
Impact of Phytoplankton Community Structure Changes in the South Sea of Korea on Marine Ecosystems Due to Climate Change

 ,
, 
Abstract
:1. Introduction
2. Materials and Methods
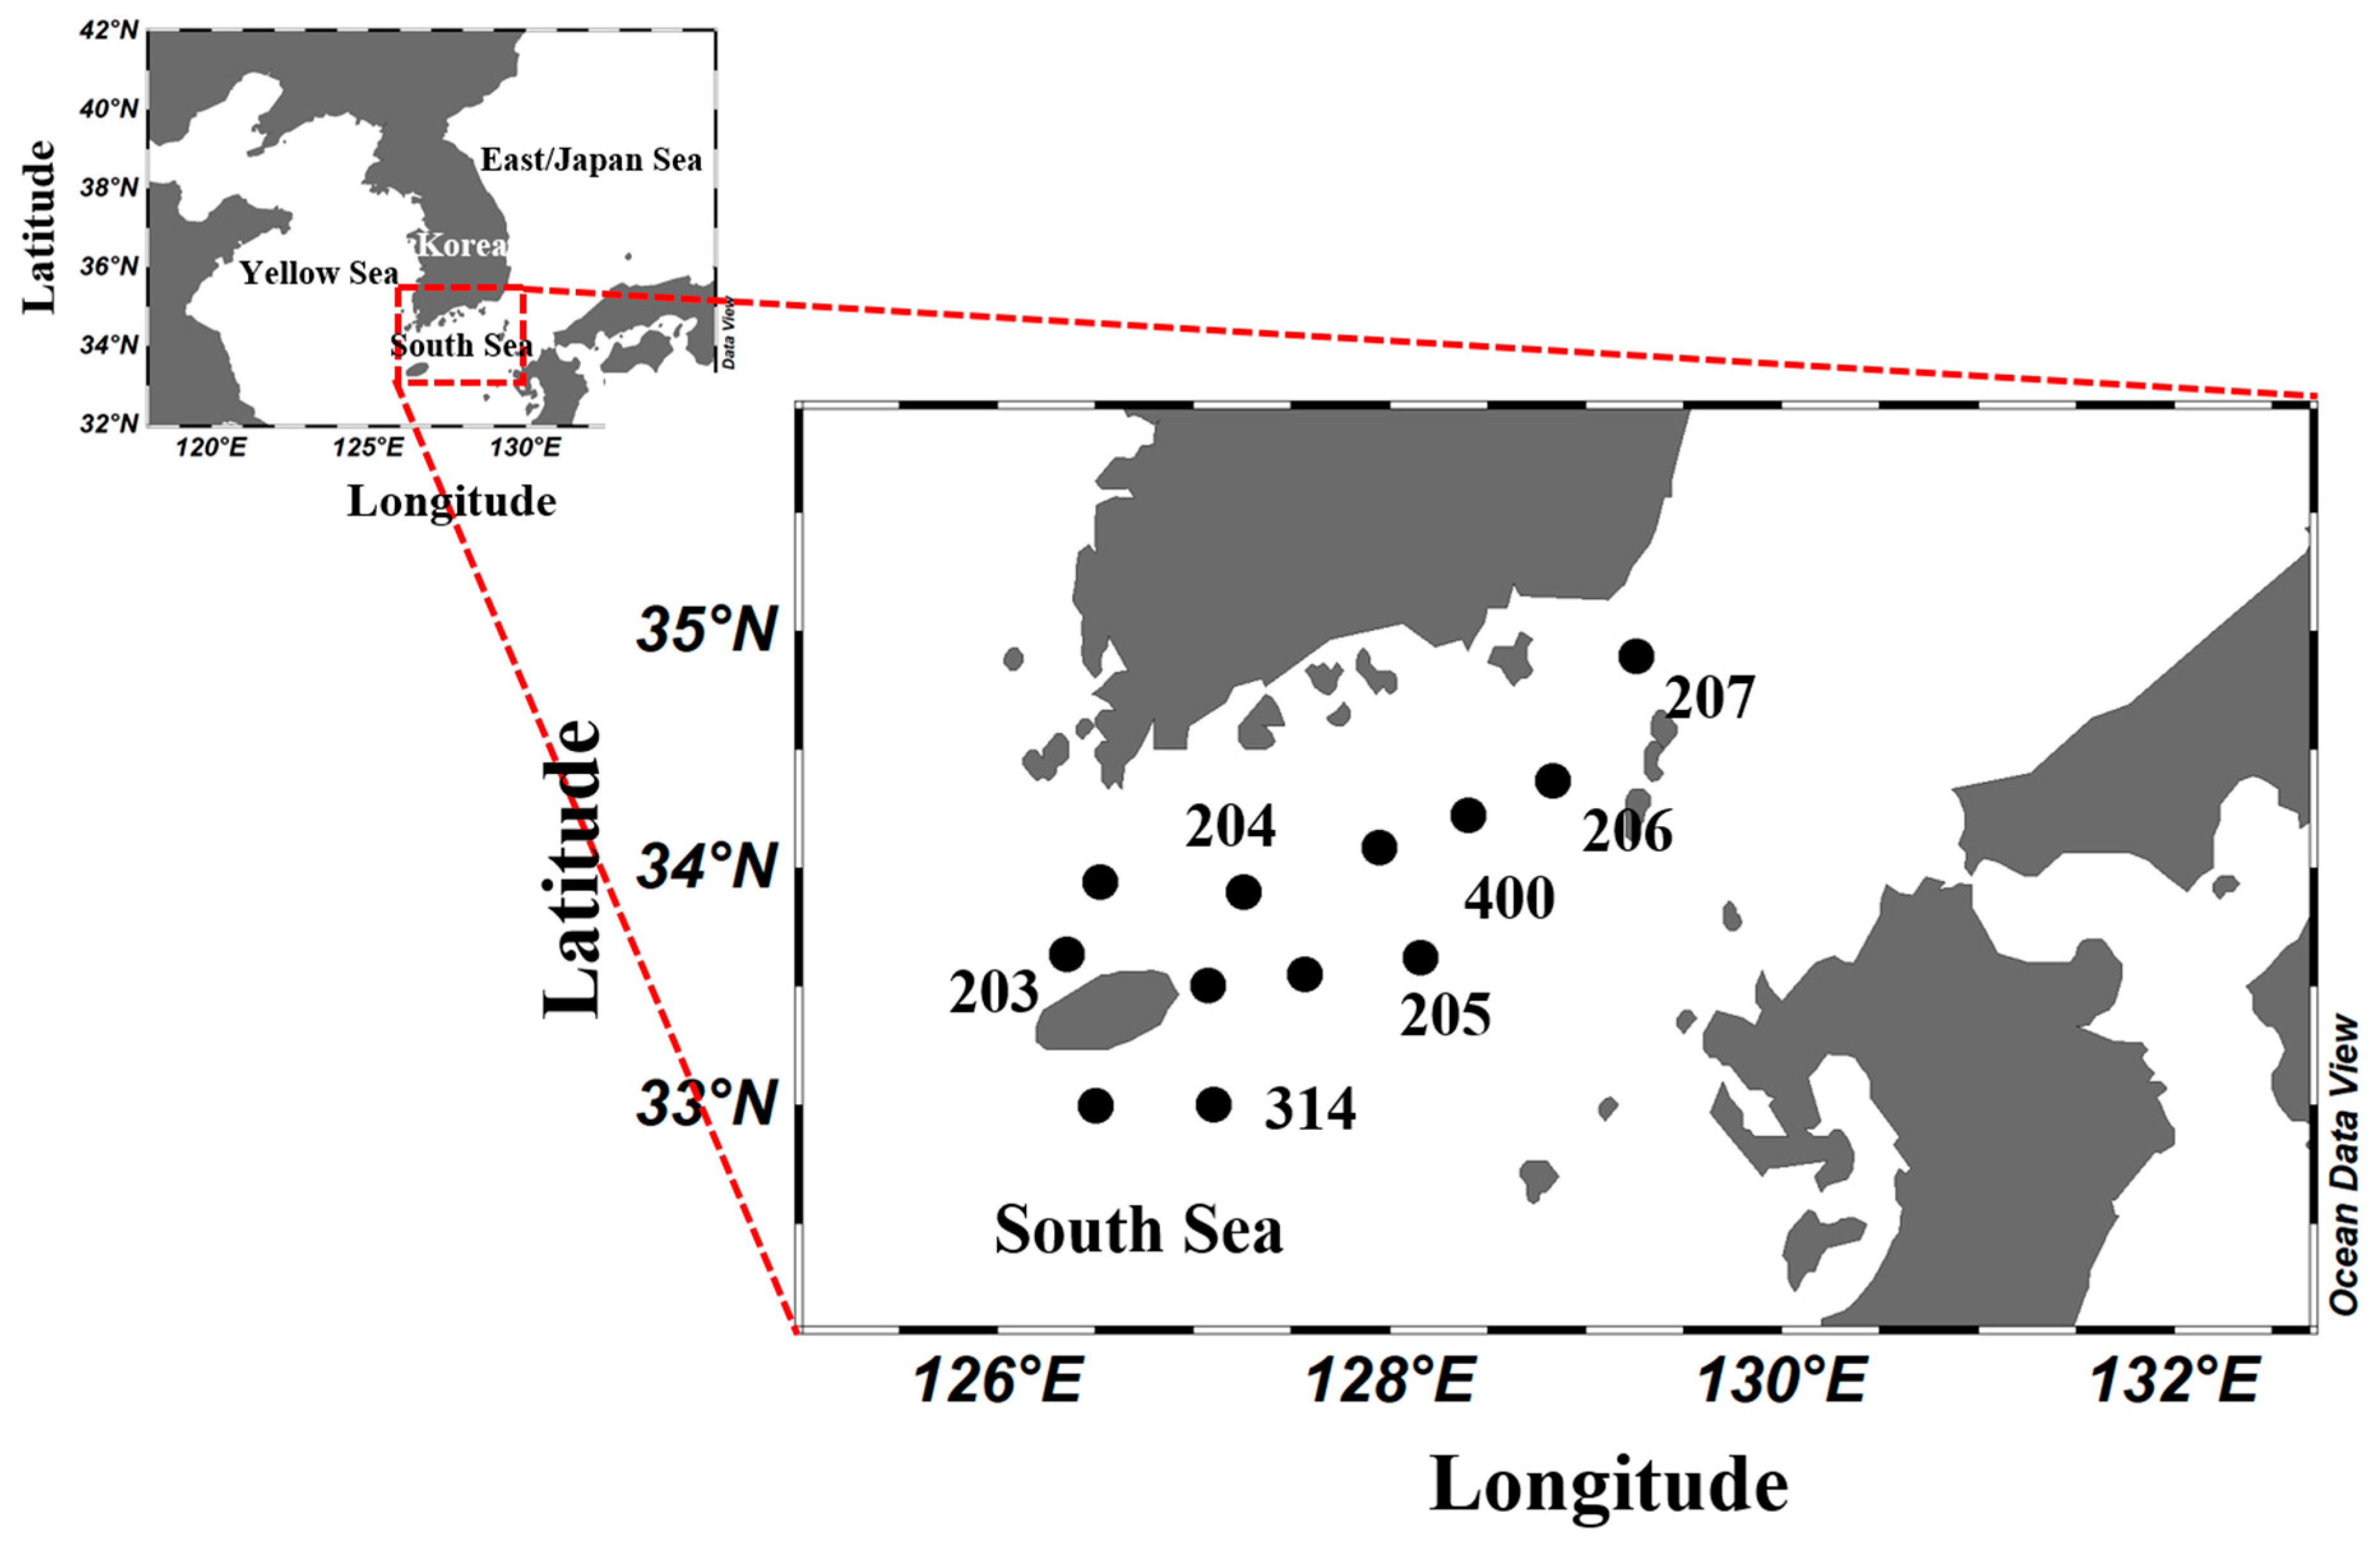
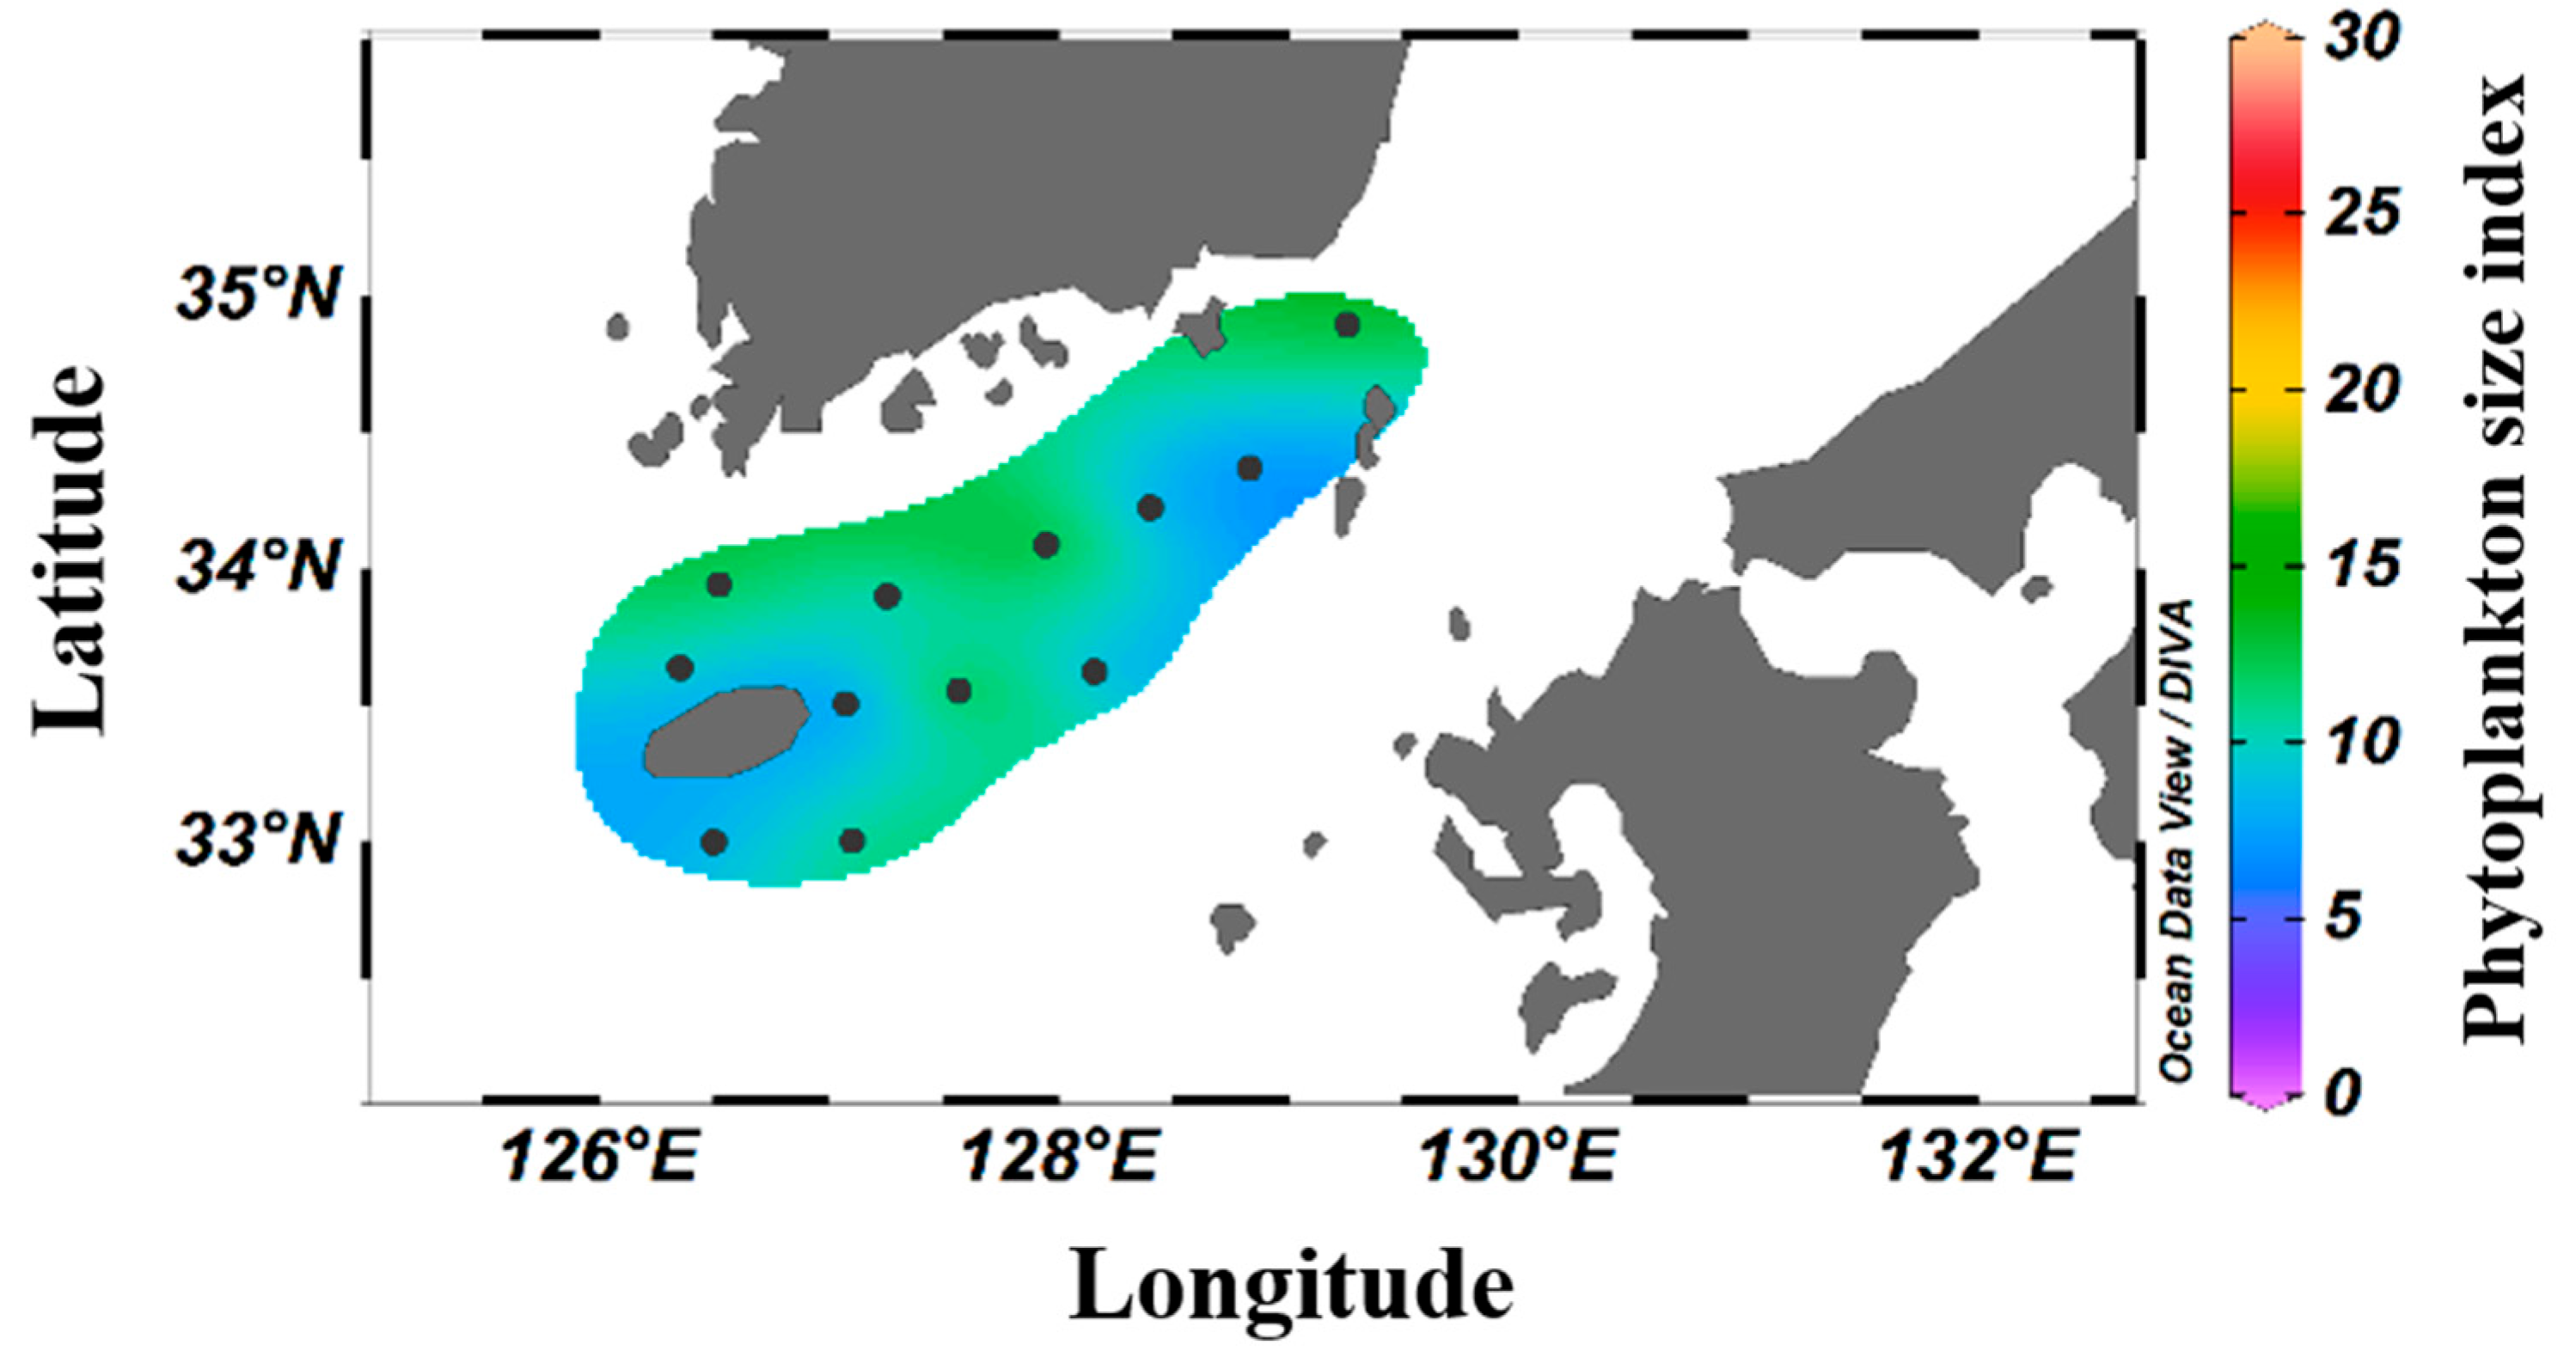
2.1. Cruises and Sampling
2.2. Dissolved Inorganic Nutrients
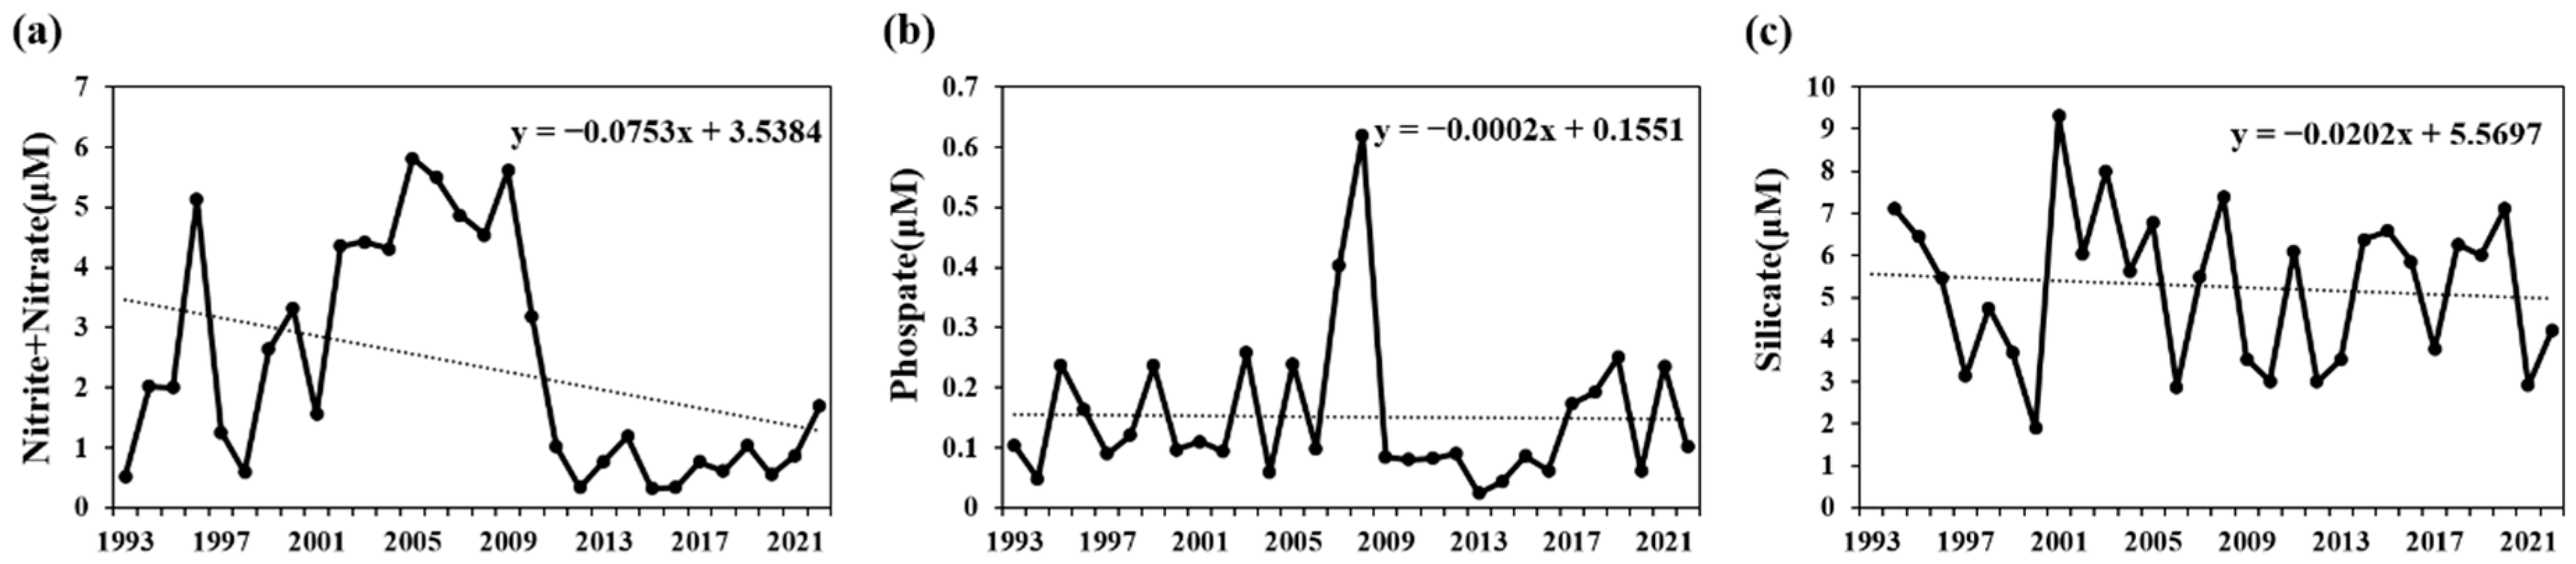
2.3. Mid- to Long-Term Data on Surface Water Temperature and Nutrients
2.4. Phytoplankton Abundances and Dominant Species
2.5. Chlorophyll-a (Chl-a) Size Fractions
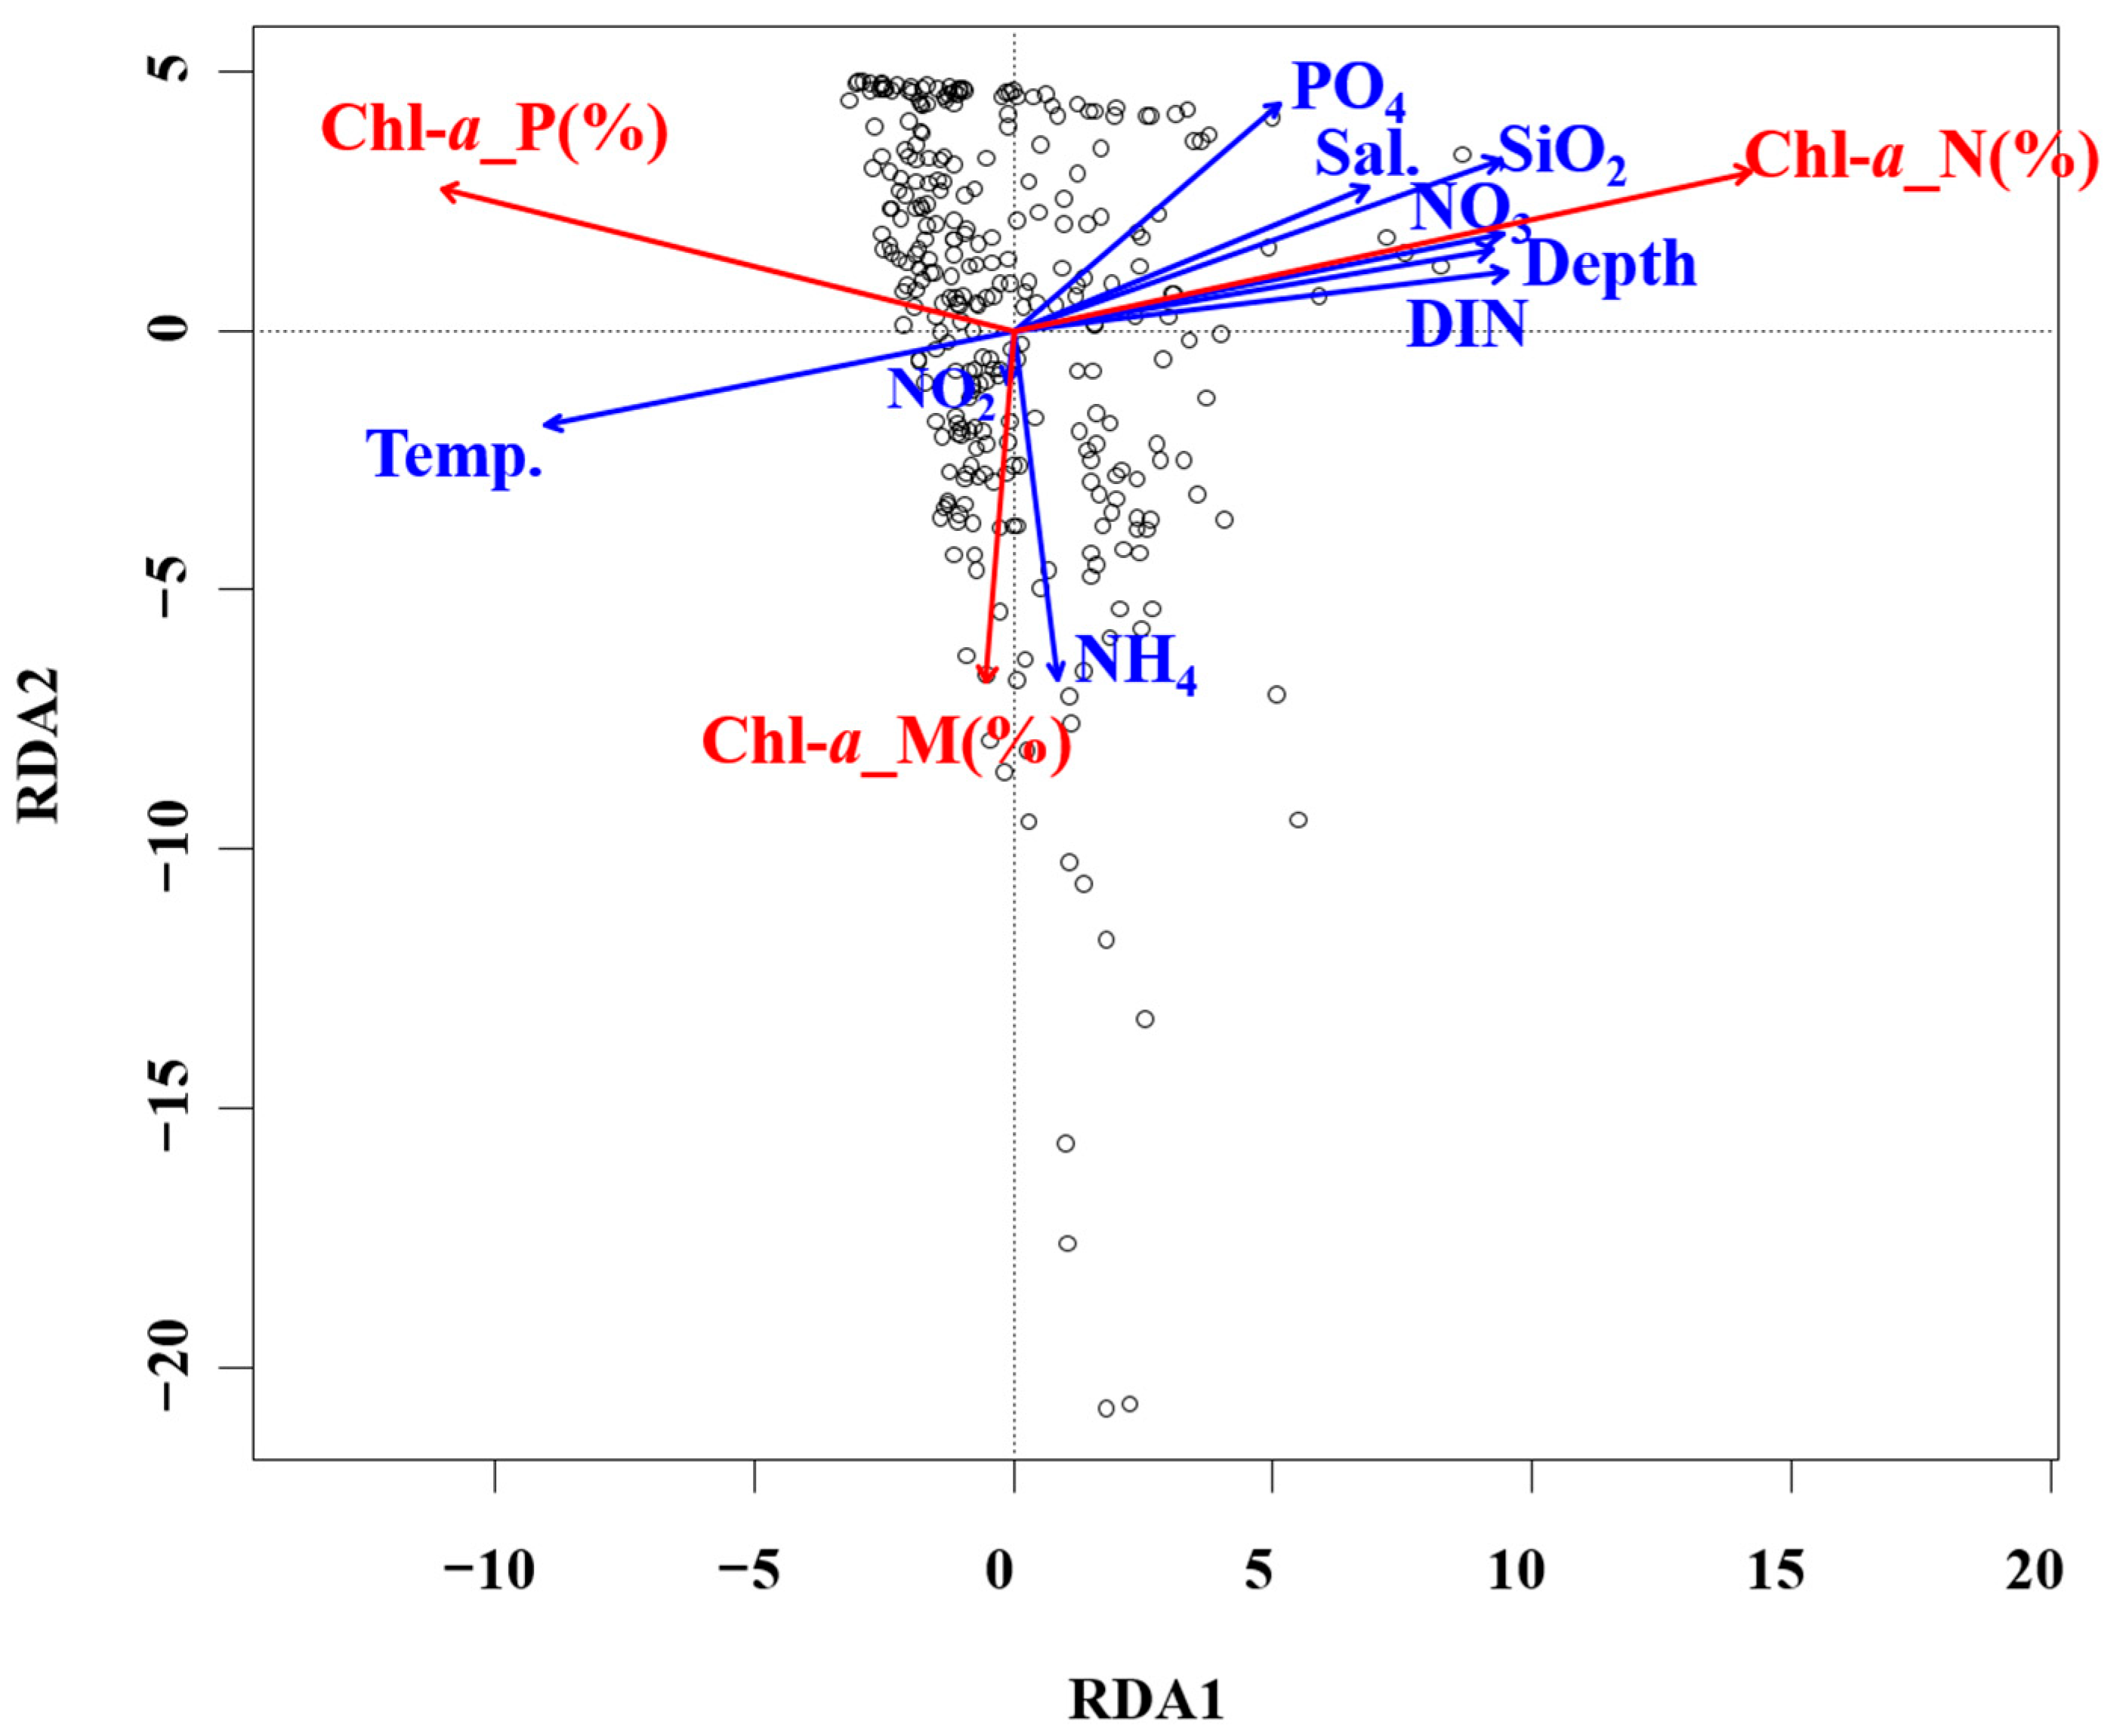
2.6. Data Analyses
3. Results
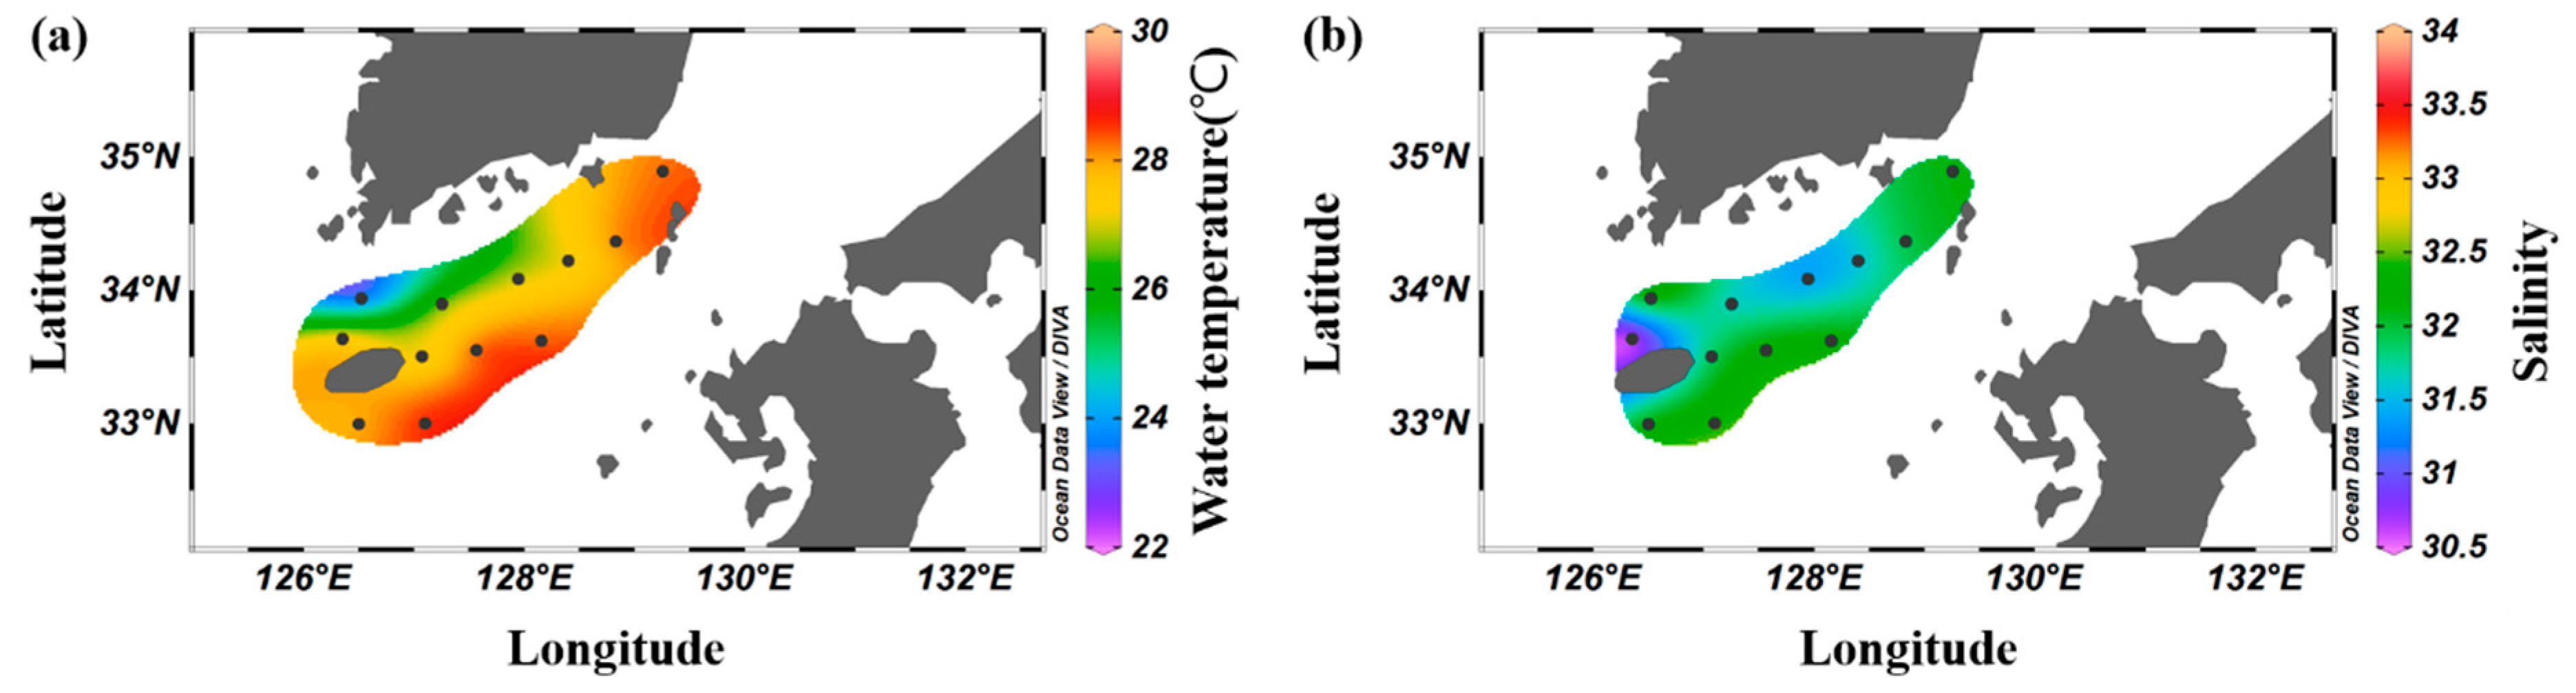
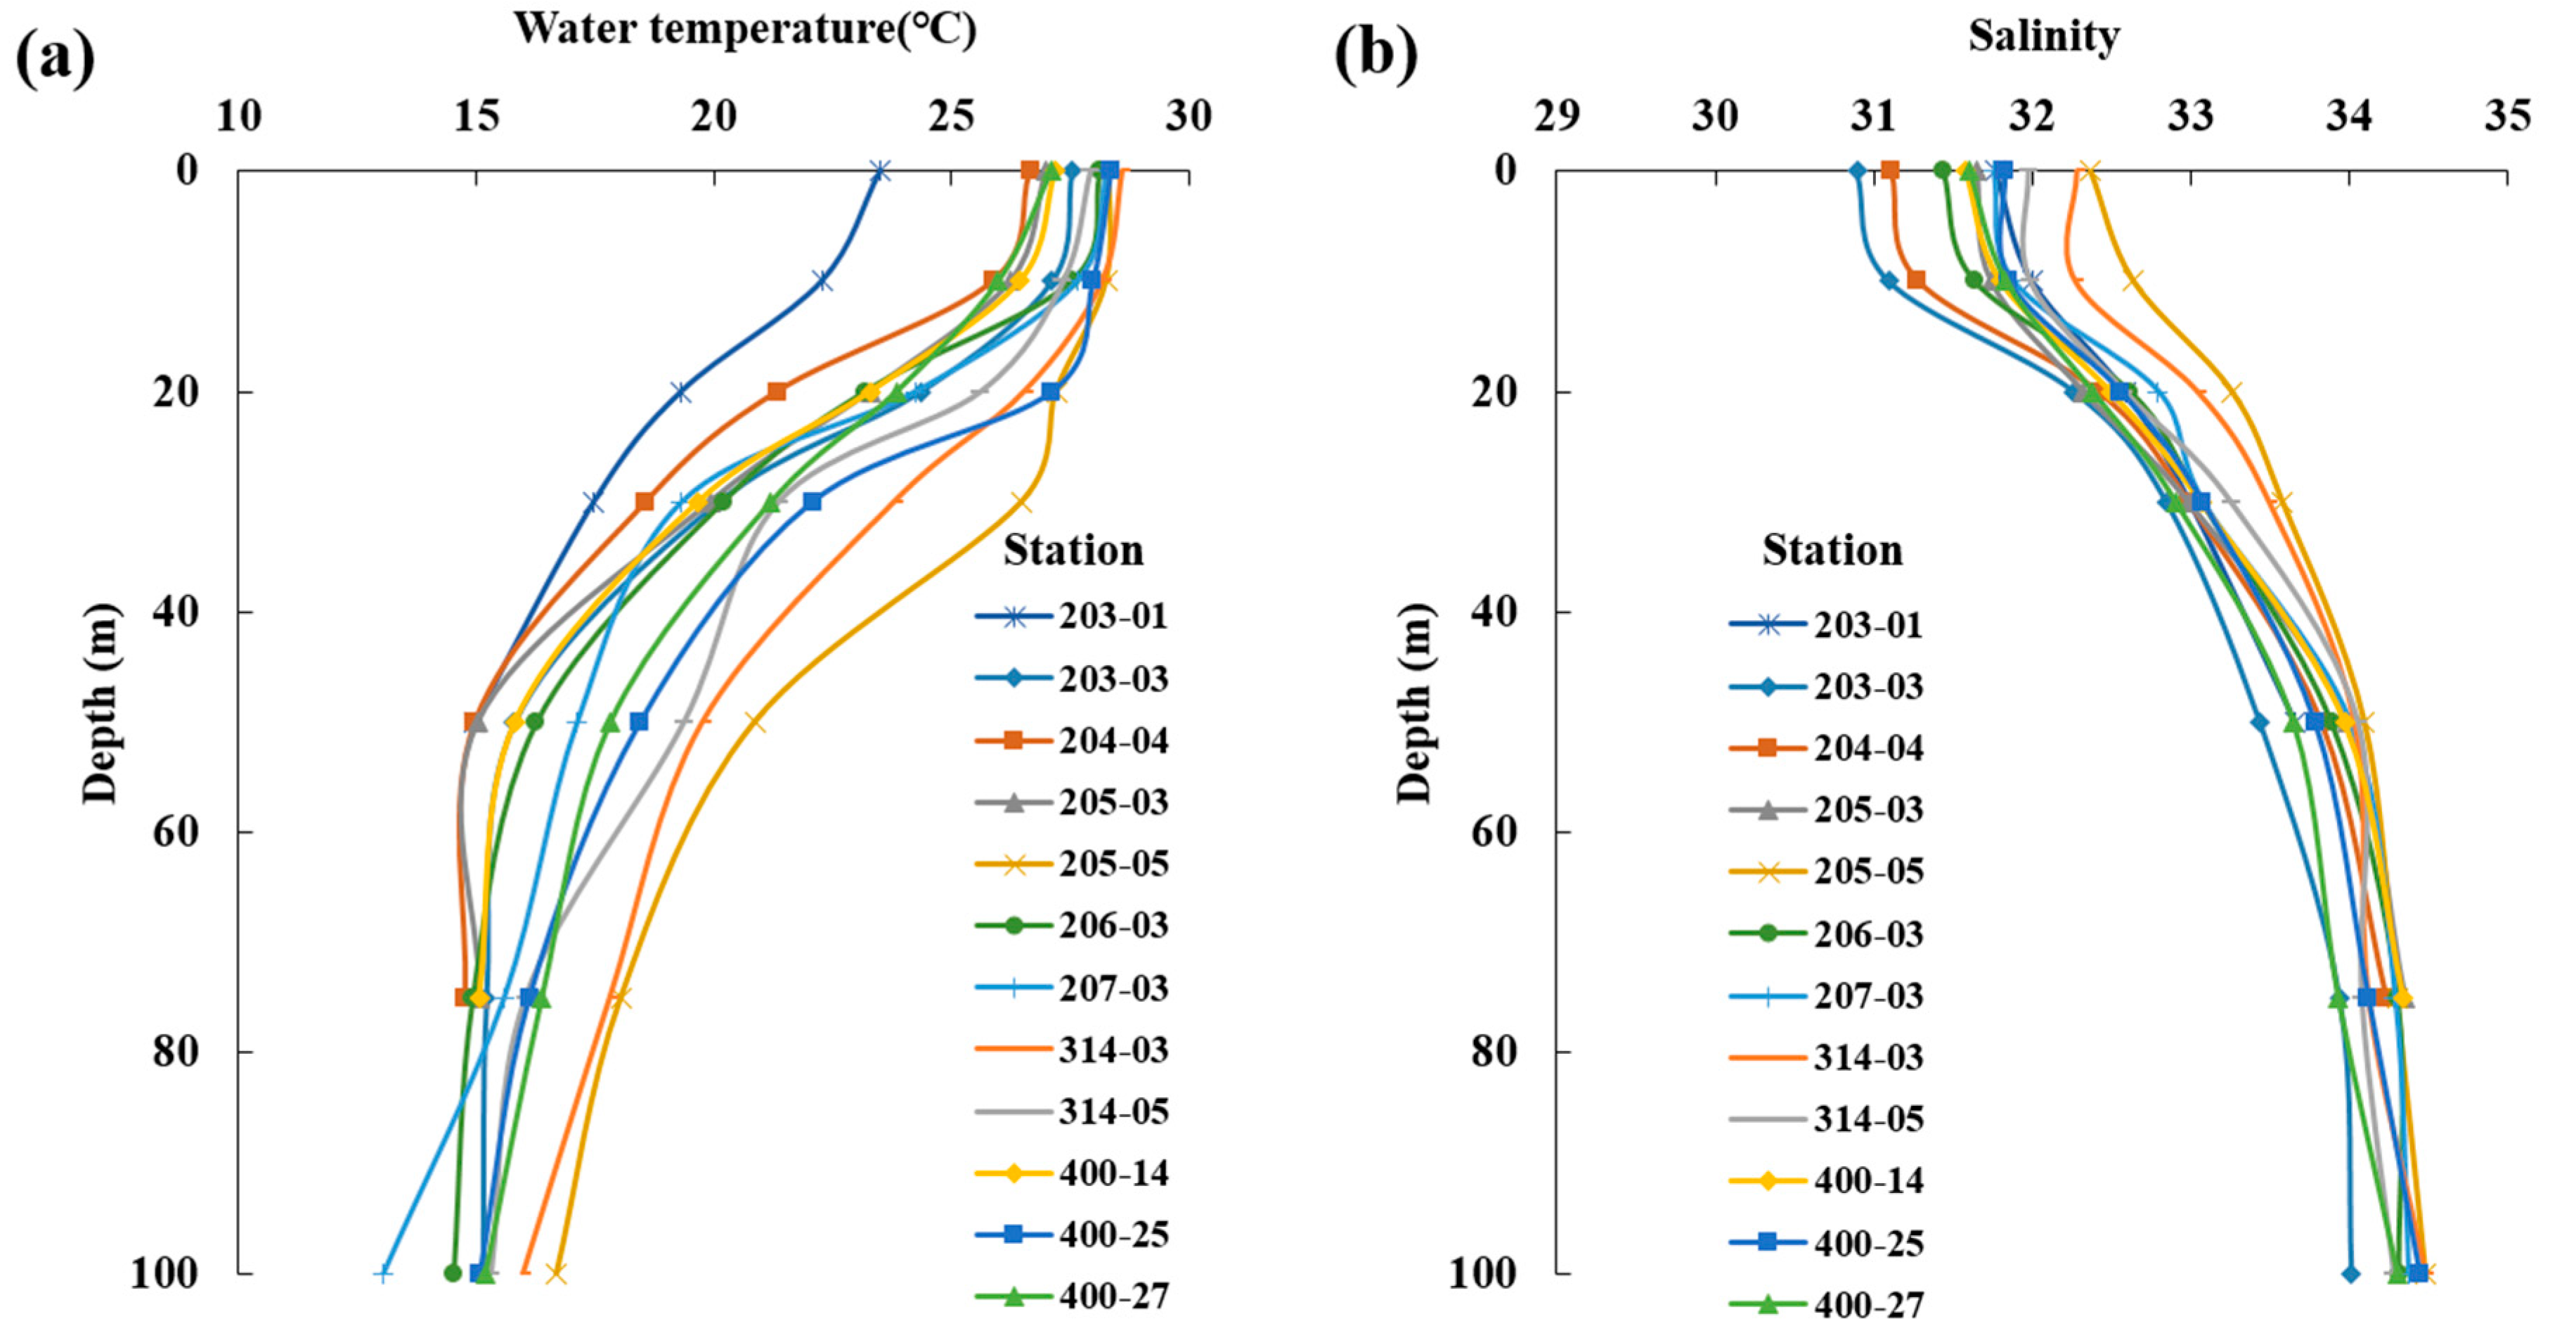
3.1. Physical Environment
3.2. Concentrations of Dissolved Inorganic Nutrients
3.3. Phytoplankton Abundances and Dominant Species
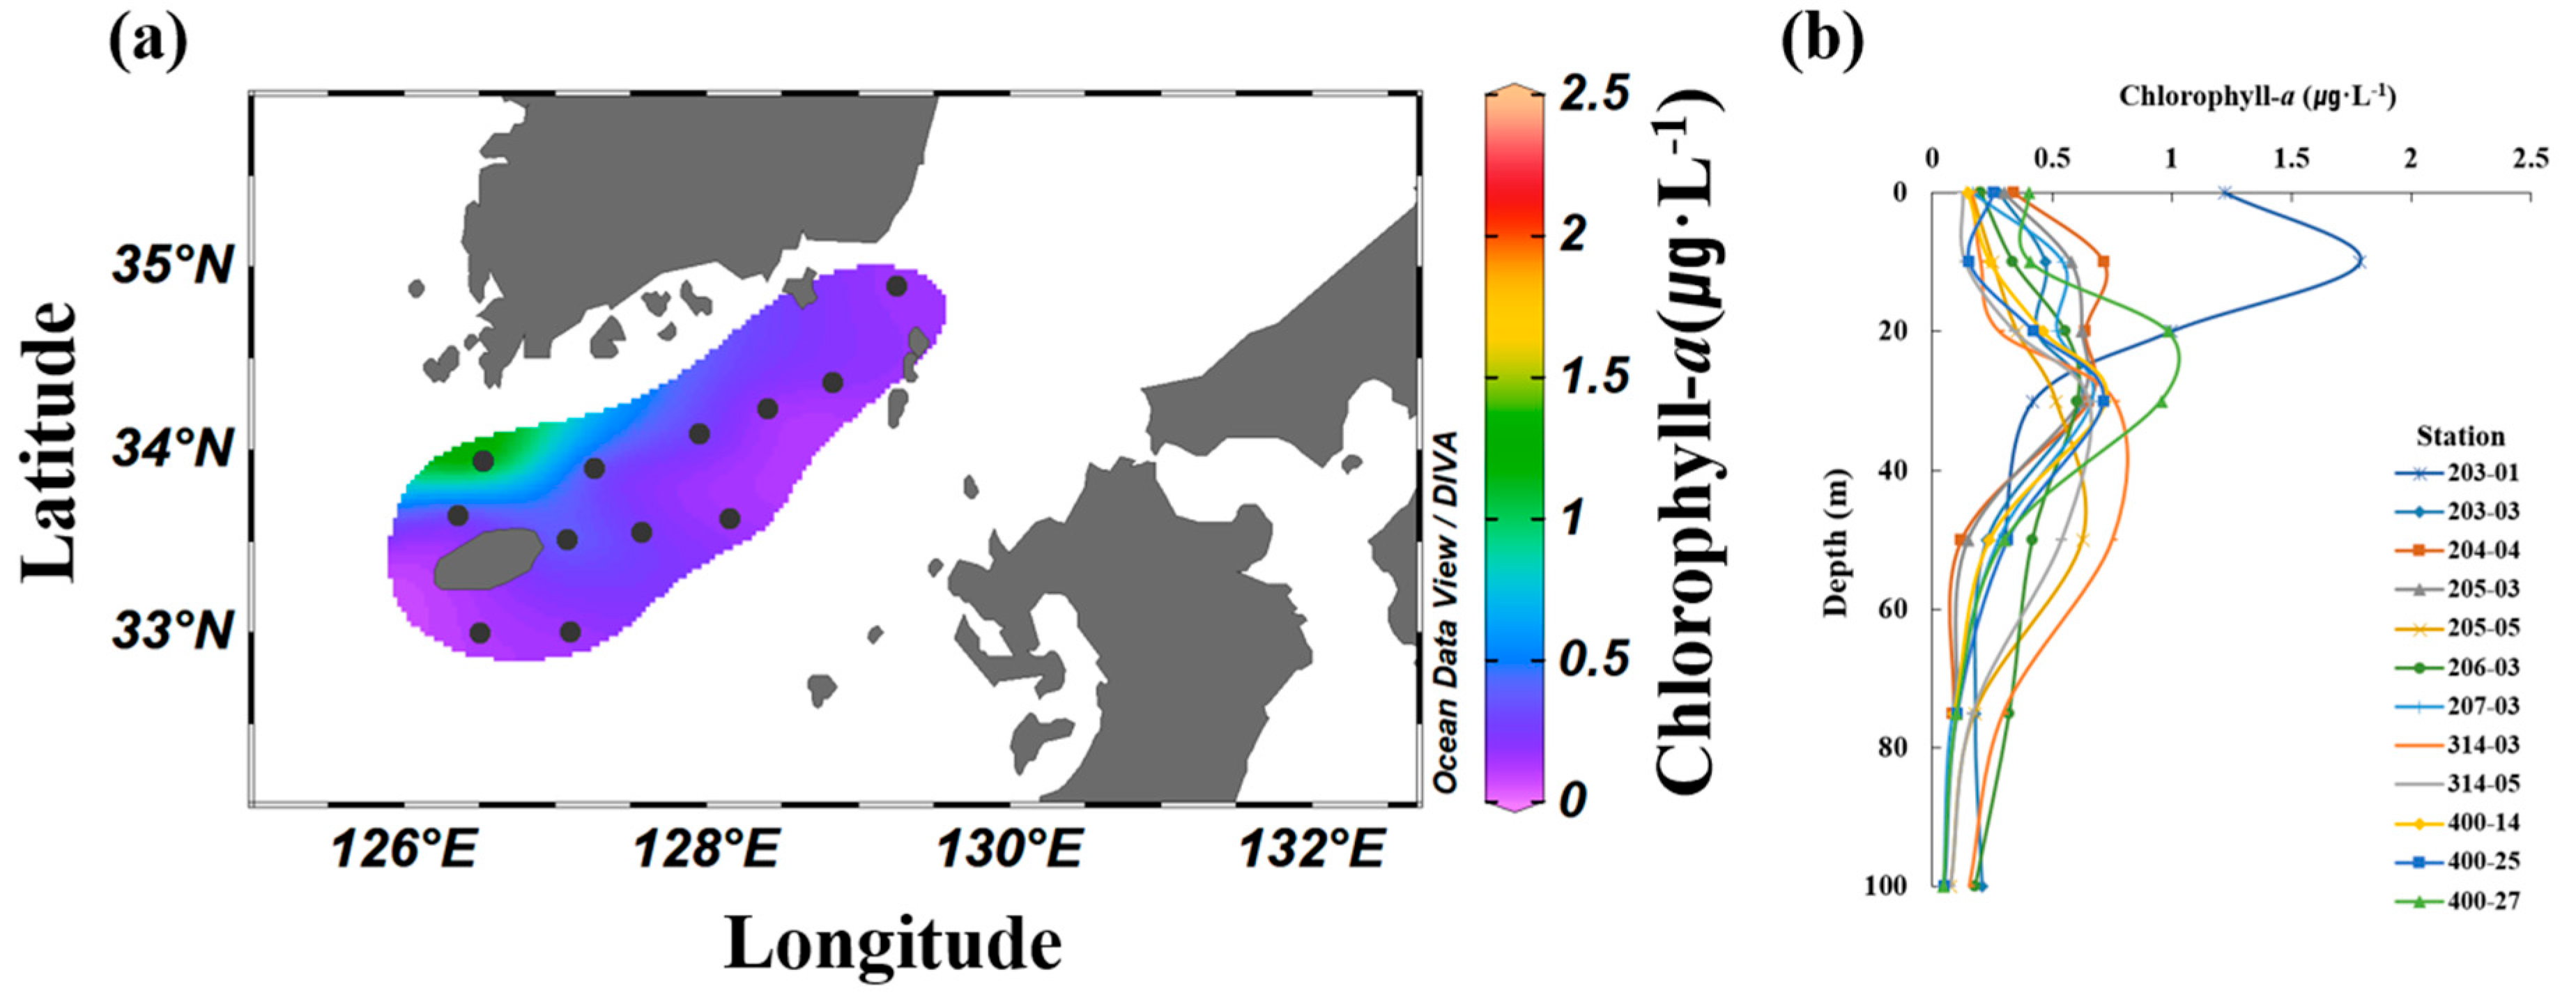
3.4. Contributions of Size-Fractionated Chl-a Concentrations
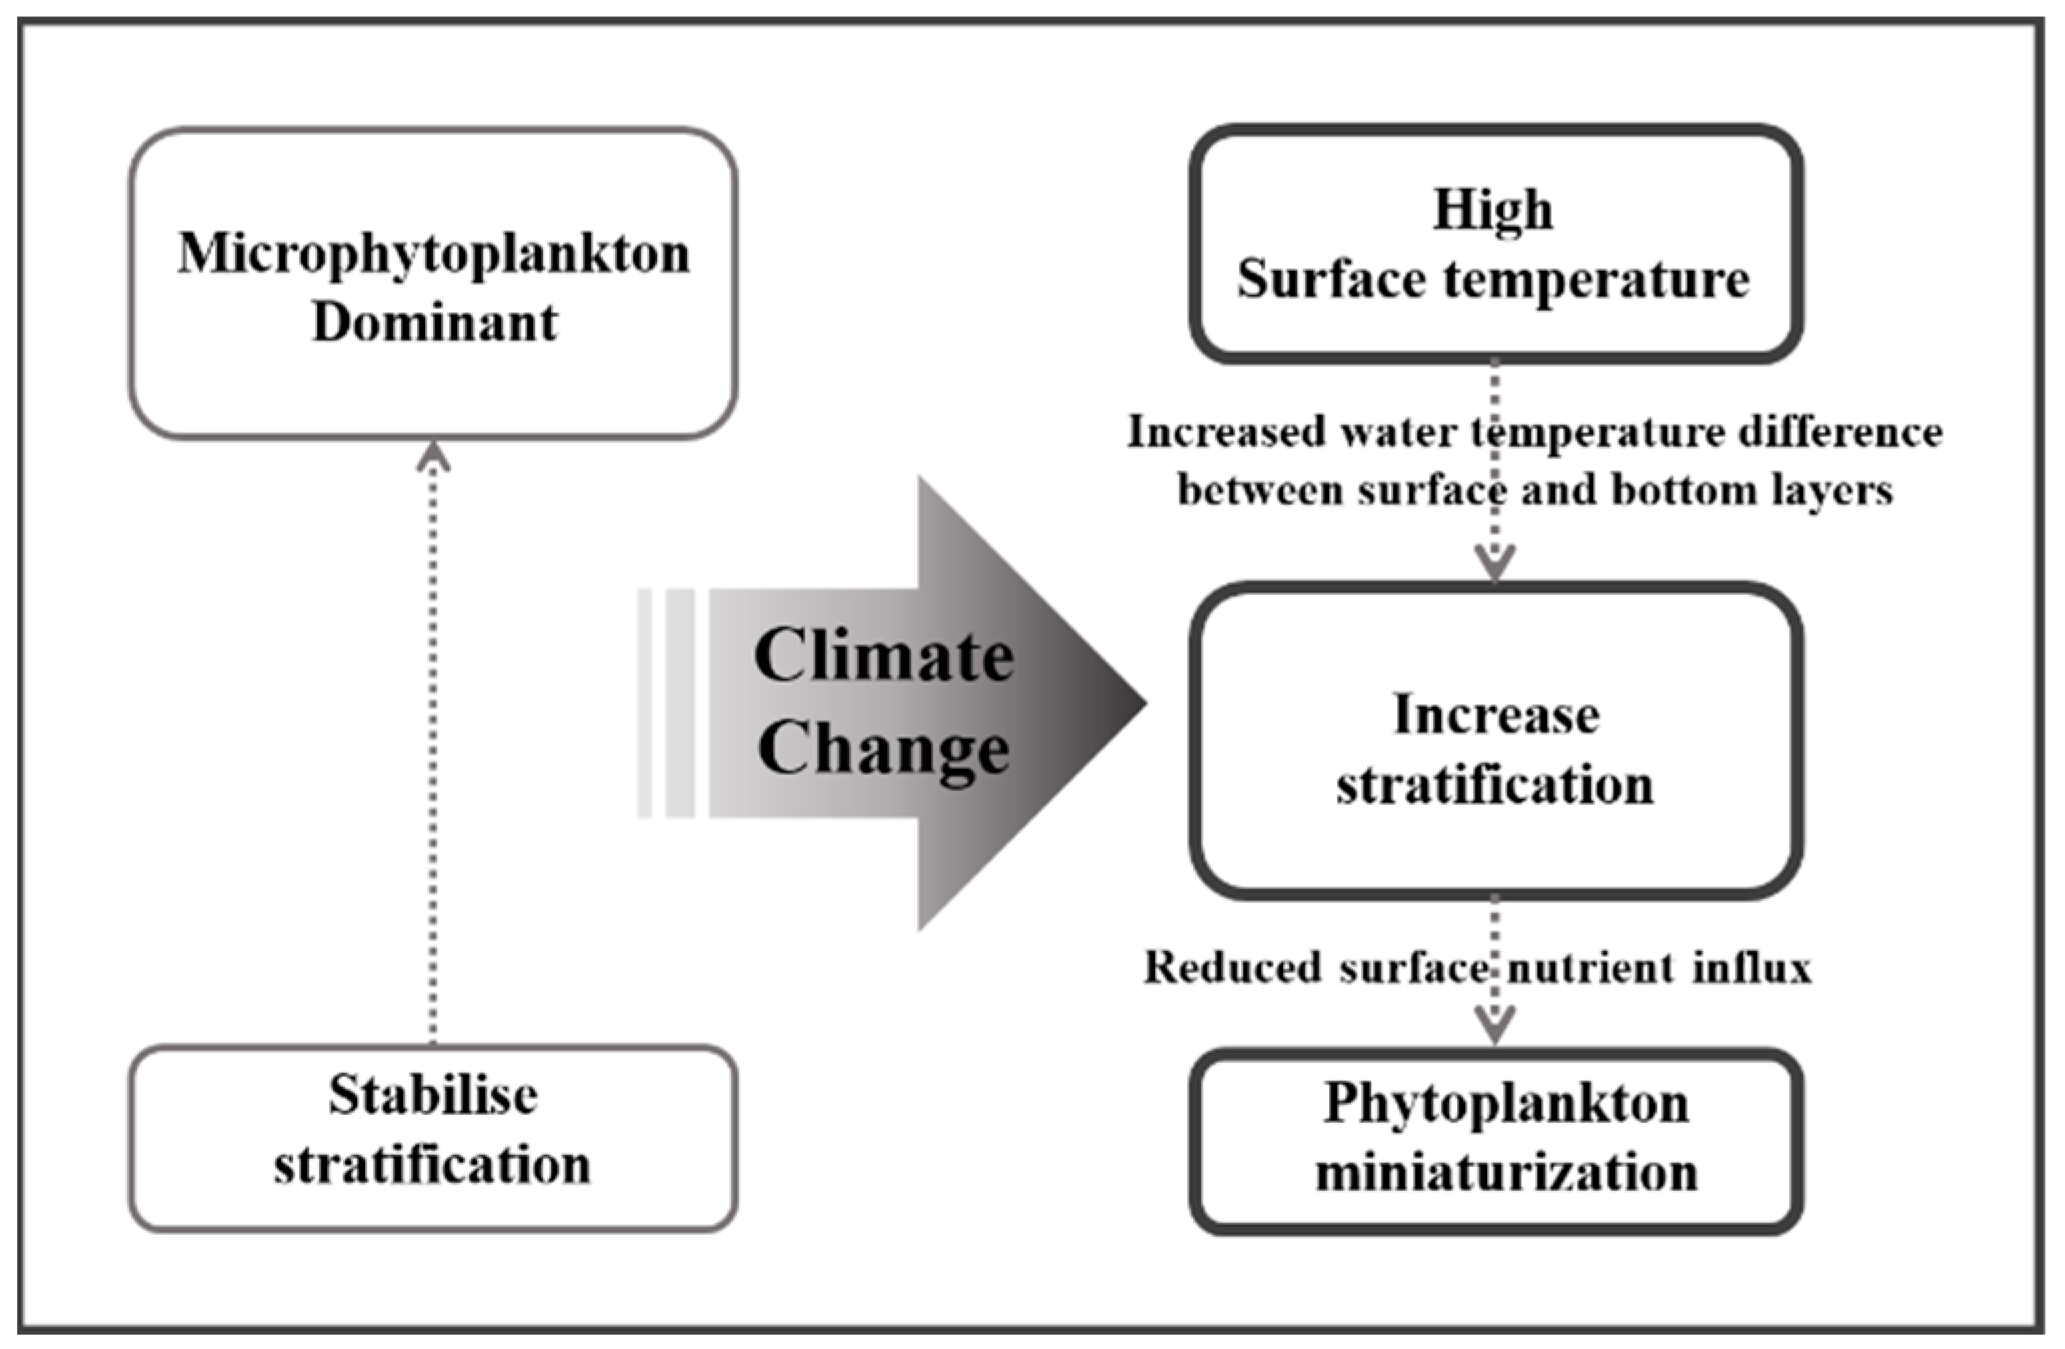
4. Discussion

| Relative Ratio (%) | |||||
|---|---|---|---|---|---|
| Area | Date | Pico Size | Nano Size | Micro Size | References |
| Uljin coast | 2003–2004/ April | 33.9 | 66.1 | [47] | |
| Chuksan coast | 2000–2002/ seasonal | 58.4 | 41.6 | [48] | |
| Ulsan port and coast | 2007–2009/ seasonal | 22.4–38.2 | 58.2–74.5 | 3.9–81.2 (52.3) | [49] |
| Northern East China Sea | 2018–2020/ August | 45.6 | 31.2 | 23.2 | [15] |
| East Sea | 2018–2020/ August | 45.9 | 33.5 | 20.6 | [16] |
| Mediterranean Sea | 31–92 | [50] | |||
| Adriatic Sea (North) | 1986 and 1988/August, 1987/July | 10–23 | [58] | ||
| Levantine Basin | 1992/March | 54.3–64.2 | [52] | ||
| Blanes Bay | 1997/summer | >50 | [51] | ||
| Atlantic Meridional Transect (Oligotrophic) | 1996/April, October 1997/April, October | 80 | 16 | 4 | [59] |
| Algerian Basin | 1996/October | 42–62 | 38–58 | [60] | |
| South China Sea | 1998/summer | 63 | 22 | 16 | [61] |
| Tyrrhenian Sea (South) | 2005/July | 44–81 | [53] | ||
| Japan Basin Yamato Basin | 2010/July | 56 56 | [54] | ||
| South Sea of Korea | 2018–2021/summer | 60.1 | 23.2 | 16.7 | This study |
5. Summary
Author Contributions
Funding
Data Availability Statement
Acknowledgments
Conflicts of Interest
References
- IPCC (Intergovernmental Panel on Climate Change). Climate Change 2023: Synthesis Report. Contribution of Working Group I, II and III to the Sixth Assessment Report of the Intergovernmental Panel on Climate Change; IPCC: Geneva, Switzerland, 2023; pp. 1–34. [Google Scholar]
- IPCC (Intergovernmental Panel on Climate Change). The Ocean and Cryosphere in a Changing Climate: A Special Report of the IPCC; Cambridge University Press: Cambridge, UK, 2019; p. 738. [Google Scholar]
- IPCC (Intergovernmental Panel on Climate Change). Climate Change 2022: Impact, Adaptation and Vulnerability. Contribution of Working Group II to the Sixth Assessment Report of the Intergovernmental Panel on Climate Change; IPCC: Geneva, Switzerland, 2022; pp. 673–816. [Google Scholar]
- WMO (World Meteorological Organization). State of the Global Climate 2021; WMO No. 1290; WHO: Geneva, Switzerland, 2022; p. 54. Available online: https://wedocs.unep.org/20.500.11822/40033 (accessed on 5 July 2023.).
- Tont, S.A. Short-period Climatic Fluctuations: Effects on Diatom Biomass. Science 1976, 194, 942–944. [Google Scholar] [CrossRef] [PubMed]
- Venrick, E.L.; McGowan, J.A.; Cayan, D.R.; Hayward, T.L. Climate and Chlorophyll a: Long-term Trends in the Central North Pacific Ocean. Science 1987, 238, 70–72. [Google Scholar] [CrossRef] [PubMed]
- Smayda, T.J. Biogeographical meaning indicators. In Phytoplankton Manual; Sournia, A., Ed.; United Nations Educational, Scientific, and Cultural Organization: Paris, France, 1978; pp. 225–229. [Google Scholar]
- Yanagi, T. Water, salt, phosphorus and nitrogen budgets of the Japan Sea. J. Oceanogr. 2002, 58, 797–804. [Google Scholar] [CrossRef]
- Onitsuka, G.; Yanagi, T.; Yoon, J.H. A numerical study on nutrient sources in the surface layer of the Japan Sea using a coupled physical-ecosystem model. J. Geophys. Res. 2007, 112, C05042. [Google Scholar] [CrossRef]
- Morimoto, A.; Takikawa, T.; Onitsuka, G.; Watanabe, A.; Moku, M.; Yanagi, T. Seasonal variation of horizontal material transport through the eastern channel of the Tsushima Straits. J. Oceanogr. 2009, 65, 61–71. [Google Scholar] [CrossRef]
- Yoon, Y.H. Spatio-temporal Distributions of Phytoplankton Community in the Coastal Waters of Central South Sea (CWoCSS), Korea. J. Korean Acad. Coop. Ind. Soc. 2017, 18, 441–453. [Google Scholar]
- Han, I.S.; Kee, J.S.; Jung, H.K. Long-term pattern changes of sea surface temperature during summer and winter due to climate change in the Korea Waters. Fish Aqua Sci. 2023, accepted. [Google Scholar]
- Park, S.J.; Kim, G.B.; Kwon, H.K.; Han, I.S. Long-term changes in the marginal seas (Yellow Sea, East China Sea, and East/Japan Sea) neighboring the Korean Peninsula. Mar. Pollut. Bull. 2023, 192, 115012. [Google Scholar] [CrossRef]
- Lee, Y.J. Phytoplankton Dynamics and Primary Production in the Yellow Sea during Winter and Summer. Ph.D. Thesis, Inha University, Incheon, Republic of Korea, 2012. [Google Scholar]
- Park, K.W.; Oh, H.J.; Moon, S.Y.; Yoo, M.H.; Youn, S.H. Effects of Miniaturization of the Summer Phytoplankton Community on the Marine Ecosystem in the Northern East China Sea. J. Mar. Sci. Eng. 2022, 10, 315. [Google Scholar] [CrossRef]
- Park, K.W.; Oh, H.J.; Hwang, J.D.; Moon, S.Y.; Lee, M.U.; Youn, S.H. Changes in Phytoplankton Size Structure in the East Sea 2018–2020 due to Marine Environment Change. Korean J. Environ. Biol. 2022, 40, 54–69. [Google Scholar] [CrossRef]
- Joo, H.T.; Son, S.H.; Park, J.W.; Kang, J.J.; Jeong, J.Y.; Lee, C.I.; Kang, C.K.; Lee, S.H. Long-term pattern of primary productivity in the East/Japan Sea based on ocean color data derived from MODIS-aqua. Remote Sens. 2016, 8, 25. [Google Scholar] [CrossRef]
- Joo, H.T.; Son, S.H.; Park, J.W.; Kang, J.J.; Jeong, J.Y.; Kwon, J., II; Kang, C.K.; Lee, S.H. Small phytoplankton contribution to the total primary production in the highly productive Ulleung Basin in the East/Japan Sea. Deep Sea Res. 2 Top. Stud. Oceanogr. 2017, 143, 54–61. [Google Scholar] [CrossRef]
- NIFS (National Institute of Fisheries Science). Annual Report for Climate Change Trends in Fisheries, 2022; NIFS: Busan, Republic of Korea, 2023; p. 87. [Google Scholar]
- Bhavya, P.S.; Kang, J.J.; Jang, H.K.; Joo, H.T.; Lee, J.H.; Lee, J.H.; Park, J.W.; Kim, K.W.; Kim, H.C.; Lee, S.H. The Contribution of Small Phytoplankton Communities to the Total Dissolved Inorganic Nitrogen Assimilation Rates in the East/Japan Sea: An Experimental Evaluation. J. Mar. Sci. Eng. 2020, 8, 854. [Google Scholar] [CrossRef]
- Kim, Y.J.; Youn, S.H.; Oh, H.J.; Kang, J.J.; Lee, J.H.; Lee, D.B.; Kim, K.W.; Jang, H.K.; Kee, J.B.; Lee, S.H. Spatiotemporal Variation in Phytoplankton Community Driven by Environmental Factors in the Northern East China Sea. Water 2020, 12, 2695. [Google Scholar] [CrossRef]
- Kang, J.J.; Jang, H.K.; Lim, J.H.; Lee, D.B.; Lee, J.H.; Bae, H.J.; Lee, C.H.; Kang, C.K.; Lee, S.H. Characteristics of Different Size Phytoplankton for Primary Production and Biochemical Compositions in the Western East/Japan Sea. Front. Microbiol. 2020, 11, 560102. [Google Scholar] [CrossRef]
- Lee, H.W.; Noh, J.H.; Choi, D.H.; Yun, M.S.; Bhavya, P.S.; Kang, J.J.; Lee, J.H.; Kim, K.W.; Jang, H.K.; Lee, S.H. Picocyanobacterial Contribution to The Total Primary Production in the Northwestern Pacific Ocean. Water 2021, 13, 1610. [Google Scholar] [CrossRef]
- Park, J.S.; Lee, S.G. Distribution and Species Composition of Phytoplankton in the Southern Waters of Korea and their Relation to the Character of Water Masses. Bull. Korean Fish. Soc. 1990, 23, 208–214. [Google Scholar]
- Yoon, Y.H.; Kim, S.A. Seasonal variations of phytoplankton population and primary productivity in the southern coastal waters of Korea. 1. A characteristics of the distribution of chlorophyll a and water quality in the dry season in the Yeosuhae Bay and adjoining sea. J. Korean Environ. Sci. Soc. 1996, 5, 347–359. [Google Scholar]
- Lee, Y.S. An influence of inflowing freshwater on the diatom blooms in the eastern coast of Dolsan, Yosu, Korea. J. Korean Soc. Mar. Environ. Energy. 2002, 24, 477–488. [Google Scholar]
- Oh, H.J.; Lee, Y.H.; Yang, J.H.; Kim, S.H. The Characteristics of Phytoplankton Distributions Related to the Oceanographic Conditions in the Southern Waters of the Korean in Summer, 2004. J. Korean Assoc. Geogr. Inf. Stud. 2007, 10, 40–48. [Google Scholar]
- Noh, I.H.; Yoon, Y.H.; Park, J.S.; Kang, I.S.; An, Y.K.; Kim, S.H. Seasonal fluctuations of marine environment and phytoplankton community in the southern part of Yeosu, Southern Sea of Korea. J. Korean Soc. Mar. Environ. Eng. 2010, 13, 151–164. [Google Scholar]
- Baek, S.H.; Shin, K.S.; Hyun, B.G.; Jang, P.G.; Kim, H.S.; Hwang, O.M. Distribution Characteristics and Community Structure of Phytoplankton in the Different Water Masses During Early Summer of Southern Sea of Korea. Ocean Polar Res. 2010, 32, 1–13. [Google Scholar] [CrossRef]
- Jang, P.G.; Hyun, B.G.; Cha, H.G.; Chung, H.S.; Jang, M.C.; Shin, K.S. Seasonal Variation of Phytoplankton Assemblages Related to Surface Water Mass in the Eastern Part of the South Sea in Korea. Ocean Polar Res. 2013, 35, 157–170. [Google Scholar] [CrossRef]
- Rines, J.E.B.; Hargraves, P.E. The Chaetoceros Ehrenberg (Bacillariophyceae) Flora of Narragansett Bay. Rhode Island. Bibl. Phycol. 1988, 79, 196. [Google Scholar]
- Round, F.E.; Crawford, R.M.; Mann, D.G. The diatoms. In Biology and Morphology of the Genera; Cambridge University Press: Cambridge, UK, 1990; p. 747. [Google Scholar]
- Shim, J.H. Illustrated encyclopedia of flora & fauna of Korea. In Marine Phytoplankton; Ministry of Education Republic of Korea: Seoul, Republic of Kore, 1994; Volume 34. (In Korean) [Google Scholar]
- Tomas, C.R. Identifying Marine Diatoms and Dinoflagellates; Academic Press, Inc.: Cambridge, MA, USA, 1997; p. 874. [Google Scholar]
- Parsons, T.R.; Maita, Y.; Lalli, C.M.A. Manual of Biological and Chemical Methods for Seawater Analysis; Pergamon Press: Oxford, UK, 1984. [Google Scholar]
- Bricaud, A.; Claustre, H.; Ras, J.; Oubelkheir, K. Natural variability of phytoplanktonic absorption in oceanic waters: Influence of the size structure of algal populations. J. Geophys. Res. 2004, 109, C11010. [Google Scholar] [CrossRef]
- Fu, M.Z.; Wang, Z.L.; Li, Y.; Li, R.X.; Sun, P.; Wei, X.H.; Lin, X.Z.; Guo, J.S. Phytoplankton biomass size structure and its regulation in the Southern Yellow Sea (China): Seasonal variability. Cont. Shelf Res. 2009, 29, 2178–2194. [Google Scholar] [CrossRef]
- Baek, S.H.; Kim, Y.B. Influences of coastal upwelling and time lag on primary production in offshore waters of Ulleungdo-Dokdo during spring 2016. Korean J. Environ. Biol. 2018, 36, 156–164. [Google Scholar] [CrossRef]
- Liu, X.; Wang, M.; Shi, W. A study of a Hurricane Katrinainduced phytoplankton bloom using satellite observations and model simulations. J. Geophys. Res. 2009, 114, C03023. [Google Scholar]
- Matsuda, O.; Nishi, Y.; Yoon, Y.H.; Endo, T. Observation of thermohaline structure and phytoplankton biomass the shelf front of East China Sea during early summer. J. Fac. Appl. Biol. Sci. 1989, 28, 27–35. [Google Scholar]
- Dortch, Q.; Whitledge, T.E. Does nitrogen or silicon limit phytoplankton production in the Mississippi River plume and nearby regions? Cont. Shelf Res. 1992, 12, 1293–1309. [Google Scholar] [CrossRef]
- Justic, D.; Rabalais, N.N.; Turner, R.E.; Dortch, Q. Changes in nutrient structure of river-dominated coastal water: Stoichiometric nutrient balance and its consequences. Estuar. Coast. Shelf Sci. 1995, 40, 339–356. [Google Scholar] [CrossRef]
- Wang, B.D.; Wang, X.L.; Zhan, R. Nutrient conditions in the Yellow Sea and the East China Sea. Estuar. Coast. Shelf Sci. 2003, 58, 127–136. [Google Scholar] [CrossRef]
- Yoon, Y.H.; Park, J.S.; Soh, H.Y.; Hwang, D.O. On the Marine Environment and Distribution of Phytoplankton Community in the Northern East China Sea in Early Summer 2004. J. Korean Soc. Mar. Environ. Energy 2005, 8, 100–110. [Google Scholar]
- Zhou, M.J.; Shen, Z.L.; Yu, R.C. Responses of a coastal phytoplankton community to increased nutrient input from the Changjiang (Yangtze) River. Cont. Shelf Res. 2008, 28, 1483–1489. [Google Scholar] [CrossRef]
- Chen, Y.L.; Lu, H.; Shiah, F.; Gong, G.; Liu, K.; Kanda, J. New production and f-ratio on the continental shelf of the East China Sea: Comparisons between nitrate inputs from the subsurface Kuroshio Current and the Changjiang River. Estuar. Coast. Shelf Sci. 1999, 48, 59–75. [Google Scholar] [CrossRef]
- Choi, H.C.; Kang, Y.S.; Jeon, I.S. Phytoplankton Community in Adjacent Waters of Ulchin Nuclear Power Plant. Korean J. Environ. Biol. 2004, 22, 426–437. [Google Scholar]
- Kang, Y.S.; Choi, H.C.; Lim, J.W.; Jeon, I.S.; Seo, J.H. Dynamics of the Phytoplankton Community in the Coastal Waters of Chuksan Harbor, East Sea. Algae 2005, 20, 345–352. [Google Scholar] [CrossRef]
- Kwon, O.Y.; Kang, J.H. Seasonal Variation of Physico-chemical Factors and Size-fractionated Phytoplankton Biomass at Ulsan Seaport of East Sea in Korea. J. Korean Acad. Ind. Coop. Soc. 2013, 14, 6008–6014. [Google Scholar]
- Magazzu, G.; Decembrini, F. Primary production, biomass and abundance of phototrophic picoplankton in the Mediterranean Sea: A review. Aquat. Microb. Ecol. 1995, 9, 97–104. [Google Scholar] [CrossRef]
- Agawin, N.S.R.; Duarte, C.M.; Agusti, S. Nutrient and temperature control of the contribution of picoplankton to phytoplankton biomass and production. Limnol. Oceanogr. 2000, 45, 591–600. [Google Scholar] [CrossRef]
- Zohary, T.; Brenner, S.; Krom, M.D.; Angel, D.L.; Kress, N.; Li, W.K.W.; Neori, A.; Yacobi, Y.Z. Buildup of microbial biomass during deep winter mixing in a Mediterranean warm-core eddy. Mar. Ecol. Prog. Ser. 1998, 167, 47–57. [Google Scholar] [CrossRef]
- Decembrini, F.; Caroppo, C.; Azzaro, M. Size structure and production of phytoplankton community and carbon pathways channeling in the southern Tyrrhenian Sea (western Mediterranean). Deep Sea Res. 2 Top. Stud. Oceanogr. 2009, 56, 687–699. [Google Scholar] [CrossRef]
- Kwak, J.H.; Lee, S.H.; Hwan, J.; Suh, Y.S.; Park, H.J.; Chang, K.I.; Kim, K.R.; Kang, C.K. Summer primary productivity and phytoplankton community composition driven by different hydrographic structures in the East/Japan Sea and the Western Subarctic Pacific. J. Geophys. Res. Oceans 2014, 119, 4505–4519. [Google Scholar] [CrossRef]
- Son, Y.B.; Ryu, J.H.; Noh, J.H.; Ju, S.J.; Kim, S.H. Climatological variability of satellite-derived sea surface temperature and chlorophyll in the south sea of Korea and East China Sea. Ocean Polar Res. 2012, 34, 201–218. [Google Scholar] [CrossRef]
- Shim, J.H.; Yeo, H.G.; Shin, Y.K. Ecological effect of thermal effluent in the Korean coastal waters I. Significance of autotrophic nano and picoplankton in adjacent waters of Kori nuclear power plant. J. Oceanol. Soc. Korea 1991, 26, 77–82. [Google Scholar]
- Shim, J.H.; Yeo, H.G.; Park, J.G. Primary production system in the southern waters of the east Sea, Korea I. Biomass and productivity. J. Oceanol. Soc. Korea 1991, 27, 91–100. [Google Scholar]
- Revelante, N.; Gilmartin, M. The relative increase of larger phytoplankton in a subsurface chlorophyll maximum of the northern Adriatic Sea. J. Plankton Res. 1995, 17, 1535–1562. [Google Scholar] [CrossRef]
- Marañón, E.; Holligan, P.M.; Barciela, R.; González, N.; Mouriño, B.; Pazó, M.J.; Varela, M. Patterns of phytoplankton size structure and productivity in contrasting open-ocean environments. Mar. Ecol. Prog. Ser. 2001, 216, 43–56. [Google Scholar] [CrossRef]
- Morán, X.A.G.; Taupier-Letage, I.; Vázquez-Domínguez, E.; Ruiz, S.; Arin, L.; Raimbault, P.; Estrada, M. Physical-biological coupling in the Algerian Basin (SW Mediterranean): Influence of mesoscale instabilities on the biomass and production of phytoplankton and bacterioplankton. Deep Sea Res. 1 Oceanogr. Res. Pap. 2001, 48, 405–437. [Google Scholar] [CrossRef]
- Ning, X.; Chai, F.; Xue, H.; Cai, Y.; Liu, C.; Shi, J. Physical-biological oceanographic coupling influencing phytoplankton and primary production in the South China Sea. J. Geophys. Res. 2005, 110, C10005. [Google Scholar] [CrossRef]
- Raven, J.R. The twelfth tansley lecture. Small is beautiful: The picophytoplankton. Funct. Ecol. 1998, 12, 503–513. [Google Scholar] [CrossRef]
- Litchman, E.; Klausmeier, C.A.; Schofield, O.M.; Falkowski, P.G. The role of functional traits and trade-offs in structuring phytoplankton communities: Scaling from cellular to ecosystem level. Ecol. Lett. 2007, 10, 1170–1181. [Google Scholar] [CrossRef] [PubMed]
- Longhurst, A.R. Ecological Geography of the Sea; Academic Press: London, UK, 2010. [Google Scholar]
- Lee, S.H.; Joo, H.T.; Lee, J.H.; Lee, J.H.; Kang, J.J.; Lee, H.W.; Lee, D.B.; Kang, C.K. Carbon uptake rates of phytoplankton in the Northern East/Japan Sea. Deep Sea Res. 2 Top. Stud. Oceanogr. 2017, 143, 45–53. [Google Scholar] [CrossRef]
- Gong, G.C.; Wen, Y.H.; Wang, B.W.; Liu, G.J. Seasonal variation of chlorophyll a concentration, primary production and environmental conditions in the subtropical East China Sea. Deep. Res. 2 Top. Stud. Oceanogr. 2003, 50, 1219–1236. [Google Scholar] [CrossRef]
- Zhang, Y.R.; Ding, Y.P.; Li, T.J.; Xue, B.; Euo, Y.M. Annual variations of chlorophyll a and primary productivity in the East China Sea. Oceanol. Limno. Sin. 2016, 47, 261–268. [Google Scholar]
- Nagata, H. The Yamato Rise, central Japan Sea. Plankton Bio. Ecol. 1998, 45, 159–170. [Google Scholar]
- Yoshie, N.; Shin, K.H.; Noriki, S. Seasonal variations of primary productivity and assimilation numbers in the western North Pacific. Spec. Rep. Reg. Stud. North-East Eurasia North Pac. Hokkaido Univ. 1999, 1, 49–62. [Google Scholar]
- Kang, Y.S.; Choi, J.K.; Chung, K.H.; Park, Y.C. Primary productivity and assimilation umber in the Kyonggi bay and the mid-eastern coast of Yellow Sea. J. Oceanogr. Soc. Korea. 1992, 27, 237–246. [Google Scholar]
- Jang, H.K.; Kang, J.J.; Lee, J.H.; Kim, M.; Ahn, S.H.; Jeong, J.Y.; Yun, M.S.; Han, I.S.; Lee, S.H. Recent Primary Production and Small Phytoplankton Contribution in the Yellow Sea during the Summer in 2016. Ocean Sci. J. 2018, 53, 509–519. [Google Scholar] [CrossRef]
- Richardson, A.J. In hot water: Zooplankton and climate change. ICES J. Mar. Sci. 2008, 65, 279–295. [Google Scholar] [CrossRef]
- Hansen, B.; Hjornsen, P.K.; Hansen, P.J. The Size Ration between Planktonic Predators and Their Prey. Limmol. Oceanogr. 1994, 39, 395–403. [Google Scholar] [CrossRef]
- Calbet, A.; Landary, M.R. Mesozooplankton Influences on the Microbial Food Web: Direct and Indirect Trophic Interactions in the Oligotrophic Open Ocean. Limmol. Oceanogr. 1999, 44, 1370–1380. [Google Scholar] [CrossRef]
- Yang, E.J.; Choi, J.K. Ingestion on Planktonic Ciliates by Copepod Acartia Hongi: A Laboratory Study. Ocean Polar Res. 2009, 31, 265–276. [Google Scholar] [CrossRef]

| Station | Latitude | Longitude | Bottom Depth (m) |
|---|---|---|---|
| 203-01 | 33.9 | 126.5 | 55 |
| 203-03 | 33.6 | 126.3 | 141 |
| 204-04 | 33.9 | 127.2 | 81 |
| 205-03 | 34.1 | 127.9 | 81 |
| 205-05 | 33.6 | 128.1 | 120 |
| 206-03 | 34.4 | 128.8 | 102 |
| 207-03 | 34.9 | 129.2 | 130 |
| 314-03 | 33.0 | 127.2 | 107 |
| 314-05 | 33.0 | 126.5 | 108 |
| 400-14 | 34.2 | 128.4 | 84 |
| 400-25 | 33.5 | 127.5 | 102 |
| 400-27 | 33.5 | 127.1 | 127 |
| St. | Depth | NH4 | NO2 + NO3 | PO4 | SiO2 | St. | Depth | NH4 | NO2 + NO3 | PO4 | SiO2 |
|---|---|---|---|---|---|---|---|---|---|---|---|
| 203-01 | 0 | 1.0 ± 0.4 | 1.1 ± 0.9 | 0.2 ± 0.1 | 6.3 ± 1.6 | 207-03 | 0 | 1.1 ± 0.6 | 1.7 ± 2.5 | 0.2 ± 0.1 | 6.2 ± 2.2 |
| 10 | 1.2 ± 0.8 | 1.8 ± 1.5 | 0.1 ± 0.1 | 7.1 ± 2.0 | 10 | 0.9 ± 0.5 | 3.8 ± 7.6 | 0.2 ± 0.3 | 8.4 ± 8.6 | ||
| 20 | 1.0 ± 0.6 | 4.4 ± 1.7 | 0.4 ± 0.2 | 9.3 ± 1.3 | 20 | 1.1 ± 0.5 | 1.5 ± 1.6 | 0.4 ± 0.3 | 5.5 ± 1.9 | ||
| 30 | 1.1 ± 0.6 | 7.6 ± 0.9 | 0.6 ± 0.3 | 11.1 ± 1.0 | 30 | 0.9 ± 0.4 | 4.5 ± 3.3 | 0.5 ± 0.1 | 9.1 ± 3.3 | ||
| 50 | 1.2 ± 0.6 | 9.3 ± 1.8 | 0.7 ± 0.3 | 12.7 ± 1.3 | 50 | 1.0 ± 0.6 | 8.5 ± 1.5 | 0.6 ± 0.3 | 14.8 ± 8.4 | ||
| 75 | 0.9 ± 0.4 | 10.7 ± 1.5 | 0.8 ± 0.4 | 15.1 ± 2.0 | |||||||
| 100 | 1.0 ± 0.5 | 12.7 ± 1.6 | 1.1 ± 0.4 | 18.1 ± 2.6 | |||||||
| 203-03 | 0 | 0.8 ± 0.3 | 0.6 ± 0.4 | 0.2 ± 0.1 | 5.2 ± 3.0 | 314-03 | 0 | 1.1 ± 0.4 | 0.7 ± 0.4 | 0.2 ± 0.1 | 3.3 ± 2.2 |
| 10 | 0.7 ± 0.2 | 2.8 ± 4.8 | 0.4 ± 0.4 | 7.7 ± 4.8 | 10 | 1.1 ± 0.6 | 0.6 ± 0.4 | 0.2 ± 0.2 | 3.0 ± 2.4 | ||
| 20 | 0.9 ± 0.4 | 4.1 ± 5.0 | 0.4 ± 0.5 | 8.9 ± 4.4 | 20 | 0.8 ± 0.2 | 0.6 ± 0.3 | 0.2 ± 0.2 | 2.7 ± 0.7 | ||
| 30 | 0.7 ± 0.5 | 4.7 ± 2.6 | 0.3 ± 0.2 | 9.2 ± 1.8 | 30 | 0.7 ± 0.4 | 1.3 ± 0.8 | 0.2 ± 0.1 | 5.0 ± 1.8 | ||
| 50 | 0.6 ± 0.3 | 9.4 ± 2.1 | 0.7 ± 0.4 | 12.6 ± 2.8 | 50 | 0.6 ± 0.2 | 6.9 ± 2.0 | 0.7 ± 0.7 | 9.6 ± 3.3 | ||
| 75 | 0.8 ± 0.6 | 7.5 ± 3.8 | 0.6 ± 0.2 | 11.1 ± 4.1 | 75 | 0.5 ± 0.2 | 9.5 ± 1.9 | 0.7 ± 0.3 | 13.1 ± 1.8 | ||
| 100 | 0.8 ± 0.5 | 8.5 ± 3.3 | 0.6 ± 0.2 | 12.3 ± 3.6 | 100 | 0.8 ± 0.3 | 12.4 ± 0.7 | 1.2 ± 0.6 | 17.5 ± 1.8 | ||
| 204-03 | 0 | 1.2 ± 0.4 | 1.0 ± 0.4 | 0.1 ± 0.1 | 5.9 ± 2.2 | 314-05 | 0 | 0.7 ± 0.2 | 0.6 ± 0.5 | 0.2 ± 0.2 | 4.7 ± 3.3 |
| 10 | 1.2 ± 0.8 | 1.6 ± 4.8 | 0.2 ± 0.2 | 6.8 ± 2.9 | 10 | 1.0 ± 0.5 | 0.8 ± 0.7 | 0.2 ± 0.2 | 4.8 ± 3.5 | ||
| 20 | 1.0 ± 0.6 | 2.7 ± 5.0 | 0.3 ± 0.2 | 8.5 ± 2.3 | 20 | 0.7 ± 0.2 | 0.7 ± 0.4 | 0.3 ± 0.2 | 5.0 ± 3.2 | ||
| 30 | 1.0 ± 0.6 | 3.7 ± 2.6 | 0.4 ± 0.3 | 8.8 ± 2.2 | 30 | 0.7 ± 0.2 | 2.7 ± 2.2 | 0.3 ± 0.4 | 6.1 ± 3.4 | ||
| 50 | 0.9 ± 0.6 | 8.1 ± 2.1 | 0.6 ± 0.2 | 12.1 ± 3.1 | 50 | 0.8 ± 0.3 | 6.2 ± 2.5 | 0.6 ± 0.4 | 9.6 ± 3.6 | ||
| 75 | 1.1 ± 0.3 | 10.4 ± 3.8 | 0.8 ± 0.3 | 14.8 ± 5.3 | 75 | 0.6 ± 0.3 | 8.7 ± 2.2 | 0.8 ± 0.3 | 12.4 ± 2.8 | ||
| 100 | 0.7 ± 0.4 | 10.9 ± 1.7 | 1.1 ± 0.4 | 15.3 ± 3.0 | |||||||
| 205-03 | 0 | 1.0 ± 0.3 | 0.5 ± 0.1 | 0.2 ± 0.1 | 5.8 ± 2.2 | 400-14 | 0 | 0.9 ± 0.5 | 1.1 ± 1.6 | 0.3 ± 0.4 | 5.4 ± 2.8 |
| 10 | 0.9 ± 0.3 | 0.6 ± 0.2 | 0.2 ± 0.2 | 6.4 ± 2.2 | 10 | 0.9 ± 0.7 | 1.0 ± 1.1 | 0.3 ± 0.3 | 5.8 ± 3.6 | ||
| 20 | 0.7 ± 0.3 | 2.6 ± 2.4 | 0.3 ± 0.2 | 6.9 ± 3.9 | 20 | 1.1 ± 0.9 | 1.9 ± 2.6 | 0.3 ± 0.2 | 6.9 ± 3.9 | ||
| 30 | 0.8 ± 0.3 | 5.4 ± 4.0 | 0.5 ± 0.2 | 8.8 ± 4.5 | 30 | 0.8 ± 0.3 | 5.8 ± 2.9 | 0.5 ± 0.4 | 9.7 ± 3.0 | ||
| 50 | 0.9 ± 0.5 | 11.2 ± 2.4 | 0.8 ± 0.2 | 15.9 ± 2.5 | 50 | 0.7 ± 0.6 | 10.4 ± 1.8 | 1.1 ± 0.5 | 15.1 ± 3.5 | ||
| 75 | 0.8 ± 0.4 | 11.7 ± 1.7 | 1.0 ± 0.2 | 16.7 ± 2.2 | 75 | 0.6 ± 0.4 | 11.9±1.4 | 1.0 ± 0.4 | 17.2 ± 2.0 | ||
| 205-05 | 0 | 1.0 ± 0.6 | 0.6 ± 0.4 | 0.4 ± 0.5 | 3.1 ± 1.8 | 400-25 | 0 | 1.2 ± 0.7 | 0.9 ± 0.6 | 0.2 ± 0.2 | 4.5 ± 2.1 |
| 10 | 0.8 ± 0.3 | 0.8 ± 0.4 | 0.2 ± 0.1 | 3.1 ± 1.5 | 10 | 1.0 ± 0.7 | 1.1 ± 0.8 | 0.3 ± 0.4 | 3.6 ± 1.4 | ||
| 20 | 1.0 ± 0.6 | 0.9 ± 0.8 | 0.4 ± 0.3 | 2.8 ± 1.4 | 20 | 0.9 ± 0.3 | 1.2 ± 1.1 | 0.3 ± 0.4 | 3.8 ± 2.1 | ||
| 30 | 0.7 ± 0.3 | 1.6 ± 1.5 | 0.3 ± 0.2 | 6.9 ± 7.3 | 30 | 0.8 ± 0.2 | 4.3 ± 4.6 | 0.4 ± 0.4 | 7.2 ± 4.6 | ||
| 50 | 0.9 ± 0.4 | 5.0 ± 3.0 | 0.3 ± 0.1 | 7.3 ± 3.7 | 50 | 0.6 ± 0.2 | 7.8 ± 1.6 | 0.7 ± 0.4 | 10.5 ± 2.3 | ||
| 75 | 0.8 ± 0.3 | 8.9 ± 2.2 | 0.7 ± 0.2 | 11.4 ± 3.4 | 75 | 0.5 ± 0.3 | 10.0 ± 1.7 | 0.9 ± 0.4 | 13.7 ± 2.1 | ||
| 100 | 0.8 ± 0.4 | 10.7 ± 1.5 | 0.8 ± 0.2 | 14.4 ± 1.8 | 100 | 1.0 ± 0.4 | 12.4 ± 1.1 | 1.1 ± 0.4 | 17.4 ± 1.1 | ||
| 206-03 | 0 | 1.0 ± 0.4 | 0.6 ± 0.3 | 0.3 ± 0.4 | 4.9 ± 2.3 | 400-27 | 0 | 0.7 ± 0.3 | 0.9 ± 0.3 | 0.3 ± 0.3 | 6.1 ± 1.8 |
| 10 | 0.9 ± 0.3 | 0.5 ± 0.3 | 0.2 ± 0.1 | 5.4 ± 2.5 | 10 | 1.1 ± 0.6 | 0.6±0.3 | 0.2 ± 0.3 | 6.2 ± 2.2 | ||
| 20 | 0.9 ± 0.3 | 1.2 ± 1.2 | 0.2 ± 0.1 | 6.4 ± 2.2 | 20 | 0.8 ± 0.5 | 1.2 ± 0.8 | 0.4 ± 0.3 | 6.8 ± 1.0 | ||
| 30 | 0.9 ± 0.3 | 3.5 ± 3.4 | 0.3 ± 0.1 | 8.7 ± 1.9 | 30 | 0.8 ± 0.5 | 3.1 ± 2.3 | 0.4 ± 0.3 | 7.9 ± 1.8 | ||
| 50 | 1.8 ± 1.9 | 8.2 ± 3.8 | 0.6 ± 0.4 | 12.6 ± 4.6 | 50 | 1.5 ± 1.5 | 7.6 ± 1.5 | 0.7 ± 0.4 | 11.1 ± 1.4 | ||
| 75 | 0.8 ± 0.3 | 8.4 ± 5.8 | 0.8 ± 0.3 | 14.0 ± 5.9 | 75 | 0.7 ± 0.4 | 9.3 ± 1.5 | 0.8 ± 0.4 | 12.8 ± 1.4 | ||
| 100 | 0.9 ± 0.3 | 11.3 ± 3.0 | 0.9 ± 0.2 | 16.5 ± 4.9 | 100 | 0.8 ± 0.8 | 11.3 ± 2.4 | 1.0 ± 0.4 | 15.9 ± 3.0 |
| 2018 | 2019 | 2020 | 2021 | 2022 | |
|---|---|---|---|---|---|
| First | Nanoflagellates (<20 μm; 62.0%) | Nanoflagellates (<20 μm; 68.8%) | Nanoflagellates (<20 μm; 77.5%) | Nanoflagellates (<20 μm; 29.3%) | Nanoflagellates (<20 μm; 90.0%) |
| Second | Pseudo-nitzschia spp. (13.2%) | Chaetoceros curvisetus. (19.7%) | Dactyliosolen fragilissimus (25.2%) | ||
| Third | Skeletonema spp. (7.6%) |
| Chl-a Composition (%) | Chl-a Composition (%) | ||||||||
|---|---|---|---|---|---|---|---|---|---|
| St. | Depth | M | N | P | St. | Depth | M | N | P |
| 203-01 | 0 | 21.1 ± 10.2 | 39.0 ± 35.1 | 39.9 ± 30.4 | 207-03 | 0 | 19.0 ± 9.0 | 29.2 ± 36.7 | 51.8 ± 30.8 |
| 10 | 19.9 ± 13.2 | 21.7 ± 7.7 | 58.4 ± 16.9 | 10 | 37.2 ± 37.3 | 9.3 ± 5.3 | 53.5 ± 32.2 | ||
| 20 | 23.0 ± 18.2 | 23.4 ± 8.1 | 53.8 ± 20.9 | 20 | 7.8 ± 10.8 | 14.1 ± 11.0 | 78.1 ± 13.8 | ||
| 30 | 21.9 ± 12.9 | 28.2 ± 7.3 | 49.9 ± 11.6 | 30 | 30.4 ± 28.0 | 11.2 ± 6.8 | 58.4± 24.8 | ||
| 50 | 14.8 ± 15.0 | 31.6 ± 11.2 | 53.5 ± 23.1 | 50 | 10.1 ± 6.8 | 24.4 ± 9.5 | 65.4 ± 10.8 | ||
| 75 | 26.0 ± 17.7 | 35.8 ± 15.7 | 38.2 ± 32.6 | ||||||
| 100 | 25.6 ± 16.2 | 41.0 ± 9.4 | 33.4 ± 22.1 | ||||||
| 203-03 | 0 | 19.9 ± 25.6 | 25.7 ± 17.7 | 54.4 ± 32.2 | 314-03 | 0 | 17.2 ± 16.9 | 20.3 ± 24.2 | 62.5 ± 17.1 |
| 10 | 17.8 ± 22.2 | 19.4 ± 7.6 | 62.8 ± 17.3 | 10 | 13.8 ± 12.3 | 14.8 ± 7.9 | 71.4 ± 8.6 | ||
| 20 | 18.2 ± 19.7 | 16.4 ± 4.3 | 65.4 ± 17.1 | 20 | 15.6 ± 7.1 | 14.3 ± 5.1 | 70.1 ± 9.4 | ||
| 30 | 16.2 ± 9.0 | 20.6 ± 7.3 | 63.3 ± 13.2 | 30 | 27.9 ± 23.7 | 14.9 ± 3.3 | 57.2 ± 25.5 | ||
| 50 | 9.0 ± 7.0 | 33.3 ± 2.3 | 57.7 ± 8.3 | 50 | 26.9 ± 27.7 | 18.8 ± 1.8 | 54.4 ± 29.0 | ||
| 75 | 12.1 ± 10.3 | 42.2 ± 13.2 | 45.7 ± 6.8 | 75 | 11.1 ± 12.4 | 34.5 ± 23.8 | 54.3 ± 19.4 | ||
| 100 | 14.3 ± 11.5 | 46.6 ± 16.3 | 39.1 ± 9.4 | 100 | 14.7 ± 16.3 | 31.8 ± 4.2 | 53.5 ± 13.5 | ||
| 204-04 | 0 | 22.5 ± 25.6 | 14.1 ± 3.5 | 63.4 ± 14.0 | 314-05 | 0 | 15.9 ± 6.5 | 22.9 ± 19.8 | 61.3 ± 21.6 |
| 10 | 16.5 ± 22.2 | 18.4 ± 9.4 | 65.0 ± 13.0 | 10 | 14.2 ± 6.6 | 13.7 ± 6.2 | 72.1 ± 9.0 | ||
| 20 | 12.5 ± 19.7 | 15.5 ± 6.2 | 72.0 ± 7.1 | 20 | 7.3 ± 5.6 | 23.1 ± 7.7 | 79.6 ± 2.4 | ||
| 30 | 13.7 ± 9.0 | 22.3 ± 8.4 | 64.0 ± 11.5 | 30 | 12.2 ± 10.8 | 14.5 ± 9.8 | 73.3 ± 9.9 | ||
| 50 | 17.9 ± 7.0 | 38.9 ± 6.5 | 43.2 ± 10.4 | 50 | 19.0 ± 15.3 | 17.4 ± 4.3 | 63.6 ± 18.6 | ||
| 75 | 20.0 ± 10.3 | 40.4 ± 8.6 | 39.6 ± 4.1 | 75 | 11.6 ± 9.2 | 30.1 ± 7.5 | 58.3 ± 3.1 | ||
| 100 | 14.6 ± 5.7 | 41.0 ± 7.2 | 44.4 ± 7.8 | ||||||
| 205-03 | 0 | 21.2 ± 18.0 | 12.5 ± 4.9 | 66.3 ± 14.0 | 400-14 | 0 | 13.4 ± 15.4 | 19.3 ± 21.1 | 67.3 ± 17.6 |
| 10 | 22.3 ± 20.4 | 11.9 ± 4.1 | 65.8 ± 19.9 | 10 | 21.3 ± 12.2 | 11.5 ± 6.9 | 67.3 ± 9.5 | ||
| 20 | 19.1 ± 17.1 | 18.1 ± 9.6 | 62.8 ± 8.2 | 20 | 14.2 ± 13.1 | 11.8 ± 7.7 | 74.0 ± 7.5 | ||
| 30 | 22.7 ± 11.2 | 17.4 ± 11.1 | 59.8 ± 12.6 | 30 | 14.8 ± 10.1 | 16.3 ± 9.3 | 69.0 ± 11.5 | ||
| 50 | 20.9 ± 16.1 | 36.1 ± 7.3 | 43.0 ± 10.4 | 50 | 10.5 ± 12.8 | 30.6 ± 7.2 | 58.9 ± 12.2 | ||
| 75 | 24.0 ± 2.8 | 41.7 ± 8.4 | 34.3 ± 7.8 | 75 | 10.6 ± 12.5 | 39.8 ± 5.1 | 49.5 ± 7.9 | ||
| 205-05 | 0 | 18.9 ± 5.7 | 14.0 ± 4.6 | 67.1 ± 1.4 | 400-25 | 0 | 37.9 ± 35.2 | 10.8 ± 4.4 | 51.3 ± 31.3 |
| 10 | 12.7 ± 9.0 | 11.9 ± 3.8 | 75.4 ± 5.5 | 10 | 28.9 ± 5.0 | 12.9 ± 2.7 | 58.2 ± 3.9 | ||
| 20 | 7.8 ± 5.2 | 13.4 ± 5.7 | 78.8 ± 3.8 | 20 | 24.0 ± 14.4 | 14.7 ± 2.8 | 61.3 ± 12.1 | ||
| 30 | 9.8 ± 2.1 | 19.2 ± 9.6 | 71.0 ± 10.9 | 30 | 13.2 ± 4.0 | 14.2 ± 6.0 | 72.6 ± 8.5 | ||
| 50 | 24.1 ± 36.8 | 12.8 ± 9.0 | 63.1 ± 29.2 | 50 | 17.2 ± 11.2 | 15.5 ± 3.8 | 67.3 ± 7.9 | ||
| 75 | 15.4 ± 15.4 | 21.0 ± 9.4 | 63.7 ± 23.5 | 75 | 8.6 ± 11.5 | 24.8 ± 6.9 | 66.6 ± 17.5 | ||
| 100 | 18.0 ± 11.5 | 29.2 ± 13.7 | 52.8 ± 18.7 | 100 | 16.0 ± 14.9 | 57.4 ± 31.9 | 26.6 ± 21.9 | ||
| 206-03 | 0 | 9.4 ± 12.5 | 14.1 ± 3.1 | 76.5 ± 11.5 | 400-27 | 0 | 11.7 ± 11.3 | 10.1 ± 1.7 | 78.3 ± 12.9 |
| 10 | 12.9 ± 14.8 | 12.5 ± 2.1 | 74.6 ± 15.1 | 10 | 18.1 ± 27.3 | 12.2 ± 3.7 | 69.7 ± 30.4 | ||
| 20 | 12.1 ± 12.2 | 10.3 ± 2.1 | 77.6 ± 11.3 | 20 | 9.1 ± 118 | 12.9 ± 4.0 | 78.0 ± 12.5 | ||
| 30 | 6.3 ± 6.5 | 14.3 ± 4.2 | 79.4 ± 9.6 | 30 | 10.4 ± 12.8 | 24.7 ± 10.0 | 64.9 ± 4.3 | ||
| 50 | 11.2 ± 10.9 | 25.9 ± 5.4 | 62.9 ± 16.0 | 50 | 13.8 ± 10.3 | 21.3 ± 2.0 | 64.8 ± 9.0 | ||
| 75 | 12.2 ± 13.3 | 37.0 ± 15.6 | 50.8 ± 11.2 | 75 | 9.9 ± 5.7 | 30.3 ± 10.7 | 59.9 ± 6.7 | ||
| 100 | 13.2 ± 11.8 | 59.9 ± 15.2 | 26.9 ± 14.7 | 100 | 11.9 ± 11.6 | 45.4 ± 13.2 | 42.6 ± 3.3 | ||
Disclaimer/Publisher’s Note: The statements, opinions and data contained in all publications are solely those of the individual author(s) and contributor(s) and not of MDPI and/or the editor(s). MDPI and/or the editor(s) disclaim responsibility for any injury to people or property resulting from any ideas, methods, instructions or products referred to in the content. |
© 2023 by the authors. Licensee MDPI, Basel, Switzerland. This article is an open access article distributed under the terms and conditions of the Creative Commons Attribution (CC BY) license (https://creativecommons.org/licenses/by/4.0/).
Share and Cite
Park, K.-W.; Chung, M.-H.; Yoo, M.-H.; O, K.-S.; Kim, K.-Y.; Park, T.-G.; Youn, S.-H. Impact of Phytoplankton Community Structure Changes in the South Sea of Korea on Marine Ecosystems Due to Climate Change. Water 2023, 15, 4043. https://doi.org/10.3390/w15234043
Park K-W, Chung M-H, Yoo M-H, O K-S, Kim K-Y, Park T-G, Youn S-H. Impact of Phytoplankton Community Structure Changes in the South Sea of Korea on Marine Ecosystems Due to Climate Change. Water. 2023; 15(23):4043. https://doi.org/10.3390/w15234043
Chicago/Turabian StylePark, Kyung-Woo, Mi-Hee Chung, Man-Ho Yoo, Kwang-Seok O, Kyoung-Yeon Kim, Tae-Gyu Park, and Seok-Hyun Youn. 2023. "Impact of Phytoplankton Community Structure Changes in the South Sea of Korea on Marine Ecosystems Due to Climate Change" Water 15, no. 23: 4043. https://doi.org/10.3390/w15234043
APA StylePark, K.-W., Chung, M.-H., Yoo, M.-H., O, K.-S., Kim, K.-Y., Park, T.-G., & Youn, S.-H. (2023). Impact of Phytoplankton Community Structure Changes in the South Sea of Korea on Marine Ecosystems Due to Climate Change. Water, 15(23), 4043. https://doi.org/10.3390/w15234043