Article

Sedimentation Characteristics of the Fluctuating Backwater Area at the Tail of Cascade Reservoirs: A Case Study of the Three Gorges Reservoir

1
Upper Changjiang River Bureau of Hydrological and Water Resources Survey, Chongqing 400021, China
2
Changjiang River Scientific Research Institute, Wuhan 430010, China
3
China Three Gorges Construction Engineering Corporation, Chengdu 610095, China
4
Bureau of Hydrology, Changjiang Water Resources Commission, Wuhan 430010, China
*
Author to whom correspondence should be addressed.
Water 2023, 15(22), 4011; https://doi.org/10.3390/w15224011
Submission received: 17 October 2023 / Revised: 14 November 2023 / Accepted: 17 November 2023 / Published: 19 November 2023
(This article belongs to the Special Issue Reservoir Control Operation and Water Resources Management)

Abstract

:
The construction of cascade reservoirs is associated with considerable uncertainty in sedimentation in the fluctuating backwater area of the terminal reservoir and poses challenges to water safety. The sedimentation characteristics under the influence of multiple factors in the main urban area of the Chongqing river section were analyzed as a case study for the operation of cascade reservoirs in the Jinsha River via the utilization of a large dataset spanning back to the normal storage of the Three Gorges Reservoir. The results of this study indicate that, owing to factors such as upstream water, sediment inflow, reservoir operation, and river sand mining, this river section experienced deposition on the sand bars and erosion in the main channel. The rate of sedimentation increased with sediment inflow, peak flow rate, and duration, while the location of sedimentation shifted as the concentration ratio changed. These results may provide technical support not only for the operation of the Three Gorges Reservoir, but also for the governance of the fluctuating backwater areas of other cascade reservoirs.

1. Introduction

The conditions of water and sediment boundaries in fluctuating backwater areas (FBAs) of reservoirs are often complex as they demonstrate characteristics of both a river channel and a reservoir. This results in notable uncertainty in the evolution of the riverbed [1], which can pose challenges for flood control [2], navigation [3,4], the utilization of sand and stone resources [5], water-related engineering [6], and ecological processes [7,8,9] in the area. This sedimentation uncertainty has attracted the attention of both scholars and reservoir operation management departments [10,11]. In the upper reaches of the Yangtze River, the Three Gorges Reservoir (TGR) has become the end of a cascade reservoir group, with its water and sediment conditions having undergone significant changes since its design [12,13]. Chongqing is one of the most important cities in China and is located in the FBA of the TGR, meaning sedimentation problems have a greater impact on its economy and society. Therefore, studying its sedimentation characteristics is of vital importance for not only selecting the optimal operation plan, but also fully utilizing the benefits of the reservoir.
Several studies have investigated sedimentation in the TGR, especially in its FBA. Based on observational data before and during the initial storage period of the TGR, analyses indicate that sedimentation primarily occurs in the perennial reservoir area [14,15], while the riverbed morphology is relatively stable between years. Additionally, there is generally no obvious unidirectional erosion and deposition (E&D) in the main urban area of Chongqing [16]. However, some river models indicate that sedimentation will accumulate and negatively impact ports, waterways, municipal infrastructure, and the ecology within this river section [17]. Since the normal storage operation of the TGR in 2008, the sedimentation rate of fine sand has decreased due to the retention of sediment in large reservoirs in the upper reaches of the Yangtze River, resulting in flocculation and sedimentation [18,19,20]. However, sedimentation is still mainly distributed in the perennial backwater area [21,22], and a lag phenomenon has been observed [23,24]. The tributary estuaries in the reservoir area also have a certain sedimentation amount [25,26]. In the FBA, human activities such as dredging, river regulation, and dock construction have interfered with sedimentation [27]. The usual trend of sedimentation in the flood season and erosion in the dry season has remained unchanged in the main urban area of Chongqing. However, the main sediment transport period has been delayed from the post-flood period to the water level fluctuation period of the following year, with a decreased quantity of sediment transported [28]. A sediment transport analysis has also indicated that there has been a cumulative sedimentation phenomenon in the FBA [29,30]. This may be avoided by increasing the water level dissipation rate of the TGR from the water level in front of the dam at 163 m [31]. In addition, mathematical models have indicated that the sediment saturation coefficient significantly impacts E&D [32], and the influence of the downstream water level leads to random evolution of the riverbed [33]. In the future, under the new water and sediment conditions following the operation of cascade reservoirs in the upper reaches of the Yangtze River, the sedimentation quantity and rate of the TGR will significantly decrease [34], taking up to 560 years to reach equilibrium [35].
The FBAs of cascade reservoirs, particularly tail reservoirs, face more complex water and sediment conditions due to the joint operation of a cascade reservoir [36]. Studies conducted following the design phase of the TGR have demonstrated that the concentrated accumulation of sediment in the FBA would not only lead to the transformation of river types and the elevation of flood season water levels, but also threaten the water depth of port areas and worsen navigation conditions [37]. Currently, studies on the FBA of the TGR, especially the river section in the main urban area of Chongqing, are primarily based on data measured in the initial water storage stage, and measurements of normal water storage in the TGR in 2008 and the operation of the cascade reservoirs in the Jinsha River are lacking. In this study, we elucidated the characteristics of sediment deposition in the FBA of the TGR under the latest water and sediment conditions, utilizing the main urban area of the Chongqing section as a case study. Furthermore, we explored the underlying causes to suggest timely measures to avoid adverse effects. We expect these findings to not only provide technical support for the operation of the TGR, but also for the governance of the FBAs of cascade reservoirs more broadly.

2. Materials and Methods
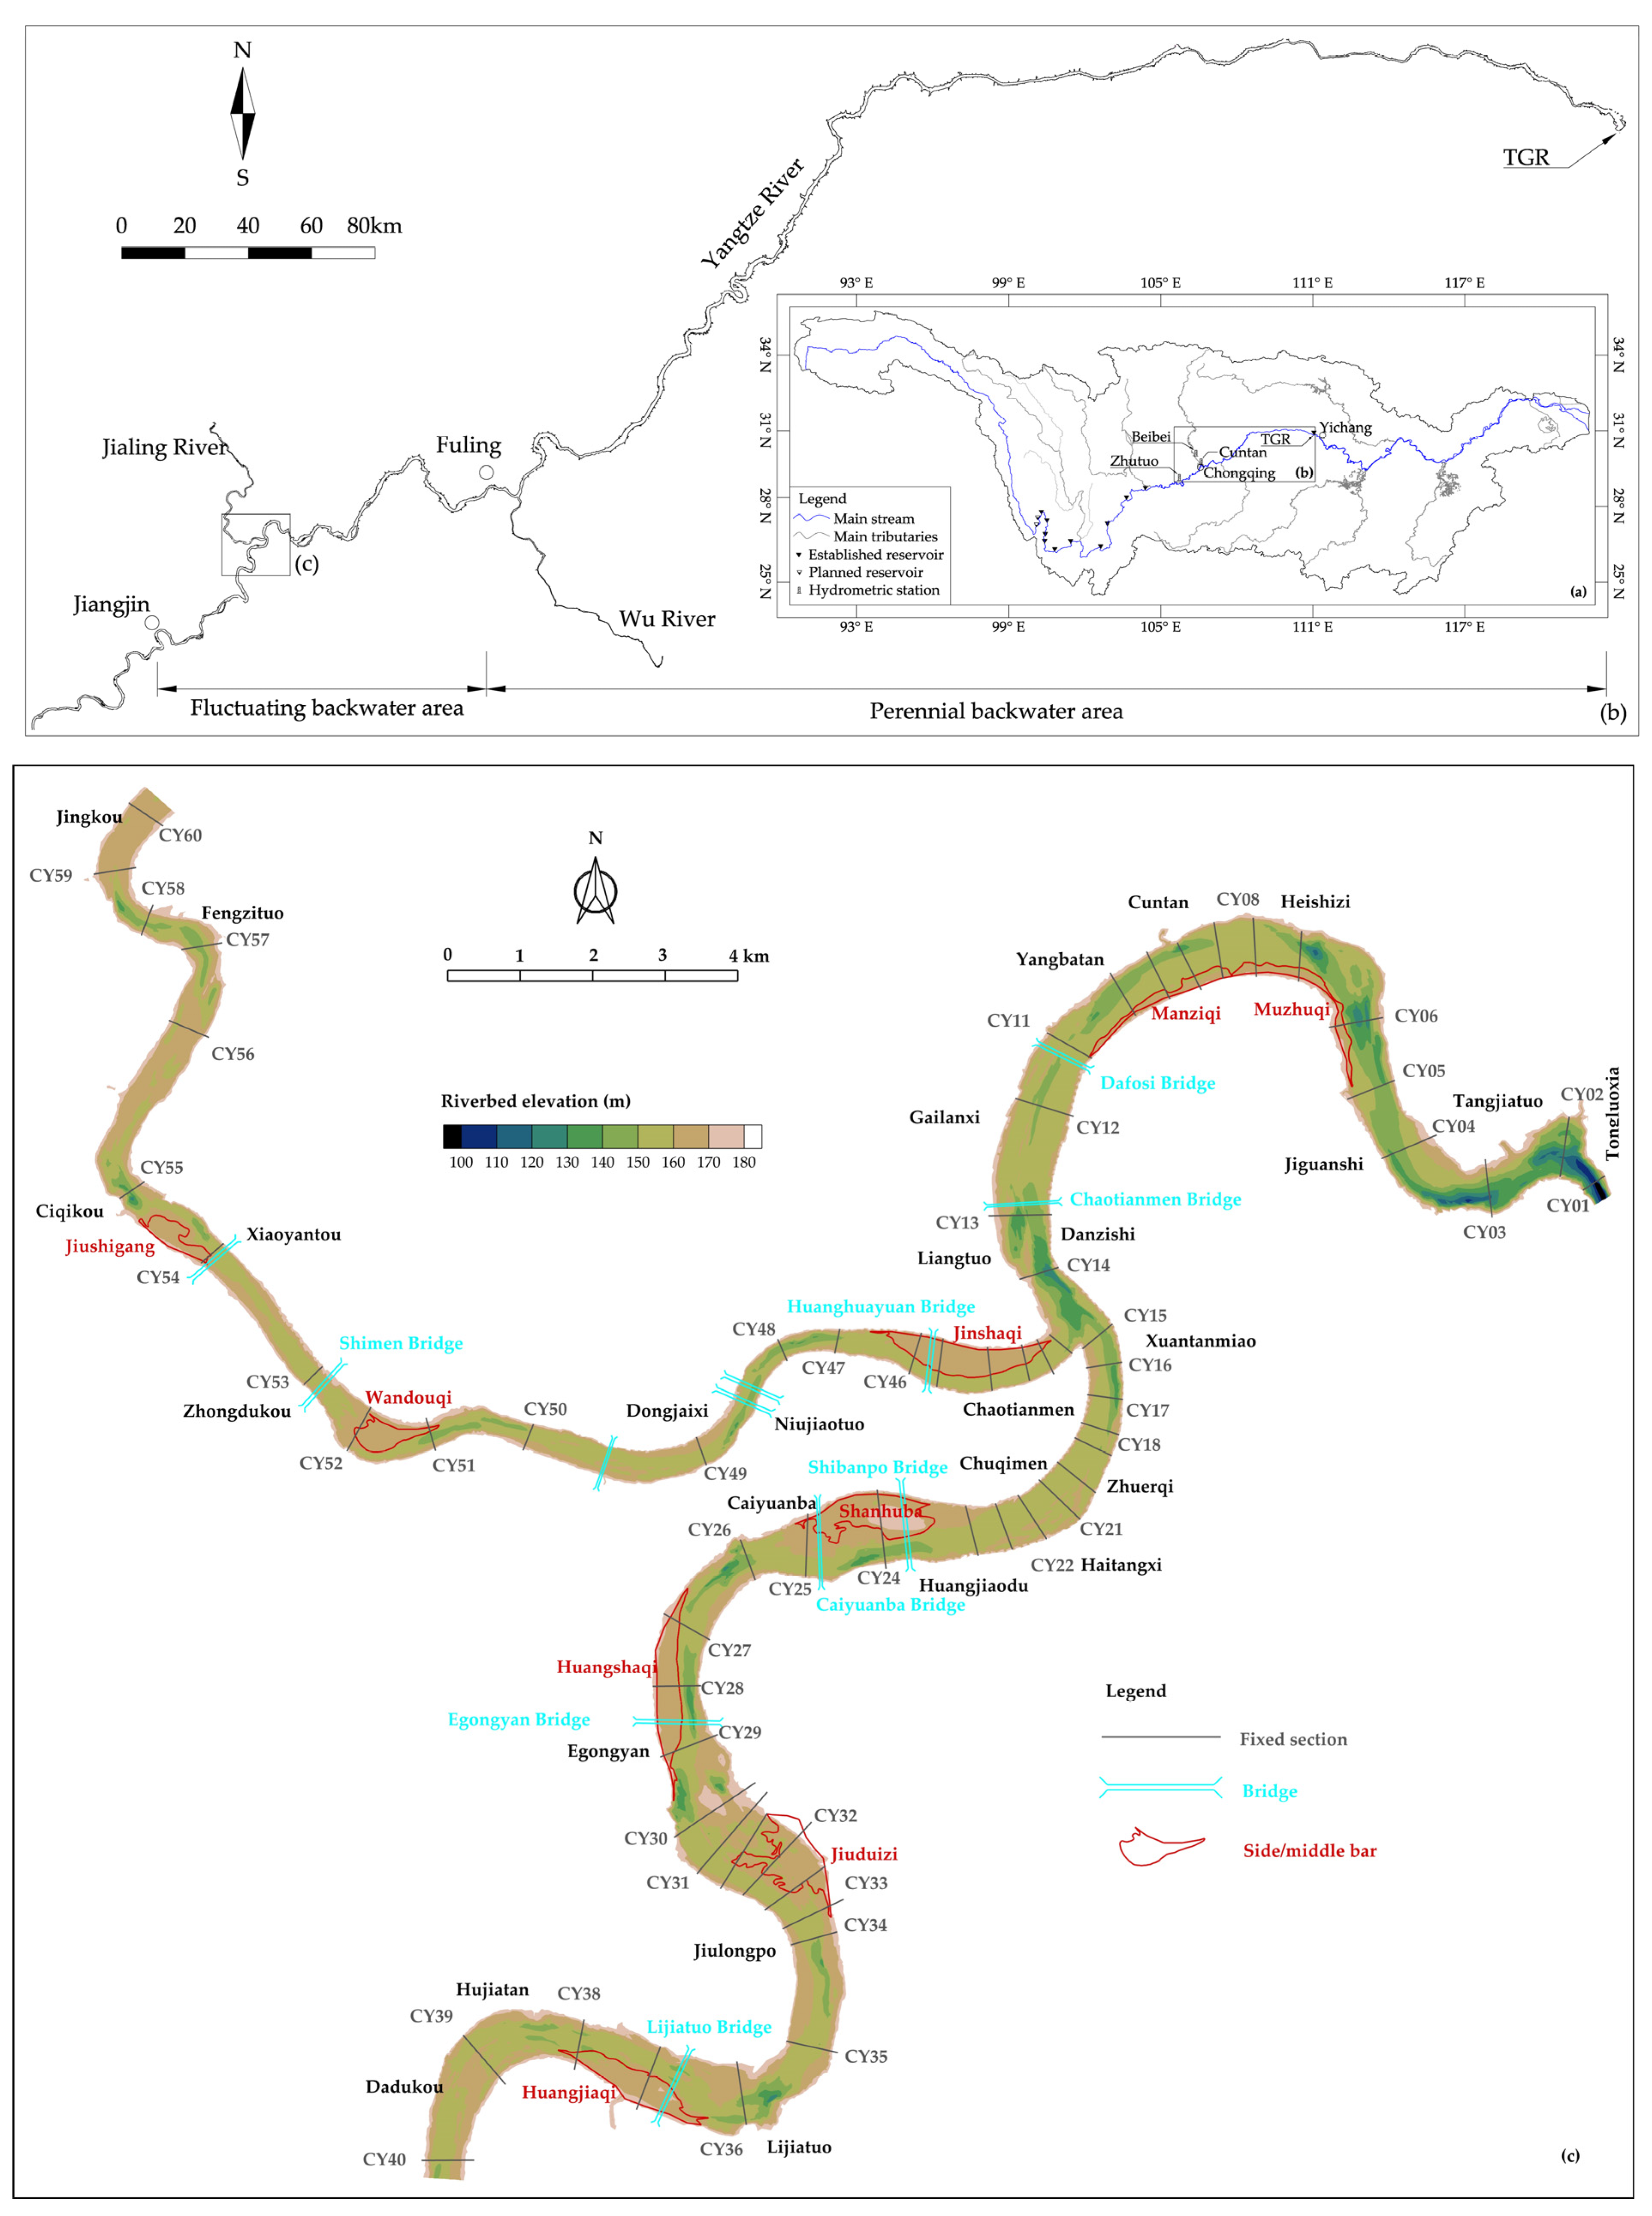
2.1. Study Area

Since the normal impoundment of the TGR in 2008, its backwater end has reached the vicinity of Jiangjin (approximately 660 km away from the dam), with an approximately 173.4 km long FBA ranging from Jiangjin to Fuling [38]. The main urban area of Chongqing is located in the FBA of the TGR, with a total length of 60 km. This includes the 40 km section from Dadukou to Tongluoxia in the main stream of the Yangtze River, and the 20 km section from Jingkou to Chaotianmen in the Jialing River. Due to the influence of geological tectonic processes, the river section in the main urban area of Chongqing presents a continuous curved channel shape on the plane. In the FBA of the TGR, there are six continuous bends in the main stream of the Yangtze River and five bends in the Jialing River. The curves are connected by relatively straight transition sections (Figure 1). This river section alternates between wide and narrow, and the shoreline is uneven with protruding stone mouths on the shore. The main stream of the Yangtze River during flood season is generally 700 to 800 m wide, with branching sections measuring up to 1300 m and as little as approximately 300 m (the Tongluoxia section). During the flood season, the Jialing River section is generally 400 to 500 m wide, reaching up to 800 m and as little as approximately 370 m (the Zengjiayan section).

2.2. Data

Since 2003, the Hydrological Bureau of the Yangtze River Water Conservancy Commission has conducted annual topographic observations on the main urban area of the Chongqing river section from May to December. A terrain scale of 1:5000 is used in July and December, and 65 fixed sections are observed monthly in the remaining months. From 2010 to 2015, to adapt to changes in the water storage of the TGR, dynamic adjustments were made to the observation tasks. While the terrain observation tasks for the entire river section were discontinued, the number of fixed-section observations and measurements of key river sections were increased. In 2010, a total of 16 observations for fixed sections were made, which were gradually reduced to nine annually by 2015. After 2016, based on the operation of the TGR and the evolving characteristics of the river, further adjustments were made to the observation tasks, with one observation each of the fixed sections before and after flooding, in June and in October, respectively, followed by one topographic observation of the entire river section in December. At the same time, terrain measurement tasks of key river sections were discontinued.
The hydrometric control stations for incoming water and sediment in the main urban area of Chongqing include Cuntan and Zhutuo stations in main stream of the Yangtze River (approximately 152 km upstream of Cuntan) and the Beibei station in the Jialing River (approximately 61 km away from the exit of the Jialing River), all of which have kept extensive records of water and sediment observation data. The data used in this study are detailed in Table 1.

2.3. Method

Three methods are typically utilized to calculate the quantity of E&D for a river channel. The first method, named the sediment-flux-method, is based on the difference between the sediment flux entering and exiting the river channel. However, this method is only applicable when there are sediment observation facilities at both the river inlet and outlet. For this study area, only the sediment flux exiting the river channel can be obtained at the Cuntan station. The Zhutuo and Beibei stations are too far away from the entrance of the study area to be applicable. Due to the influence of sediment production in the interval, their observed values cannot accurately represent the sediment flux entering the study area. Therefore, this method is not appropriate for this study.
The second method is based on topography. By dissecting the study area, the two measurements above that correspond to sediment storage can be calculated based on topographic data. Although there are several topographical measurements in the study area, their measurement dates are inconsistent with the cross-section. Additionally, the frequency of observations is much smaller than the that of the section terrain. In this study, a third method, based on cross-sectional data [39], is adopted to reflect the entire E&D process. For a given river section, the channel storage (Vol) can be expressed by utilizing the frustum volume formula:
V o l = Δ x ( A i + A i + 1 A i · A i + 1 ) 3   i = 1 , 2 , , n c s 1
where Ai is the discharge area, Δx is the distance from the i to i + 1 section, and ncs is the number of sections. The total difference in the channel storage between two measurements will be the quantity of E&D.

3. Results

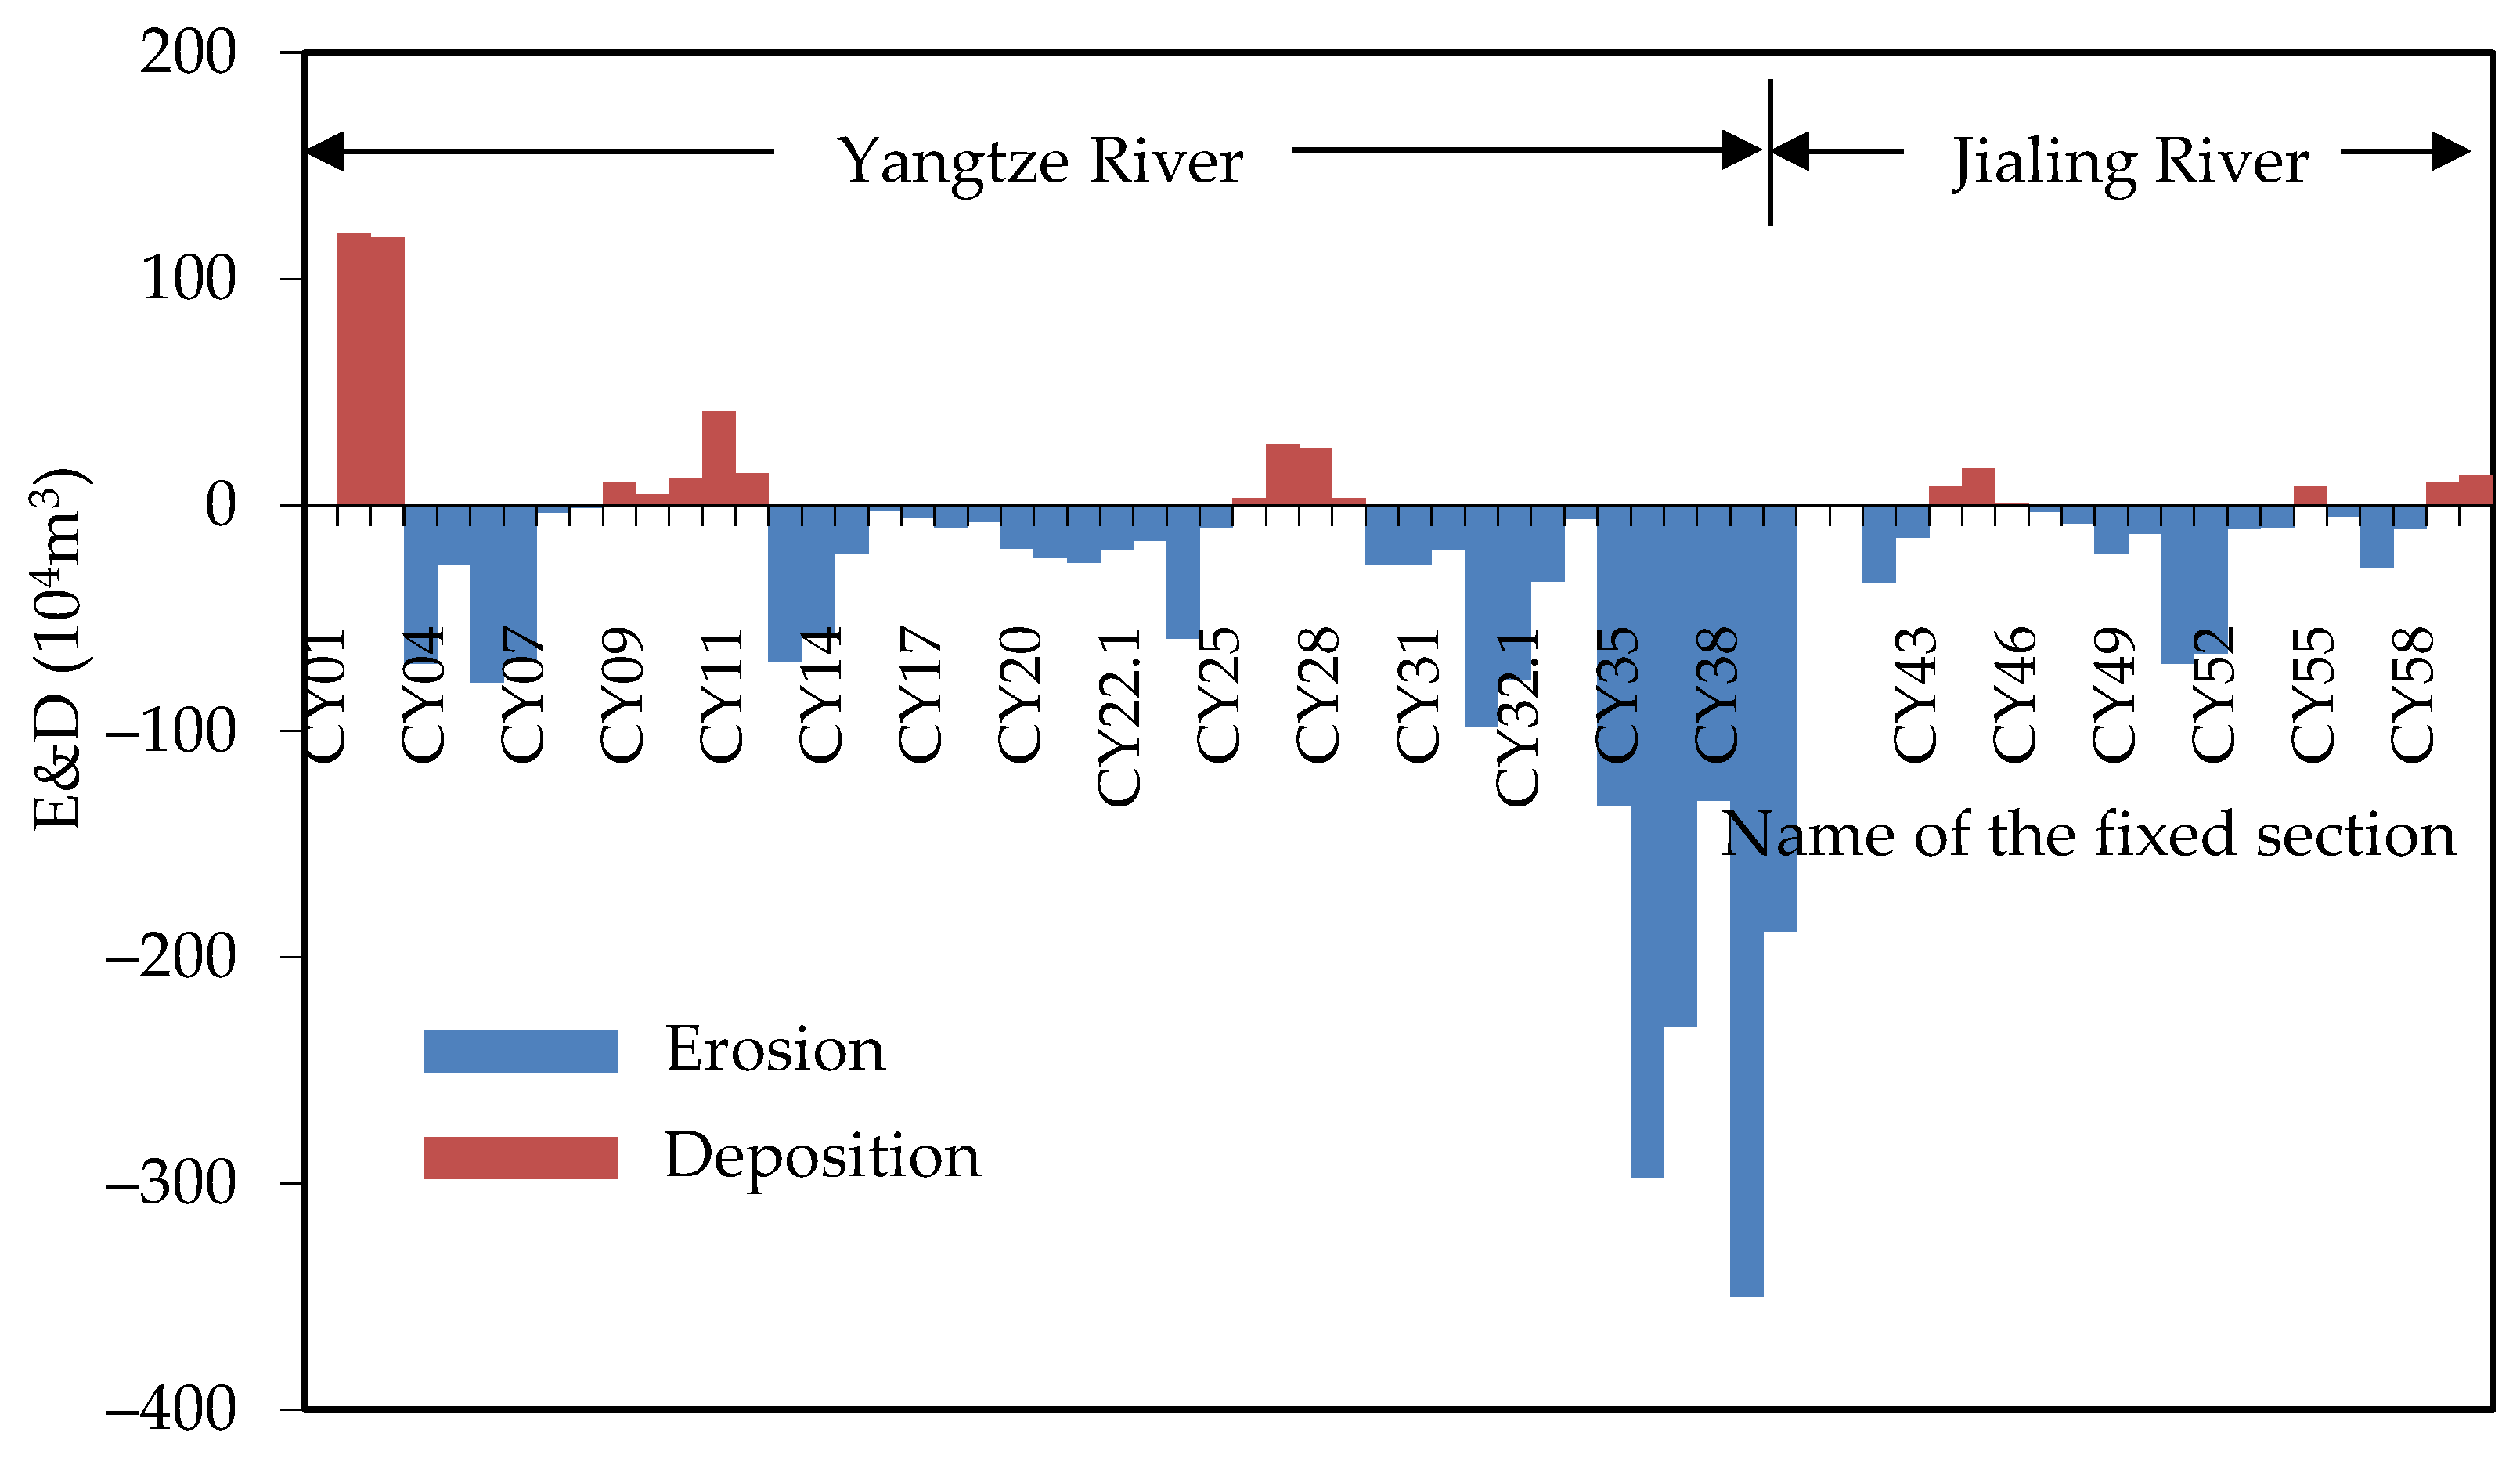
3.1. Volume of Sedimentation

Since the TGR began storing water at a normal water level (175 m) in September 2008, the river section in the main urban area of Chongqing has experienced erosion of 20.672 million m3 of material. Deposition at the side bars totals 2.895 million m3, and scouring in the main channel has reached approximately 23.567 million m3. The process and distribution of E&D are illustrated in Figure 2 and Table 2.
By quantifying the distribution of sedimentation, all sections above and below Chaotianmen in the main stream of the Yangtze River, including the Jialing River section, exhibited erosional volumes of 17.568, 0.744, and 2.360 million m3, respectively. The average scouring depths were 1.04 m, 0.07 m, and 0.21 m, respectively (Table 3), and the maximum sedimentation thickness was 18.3 m in the CY02 section. They were located on the left side of the Tangjiatuo area, approximately 14 km below the confluence, with an elevation of approximately 147 m after sedimentation (Figure 3).

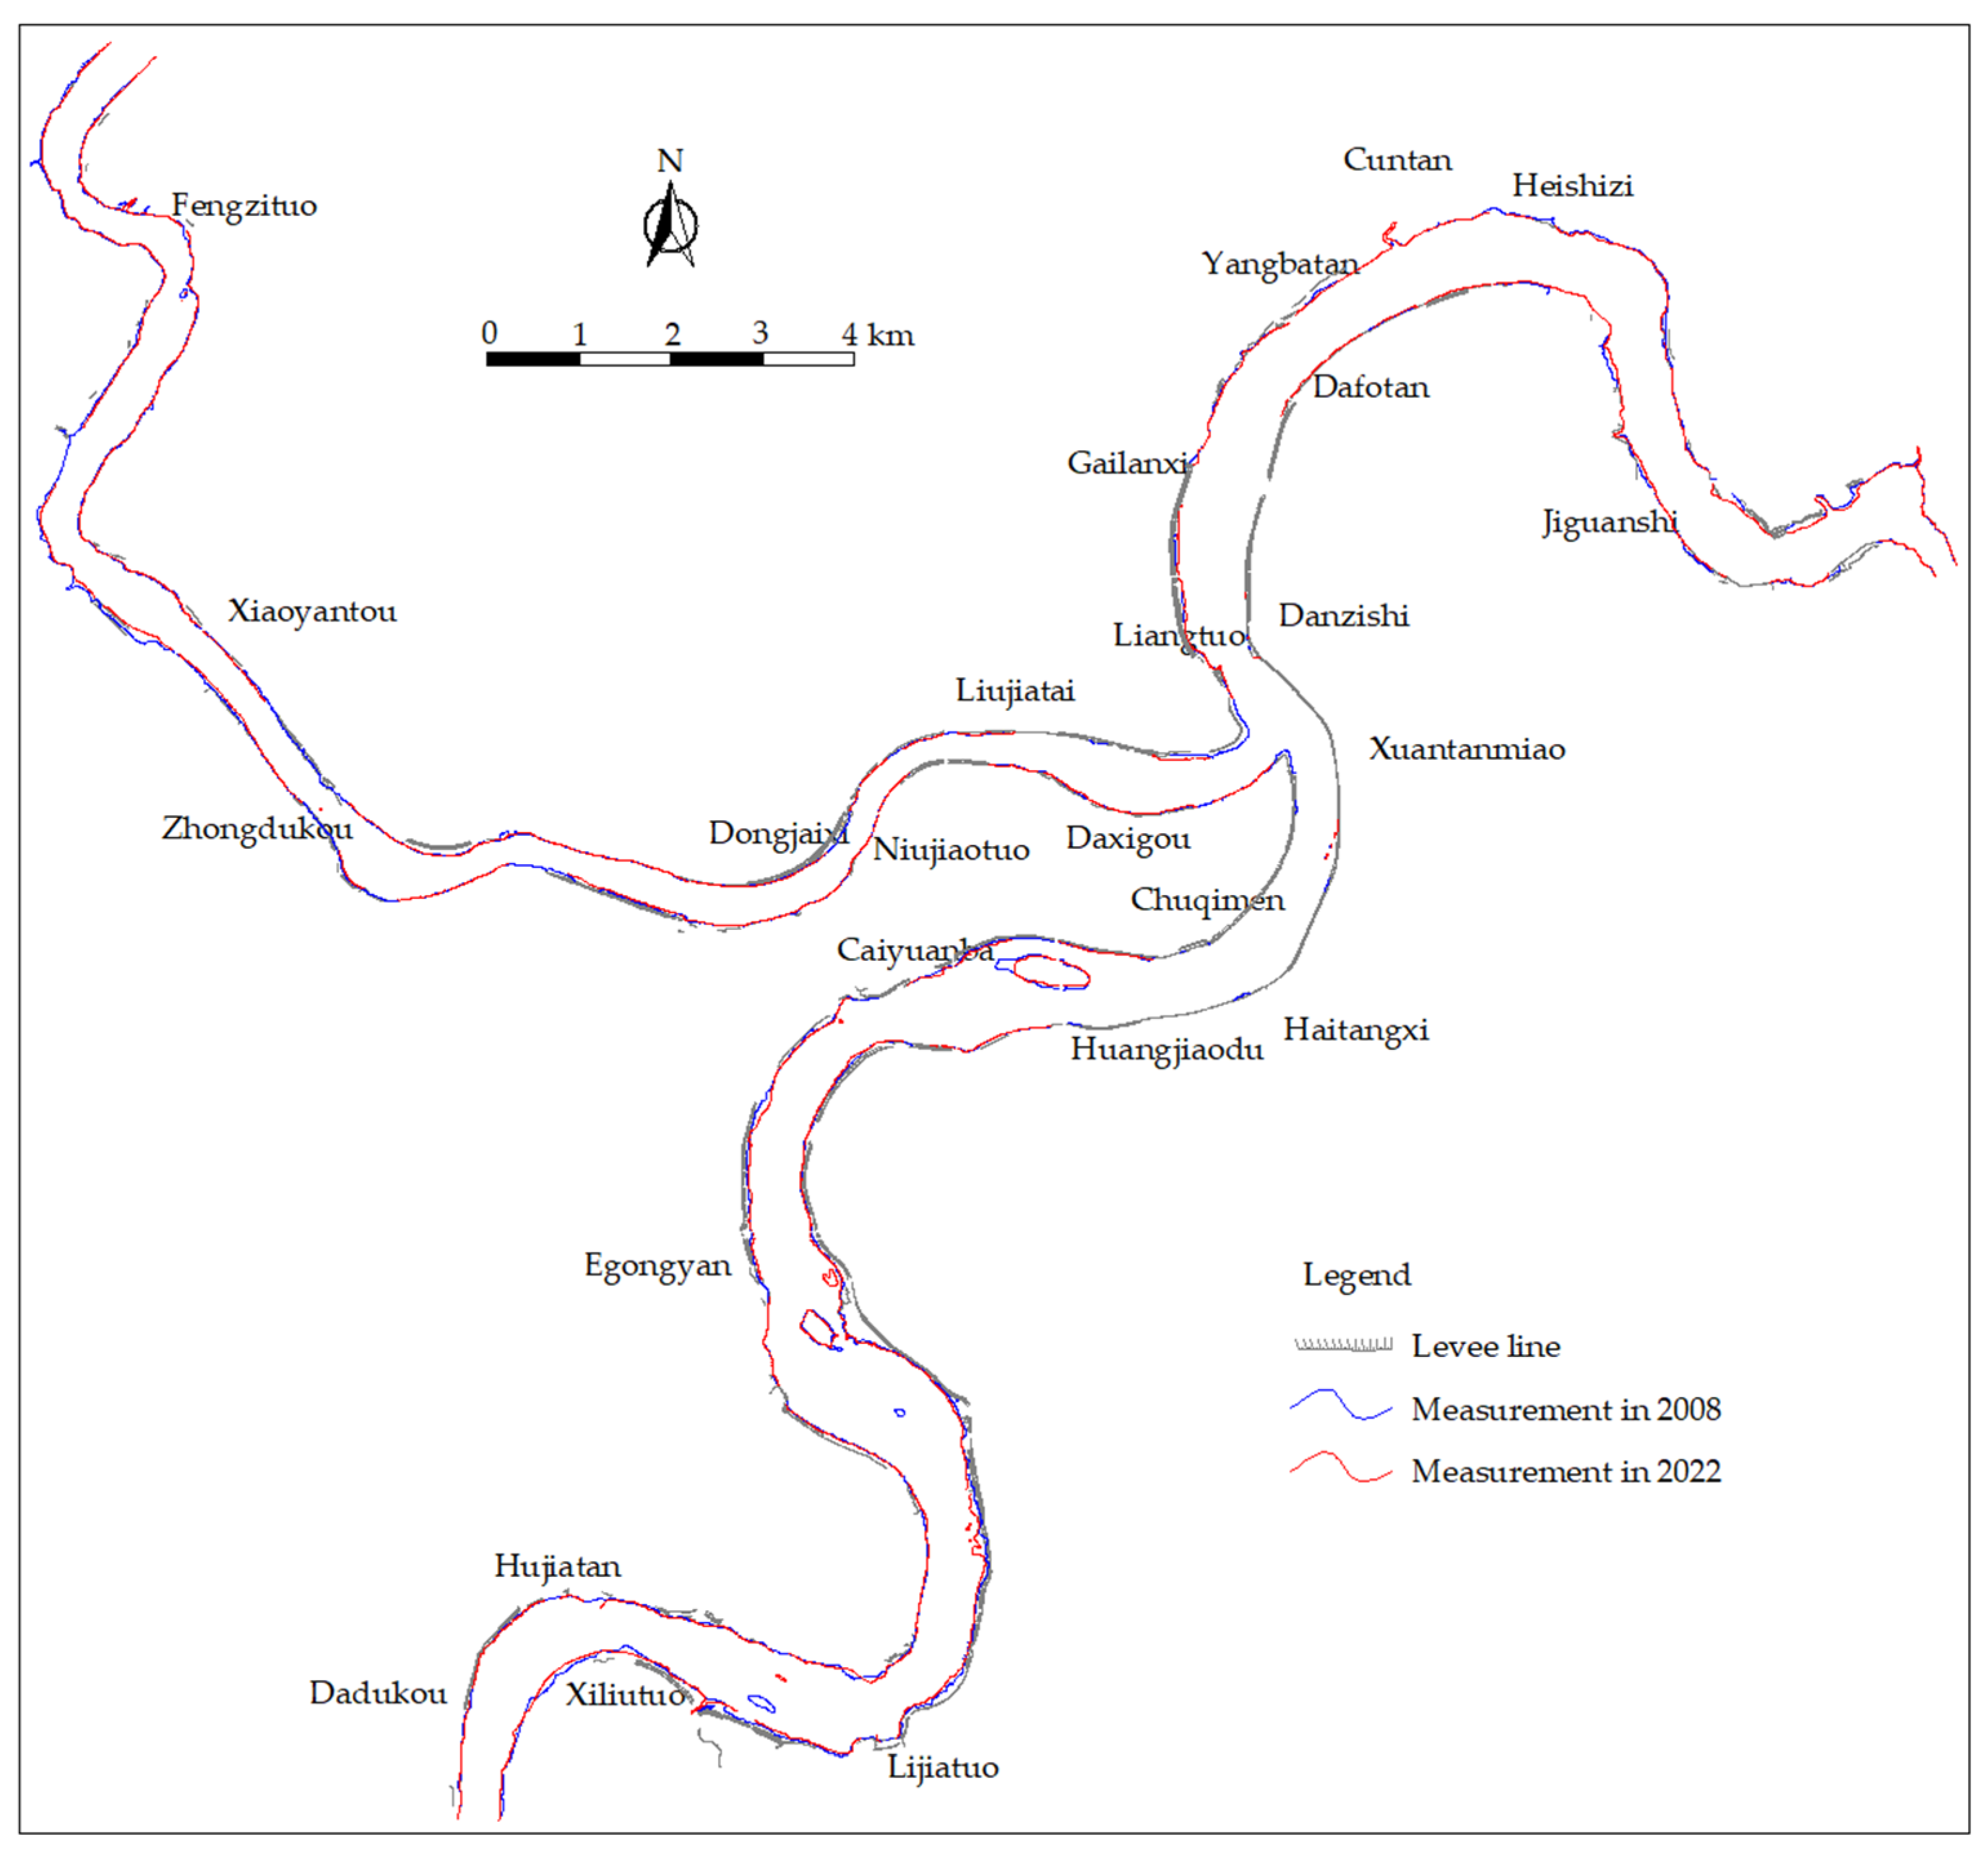
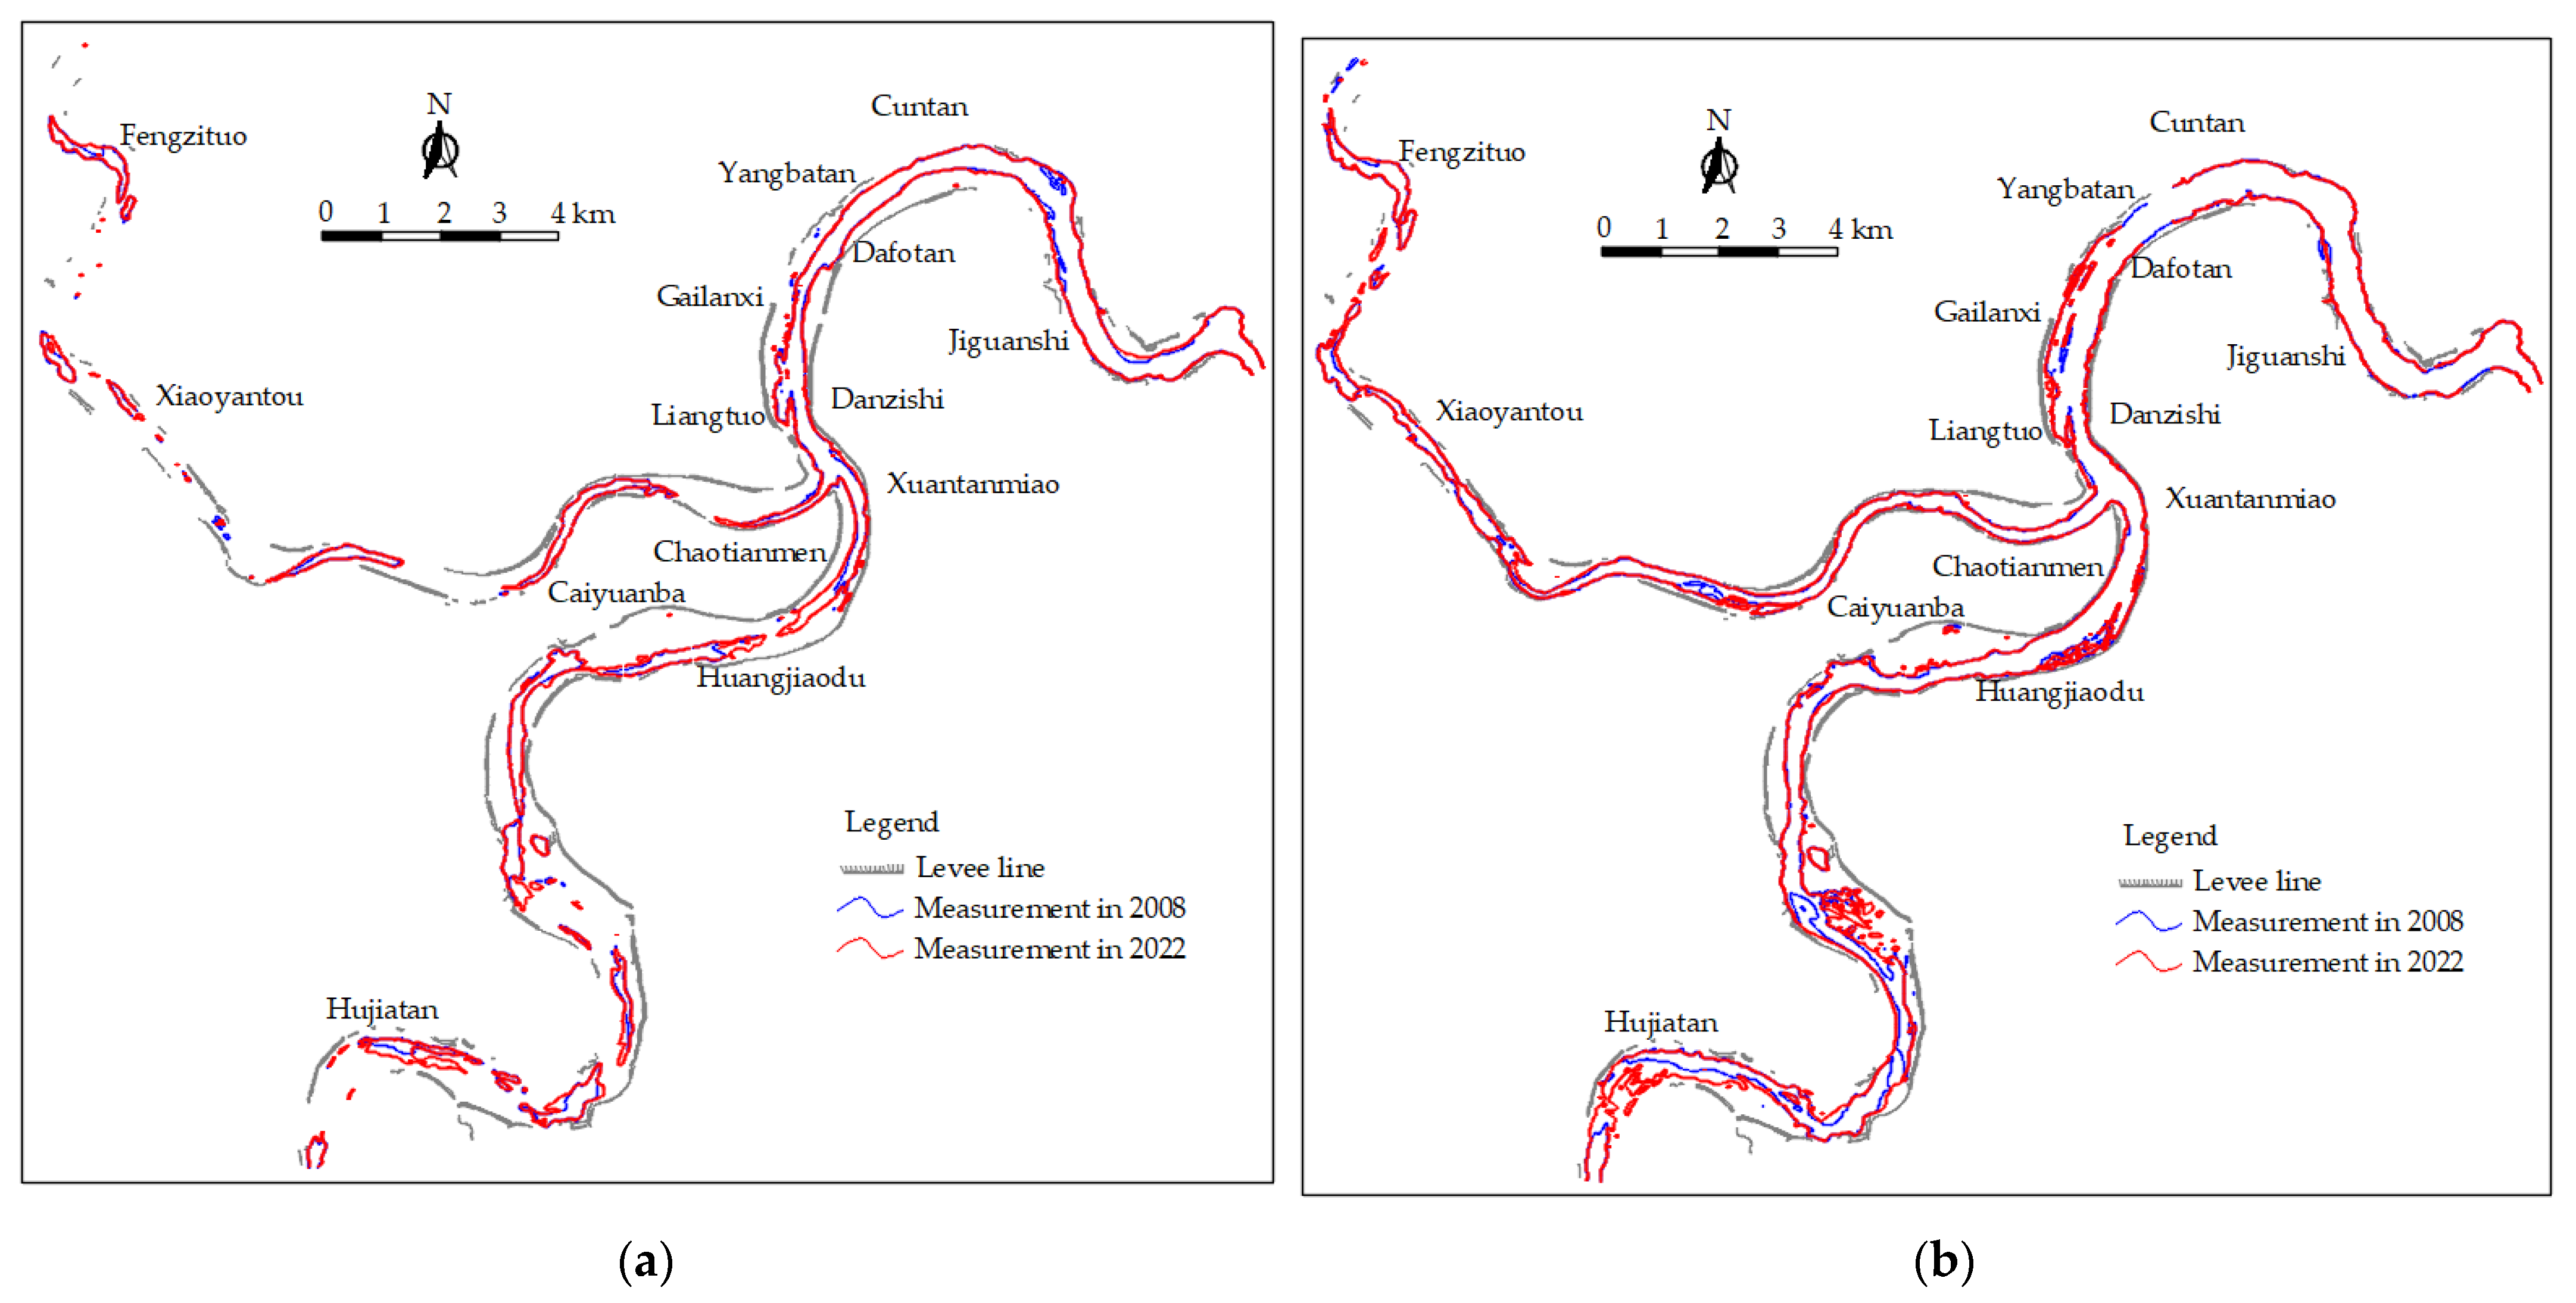
3.2. Plane Changes of Shorelines and Sand Bars

The main urban area of the Chongqing section is a mountainous river with steeply sloped banks on both sides. No significant changes to the E&D of the 170 m shoreline were observed between 2008 and 2022. Although some areas had been adjusted due to urban construction, the plane changes were relatively small, mostly within 30 m, and the shoreline was relatively stable. The plane changes of the shoreline in the main urban area of Chongqing section are depicted in Figure 4.
The 155 m and 160 m contour lines were selected to analyze changes in the sand bars of the main urban area of Chongqing. By analyzing the flat change map of the sand bars (Figure 5), it was found that from 2021 to 2022, the Jinshaqi section underwent marked changes, primarily manifesting as the erosion and retreat of approximately 65 m for the 155 m contour line at the head, and an increase of approximately 50 m in sedimentation at the tail estuary. The overall E&D of the other sand bars was relatively small.
From 2008 to 2022, the left bank near Tangjiatuo, in the section below the confluence of the main streams of the Yangtze and Jialing rivers, shrank toward the riverbank due to construction, with a maximum shrinkage of approximately 110 m. The section downstream from the Muzhuqi side bar on the right bank near Baishatuo was markedly affected by sand mining, and the front of the bar had retreated notably. The maximum retreating amplitude along the front of the bar was approximately 150 m, and the contour line of 155 m at the top of the bend on the opposite bank had disappeared. The Manziqi side bar on the right bank of the Cuntan section was relatively stable, and its shape and position underwent minimal change. The riverbank on both sides of the section between the Dafosi Bridge and the Chaotianmen Bridge had been adjusted, while the right side bar had been slightly eroded. The contour line of 155 m had retreated by approximately 30 m, and the surface of the left side bar had been slightly eroded. The shoreline in front of the bar was relatively stable. Upstream of the Chaotianmen Bridge, the side bar on the opposite bank of Danzishi was washed away, and the contour line of 155 m had retreated by approximately 150 m. The right bank at the confluence section had been eroded with a maximum retreating amplitude of approximately 70 m for the 155 m contour line.
Above the confluence, the side bar on the left bank of the Zhuerqi section was markedly affected by sand mining, with a retreat of approximately 100 m for the 155 m contour line. There was slight erosion in the middle of Shahuba with a partial retreat of approximately 150 m. The middle section of Xiejiaqi on the right bank, upstream of the Caiyuanba Bridge, had been slightly eroded, retreating by approximately 75 m. The E&D of Huangjiaqi on the left bank was relatively small, and the morphology remained mostly unchanged. Due to factors such as sand mining and construction, the total sand bar area in the Jiulongpo reach was reduced. The surface elevation of the Sanjiaoqi sand bar on the left bank was completely reduced to below 160 m, The elevation of the Jiuduizi sand bar on the right bank underwent similar reductions, as the 160 m contour line at the head had shrunk and retreated by approximately 130 m. The degree of sand mining in the upstream Hujiatan section was relatively high—while the original elevation of the river bottom was mostly above 160 m, the range below 160 m had markedly expanded by the end of 2022.
Figure 4. Changes in the shoreline (170 m contour line) of the main urban area of the Chongqing river section.
Water 15 04011 g004
The middle region of the Jinshaqi side bar on the left bank of the mouth of the Jialing River section had eroded, and the 155 m contour line had increased up to 330 m toward the upstream area. The tail had filled with silt, as had the 155 m contour line approximately 60 m toward the river center. The head of the convex bank of the Tuwan section downstream of the Shimen Bridge had retreated by approximately 80 m due to the dredging of the waterway, resulting in sediment accumulating at the top of the bend. The 160 m contour line on the right bank had accumulated silt by approximately 30 m toward the river center, while the shape of the other banks remained relatively stable without notable changes.
Figure 5. Evolution of the sand bar in the main urban area of Chongqing river section: (a) the 155 m contour line; (b) the 160 m contour line.
Water 15 04011 g005

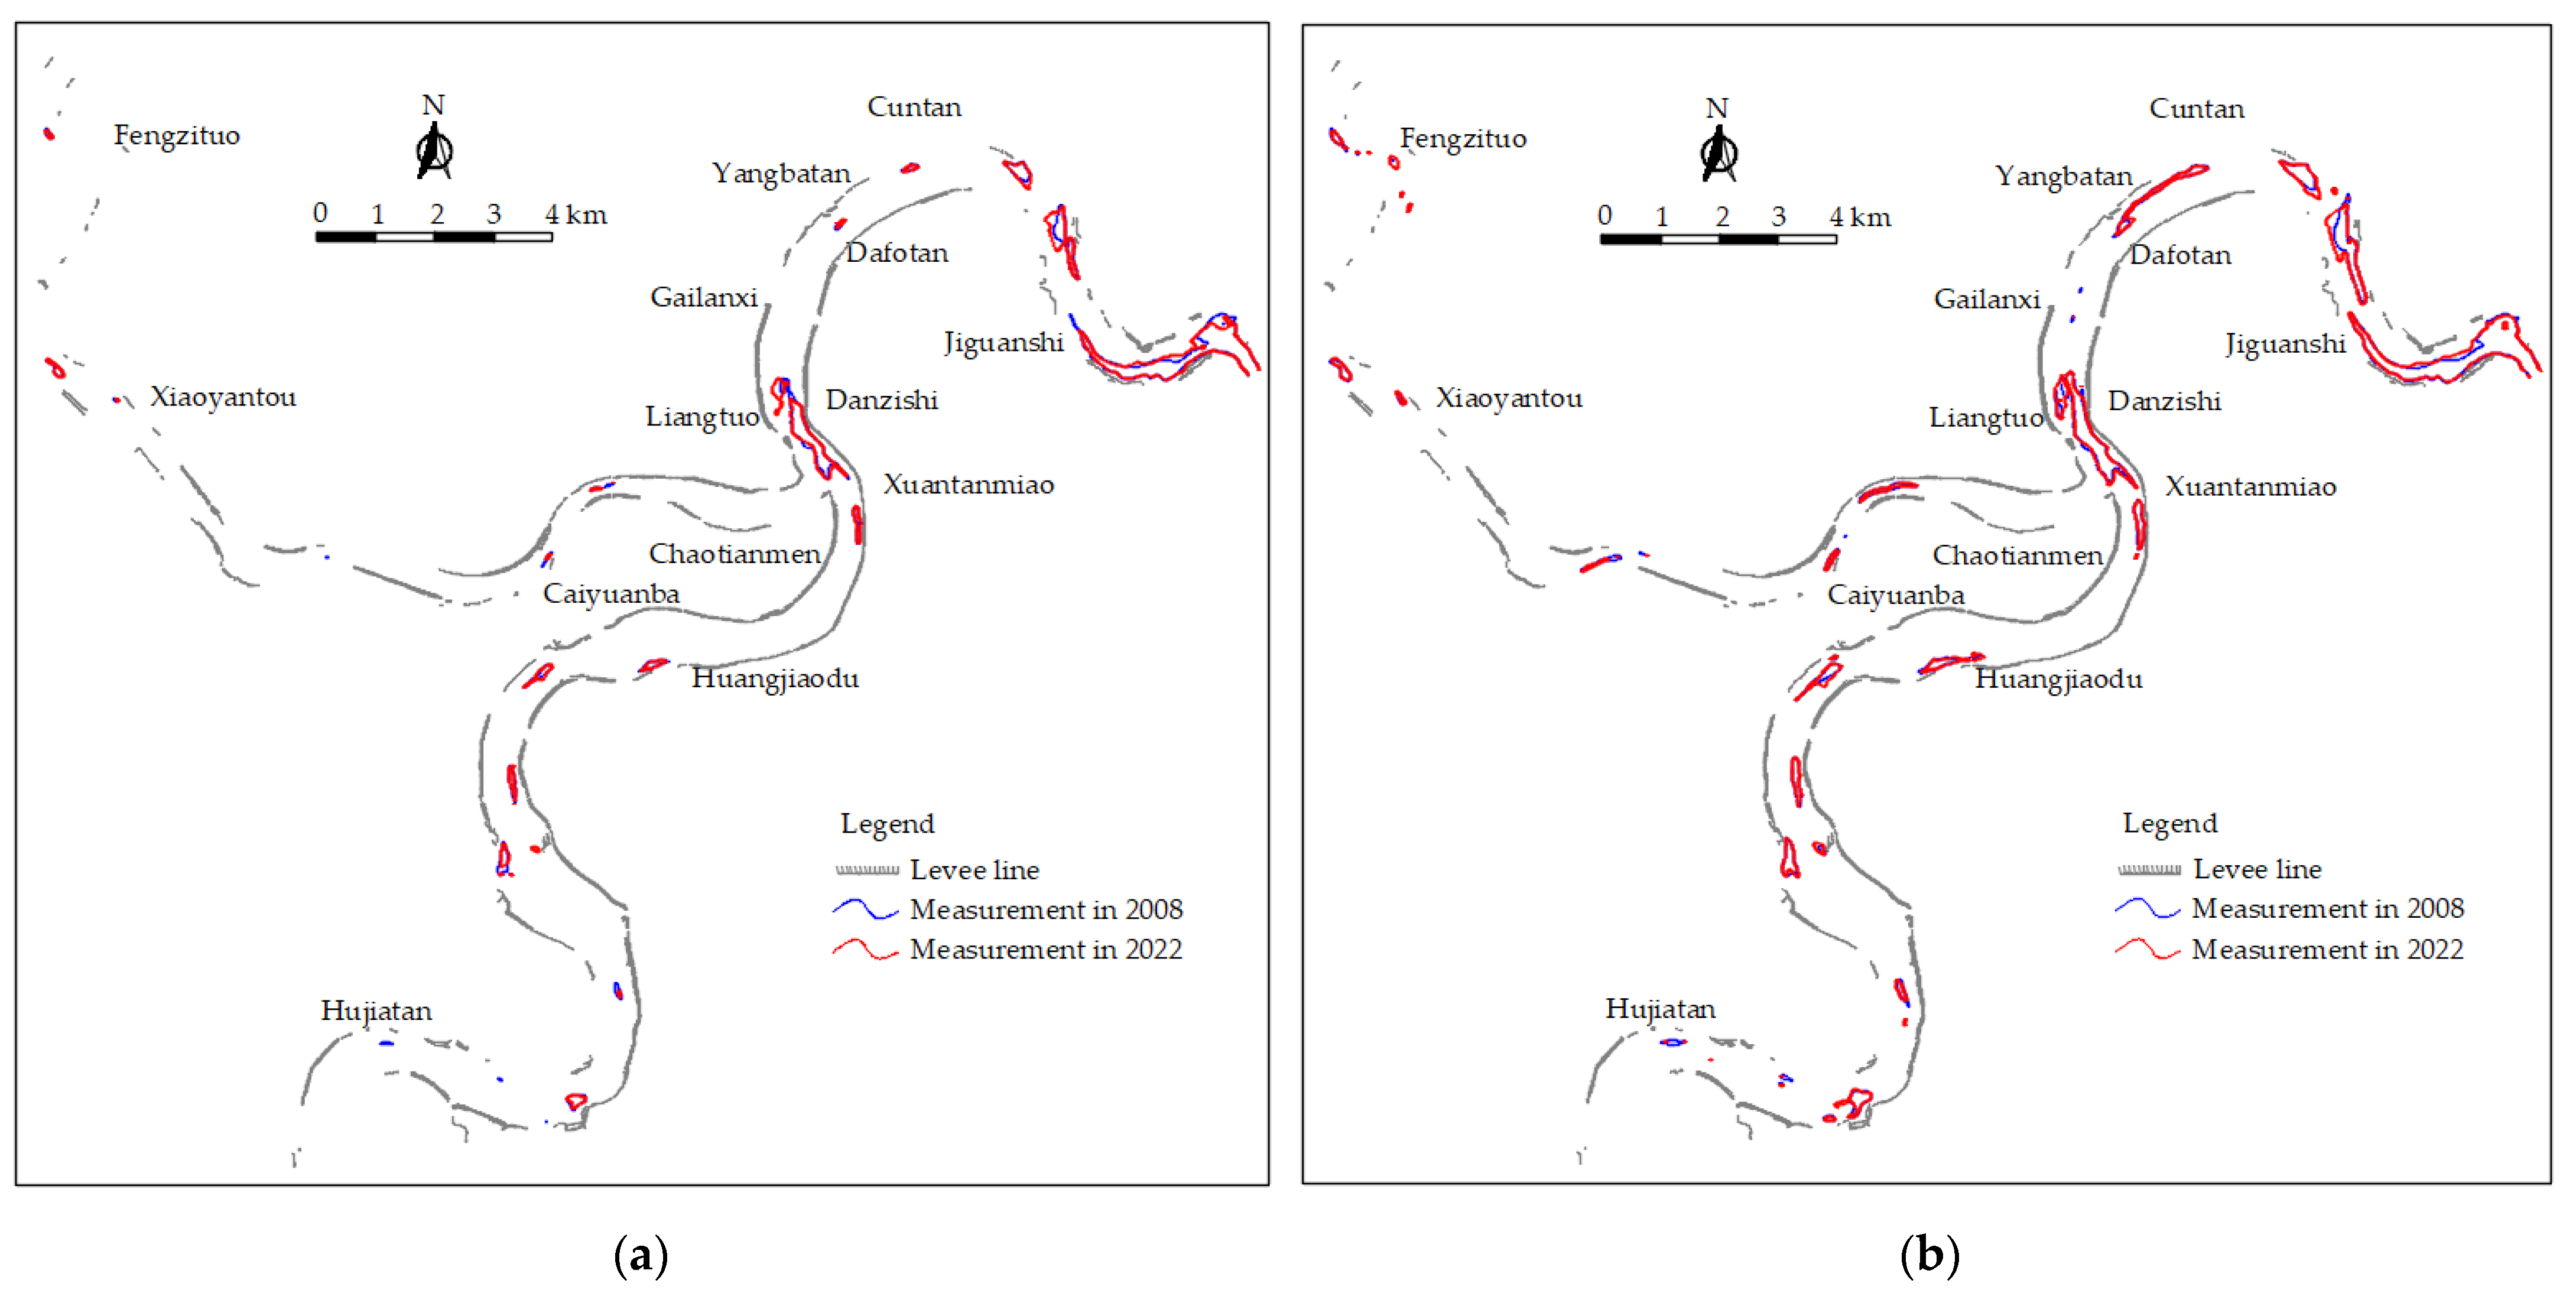
3.3. Plane Change of Pools

The 140 m and 145 m contour lines were selected to analyze pool changes in the main urban area of the Chongqing section, as depicted in Figure 6. From 2021 to 2022, the overall changes to each pool were relatively small and remained relatively stable.
From 2008 to 2022, deep pools developed in the sections below the confluence, including at the outlet section of Tongluoxia, the opposite bank of Baishatuo, the left side of the Cuntan section, and the Danzishi section. The pools at the exit section developed toward the left bank, with a maximum extension of approximately 180 m for the 140 m contour line and a head drop of approximately 330 m. The Baishatuo section expanded in a transverse direction by approximately 240 m at the head of the deep pool, and by nearly 180 m downstream at the tail of the upper deep pool. The head of the Cuntan deep pool was slightly silted, having retreated by approximately 120 m. The tail of the Danzishi deep pool had been silted to the left and washed to the right, and the left side of the head had been washed, expanding approximately 90 m to the left. Many of these effects were due to sand mining.
Deep pools developed above the confluence on the right side of Xuantanmiao; the opposite bank of Shanhuba, Xiejiaqi, and Huangjiaqi; and the Longfengsi and Jiulongpo areas. The head of the deep pool on the opposite bank of Shanhuba had been slightly silted and had retreated by approximately 40 m, while the head of the deep pool on the opposite bank of Xiejiaqi had been silted and had retreated by approximately 150 m. The length of the deep pool at the 140 m contour line had been shortened from 300 m to 80 m in the upstream area of Jiulongpo, while the other deep pools experienced little change in E&D, with minimal changes to their position and morphology.
The Jialing River section had developed deep troughs on the left side of Zengjiayan, the right side of the upstream area of Niujiaotou, the right side of Zhongshutuo, the right side of Ciqikou, and the right side of Dazhulin. Among them, the sedimentation in the deep trough of Zhongshutuo was more pronounced, with an elevation of approximately 200 m at the end of the deep groove. The width of the tail of the deep groove was reduced from 70 m to approximately 25 m, while the changes in the deep grooves of other sections were relatively small, their positions and morphologies remaining nearly unchanged.
Figure 6. Evolution of the pools in the main urban area of the Chongqing river section: (a) the 140 m contour line; (b) the 145 m contour line.
Water 15 04011 g006

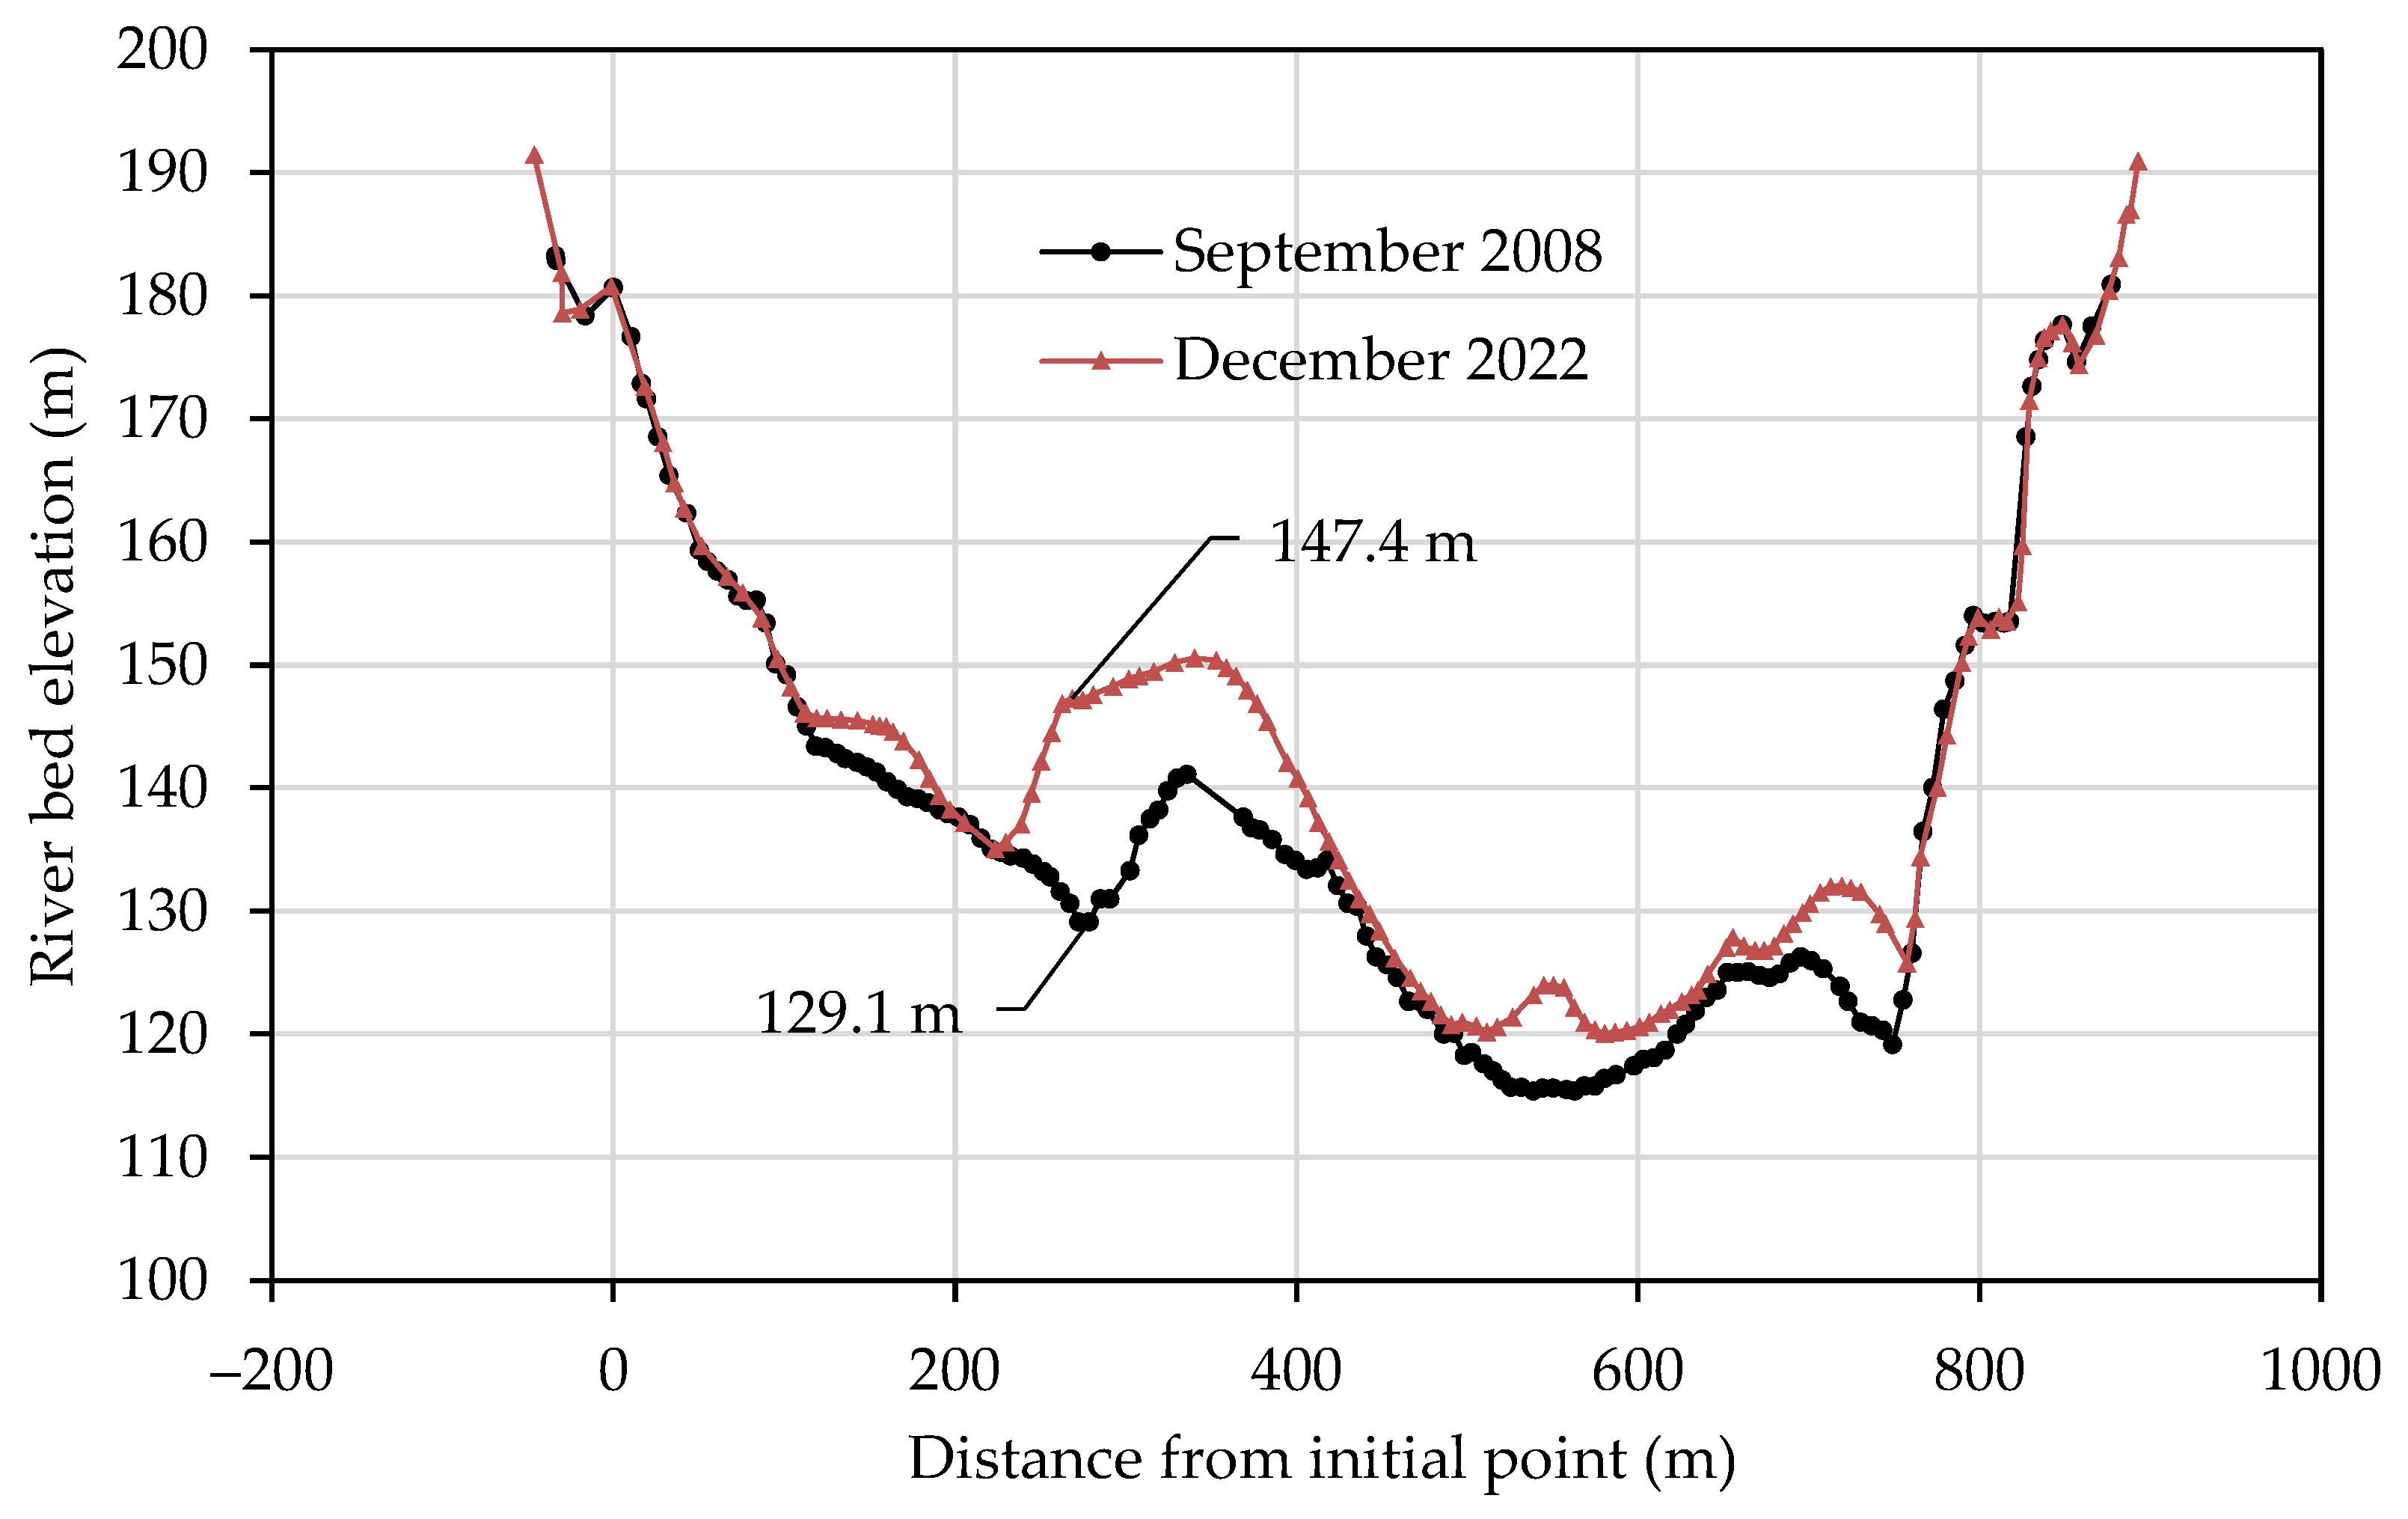
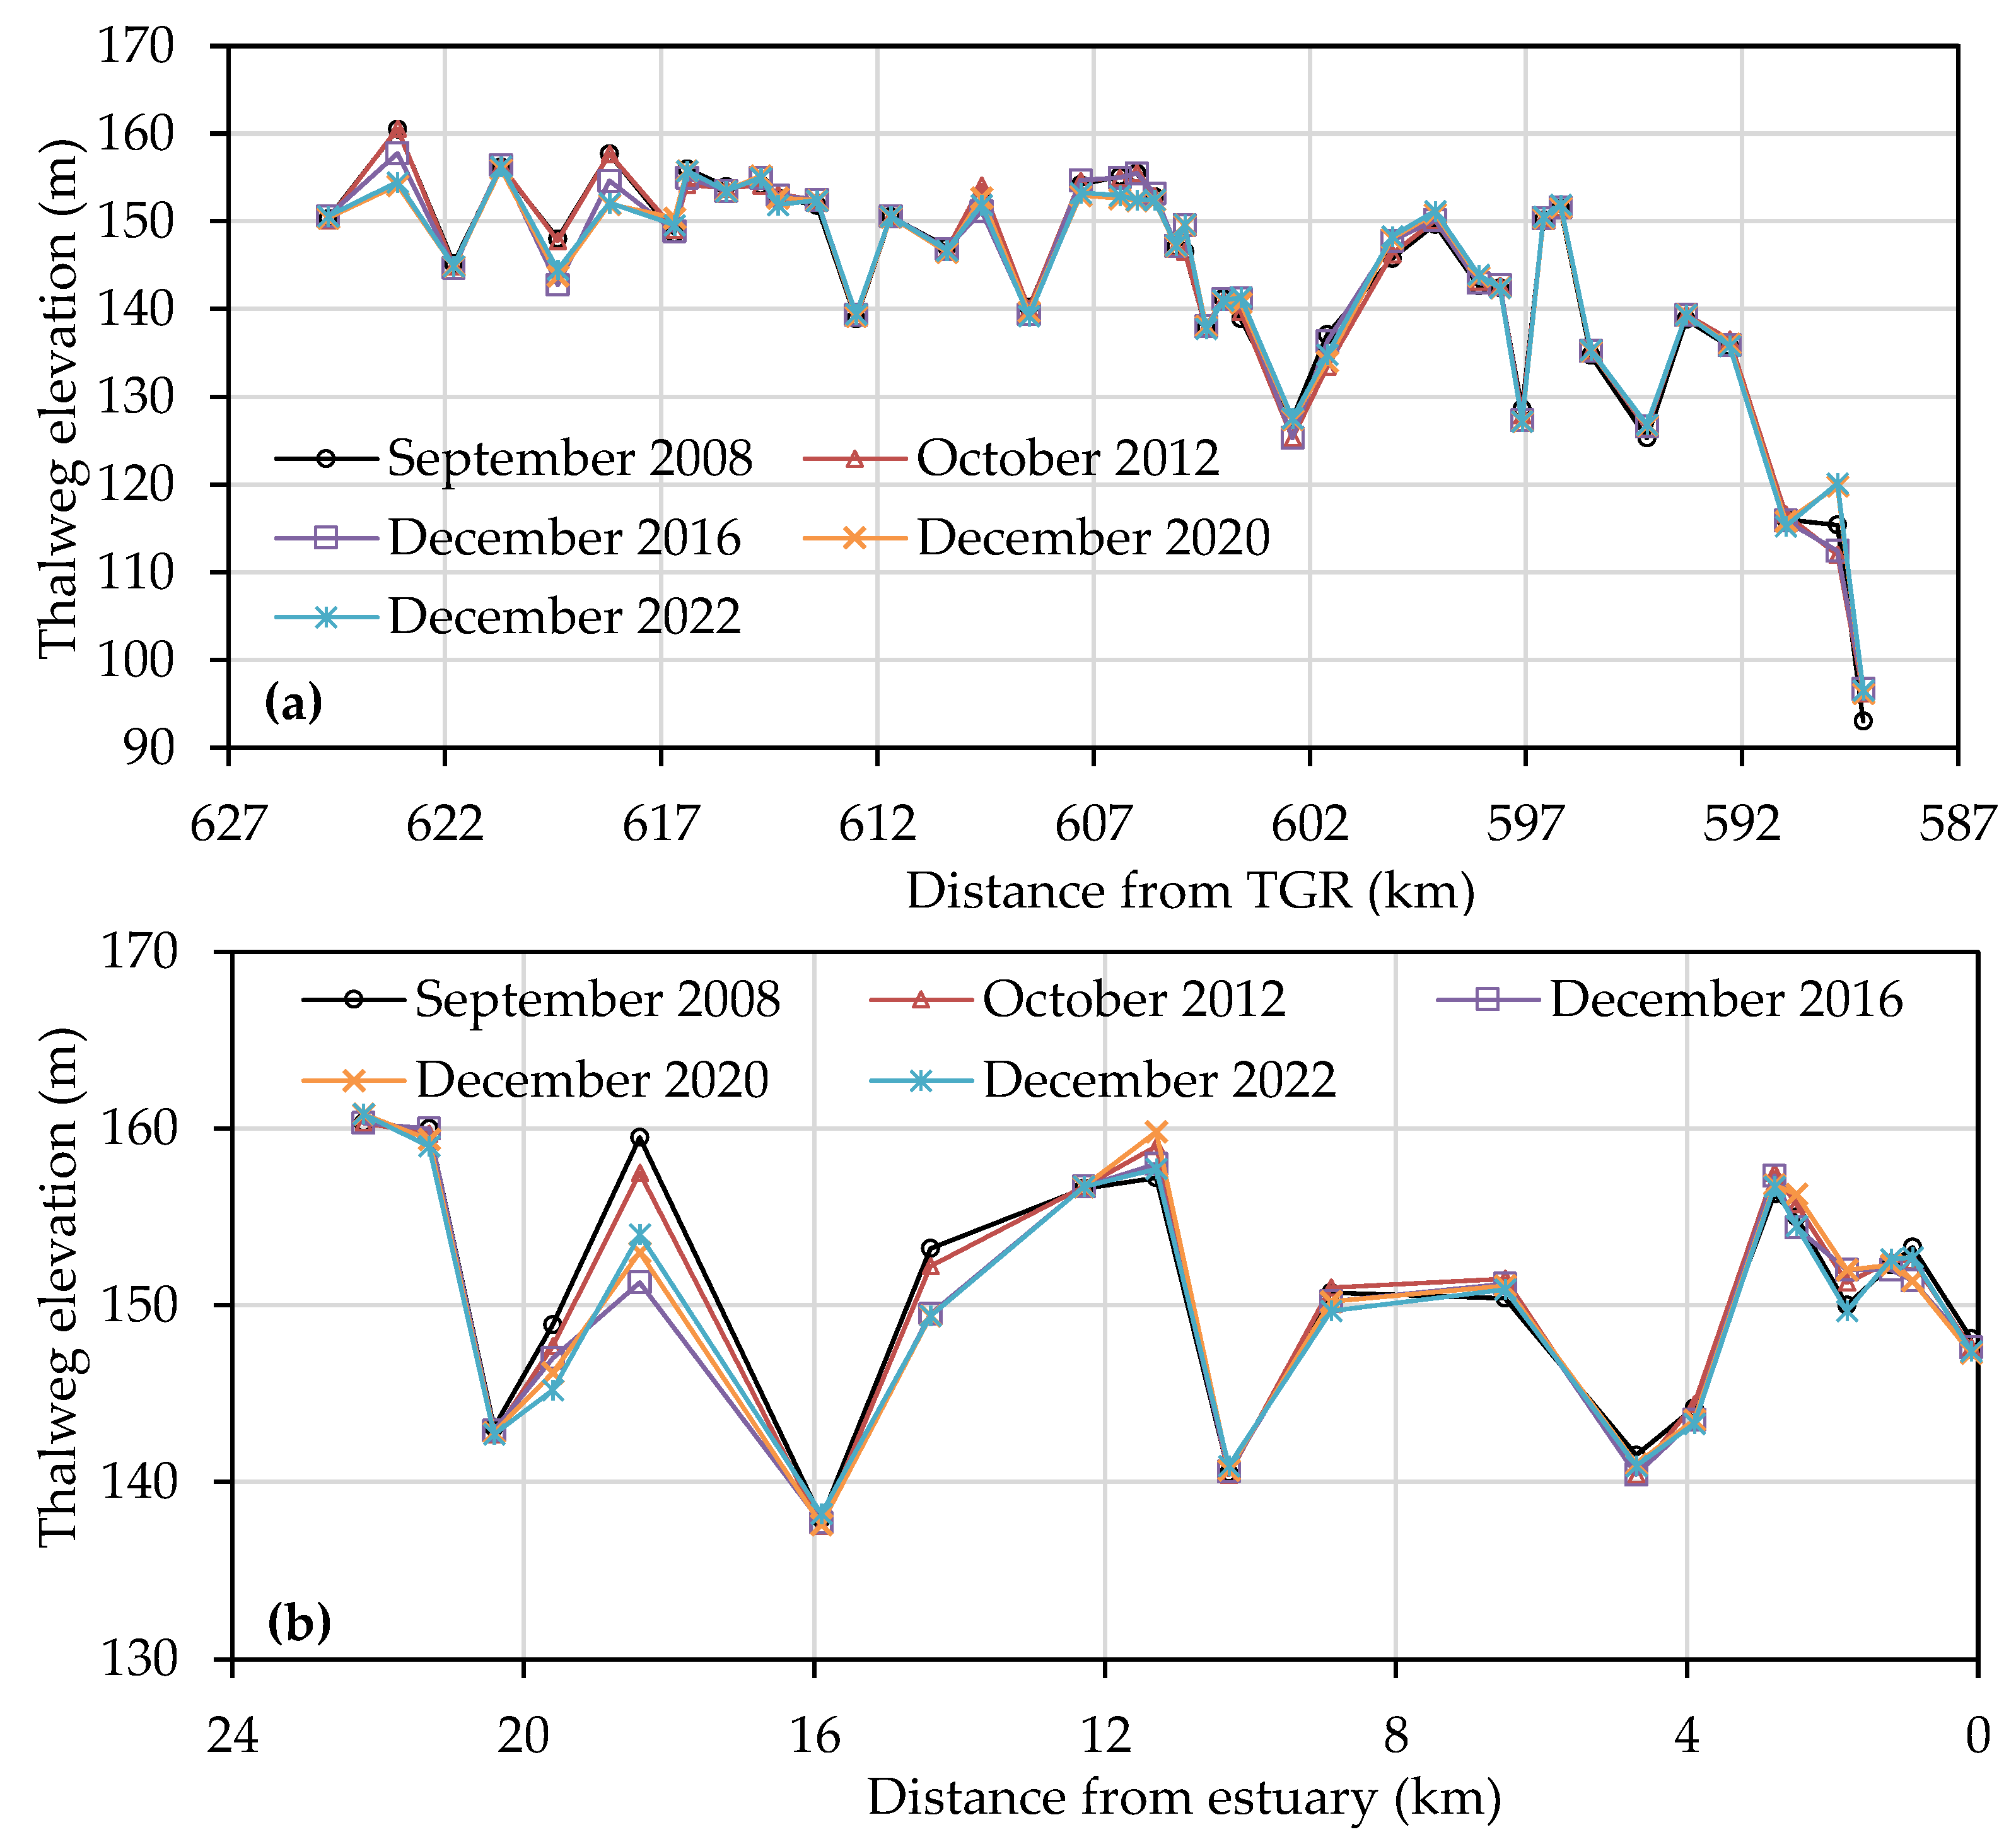
3.4. Changes in the Thalweg

The interannual changes in the longitudinal profile of the thalweg in the main urban area of Chongqing are represented in Figure 7. After the normal impoundment of the TGR in 2008, there was evidence of E&D occurring in the river section, but the overall changes were relatively small, generally within 1 m, except in areas where sand mining and waterway dredging occurred. There are two probable reasons for this: Firstly, most of the deep thalweg in the main urban area of Chongqing is composed of pebbles, which move slowly and exhibit low-intensity sediment transport, resulting in minimal changes to E&D. Secondly, following normal impoundment, this section has generally experienced moderate water and low sand input conditions. Even in 2020, under relatively large water and sand input conditions, deposition and uplift only occurred in local river sections, resulting in no marked impact on the overall characteristics of the thalweg in this river section.

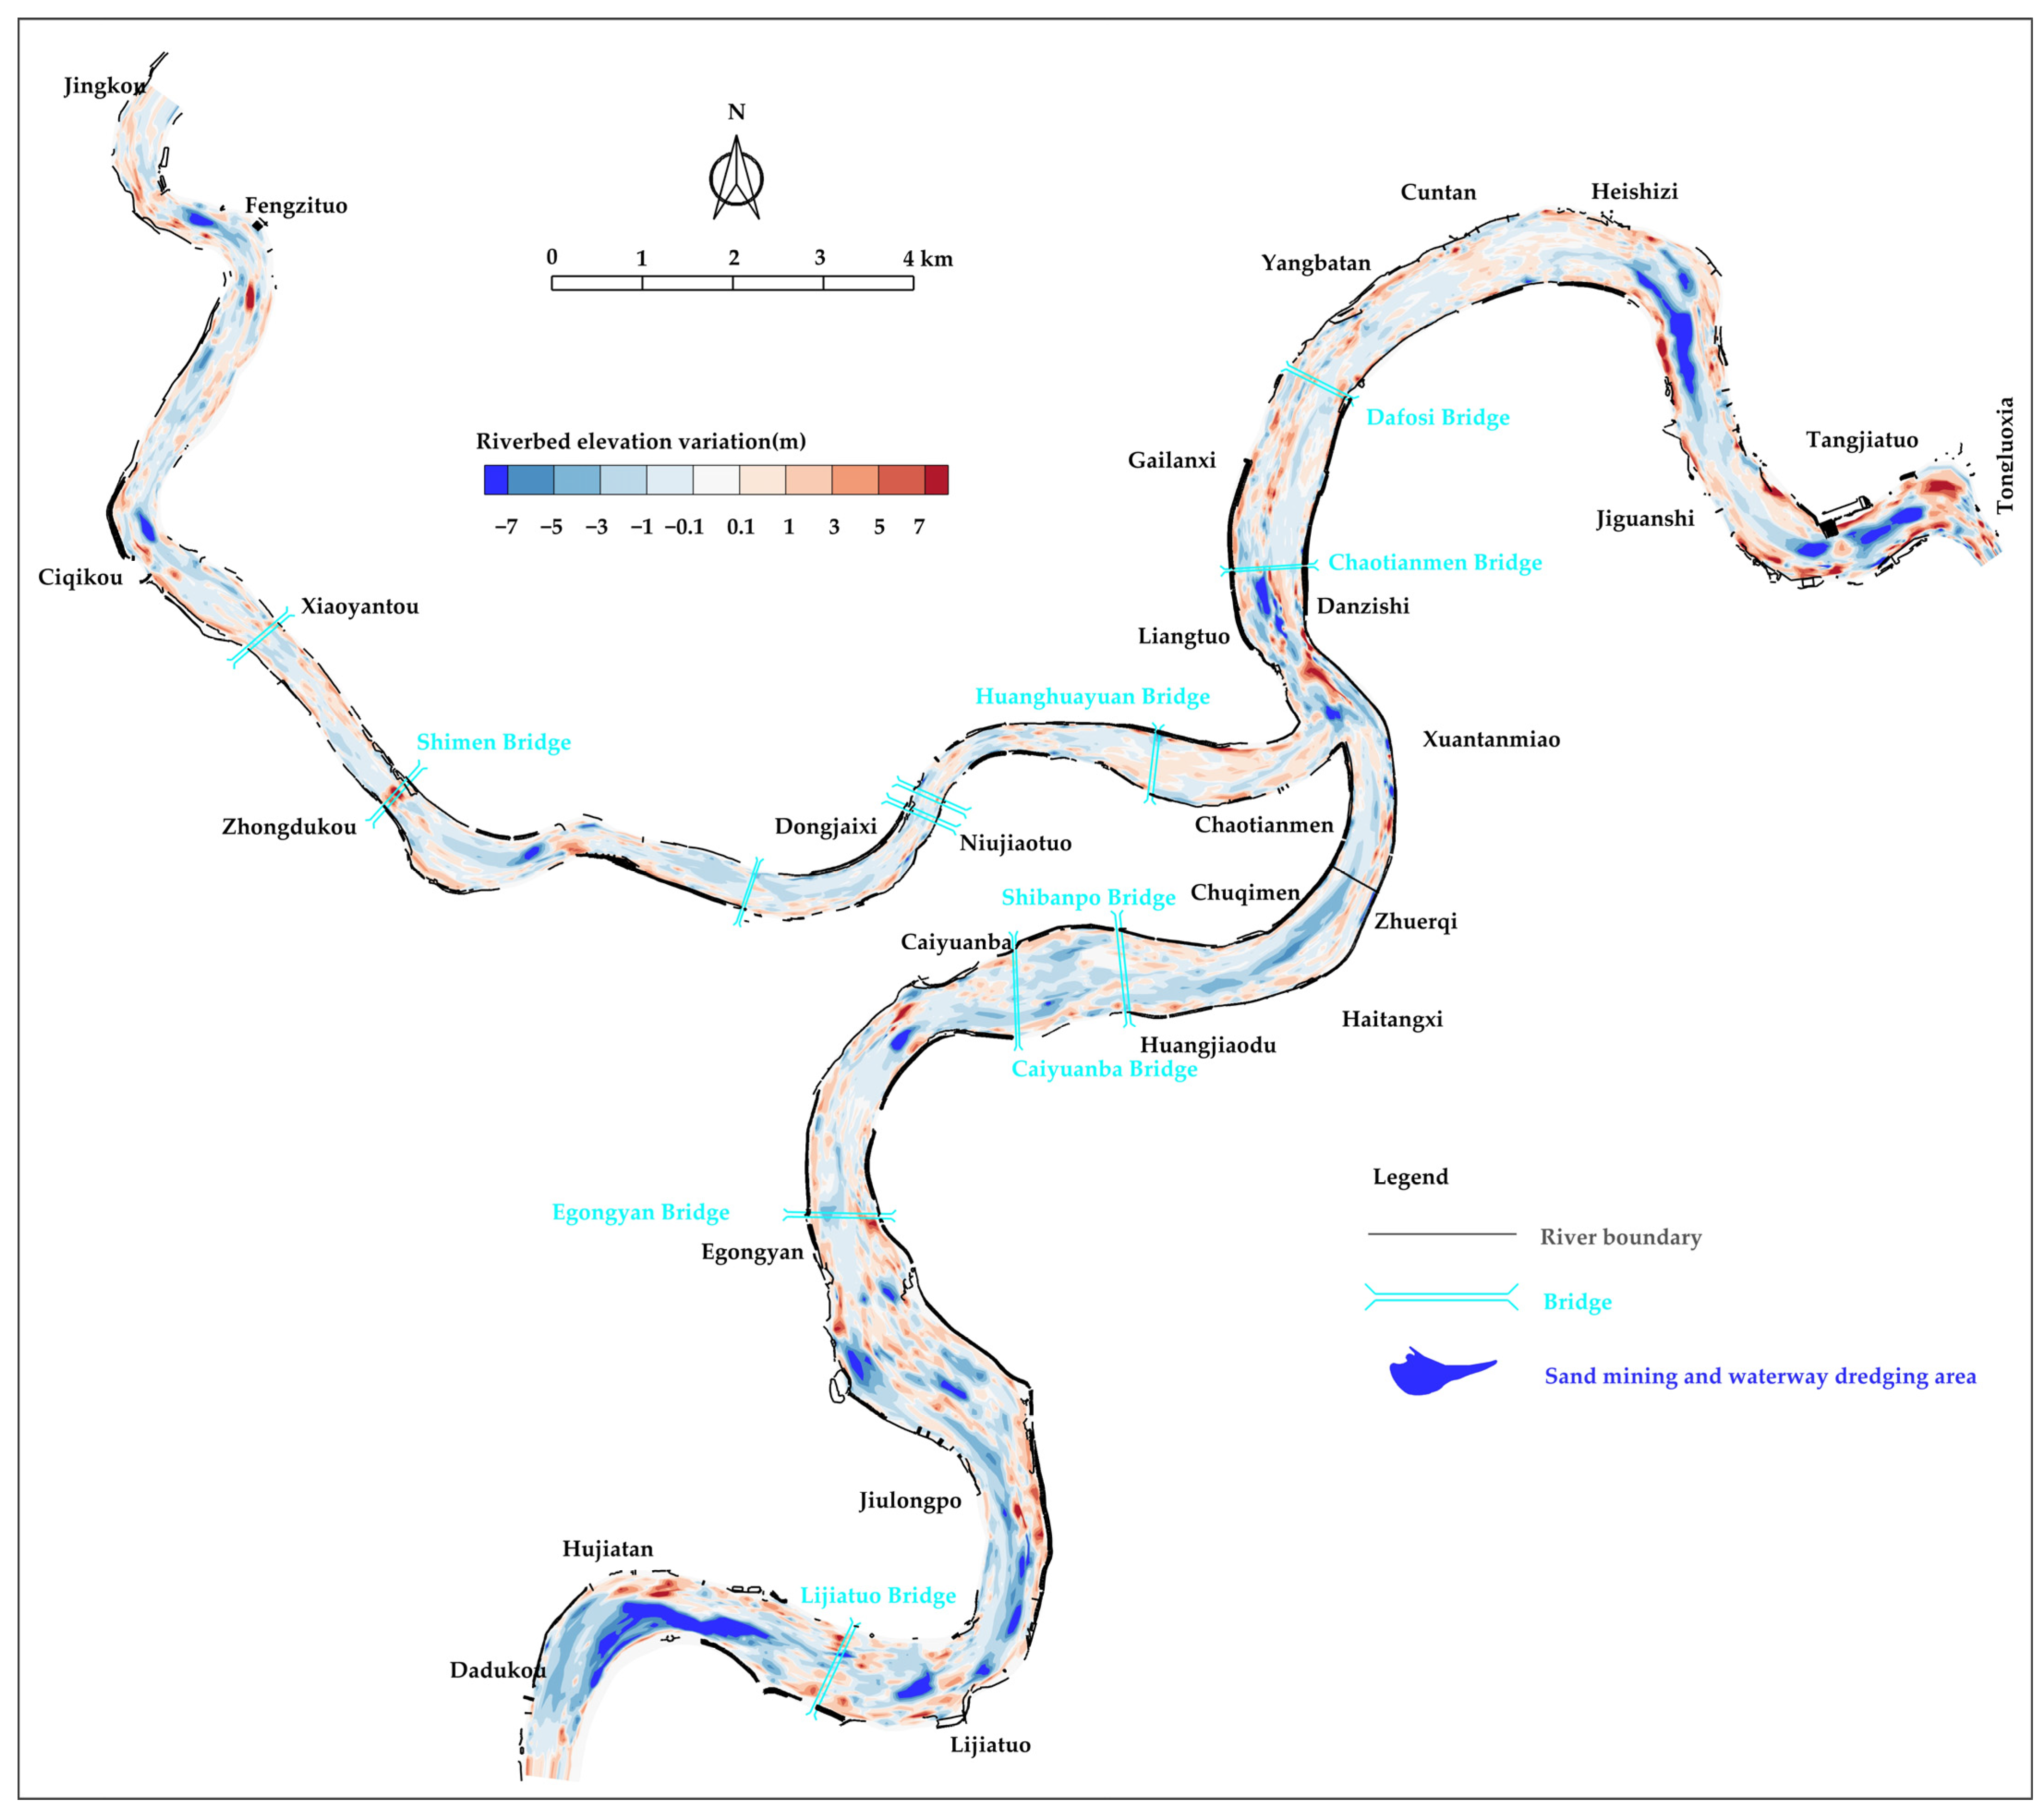
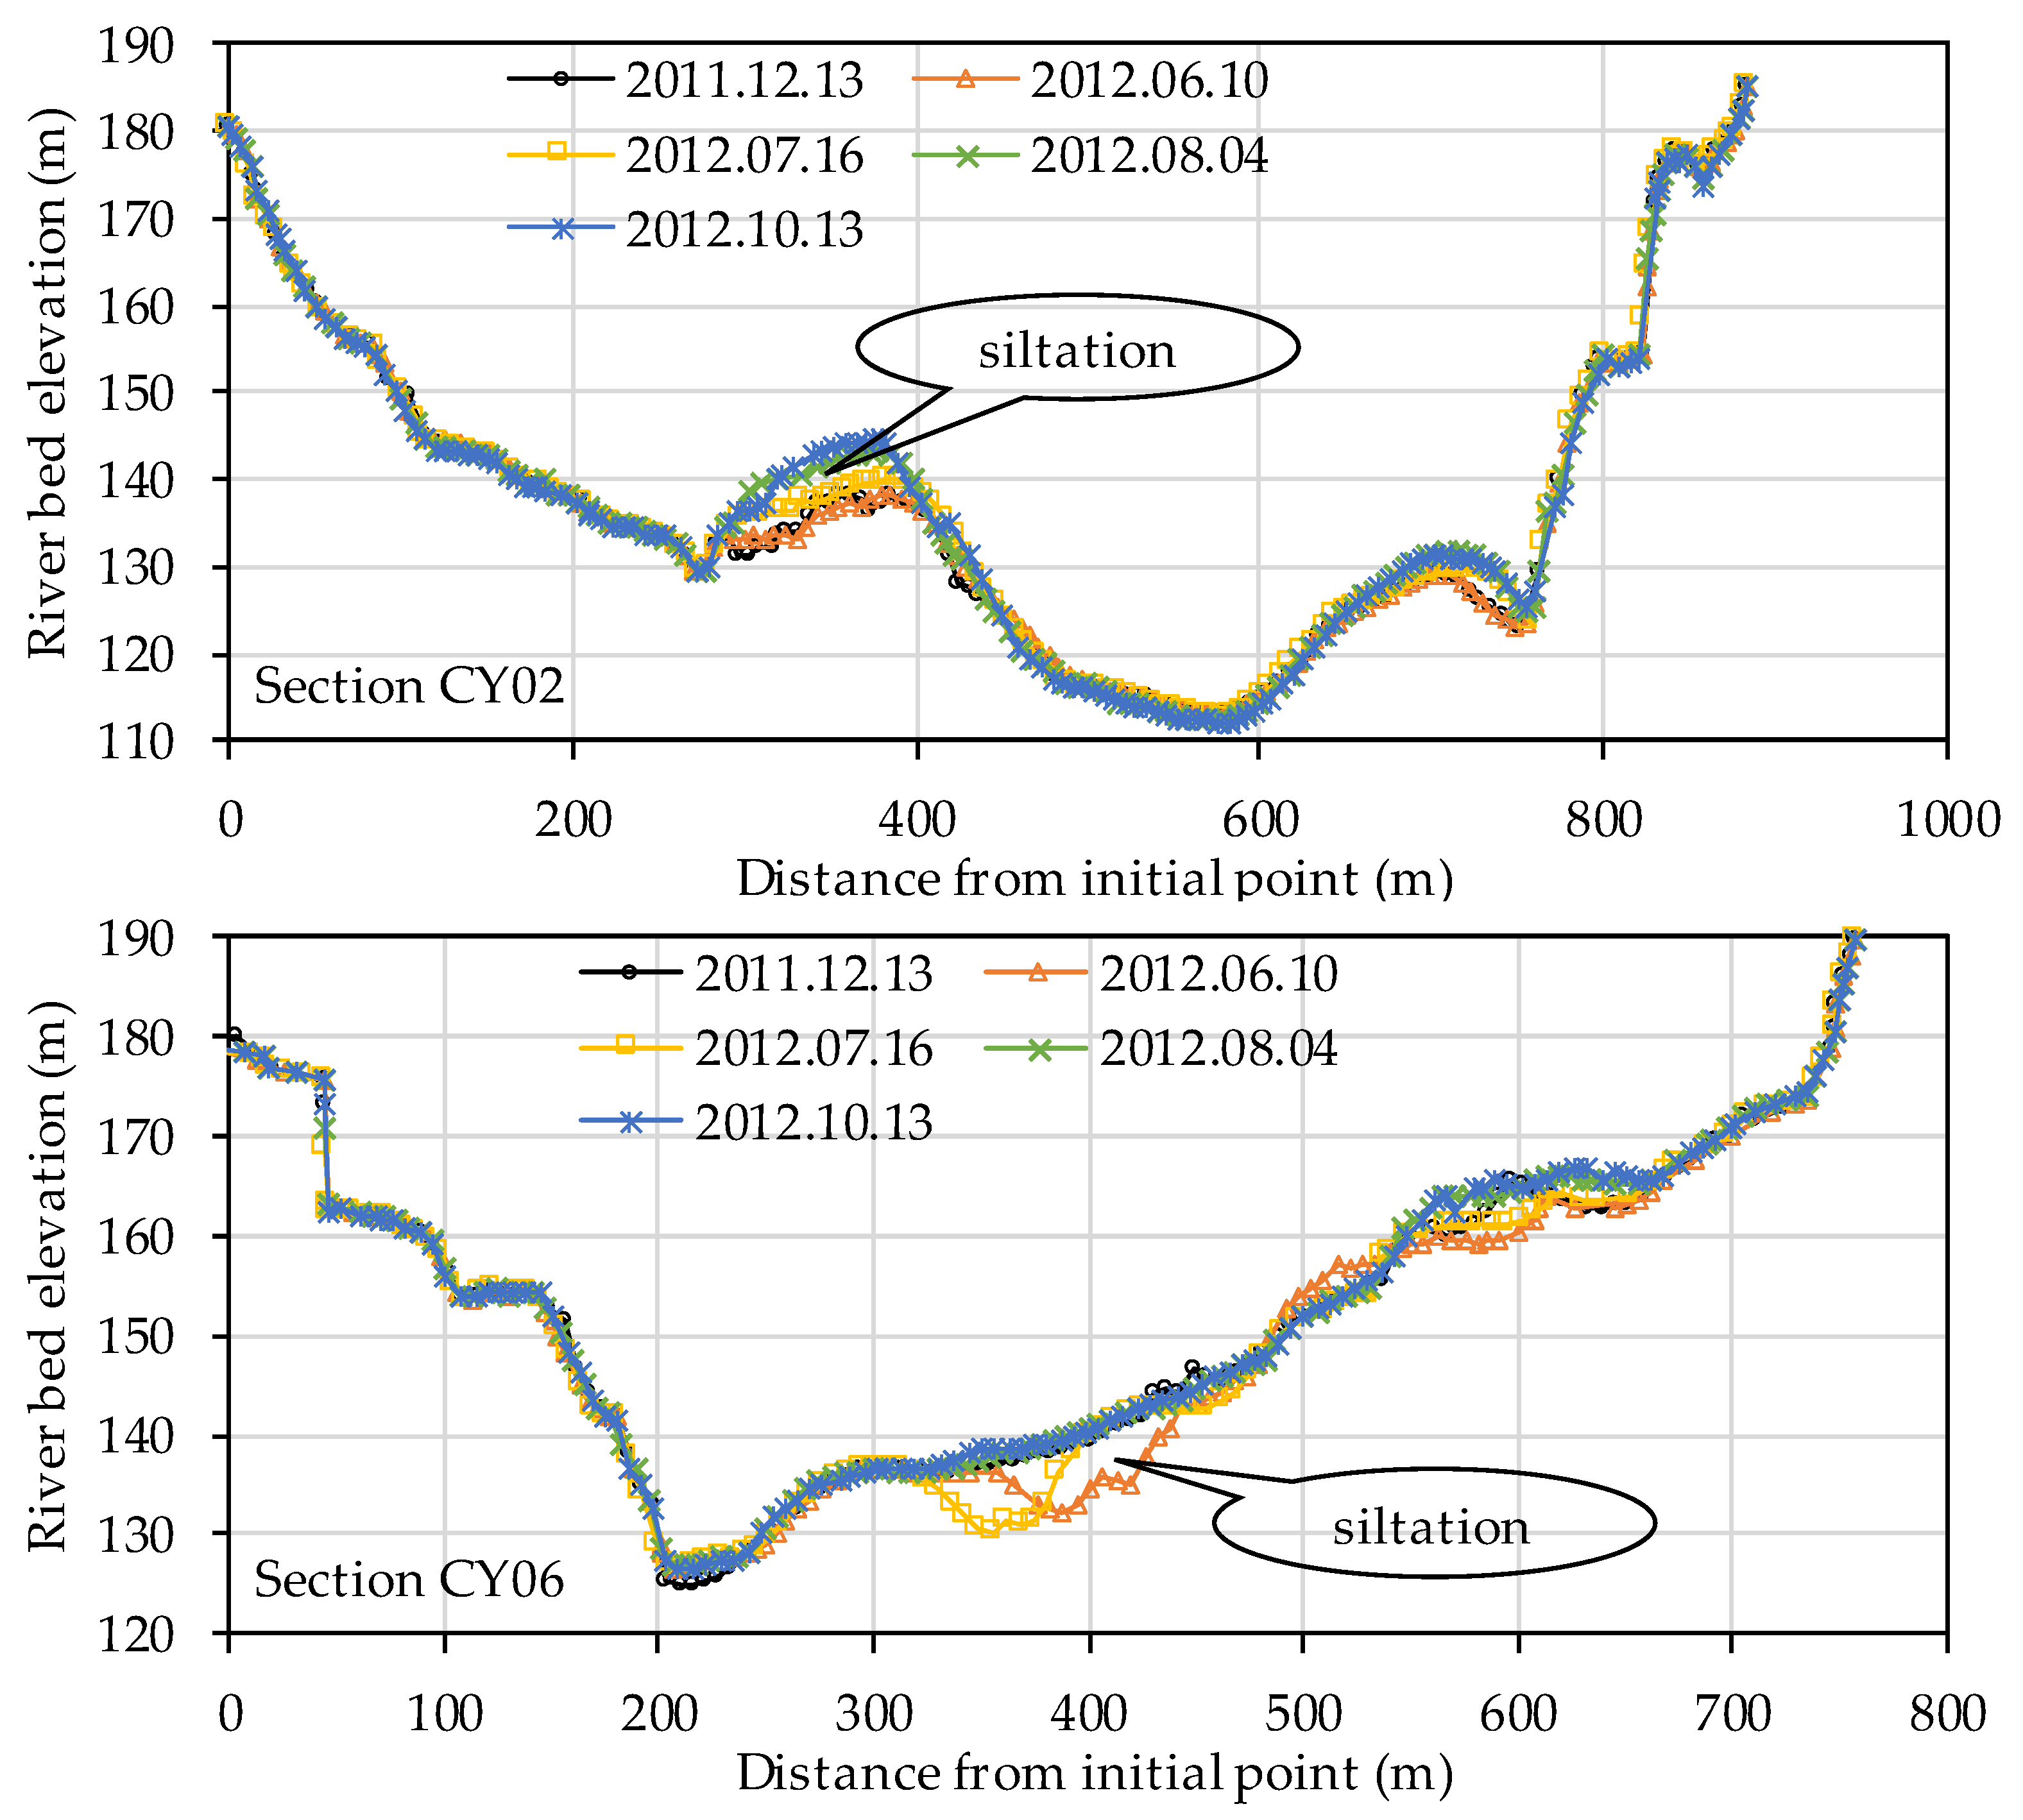
3.5. Siltation Distribution

Figure 8 illustrates the distribution of E&D in the main urban area of Chongqing following the normal storage of the TGR below normal water storage levels from July 2008 to December 2022. Both erosion and sedimentation are distributed in the study area. Erosion is primarily distributed in the main stream of the Yangtze River upstream of Chaotianmen and the Jialing River reach upstream of Huanghuayuan Bridge, with an amplitude ranging from 1 m to 3 m. Other areas are mainly characterized by sedimentation, with an amplitude generally within 2 m. In some areas, such as near Tangjiatuo, the amplitude of sedimentation reached greater than 5 m.
Notably, the terrain of some areas exhibits considerable downward cutting, generally exceeding 10 m, occasionally exceeding 20 m. These more extreme terrain changes are due to recent human activities, such as sand mining and waterway dredging.
Figure 8. Distribution of riverbed elevation changes in the study area from July 2008 to December 2020.
Water 15 04011 g008

4. Discussion

Since the normal impoundment of the TGR, the main urban area of the Chongqing river section has accumulated scouring of 20.672 million m3 due to a variety of factors, including water and sediment inputs, reservoir operational procedures, and river sand mining. This includes depositions of 2.895 million m3 on sand bars and scouring of 23.567 million m3 in the main channel. Overall, between 2008 and 2022, the positions of sand bars and deep pools remained nearly unchanged, with only minor changes in the thalweg of the river. The areas within some river sections that experienced marked changes to E&D were mostly affected by urban construction, waterway dredging, and sand mining. Natural contributions to E&D were relatively small, and the river regime remained fairly stable. We identified three factors, which are discussed below, that have been primarily responsible for the current patterns of evolution in this region.

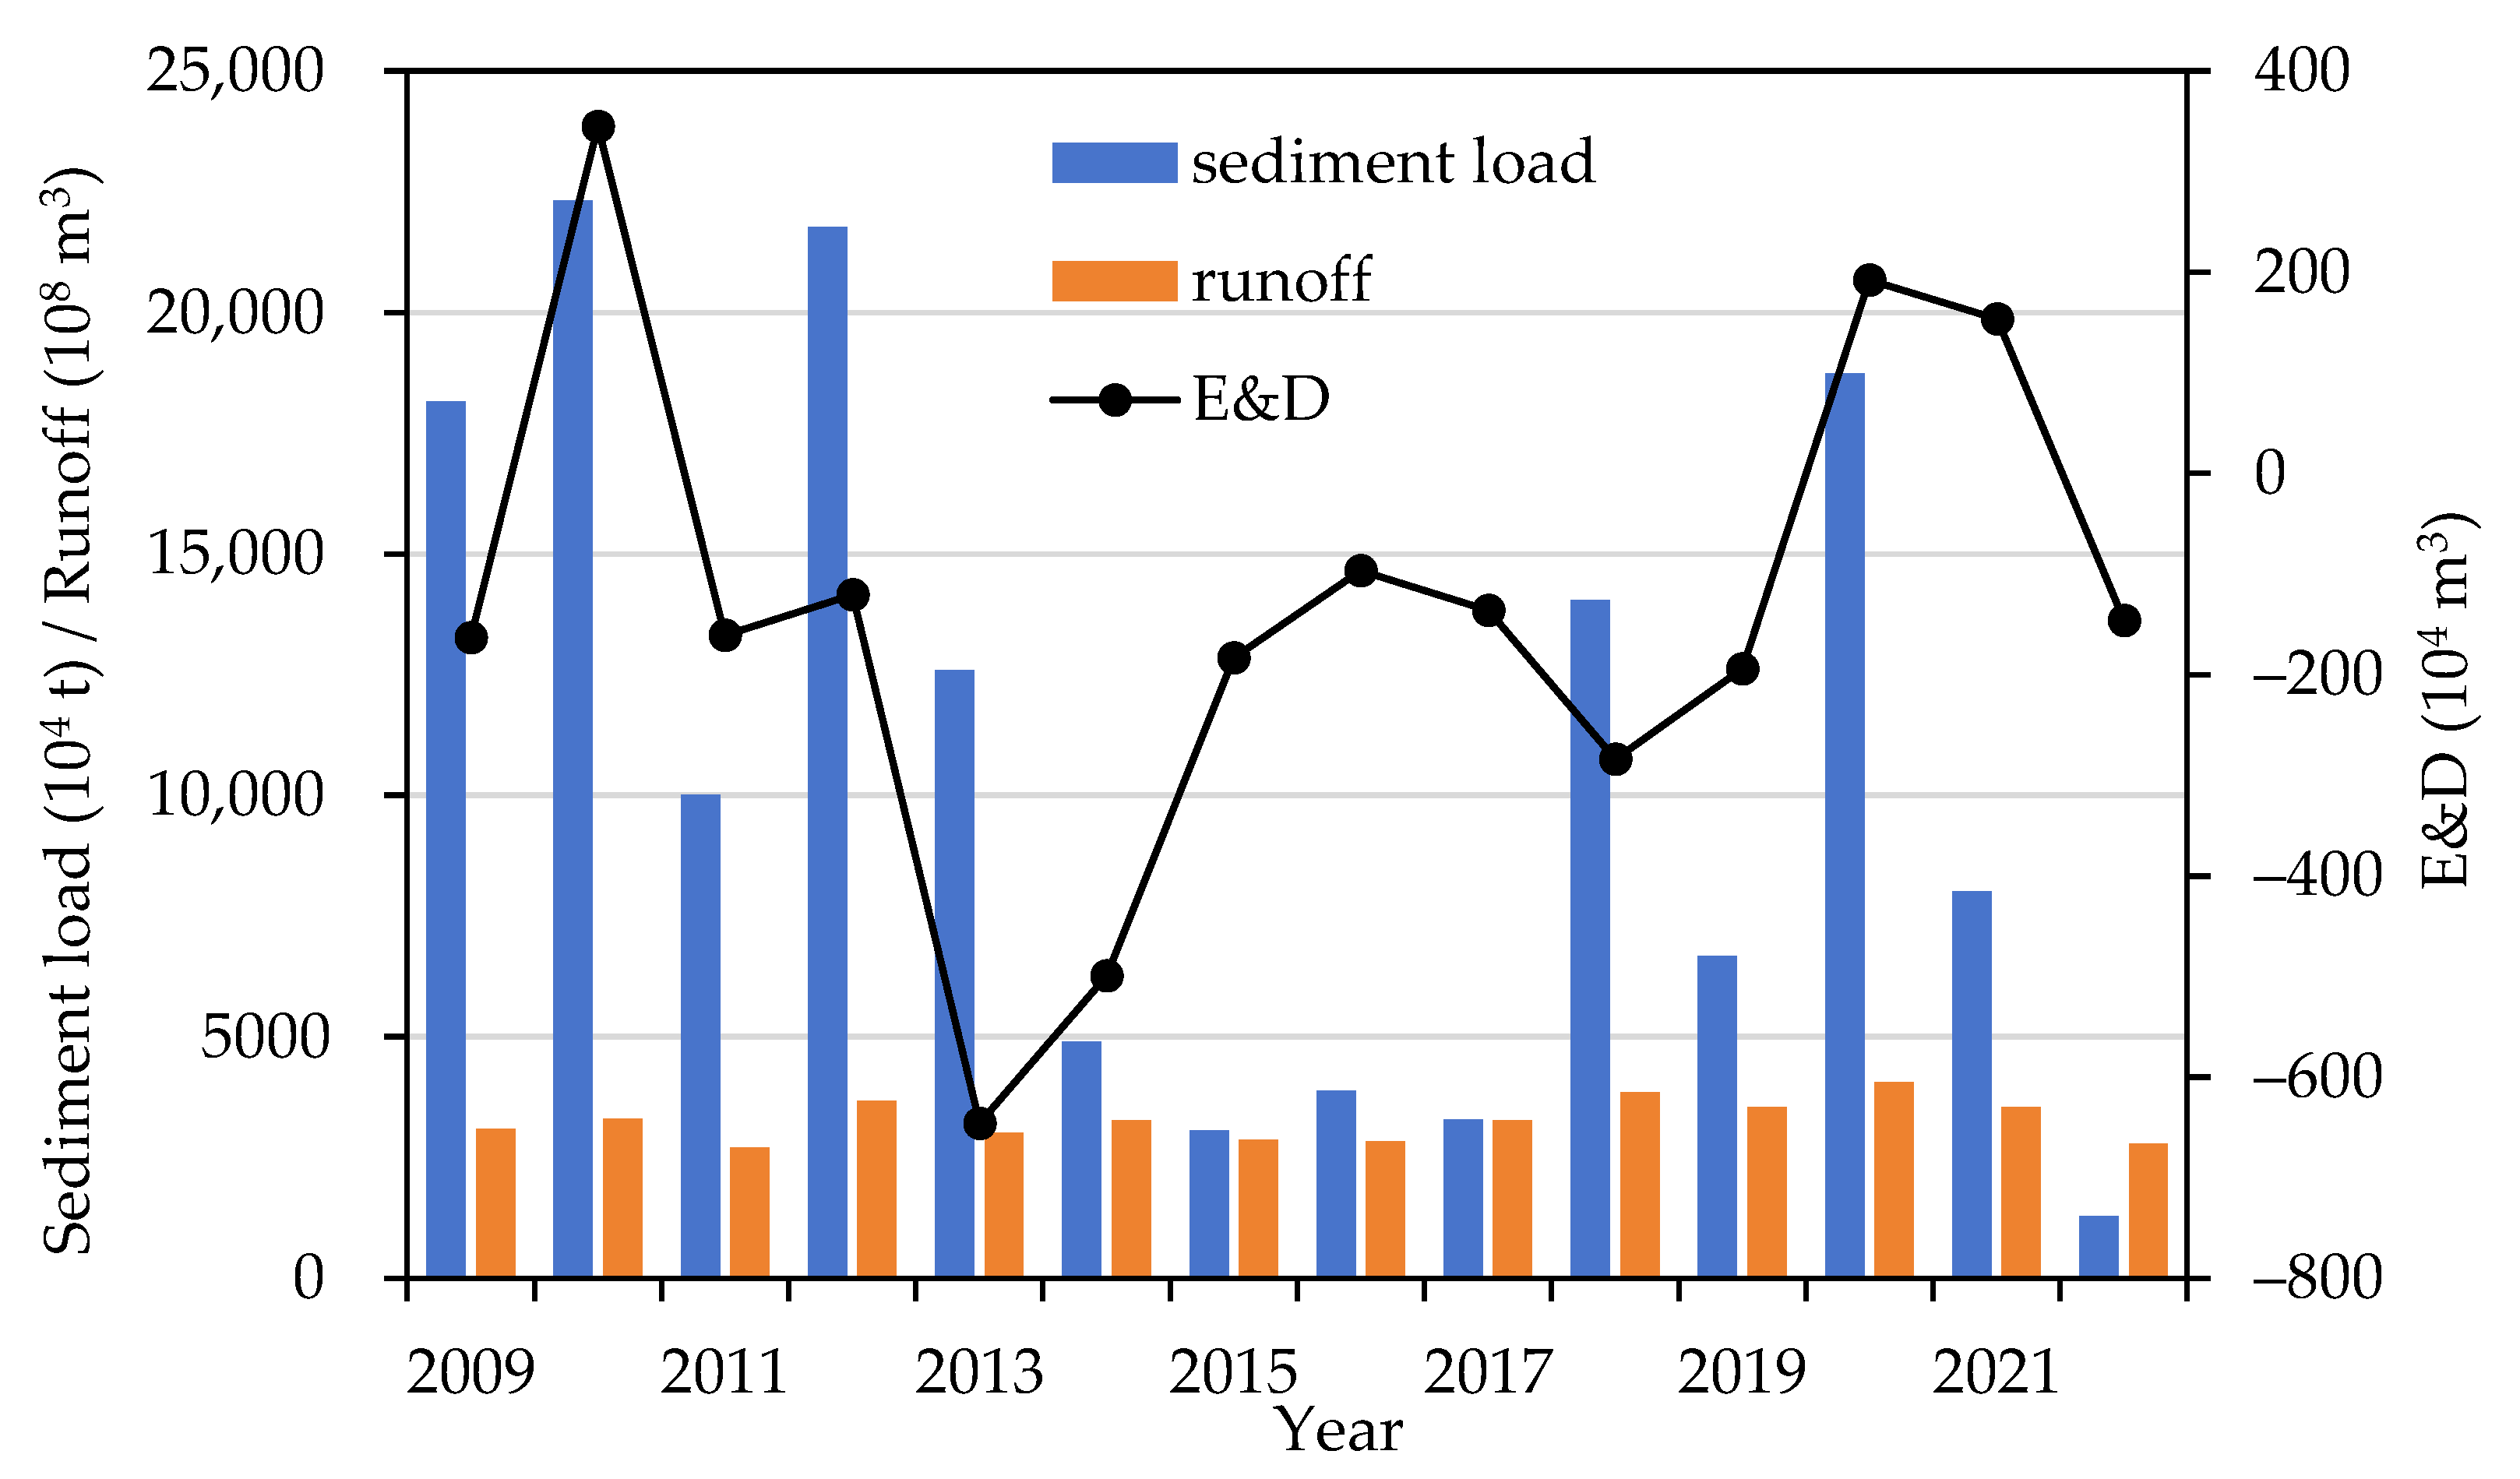
4.1. Impact of Income Flow and Sediment

4.1.1. Total E&D

Figure 9 illustrates the relationship between total runoff, sediment load, and E&D since 2008. The total inflow into the main streams of the Yangtze and Jialing rivers has varied slightly in recent years. However, in 2010, the main streams of the Yangtze and Jialing rivers experienced a total sediment inflow of 223.2 million tons, which was the highest during the study period. Simultaneously, from November 2009 to December 2010, the main urban area of Chongqing experienced deposition of 4.176 million m3 (excluding the impact of sand mining, the same below), which was also the highest during the study period. A relatively large quantity of sand deposition was also observed in 2009, 2012, and 2020, at 2.203, 1.862, and 2.552 million m3, respectively. In 2022, due to relatively low quantities of input sand, 0.492 million m3 of erosion occurred. Similar water and sediment conditions also occurred in the Wujiang River downstream of main urban area of Chongqing, adjacent to the starting point of the fluctuating backwater area [40]. This indicates that when the sediment inflow in the upstream area sharply decreases, sedimentation in the fluctuating backwater area improves [30].

4.1.2. Process

The impact of incoming water and sediment processes during the year primarily manifests as consistency between the distribution of incoming sediment and flow discharge [41]. The maximum sediment transport capacity in the main urban area of Chongqing occurs when the flow discharge is 12,000–25,000 m3/s (Cuntan hydrometric station) and is referred to as the main sediment transport flow discharge. If large quantities of sediment are input during this flow discharge, the majority of the sediment is carried away, resulting in a low degree of sedimentation occurring in that river section, accompanied by some scouring. During the flood season, peak flow is typically greater than 25,000 m3/s, the upper limit of the main sediment transport flow discharge. Two distinct patterns are observed in different flood peak conditions:
The larger the flood peak during the flood season, the longer the duration of the flood process, and the more easily sedimentation occurs in the main urban area of the Chongqing section. During the flood season in 2012, from 12 June to 8 August, there were two major floods on 6 July and 24 July, with peak flows of 50,500 and 63,200 m3/s at the Cuntan hydrometric station. During these two floods, the duration of the flow discharge exceeding 25,000 m3/s reached 17 days, with 13 and 15 days exceeding 30,000 m3/s, respectively. Therefore, during the observation period from 12 June to 18 July, and from 18 July to 8 August, a large degree of sediment deposition occurred, with depositions of 2.137 and 2.511 million m3, respectively.
If the peak flow during the flood season is small, the flood process features a sharp peak with a steep rise and fall, a short flood duration, and small quantities of sediment deposited, and erosion is occasionally observed. From 8 August to 8 September 2012, a flood process occurred in the main urban area of Chongqing reach, with a peak flow on September 3rd of 47,300 m3/s at Cuntan Station. Flows exceeding 25,000 m3/s only spanned five days. Although the largest sand peak of the year occurred on 6 September, it lagged behind the flood peak by three days, with a corresponding flow rate of 22,900 m3/s. From 8 August to 8 September, not only did the sediment input in the main urban area of the Chongqing section not settle, but a significant transport process was observed, with a total sand loss of 1.755 million m3.

4.1.3. Discharge Ratio of the Main Streams of the Yangtze and Jialing Rivers

The impact of the discharge ratio of the Yangtze and Jialing rivers on E&D in the main urban area of Chongqing primarily manifests as differences in the location of sedimentation [42]. When this ratio is relatively low, the water from the main stream of the Yangtze River imparts a significant lifting effect on the Jialing River section, resulting in the sediment in the Jialing River section being more prone to deposition. For example, from 18 July to 20 August 2014, and from 15 July to 18 August 2015, the discharge ratio of the two rivers was relatively low, at 0.16 and 0.14, respectively. During these periods, the Jialing River section experienced depositions of 0.476 and 0.707 million m3, respectively.
When the ratio is relatively large, the jacking effect of the main stream of the Yangtze River on the Jialing River section is weakened, and the Jialing River section becomes more prone to sediment transport. From 18 July to 17 August 2013, a major flood occurred in the main urban area of Chongqing. This event was primarily induced by rising waters in the Jialing River, which exhibited a maximum annual flow discharge of 24,500 m3/s on 20 July. On the same day, Cuntan station also experienced a maximum annual flow discharge of 44,900 m3/s. The entire flood process occurred over eight days, with flow discharge durations exceeding 25,000 and 30,000 m3/s of 12 and 7 days, respectively. During this period, the water inflow from the main stream of the Yangtze River, as measured at the Zhutuo station, was relatively low, with the flow discharge on 20 July measured as only 22,200 m3/s. From 18 July to 25 July, during the flood process, the discharge ratio of the two rivers reached 0.96. The large inflow of the Jialing River resulted in a large degree of erosion in the Jialing River section and the section below Chaotianmen, experiencing sediment erosion quantities of 0.258 and 0.3 million m3, respectively. The river section upstream of Chaotianmen exhibited an accumulated deposition of 1.14 million m3. In 2020, notable flooding events occurred in the main streams of both the Yangtze and Jialing rivers. The average discharge ratio from 22 May to 10 October was 0.28, indicating a strong mutual support effect between the two rivers. During the 2020 flood season, there was marked sedimentation in the main streams of both the Yangtze and Jialing river sections (3.621 million m3).

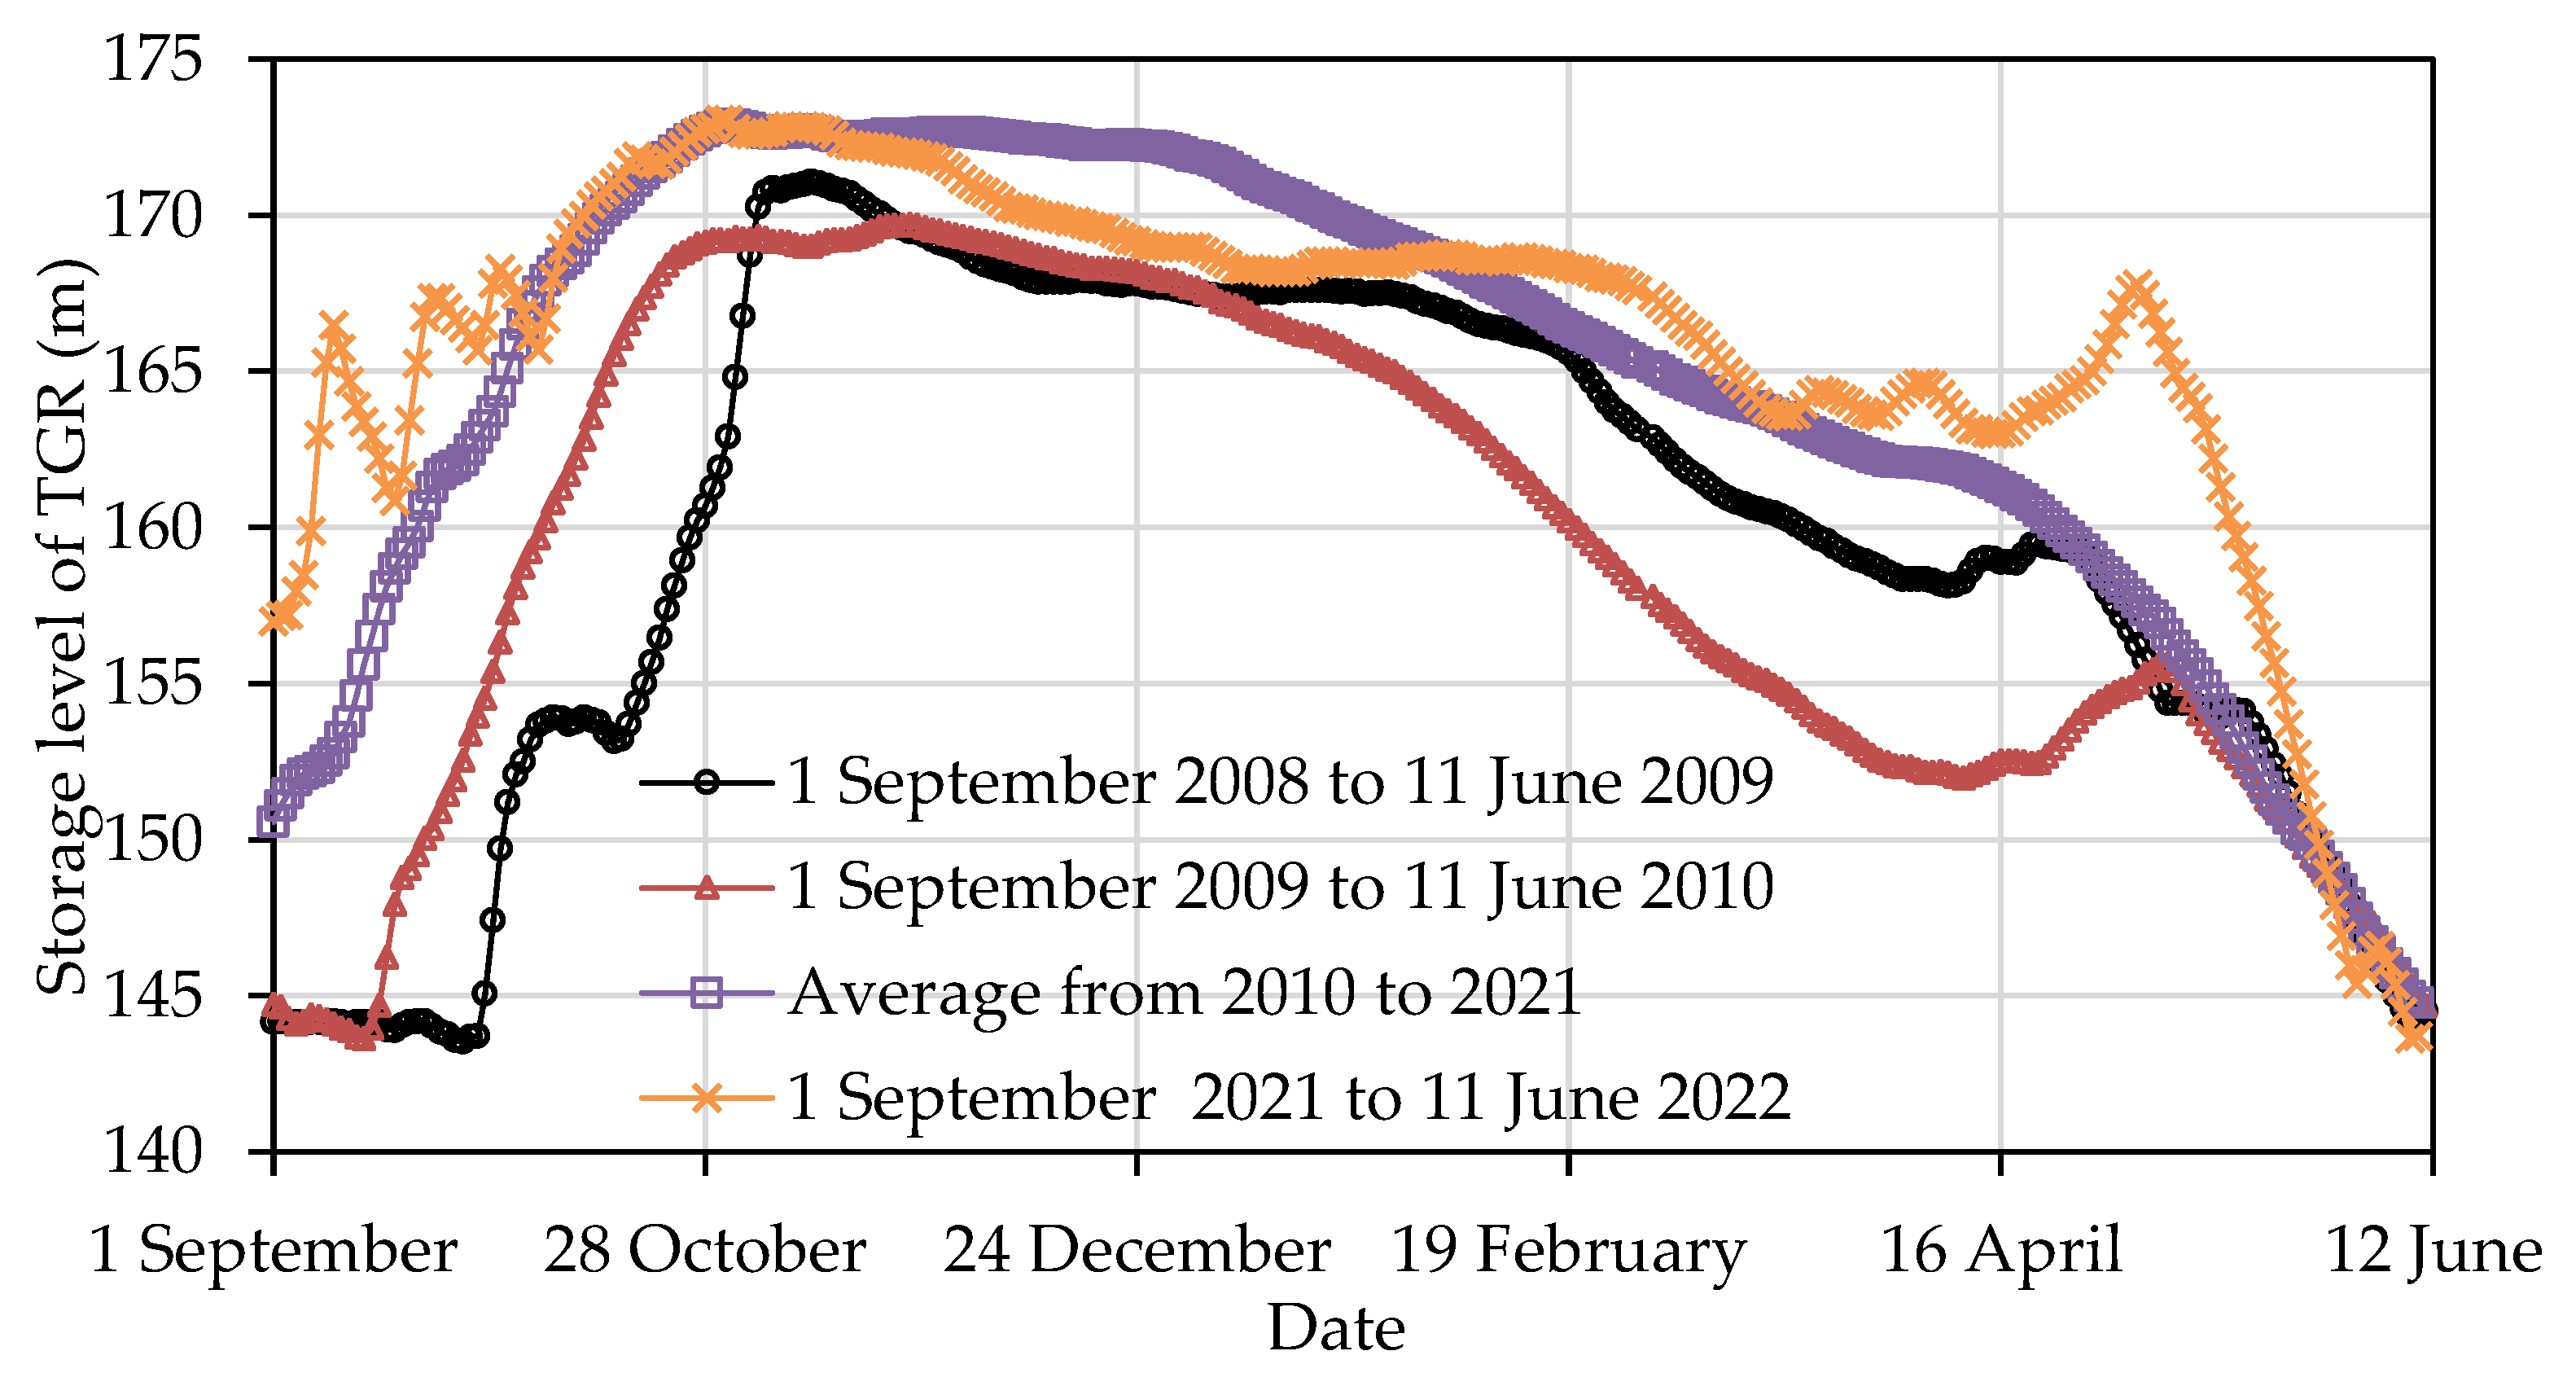
4.2. Impact of the TGR

Changes in the storage level of the TGR during the storage and dissipation periods after September 2008 are shown in Figure 10. After storage levels reached 175 m, the main urban area of the Chongqing river section was impacted, altering its natural E&D pattern of “flood siltation, dry erosion” to some extent [10]. This manifested primarily as the impact of water storage in the post-flood stage, leading to a decrease in sand transportation, which was unable to carry away pre-flood siltation and the occurrence of sedimentation. Only during the dissipation period, when the storage level decreased and the upstream flow increased, did sand transportation begin, resulting in the river section being eroded.
This river section was weakly affected at the end of the flood season during the early stage of impoundment, especially when the storage level was below 168 m. During this period, the flow measured at Cuntan station was observed to be nearly at the main sediment transport flow discharge status, with the river section still possessing some sediment-carrying capacity. In 2008, 2011, 2012, and 2013, during the initial impoundment period, erosion was observed. Additionally, an equilibrium state of E&D was maintained in 2009. Following the 2010 flood season, there was an autumn flood process, wherein the peak flow measured at Cuntan station reached 33,000 m3/s. Due to the influence of incoming flow, 2.13 million m3 of sediment accumulated in the river section from 10 September to 18 September 2010. As the flood subsided and the main stream returned to its channel, 1.53 million m3 sediment was carried through the reach between 18 September and 30 September. Similarly, from 5 September to 24 September 2014, an autumn flood resulted in slight sedimentation during the initial impoundment period, after which it shifted to erosion.
In the later stage of water storage as the storage level gradually rises, especially when the storage level exceeds 168 m, the river section is primarily influenced by the water level. During this time, flow velocity slows, sediment carrying capacity decreases, and sediment is more prone to deposition. For example, in the later stages of water storage in 2008, 2010, and 2011, notable sedimentation was observed. In the later stage of water storage in 2013, the river section was scoured by 0.86 million m3, which may be primarily due to the influence of sand mining. Calculations based on the cross-section data revealed that terrain changes owing to sand mining amounted to 0.877 million m3. Owing to the impact of sand mining, a slight sedimentation of 0.017 million m3 was observed during this period. In 2014, the river section was also affected by sand mining and exhibited erosion, but also accumulated 0.078000 million m3 of sediment during this period. In 2015, the sediment inflow from the upstream decreased further. Although there was some sedimentation during the flood season, some erosion was observed in the main urban area of Chongqing during the later stage of water storage.
During the pre-flood period, as the storage level declined and upstream flow increased, the river section gradually regained a large amount of sediment carrying capacity. Since 175 m water storage was reached, erosion was the predominant state during the pre-flood period, and in years with more sedimentation during the preliminary stage, the degree of erosion during the pre-flood period was also greater.
Figure 10. Comparison of water level changes in front of the TGR during the storage and dissipation periods from 2008 to 2022.
Water 15 04011 g010

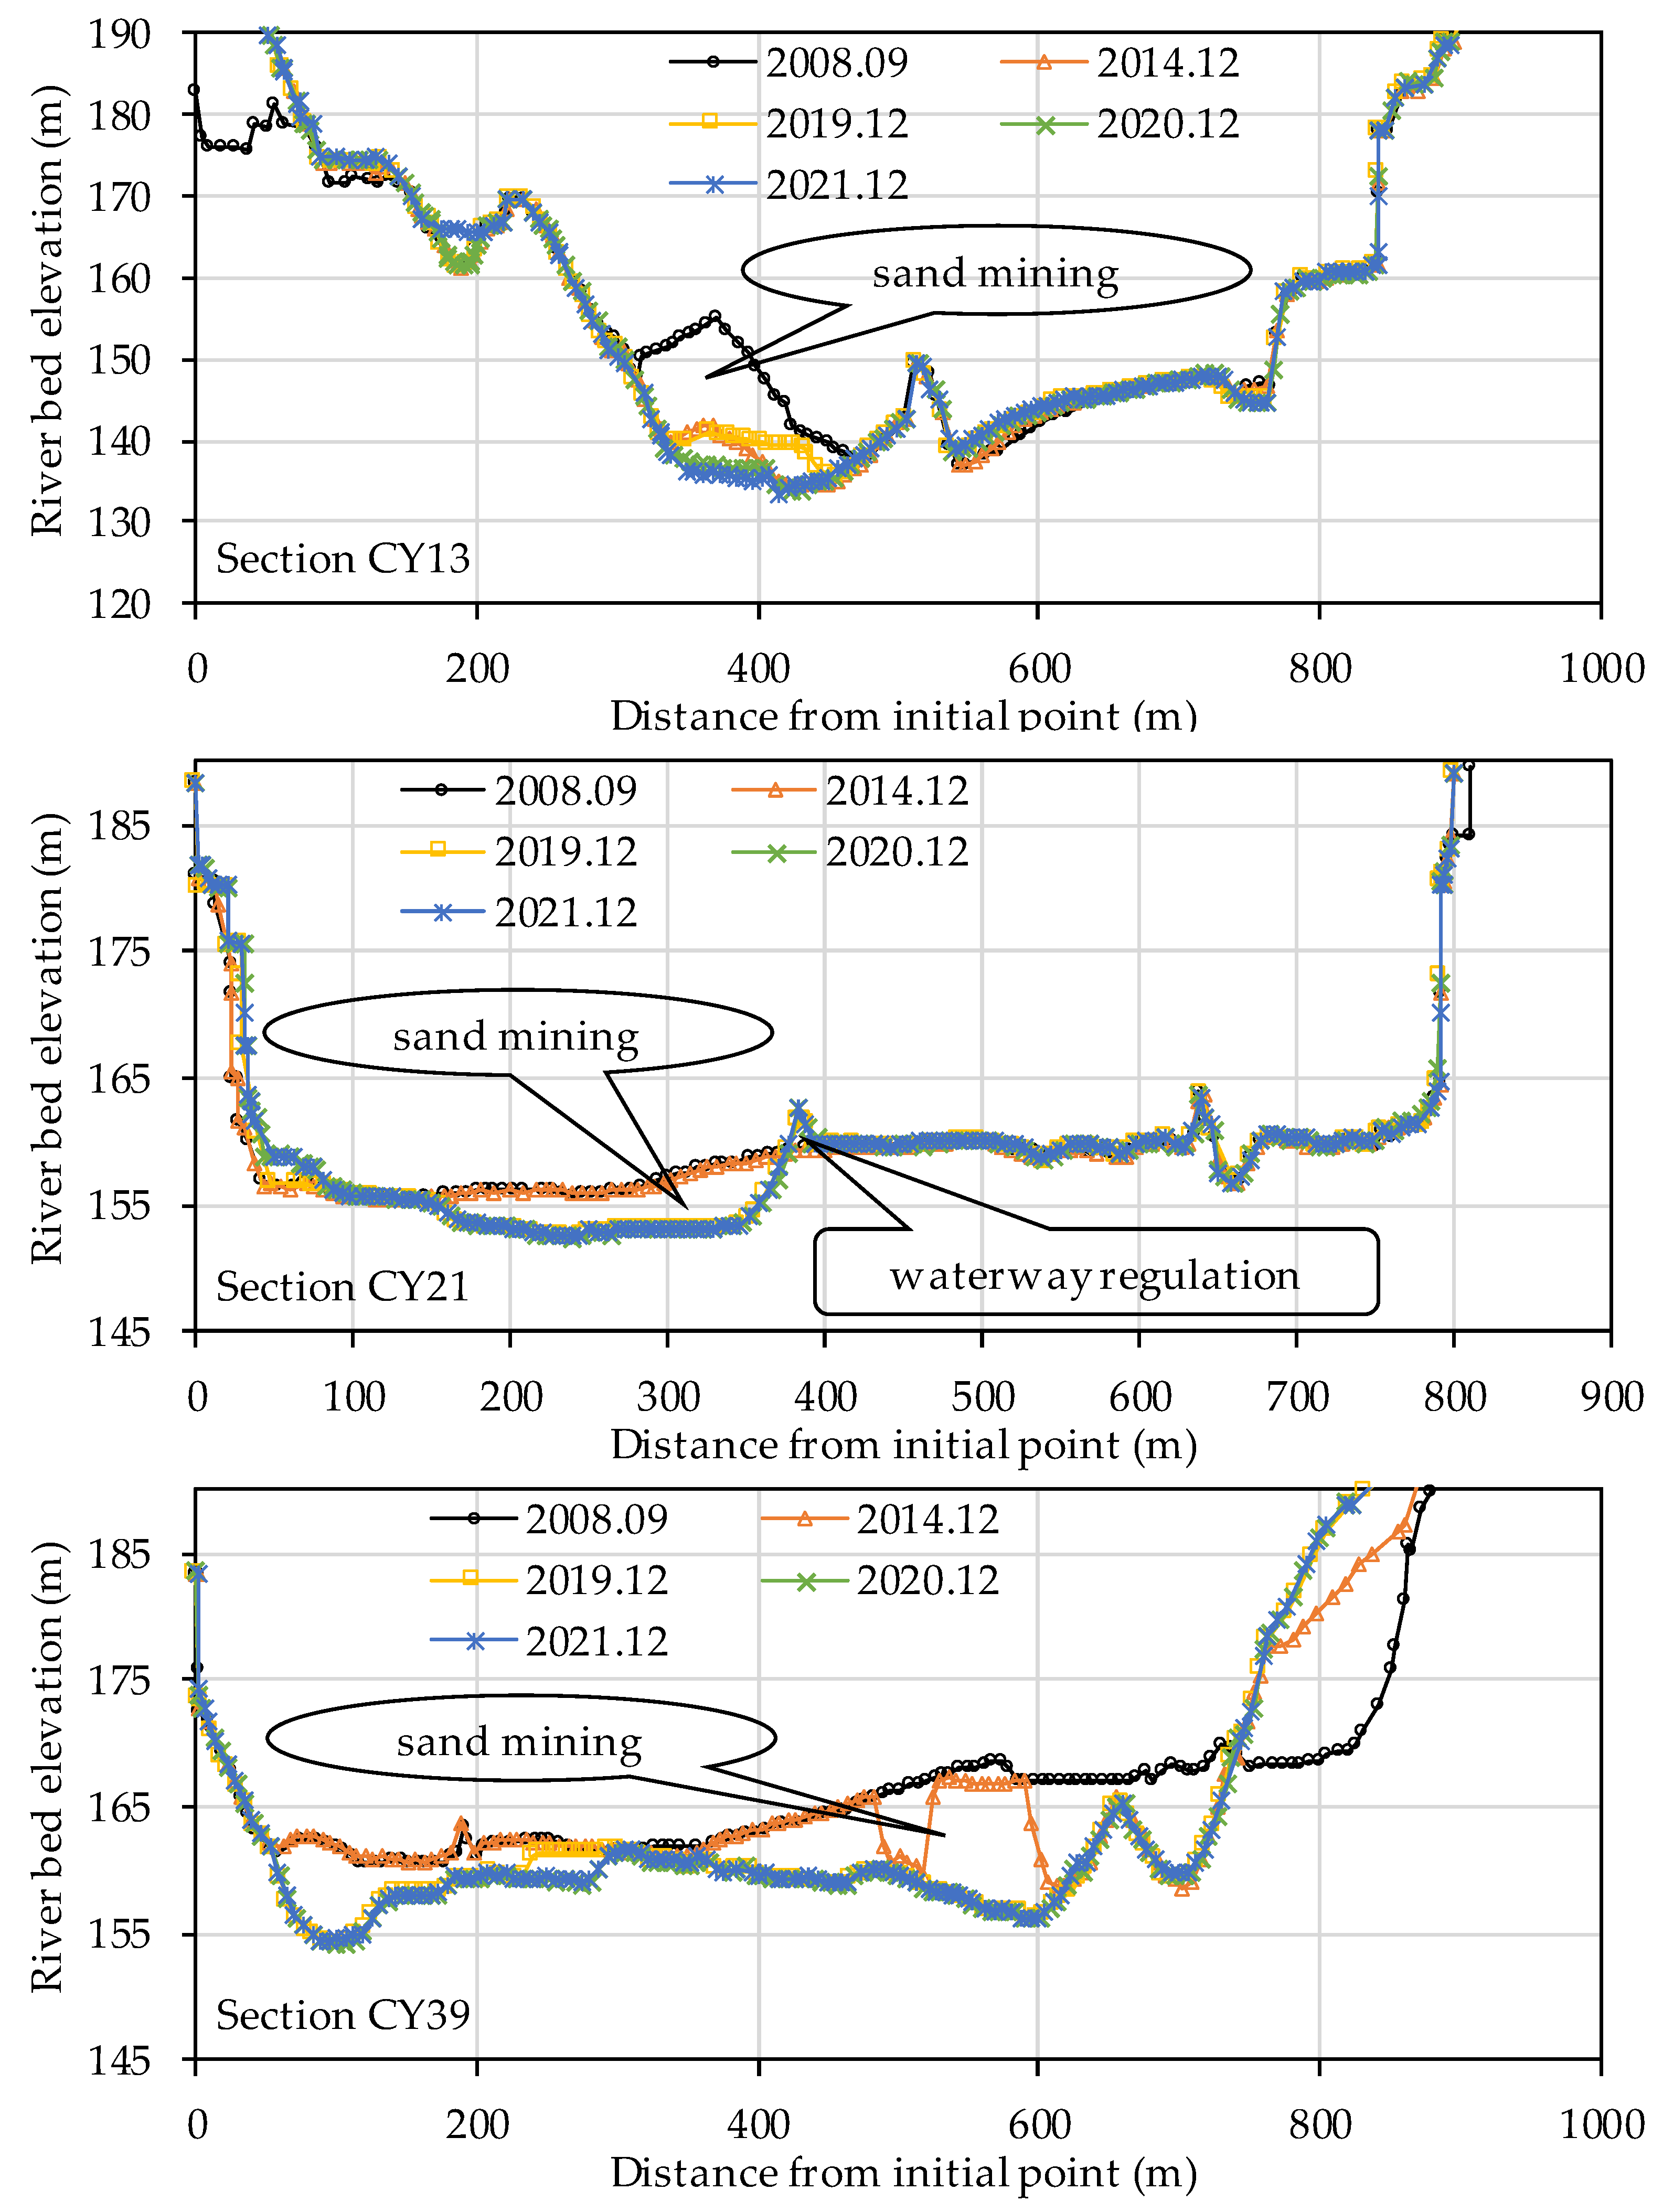
4.3. Impact of Human Activities

In recent years, sand mining activities have increased in frequency in the main urban area of Chongqing [43], and channel regulation projects have been implemented in multiple places [44,45]. Sand mining and channel regulation have markedly impacted riverbed E&D. Figure 11 highlights typical anthropogenic activities of sand mining and waterway regulation in selected years. From the interannual variation in the cross-section, anthropogenic activities such as these have been observed to result in marked changes to the elevation of local areas of the cross-section, with frequent interannual variations. Since 2011, the Hydrological Bureau of the Yangtze River Commission has organized sand mining surveys on the river sections in the main urban area of Chongqing. According to their survey data, the total quantity of sand mined in 2011 and 2012 was approximately 1.477 and 1.535 million tons, respectively.
The impact of sand mining activities on riverbed E&D has two main effects. Firstly, it affects calculations of the quantities of E&D, which masks the natural E&D characteristics of the river. For example, 15 October 2012 to 23 February 2013 experienced the largest volume of sand mined, based on the comparison of fixed cross-section data. By using the channel storage method, we found that the local terrain changes in the main urban area of Chongqing resulting from sand mining amounted to approximately 3.165 million m3. However, the total quantity of E&D in the main urban area of the Chongqing river section was only 3.623 million m3 during this period. Secondly, after sand mining, a large degree of sedimentation was observed in the sand mining area during the flood season. A typical cross-section of sand mining and siltation is shown in Figure 12. The sand mining sections CY02, CY03, and CY06 all experienced large degrees of sedimentation during the flood process. The maximum siltation height in the CY02 section was approximately 5.4 m, and it was 5 m in the CY03 section. The CY06 section also experiences repeated sand mining operations during the year. From December 2011 to June 2012, there were two major sand mining operations near the starting point at 360 and 390 m, with a maximum mining height of nearly 7 m. On 6 July and 24 July, there were two major floods, resulting in severe sedimentation in the excavation area. As of 12 September, the majority of the mining area has been filled with sediment.

5. Conclusions

In this study, we analyzed the sedimentation characteristics of the main urban area of the Chongqing river section located in the FBA of the TGR based on terrain measurements and hydrological data collected following the normal storage of the TGR in 2008. The results of this study demonstrate that accumulated erosion has occurred through sedimentation on sand bars and erosion in main channels of 2.895 and 20.672 million m3, respectively. However, river sections have exhibited little change within 30 m of the shorelines, and the positions of sand bars and deep pools in the river section are nearly unchanged. Furthermore, the amplitude of changes in the thalweg are rarely greater than 1 m.
The evolution of the river sections in this area has been influenced by multiple factors, including water and sediment inputs, reservoir operations, and river sand mining. As sediment inflow and peak flood discharge and duration increase, sedimentation quantities increases, and its location shifts with the change in the confluence ratio of the main streams of the Yangtze and Jialing rivers. In recent years, anthropogenic activities such as sand mining and waterway regulation have led to cumulative erosion.
This study elucidated the sedimentation that has occurred since the normal water storage of the TGR and, by extension, the operation of most cascade reservoirs in the Jinsha River, including those taking place under the water. The results of this study serve as a reference for the evolution of rivers in cascade reservoirs over an extended period into the future. Furthermore, these results provide support for the comprehensive improvement of FBA and the optimization of joint operations in cascade reservoirs.

Author Contributions

Conceptualization, J.L. and H.G.; methodology, H.G. and Y.P.; validation, X.D. and L.Z.; formal analysis, J.L. and H.G.; investigation, H.G.; resources, J.L.; data curation, J.L.; writing—original draft preparation, J.L. and H.G.; writing—review and editing, X.D. and L.Z.; visualization, L.Z.; supervision, H.G.; project administration, J.L. and Y.M.; funding acquisition, J.L. and L.Z. All authors have read and agreed to the published version of the manuscript.

Funding

This research was funded by the China Three Gorges Corporation (grant number JGAJ0421004 and 0704220) and the Bureau of Hydrology, Changjiang Water Resources Commission (grant number SWJ-CJX23Z10).

Data Availability Statement

The data presented in this study are available on request from the corresponding author. The data are not publicly available due to privacy.

Conflicts of Interest

Author Xianyong Dong was employed by the company China Three Gorges Construction Engineering Corporation. The remaining authors declare that the research was conducted in the absence of any commercial or financial relationships that could be construed as a potential conflict of interest.

References

  1. Lu, X.; Huang, E.; Wang, S.; Zhao, X.; Guan, X. Bed-load Sediment Transport in Fluctuating Backwater Area of a Steep Slope Reach. Adv. Eng. Sci. 2018, 50, 89–95. [Google Scholar] [CrossRef]
  2. Zhang, R.; Wu, B.; Liu, S. Cause of Sediment Problems in Flood Seasons of the Niulan River-Dian Lake Water Diversion Project. J. Basic Sci. Eng. 2020, 28, 1–17. [Google Scholar] [CrossRef]
  3. Deng, Z. Pebble movement law and channel regulation countermeasures in Shangluoqi reach of Three Gorges Reservoir. Port Waterw. Eng. 2023, 120–126. [Google Scholar] [CrossRef]
  4. Su, L. Riverbed evolution and waterway regulation scheme of Guangyangba reach in fluctuating backwater area of the Three Gorges Reservoir. Port Waterw. Eng. 2023, 149–154. [Google Scholar] [CrossRef]
  5. Xia, N.; Xiao, Y.; Hu, X.; Deng, J.; Li, D. Sand mining distribution in fluctuating backwater area of Three Gorges Reservoir. Port Waterw. Eng. 2023, 151–156. [Google Scholar] [CrossRef]
  6. Liu, M.; Zeng, L.; Wu, L.; Zhu, C.; Abi, E. Effect of periodic water-sediment laden flow on damage for steel piles. Front. Environ. Sci. 2022, 10, 971786. [Google Scholar] [CrossRef]
  7. Xu, G.; Wang, L.; Yang, S.; Yang, W.; Peng, Y.; Sun, Z. Spatial Distribution and Habitat Characteristics of Fish Swarm in Fluctuating Backwater Zone of Three Gorges Reservoir in Impoundment Period. J. Yangtze River Sci. Res. Inst. 2021, 38, 46–52. [Google Scholar] [CrossRef]
  8. Yang, S.; Xu, G.; Wang, L.; Yang, W.; Xiao, Y.; Li, W.; Hu, J. Field-derived relationships between fish habitat distribution and flow-sediment conditions in fluctuating backwater zone of the Three Gorges Reservoir. Ecol. Inform. 2021, 62, 101273. [Google Scholar] [CrossRef]
  9. Xiao, Y.; Deng, J.; Yang, S.; Hu, J.; Wang, L.; Li, W. Study on the spawning habitat suitability of four major Chinese carps in the fluctuating backwater area of the Three Gorges Reservoir. Ecol. Indic. 2022, 143, 109314. [Google Scholar] [CrossRef]
  10. Jianjun, Z.; Cao, H.; Man, Z. Reducing Deposition in TGP Reservoir by Dredging Coarse Sediment. Sci. Technol. Rev. 2010, 28, 28–36. [Google Scholar]
  11. Hu, C.; Fang, C. Research on sediment problem solutions for the Three Gorges Project and it operational effects. Sci. Sin. Technol. 2017, 47, 832–844. [Google Scholar] [CrossRef]
  12. Lu, Y.; Zuo, L.; Ji, R.; Liu, H. Deposition and erosion in the fluctuating backwater reach of the Three Gorges Project after upstream reservoir adjustment. Int. J. Sediment Res. 2010, 25, 64–80. [Google Scholar] [CrossRef]
  13. Tang, X.; Tong, S.; Huang, G.; Xu, G.; Li, X.; Lei, K.; Yao, S. Characteristics of sedimentation and channel adjustment linked to the Three Gorges Reservoir. Int. J. Sediment Res. 2021, 36, 177–189. [Google Scholar] [CrossRef]
  14. Hu, J.; Yang, S.; Wang, X. Sedimentation in Yangtze River above Three Gorges Project since 2003. J. Sediment Res. 2013, 1, 39–44. [Google Scholar] [CrossRef]
  15. Li, W.; Yang, S.; Fu, X.; Xiao, Y. Sedimentation characteristics in the Three Gorges Reservoir during the initial operation stage. Adv. Water Sci. 2015, 26, 676–685. [Google Scholar] [CrossRef]
  16. Peng, W.; Liu, D.; Liu, T.; Wang, X. Analyses on erosion and deposition characteristics of the river reach in Chongqing City. J. Sediment Res. 2005, 6, 44–50. [Google Scholar] [CrossRef]
  17. Xujing, Z.; Dewei, M.U.; Shiqiang, Z. Sediment Aggregation and Regulation for Chongqing Reach of the Fluctuating Backwater District in Three Georges Reservoir. J. Chongqing Jianzhu Univ. 2006, 28, 13–17. [Google Scholar] [CrossRef]
  18. Liu, J.; Yang, S.; Shen, Y. Impact of runoff and sediment from the Upper Yangtze River on deposition in the Three Gorges Reservoir. J. Sediment Res. 2019, 44, 33–39. [Google Scholar] [CrossRef]
  19. Ren, S.; Liu, L. Sediment deposition and countermeasures in the Three Gorges Reservoir. J. Sediment Res. 2019, 44, 40–45. [Google Scholar] [CrossRef]
  20. Li, W.; Ma, H.; Yang, S.; Yang, W.; Song, C. Sedimentation and One Dimensional Simulation of Fine Sediment in the Three Gorges Reservoir. J. Basic Sci. Eng. 2021, 29, 251–260. [Google Scholar] [CrossRef]
  21. Li, W.; Li, N.; Yang, S.; Wang, T. Analysis of the sedimentation in the Three Gorges Reservoir based on the sediment carrying capacity. Adv. Water Sci. 2016, 27, 726–734. [Google Scholar] [CrossRef]
  22. Li, W.; Yang, S.; Xiao, Y.; Fu, X.; Hu, J.; Wang, T. Rate and Distribution of Sedimentation in the Three Gorges Reservoir, Upper Yangtze River. J. Hydraul. Eng. 2018, 144, 05018006. [Google Scholar] [CrossRef]
  23. Tang, X.; Tong, S.; Xu, G.; Huang, G.; Wang, T. Delayed response of sedimentation in the flood seasons to the pool level of the Three Gorges Reservoir. Adv. Water Sci. 2019, 30, 528–536. [Google Scholar] [CrossRef]
  24. Li, X.; Ren, J.; Xu, Q.; Yuan, J.; Zhang, W. Impact of cascade reservoirs on the delayed response behaviour of sedimentation in the Three Gorges Reservoir. J. Geogr. Sci. 2023, 33, 576–598. [Google Scholar] [CrossRef]
  25. Zhu, L.; Xu, Q.; Zhang, O.; Yang, Y.; Wang, W. Sedimentation at estuary of 66 tributaries in the Three Gorges Reservoir. Sci. Sin. Technol. 2019, 49, 552–564. [Google Scholar] [CrossRef]
  26. Liu, S.; Li, D.; Liu, D.; Zhang, X.; Wang, Z. Characteristics of sedimentation and sediment trapping efficiency in the Three Gorges Reservoir, China. Catena 2022, 208, 105715. [Google Scholar] [CrossRef]
  27. Wang, B.-Y.; Yan, D.-C.; Wen, A.-B.; Chen, J.-C. Influencing factors of sediment deposition and their spatial variability in riparian zone of the Three Gorges Reservoir, China. J. Mt. Sci. 2016, 13, 1387–1396. [Google Scholar] [CrossRef]
  28. Yang, Y.; Chen, L.; Huang, J.; Ping, Y.; Liu, T. Study of sediment silting-scouring in Jialing-Yangtze confluence reach during 175 m experimental impoundment period. Eng. J. Wuhan Univ. 2017, 50, 31–36. [Google Scholar] [CrossRef]
  29. Lei, Y. Study on overall sediment erosion and sedimentation in the fluctuating backwater area of the Three Gorges Reservoir. Yangtze River 2018, 49, 1–5. [Google Scholar] [CrossRef]
  30. Liu, S.; Zhang, X.; Huang, J. Analysis on recent variation of transport characteristics of gravel bed-load into Three Gorges Reservoir and its impact. Water Resour. Hydropower Eng. 2018, 49, 82–89. [Google Scholar] [CrossRef]
  31. Zhu, L.; Ge, H.; Dong, B.; Yang, C. Control index of sediment reduction dispatching in Chongqing reach after the storage level of TGR reaching 175 m. Acta Geogr. Sin. 2021, 76, 114–126. [Google Scholar] [CrossRef]
  32. Ge, H.; Deng, C. 2D Hydraulic modelling of the main urban area of Chongqing, Part 2: Model validation and application. In Proceedings of the 4th International Workshop on Renewable Energy and Development (IWRED), Electr Network, Sanya, China, 24–26 April 2020; IOP: Bristol, UK, 2020. [Google Scholar]
  33. Luo, M.; Yu, H.; Huang, E.; Ding, R.; Lu, X. Two-Dimensional Numerical Simulation Study on Bed-Load Transport in the Fluctuating Backwater Area: A Case-Study Reservoir in China. Water 2018, 10, 1425. [Google Scholar] [CrossRef]
  34. Ren, S.; Zhang, B.; Wang, W.-J.; Yuan, Y.; Guo, C. Sedimentation and its response to management strategies of the Three Gorges Reservoir, Yangtze River, China. Catena 2021, 199, 105096. [Google Scholar] [CrossRef]
  35. Chen, P.; Deng, J.; Tan, G.; Lu, J.; Jin, Z.; Zhou, Y.; Shu, C.; Feng, Z.; Tang, R.; Lve, Y.; et al. Prediction research on sedimentation balance of Three Gorges Reservoir under new conditions of water and sediment. Sci. Rep. 2021, 11, 19005. [Google Scholar] [CrossRef] [PubMed]
  36. Yang, C.; Deng, J.; Qi, Y.; Wang, Y.; Lin, J. Study on Long-term Impact of Small and Medium-sized Floods Regulation on Sedimentation of the Three Gorges Reservoir. Water Resour. Power 2020, 38, 34–37. [Google Scholar]
  37. Pan, Q. Review of sediment research in Three Gorges Project in recent 60 years. Yangtze River 2017, 48, 18–22. [Google Scholar] [CrossRef]
  38. Bureau, C.W.R. Yangtze River. Available online: http://slj.cq.gov.cn/ztzl_250/hzzjsst/tzgg_24017/201707/t20170705_6080714_wap.html (accessed on 5 July 2023).
  39. Ge, H.; Zhu, L.; Deng, C.; Jiang, L.; Long, R. Decadal Hydro-Morphodynamic Evolution of a Sandy Meander Bend Downstream of the Three Gorges Dam and Impact on Waterway Navigation. Water 2022, 14, 19. [Google Scholar] [CrossRef]
  40. Lu, Y.; Wang, Y.; Cao, L.; Zhang, Q.; Zhao, D. Fluvial Process of Chongqing Segment of Wujiang River and Its Impacts on Navigation. J. Yangtze River Sci. Res. Inst. 2023, 40, 186–191. [Google Scholar] [CrossRef]
  41. Huang, R.; Shu, C.; Tang, G. Preliminary Study on Transportation Characteristics of Sediment Concentration Peak of the Three Gorges Reservoir in Flood Season. J. Basic Sci. Eng. 2019, 27, 1202–1210. [Google Scholar] [CrossRef]
  42. Zhang, F. Influence of confluence ratio on water flow and sediment characteristics in Chongqing of the Yangtze River. J. Waterw. Harb. 2023, 44, 352–361. [Google Scholar] [CrossRef]
  43. Xiao, Y.; Zhang, S.; Yang, S.; Li, W. Distribution of sand excavation area and simulation of recovery ability for destroyed gravel shoals in upstream of the Yangtze River. Port Waterw. Eng. 2020, 127–131+154. [Google Scholar] [CrossRef]
  44. Chen, X.; Zhang, X. Regulation of the Chongqing section of the Yangtze River in the fluctuating backwater area of the Three Gorges Reservoir. China Water Transp. 2008, 40–41+43. [Google Scholar] [CrossRef]
  45. Fan, S.; Zhu, D.; He, Y.; Li, J. Stepped navigation regulation structures design of Hujiatan beach in fluctuating backwater area of the Three Gorges reservoir. Port Waterw. Eng. 2016, 134–138+157. [Google Scholar] [CrossRef]
Figure 1. Study area: (a) the Yangtze River Basin; (b) the TGR and its important tributaries; (c) the main urban area of the Chongqing river section.
Water 15 04011 g001
Figure 2. Distribution of E&D along the river in the main urban area of Chongqing section since 2008.
Water 15 04011 g002
Figure 3. Changes in the CY02 section from September 2008 to December 2022.
Water 15 04011 g003
Figure 7. Evolution of the thalweg in the main urban area of the Chongqing river section: (a) the main stream of the Yangtze River; (b) the Jialing River.
Water 15 04011 g007
Figure 9. Relationship between annual total runoff, sediment load, and E&D.
Water 15 04011 g009
Figure 11. Typical cross-sectional changes influenced by human activities.
Water 15 04011 g011
Figure 12. Typical cross-section of sand mining and siltation.
Water 15 04011 g012
Table 1. Data used in this study.
TypePeriodMeasurementsSource
Fixed-section terrain2008–200962, June to November, once a monthHydrological Bureau of the Yangtze River Water Conservancy Commission
2010–201565, decreasing from 16 to 9 times per year
2016–202265, June to October, once a month
Topographic terrain
(Entire river section)
2008–2009July, December
2016–2022December
Topographic terrain
(Key river sections)
2010–2015July, December
Flow discharge2008–2022Daily average
Table 2. E&D in the main urban area of Chongqing section since the normal storage of the TGR in 2008, unit: 104 m.
Time IntervalMain Stream of the Yangtze RiverJialing RiverWholeNotes
Below
Chaotianmen
Above
Chaotianmen
September 2008~December 2008−37.4−24.6−66.8−128.8Storage period in 2008
December 2008~June 2009−33.5−73.7−18.2−125.4Decline period in 2009
June 2009~September 2009−59.942.65739.7Flood season of 2009
September 2009~November 200941.6−47.1−72.2−77.7Storage period in 2009
November 2009~June 201016.170.494.3180.8Decline period in 2010
June 2010~September 201070.943−154.3−40.4Flood season in 2010
September 2010~December 201043.822139.3205.1Storage period in 2010
December 2010~June 2011−113.6−84.8−65.9−264.3Decline period in 2011
June 2011~September 2011−28.929.716.817.6Flood season in 2011
September 2011~December 201112.553.819.485.7Storage period in 2011
December 2011~June 2012−51.4−178.1−72.6−302.1Decline period in 2012
June 2012~September 2012166.730.891.8289.3Flood season in 2012
September 2012~October 2012−21.2−105.618.9−107.9Storage period in 2012
October 2012~June 20130.4−273−57−329.6Decline period in 2013
June 2013~September 2013−57.5−28.6−53.8−139.9Flood season in 2013
September 2013~December 2013−47.6−137.38.1−176.8Storage period in 2013
December 2013~June 2014−80.4−151.2−78−309.6Decline period in 2014
June 2014~September 201410840.2−3.3144.9Flood season in 2014
September 2014~December 2014−89.2−238.3−7−334.5Storage period in 2014
December 2014~June 2015−37.3−160.2−53.7−251.2Decline period in 2015
June 2015~September 2015120.771.384.6276.6Flood season in 2015
September 2015~December 2015−55.1−106.8−46.6−208.5Storage period in 2015
December 2015~June 201667.5−21.1−43.82.6Decline period in 2016
June 2016~October 2016−100.5−31−1.4−132.9Flood season in 2016
October 2016~December 2016−42.65422.634Storage period in 2016
December 2016~June 201725.6−112.8−17.2−104.4Decline period in 2017
June 2017~October 2017−8.2−82.328.8−61.7Flood season in 2017
October 2017~December 201740.40.1−10.430.1Storage period in 2017
December 2017~June 2018−37.7−164.6−41.8−244.1Decline period in 2018
June 2018~October 201814.6−69.626.5−28.5Flood season in 2018
October 2018~December 2018−7.7−29.125.4−11.4Storage period in 2018
December 2018~May 20192.3−101.1−40.6−139.4Decline period in 2019
May 2019~October 201938−67.6−24.7−54.3Flood season in 2019
October 2019~December 201944.4−51.16.1−0.6Storage period in 2019
December 2019~May 202017.940.80.759.4Decline period in 2020
May 2020~October 202048.7148.9118.3315.9Flood season in 2020
October 2020~December 2020−76.2−81.7−25−182.9Storage period in 2020
December 2020~May 202157.238.8−41.854.2Decline period in 2021
May 2021~October 2021−8.330.160.882.6Flood season in 2021
October 2021~December 2021−11.32.226.417.3Storage period in 2021
December 2021~June 2022−89.2−88.5−69.7−247.4Decline period in 2022
June 2022~December 20228334.3−16101.3Flood and storage periods in 2022
September 2008~December 2022−74.4−1756.8−236−2067.2
Table 3. Thickness of E&D in the main urban area of Chongqing section from September 2008 to December 2022.
SectionAverage (m)Maximum
Value (m)Location
Main stream of the Yangtze RiverAbove Chaotianmen−1.04 12.0CY34
Below Chaotianmen−0.0718.3CY02
Jialing River−0.214.4CY52
Note: 1 “−” indicates erosion.
Disclaimer/Publisher’s Note: The statements, opinions and data contained in all publications are solely those of the individual author(s) and contributor(s) and not of MDPI and/or the editor(s). MDPI and/or the editor(s) disclaim responsibility for any injury to people or property resulting from any ideas, methods, instructions or products referred to in the content.

