Article

Runoff Decline Is Dominated by Human Activities

1
River and Lake Protection Center, Ordos Water Conservancy Bureau, Ordos 017000, China
2
Key Laboratory of Water Cycle and Related Land Surface Processes, Institute of Geographic Sciences and Natural Resources Research, Chinese Academy of Sciences, Beijing 100101, China
3
Key Laboratory of Hydrometeorological Disaster Mechanism and Warning of Ministry of Water Resources, Nanjing University of Information Science and Technology, Nanjing 210044, China
4
School of Hydrology and Water Resources, Nanjing University of Information Science and Technology, Nanjing 210044, China
5
Ordos Hydrology and Water Resources Subcenter, Ordos 017000, China
*
Author to whom correspondence should be addressed.
Water 2023, 15(22), 4010; https://doi.org/10.3390/w15224010
Submission received: 25 October 2023 / Revised: 10 November 2023 / Accepted: 16 November 2023 / Published: 18 November 2023

Abstract

:
Investigations into runoff change and its influencing factors hold immense significance for promoting sustainable development, efficient water resource utilization, and the improvement of the ecological environment. To reduce methodological uncertainties, this study employed six attribution analysis methods, including two statistical approaches, a Budyko equation sensitivity coefficient method, and three hydrology models, to differentiate the contributions of climate change and human activities to the runoff change in the Xiliugou basin. The results indicated an abrupt change point in 2006, and the annual runoff series from 1960 to 2020 demonstrated a significant declining trend. All the six methods revealed that human activities were the major influencing factor. The average contribution rate of climate change was noted to be 24.2%, while that of human activities was 75.8% among the six methods used for this study. The prominent human activities in the Xiliugou basin revolve around soil and water conservation measures. The research findings hold great significance for the comprehensive understanding of runoff formation and its response to the changing environment in the Xiliugou basin. Additionally, these results can provide a foundation for decision-making for water resource management and ecological protection.

1. Introduction

The hydrologic cycle system closely links the earth’s hydrosphere, atmosphere, biosphere, and lithosphere, forming a mutually coupled subsystem. This system provides an important link between atmospheric, terrestrial, and ecological water [1,2]. Both climatic factors and human activities exert influences on the hydrological cycle within basins [3,4,5]. Climate change inherently induces alterations in hydrological characteristics across various spatial scales, including in basins and at the regional and global levels. For example, an increase in the global temperature results in an increased evapotranspiration rate and consequently modifies precipitation and hydrological characteristics, and the occurrence and severity of hydrological extreme events, such as floods and droughts, are influenced by their frequency and intensity. These changes affect the total amount of water resources and their redistribution on the spatiotemporal scale [6,7,8]. Human-induced land use alterations, including the construction of water conservancy projects, deforestation, urbanization, and the restoration of vegetation, have a substantial influence on hydrological processes and the spatiotemporal distribution of water resources within river basins. These modifications make a substantial contribution to the sustainable development of the socio-economy and the ecological environment [9,10].
A river’s flow plays a crucial role in maintaining the hydrological balance within a basin, making it highly significant for improving the local ecological environment and fostering economic growth on a larger scale [11]. The accurate evaluation of the individual effects of climate change and human activities on runoff fluctuations provides essential guidance for efficient watershed water resource management, making a substantial contribution to the achievement of sustainable development goals. Hence, it is crucial to regard climate change and human activities as distinct factors that exert influence and to utilize long-term runoff data to quantify and attribute runoff variability for both factors at different time scales [3]. Climate factors, including precipitation, temperature, and potential evapotranspiration, can be easily quantified by simulating a precipitation runoff model with a strong physical mechanism. However, human activity factors indicate an extremely complex mechanism due to their inherent randomness and arbitrariness. Furthermore, aligning the spatiotemporal scale of these activities with the runoff process is challenging, and even the influence of human activities on runoff usually lacks a well-defined physical mechanism.
There are three main approaches to unraveling the impacts of climate change and human activities on the complex processes that regulate runoff. The first one involves a statistical approach based on observed hydrometeorological data [12,13,14,15,16,17,18]. This method is straightforward but lacks a physical basis, and it requires highly accurate, long-term statistical data, thus limiting its application. The second one is a sensitivity coefficient method based on the Budyko hydrothermal coupling equilibrium equation [19,20,21,22,23]. This method offers a certain physical mechanism, a simple calculation process, and straightforward parameter calculation. Nevertheless, it is important to note that these methodologies are limited in their applicability solely to multi-year and annual scales, and they thereby can potentially fail to comprehensively quantify the effects of various human activities and the underlying surface modifications on the hydrological dynamics of a given basin. The last approach involves the hydrologic model method [24,25,26,27]. This model demonstrates a strong physical mechanism, effectively explaining and attributing runoff change, and it can simulate and restore runoff changes at different time scales from days to years. However, the model structure is relatively complex and may involve a large number of parameters with associated uncertainties. The complex interplay between the underlying surface conditions and climate factors within a basin is intricate and multifaceted, demanding high-quality data, especially for distributed hydrological models. It is important to note that the specific impacts of climate and human activities, as determined by various attribution analysis methods, may exhibit inconsistencies, even within the same basin. These discrepancies highlight the uncertainties associated with the chosen methodology [28].
The Yellow River basin in China stands out as one of the foremost regions grappling with acute water scarcity and significant soil erosion. In recent decades, significant changes have occurred in the hydrological system of this basin, largely due to the combined influence of climate change and human activities [29,30]. To tackle the urgent issues related to soil and water erosion in the Yellow River basin, a wide range of diligent measures for soil and water conservation have been comprehensively implemented. These measures encompass an extensive scope of ecological restoration initiatives alongside the implementation of landscape engineering interventions. For instance, measures like constructing terraces, implementing water diversion projects, and developing reservoirs have been undertaken [29,31,32].
The Xiliugou basin is located within the Ten Kongduis basin, which is situated in the upstream region of the Yellow River basin. It is an ecologically fragile area with an interlacing distribution of sandstone, desert, and floodplain. The region exhibits a significant spatial heterogeneity on a regional scale and is highly sensitive to human disturbance and climate change. The Xiliugou basin experiences a limited availability of water resources. With the development of mineral resources, industrial growth, urban sprawl, and increased groundwater exploitation, the problem of water resource scarcity has intensified. However, limited comprehensive investigations have been conducted on the factors influencing changes in runoff across the Xiliugou basin. Therefore, the main objective of our study is to thoroughly examine the drivers of runoff change in this basin. By employing various methodologies, our aim is to discern the distinct impacts of climate change and human activities on the observed patterns of runoff. This research endeavor is of significant importance, as it can provide valuable insights for informed decision-making in areas such as land use planning, water resource management, and the promotion of sustainable development within the Xiliugou basin.
For the purpose of our investigation, the Xiliugou basin was chosen as the focal area. In our research, we employed the nonparametric Mann–Kendall (MK) test to identify possible abrupt change points in the runoff patterns covering the period from 1960 to 2020. To enhance the investigation, the study period was divided into two separate periods, namely the baseline period and the impact period, considering the identified abrupt change points. Following this division, six separation methods were employed in our research. These approaches encompassed two statistical methods, namely the sensitivity coefficient method utilizing the Budyko equation and the utilization of three hydrology models. The primary aim of employing these methods was to effectively distinguish and quantify the respective contributions of climate variations and human activities to the observed runoff changes. The objectives of this study are as follows: (1) to identify abrupt change points in runoff within the Xiliugou basin; (2) to utilize different methodologies to discern the impacts of climate change and human activities on runoff; and (3) to analyze the discrepancies in the effects of climate change and human activities on runoff changes resulting from the use of different methods and summarize the main factors causing runoff change.

2. Materials and Methods

2.1. Study Region

Situated within the Ten Kongduis basin in Ordos and positioned on the right bank of the Yellow River, the Xiliugou basin occupies a central location, with its specific coordinates being E109°24′~110°00′ and N39°47′~40°30′ (Figure 1). The control area above Longtouguai hydrological station is 1157 km2, and the altitude varies from 1044 to 1551 m. The Xiliugou basin experiences a semi-arid continental climate, characterized by lengthy cold winters and brief hot summers. The average annual temperature within the basin is approximately 6 °C, the average annual wind speed is 3.7 m·s−1, the annual rainfall is 240–360 mm, and the potential evaporation is 2200 mm. The distribution of rainfall and runoff within this basin exhibits seasonal variations with uneven patterns throughout the year. Notably, during the flood season (June–September), the rainfall accounts for approximately 82% of the total annual precipitation. The rainfall in the flood season tends to be concentrated and takes the form of heavy rain, resulting in sharp changes in the flood level. It serves as a critical source of coarse sand in the Yellow River, China. In recent decades, several strategies have been employed to promote vegetation restoration in the basin, such as the implementation of soil and water conservation techniques and the conversion of agricultural land into forested or grassy areas. These endeavors have led to a remarkable growth in vegetation coverage within the region. As a result, there has been a noticeable alteration in land use and cover, leading to a substantial decrease in both runoff and sediment [33].

2.2. Data

Comprehensive meteorological data, including daily precipitation, temperatures, sunshine duration, specific humidity, and wind speed, were diligently collected from the National Meteorological Information Center of China (https://www.nmic.cn/, 8 August 2022). This comprehensive dataset spans a significant timeframe, ranging from 1960 to 2020. To acquire monthly runoff information specifically for the Longtouguai hydrological station within the aforementioned period, we extensively consulted the esteemed Hydrological Yearbook of the People’s Republic of China for accurate references and information. The leaf area index (LAI) data for the period from 1982 to 2020 were acquired from the reputable Global LAnd Surface Satellite (GLASS) and the Advanced Very-High-Resolution Radiometer (AVHRR) LAI product. These datasets were integrated into the proficient Google Earth Engine platform for seamless analysis. These detailed records exhibit an outstanding spatial resolution of 0.05° and a temporal resolution of every 8 days. Additionally, we diligently acquired a digital elevation model (DEM) with a resolution of 30 m from the renowned NASA Advanced Spaceborne Thermal Emission and Reflection Radiometer Global Digital Elevation Model (ASTER GDEM) (https://lpdaac.usgs.gov/, 2 August 2022). Subsequently, we precisely extracted the underlying surface data, encompassing crucial elements such as soil properties (including physicochemical aspects), a 1:100,000 soil distribution map, and the crucial land use/land cover (LULC) data, all possessing a remarkable 30 m resolution. These invaluable resources were collected from the renowned Chinese Academy of Sciences’ Data Center for Resources and Environmental Sciences (https://www.resdc.cn, 18 August 2022), with a specific focus on the noteworthy time period of the 1980s.

2.3. Trend Analysis and Abrupt Change Detection

The widely employed nonparametric Mann–Kendall (MK) method [34,35] has found extensive application in the analysis of trends and sudden shifts in hydrometeorological time series. In this study, the MK method was applied to estimate annual runoff trends and abrupt points in the Longtouguai hydrological station.

2.4. Six Methods for Attribution Analysis of Runoff Change

2.4.1. Precipitation–Runoff Double Mass Curve (DMC) Method

The double mass curve technique plays a vital role in investigating the coherence and connection between two variables. It involves examining the gradient of cumulatively accumulated values of the two variables over various time periods, which are then plotted on a Cartesian coordinate system [36]. In this study, the variable used as a reference or independent variable, represented by x, signifies precipitation, while the test variable or dependent variable, denoted as y, represents runoff. The notation of xi and yi is employed to represent N years of observations, where i ranges from 1 to N.
To commence the analysis, the cumulative yearly values of x and y can be computed using Formulas (1) and (2), respectively. The utilization of these formulas enables the determination of yearly cumulative series, denoted as Xi and Yi, which is achieved through the following calculations:
X i = i = 1 N   x i
Y i = i = 1 N   y i
Subsequently, a relationship curve is constructed within a rectangular coordinate system to graphically depict the cumulative values of the two variables. This curve serves as a visual representation of the association between the accumulated values of the respective variables. In the absence of any systematic bias in the dependent variable or test variable, the cumulative curve exhibits a linear pattern. An upward bias indicates an increase, while a downward bias suggests a decrease.

2.4.2. Slope Change Ratio of Cumulative Quantity (SCRCQ) Method

The SCRCQ method [17] serves as a valuable tool for quantifying and distinguishing the relative influences exerted by these two factors on the observed changes in runoff. This approach can be used by two ways: (1) reflecting climate change only by precipitation to estimate its contribution rate, and (2) reflecting climate change comprehensively by precipitation and temperature. Within the scope of this study, the climate change factors under investigation encompassed precipitation and temperature. These variables were carefully chosen as key indicators to better comprehend the dynamics of climate change within the analyzed context.
To commence the analysis, the calculation of the slope for cumulative runoff, cumulative precipitation, and cumulative temperature was conducted individually for both the baseline period and the period of change. These slopes are denoted as SRa, SPa, and STa for the baseline period and SRb, SPb, and STb for the change period. By calculating the difference between the slopes of the baseline period and the change period, we can determine the rates of change for cumulative runoff (RR), cumulative precipitation (RP), and cumulative temperature (RT). It is important to note that in this method, precipitation and runoff were assumed to exhibit a positive correlation, while temperature and runoff considered to exhibit a negative correlation. Furthermore, we defined the attribution of precipitation (ηP) and temperature (ηT) to the variability in runoff as follows:
η P = R P / R R × 100 %
η T = R T / R R × 100 %
We calculated and quantified the respective impacts of climate change (ηC) and human activities (ηH) on the observed alterations in runoff through the following calculations:
η C = η P + η T
η H = 1 η C

2.4.3. Sensitivity Coefficient Methods by the Budyko Equation

The Budyko theory provides a comprehensive framework for understanding the distribution mechanism of precipitation between runoff and evapotranspiration, offering insights into the intricate coupling between water and energy within a given basin. This theory delves into the fundamental principles that govern the interplay of water and energy dynamics, shedding light on the intricate relationship between these two crucial components. This study used the Budyko equation for Fu’s formula [37] to study the attribution analysis of runoff change:
E P = 1 Q P = 1 + E P P 1 + E P P ω 1 / ω
where Q represents the average annual runoff depth (mm), P signifies the average annual precipitation (mm), E denotes the average annual evapotranspiration (mm), and EP corresponds to the average annual potential evapotranspiration (mm). Furthermore, the basin-specific parameters are represented by the symbol ω.
To accurately assess the influence of climate elements, specifically precipitation (P) and potential evapotranspiration (EP) on runoff, we utilized the sensitivity coefficient technique. This approach facilitates the computation of runoff sensitivity to changes in P and EP, enabling a rigorous and quantitative assessment of their respective influences:
Δ Q C = Q P Δ P + Q E P Δ E P
where the runoff change caused by this phenomenon is represented by ΔQC. The sensitivity coefficients of runoff with respect to P and EP are denoted by Q P and Q E P , respectively, and ΔP and ΔEP represent the changes in precipitation and potential evapotranspiration, respectively.
The calculation of sensitivity coefficients was conducted as follows:
Q P = P ω 1 E P ω + P ω 1 ω 1
Q E P = E P ω 1 E P ω + P ω 1 ω 1 1
When evaluating the influence of human activities on runoff, it is possible to quantify the alterations in runoff caused by these activities. This calculation involves determining the alteration in runoff attributable to human interventions:
Δ Q H = Δ Q Δ Q C
where the alteration in runoff attributed specifically to human activities is represented as ΔQH. It is crucial to distinguish ΔQH from the overall actual change in runoff, represented as ΔQ, in order to separate and quantify the distinct impact of human interventions on changes in runoff.

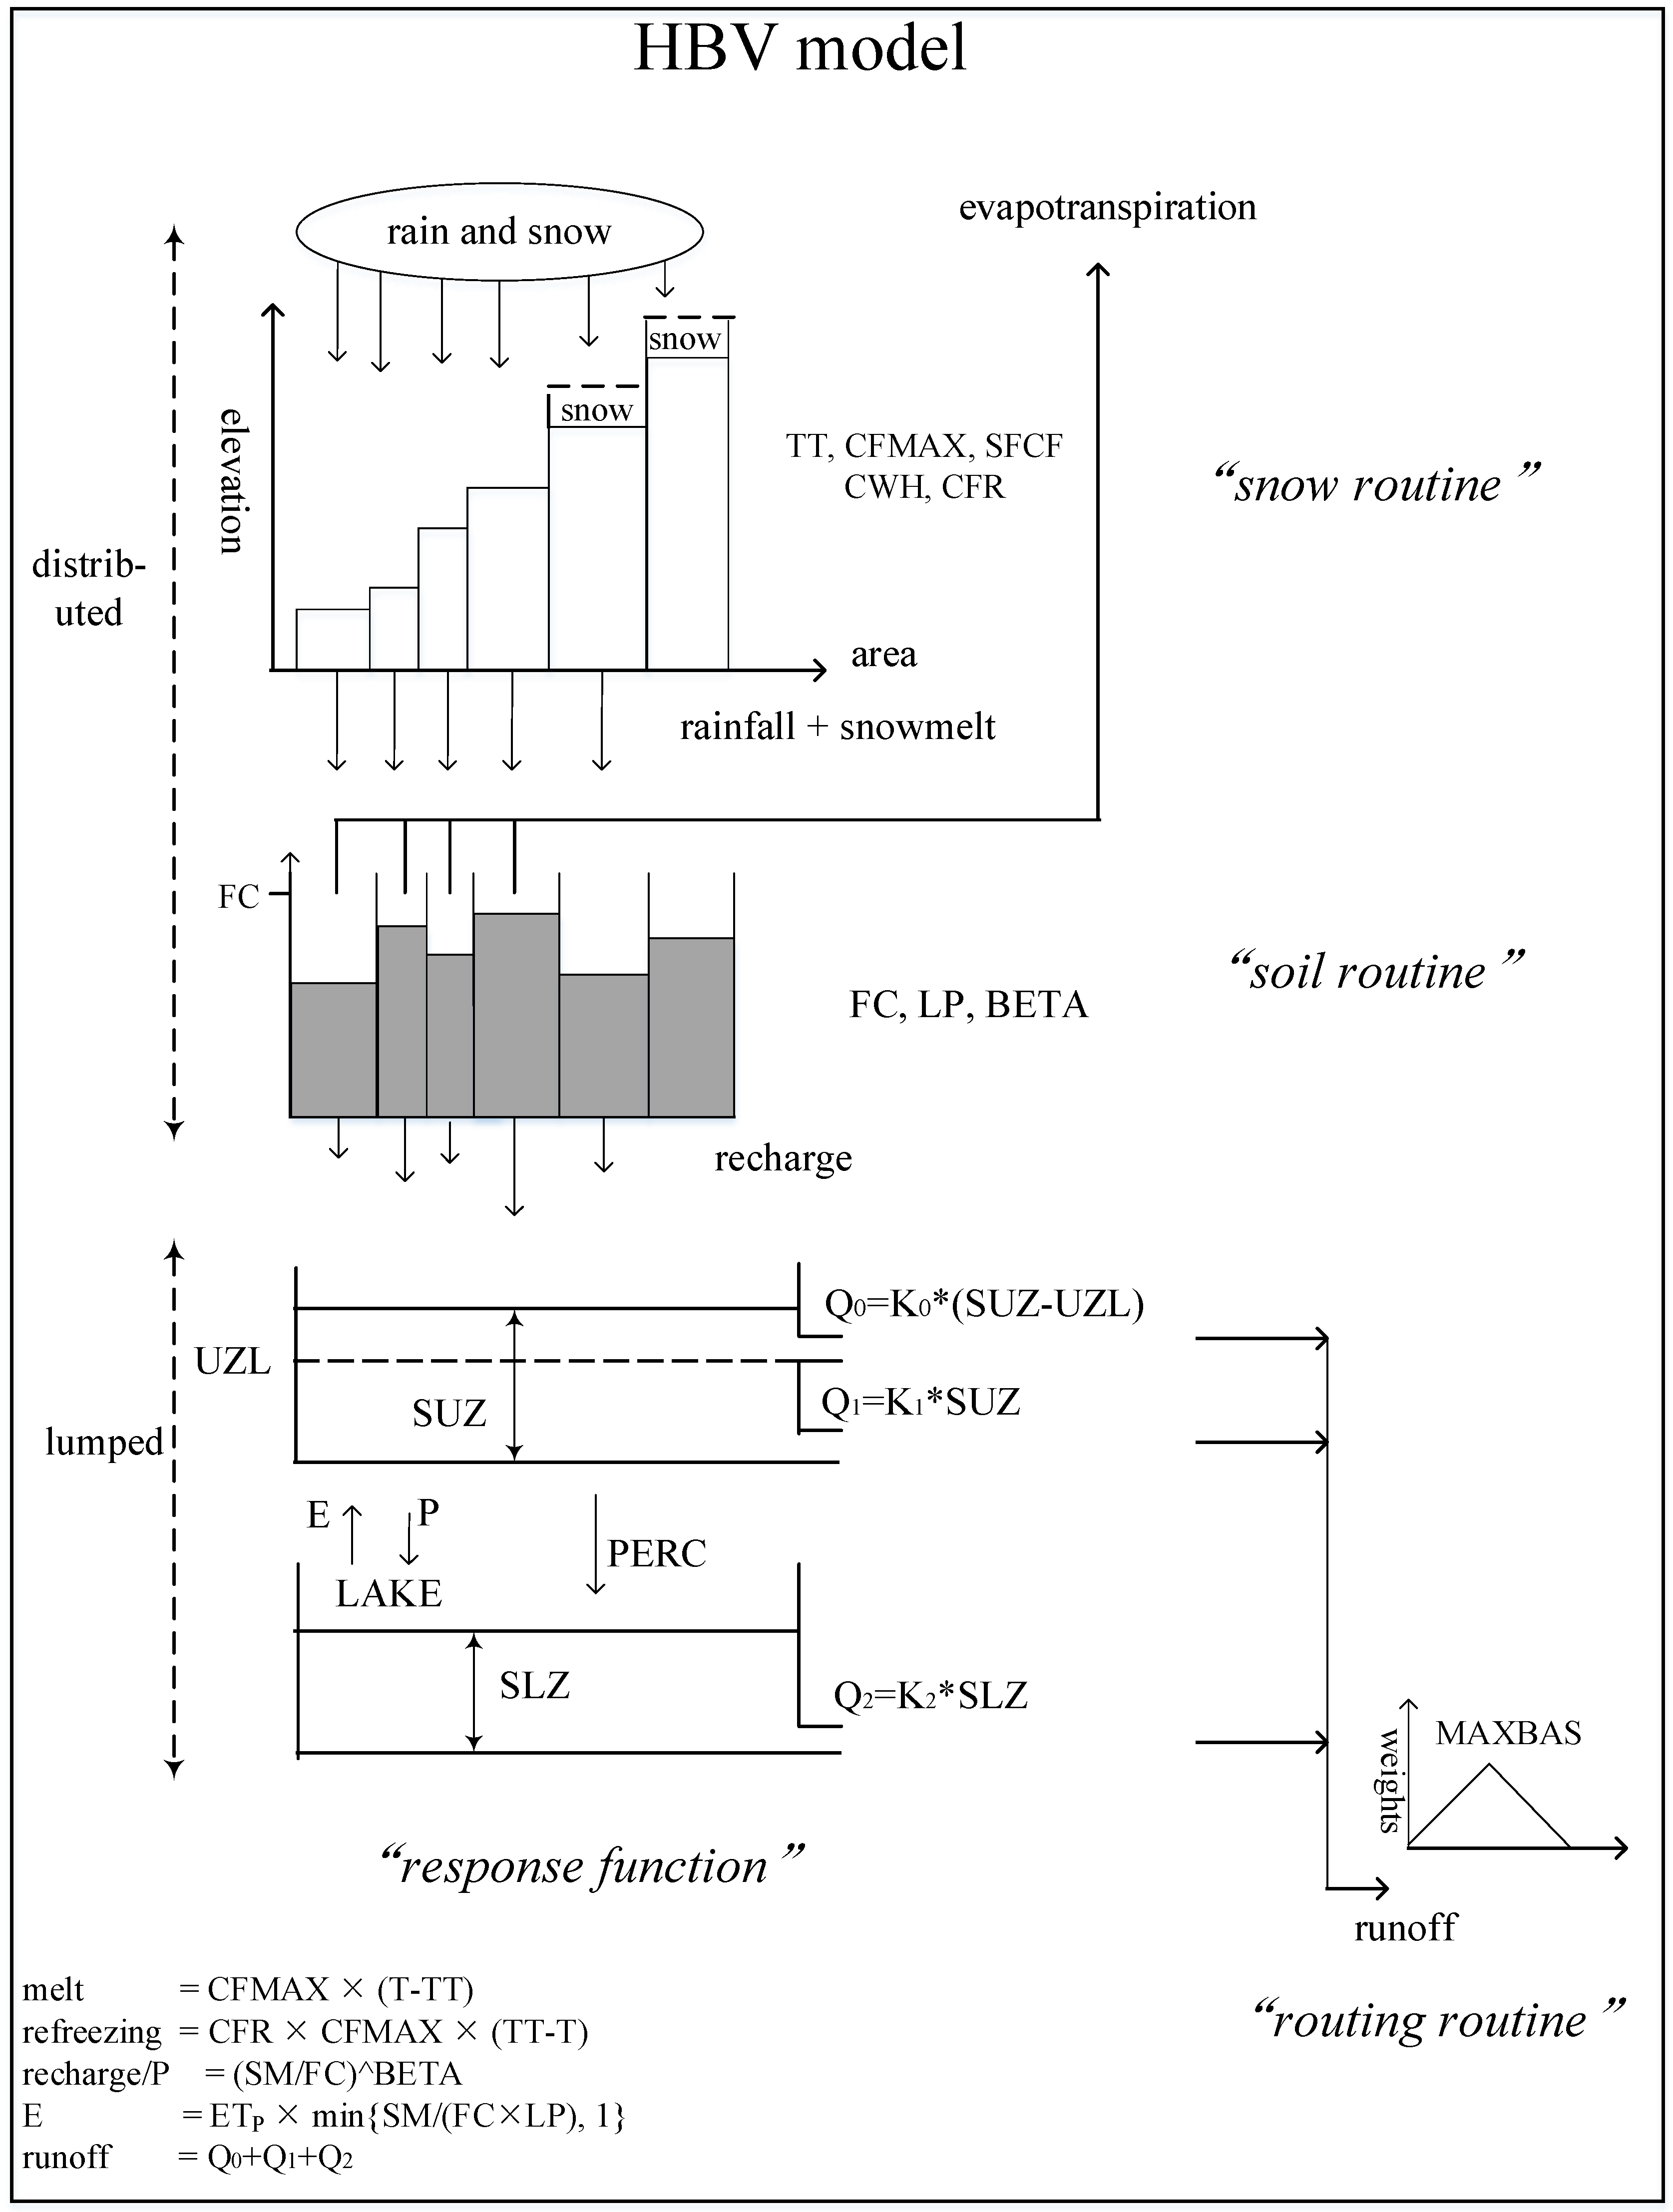
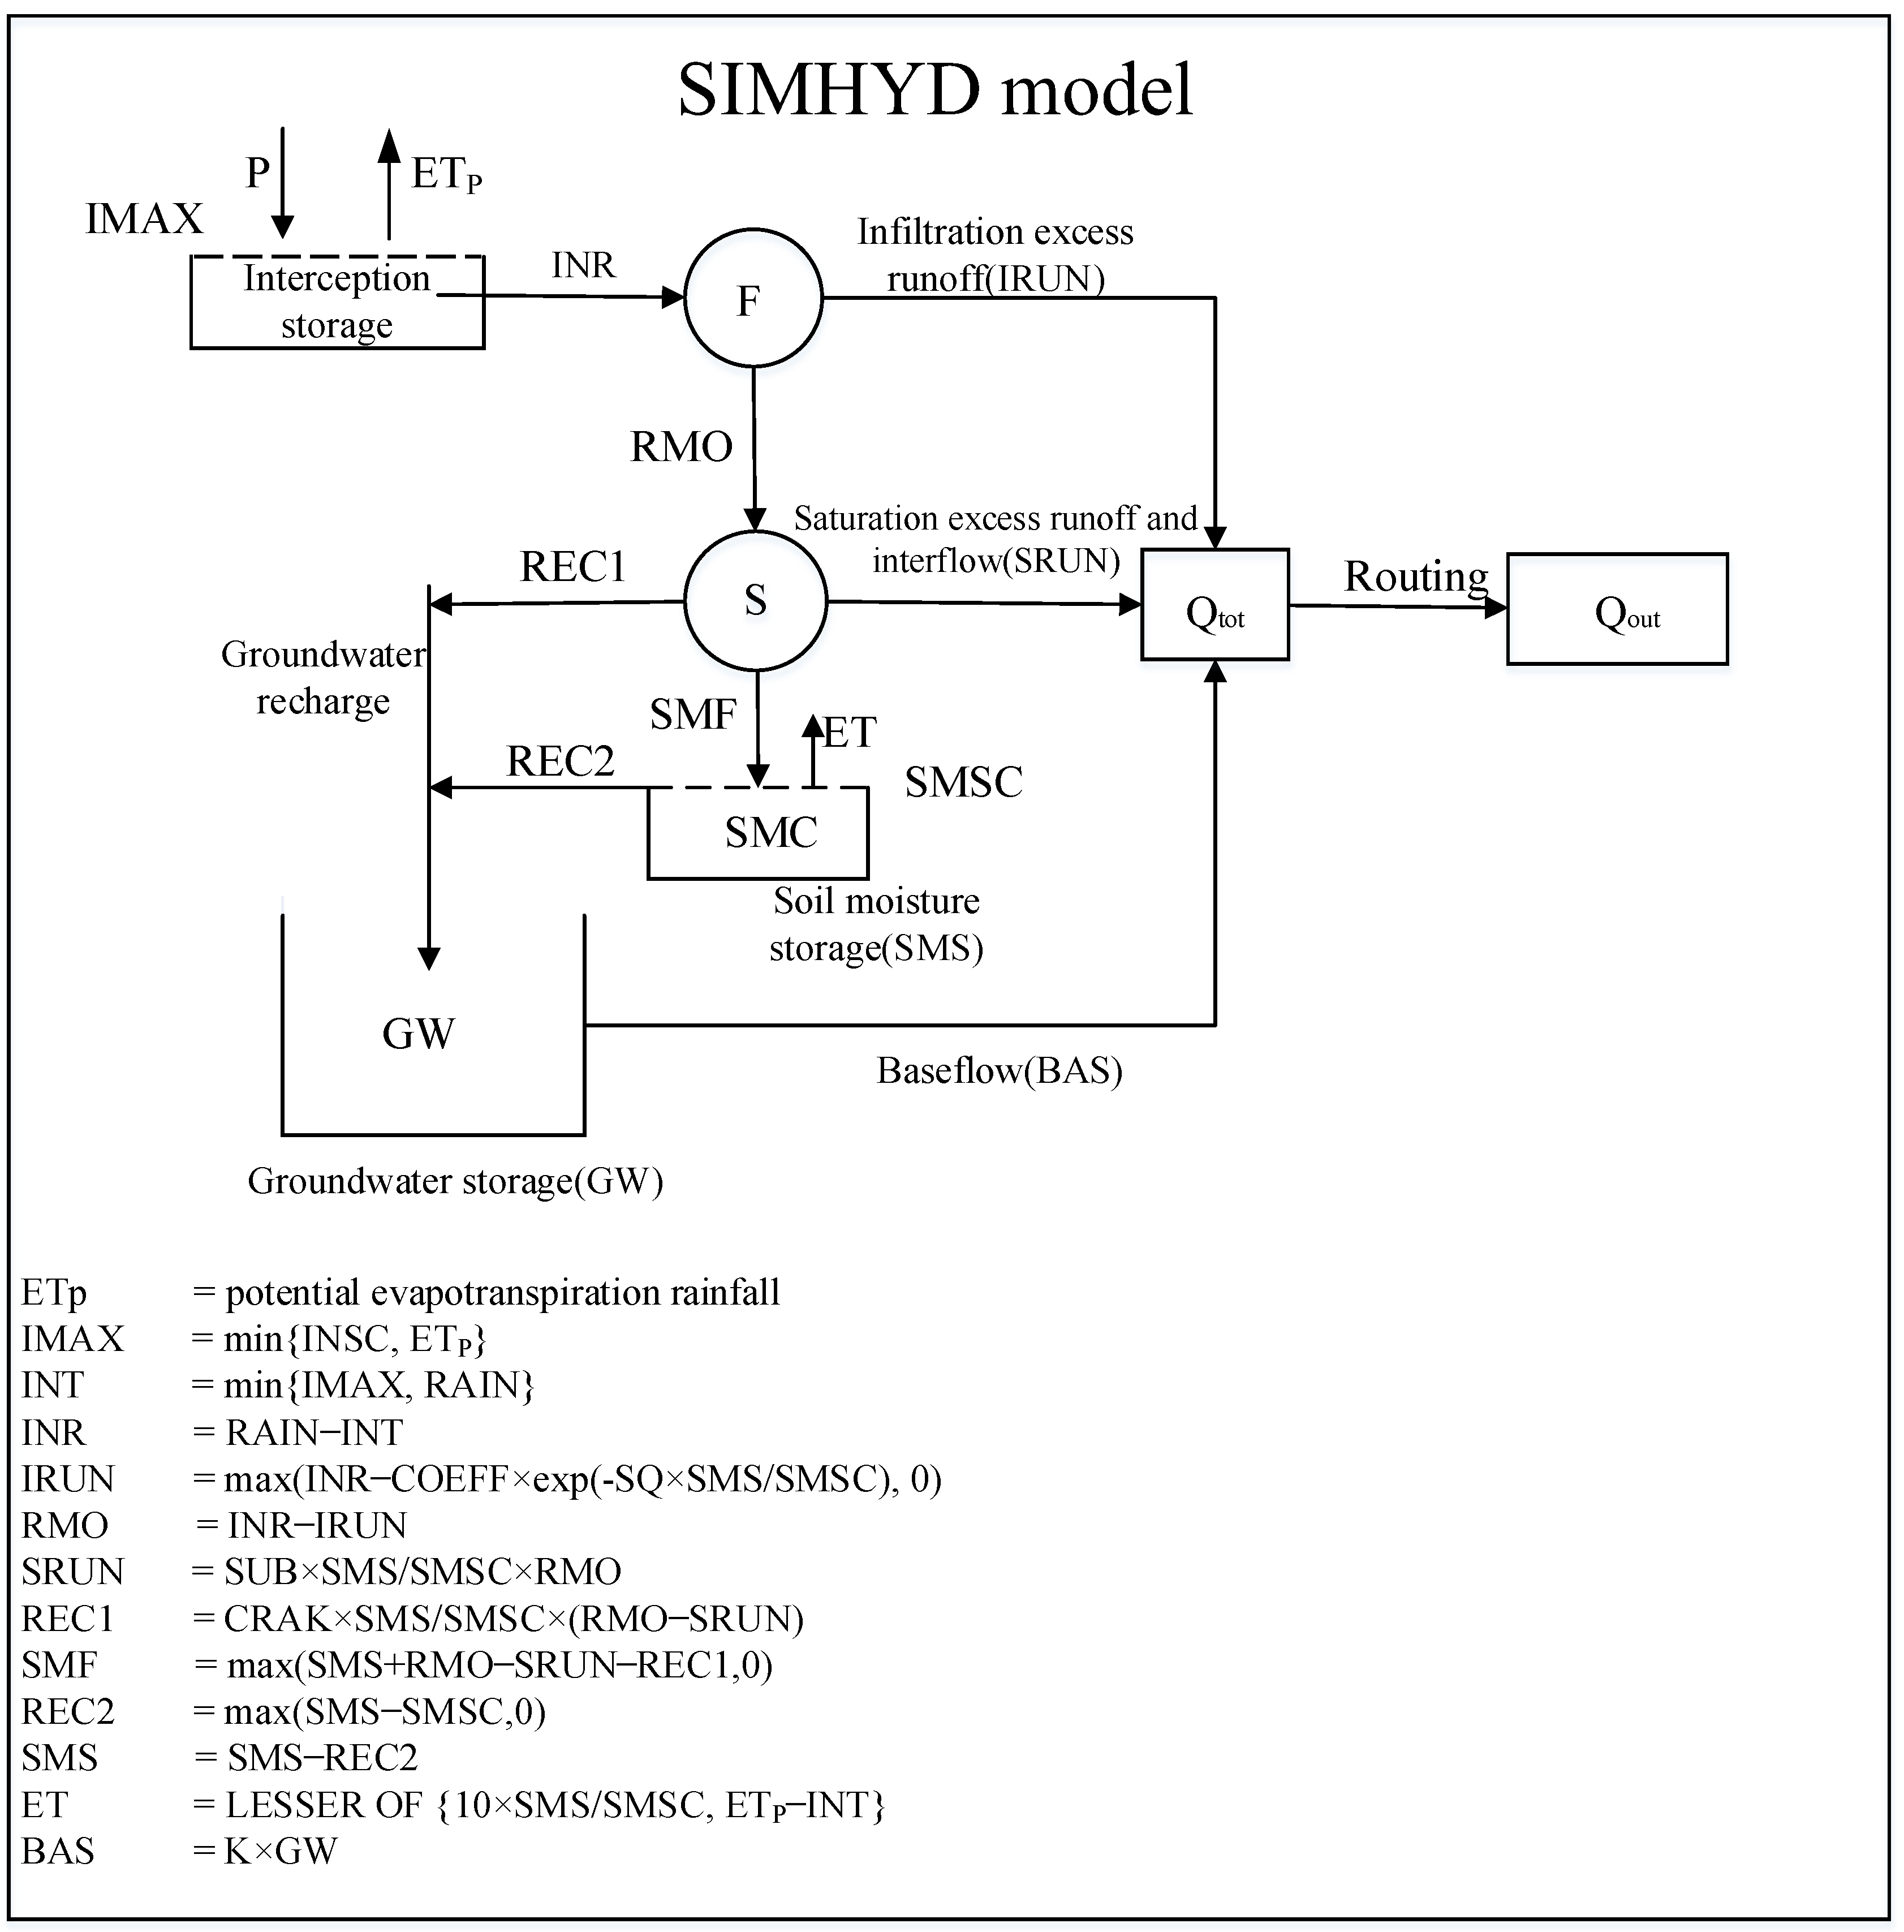
2.4.4. HBV and SIMHYD Hydrological Model

The Hydrologiska Byrans Vattenbalansavdelning (HBV) hydrological model [38] and SIMulation of HYDrology (SIMHYD) [39,40,41,42,43] are two conceptual precipitation runoff models. These models exhibit their proficiency in establishing the connections between precipitation, evaporation, and runoff. Moreover, they integrate modifications in soil, water and groundwater processes using a set of precise mathematical equations. These equations form the basis for accurately simulating and analyzing the intricate dynamics of a hydrological system.
The HBV model structure is mainly composed of a snow melting module, a soil moisture module, and a production confluence module. The specific model structure is shown in Figure 2.
The SIMHYD model comprises three main elements: surface runoff, soil water movement, and subsurface flow. The fundamental structure of the model is depicted in Figure 3.

2.4.5. SWAT Hydrological Model

The Soil and Water Assessment Tool (SWAT) model, established by the United States Department of Agriculture, is a widely acknowledged and extensively employed physically based model at a large scale [44,45]. SWAT incorporates a comprehensive set of physical principles and mathematical algorithms to accurately represent the complex dynamics of a soil–water system. It includes several modules, such as a hydrology module, a sediment transport module, and a nutrient transport module, etc. This model has a wide range of applicability, including basin water balance accounting. Additionally, it facilitates explorations into the impact of management strategies, as well as variations in climate and land use, on both the quantity and quality of water within basins. The versatility and robustness of this model make it an invaluable tool for the comprehensive and accurate analysis of hydrological processes and their associated environmental impacts. The model corresponds each process of the hydrological cycle to different sub-modules through modular modeling, and each module can be run independently or combined, which is conducive to expansion and application. The hydrological module includes numerous variables, such as evapotranspiration, river discharge, surface runoff, soil water transport, groundwater recharge, etc., realizing the calculation and simulation of the hydrological cycle. The SWAT model is divided into a sub-basin calculation module and a channel production and confluence module influenced by the underlying surface properties and rainfall processes.
The basis of this model is built upon the water balance equation, which can be represented as follows:
S W t = S W 0 + i = 1 t   P d a y , i Q s u r f , i E a , i W seep , i Q g w , i
where SWt (mm) represents the soil water storage at a specific time, SW0 (mm) indicates the initial soil water storage, t denotes the time, Pday,i (mm) signifies precipitation on the ith day, Qsurf,i (mm) denotes the surface runoff on the ith day, Ea,i (mm) represents the evapotranspiration on the ith day, Wseep,i (mm) indicates the amount of water infiltration on the ith day, and Qgw,i (mm) represents the return flow from the groundwater on the ith day.

2.5. Calibration and Verification of HBV and SIMHYD Models

To optimize the parameters of the HBV and SIMHYD hydrological models, a widely recognized global optimizer called the particle swarm optimization (PSO) toolbox [46] was employed. These specific values were selected to ensure an effective exploration of the solution space, leading to the identification of the most optimal solution.
The two hydrological models underwent a rigorous calibration and validation process, utilizing the monthly runoff data from the baseline period. For calibration purposes, 70% of the available data were employed, while the remaining 30% were reserved for validation. For the purpose of model calibration in this study, the Nash–Sutcliffe efficiency (NSE) [47] was chosen as the objective function. This widely recognized metric serves as a reliable indicator of model performance and enabled a robust assessment of the model’s ability to accurately replicate the observed runoff patterns:
F = 1 N S E + 5 | L N 1 + B i a s | 2.5
N S E = 1 i = 1 N Q o b s , i Q s i m , i 2 i = 1 N Q o b s , i Q o b s ¯ 2
B i a s = i = 1 N Q o b s , i i = 1 N Q s i m , i i = 1 N Q o b s , i
where the NSE (Nash–Sutcliffe efficiency) was calculated by comparing the simulated monthly runoff (Qsim) with the observed monthly runoff (Qobs). The NSE was determined using the average value of the observed monthly runoff, with “i” representing the ith month and “N” denoting the total number of months in the calibration period. The F value was minimized during the calibration to enhance the model’s performance and its ability to accurately replicate the observed runoff patterns. The NSE value serves as a robust metric to evaluate and compare the results of the calibration and verification processes, providing valuable insights into the accuracy and reliability of the hydrological models.

2.6. Calibration and Verification of SWAT Model

In this study, the calibration and verification of the model parameters were carried out utilizing the SWAT-CUP Premium tool (https://www.2w2e.com/, 10 October 2022). This tool offers advanced features for rigorous model evaluation. The calibration and validation of the SWAT model were proficiently performed using the monthly runoff data from the baseline period. To ensure an accurate representation of the hydrological processes, 70% of the available data were allocated for calibration, while the remaining 30% were dedicated to validation. This systematic approach enabled the identification of optimal parameter values and ensured the model’s ability to effectively reproduce the observed runoff patterns.
During the calibration and validation processes, a comprehensive objective function, denoted as F, was implemented in SWAT-CUP Premium. This function incorporated multiple evaluation metrics, including R2, the Nash–Sutcliffe efficiency (NSE) [47], and Bias. By integrating these diverse criteria, the objective function facilitated a thorough assessment of the model’s performance and enhanced the reliability of the results. Simultaneously considering multiple aspects of model accuracy, precision, and bias, this approach provided a robust framework for both the calibration and verification stages:
F = w3R2 + w5NSE − |w8Bias|
N S E = 1 i = 1 N Q o b s , i Q s i m , i 2 i = 1 N Q o b s , i Q o b s ¯ 2
B i a s = i = 1 N Q o b s , i i = 1 N Q s i m , i i = 1 N Q o b s , i
R 2 = i = 1 N Q o b s , i Q o b s ¯ Q s i m , i Q s i m ¯ 2 i = 1 N Q o b s , i Q o b s ¯ 2 i = 1 N Q s i m , i Q s i m ¯ 2
where the weights (w3, w5, w8) used in the objective function were calculated following the prescribed equations outlined in the SWAT-CUP Premium handbook:
w3 = 1, w5 = |avg_goal_R2/avg_goal_NSE|, w8 = avg_goal_R2/avg_goal_Bias
The findings validated the suitability of these three hydrological models for assessing the attribution on runoff variations in the Xiliugou basin.

2.7. Calculation of Contribution of Climate Factors and Human Activities to Runoff Variations

To quantify the variations in runoff resulting from climate change and human activities, the following equations were utilized for the computation:
Δ Q = Q p a s t Q p r e = Δ Q C + Δ Q H
Δ Q H = Q p a s t Q s i m
Δ Q C = Δ Q Δ Q H = Q s i m Q p r e
where the change in runoff (ΔQ) can be attributed to two primary factors: climate variability (ΔQC) and human activities (ΔQH). To determine their relative contributions, the observed annual average runoff during the baseline period (Qpast) and the change period (Qpre) were utilized. Additionally, the multiyear average simulated runoff (Qsim), which only accounts for the impact of climate factors, was obtained. The relative contributions of climate factors (ηC) and human disturbance (ηH) towards the overall runoff variations were calculated as follows:
η C = Δ Q C Δ Q C + Δ Q H × 100 %
η H = Δ Q H Δ Q C + Δ Q H × 100 %

3. Results

3.1. Abrupt Change analysee of Annual Runoff

The outcomes of the Mann–Kendall (MK) test indicated a statistically significant decrease in the annual runoff (Z = −4.25, p < 0.01). Additionally, a sudden shift was identified in 2006, as depicted in Figure 4.
The precipitation–runoff DMC in the Xiliugou basin was generated based on the identified abrupt change points (refer to Figure 5). The analysis confirmed the validity of the detected abrupt change point in 2006.

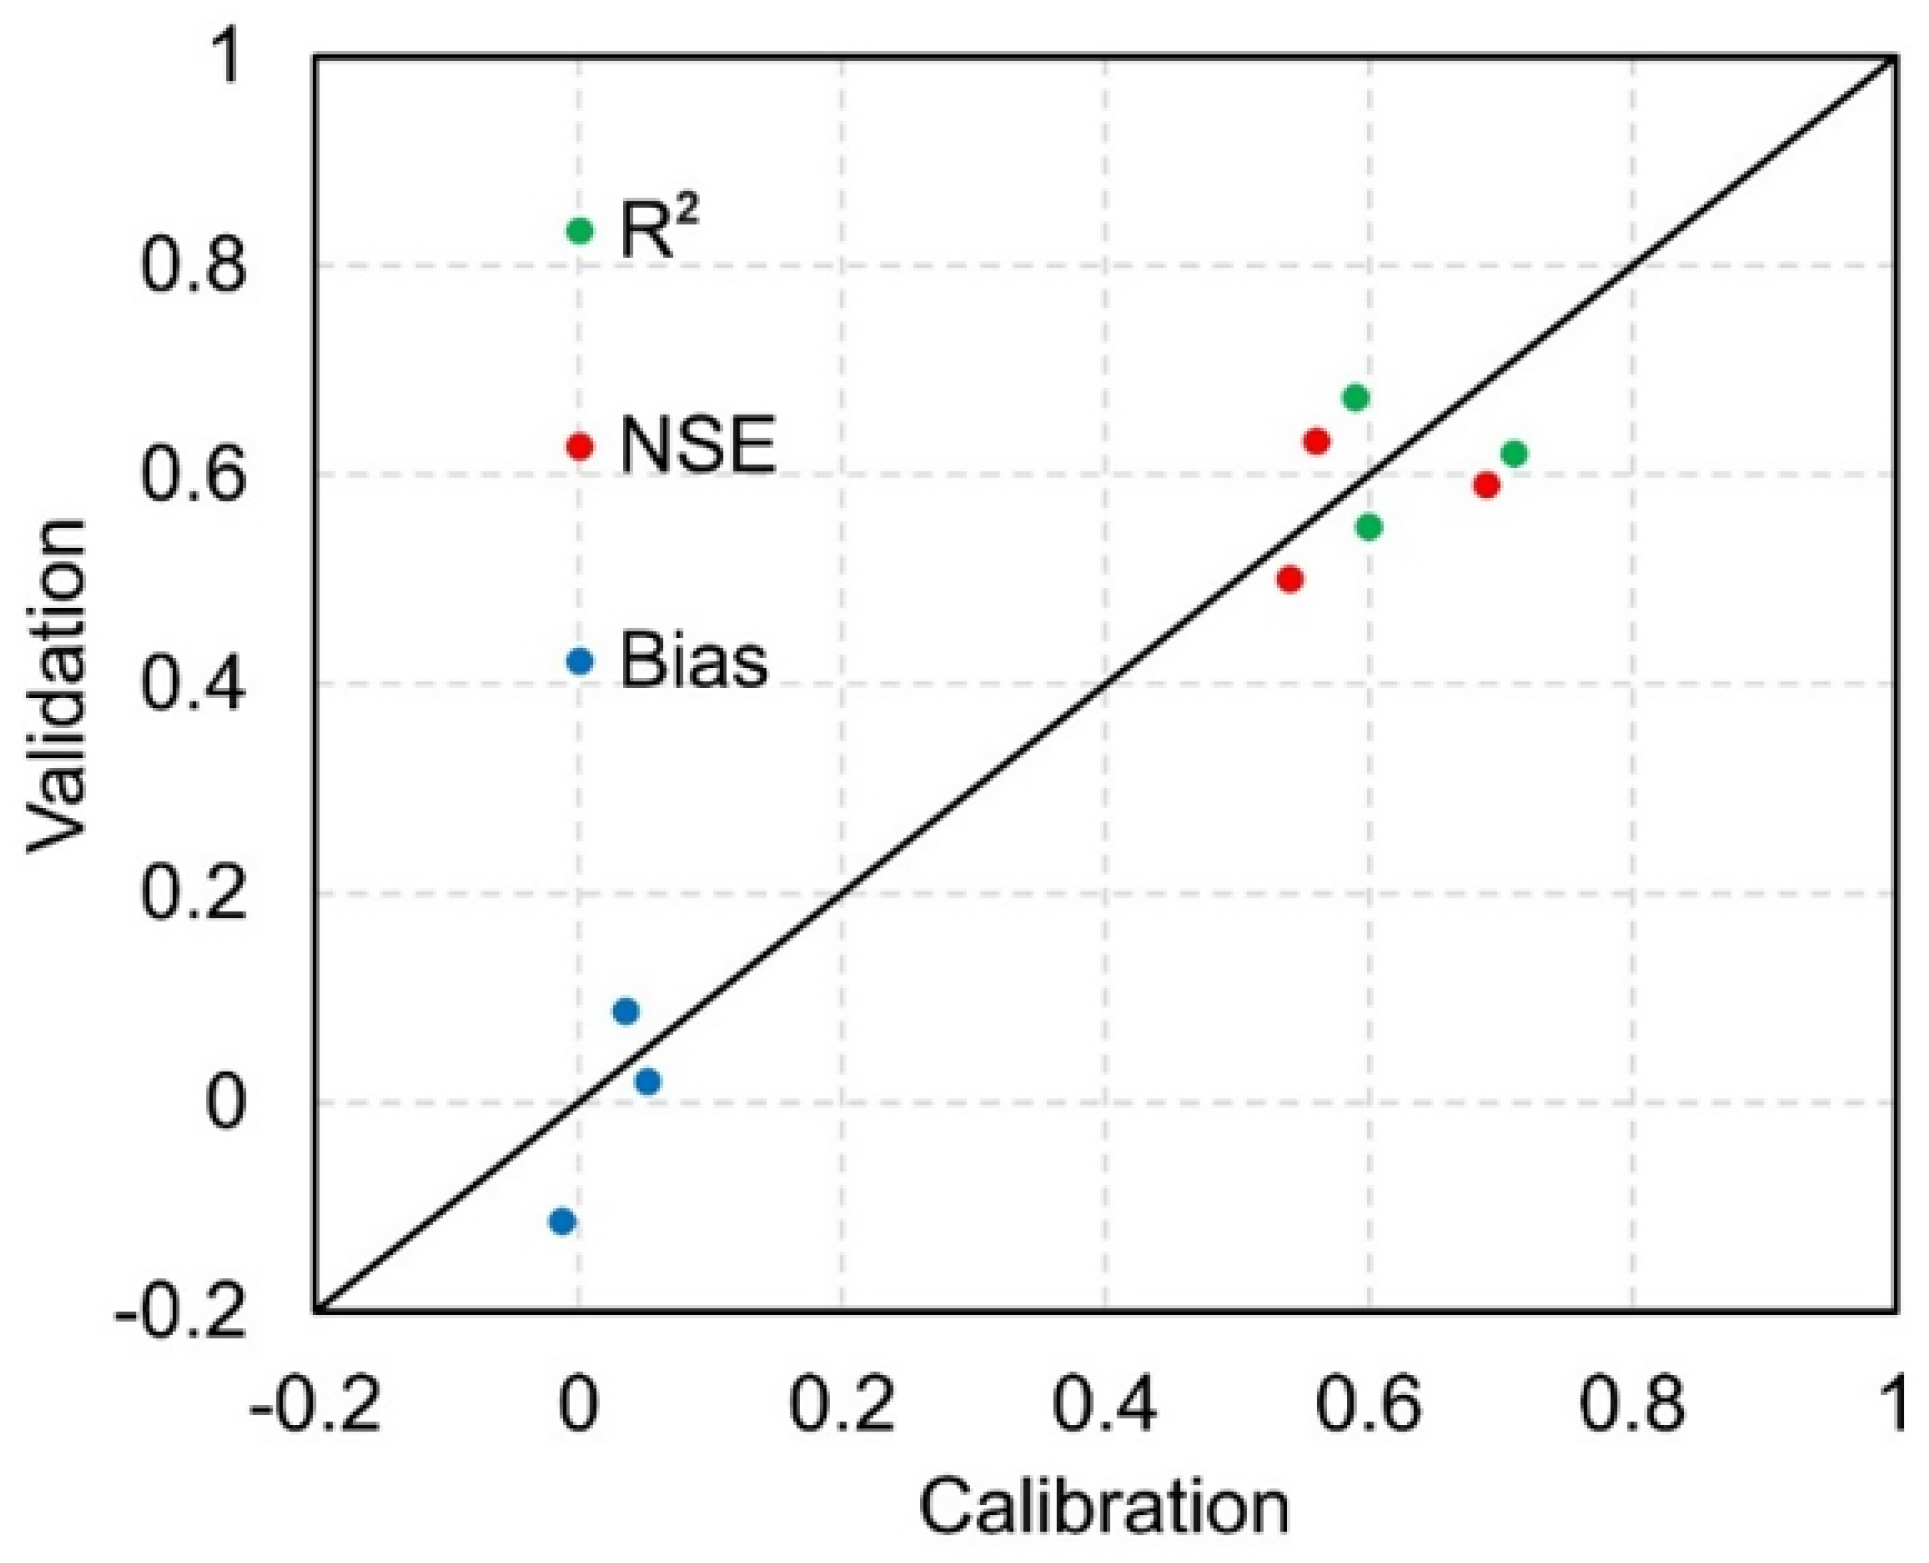
3.2. Calibration and Validation Results of Three Hydrological Models

In this study, the calibration and validation of the model were performed using the baseline period. The calibration period ranged from 1960 to 1992, while the validation period spanned from 1993 to 2006. The hydrology models were evaluated based on multiple criteria, and their performance is illustrated in Figure 6. The assessment indicated satisfactory results, with NSE and R2 values exceeding 0.5 and bias values falling within the acceptable range of ±0.15 during both the calibration and validation periods [43,48]. Consequently, these three hydrology models were considered appropriate for analyzing the effects of climate change and human activities on runoff changes in the Xiliugou basin.

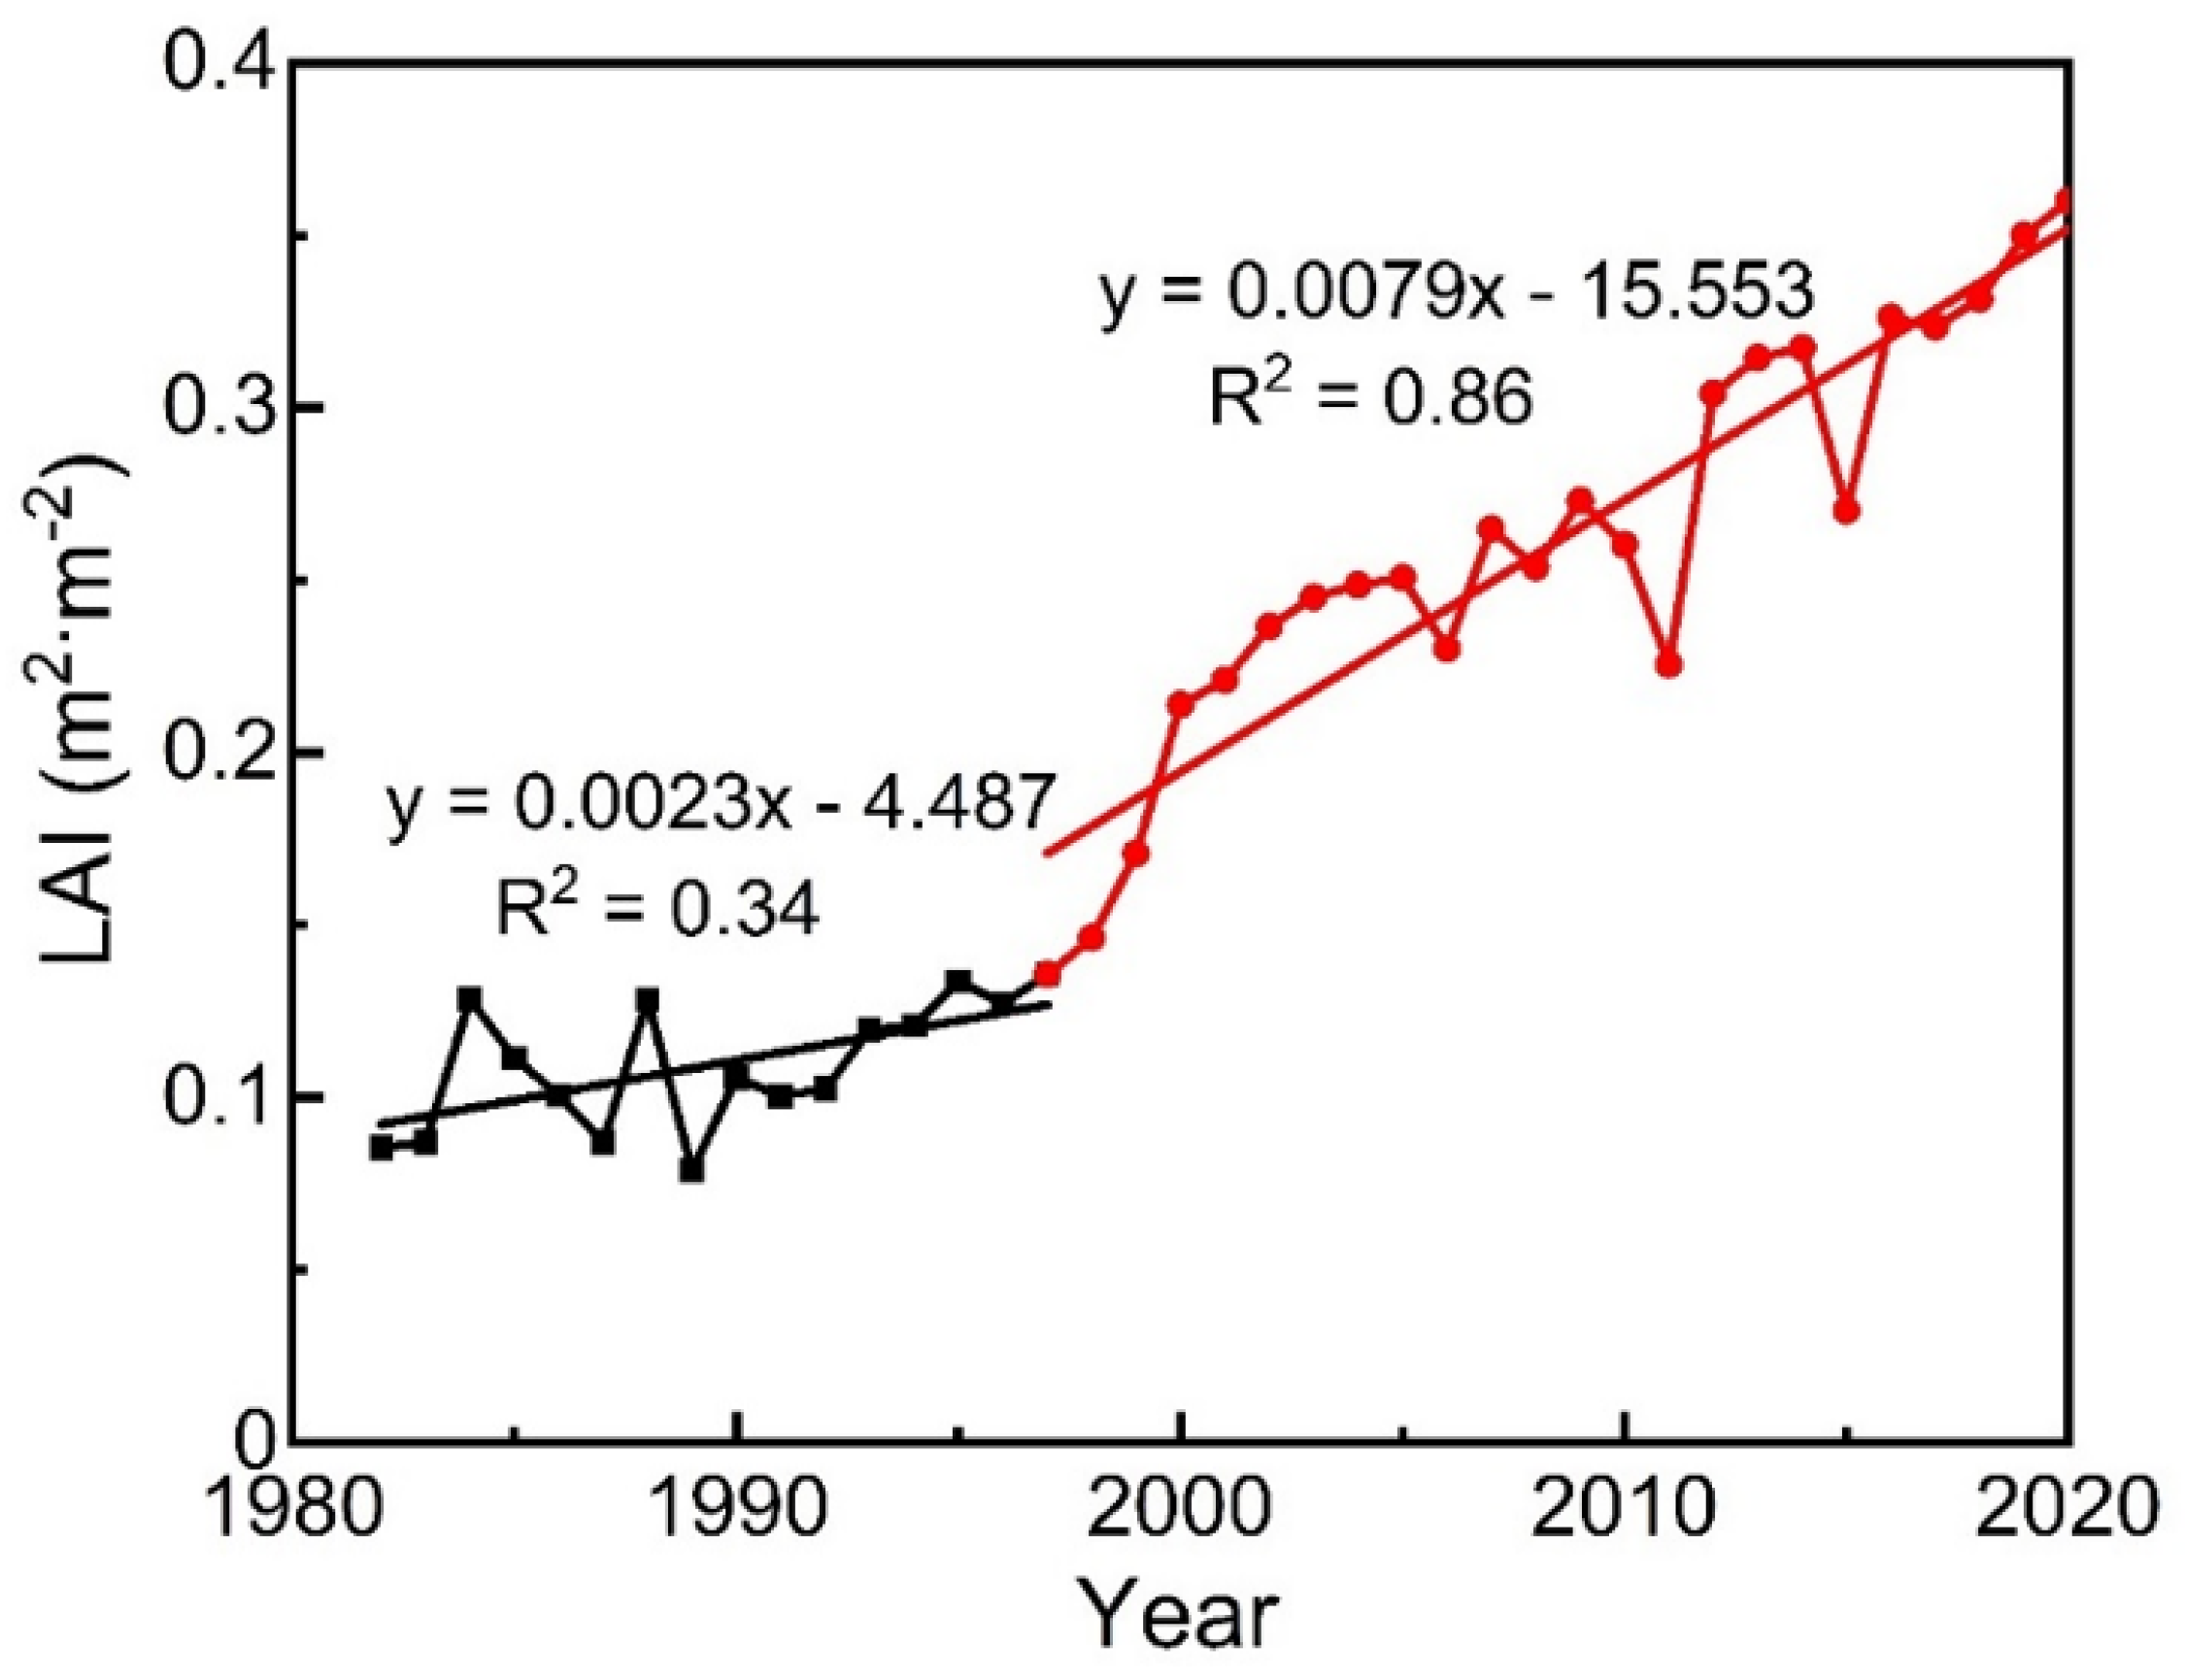
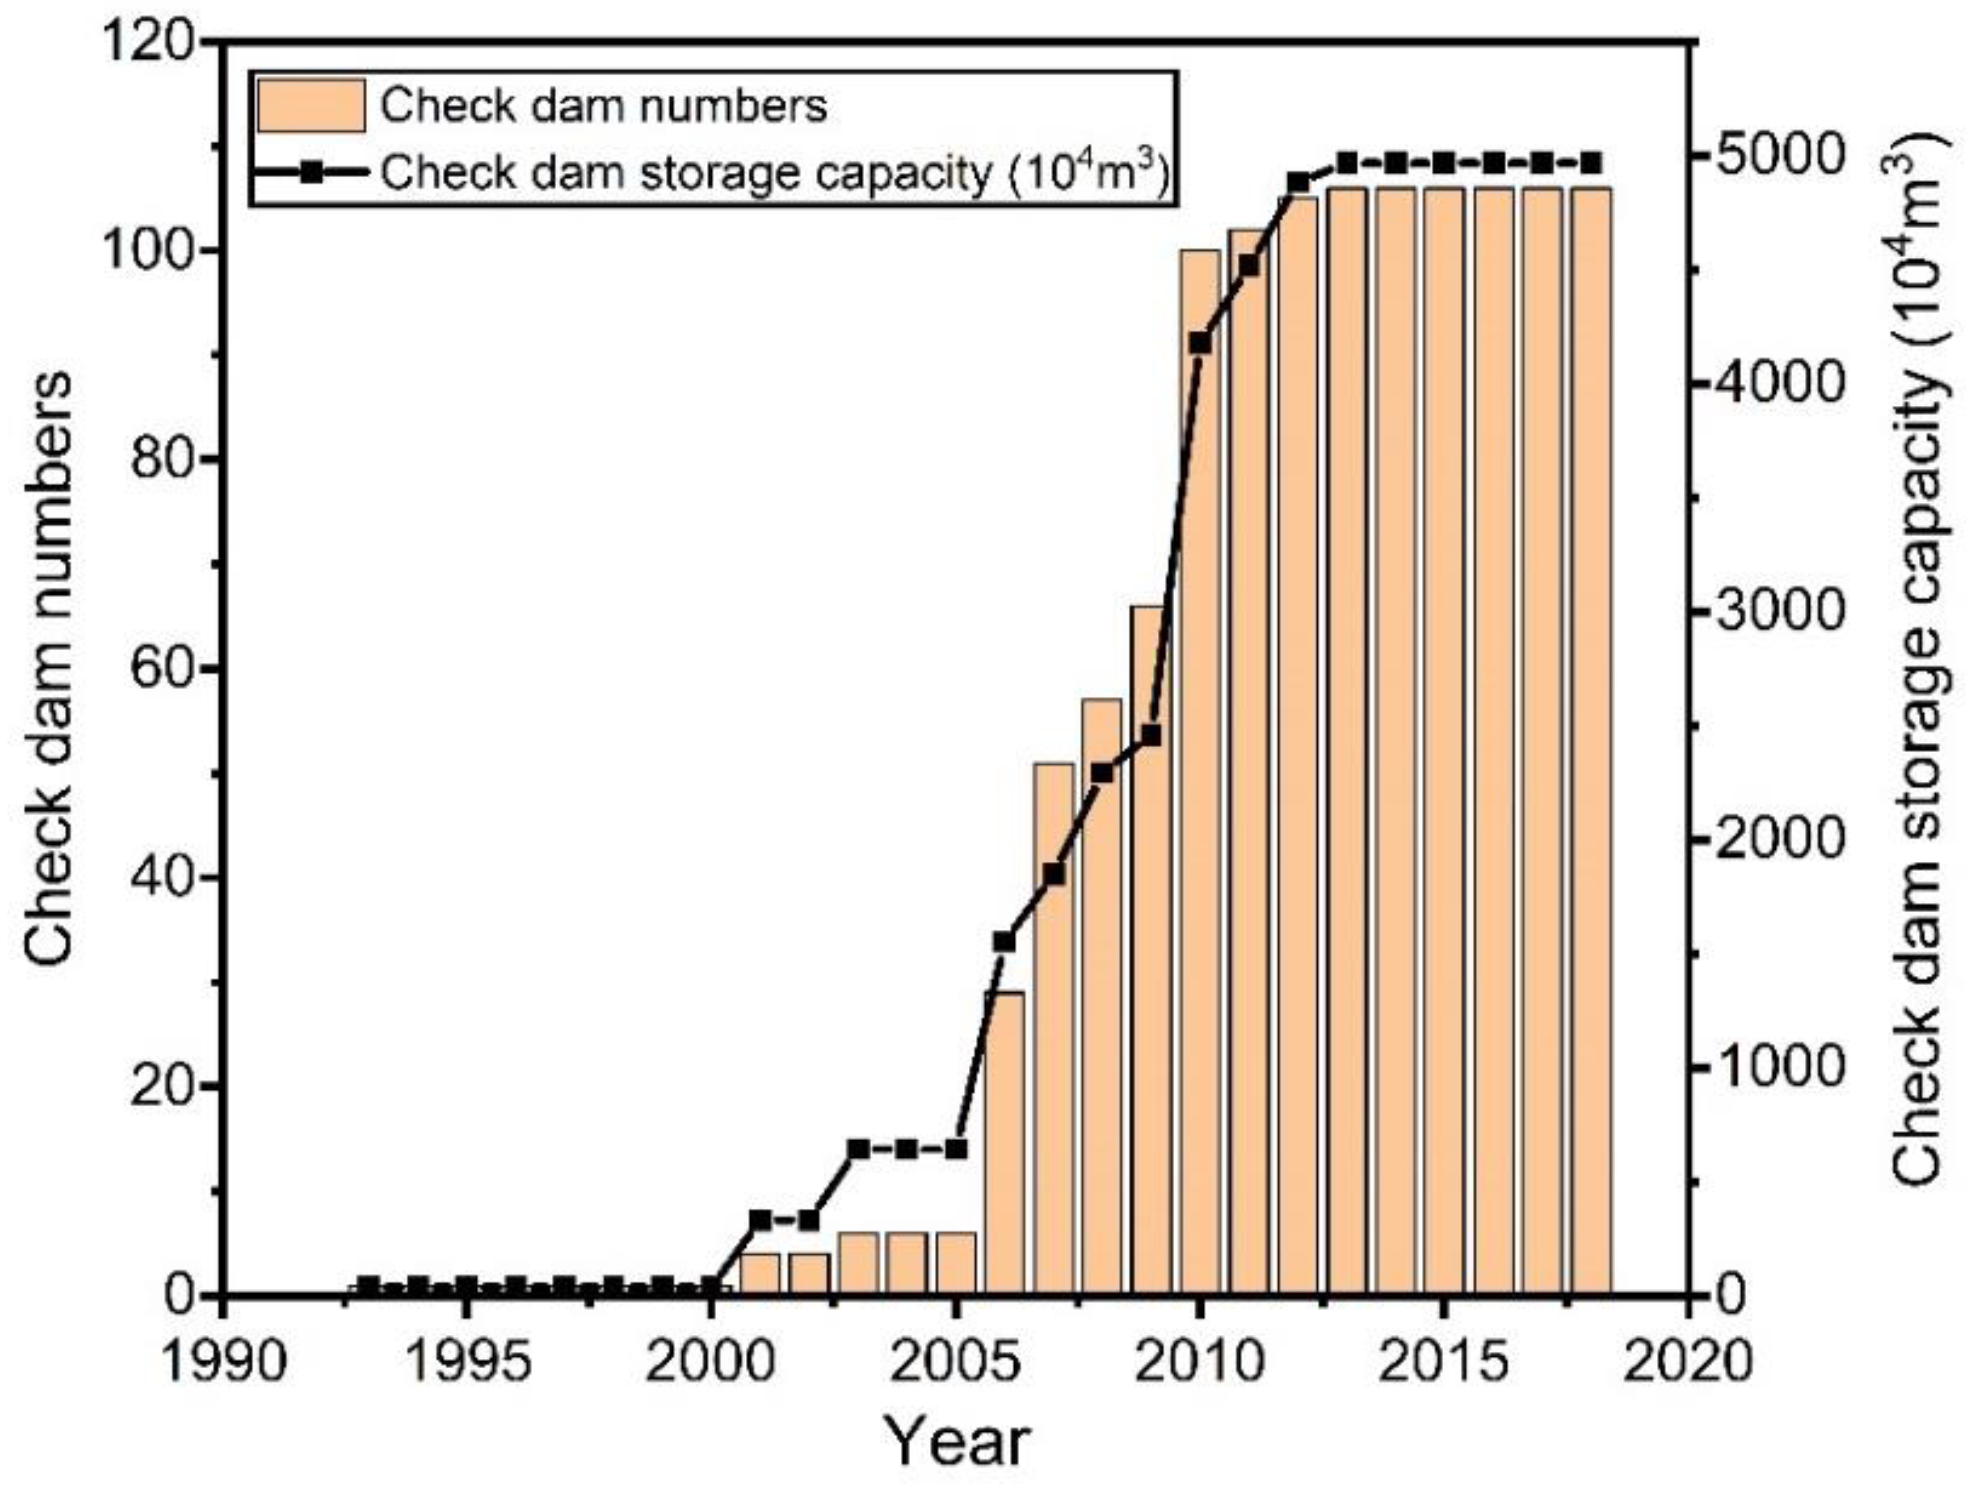
3.3. The Impact of Climate Change and Human Activities on Changes in Runoff

In this study (refer to Figure 7), significant variations were observed in the results obtained from the six different methodologies, indicating the presence of methodological uncertainties. The DMC method calculated that climate change contributed to 40.4% of the runoff change, while human activities accounted for the remaining 59.6%. Similarly, the SCRCQ method indicated a contribution rate of 39.9% for climate change and 60.1% for human activities. By employing the Budyko equation, the runoff change was attributed to climate change at a rate of 12.9%, whereas human activities contributed to 87.1%. When considering the three hydrological models, their respective contributions to climate change were 6.9%, 16%, and 28.9%, while the contributions of human activities were 93.1%, 84%, and 71.1%, respectively. According to the six methods used, the average contribution of climate change was determined to be 24.2%, while human activities accounted for an average contribution of 75.8%. Consistently, all the methods indicated that human activities significantly influenced the modification of runoff patterns in the Xiliugou basin. Figure 8 presents the simulated monthly runoff process lines by the three hydrological models and the measured monthly runoff process line during the impact/change period (2007–2020). It is evident that the simulated monthly runoff processes by all three hydrological models exhibited consistency during the impact period. Notably, the SWAT model produced the highest simulation results. However, the three hydrological models demonstrated limited capability in capturing extreme runoff events, with all simulations underestimating the magnitude of extreme runoff occurrences in 2016.

4. Discussion

In this study, the MK test was utilized as a statistical tool to identify the point of abrupt change in the runoff series. The analysis indicated that the year 2006 was identified as the observed abrupt change point. This finding was further substantiated by examining the precipitation–runoff double mass curve, which displayed a gradual increase in cumulative runoff around the aforementioned year, thereby corroborating the results obtained from the MK test. The results showed that the contribution rates calculated by the two statistical analysis methods were extremely close, which could be enforced by the similar principle of mechanism of both methods. The results calculated by the three hydrological models were slightly different, which may have been caused by the different model structures and physical mechanisms of the three hydrological models.
The collective findings from all the utilized methodologies consistently demonstrated that the variations in runoff within the Xiliugou basin were predominantly influenced by human activities. This observation is consistent with prior studies conducted in the Yellow River basin, which further strengthens the understanding that human activities have a notable impact on the formation of runoff patterns in these areas [7,19,24,28,49]. The typical human activities entail the implementation of comprehensive soil and water conservation management practices in the Xiliugou basin. These activities include engineering and vegetation ecological measures. The implementation of comprehensive soil and water conservation practices in the Xiliugou basin commenced in the 1960s. However, due to the low investment, small management scale, low conservation rate, and fewer gully dam projects for flood and sand control, the problem has not been taken care thoroughly. During the 1990s, the Ministry of Water Resources, together with the Inner Mongolia Autonomous Region and relevant departments in Ordos, demonstrated a strong dedication to executing the initial phase of the soil and water conservation project in the Dalate banner, which received financial support from the World Bank. The basic aims of that project were afforestation, grass plantation, soil and water conservation, and cancelling all sloping farmland above 25°. To bolster vegetation coverage and combat soil erosion in the Loess Plateau, a collaborative endeavor spanning over two decades has been undertaken. These sustained endeavors have led to significant improvements in the overall vegetation condition within the region. Several vegetation restoration programs were introduced in the late 1990s. The “Natural Forest Conservation Program” and the “Grain for Green Program” [5,11,31] are the most prominent projects introduced for vegetation restoration in the region. Over a span of more than two decades, the implementation of these projects has resulted in substantial improvements in the vegetation coverage of the Loess Plateau [50,51]. Figure 9 shows the annual changes in the leaf area index (LAI) in the Xiliugou basin from 1982 to 2020. It can be observed that the implementation of large-scale vegetation restoration measures after 1997 significantly increase the LAI trends from 0.12 to 0.36 between 1997 and 2020.
In addition to the extensive vegetation restoration initiatives, the construction of check dams also plays a crucial role in conserving soil and water resources. In recent years, a substantial number of check dams have been erected in the Xiliugou basin to mitigate soil erosion. Figure 10 illustrates the annual variations in the count and storage of check dams in the Xiliugou basin. The construction of these dams primarily commenced after 2000, with a particular focus between 2005 and 2010. By 2018, the Xiliugou basin hosted a total of 105 check dams, including 39 large/backbone dams, 31 medium-sized dams, and 35 small dams. The total storage capacity corresponding to check dams is 0.493 × 10⁸ m3. These intense human activities have substantially affected on the runoff distributions and patterns in the studied basin.
Because there is an absence of meteorological stations within the investigated basin (Figure 1), the meteorological data (such as precipitation, temperature, etc.) used in this study could be a little different from the actual meteorological data in the basin. Therefore, there could be some uncertainties in the interannual variation in the hydrometeorological series and the role of climate change and human activities in the runoff change. To enhance the scientific rigor and accuracy of the research findings, it is imperative to intensify the collection and assessment of meteorological data within the basin during subsequent research endeavors.
The current research approaches for distinguishing the impacts of climate change and human activities on basin runoff changes rely on the assumption that climate change and human activities are relatively independent factors. The contribution of climate variations to runoff change is evaluated using various methodologies, while the remaining portion is attributed to human activities. However, the precise quantitative assessment of the interplay between climate change and human activities in runoff changes is still not fully understood due to the complex multi-factorial influence mechanisms and interactions involved. Therefore, isolating the impacts of climate factors and human activities cannot be achieved simplistically. For instance, climate change can influence human activities, and vice versa. Given the uncertainties associated with the methodology and limitations of hydrological data, future studies should adopt a comprehensive approach that considers various factors to accurately attribute the response of runoff to climate change and human activities. This holistic approach will contribute to ensuring water resource security and facilitate a more informed regulation and control of water resources.

5. Conclusions

Six distinct methods were employed to discern the respective impacts of climate change and human activities on runoff changes within the Xiliugou basin in this study. By conducting the Mann–Kendall test, an abrupt change point in the runoff series was identified in 2006. The findings indicated a significant decrease in annual runoff from 1960 to 2020. To account for this abrupt change point, the research period was divided into two distinct periods: 1960–2006 as the baseline period and 2007–2020 as the change period/impact period. The results obtained from all the methodologies consistently demonstrated that human activities predominantly drove the observed runoff changes. The average contribution rates attributed to climate change and human activities across all six methods were determined to be 24.2% and 75.8%, respectively. Notably, the Xiliugou basin exhibits typical human activities characterized by soil and water conservation measures. In recent years, the implementation of vegetation restoration programs and check dam construction, aimed at enhancing vegetation coverage and promoting soil and water conservation, have significantly impacted the runoff processes in the region. This study provides valuable insights into the medium-to-long-term consequences of soil and water conservation measures on water availability, spanning from the catchment to regional scales. The gained insights hold immense significance in fostering sustainable water resource management within river basins.

Author Contributions

P.M.: investigation, formal analysis, data curation, writing—original draft, visualization. D.: data curation and supervision. X.L.: data curation, methodology, revising manuscript. S.N.: supervision and revising manuscript. A.K.: supervision and revising manuscript. H.M., Y.D. and R.W.: supervision. J.L.: conceptualization, methodology, supervision, writing—revising manuscript. All authors have read and agreed to the published version of the manuscript.

Funding

This work was supported by the “Science for a Better Development of Inner Mongolia” Program (KJXM-EEDS-2020005) of the Bureau of Science and Technology of the Inner Mongolia Autonomous Region. The “Quantifying Groundwater Changes and Development of Better Agricultural Water Saving Techniques in the Western Ordos” Program was funded by the Bureau of Science and Technology of the Erdos. The Natural Science Foundation of Inner Mongolia (2021BS04009).

Data Availability Statement

Data are contained within the article.

Conflicts of Interest

The authors declare no conflict of interest.

References

  1. Kleidon, A.; Renner, M. Thermodynamic Limits of Hydrologic Cycling within the Earth System: Concepts, Estimates and Implications. Hydrol. Earth Syst. Sci. 2013, 17, 2873–2892. [Google Scholar] [CrossRef]
  2. Yang, D.; Yang, Y.; Xia, J. Hydrological Cycle and Water Resources in a Changing World: A Review. Geogr. Sustain. 2021, 2, 115–122. [Google Scholar] [CrossRef]
  3. Dey, P.; Mishra, A. Separating the Impacts of Climate Change and Human Activities on Streamflow: A Review of Methodologies and Critical Assumptions. J. Hydrol. 2017, 548, 278–290. [Google Scholar] [CrossRef]
  4. Li, C.; Wang, L.; Wanrui, W.; Qi, J.; Linshan, Y.; Zhang, Y.; Lei, W.; Cui, X.; Wang, P. An Analytical Approach to Separate Climate and Human Contributions to Basin Streamflow Variability. J. Hydrol. 2018, 559, 30–42. [Google Scholar] [CrossRef]
  5. Zhang, L.; Nan, Z.; Yu, W.; Zhao, Y.; Xu, Y. Comparison of Baseline Period Choices for Separating Climate and Land Use/Land Cover Change Impacts on Watershed Hydrology Using Distributed Hydrological Models. Sci. Total Environ. 2018, 622–623, 1016–1028. [Google Scholar] [CrossRef]
  6. Schewe, J.; Heinke, J.; Gerten, D.; Haddeland, I.; Arnell, N.W.; Clark, D.B.; Dankers, R.; Eisner, S.; Fekete, B.M.; Colón-González, F.J.; et al. Multimodel Assessment of Water Scarcity under Climate Change. Proc. Natl. Acad. Sci. USA 2014, 111, 3245–3250. [Google Scholar] [CrossRef]
  7. Yin, J.; Gentine, P.; Zhou, S.; Sullivan, S.C.; Wang, R.; Zhang, Y.; Guo, S. Large Increase in Global Storm Runoff Extremes Driven by Climate and Anthropogenic Changes. Nat. Commun. 2018, 9, 4389. [Google Scholar] [CrossRef]
  8. Zhang, W.; Villarini, G.; Vecchi, G.A.; Smith, J.A. Urbanization Exacerbated the Rainfall and Flooding Caused by Hurricane Harvey in Houston. Nature 2018, 563, 384–388. [Google Scholar] [CrossRef] [PubMed]
  9. Jaramillo, F.; Destouni, G. Local Flow Regulation and Irrigation Raise Global Human Water Consumption and Footprint. Science 2015, 350, 1248–1251. [Google Scholar] [CrossRef]
  10. Wang, G.; Zhang, J.; Yang, Q. Attribution of Runoff Change for the Xinshui River Catchment on the Loess Plateau of China in a Changing Environment. Water 2016, 8, 267. [Google Scholar] [CrossRef]
  11. Li, L.; Ni, J.; Chang, F.; Yue, Y.; Frolova, N.; Magritsky, D.; Borthwick, A.G.L.; Ciais, P.; Wang, Y.; Zheng, C.; et al. Global Trends in Water and Sediment Fluxes of the World’s Large Rivers. Sci. Bull. 2020, 65, 62–69. [Google Scholar] [CrossRef]
  12. Shi, H.; Hu, C.; Wang, Y.; Liu, C.; Li, H. Analyses of Trends and Causes for Variations in Runoff and Sediment Load of the Yellow River. Int. J. Sediment Res. 2017, 32, 171–179. [Google Scholar] [CrossRef]
  13. Du, J.; Shi, C. Effects of Climatic Factors and Human Activities on Runoff of the Weihe River in Recent Decades. Quat. Int. 2012, 282, 58–65. [Google Scholar] [CrossRef]
  14. Miao, C.; Ni, J.; Borthwick, A.G.L.; Yang, L. A Preliminary Estimate of Human and Natural Contributions to the Changes in Water Discharge and Sediment Load in the Yellow River. Glob. Planet. Change 2011, 76, 196–205. [Google Scholar] [CrossRef]
  15. Gao, P.; Li, P.; Zhao, B.; Xu, R.; Zhao, G.; Sun, W.; Mu, X. Use of Double Mass Curves in Hydrologic Benefit Evaluations. Hydrol. Process. 2017, 31, 4639–4646. [Google Scholar] [CrossRef]
  16. Xue, L.; Yang, F.; Yang, C.; Chen, X.; Zhang, L.; Chi, Y.; Yang, G. Identification of Potential Impacts of Climate Change and Anthropogenic Activities on Streamflow Alterations in the Tarim River Basin, China. Sci Rep 2017, 7, 8254. [Google Scholar] [CrossRef] [PubMed]
  17. Wang, S.; Yan, M.; Yan, Y.; Shi, C.; He, L. Contributions of Climate Change and Human Activities to the Changes in Runoff Increment in Different Sections of the Yellow River. Quat. Int. 2012, 282, 66–77. [Google Scholar] [CrossRef]
  18. Sun, W.; Song, X.; Zhang, Y.; Chiew, F.; Post, D.; Zheng, H.; Song, S. Coal Mining Impacts on Baseflow Detected Using Paired Catchments. Water Resour. Res. 2020, 56, e2019WR025770. [Google Scholar] [CrossRef]
  19. Liang, K. Comparative Investigation on the Decreased Runoff between the Water Source and Destination Regions in the Middle Route of China’s South-to-North Water Diversion Project. Stoch. Environ. Res. Risk Assess. 2018, 32, 369–384. [Google Scholar] [CrossRef]
  20. Xu, X.; Yang, D.; Yang, H.; Lei, H. Attribution Analysis Based on the Budyko Hypothesis for Detecting the Dominant Cause of Runoff Decline in Haihe Basin. J. Hydrol. 2014, 510, 530–540. [Google Scholar] [CrossRef]
  21. Xu, X.; Liu, W.; Scanlon, B.R.; Zhang, L.; Pan, M. Local and Global Factors Controlling Water-Energy Balances within the Budyko Framework. Geophys. Res. Lett. 2013, 40, 6123–6129. [Google Scholar] [CrossRef]
  22. Yang, Y.; Zhang, S.; McVicar, T.R.; Beck, H.E.; Zhang, Y.; Liu, B. Disconnection between Trends of Atmospheric Drying and Continental Runoff. Water Resour. Res. 2018, 54, 4700–4713. [Google Scholar] [CrossRef]
  23. Zhou, X.; Yang, Y.; Sheng, Z.; Zhang, Y. Reconstructed Natural Runoff Helps to Quantify the Relationship between Upstream Water Use and Downstream Water Scarcity in China’s River Basins. Hydrol. Earth Syst. Sci. 2019, 23, 2491–2505. [Google Scholar] [CrossRef]
  24. Feng, D.; Zheng, Y.; Mao, Y.; Zhang, A.; Wu, B.; Li, J.; Tian, Y.; Wu, X. An Integrated Hydrological Modeling Approach for Detection and Attribution of Climatic and Human Impacts on Coastal Water Resources. J. Hydrol. 2018, 557, 305–320. [Google Scholar] [CrossRef]
  25. Jehanzaib, M.; Shah, S.A.; Yoo, J.; Kim, T.-W. Investigating the Impacts of Climate Change and Human Activities on Hydrological Drought Using Non-Stationary Approaches. J. Hydrol. 2020, 588, 125052. [Google Scholar] [CrossRef]
  26. Li, X.; Zhang, Y.; Ma, N.; Li, C.; Luan, J. Contrasting Effects of Climate and LULC Change on Blue Water Resources at Varying Temporal and Spatial Scales. Sci. Total Environ. 2021, 786, 147488. [Google Scholar] [CrossRef]
  27. Yan, R.; Zhang, X.; Yan, S.; Zhang, J.; Chen, H. Spatial Patterns of Hydrological Responses to Land Use/Cover Change in a Catchment on the Loess Plateau, China. Ecol. Indic. 2018, 92, 151–160. [Google Scholar] [CrossRef]
  28. Luan, J.; Zhang, Y.; Ma, N.; Tian, J.; Li, X.; Liu, D. Evaluating the Uncertainty of Eight Approaches for Separating the Impacts of Climate Change and Human Activities on Streamflow. J. Hydrol. 2021, 601, 126605. [Google Scholar] [CrossRef]
  29. Fu, B.; Wang, S.; Liu, Y.; Liu, J.; Liang, W.; Miao, C. Hydrogeomorphic Ecosystem Responses to Natural and Anthropogenic Changes in the Loess Plateau of China. Annu. Rev. Earth Planet. Sci. 2017, 45, 223–243. [Google Scholar] [CrossRef]
  30. Li, P.; Mu, X.; Holden, J.; Wu, Y.; Irvine, B.; Wang, F.; Gao, P.; Zhao, G.; Sun, W. Comparison of Soil Erosion Models Used to Study the Chinese Loess Plateau. Earth-Sci. Rev. 2017, 170, 17–30. [Google Scholar] [CrossRef]
  31. Cao, S.; Chen, L.; Shankman, D.; Wang, C.; Wang, X.; Zhang, H. Excessive Reliance on Afforestation in China’s Arid and Semi-Arid Regions: Lessons in Ecological Restoration. Earth-Sci. Rev. 2011, 104, 240–245. [Google Scholar] [CrossRef]
  32. Gao, P.; Deng, J.; Chai, X.; Mu, X.; Zhao, G.; Shao, H.; Sun, W. Dynamic Sediment Discharge in the Hekou–Longmen Region of Yellow River and Soil and Water Conservation Implications. Sci. Total Environ. 2017, 578, 56–66. [Google Scholar] [CrossRef]
  33. Qian, L.; Dang, S.; Bai, C.; Wang, H. Variation in the Dependence Structure between Runoff and Sediment Discharge Using an Improved Copula. Theor. Appl. Climatol. 2021, 145, 285–293. [Google Scholar] [CrossRef]
  34. Mann, H.B. Nonparametric Tests Against Trend. Econometrica 1945, 13, 245. [Google Scholar] [CrossRef]
  35. Mavromatis, T.; Stathis, D. Response of the Water Balance in Greece to Temperature and Precipitation Trends. Theor. Appl. Climatol. 2011, 104, 13–24. [Google Scholar] [CrossRef]
  36. Kohler, M.A. On the Use of Double-Mass Analysis for Testing the Consistency of Meteorological Records and for Making Required Adjustments. Bull. Am. Meteorol. Soc. 1949, 30, 188–195. [Google Scholar] [CrossRef]
  37. Fu, B. The calculation of the evaporation from land surface. Chin. J. Atmos. Sci. (In Chinese). 1981, 5, 23–31. [Google Scholar]
  38. Krysanova, V.; Bronstert, A.; Müller-Wohlfeil, D.-I. Modelling River Discharge for Large Drainage Basins: From Lumped to Distributed Approach. Hydrol. Sci. J. 1999, 44, 313–331. [Google Scholar] [CrossRef]
  39. Chiew, F.H.S.; Kirono, D.G.C.; Kent, D.M.; Frost, A.J.; Charles, S.P.; Timbal, B.; Nguyen, K.C.; Fu, G. Comparison of Runoff Modelled Using Rainfall from Different Downscaling Methods for Historical and Future Climates. J. Hydrol. 2010, 387, 10–23. [Google Scholar] [CrossRef]
  40. Li, F.; Zhang, Y.; Xu, Z.; Teng, J.; Liu, C.; Liu, W.; Mpelasoka, F. The Impact of Climate Change on Runoff in the Southeastern Tibetan Plateau. J. Hydrol. 2013, 505, 188–201. [Google Scholar] [CrossRef]
  41. Li, F.; Zhang, Y.; Xu, Z.; Liu, C.; Zhou, Y.; Liu, W. Runoff Predictions in Ungauged Catchments in Southeast Tibetan Plateau. J. Hydrol. 2014, 511, 28–38. [Google Scholar] [CrossRef]
  42. Zhang, Y.; Vaze, J.; Chiew, F.H.S.; Teng, J.; Li, M. Predicting Hydrological Signatures in Ungauged Catchments Using Spatial Interpolation, Index Model, and Rainfall–Runoff Modelling. J. Hydrol. 2014, 517, 936–948. [Google Scholar] [CrossRef]
  43. Zhang, Y.; Chiew, F.H.S. Relative Merits of Different Methods for Runoff Predictions in Ungauged Catchments: RUNOFF PREDICTIONS IN UNGAUGED CATCHMENT. Water Resour. Res. 2009, 45, 1–13. [Google Scholar] [CrossRef]
  44. Arnold, J.G.; Srinivasan, R.; Muttiah, R.S.; Williams, J.R. Large Area Hydrologic Modeling and Assessment PART I: Model Development. J. Am. Water Resour. Assoc. 1998, 34, 73–89. [Google Scholar] [CrossRef]
  45. Arnold, J.G.; Allen, P.M. Estimating Hydrologic Budgets forstand Three Illinois Watersheds. J. Hydrol. 1996, 176, 57–77. [Google Scholar] [CrossRef]
  46. Eberhart, R.; Kennedy, J. A New Optimizer Using Particle Swarm Theory. In Proceedings of the MHS’95. Proceedings of the Sixth International Symposium on Micro Machine and Human Science, Nagoya, Japan, 4–6 October 1995; pp. 39–43. [Google Scholar]
  47. Nash, J.E.; Sutcliffe, J.V. River forcasting using conceptual models. Part I: A discussion of principles. J. Hydrol. 1970, 10, 280–290. [Google Scholar] [CrossRef]
  48. Moriasi, D.N.; Arnold, J.G.; Van Liew, M.W.; Bingner, R.L.; Harmel, R.D.; Veith, T.L. Model Evaluation Guidelines for Systematic Quantification of Accuracy in Watershed Simulations. Trans. ASABE 2007, 50, 885–900. [Google Scholar] [CrossRef]
  49. Luan, J.; Miao, P.; Tian, X.; Li, X.; Ma, N.; Abrar Faiz, M.; Xu, Z.; Zhang, Y. Estimating Hydrological Consequences of Vegetation Greening. J. Hydrol. 2022, 611, 128018. [Google Scholar] [CrossRef]
  50. Feng, X.; Fu, B.; Piao, S.; Wang, S.; Ciais, P.; Zeng, Z.; Lü, Y.; Zeng, Y.; Li, Y.; Jiang, X.; et al. Revegetation in China’s Loess Plateau Is Approaching Sustainable Water Resource Limits. Nat. Clim. Change 2016, 6, 1019–1022. [Google Scholar] [CrossRef]
  51. Piao, S.; Yin, G.; Tan, J.; Cheng, L.; Huang, M.; Li, Y.; Liu, R.; Mao, J.; Myneni, R.B.; Peng, S.; et al. Detection and Attribution of Vegetation Greening Trend in China over the Last 30 Years. Glob. Change Biol. 2015, 21, 1601–1609. [Google Scholar] [CrossRef]
Figure 1. The geographical location of the Xiliugou basin.
Water 15 04010 g001
Figure 2. HBV hydrological model structure.
Water 15 04010 g002
Figure 3. SIMHYD hydrological model structure.
Water 15 04010 g003
Figure 4. Analysis of the long-term trend and identification of abrupt changes in the annual runoff sequence within the Xiliugou basin spanning from 1960 to 2020.
Water 15 04010 g004
Figure 5. Precipitation–runoff double mass curve relationship in Xiliugou basin from 1960 to 2020.
Water 15 04010 g005
Figure 6. The calibration and validation periods of the three hydrology models were evaluated using NSE, R2, and Bias values.
Water 15 04010 g006
Figure 7. The assessment of runoff change was conducted using six research methods to determine the respective contributions of climate change and human activities.
Water 15 04010 g007
Figure 8. The simulated monthly runoff process lines by the three hydrological models and measured monthly runoff process line during 2007–2020.
Water 15 04010 g008
Figure 9. Annual LAI changes in Xiliugou basin from 1982 to 2020.
Water 15 04010 g009
Figure 10. The temporal variation in the annual count and storage of check dams in the Xiliugou basin.
Water 15 04010 g010
Disclaimer/Publisher’s Note: The statements, opinions and data contained in all publications are solely those of the individual author(s) and contributor(s) and not of MDPI and/or the editor(s). MDPI and/or the editor(s) disclaim responsibility for any injury to people or property resulting from any ideas, methods, instructions or products referred to in the content.

