Article

Deformation Characteristics and Stability Prediction of Mala Landslide at Miaowei Hydropower Station under Hydrodynamic Action

1
Power China Huadong Engineering (Fujian) Corporation Limited, Fuzhou 350003, China
2
Power-China Huadong Engineering Corporation Limited, Hanzhou 311122, China
3
Institute of Engineering Geology and Geohazards, Hohai University, Nanjing 210098, China
*
Author to whom correspondence should be addressed.
Water 2023, 15(22), 3942; https://doi.org/10.3390/w15223942
Submission received: 14 August 2023 / Revised: 8 October 2023 / Accepted: 13 October 2023 / Published: 13 November 2023

Abstract

:
In recent years, with the completion of the construction of large-scale hydropower projects in China, a series of engineering geological problems that occurred during the operation of the hydropower station have become an important issue affecting the normal operation of hydropower stations. Landslides on reservoir slopes triggered especially by water storage and other factors related to the construction of hydropower stations seriously affect the normal operation of the hydropower station and lead to other geological disasters. Research indicates that many reservoir-area landslides are triggered by hydrodynamic forces resulting from water level fluctuations in hydroelectric power stations. The Mala landslide of Miaowei Hydropower Station in the Lancang River Basin of China is taken as the engineering example to study the influence of hydrodynamic forces on the deformation characteristics and stability trends of the landslide. This paper explores the formation mechanism and influencing factors of the Mala landslide by conducting a field investigation of the Mala landslide and analyzing the monitoring data. Additionally, this paper also discusses the impacts of water storage, rainfall, and engineering construction on landslide induction. It is considered that the evolution of the Mala landslide from the initial stage of water storage to the current state mainly includes four stages: small-scale bank collapse stage, creep deformation stage, accelerated sliding stage, and uniform sliding stage. Moreover, the changes in the trend of landslide stability are analyzed using the two-dimensional finite element method. The research results provide a valuable reference for understanding the formation mechanism and predicting the deformation of reservoir landslides, which has considerable engineering practical significance.

1. Introduction

In recent years, with the completion of the construction of large-scale hydropower projects in China, a series of engineering geological problems that occurred during the operation of the hydropower station have become an important issue affecting the normal operation of hydropower stations. Landslides on the reservoir bank are influenced by various factors, especially those related to water storage, heavy rainfall, and additional loads in the reservoir area of hydropower stations. These landslides will affect the safe operation and traffic safety of the hydropower station, ultimately leading to river blockage and surge disasters. Mala landslide is a typical reservoir landslide of Miaowei Hydropower Station. The inducing factors of the Mala landslide are related to the factors that cause the changes in hydrodynamic conditions of the bank slope, such as water storage, rainstorms, and so on. The reservoir area of Miaowei Hydropower Station is located in the middle section of the Hengduan Mountains in the northwest province of Yunnan. The overall terrain is higher in the north and lower in the south. The Nujiang River and Lancang River are both developed in deep canyons, forming alpine valleys. The terrain on both sides of the river valley in the reservoir area is complex, with steep slopes and gentle slopes alternating. Most of the bank slopes are rocks, while some of the bank slopes in some reservoir areas are composed of thick overburden. With the impoundment of the Miaowei Hydropower Station, significant changes have occurred in the geological environment within the reservoir area, particularly in the hydrogeological environment. The revival of ancient landslides and the occurrence of new landslides may be caused by the dynamic changes in the reservoir water level, long-term periodic water erosion, dynamic and static water pressure, water immersion softening and the resulting dynamic load, which affect the reservoir bank slope. Due to the resettlement, the more frequent construction and other human factors in the reservoir, the engineering disturbance may also induce more deformation and instability of the bank slopes.
As early as 1960, Karl Terzaghi proposed that an excessive decrease in reservoir water level would lead to a decrease in landslide stability [1]. Especially when the water level drops too quickly, the saturated zone pore water inside the slope cannot be discharged into the reservoir in time, which can easily cause deformation at the foot of the slope under the action of seepage force, thereby affecting the stability of the landslide. Norbert Morgenstern found that according to the relationship between the drawdown rate of reservoir water level and the slope dip angle, the safety factor of the slope during reservoir water drawdown can be calculated [2]. James M Duncan et al. focused on the calculation of pore water pressure inside slopes under sudden drops in reservoir water level. It is believed that the change in pore water pressure of rock and soil inside the slope during the rapid decline of reservoir water level is an important factor determining the stability of landslide mass under sudden water level drop. The calculation formula for pore water pressure inside the landslide body in the reservoir area has been revised by previous scholars. A formula for calculating the stability of the landslide body under a given sliding surface when the reservoir water level drops has been proposed [3]. N Pinyol proposed a systematic analysis method for landslide research in the reservoir area after conducting a detailed study of a large landslide in Spain, including preliminary exploration, geological modeling, stability analysis, mechanism analysis, disaster prevention, etc. [4] Huang et al. studied the failure mode and genetic mechanism of bank slope. They systematically analyzed the mechanism of large-scale landslides and the mechanical process of bank slope instability in China since the 20th century [5,6]. Cotechia et al. analyzed the influence of reservoir water on bank slope stability by combining the mechanism of reservoir slope instability with the permeability characteristics of bank slope through geological survey, physical model test and numerical simulation analysis [7]. Paranuzzi et al. believed that the stability of the reservoir bank slope is greatly affected by the fluctuation rate of the reservoir water level and is closely related to the permeability of the reservoir bank slope [8]. Qin et al. used the analysis theory of coupling seepage field and stress field to study the characteristics of stress field changes in reservoir bank slopes under water-level fluctuations. The results indicated that the stress field on the bank slope changes greatly when the reservoir water level changes, and the stability of the bank slope decreases significantly when the reservoir water level drops [9]. Wu et al. used the Jinping hydropower station as an engineering example to study the relationship between the development of reservoir landslides, water storage, and water level fluctuations [10]. Li et al. used the discrete element method (DEM) and computational fluid dynamics (CFD) analysis method to study the impact of river blockage and surge disasters caused by reservoir landslides and discussed the evolution mode of shock waves caused by river damming landslides, including the climbing of the opposite bank and quasi three-dimensional propagation along the river direction [11]. Cao et al. studied the failure mechanism of landslide deposits in the Three Gorges Reservoir area under the condition of reservoir water level fluctuations and found that hydrodynamic pressure has a significant impact on the initialization of landslide failure [12]. Wang et al. used the Pseudo-Maximum-Likelihood-Estimation-Mixed-Copula approach to analyze the correlation between the influencing factors of hydrodynamic landslides and the monthly displacement increment [13]. Canoglu et al. established a soil moisture distribution and routing (SMDR) model, as well as the concept of landslide susceptibility, based on a comprehensive analysis of soil moisture, to address the spatial and temporal changes in landslide susceptibility. The proposed method reflects the temporal impact of the saturation degree index (SDI) on landslide susceptibility [14]. Wang used the Three Gorges Reservoir as an example to study the deformation characteristics, mechanism, and influencing factors of hydrodynamic pressure landslides. The results showed that the key hydrodynamic factor of landslide deformation in the reservoir is the outward hydrodynamic pressure formed when the water level drops [15]. Mishra et al. analyzed the monitoring methods of reservoir-induced landslides and used continuous scattering interferometer (PSI) technology to plot and monitor reservoir-induced landslides (RILs), which is crucial for assessing and mitigating related geological environmental hazards [16]. Kohler et al. used a slow-sliding landslide in a reservoir in the Swiss Alps as an example to study the kinematics of landslides and their dependence on hydrological conditions. The study showed that slow-moving active landslides are less susceptible to seismic acceleration than stable slopes [17]. Kędra et al. used the Czorsztyn reservoir bank slope upstream of the Dunajec River as an example to study and evaluate the impact of water level fluctuations in mountainous reservoirs on their bank slope deformation and failure. The results indicate that the actual water level range of mountainous reservoirs will have an impact on the deformation of the bank slope, which is much narrower than the theoretical range [18].
In addition, a large number of scholars, such as Ghiasian and Ghareh [19] and Kalenchuk et al. [20], have established relevant analysis models for the groundwater system of landslides. However, these studies only studied the hydraulic effect of reservoirs on landslides from a hydraulic perspective, without studying the material mechanical effect of water on landslides, that is, the influence of water on the strength characteristics of sliding bodies and sliding zone materials. Many scholars currently use various experimental methods to study landslides in reservoir areas under the action of dynamic water. Among them, geotechnical centrifugal model tests are widely used. Several scholars have conducted research on the centrifugal model test of reservoir bank landslides and studied the formation mechanism of landslides in the reservoir area [21,22,23,24,25].
The research methods of landslide stability in reservoir areas mainly include the physical model test method and numerical simulation method.
At present, the commonly used physical model test methods include the inclined test-bed test method, base friction test method, centrifuge test method and gravity method. Wong and Chiu developed a three-dimensional tilt test-bed, which can apply different pressures on the side of the model to simulate the gravity conditions of landslides [26]. Aydan and Kawamoto verified the method of residual toppling force to judge landslide stability through a base friction test [27]. Chen developed a large base friction test-bed, which can better simulate landslides [28]. Li et al. and Chena et al. used a shaking table to study the relationship between discontinuity and landslides, as well as the stability changes of anti-dip rock slopes with joint development under the influence of external dynamic conditions [29,30]. Alzo’ubi et al. and Chen et al. used the centrifuge method to simulate the conditions of rock slope deformation and combined it with the comparative numerical simulation method to study the relationship between the failure depth of toppling deformation and the sliding surface caused by slope deformation [31,32]. Dong et al. used the self-weight of the test rock mass and jack load to consider the influence of the development position of the discontinuous structural plane and lithology on the rock slope characteristics and laws [33,34].
In summary, scholars have proposed two views on the deformation mechanism of reservoir bank landslides. The first type believes that the deformation of reservoir bank landslides is mainly related to slope structure, groundwater dynamic environment, external loads, etc. The second type believes that the deformation of reservoir bank landslides is mainly related to the water-rock interaction existing within the landslide body. It is believed that the macro factors affecting the deformation of reservoir bank landslides, ultimately, mainly include rainfall, water storage, earthquakes, and additional loads, although the two perspectives have different research perspectives.
Currently, the slope deformation disaster in reservoir areas poses a significant threat to the construction and operational stability of large hydropower projects located in mountainous and gorge regions. Substantial research has not fully explained the mechanism behind slope failures that occur during sudden increases in water level; such knowledge is crucial for effectively addressing the disaster-causing potential of slope collapse. A key issue that needs to be urgently addressed is the response of high and steep rocky slopes to water storage in hydropower projects. It is necessary to establish the mechanism responsible for slope instability during water-level rise and to develop warning and control measures to mitigate potential disaster occurrences.
This paper selects the Mala landslide of Miaowei Hydropower Station in the Lancang River Basin of China as an engineering example to explore the influence of water level fluctuations on landslide deformation. Through on-site investigation and analysis of monitoring data, it was discovered that reservoir impoundment, short-term heavy rainfall, and engineering loads have significant impacts on landslide deformation. Additionally, the deformation trend of the landslide was analyzed through two-dimensional finite element numerical simulation. This research can serve as a reference for the analysis of the causes and deformation prediction of reservoir landslides and has practical engineering significance. This article aims to reveal the influence of hydrodynamic water action on the mechanism of landslide disasters on bank slopes, promote the application of disaster prediction results on the bank slopes of high mountain and canyon reservoirs to engineering practice, and provide theoretical basis and technical support for the management and prediction of reservoir bank instability disasters in hydropower projects.

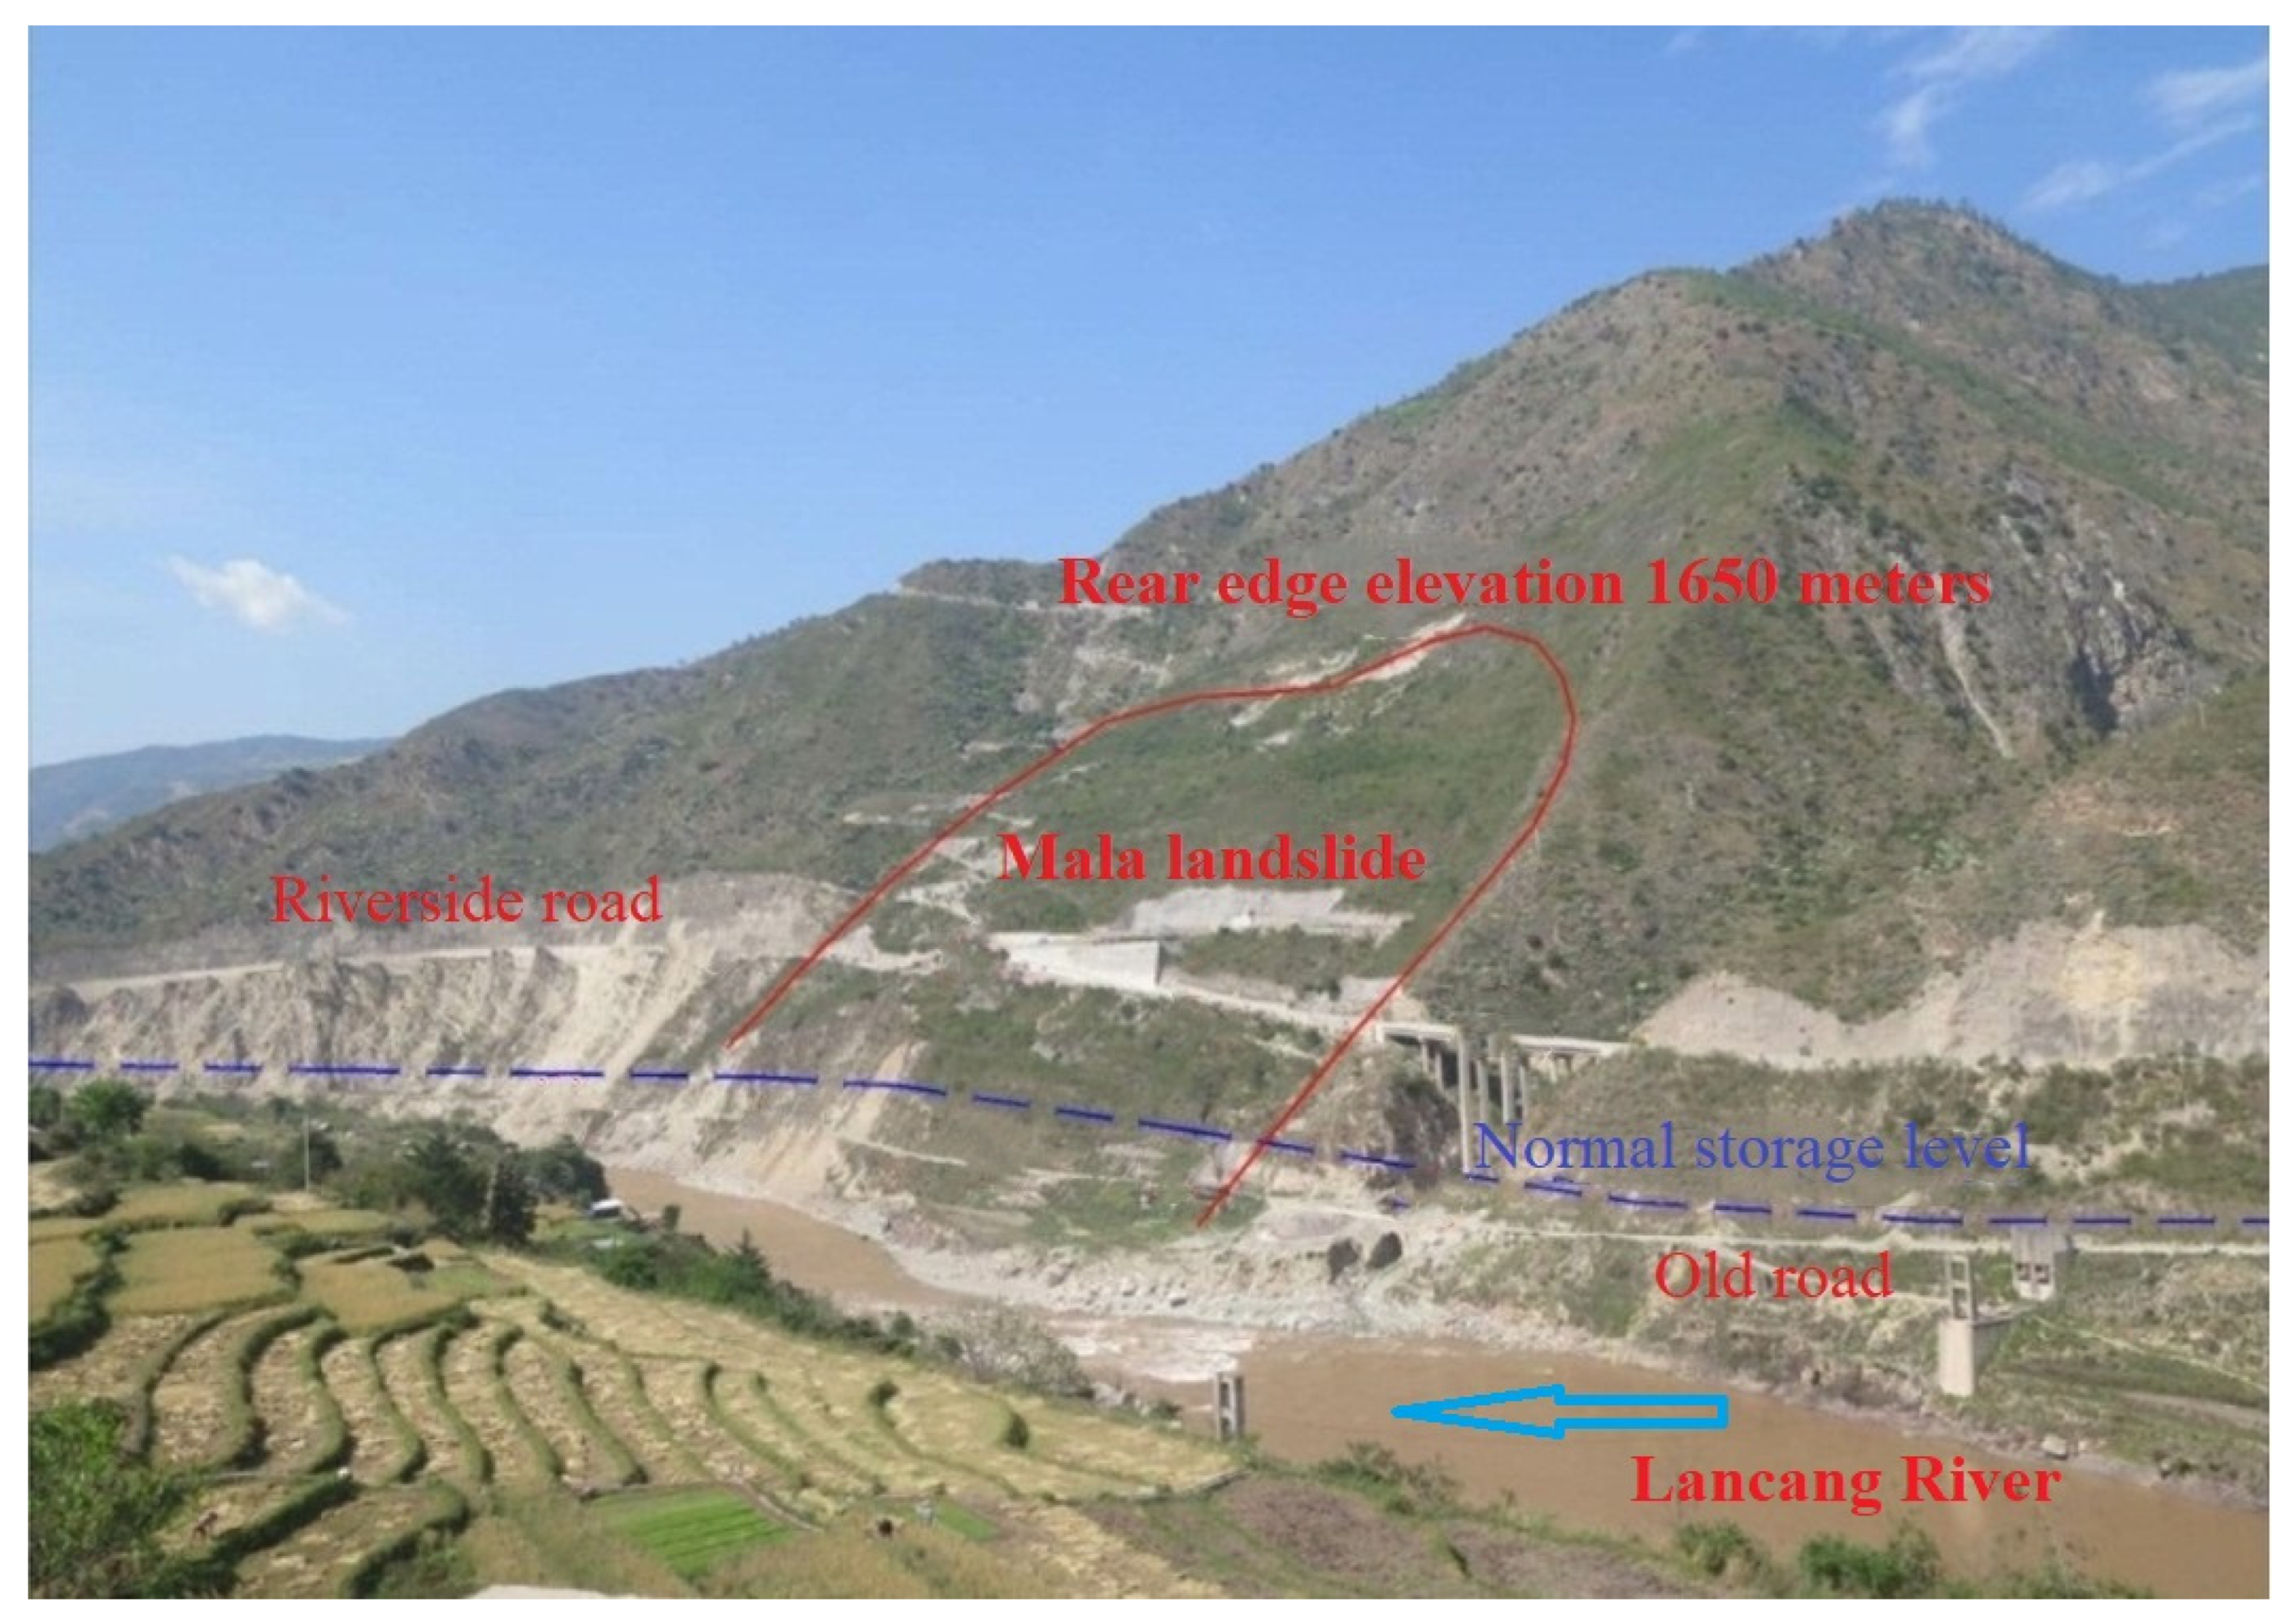
2. Engineering Geological Conditions of Landslides

The Mala landslide is an ancient landslide located in bedrock, with accumulation bodies distributed between slopes at elevations of 1395 m to 1650 m. The elevation of the rear edge of the landslide is 1650 m, while the elevation of the front edge is approximately 1400 m. The length along the river is about 420 m, while the length perpendicular to the river is about 350 m. The thickness of the Mala landslide varies from 10 m to 75 m, and the volume is approximately 4.3 million cubic meters. The newly constructed riverside highway passes through the lower part of the landslide, with a road surface elevation ranging from 1440 m to 1480 m. The overall view of the Mala landslide prior to impoundment is shown in Figure 1.
Based on the preliminary exploration data, on-site engineering survey, drilling core extraction, and indoor geotechnical test results of the Mala landslide, the strata in the landslide area are primarily composed of overburden and bedrock layers.
The predominant types of groundwater in landslide areas are bedrock fissure water and pore water. Pore water exists in the colluvial and alluvial deposits located on both sides of the riverbed. Groundwater exhibits significant variations across different seasons, with abundant water content during the rainy season. Fissured phreatic water is stored in the cracks and structural zones of rock masses, primarily recharged by the infiltration of surface water into the underground environment. The abundance of fissured phreatic water is primarily controlled by the degree of fracture structure and fracture development. The Lancang River serves as the lowest discharge reference level for surface water and groundwater within the landslide area. Surface water and groundwater both discharge into the Lancang River. The tributaries and ditches on both sides of the Lancang River are well-developed, while the elevation of the right bank ditch source mostly distributes above 2500 m, and the left bank ditch source mostly distributes above 3000 m. Therefore, the elevation of the watershed on both banks is below 2500 m, much higher than the reservoir water level.
With the construction of hydropower stations and the development of the local economy, inevitable engineering activities have significant impacts on geological bodies. The old roads, new riverside roads, and mountain roads within the study area traverse through the landslide area. The bottom of the landslide features an old landslide with bedrock, and the phenomenon of bedrock toppling is severe. The dynamic load of vehicles has a significant impact on the stability of the slope. Additionally, the unloading effect resulting from rock excavation leads to the formation of unloading cracks within the rock mass. Rainfall will penetrate downwards along these unloading cracks, and the accumulation of engineering excavation waste will generate static loads, which is not beneficial for the stability of the slope.

3. Deformation Characteristics and Mechanism Analysis of Landslide

3.1. Development Characteristics of Landslide

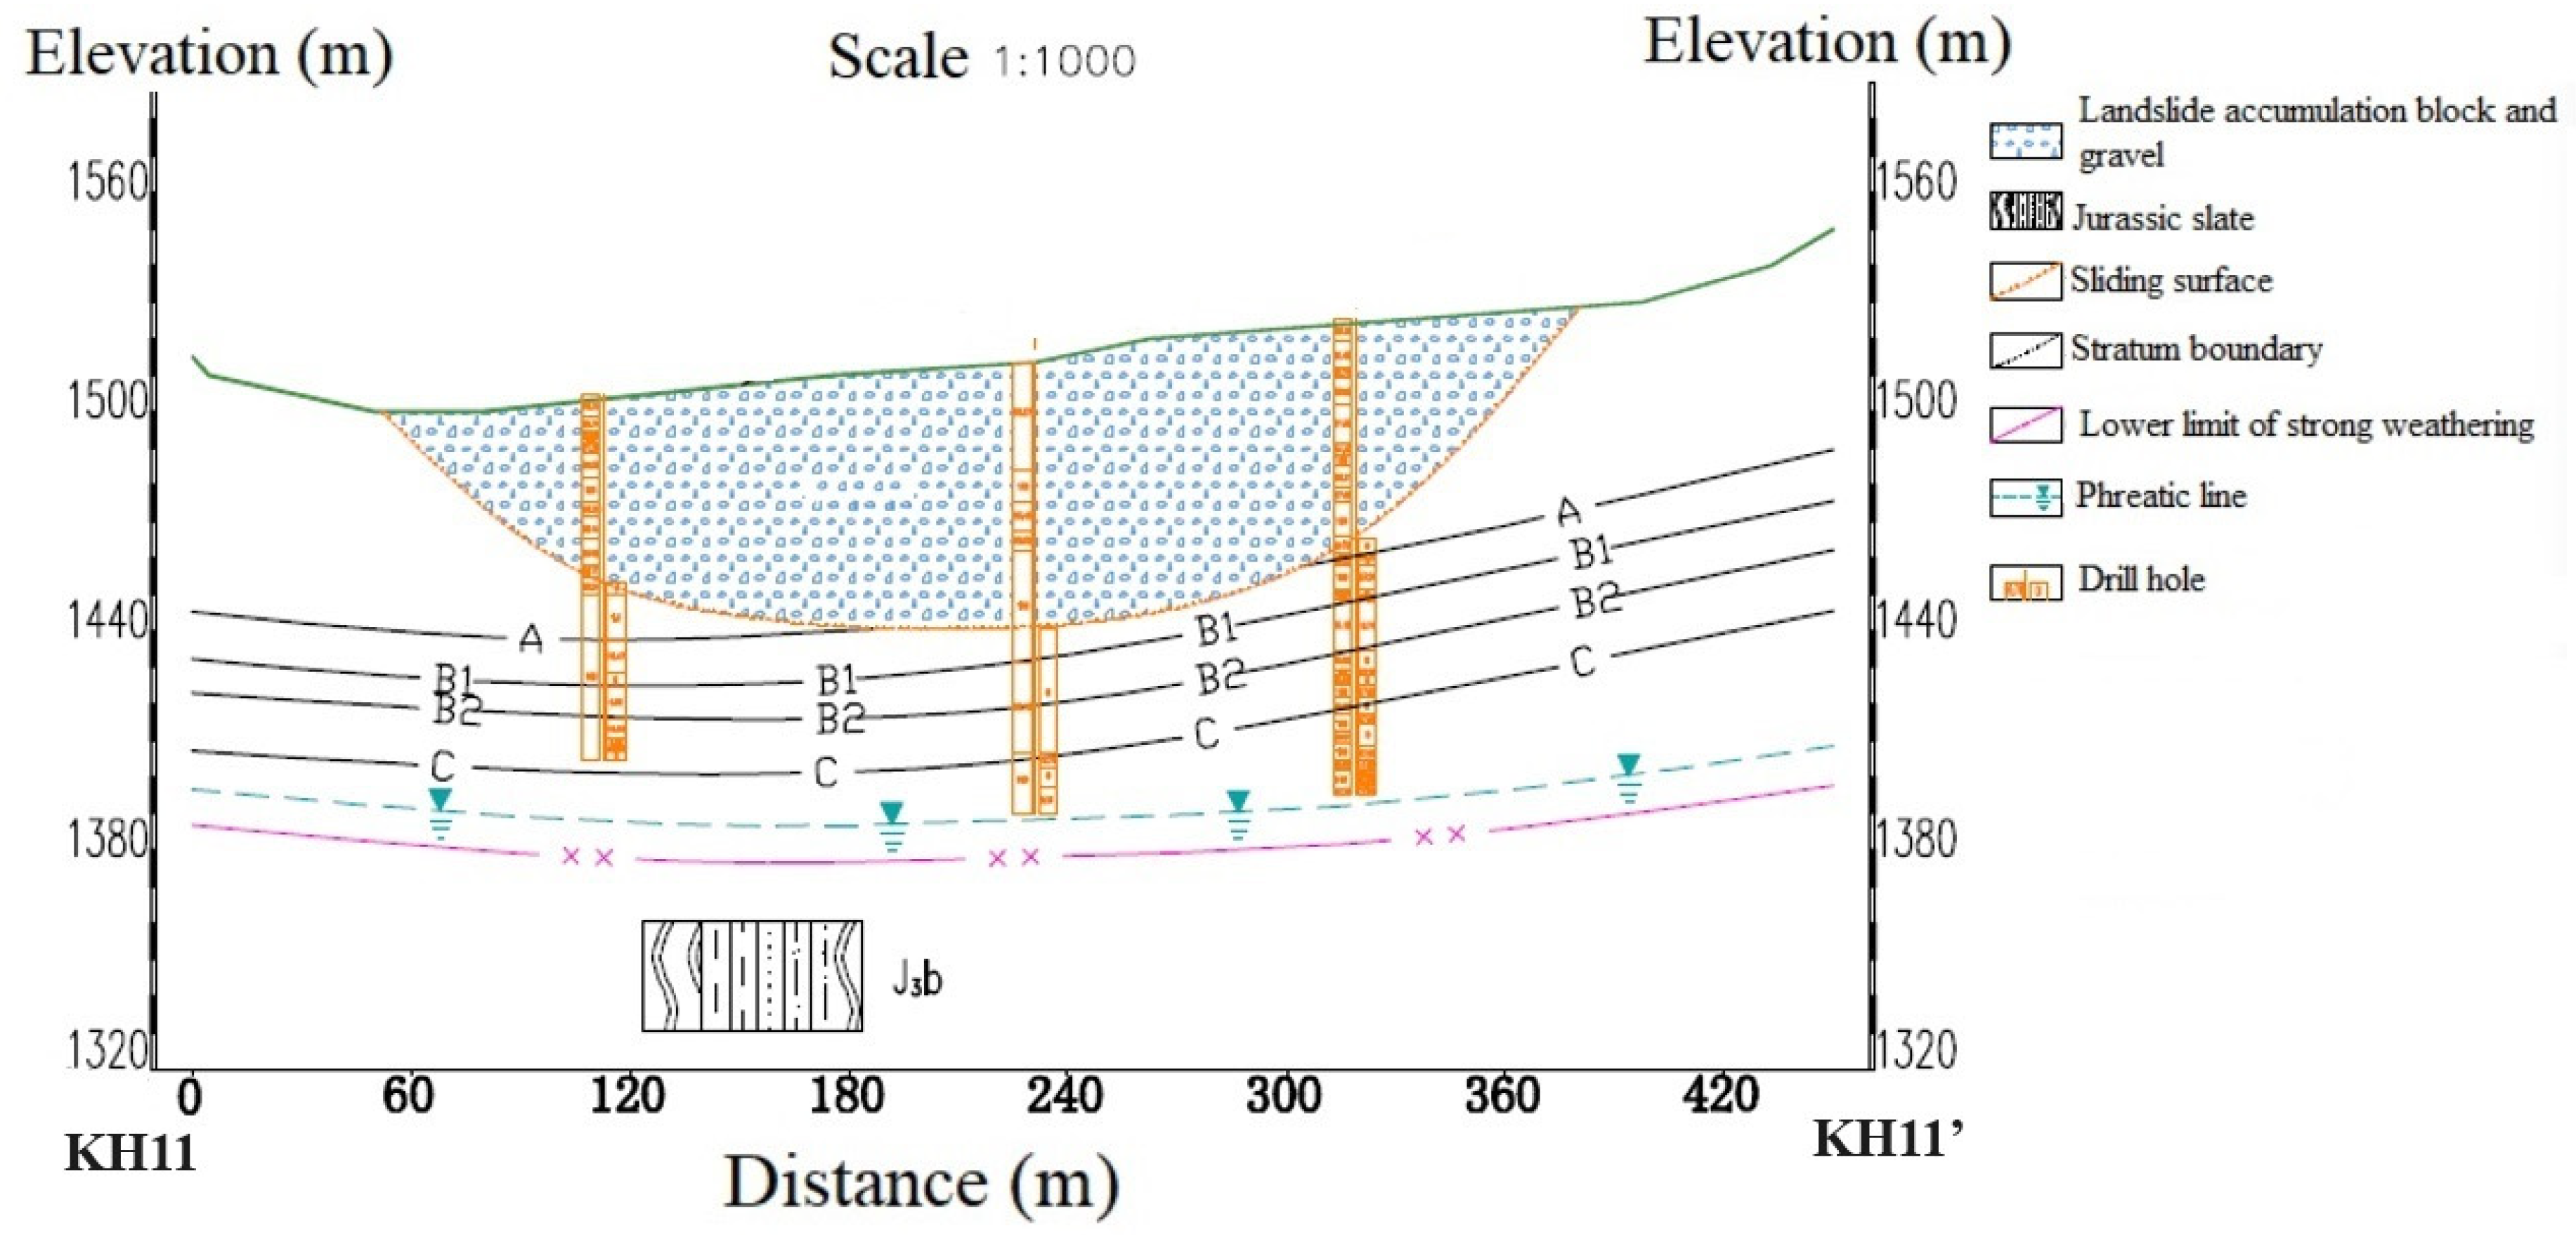
3.1.1. Geometric Characteristics of the Slope

The Mala landslide is a rock landslide with a clear boundary and the shape of a “circular chair” (see Figure 2). The landslide is located at the concave bank of the Lancang River’s turning point, and the current water storage level is almost the same as the elevation of the shear outlet at the front edge of the landslide. The rear edge of the landslide is steep, and the middle part is thick and prominent.

3.1.2. Characteristics of Sliding Body

The sliding rock and soil layer is primarily composed of colluvial and alluvial silty clay layer (Qcol+dl), landslide accumulation block gravel layer (Qdel), and a small amount of artificially accumulated sand and gravel on the surface. Based on the analysis of core data obtained from exploration boreholes, it is revealed that the thickness of the sliding body varies between 30 m and 70 m. In the two-dimensional profile (longitudinal profile, Figure 3), which is perpendicular to the riverbank line of the sliding body, the shape of the accumulation body is that of a “crescent”, exhibiting the characteristic of a thin accumulation layer at the rear edge and a thick accumulation layer at the middle and front edges. The center of gravity is concentrated in the middle and lower parts of the sliding body, and the composition of the landslide mainly consists of landslide accumulation blocks and crushed stones. The thickness of the two-dimensional profile (transverse section, Figure 4) of the sliding body along the riverbank is relatively uniform. The accumulation thickness near the downstream side of the Lancang River is greater than that on the upstream side, and the center of gravity of the transverse section leans towards the downstream.

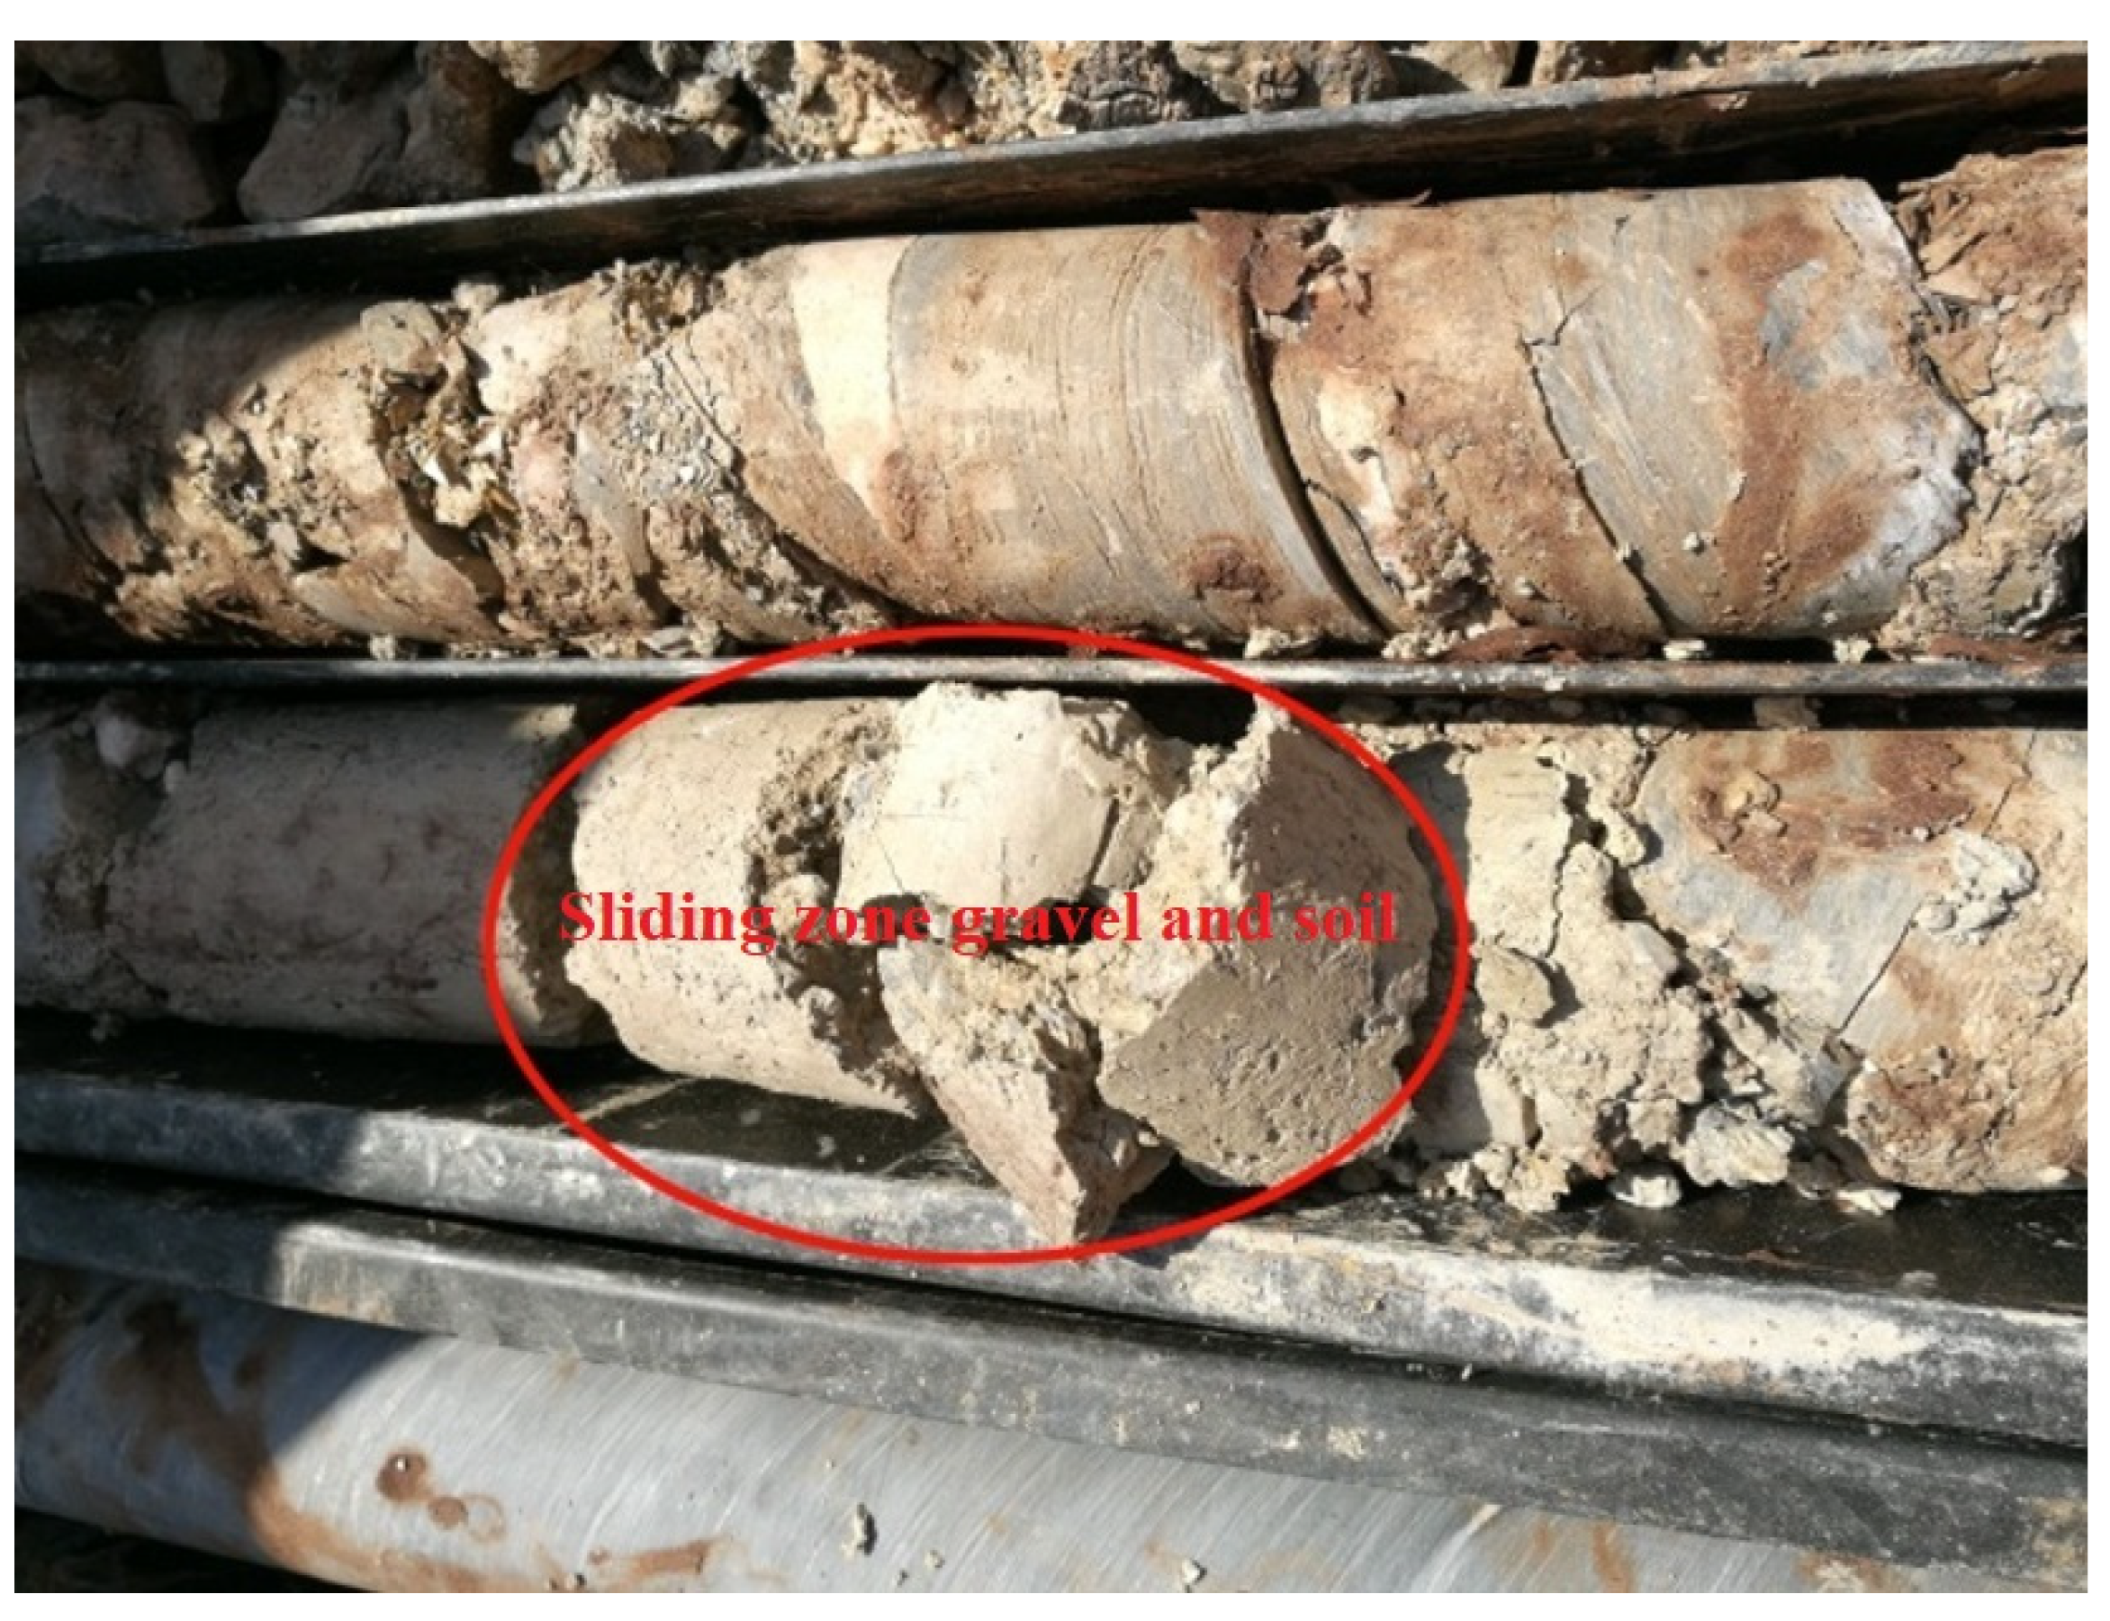
3.1.3. Characteristics of Slip Zone

Through analysis and comparison of core samples extracted from drilling holes, it was found that the position of the sliding zone is essentially consistent with the location of lithological changes (the boundary between the foundation and the cover layer); that is, the sliding body consists of a cover layer, and the sliding zone is composed of the bottom of the cover layer and the top of the strongly weathered bedrock. According to the extracted drilling core data, the rock and soil in the sliding zone are in the form of fragments, crushed powder, and angular gravel (see Figure 5). The composition of the rock and soil in the sliding zone is made up of block stones, crushed stones, and a small amount of silty clay. The content of block stones varies from 30% to 40%, with particle sizes ranging from 20 cm to 30 cm, which is angular in shape. The content of crushed stone ranges from 40% to 50%, with particle sizes ranging from 6 cm to 10 cm, which is angular in shape. The silty clay content is between 10% and 30%, slightly wet, hard to plastically deform, and has a moderately dense structure. Based on a comprehensive analysis of the core features extracted from six boreholes, it is speculated that the thickness of the sliding zone ranges from 1.0 m to 4.0 m. In order to accurately grasp the mechanical parameters of the sliding zone soil, indoor soil tests and analysis were conducted on the sliding zone soil samples at the front edge of the landslide mass. The test methods include saturated consolidation quick shear test, triaxial consolidated undrained shear test, and repeated direct shear test. See Table 1 for parameters of test results of sliding zone soil.

3.1.4. Sliding Bed Characteristics

The sliding bedrock mass is mainly composed of slate from the Middle Jurassic Huakai Left Formation (J2h2), with strong to weak weathering, near layered distribution, poor cementation, developed joint fissures, and loose and fragmented structures. The phenomenon of rock layer toppling is severe, with a dip angle of 10° to 40° after toppling. The lower limit depth of weak toppling is 40 m to 90 m, and the lower limit depth of the weak weathering zone is 20 m to 180 m. The core of the sliding bedrock layer extracted from the survey borehole is in the form of fragments, flakes, short columns, and columns from shallow to deep. The integrity of the rock layer tends to be good, and the degree of weathering weakens. The sliding bedrock core taken for drilling is shown in Figure 6.

3.2. Deformation and Failure Characteristics of Landslide

3.2.1. Distribution Characteristics of Cracks in Landslide

Since the water level of the reservoir rose to the elevation of 1388 m in June 2017, a small-scale bank collapse has been occurring near the downstream boundary of the landslide front edge. When the water level of the reservoir rose to the elevation of 1401 m in July 2017, an apparent monitoring point began to appear displaced. Since then, the water level of the reservoir has been maintained at an elevation of 1401 m. In September 2017, the displacement of the apparent monitoring points significantly increased, and cracks began to appear on the surface of the landslide front edge. The survey data in September 2018 showed that the cracks around the landslide body were connected. According to the data provided by Huadong Engineering Co., Ltd. (Hangzhou, China) on all cracks within the landslide area from September 2017 to September 2018, all cracks are projected onto the landslide in schematic form, as shown in Figure 7.
By analyzing the average width and extension direction of cracks distributed within the landslide mass, as well as the characteristics of the sliding mass, the sliding bedrock and the soil, the following conclusions can be inferred: The landslide has a tendency to move towards the downstream side of the Lancang River, and the center of the landslide is located in the middle and downstream area of the slide mass; there may be a locking section in the middle area of the landslide body that leans upstream and blocks the sliding of the body; there is a certain rotational trend of the sliding body under the action of gravity in the locking section and the body; under external forces such as periodic impoundment, rainstorms, and earthquakes, the landslide body will produce relative displacement, which may cause secondary landslide bodies.

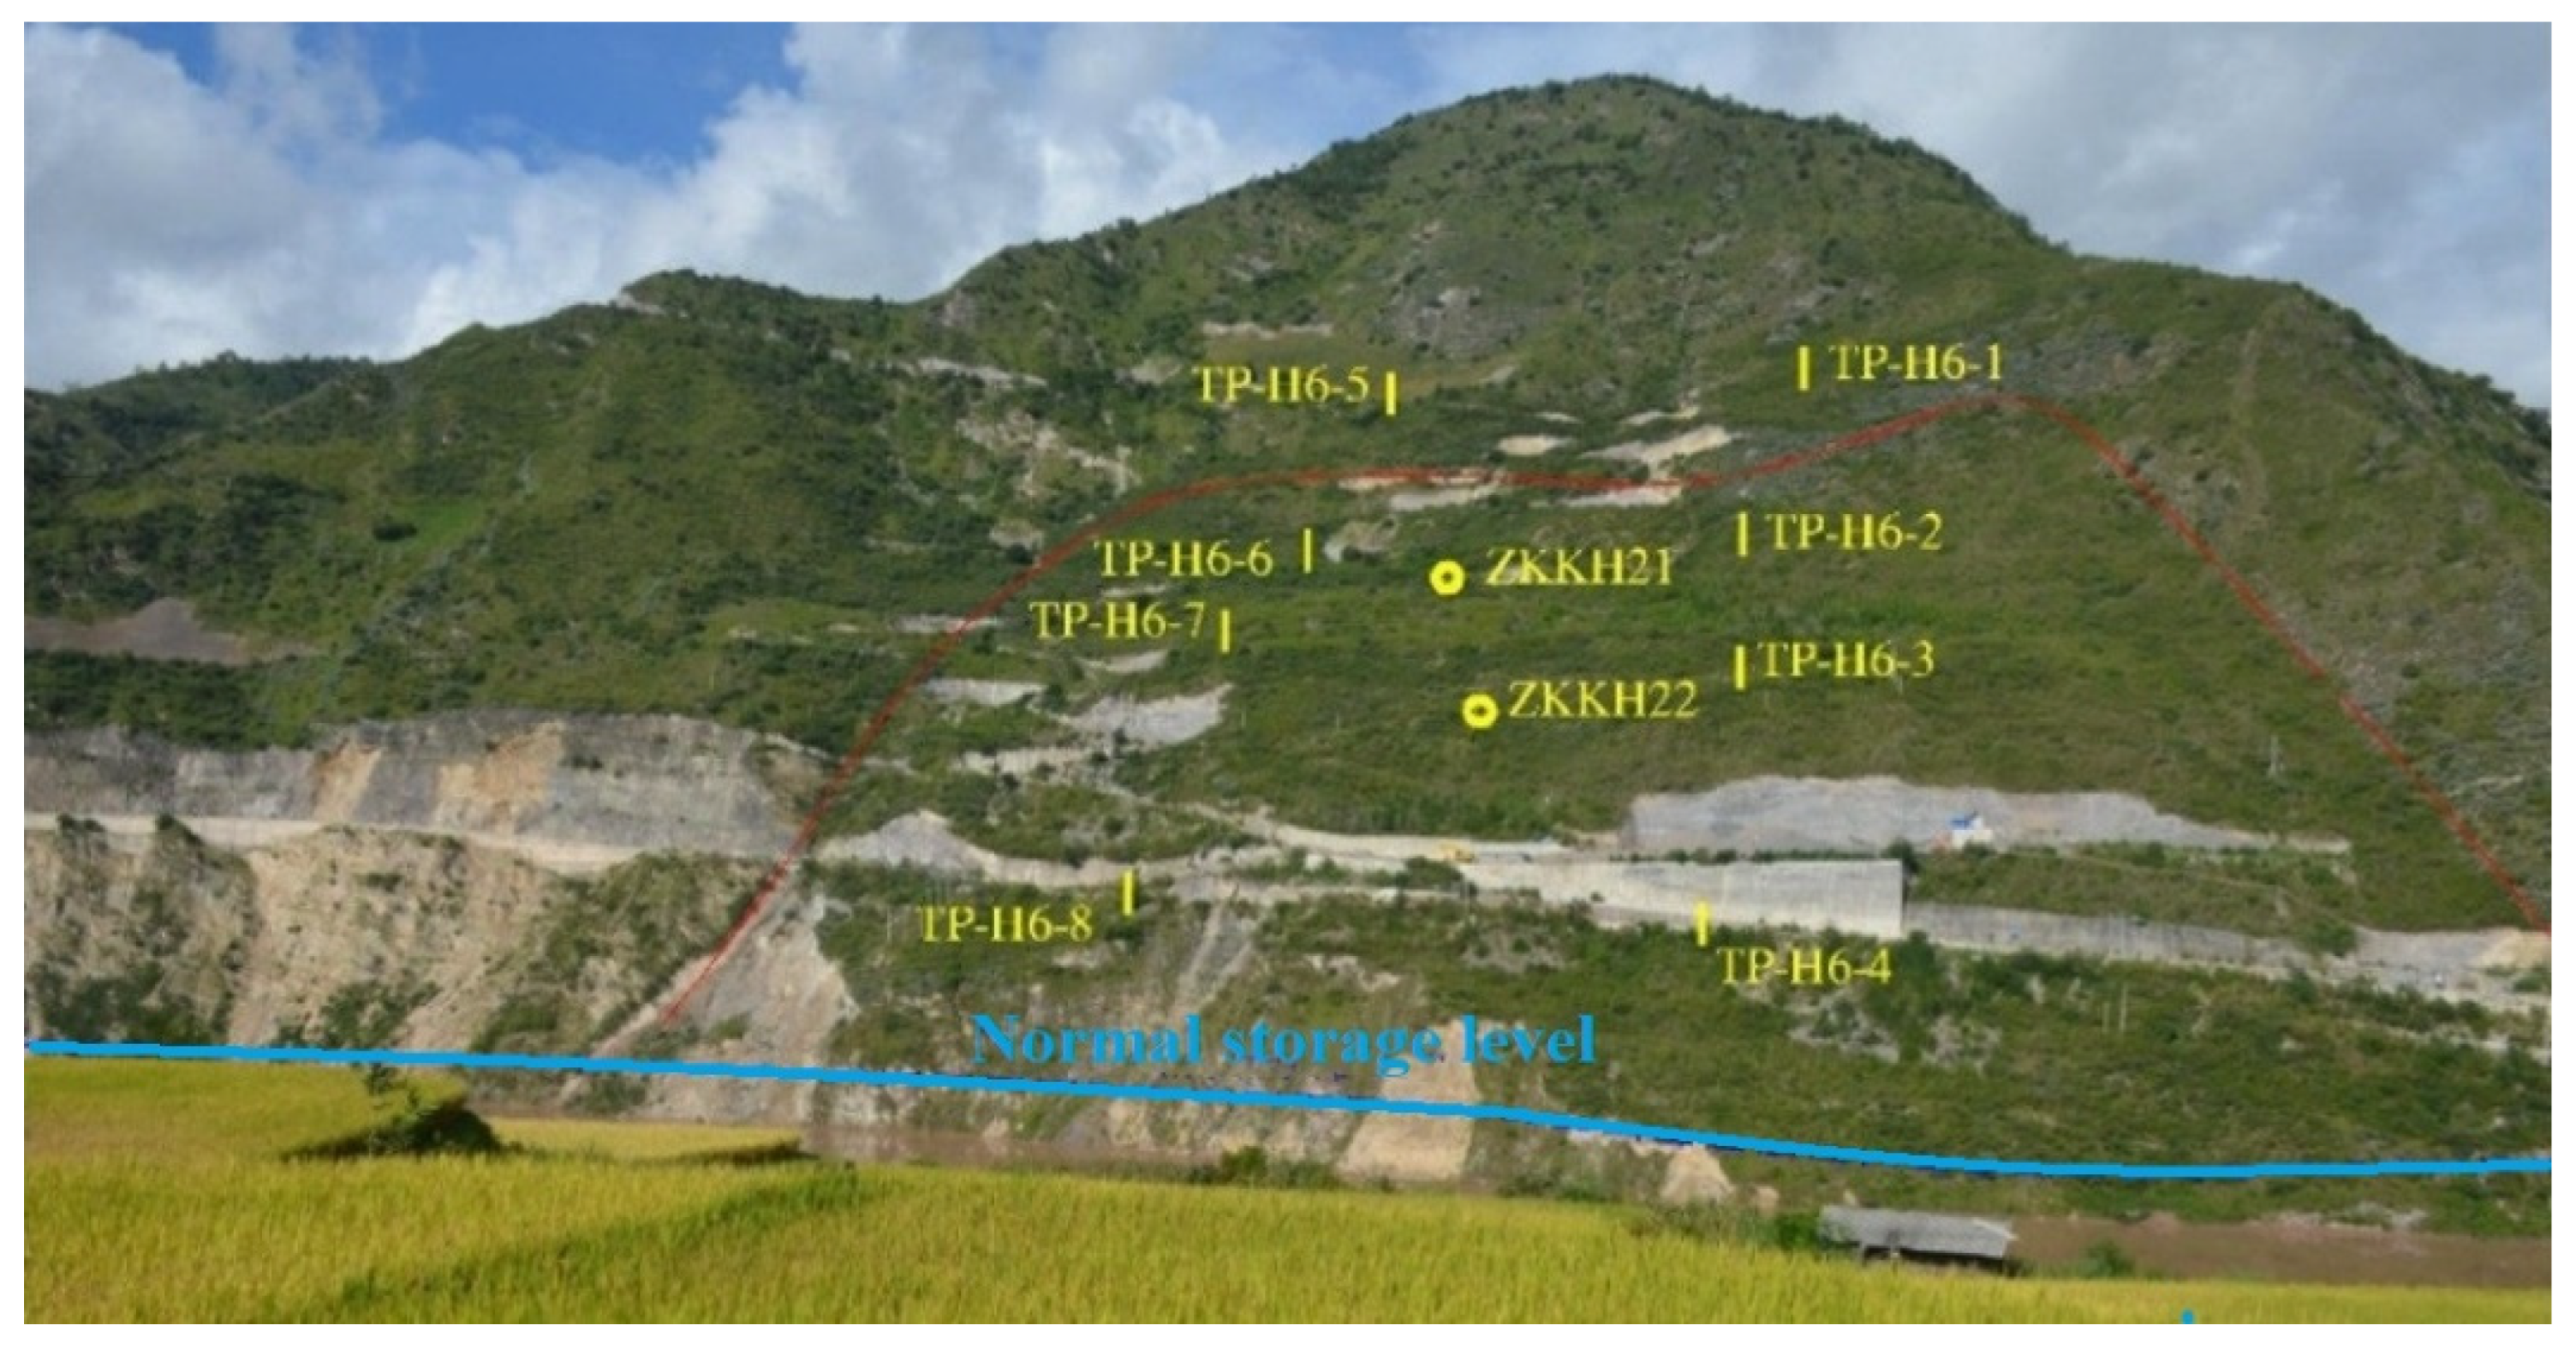
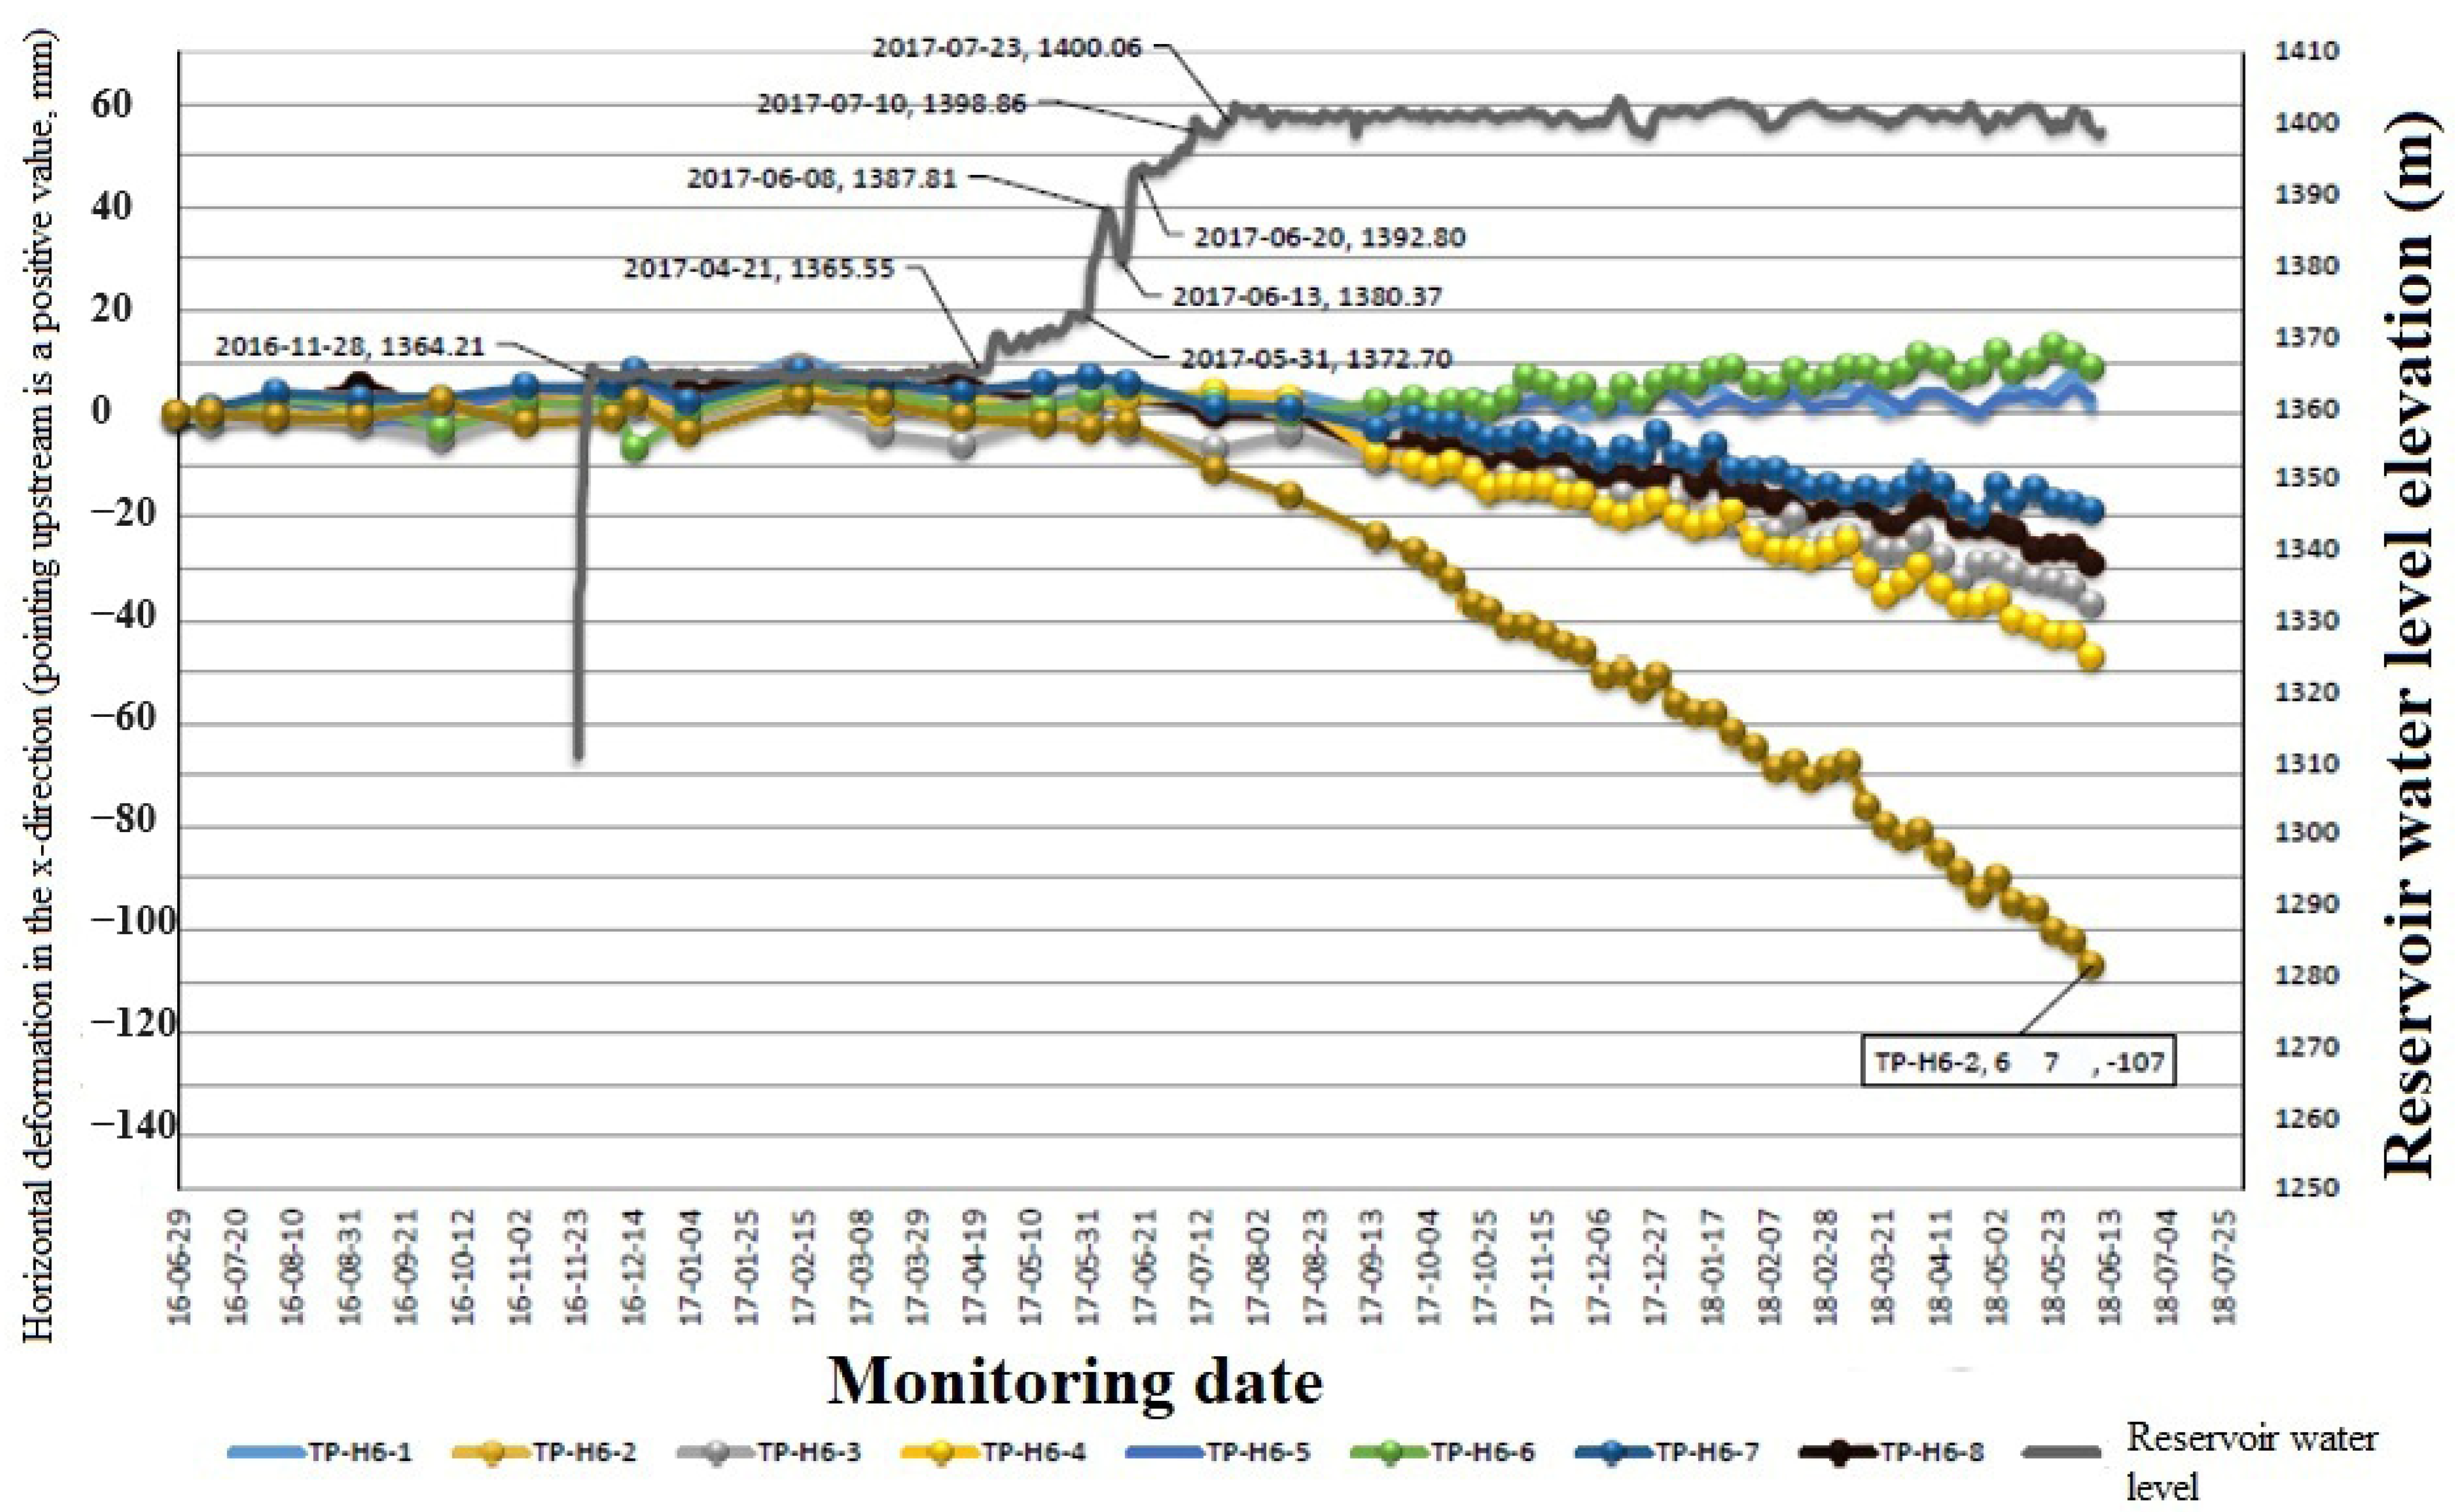
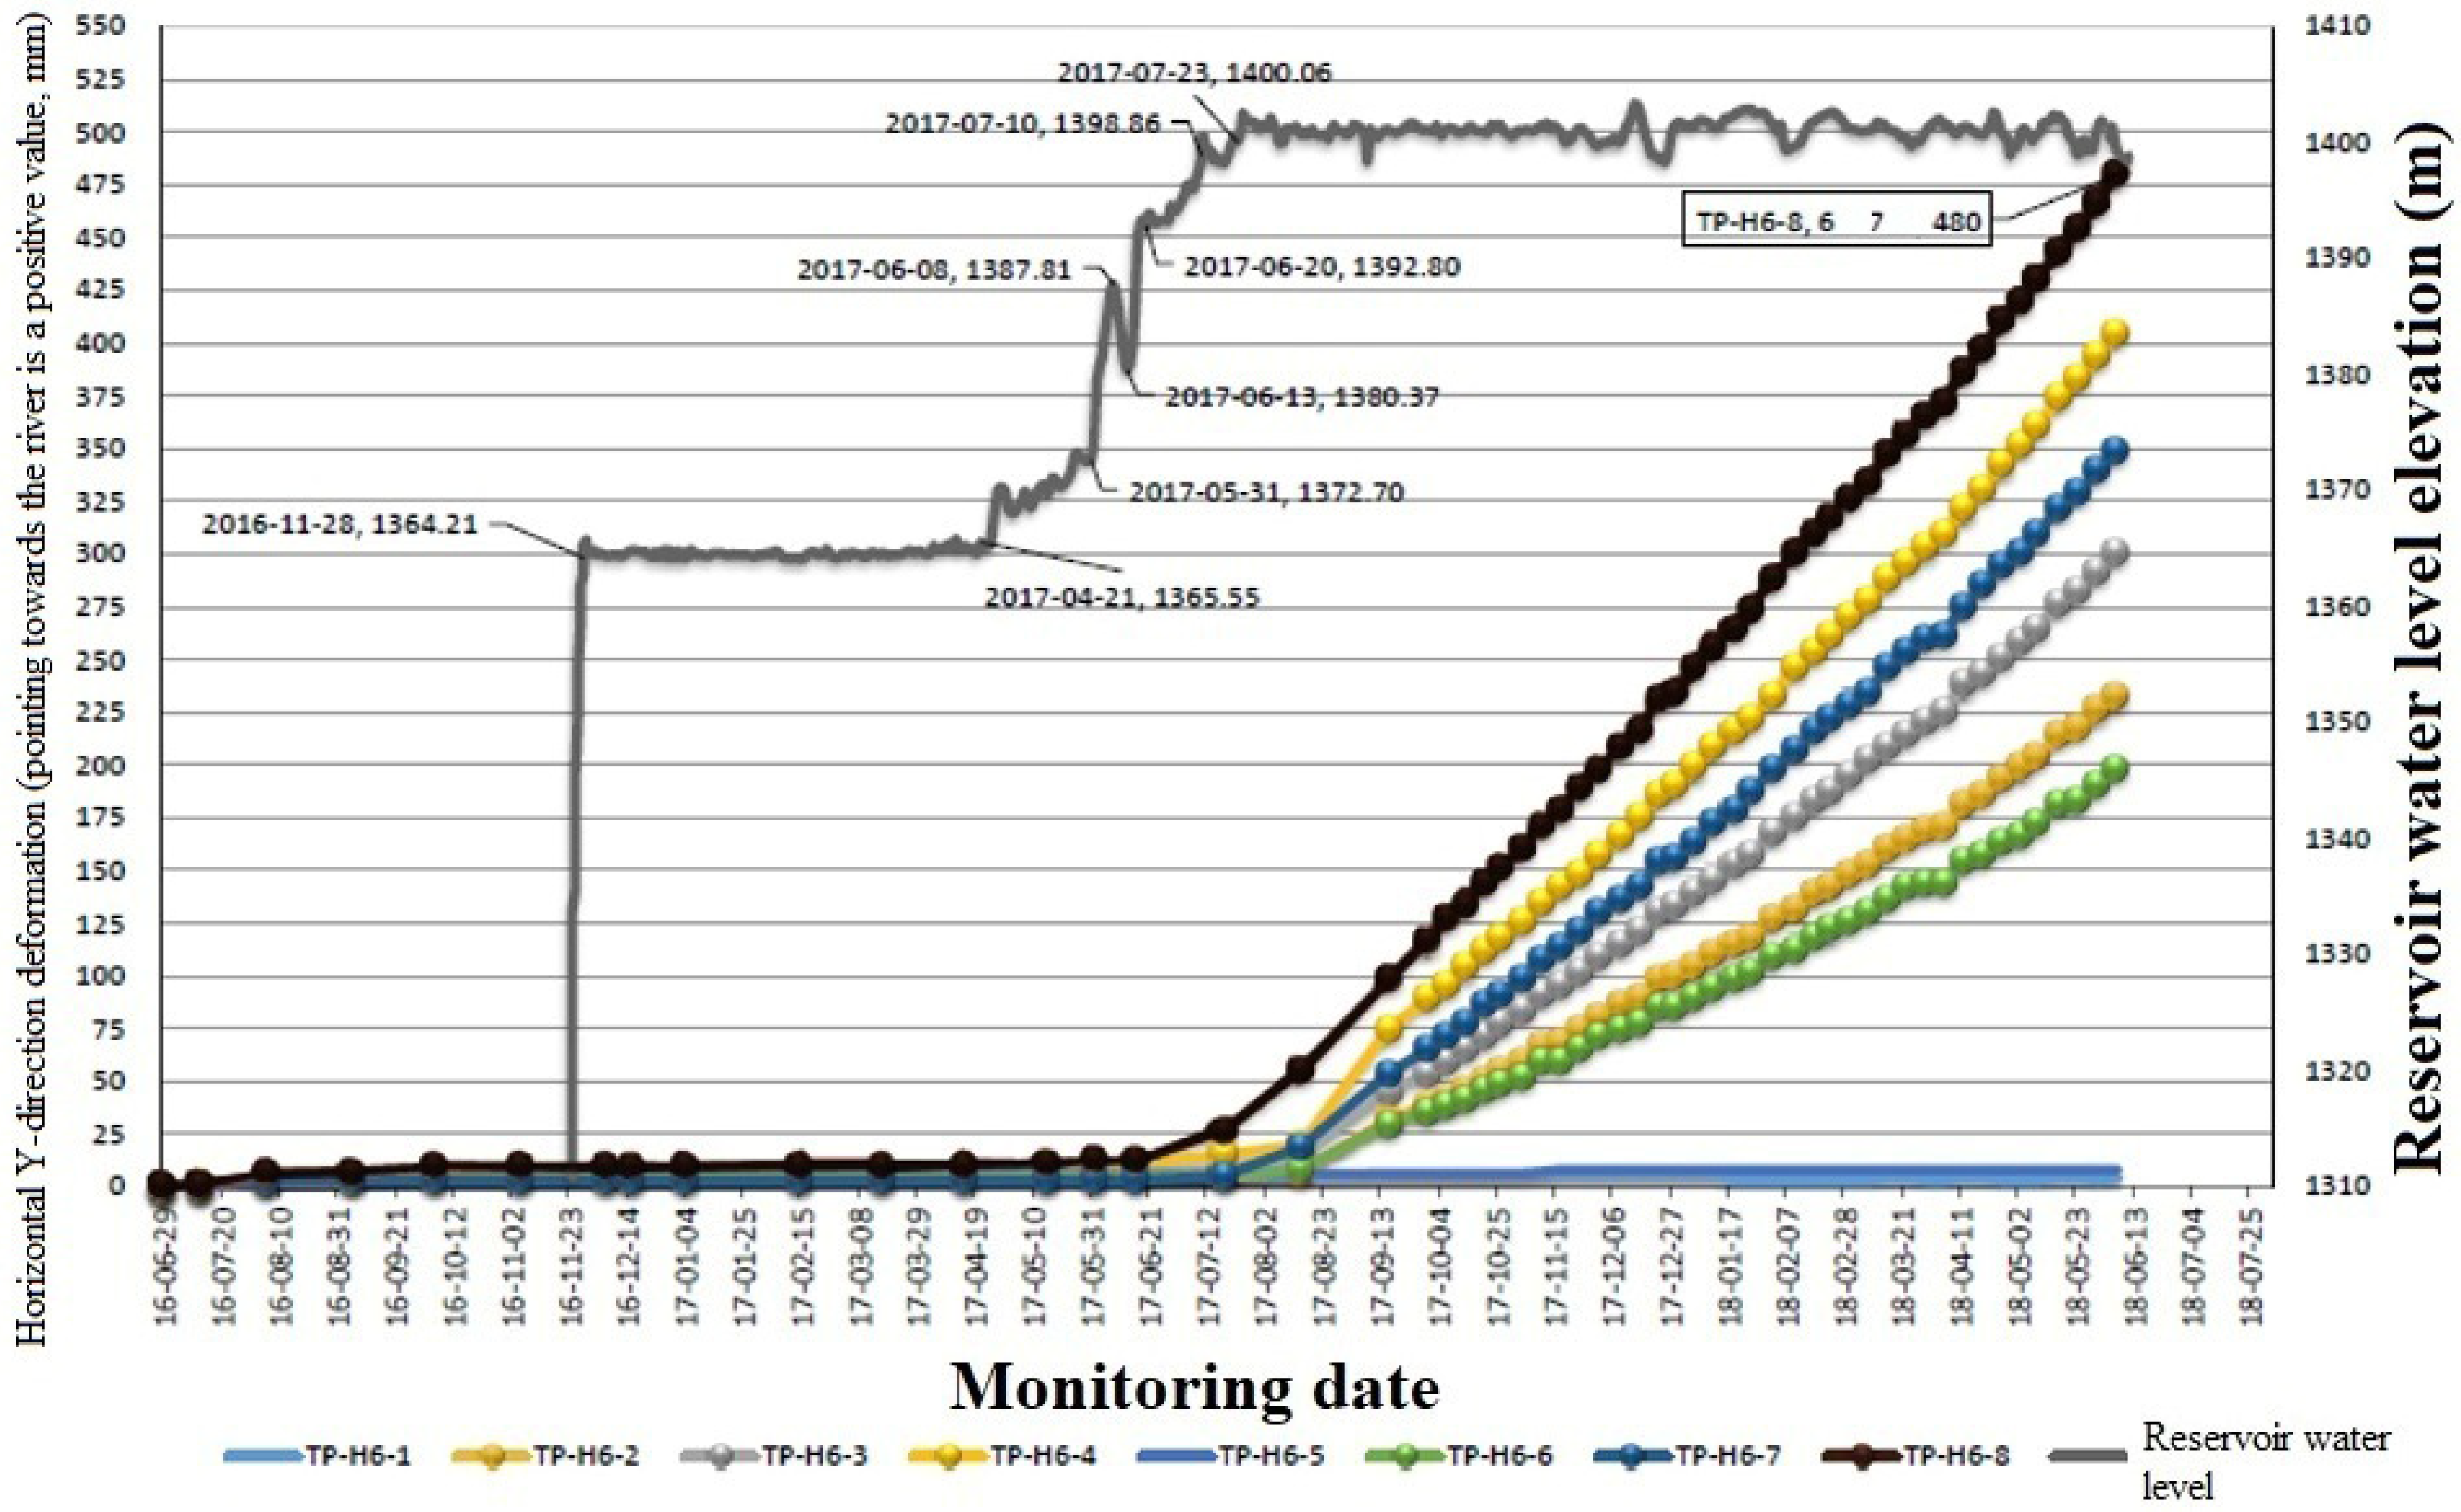
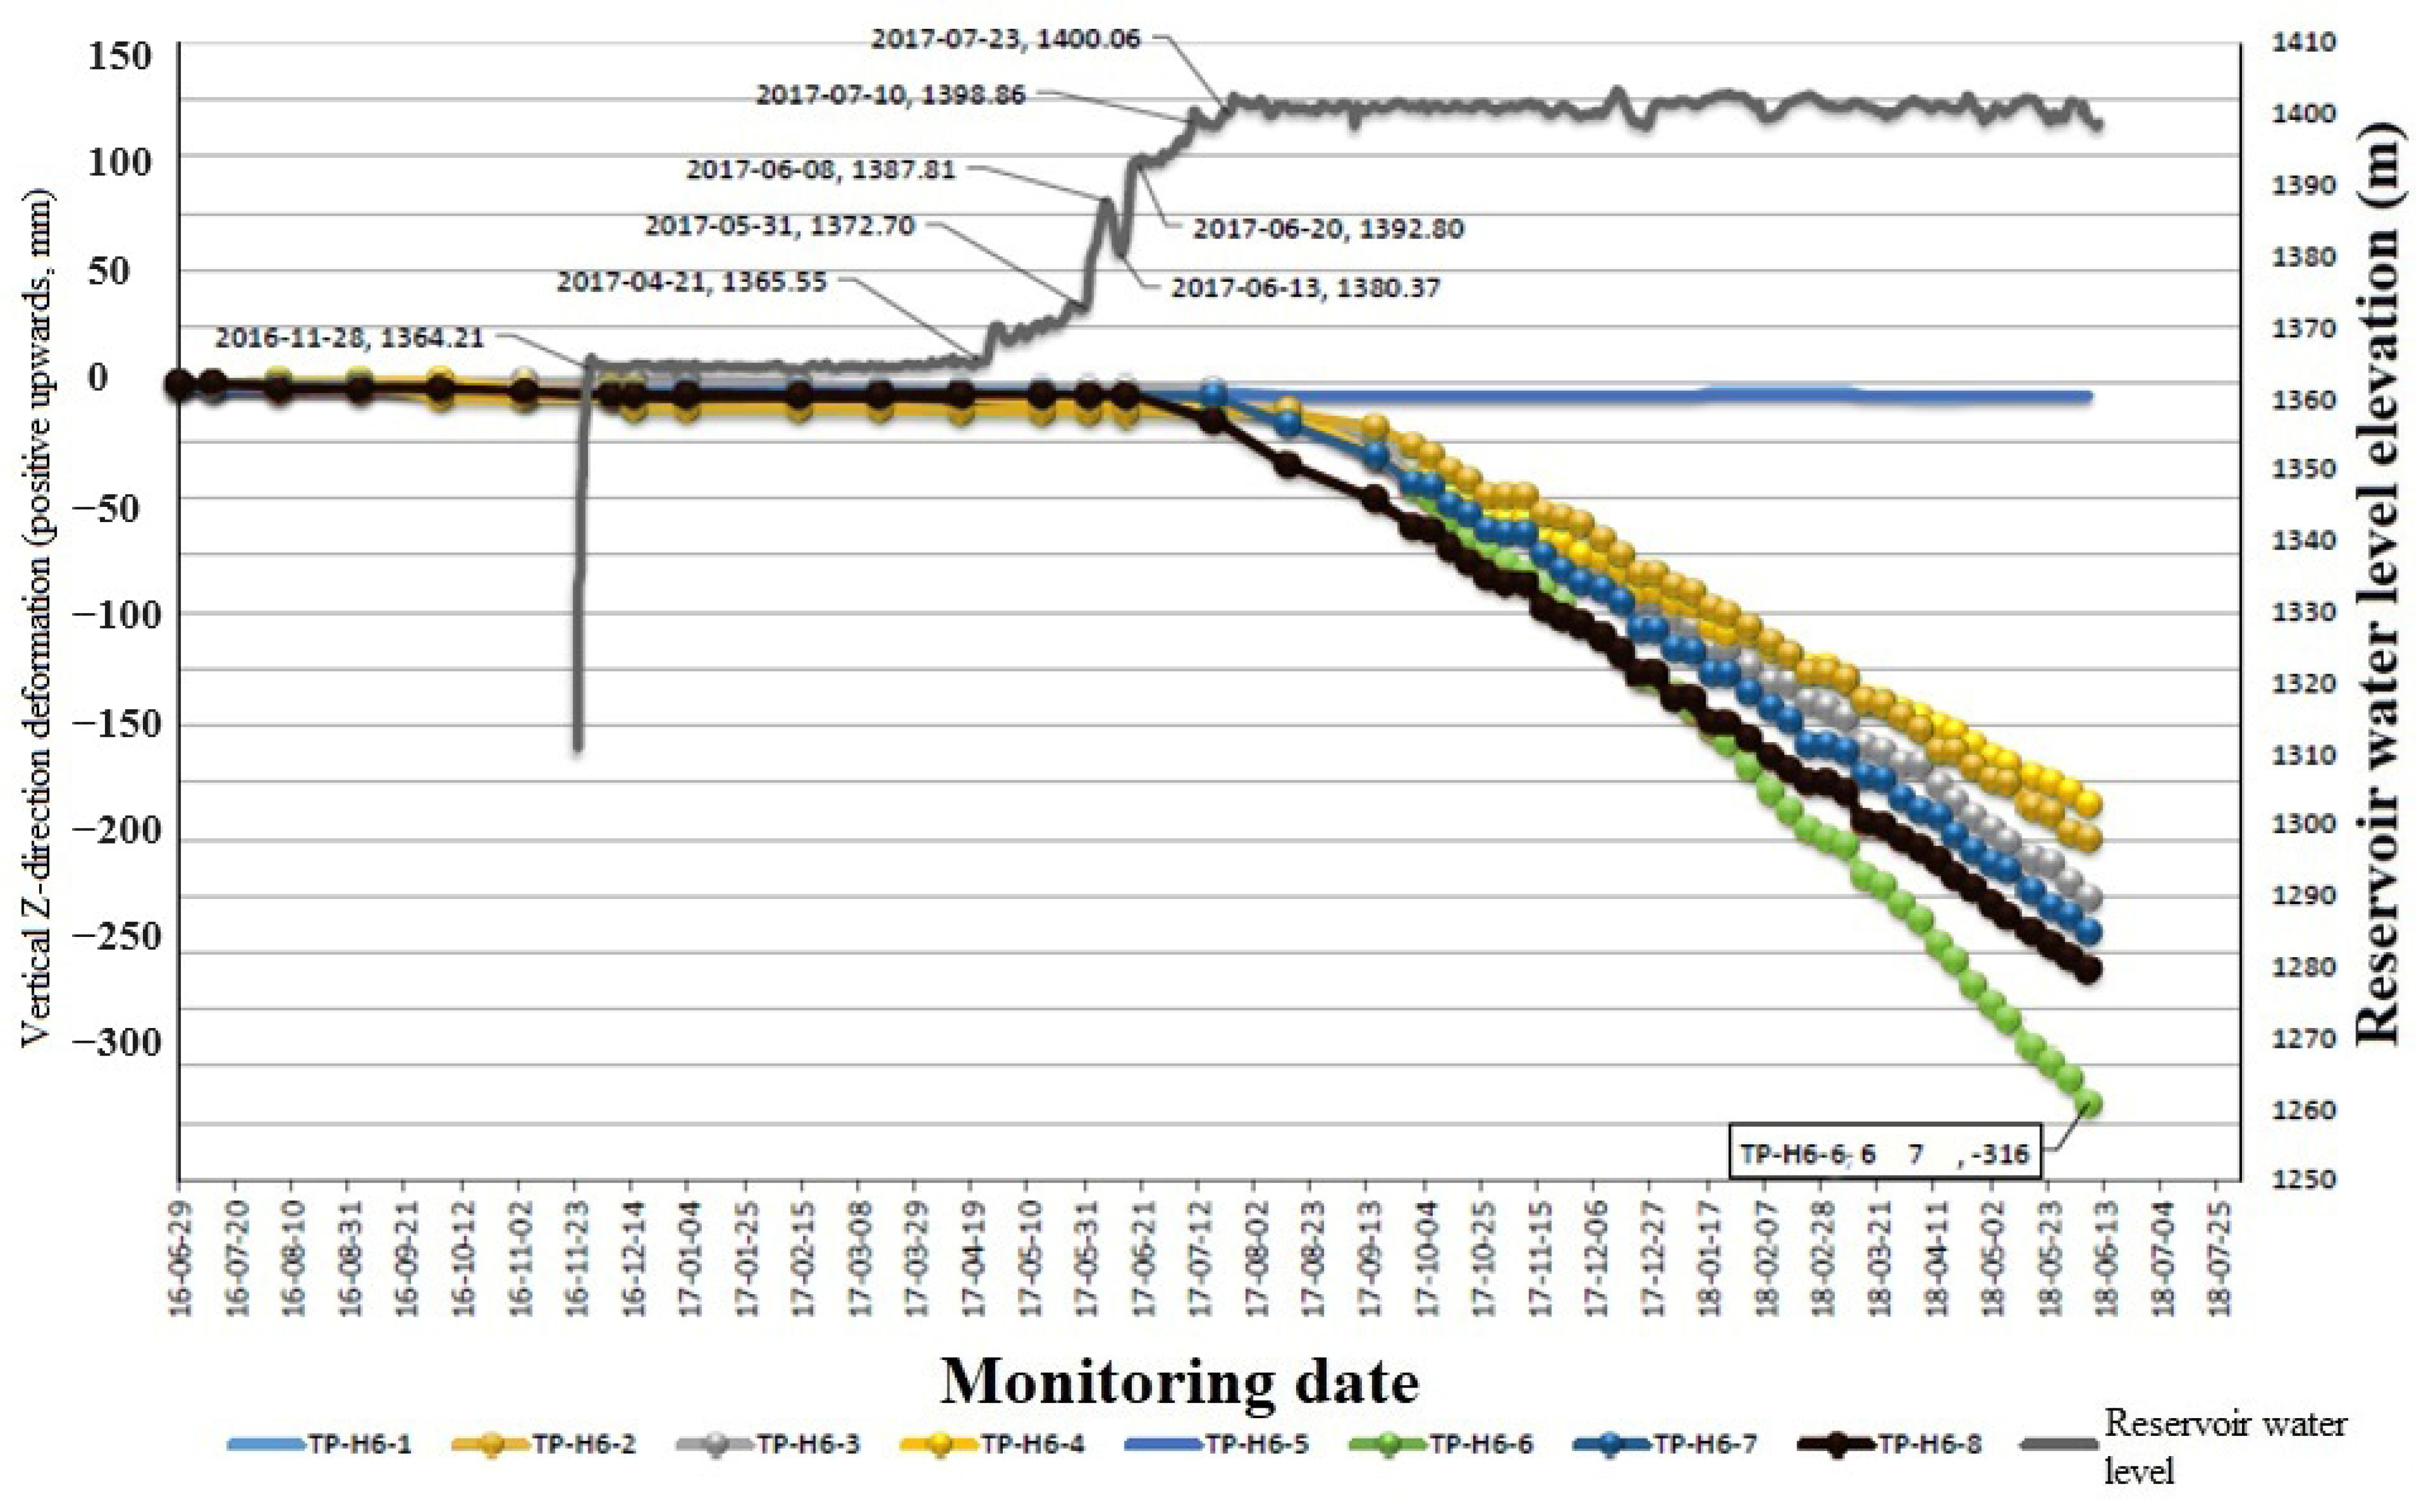
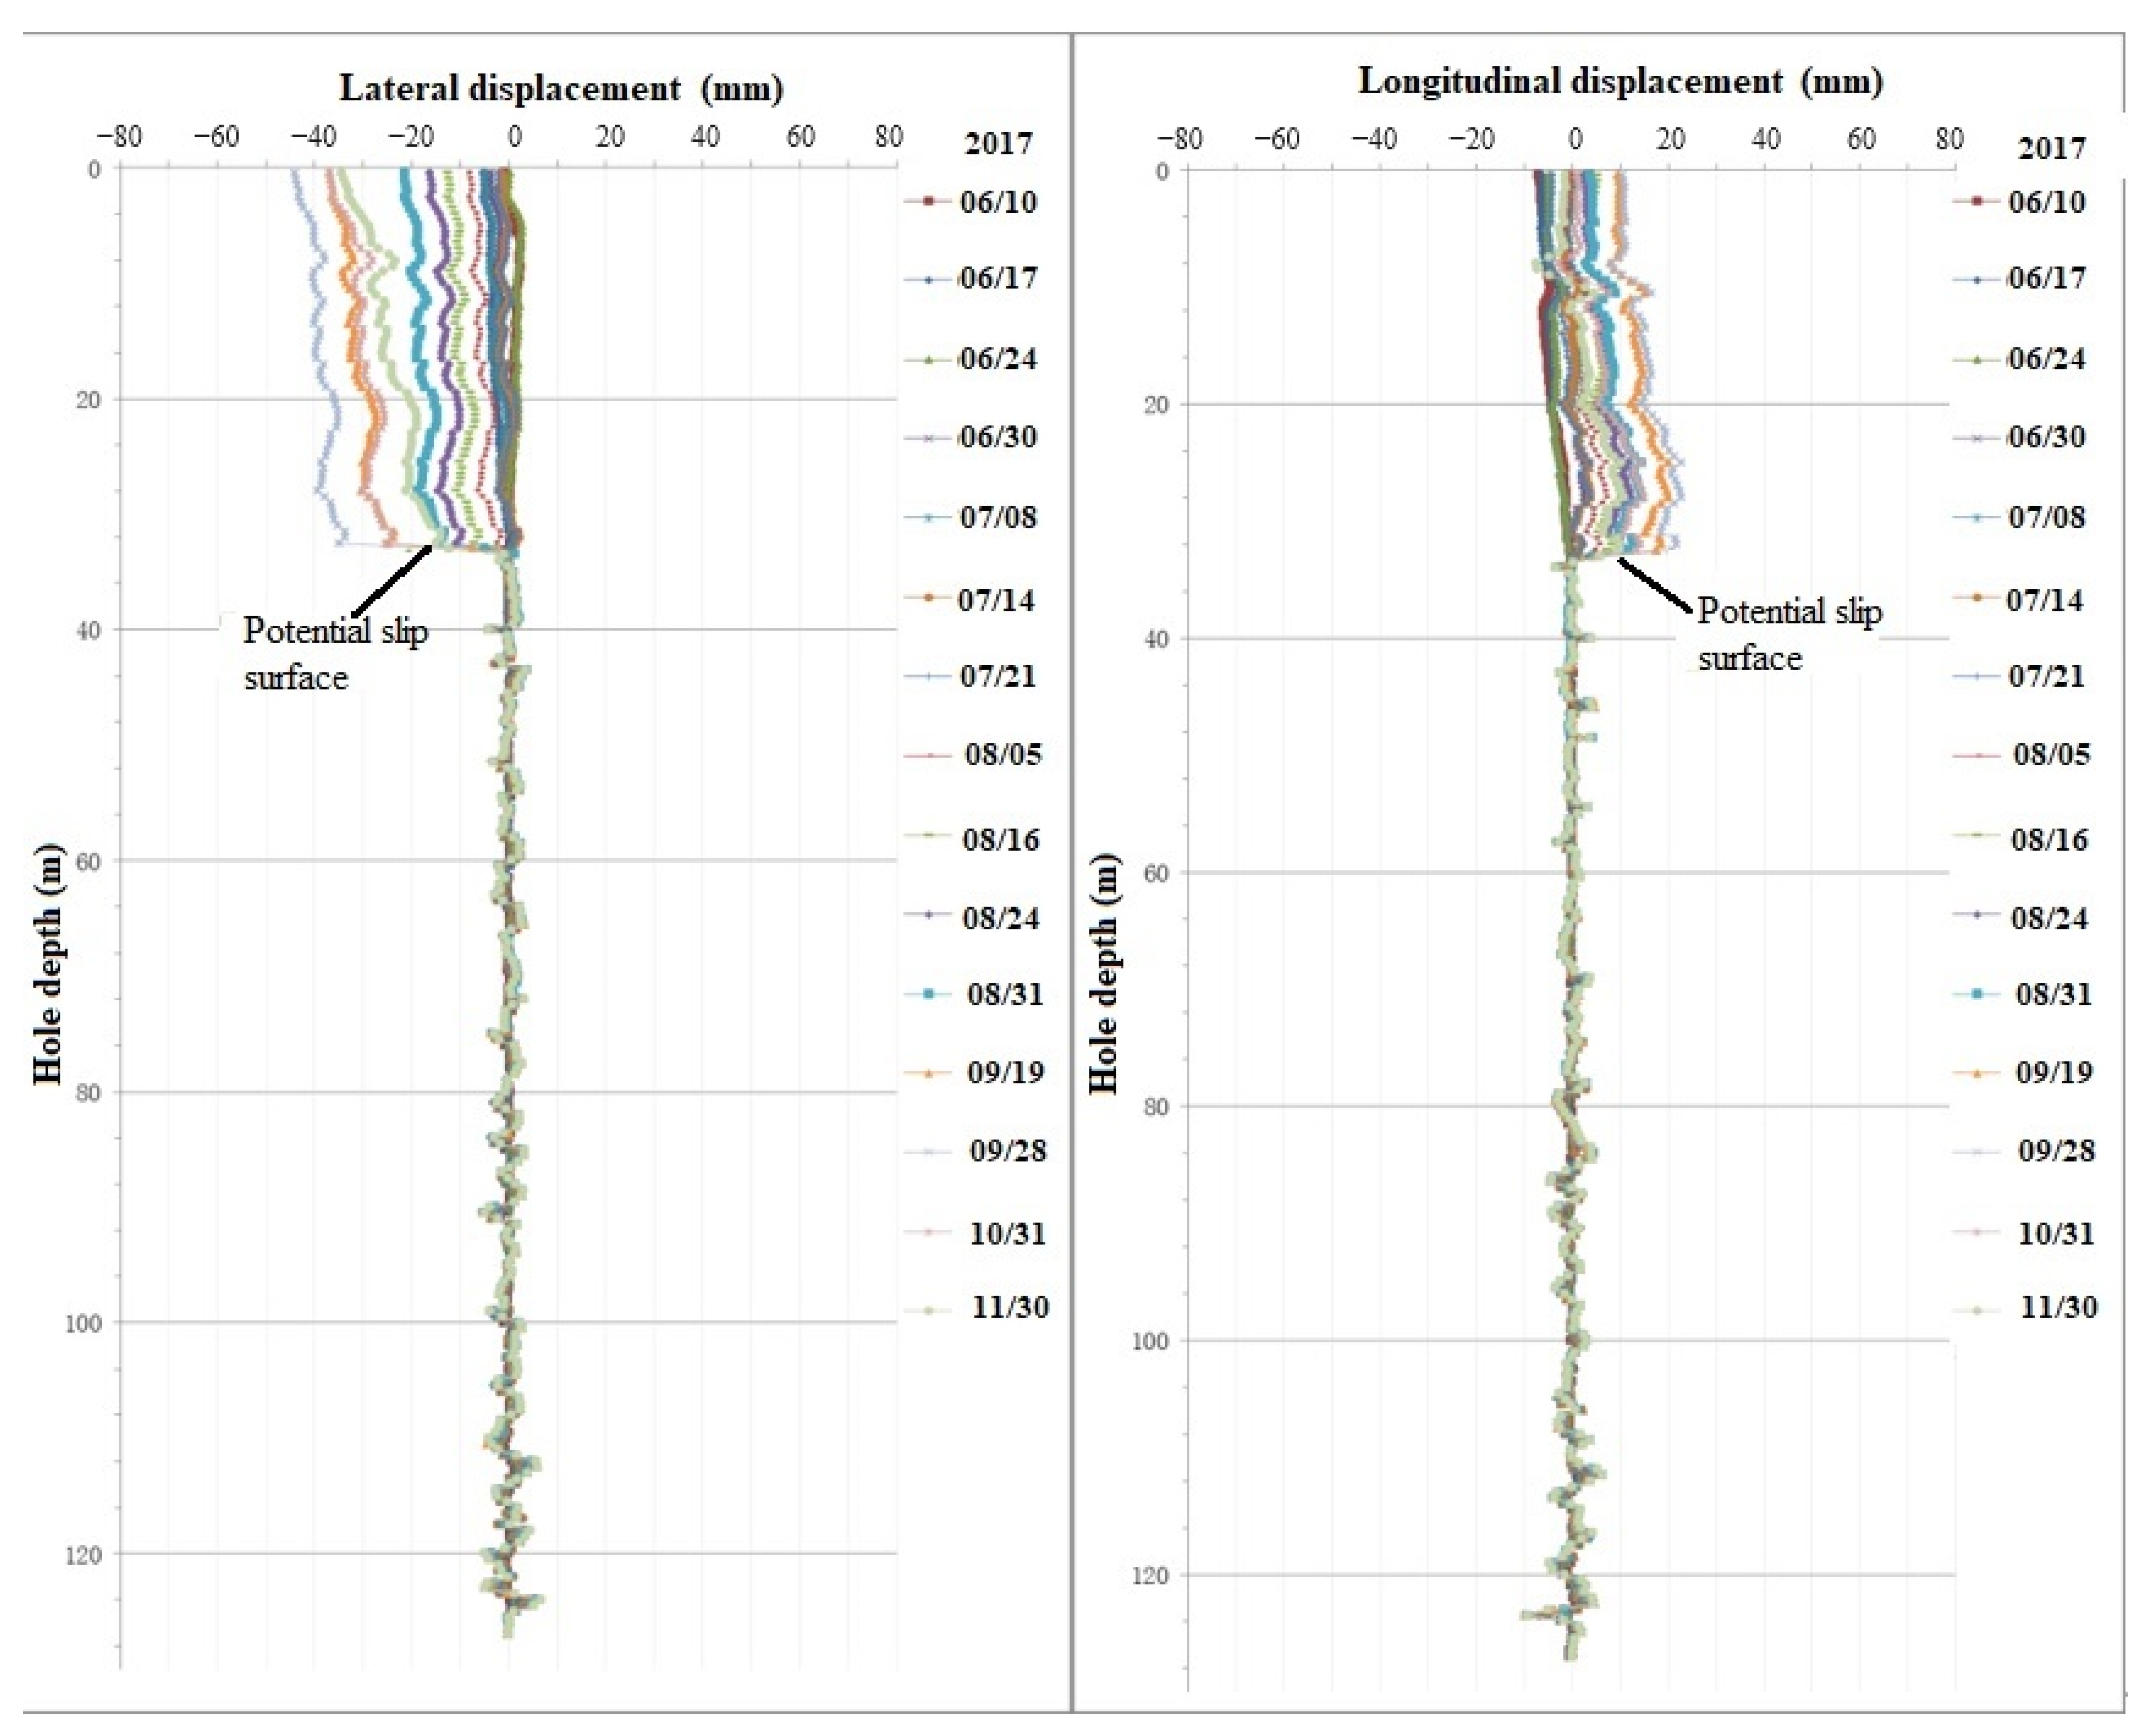
3.2.2. Deformation Monitoring of Landslide

The monitoring of the deformation of the Mala landslide began in June 2016, prior to the impoundment of the reservoir. The monitoring work is divided into surface deformation monitoring and deep deformation monitoring. For surface deformation monitoring, two monitoring sections were arranged with a total of eight monitoring points labeled No. TP-H6-1 to TP-H6-8. The deep deformation monitoring of the Mala landslide was carried out by using the method of exploratory borehole inclination measurement. There were two boreholes labeled ZKKH21 and ZKKH22. The locations of monitoring points are shown in Figure 8.
(1)
Apparent displacement of Mala landslide
The measurement of the initial values for apparent displacement monitoring began from the 24th of June to the 29th of June 2016. Due to the small deformation of the landslide in the early stage, monitoring was conducted once a month. With the increase in water storage elevation, the landslide deformation accelerated on the 16th of September 2017. Afterward, the monitoring frequency was increased and adjusted to one observation per week. As of the 13th of June 2018, the deformation statistical curves of each monitoring point of the Mala landslide in X, Y, and vertical directions are shown in Figure 9, Figure 10 and Figure 11. The X direction is perpendicular to the axis of the landslide. Positive values indicate that the deformation is towards the upstream direction of the Lancang River, while negative values indicate that the deformation is towards the downstream direction of the Lancang River. The Y direction is along the axis of the landslide, with positive values indicating that the deformation is towards the Lancang River and negative values indicating that the deformation is away from the Lancang River. A positive value in the vertical direction indicates that the deformation is upwards, while a negative value indicates that the deformation is downwards.
Based on the analysis of the apparent displacement monitoring results of the Mala landslide, the following conclusions can be drawn.
① Six monitoring points located within the landslide area (numbered TP-H6-2, TP-H6-3, TP-H6-4, TP-H6-6, TP-H6-7, TP-H6-8) experienced deformation after water storage, while two monitoring points outside the landslide area (numbered TP-H6-1, TP-H6-5) showed almost no deformation after water storage.
② The deformation situation of each monitoring point is synchronous, with deformation occurring almost simultaneously. The deformation trend is consistent, but the amount and rate of deformation are different. As of June 2018, the landslide mass is still undergoing deformation, with a maximum displacement of 107 mm in the X direction of the plane (TP-H6-2). The maximum displacement in the Y direction is 480 mm (TP-H6-8), and the maximum vertical displacement is 316 mm (TP-H6-6). The cumulative displacement of each monitoring point is summarized in Table 2.
③ The water level began rising from 21 April 2017 until 13 June 2017. During this period, the displacement of each monitoring point was very small, and there was almost no deformation. During the period of 13 June 2017 to 20 June 2017, the water level suddenly rose at a rate of 1.86 m/d, and the monitoring points began showing significant deformation, which indicated that the buoyancy generated by the sudden rise in water level became an important factor triggering the occurrence of landslides. During the period of 13 June 2017 to 13 September 2017, the deformation curve of each monitoring point was exponential type, and the deformation rate of the landslide continued increasing. After 13 September 2017, the deformation rate of each monitoring point tended to a fixed value, that is, nearly uniform deformation. At this stage, the average deformation rate of each monitoring point in the X direction of the plane, Y direction, and vertical Z direction is shown in Table 3.
④ The deformation situation of each monitoring point is consistent with the statistics of surface cracks. The maximum monitoring point for displacement in the Y-direction of the plane is monitoring point TP-H6-8, corresponding to crack number Hx1-Hx5, with crack widths greater than 10 cm. The maximum displacement in the vertical Z direction is monitoring point TP-H6-2, corresponding to crack number Hh3-Hh6.
(2)
Deep displacement monitoring of landslides
The initial deep monitoring began on the 3rd of June 2017 and was conducted twice a month. The frequency of observations was appropriately increased based on the water storage situation. On the 30th of October 2017, the inclinometer tube was cut off by the slide, and monitoring ceased on the 30th of November 2017. The time-dependent displacement curves for rock and soil at different depths in monitoring holes ZKKH21 and ZKKH22 are shown in Figure 12 and Figure 13.
According to the analysis of the deep displacement curve, the longitudinal displacement of borehole ZKKH21 sharply increases at a depth of 32.5 m, which is consistent with the characteristics of shear displacement. The monitoring curve below 32.5 m shows an “S” shape with a small displacement. Considering the significant deformation of the inclinometer tube at a depth of 32.5 m, which prevented monitoring below that depth, it is believed that the potential slip surface depth of borehole ZKKH21 is approximately 32.5 m. Similarly, it can be concluded that the potential slip surface depth of borehole ZKKH22 is approximately 72.0 m.
Based on the monitoring data of the apparent displacement at the Mala landslide, it can be concluded that the initial sliding of the Mala landslide is closely linked to rapid water buildup. Under the current water levels, the surface rock and soil of the Mala landslide are sliding towards the direction of the Lancang River at a nearly uniform speed. The displacement monitoring of the deep borehole indicates that the longitudinal displacement in borehole ZKKH21 tends to stabilize, while the longitudinal displacement in borehole ZKKH22 is increasing at a low rate towards the direction of the Lancang River. Based on the above analysis, it is believed that the Mala landslide is currently in a sliding state, and stability predictions and disaster impact assessments for the Mala landslide are particularly significant.

3.3. Analysis of Factors Influencing Landslide Stability and Evolution Process

3.3.1. The Impact of Reservoir Storage on Landslides

According to apparent displacement monitoring data, there was almost no displacement at each monitoring point before mid-June 2017. At that time, the reservoir water level did not rise near the landslide, and the landslide was in a stable state. The initial deformation of the Mala landslide began in mid-June 2017, with the reservoir water level increasing from the elevation of 1372.7 m to 1392.8 m. As the reservoir water returned to the vicinity of the landslide, the monitoring point TP-H6-8 began to deform. In late July 2017, the water level rose from 1392.8 meters to 1401 meters, leading to an increase in the extent of bank collapse at the front edge of the landslide. The monitoring points from the front edge to the rear edge of the landslide also underwent deformation successively. From late July 2017 to September 2017, the water level remained stable, and the monitoring points within the landslide body deformed at a small rate. After September 2017, the deformation accelerated and increased rapidly at nearly uniform acceleration. It can be seen that the deformation of monitoring points is directly related to the water storage of the reservoir. The main influences of reservoir water storage on landslides are as follows. ① Under the influence of buoyancy, during the period of rapid water-level rise, river water is unable to quickly penetrate into the pores inside the landslide rock and soil, which leads to a lifting effect on the landslide rock and soil, especially rocks and soil around the front edge. According to previous survey data, the front edge of the ancient landslide is located below 1401 m, so the rocks and soil near the front edge of the landslide body are relatively loose, which leads that the bank collapse is prone to occur easily by a sudden rise in the water level. ② The impact of water level difference also has a certain effect on the formation of landslides. During the stage of rapid decline in water level, the interstitial water that has already infiltrated into the landslide body cannot be discharged in time, while the water level on the river surface has decreased. Under the effect of water level difference, the accumulated water inside the landslide body exerts a force towards the Lancang River. Therefore, under this force, the landslide body is prone to a comprehensive sliding trend. ③ Soaking softening effect: Based on the compositional characteristics of the rock and soil mass of the landslide, it can be seen that the cover layer consists largely of fragmented stones, interspersed with a small amount of silty clay, which has poor cohesion and is prone to decomposition upon soaking. The bedrock is Jurassic slate, with large pores, poor cementation, a high shale content, and prone to softening upon soaking. The strength of the softened rock layer exhibits significant differences compared with its pre-softening state.

3.3.2. The Impact of Concentrated Rainfall on Landslide

The climate type of the landslide area is subtropical monsoon climate, with significant rainfall. The rainfall is concentrated mainly from June to October, particularly from August to September, with the average monthly rainfall amounting to 150.9 mm. According to the statistics of apparent monitoring displacement, it was found that the deformation of each monitoring point within the landslide body has accelerated and rapidly increased at a nearly uniform rate since September 2017. At this stage, the water level has been maintained at the elevation of 1401 m. The previous crack record data indicates that cracks appeared within the landslide in September 2017, so it is suspected that concentrated rainfall was responsible for promoting the accelerated sliding of the landslide. Based on the daily rainfall data obtained from the hydrological station from June 2016 to June 2018 in the landslide area, a relationship diagram has been created between the deformation in the Y-direction of the landslide plane and rainfall. It can be seen that concentrated rainfall occurred in the landslide area from June to October 2017, with a maximum daily rainfall of 40 mm. The rainwater seeped downward along the gaps in the rock and soil inside the landslide body, and cracks appeared on the surface. The width of the cracks increased under the action of water pressure due to the accumulated rainwater in the cracks. At the same time, rainwater also has a certain effect on the rock and soil mass of the landslide zone while increasing the weight of the landslide body, which leads to the rapid decline of the landslide. The trend of a nearly uniform increase in displacement at each monitoring point after October 2017 also indicates that concentrated rainfall played an important role in accelerating the sliding of slide masses (see Figure 14).

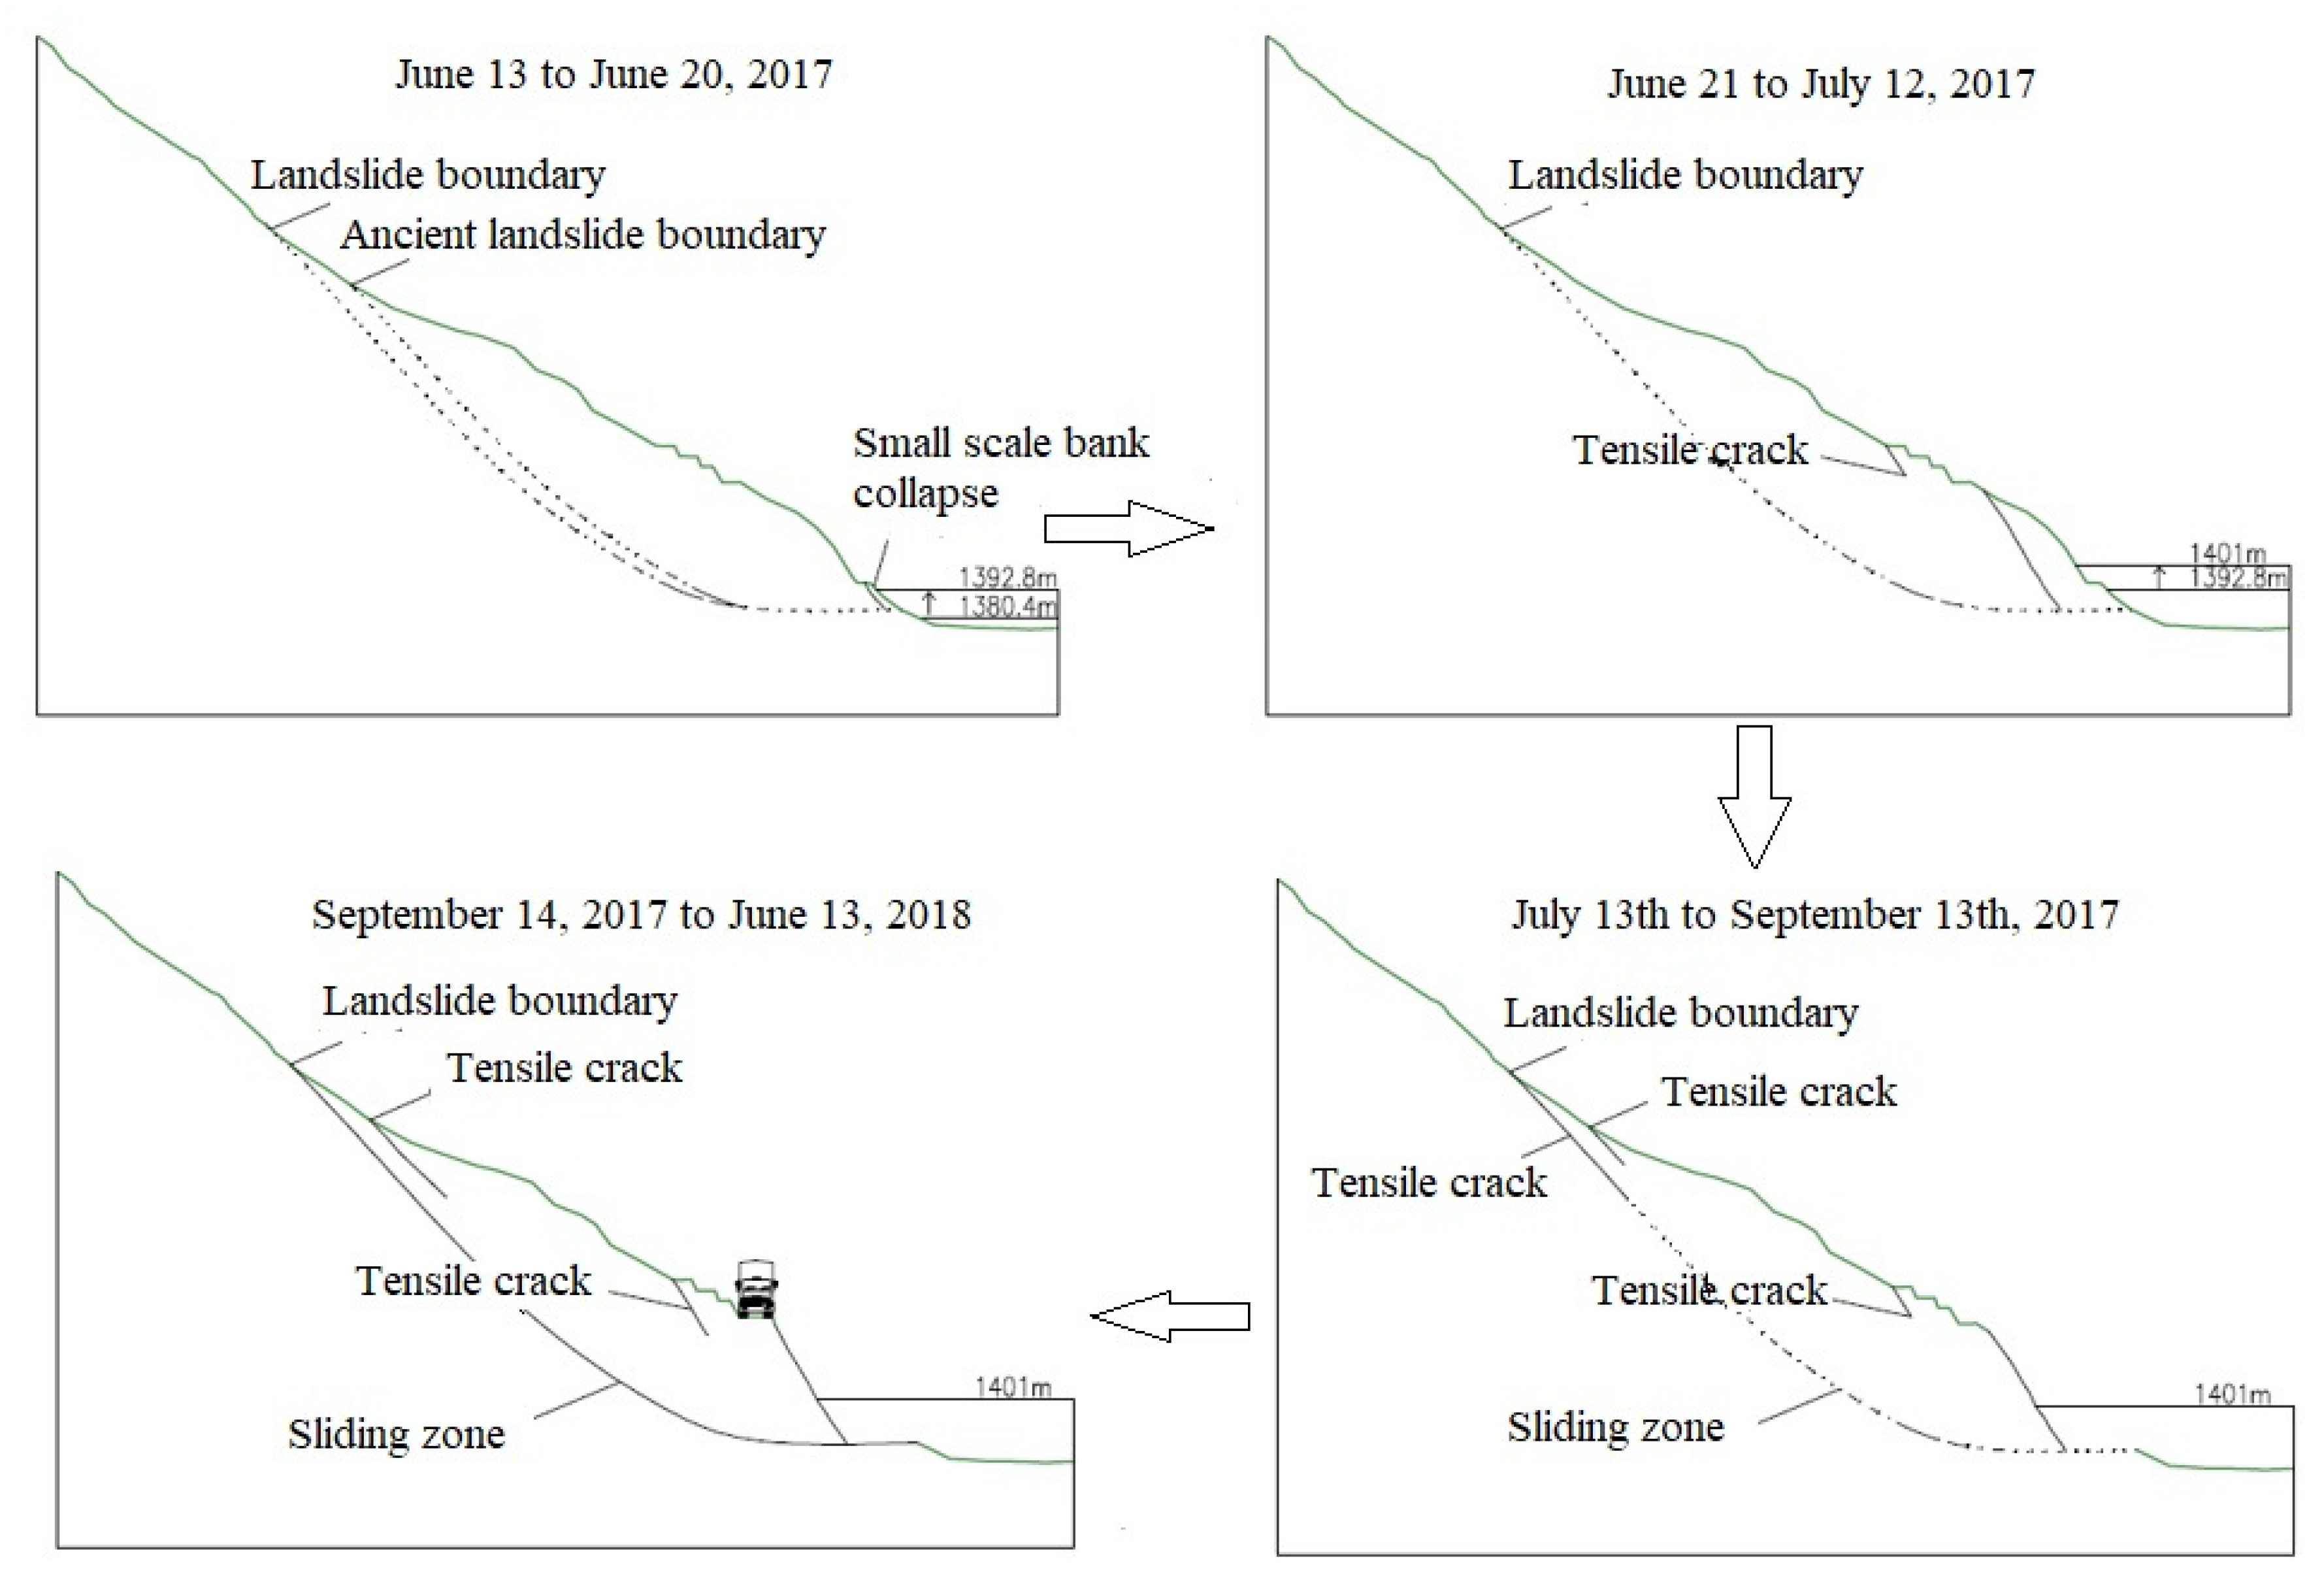
3.3.3. Analysis of Landslide Evolution Process

By comprehensively analyzing the surface displacement monitoring, deep borehole displacement monitoring, and crack development of landslide bodies, the development process of landslide is divided into four stages, as shown in Figure 15.
(1)
Small-scale bank collapse stage (13 June to 20 June 2017)
The water level in the reservoir area increased from 1380.4 m at an average rate of 1.77 m per day to 1392.8 m. During this process, the horizontal section at the front edge of the ancient landslide became immersed in the reservoir water so that the rock and soil at the front edge loose. Under the buoyancy force generated by the sudden rise in water level, there was a small area of bank collapse occurred in the riverside part of the slope.
(2)
Creep deformation stage (21 June to 12 July 2017)
The water level in the reservoir area increased from 1392.8 m at an average rate of 0.39 m per day to 1401 m. During this process, the horizontal section at the front edge of the ancient landslide was immersed in the reservoir water for only one month. Because the rock and soil mass at the front edge consists of crushed stone mixed with silty clay and strongly weathered slate, it has a low bonding force and is prone to decomposition under immersion, which results in a decrease in the mechanical strength of strongly weathered slate. Under the impact of rising water levels and river erosion, large-scale bank collapse occurs at the front edge of the slope, and the bank collapse is concentrated at the protruding positions of the rock and soil in the middle and downstream of the slope. The collapse of the bank results in the disappearance of the force at the foot of the slope that blocks the downward movement of the upper rock and soil, and overall deformation of the slope begins to occur, manifested as slow creep deformation. At the same time, cracks began to appear at the first stage of small-scale bank collapse at the front edge, and the speed of landslides during this stage was very small.
(3)
Accelerated sliding stage (13 July to 13 September 2017)
At this stage, the water level in the reservoir remained at an elevation of around 1401 m, while there was a continuous heavy rainfall in the landslide area, with daily rainfall reaching 40 mm. The rainwater seeps downward along the gaps within the rock and soil mass, increasing the density of the rock and soil mass, leading to an increase in the deformation of the large-scale landslide and increasing the number of cracks within the slope. At the same time, the rainwater can also penetrate into these cracks, generating water pressure within the cracks that causes them to widen and deepen further, which also serves to soften the rock and soil mass within the sliding zone. This cycle results in a sharp increase in the deformation rate of the slope mass. At this stage, the deformation rate of the slope mass increases rapidly, and the displacement curve exhibits an “exponential” pattern.
(4)
Uniform sliding stage (14 September to 13, June 2017)
At this stage, the rainfall is relatively little, and the water level in the reservoir has remained stable at an elevation of around 1401 m. The self-weight load and vibration load generated by vehicles passing along the riverside road every day promote the sliding of the large-scale landslide mass. At this stage, the sliding zone of the landslide body is essentially continuous, and the sliding body slides towards the direction of the Lancang River at a nearly uniform speed.

4. Prediction Results of Landslide Deformation Trend Considering Hydrodynamic Effects

The two-dimensional profile deformation of the landslide body has been simulated, taking into account the deformation trend under the hydrodynamic action of the landslide, and the profile KH9 that is consistent with the main sliding direction of the landslide body has been selected to analyze the stability and deformation situation. The stability and deformation of the profile under three conditions of a 1401 m water-level situation, rainfall superimposition, and earthquake are studied. The deformation simulation of the 1401 m water-level situation is carried out using the SIGMA module within Geo- GeoStudio 2007 software for numerical simulation. The deformation simulation of rainfall conditions adopts the coupled calculation method of the SEEP module and SIGMA module within Geo-Slope software. The deformation simulation of earthquake conditions adopts the coupled calculation method of the SLOPE module and SIGMA module within Geo-Slope software.

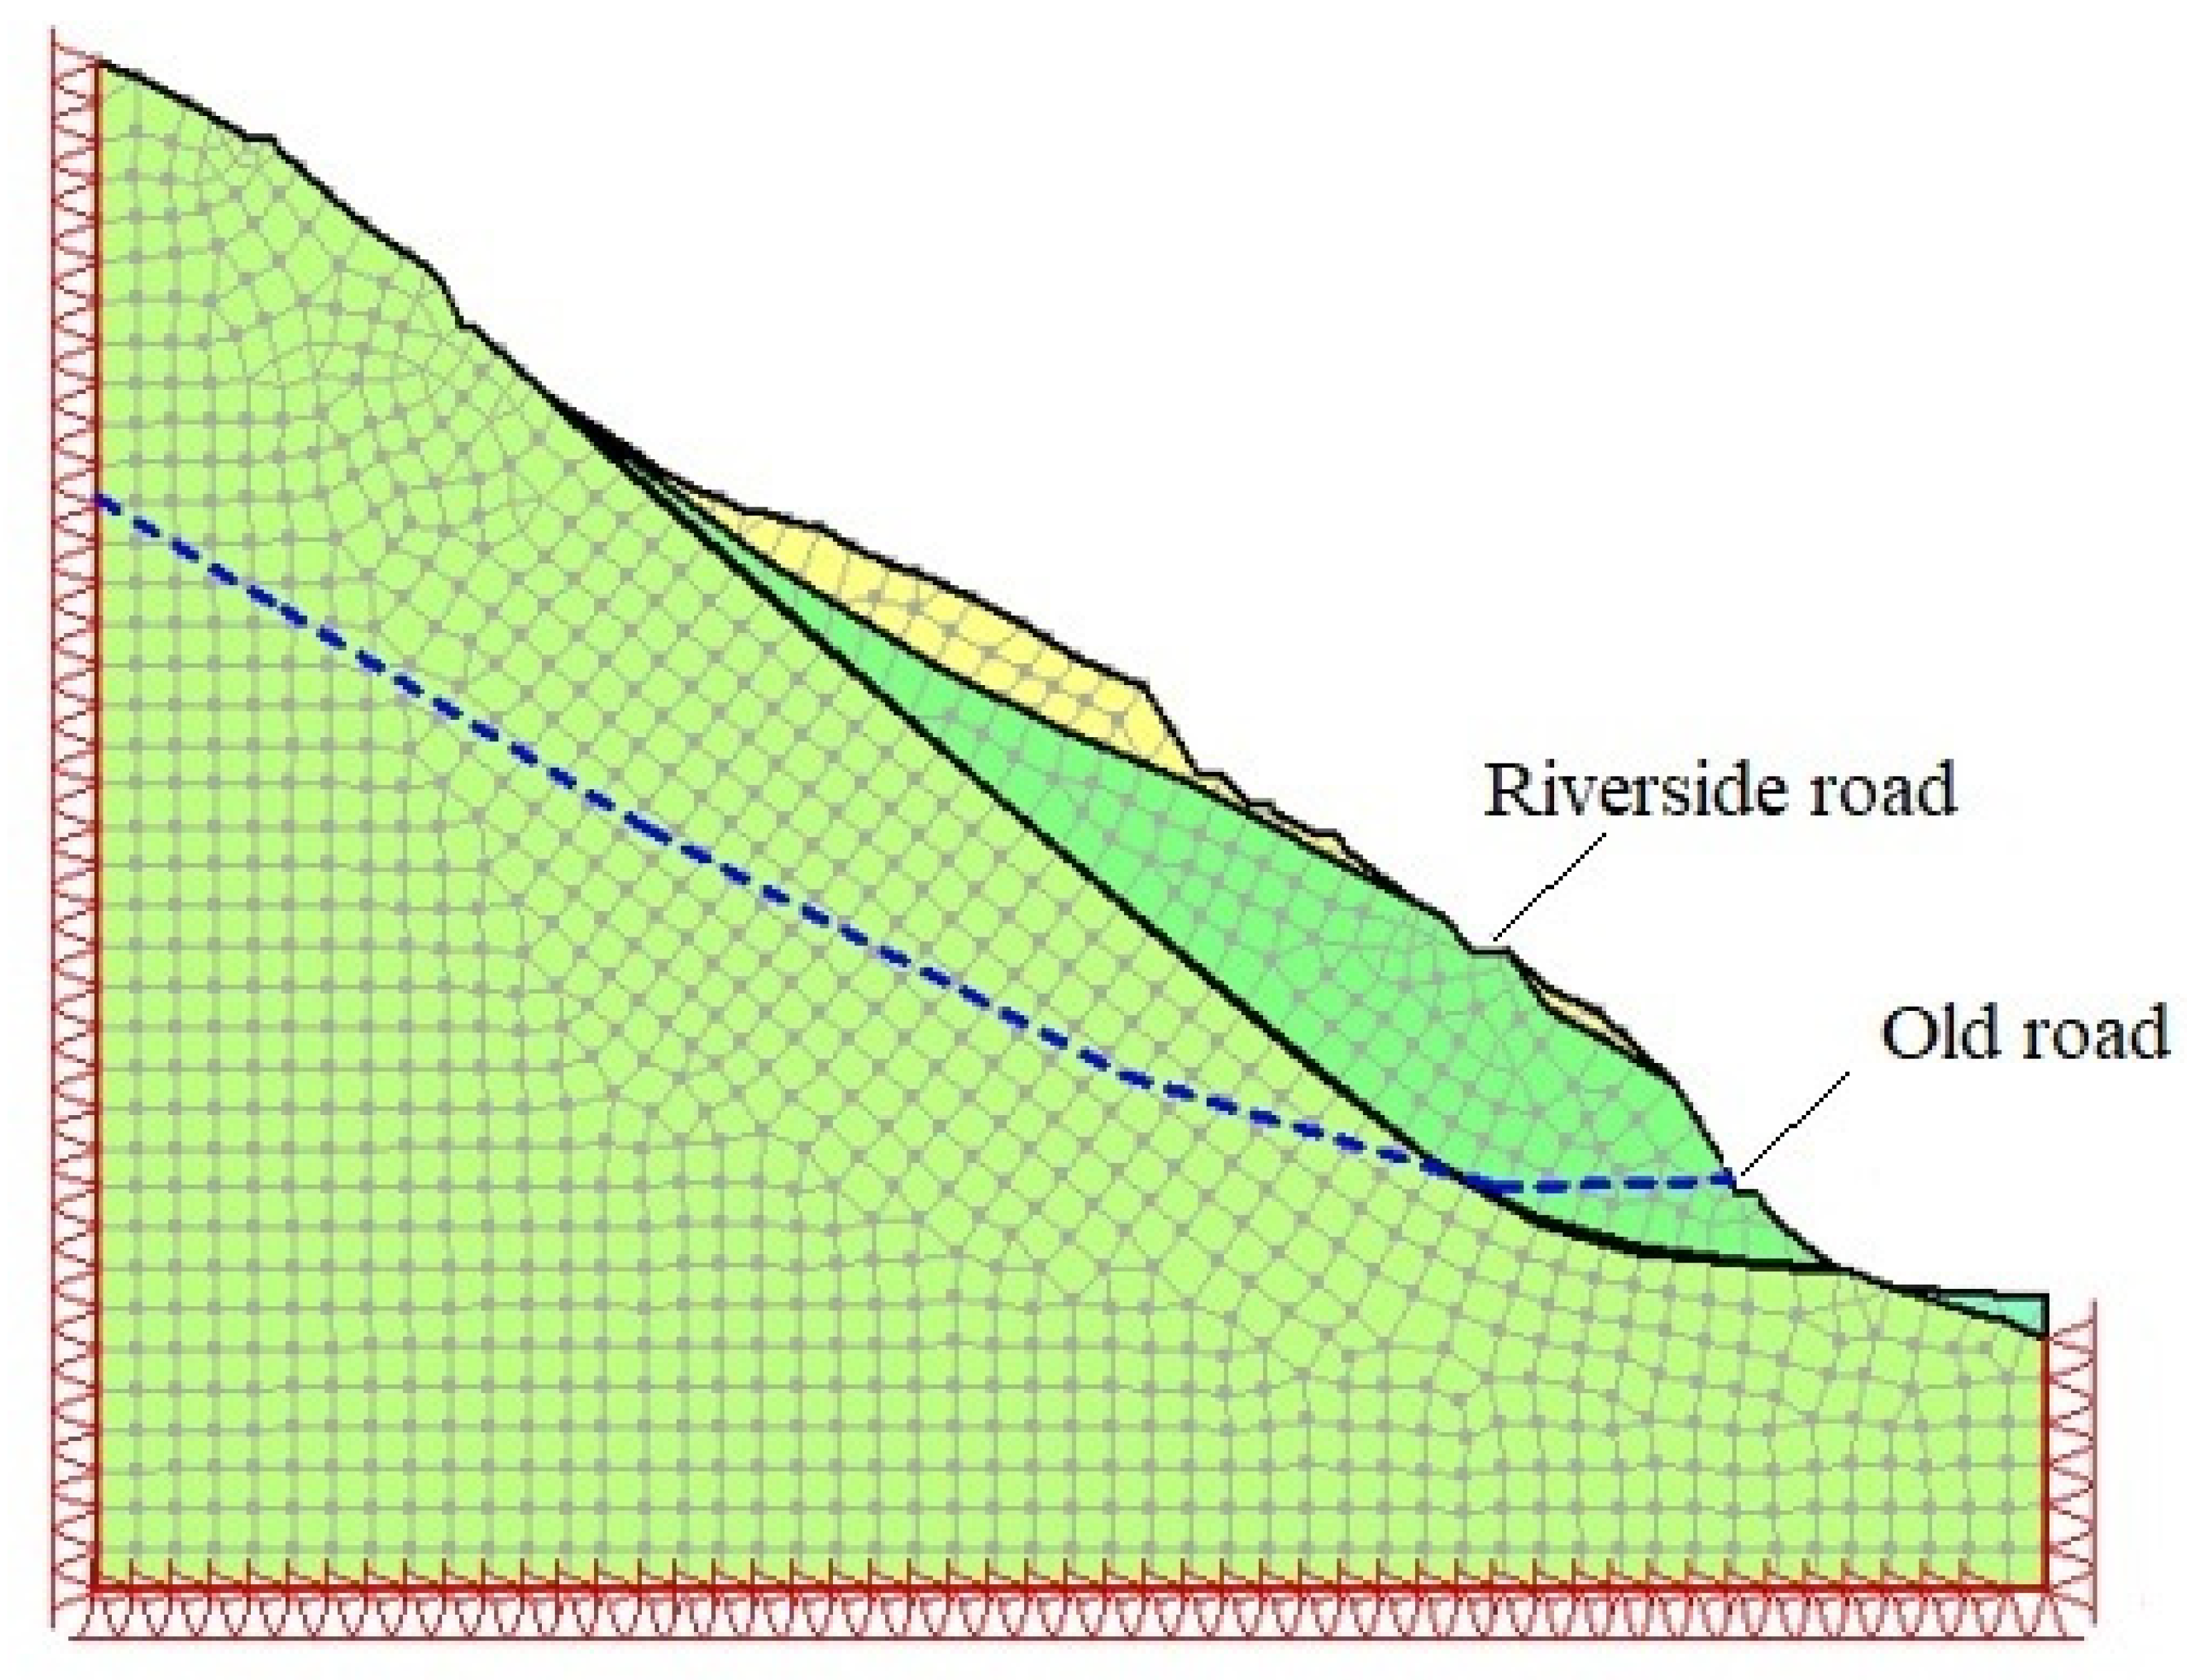
4.1. Calculation Parameters and Models

According to the engineering analogy and soil test results, the physical and mechanical parameters of each rock and soil layer in the numerical simulation are shown in Table 4.
The deformation simulation model for the storage condition of section KH9 1401 m is shown in Figure 16. Fixed X boundary conditions are applied to the left and right sides of the model, and fixed X/Y boundary conditions are applied to the bottom. Each rock and soil layer is divided into grids, with a minimum grid size of 10 m.

4.2. Deformation Simulation of 1401 m Water Storage Condition

The two-dimensional finite element calculation results for section KH9 under 1401 m water storage conditions (Figure 17) indicate that the deformation area is distributed throughout the range of the sliding mass. The displacement at the front edge is greater than that at the rear edge, and the displacement of the surface layer is greater than that of the deep layer of the sliding mass. The maximum and minimum principal stress diagram shows that the maximum principal stress in the 1401 m water storage slope is evenly distributed in layers. Shear stress concentration occurs in the middle and bottom of the slip zone, and tensile stress concentration occurs at the rear edge of the slip mass. The slip mass shows the trend of leading edge traction and trailing edge rock mass sliding.

4.3. Deformation Simulation of Rainstorm Conditions

The deformation simulation model for the storage condition of section KH9 is consistent with the natural conditions. Potential seepage surface boundary conditions are set on the slope surface above the water level, and zero pressure boundary conditions are set on the rock and soil below the water level, as shown in Figure 18.
Unlike the 1401 m water storage condition, the displacement of the sliding mass under rainfall conditions is greater, with a maximum displacement of 80.5 cm. Under the action of rainfall, rainwater infiltrates into the sliding mass along the cracks distributed in the pores of the rock and soil mass and within the scope of the sliding mass, resulting in an increase in the gravity of the sliding mass and a decrease in the physical and mechanical parameters of the sliding zone. Therefore, the stress concentration near the sliding zone is more pronounced in the maximum principal stress nephogram. The maximum principal stress value can reach 4.0 MPa, while in the minimum principal stress cloud map, the trailing edge of the sliding mass shows an increase in tension area, with the maximum displacement area concentrated near the leading edge of the sliding mass, and the displacement at the trailing edge is relatively small, as shown in Figure 19.

4.4. Deformation Simulation under Earthquake Conditions

The deformation simulation model for section KH9 under seismic conditions is consistent with the natural conditions, and a seismic load with a horizontal seismic coefficient of 0.1 is applied internally to the model.
The numerical simulation results under seismic conditions for section KH9 water storage (Figure 20) show that the overall displacement of the slope is relatively large, with a maximum displacement of 92.1 cm. Unlike the conditions of water storage and rainstorms, the seismic condition is characterized by overall collapse deformation, and the stress concentration value of the sliding belt is between 1.5 MPa and 2.5 MPa, with the stress concentration inside the sliding body not being particularly pronounced. The landslide accumulation blocks and crushed stones that are mainly distributed within the sliding body experience collapse under strong seismic action, and the loose rock and soil in the lower part provide space for the upper rock and soil, resulting in a continuous effect that is similar to a “domino effect”. This phenomenon is common in fragmented accumulation bodies and toppling rock masses.

5. Conclusions

The deformation mechanisms of rocky bank slopes in high mountain canyon reservoirs are diverse, and the results of this study are applicable to the stability analysis and deformation development trend of water-related bank landslides in high mountain canyon reservoirs. The research results provide a solution and analysis approach for similar problems in other practical projects. The following research results have been achieved in this study.
(1)
Based on the statistical analysis of the extension direction and width of cracks exposed within the landslide area, it is concluded that the overall sliding direction of the landslide is towards the downstream side of the Lancang River. The position of the center of gravity of the sliding mass is speculated to be located in the middle downstream part of the sliding mass, and there may be a protruding locking section on the right side of the landslide mass, which could block the sliding of the upstream rock and soil.
(2)
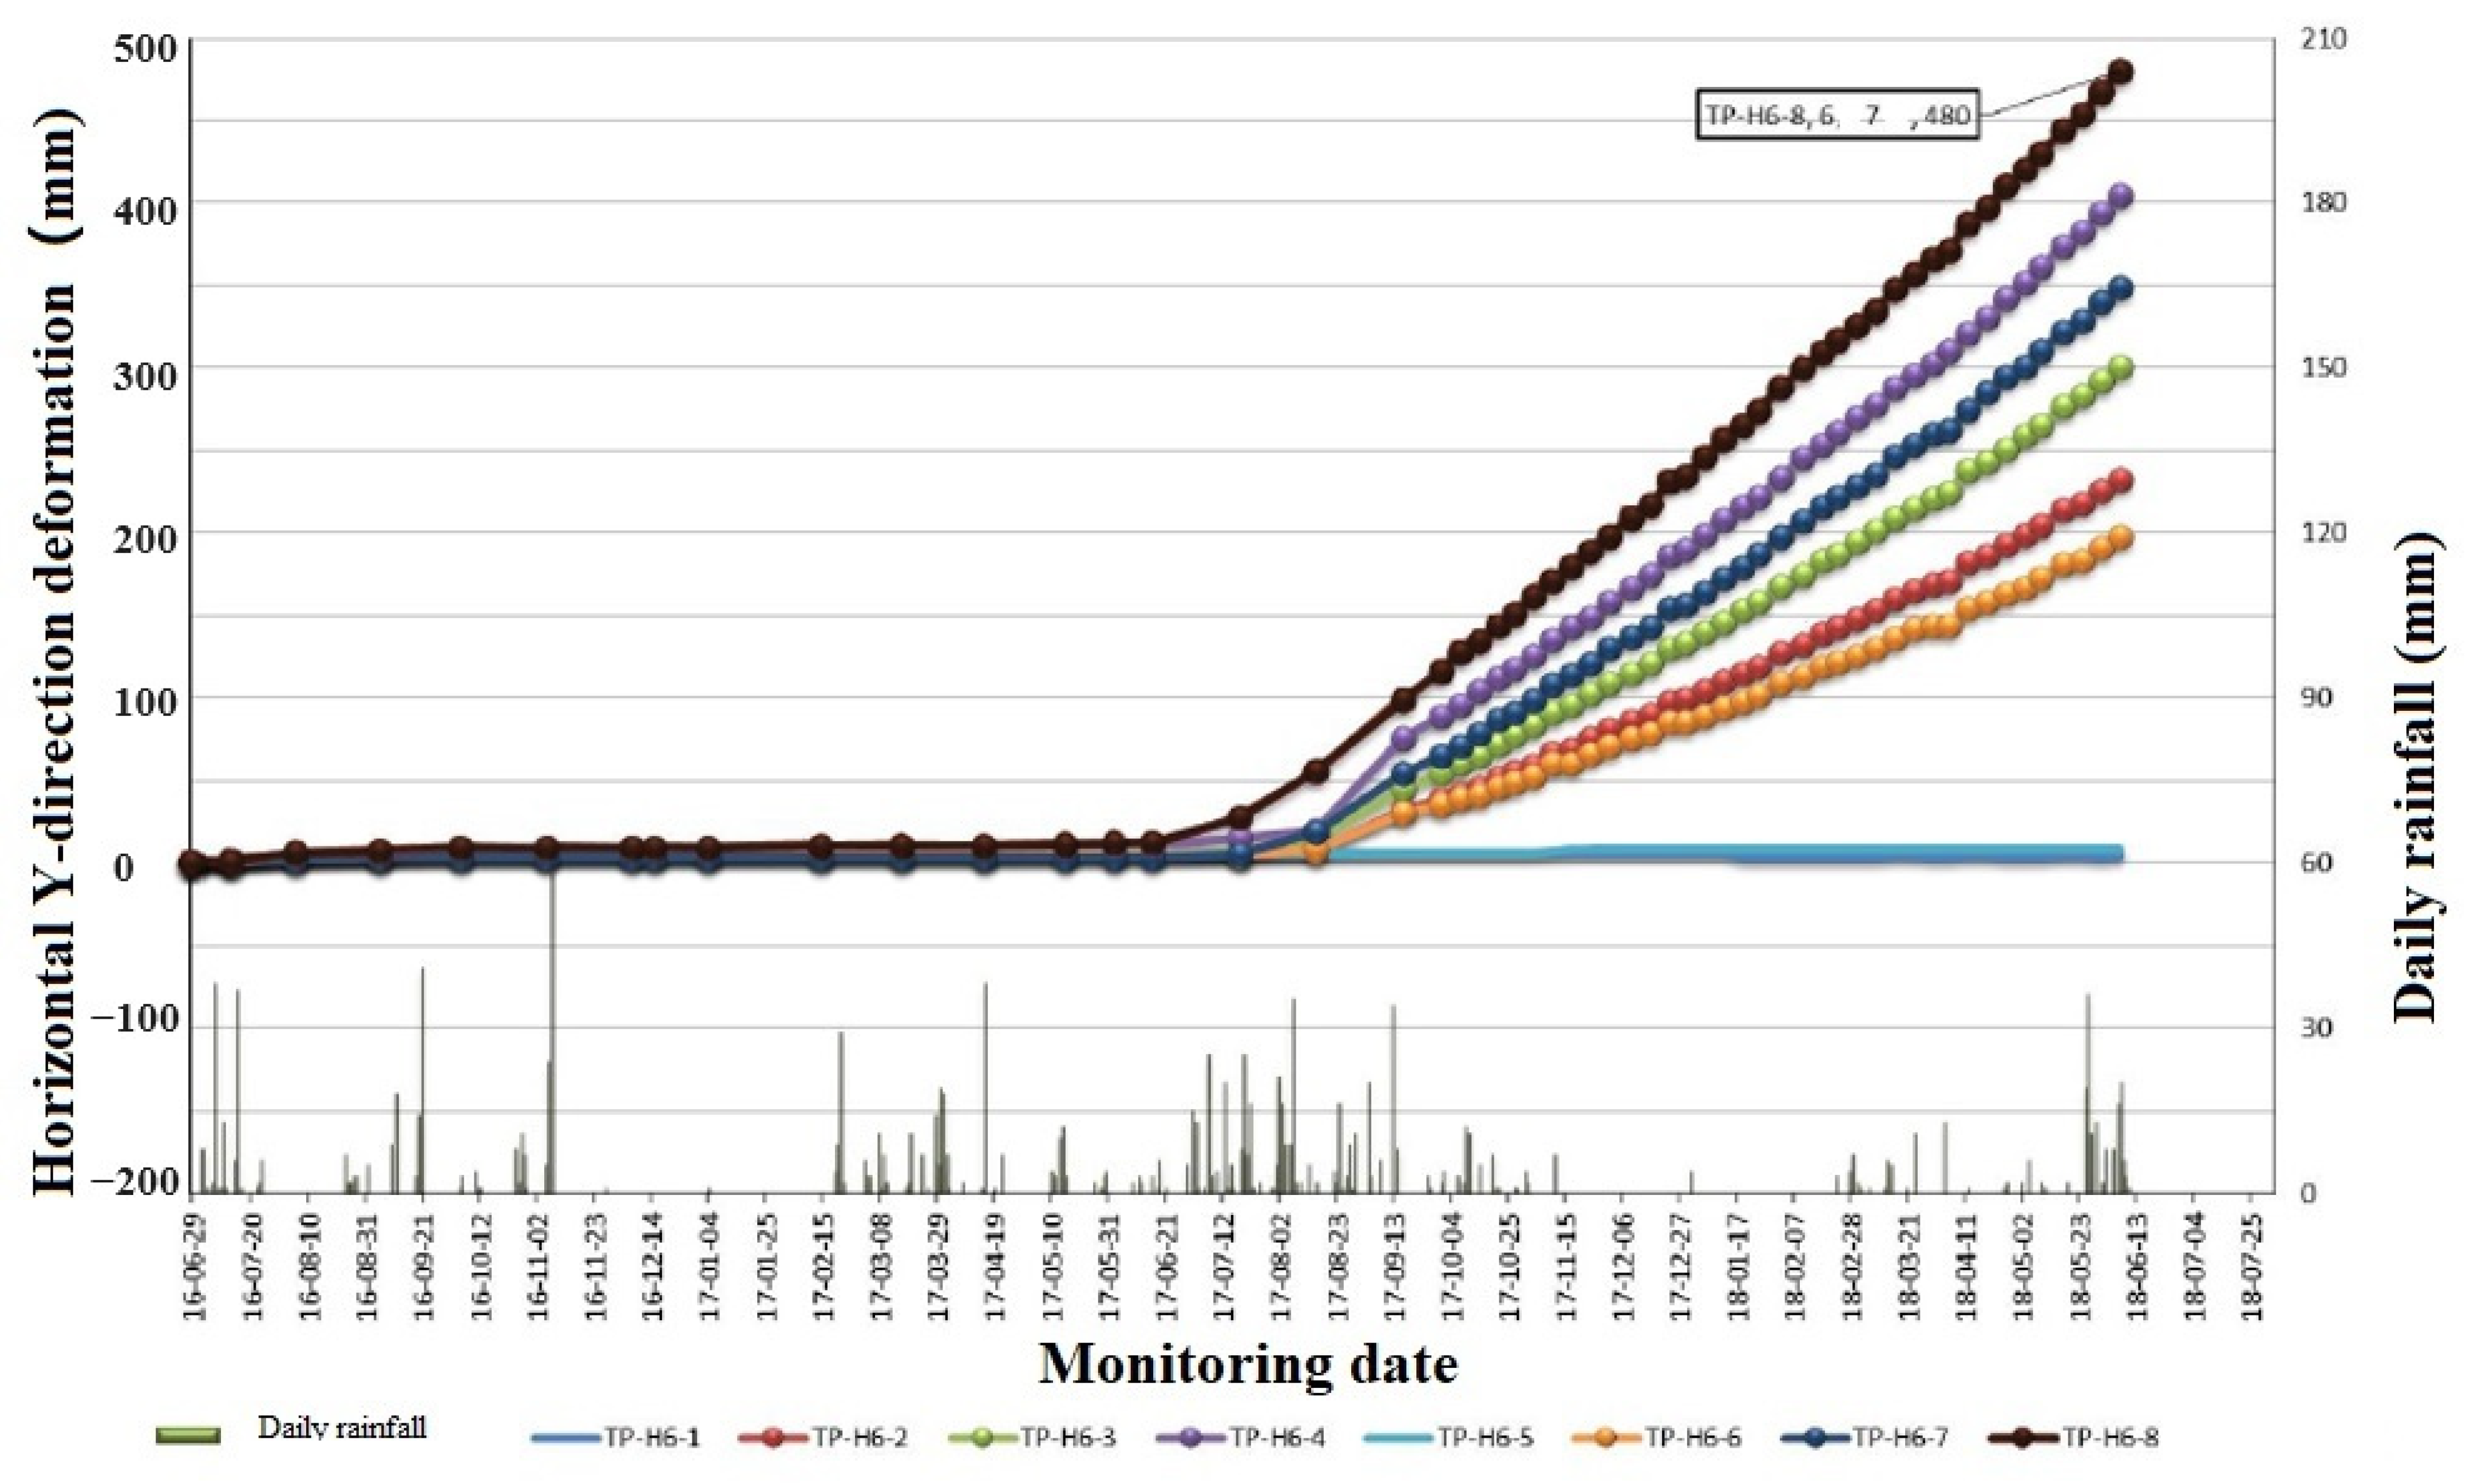
The monitoring data for the apparent displacement within the landslide area shows that as of 7 June 2018, the maximum displacement in the X direction of monitoring point TP-H6-2 is 107 mm. The maximum displacement in the Y direction of monitoring point TP-H6-8 is 480 mm, and the maximum displacement in the Z direction of monitoring point TP-H6-6 is 316 mm. In deep displacement monitoring, the position of the sliding surface can be roughly determined based on the cut position of the inclinometer tube.
(3)
Based on comprehensive analysis, the main factors affecting landslide stability include reservoir impoundment, bank collapse, concentrated rainfall, and additional loads. Based on the deformation monitoring data and theoretical analysis of the landslide mass, it is believed that the evolution process of the landslide mass from the beginning of water storage to now mainly includes four stages: small-scale bank collapse stage, creep deformation stage, accelerated sliding stage, and uniform sliding stage. The overall stage of the landslide manifestation is in the creep stage, and the front foot of the landslide is softened by immersion in water, resulting in significant deformation of the front of the slope and instability. It may lose stability during the process of reservoir water level rise, sudden drops, rainstorms, earthquakes, and other operating conditions.
(4)
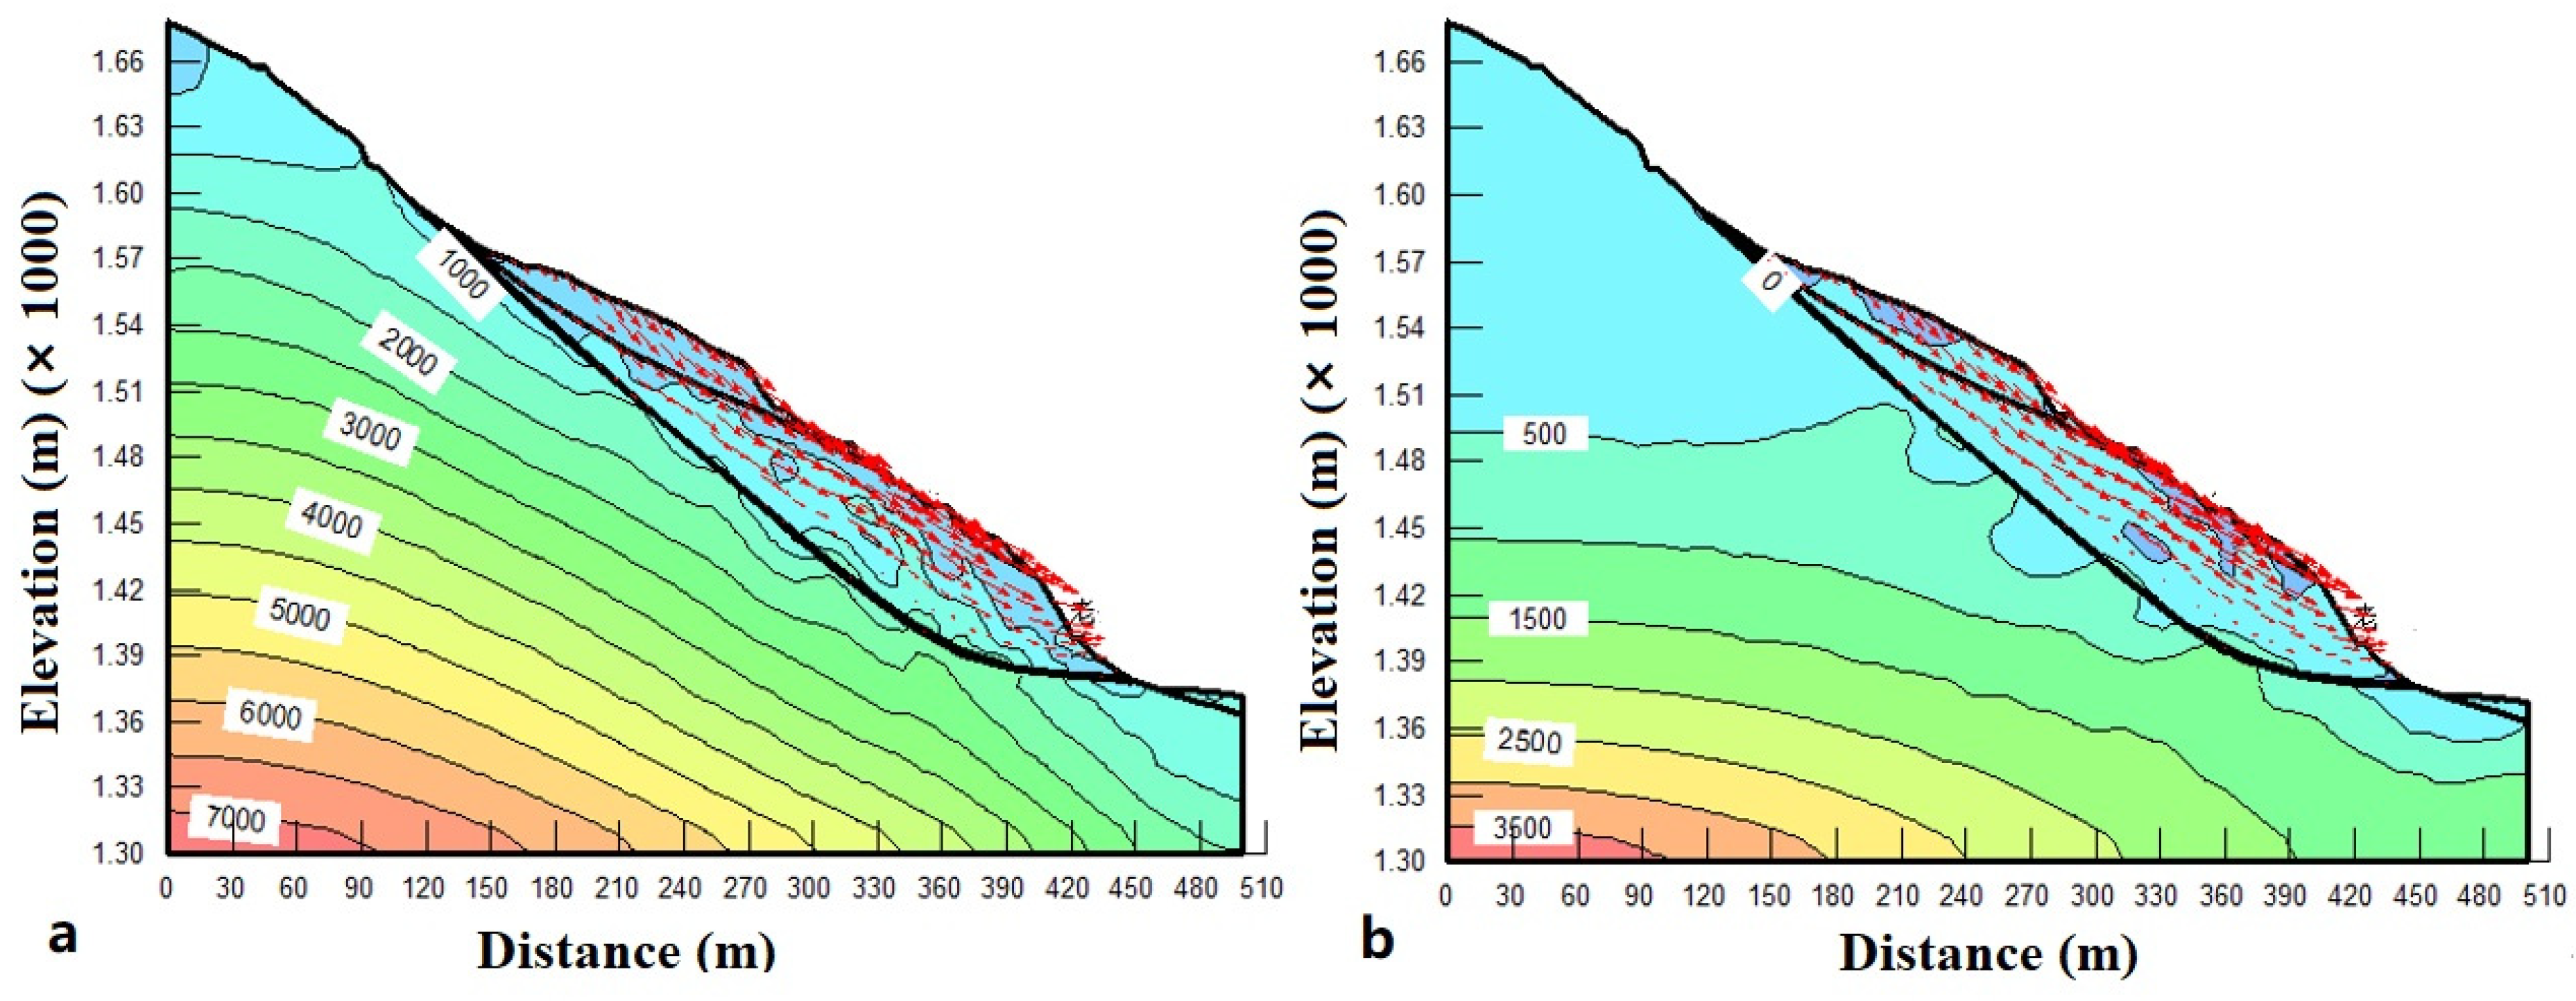
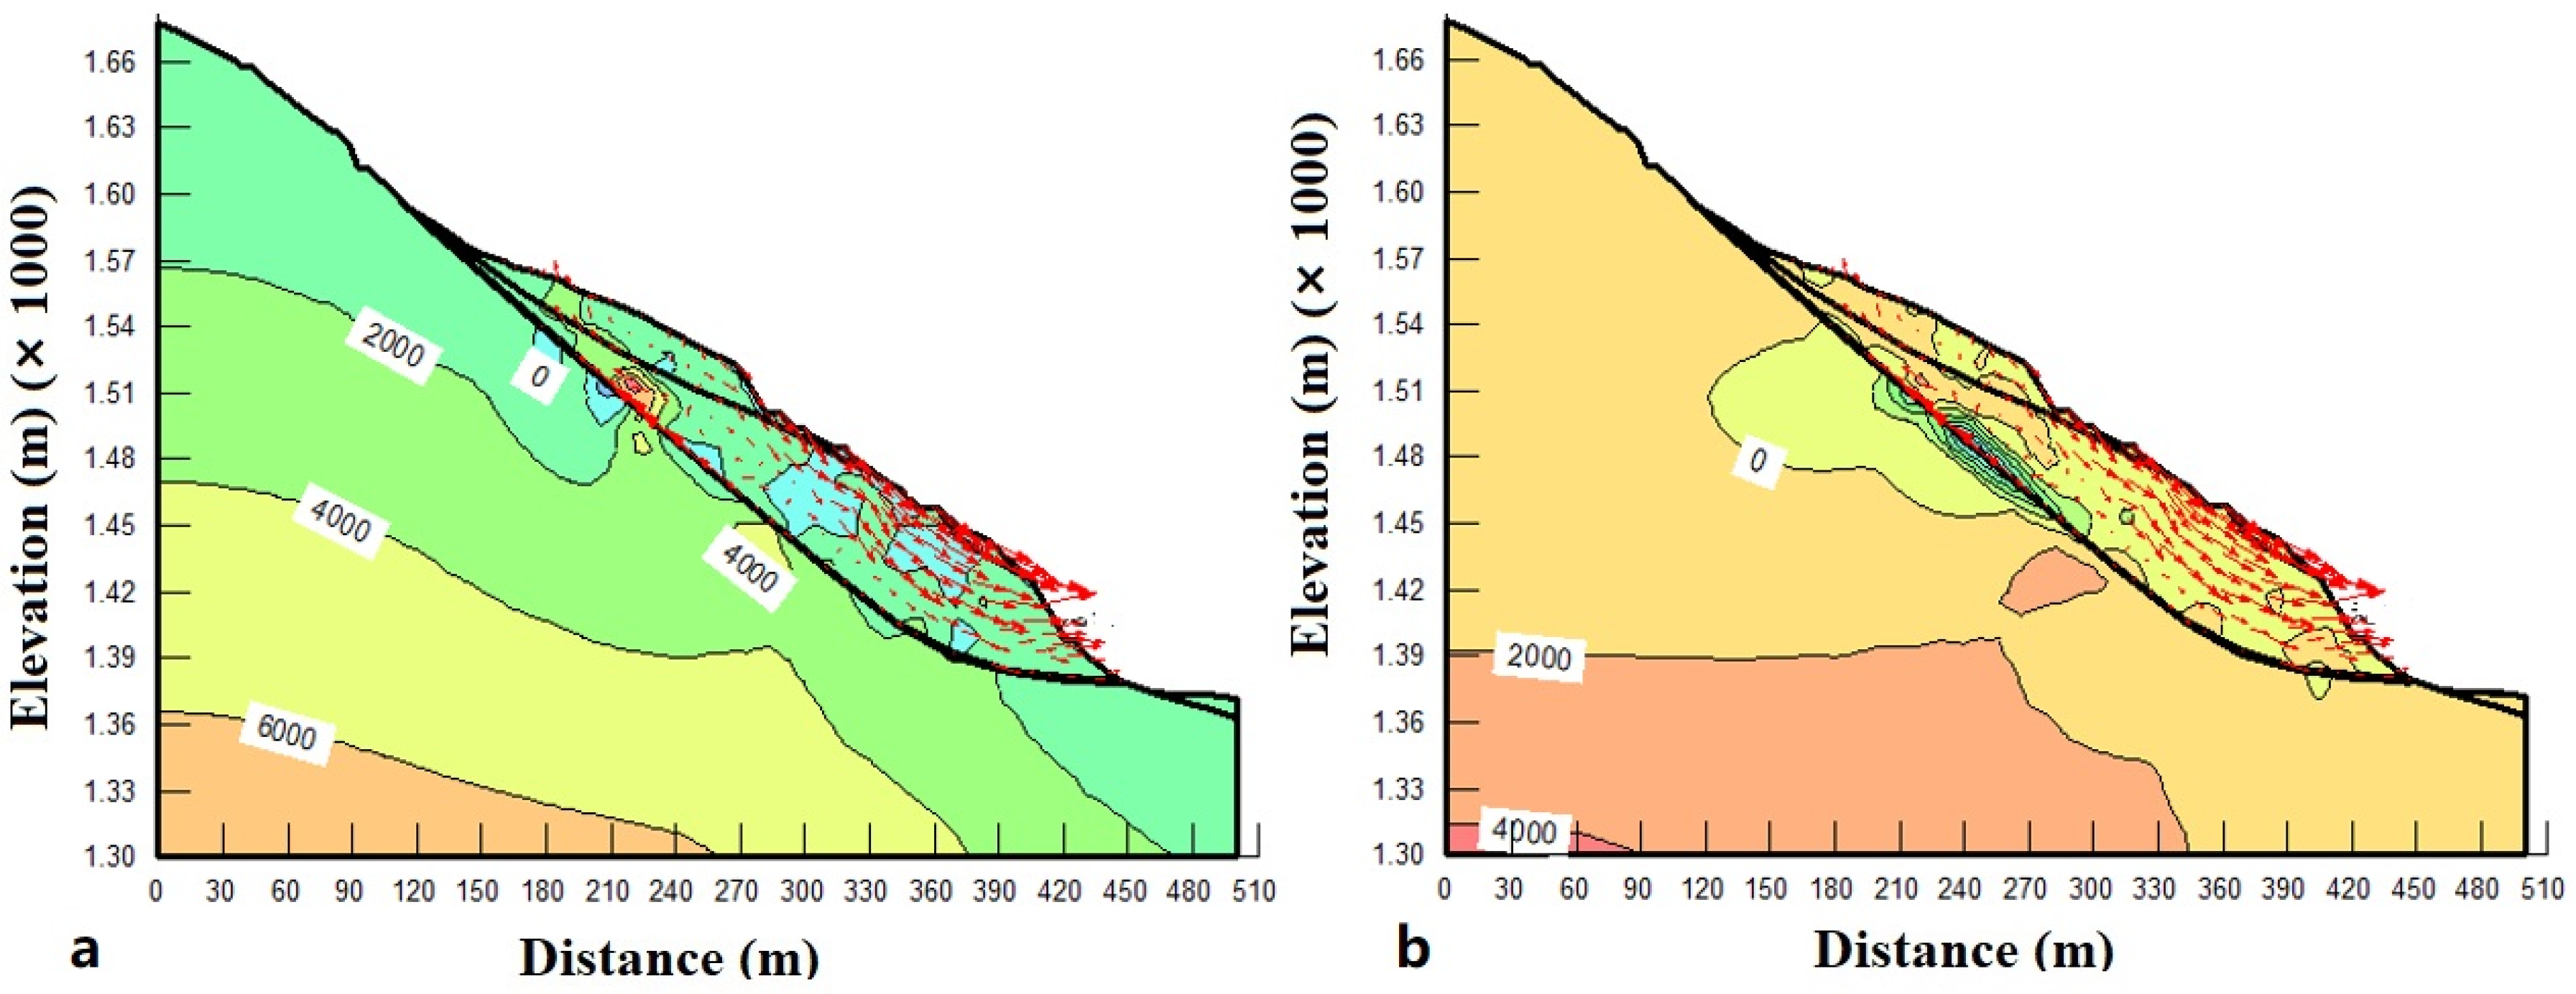
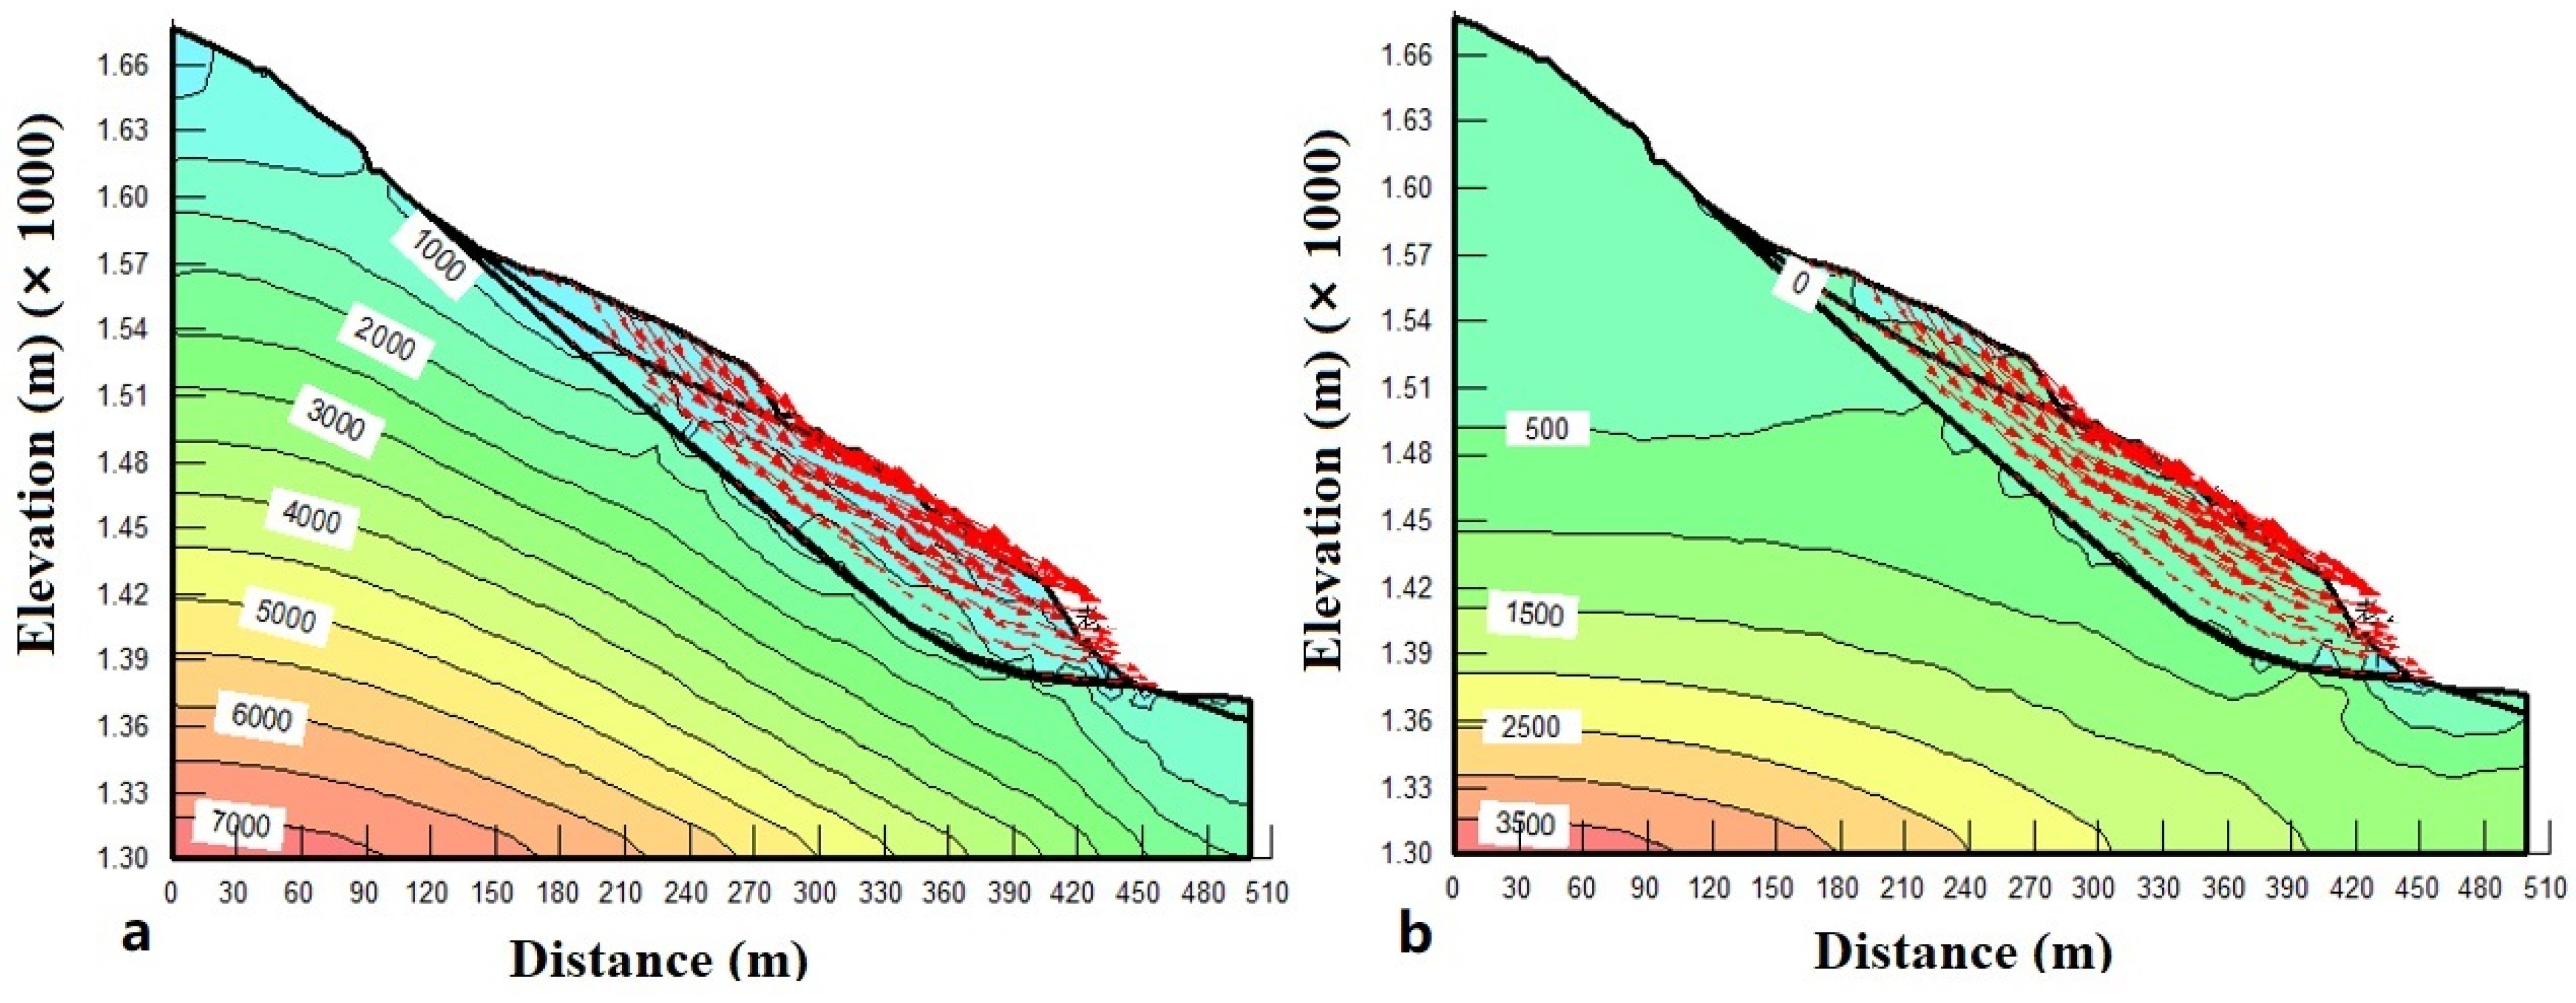
The results of the 2D finite element numerical simulation of the landslide mass show that shear stress concentration occurs in the middle and lower parts of each sliding zone of the landslide, and there is a phenomenon of tensile stress concentration at the trailing edge of the sliding body. The sliding mass exhibits a trend towards leading edge traction and trailing edge rock and soil sliding.

Author Contributions

Conceptualization, J.L.; Software, M.D.; Investigation, J.L., F.Y. and L.C.; Resources, Z.S.; Data curation, F.Y.; Writing—original draft, J.L. and M.D.; Writing—review and editing, F.Z.; Supervision, F.Z.; Funding acquisition, Z.S. All authors have read and agreed to the published version of the manuscript.

Funding

This research was funded by the Science Foundation of China Huaneng Group Co., Ltd grant number [20158101216].

Data Availability Statement

Not applicable.

Acknowledgments

This study was supported by the Science Foundation of China Huaneng Group Co., Ltd., 20158101216. The authors express their sincere thanks to the anonymous reviewers and the editor for their invaluable help and guidance throughout this research.

Conflicts of Interest

The authors declare no conflict of interest.

References

  1. Fannin, J. Karl Terzaghi: From theory to practice in geotechnical filter design. J. Geotech. Geoenviron. Eng. 2008, 134, 267–276. [Google Scholar] [CrossRef]
  2. Imam, S.M.R.; Morgenstern, N.R.; Robertson, P.K.; Chan, D.H. Yielding and flow liquefaction of loose sand. Soils Found. 2002, 42, 19–31. [Google Scholar] [CrossRef]
  3. Lade, P.V.; Duncan, J.M. Elasto-plastic stress-strain theory for cohesionless soil. J. Geotech. Eng. Div. 1975, 101, 1037–1051. [Google Scholar] [CrossRef]
  4. Nuria, M.P.; Eduardo, E.A. [24 h] Criteria for rapid sliding, I.I. Thermo-hydro-mechanical and scale effects in Vaiont case. Eng. Geol. 2010, 114, 211–227. [Google Scholar] [CrossRef]
  5. Huang, R.; Qi, S. Engineering Geology: Review and Prospect of Past Ten Years in China. J. Eng. Geol. 2017, 25, 257–276. [Google Scholar] [CrossRef]
  6. Tan, L.; Huang, R.; Pei, X. Deformation characteristics and inducing mechanisms of a super-large bedding rock landslide triggered by reservoir water level decline in Three Gorges Reservoir area. Chin. J. Rock Mech. Eng. 2021, 40, 302–341. [Google Scholar]
  7. Cotecchia, F.; Vitone, C.; Santaloia, F.; Pedone, G.; Bottiglieri, O. Slope instability processes in intensely fissured clays: Case histories in the Southern Apennines. Landslides 2015, 12, 877–893. [Google Scholar] [CrossRef]
  8. Paronuzzi, P.; Bolla, A.; Rigo, E. Brittle and Ductile Behavior in Deep-Seated Landslides: Learning from the Vajont Experience. Rock Mech. Rock Eng. 2016, 49, 2389–2411. [Google Scholar] [CrossRef]
  9. Qin, R.; Hai, Z.; Ling, F. Considering the effect of reservoir water level lift in gone slope stability. Electron. J. Geotech. Eng. 2014, 19, 3191–3200. [Google Scholar]
  10. Wu, S.; Hu, X.; Zheng, W.; Zhang, G.; Liu, C.; Xu, C.; Zhang, H.; Liu, Z. Displacement behaviour and potential impulse waves of the Gapa landslide subjected to the Jinping Reservoir fluctuations in Southwest China. Geomorphology 2022, 397, 108013. [Google Scholar] [CrossRef]
  11. Li, D.; Nian, T.; Tiong, R.L.K.; Shen, Y.; Shao, Z. River blockage and impulse wave evolution of the Baige landslide in October 2018: Insights from coupled DEM-CFD analyses. Eng. Geol. 2023, 321, 107169. [Google Scholar] [CrossRef]
  12. Cao, Z.; Tang, J.; Zhao, X.; Zhang, Y.; Wang, B.; Li, L.; Guo, F. Failure Mechanism of Colluvial Landslide Influenced by the Water Level Change in the Three Gorges Reservoir Area. Geofluids 2021, 2021, 6865129. [Google Scholar] [CrossRef]
  13. Wang, R.; Zhang, K.; Qi, J.; Xu, W.; Wang, H.; Huang, H. Correlation Analysis of Influencing Factors and the Monthly Displacement Increment of a Hydrodynamic Landslide Using a Pseudo-Maximum-Likelihood-Estimation-Mixed-Copula Approach. Front. Earth Sci. 2021, 9, 637041. [Google Scholar] [CrossRef]
  14. Canoglu, M.C.; Aksoy, H.; Ercanoglu, M. Integrated approach for determining spatio-temporal variations in the hydrodynamic factors as a contributing parameter in landslide susceptibility assessments. Bull. Eng. Geol. Environ. 2019, 78, 3159–3174. [Google Scholar] [CrossRef]
  15. Wang, S.; Pan, Y.; Wang, L.; Guo, F.; Chen, Y.; Sun, W. Deformation characteristics, mechanisms, and influencing factors of hydrodynamic pressure landslides in the Three Gorges Reservoir: A case study and model test study. Bull. Eng. Geol. Environ. 2021, 80, 3513–3533. [Google Scholar] [CrossRef]
  16. Mishra, V.; Jain, K. Satellite based assessment of artificial reservoir induced landslides in data scarce environment: A case study of Baglihar reservoir in India. J. Appl. Geophys. 2022, 105, 104754. [Google Scholar] [CrossRef]
  17. Kohler, M.; Hodel, D.; Keller, L.; Molinari, A.; Puzrin, A.M. Case study of an active landslide at the flank of a water reservoir and its response during earthquakes. Eng. Geol. 2023, 232, 107243. [Google Scholar] [CrossRef]
  18. Kędra, M.; Wiejaczka, Ł.; Zydroń, T.; Kijowska-Strugała, M.; Cebulski, J. The influence of water level hydrodynamics on potential changes in the morphology of a mountain reservoir shore zone. Catena 2023, 231, 107363. [Google Scholar] [CrossRef]
  19. Ghiassian, H.; Ghareh, S. Stability of sandy slopes under seepage conditions. Landslides 2008, 5, 397–406. [Google Scholar] [CrossRef]
  20. Kalenchuk, K.S.; Hutchinson, D.J.; Diederichs, M.S. Downie Slide: Numerical simulation of groundwater fluctuations influencing the behaviour of a massive landslide. Bull. Eng. Geol. Environ. 2013, 72, 397–412. [Google Scholar] [CrossRef]
  21. Wang, F.W.; Okuno, T.; Matsumoto, T. Deformation characteristics and influential factors for the giant Jinnosuke-dani landslide in the Haku-san Mountain area, Japan. Landslides 2007, 4, 19–31. [Google Scholar] [CrossRef]
  22. Castelli, M.; Scavia, C.; Bonnard, C.; Laloui, L. Mechanics and velocity of large landslides. Eng. Geol. 2009, 109, 1–4. [Google Scholar] [CrossRef]
  23. Quinn, P.; Hutchinson, D.; Diederichs, M.; Rowe, R. Characteristics of large landslides in sensitive clayin relation to susceptibility, hazard, and risk. Can. Geotech. J. 2011, 48, 1212–1232. [Google Scholar] [CrossRef]
  24. Ling, H.; Hoe, I.; Ling, M. Centrifuge model simulations of rainfall-induced slope instability. J. Geotech. Geotech. Geoenviron. Eng. Eng. ASCE 2012, 138, 1151–1157. [Google Scholar] [CrossRef]
  25. Ling, H.; Ling, H.L.; Li, L.; Kawabata, T. Centrifuge modeling of slope failures induced by rainfall. In Proceedings of the 7th International Conference on Physical Modelling in Geotechnics, Zurich, Switzerland, 27 June–2 July 2010; pp. 1131–1136. [Google Scholar]
  26. Wong, R.H.C.; Chiu, M.A. Study on failure mechanism of toppling by physical model testing. In Proceedings of the 38th U.S. Rock Mechanics Symposium, Washington, DC, USA, 7–10 July 2001; pp. 989–995. [Google Scholar]
  27. Aydan, O.; Kawamoto, T. The stability of slopes and underground openings against flexural toppling and their stabilisation. Rock Mech. Rock Eng. 1992, 25, 143–165. [Google Scholar] [CrossRef]
  28. Chen, Z.Y. Recent developments in slope stability analysis. In Proceedings of the 8th International Congress on Rock Mechanics, Tokyo, Japan, 25–30 September 1995; Volume 3, pp. 1041–1048. [Google Scholar]
  29. Li, L.Q.; Ju, N.P.; Zhang, S.; Deng, X.X. Shaking table test to assess seismic response differences between steep bedding and toppling rock slopes. Bull. Eng. Geol. Environ. 2019, 78, 519–531. [Google Scholar] [CrossRef]
  30. Chena, C.C.; Lia, H.H.; Chiub, Y.C.; Tsaia, Y.K. Dynamic response of a physical anti-dip rock slope model revealed by shaking table tests. Eng. Geol. 2020, 277, 105772. [Google Scholar] [CrossRef]
  31. Alzo’ubi, A.; Martin, C.; Cruden, D. Influence of tensile strength on toppling failure in centrifuge tests. Int. J. Rock Mech. Min. Sci. 2010, 47, 974–982. [Google Scholar] [CrossRef]
  32. Chen, Z.Y.; Gong, W.J.; Ma, G.W.; Wang, J.; He, L.; Xing, Y.; Xing, J. Comparisons between centrifuge and numerical modeling results for slope toppling failure. Sci. China Technol. Sci. 2015, 58, 1497–1508. [Google Scholar] [CrossRef]
  33. Dong, M.L.; Zhang, F.M.; Lv, J.Q.; Fei, Y.; Li, Z.N. Study of stability influencing factors of excavated anti-dip rock slope. KSCE J. Civ. Eng. 2020, 24, 2293–2303. [Google Scholar] [CrossRef]
  34. Dong, M.L.; Zhang, F.M.; Hu, M.J.; Liu, C. Study on the influence of anchorage angle on the anchorage effect of soft-hard interbedded toppling deformed rock mass. KSCE J. Civ. Eng. 2020, 24, 2382–2392. [Google Scholar] [CrossRef]
Figure 1. Overall view of Mara landslide before impoundment.
Water 15 03942 g001
Figure 2. Engineering geological plan of Mala landslide.
Water 15 03942 g002
Figure 3. Engineering geological profile of Mala landslide (section KH9–KH9’, east–west direction). (A) is extremely strong toppling boundary, (B1) is strong toppling upper segment boundary, (B2) is strong toppling lower segment boundary, (C) is Weak toppling boundary).
Water 15 03942 g003
Figure 4. Engineering geological profile of Mala landslide (section KH11–KH11′, north–south direction). (A) is extremely strong toppling boundary, (B1) is strong toppling upper segment boundary, (B2) is strong toppling lower segment boundary, (C) is Weak toppling boundary).
Water 15 03942 g004
Figure 5. Sliding zone rock and soil mass taken from drilling.
Water 15 03942 g005
Figure 6. Sliding bedrock core taken from drilling.
Water 15 03942 g006
Figure 7. Distribution of cracks within the landslide area. Note: The dark red curve in the figure represents the boundary of the landslide. The red curve and font represent tensile cracks and crack numbers, respectively, with an average width greater than 10 cm. The yellow curve and font indicate tensile cracks with an average width of no more than 10 cm and crack numbers, respectively. The blue curve and font represent shear cracks, while the blue arrow indicates the inferred deformation direction.
Water 15 03942 g007
Figure 8. Distribution of monitoring points for Mala landslide.
Water 15 03942 g008
Figure 9. Relationship curve between horizontal X-direction deformation and reservoir water level in Mala landslide surface displacement monitoring.
Water 15 03942 g009
Figure 10. Relationship curve between horizontal Y-direction deformation and reservoir water level in Mala landslide surface displacement monitoring.
Water 15 03942 g010
Figure 11. Relationship curve between vertical deformation and reservoir water level in Mala landslide surface displacement monitoring.
Water 15 03942 g011
Figure 12. Deep displacement monitoring of borehole ZKKH21.
Water 15 03942 g012
Figure 13. Deep displacement monitoring of borehole ZKKH22.
Water 15 03942 g013
Figure 14. Relationship between horizontal Y-direction displacement and daily rainfall in the surface monitoring of Mala landslide.
Water 15 03942 g014
Figure 15. Development stages of Mala landslide.
Water 15 03942 g015
Figure 16. Two-dimensional finite element numerical model for water storage conditions.
Water 15 03942 g016
Figure 17. Maximum (a) and minimum (b) principal stress and displacement vector diagram under water storage conditions.
Water 15 03942 g017
Figure 18. Two-dimensional finite element numerical model for rainstorm (The blue line is the groundwater level line; the blue arrows represents simulated rainfall).
Water 15 03942 g018
Figure 19. Maximum (a) and minimum (b) principal stress and displacement vector diagram under rainstorm conditions.
Water 15 03942 g019
Figure 20. Maximum (a) and minimum (b) principal stress and displacement vector diagram under seismic conditions.
Water 15 03942 g020
Table 1. Parameters of test results for sliding zone.
Soil Sample NumberDry Density (g/cm3)Cohesion (kPa)Internal Friction Angle (°)
Triaxial consolidated undrained shear test11.710.6628.0
21.79.5827.6
31.79.2328.9
Saturated consolidation fast shear test11.62.227.5
21.64.127.3
31.67.6526.3
Repeated direct shear testSoil sample numberDry density (g/cm3)Residual cohesion (kPa)Residual internal friction angle (°)
11.63.925.4
Table 2. Accumulated displacement of each monitoring point (mm).
Monitoring Point Number and Displacement DirectionTP-H6-1TP-H6-2TP-H6-3TP-H6-4TP-H6-5TP-H6-6TP-H6-7TP-H6-8
Horizontal X Direction 1−107−37−4739−19−29
Horizontal Y Direction 42323014058198349480
Vertical Z Direction −5−200−226−185−5−316−241−258
Table 3. Average deformation rate during uniform deformation stage at each monitoring point (mm).
Monitoring Point Number and Displacement DirectionTP-H6-1TP-H6-2TP-H6-3TP-H6-4TP-H6-5TP-H6-6TP-H6-7TP-H6-8
Horizontal X Direction 0−0.31−0.11−0.1500.03−0.07−0.10
Horizontal Y Direction 00.760.971.2600.641.121.44
Vertical Z Direction 0−0.67−0.75−0.580−1.06−0.78−0.77
Table 4. Physical and mechanical parameters of each rock and soil layer in numerical simulation.
Rock Mass CategoryUnit Weight (kN/m3)Deformation Modulus (MPa)Cohesion (kPa)Internal Friction Angle (°)Poisson’s Ratio
Collapse slope deposit containing crushed stone and silty clay2020036.026.00.25
Landslide accumulation block and gravel21.530035.027.00.25
Sliding zone17.01008.025.00.23
Bedrock24.01200320.035.00.21
Disclaimer/Publisher’s Note: The statements, opinions and data contained in all publications are solely those of the individual author(s) and contributor(s) and not of MDPI and/or the editor(s). MDPI and/or the editor(s) disclaim responsibility for any injury to people or property resulting from any ideas, methods, instructions or products referred to in the content.

