Article

Rainfall–Mining Coupling Effects on Slope Failure Mechanism and Evolution Process: A Case Study of Open-Pit to Underground Mining

1
School of Urban Construction, Changzhou University, Changzhou 213164, China
2
School of Resources and Safety Engineering, Chongqing University, Chongqing 400044, China
3
Sinosteel Maanshan General Institute of Mining Research Co., Ltd., Maanshan 243000, China
4
School of Civil Engineering, Shaoxing University, Shaoxing 312000, China
5
College of Engineering, Design and Physical Sciences, Brunel University London, London UB8 3PH, UK
*
Author to whom correspondence should be addressed.
Water 2024, 16(5), 740; https://doi.org/10.3390/w16050740
Submission received: 13 January 2024 / Revised: 22 February 2024 / Accepted: 27 February 2024 / Published: 29 February 2024

Abstract

:
This research examines how rainfall and mining affect the slope damage resulting from the transition from open-pit mining to underground mining. Using an unmanned aerial vehicle (UAV), the Huangniu slope of the Dexing Copper Mine was fully characterized, and experiments were conducted on rock samples from appropriate sites. First, the mechanical properties of the samples were measured. Then, the parameters of the similarity simulation experiments were derived based on the similarity theory. Subsequently, the rainfall, rock slope, data acquisition, and monitoring systems were designed. Finally, the rock mass failure with different slope angles was analyzed, and the deformation and damage patterns under the coupling effect were obtained. The results show that rainfall increases pore water pressure and moisture content. Rainfall and slope-slip water have more of an impact on the open-pit platform. The pore water pressure values on the upper rock mass rise faster than inside it. In the open-pit mining stage, the rock mass shifts slightly to the upper left. In the room mining stage, vertical fractures and goaf sinking occur. The fractures above the mine form a semi-ellipse. In the pillar mining stage, overlying rock displacement is evident and fractures persist. In the continuous pillar mining stage, the overlying rock collapses. The 65° slope model was the most damaged, while the 55° slope model was the least damaged. The results also suggest that the UAV guides sample selection.

1. Introduction

Mineral resources play a crucial role in modern industry and infrastructure, yet their extraction presents multifaceted challenges [1]. As open-pit mines become deeper and more concave, some of them switch to underground mining [2]. This transition is very complex because the surrounding rock mass is disturbed by the stress of excavation during open-pit mining, which causes damage to and fractures in the rock mass [3,4,5,6]. When underground mining starts, the rock mass is disturbed again [7]. The interaction of the stress fields changes the internal shape of the rock mass, resulting in strong nonlinearity [8,9,10,11]. This dynamic process has attracted many scholars’ attention. Soltani and Osanloo developed a set of models to determine the optimal transition depth between open-pit mining and different underground mining methods [12]. Zhang et al. proposed a cement slurry backfilling technology for the transition stage and found that the backfilling height affected the safety of the roof and the underground column. The vertical displacement was small during the backfilling process [13]. Moreover, Li et al. studied the macroscopic and microscopic characteristics of the surrounding and overlying rocks in the transition and found that the mining space size was related to pressure increase and relief. The pressure relief was more complete near the mining area, and the stress reduction level decreased with the distance [14]. Zhao et al. used microseismic monitoring to study the changes in stress and volume over time and analyzed the rock failure and damage migration to evaluate the rock mass stability in the transition [15]. Zhu et al. effectively elucidated the toppling failure mechanism of anti-dip layered slopes by conducting physical model tests [16].
Rainfall infiltration and mining unloading are the most common external factors that affect a mining area. They weaken and destroy the stability of the rock mass. Many studies have investigated their effects on rock mass [17,18,19,20,21,22,23,24,25,26,27,28]. Here, rainfall reduces the connection force between rock particles. It also causes the water wedge effect and dissolution, which damage the rock mass. The free water in the rock mass creates pore water pressure and expansion strengthening, which develop internal fractures in the rock mass. Mining unloading has a more obvious influence on rock mass failure. It changes the structure of the rock mass and induces vibrations, which can lead to more microfractures. Li et al. investigated the seepage field evolution of granite residual soil slopes under rainfall infiltration conditions. It was observed that the pore water pressure exhibited an increase in the response to rainfall infiltration, while the moisture content of the slope displayed a distinct wave-like distribution along its vertical profile [29]. Xiang et al. studied the in situ unloading damage, core cutting characteristics, and mechanical mechanism of deep rock masses in mines. They found that the deep high-stress rock mass was significantly damaged after in situ unloading, and the damage time effect increased with the depth [28]. Furthermore, Du et al. utilized fiber optic-sensing technology to propose a quantitative index of the coupling effect between the mining rock mass and fiber optic, and they quantitatively analyzed and discussed the coupling coefficients of different vertical zones [20].
Most studies on mine stability focus on single factors, and few consider the coupling effects of rainfall and mining in realistic situations [17,18,19,21,22,24,25,26]. Additionally, the experimental methods are usually based on small-scale rock mass samples, and large-scale similarity simulation studies are scarce. Thus, it is important for practical engineering purposes to study rock mass failure and evolution under the rainfall–mining coupling effect. To this end, this research uses the Huangniu slope of the Dexing Copper Mine as an example and conducts the following steps: (1) determining the mechanical properties of the rock samples obtained by remote sensing technology and obtaining the relevant parameters of similarity simulation experiments by the similarity theory; (2) designing the rainfall, physical model, data acquisition, and monitoring systems of the similarity experiment; and (3) analyzing the rock mass failure process with different slope angles, obtaining the deformation and damage laws of models with different slope angles under the rainfall–mining coupling effect, and elucidating the damage mechanism and evolution process.

2. Materials and Methods
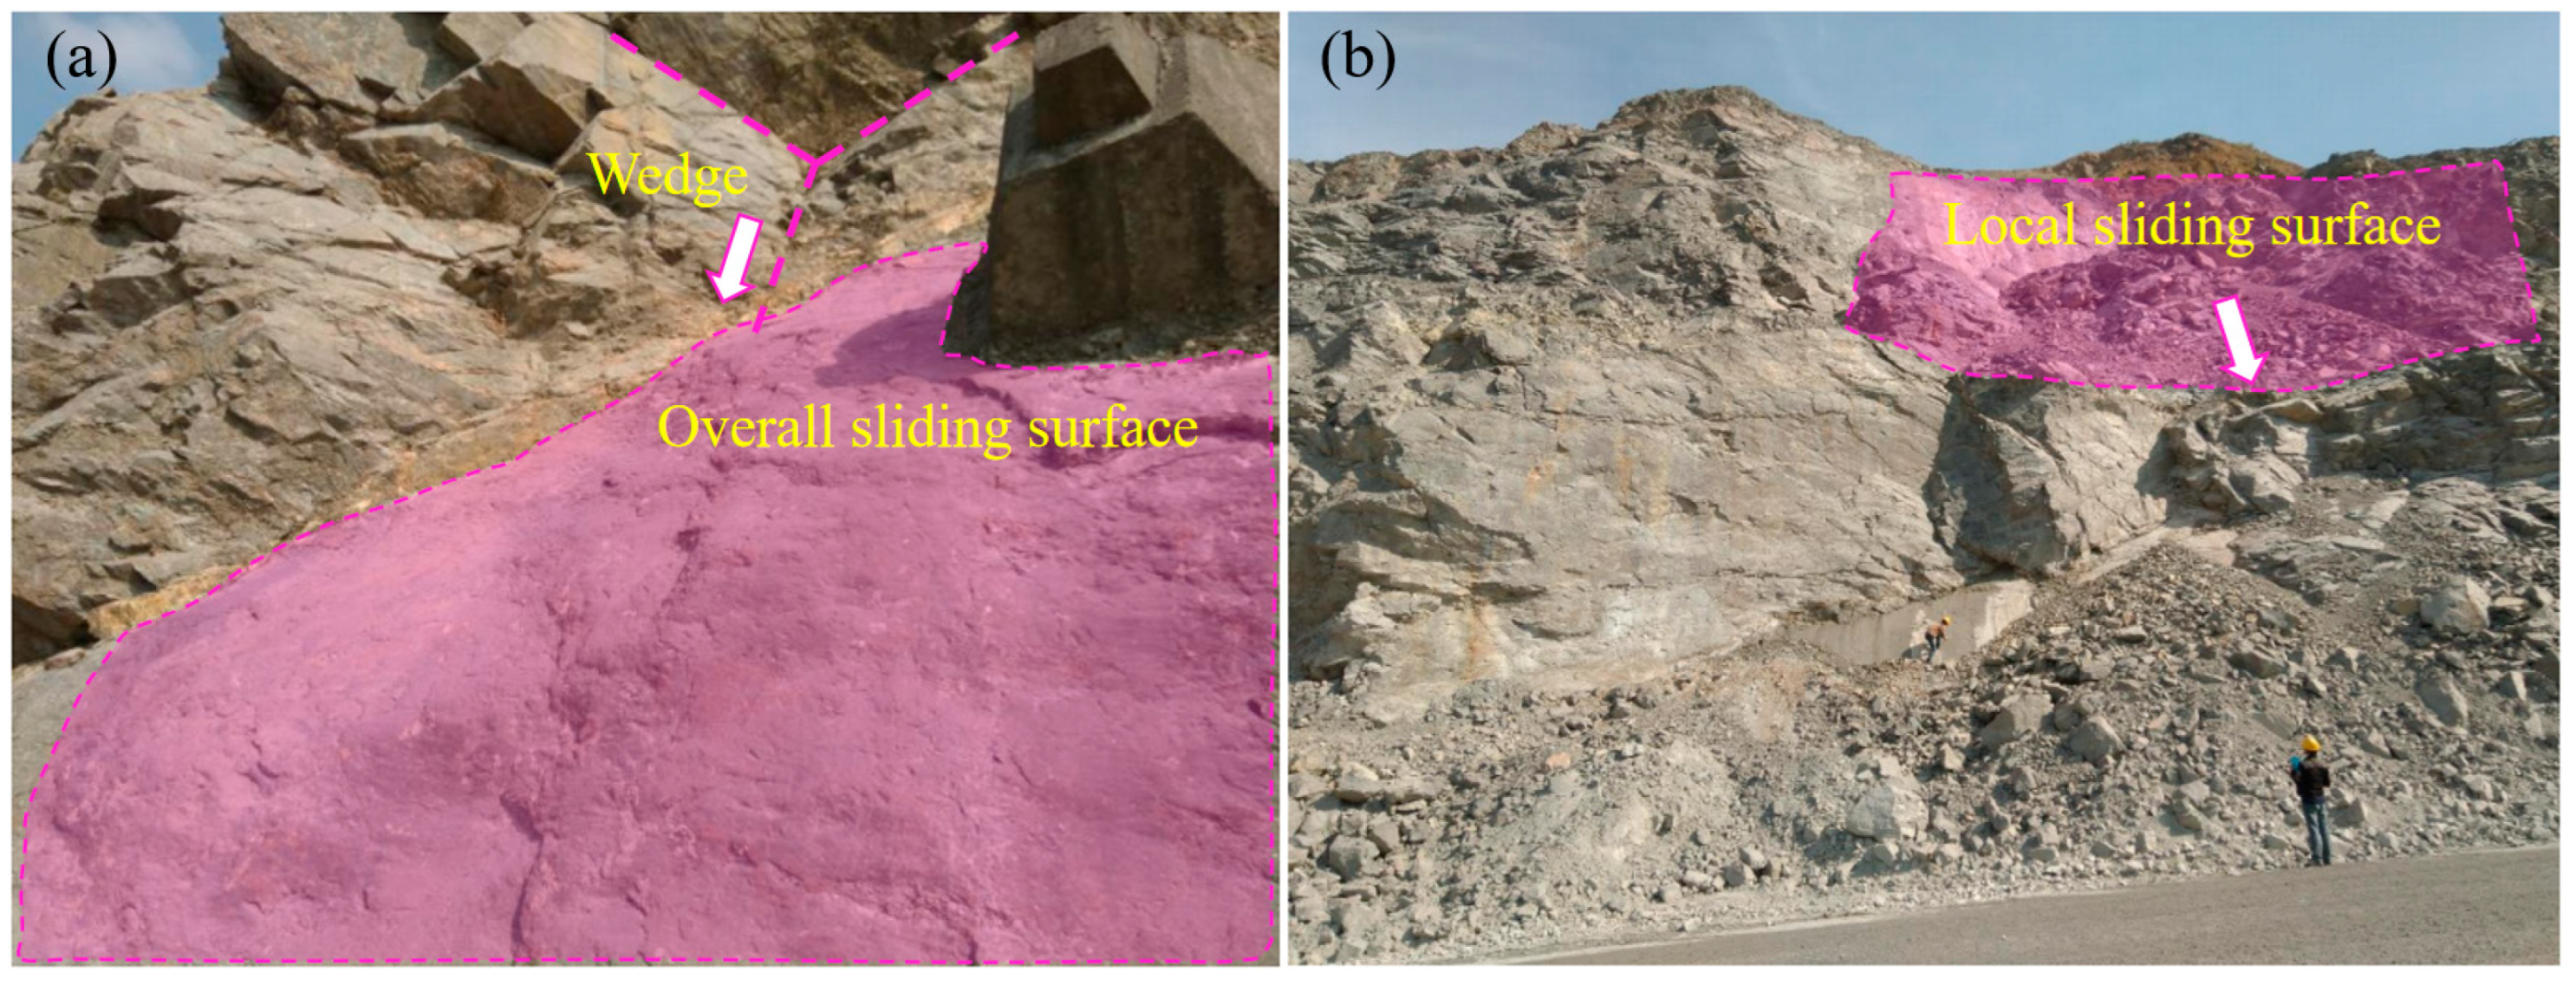
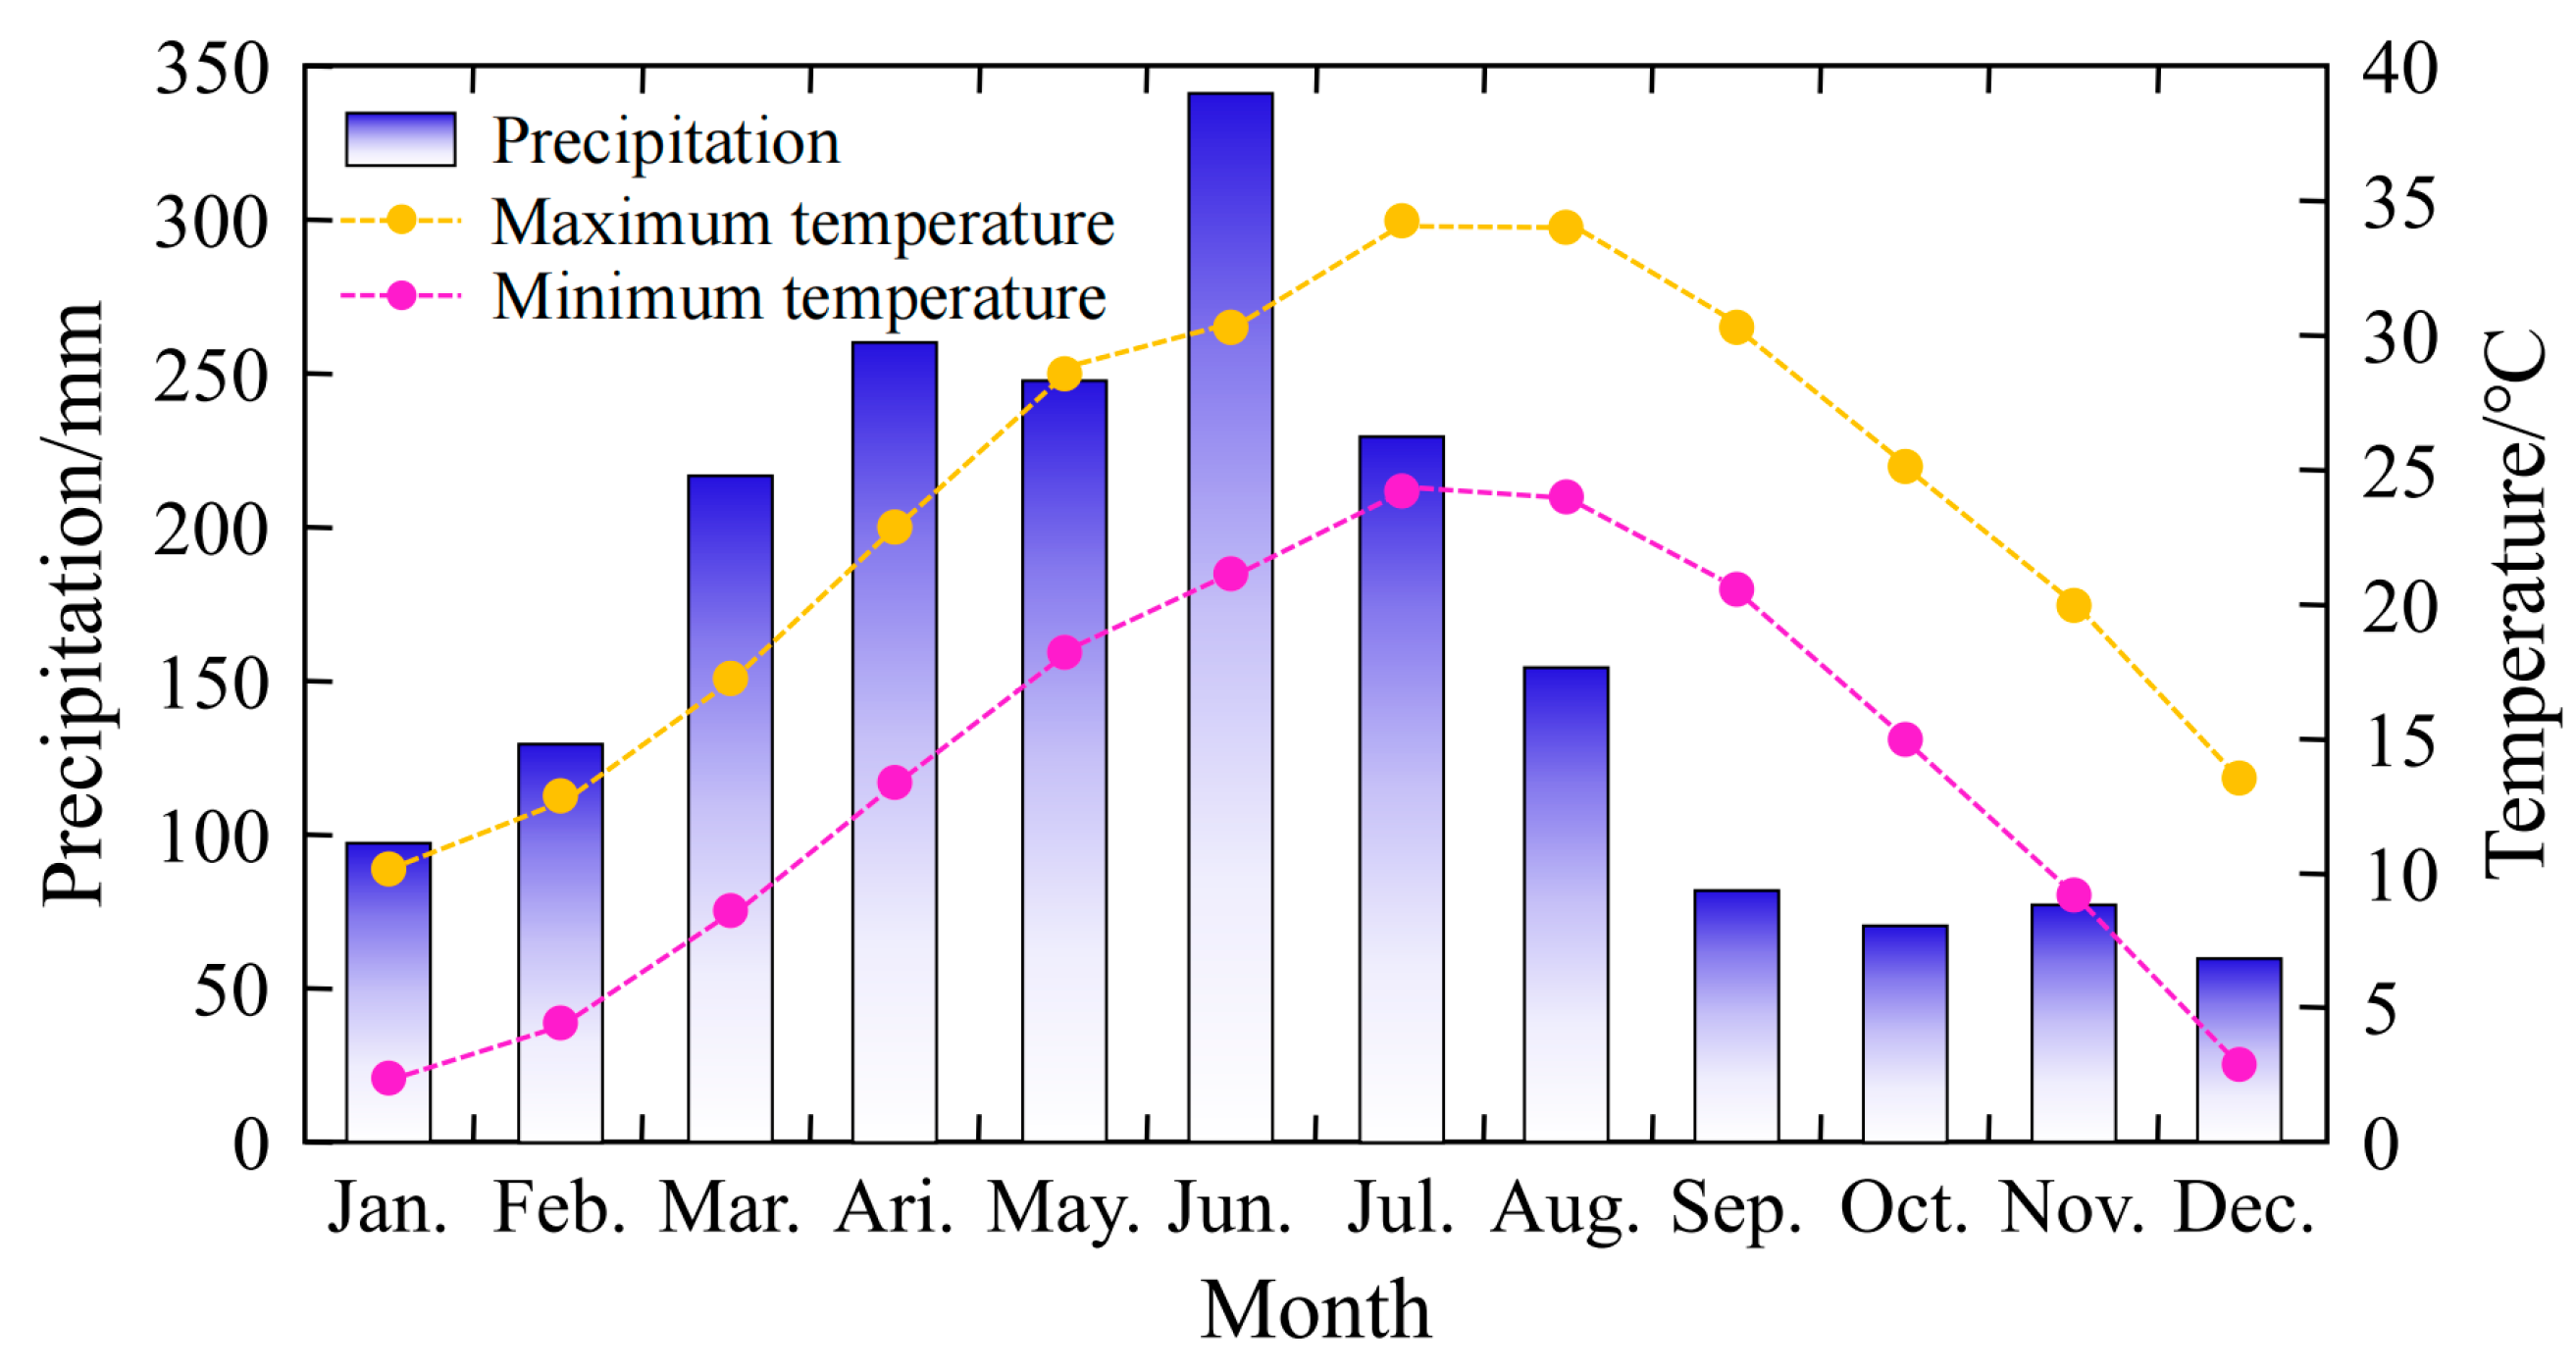
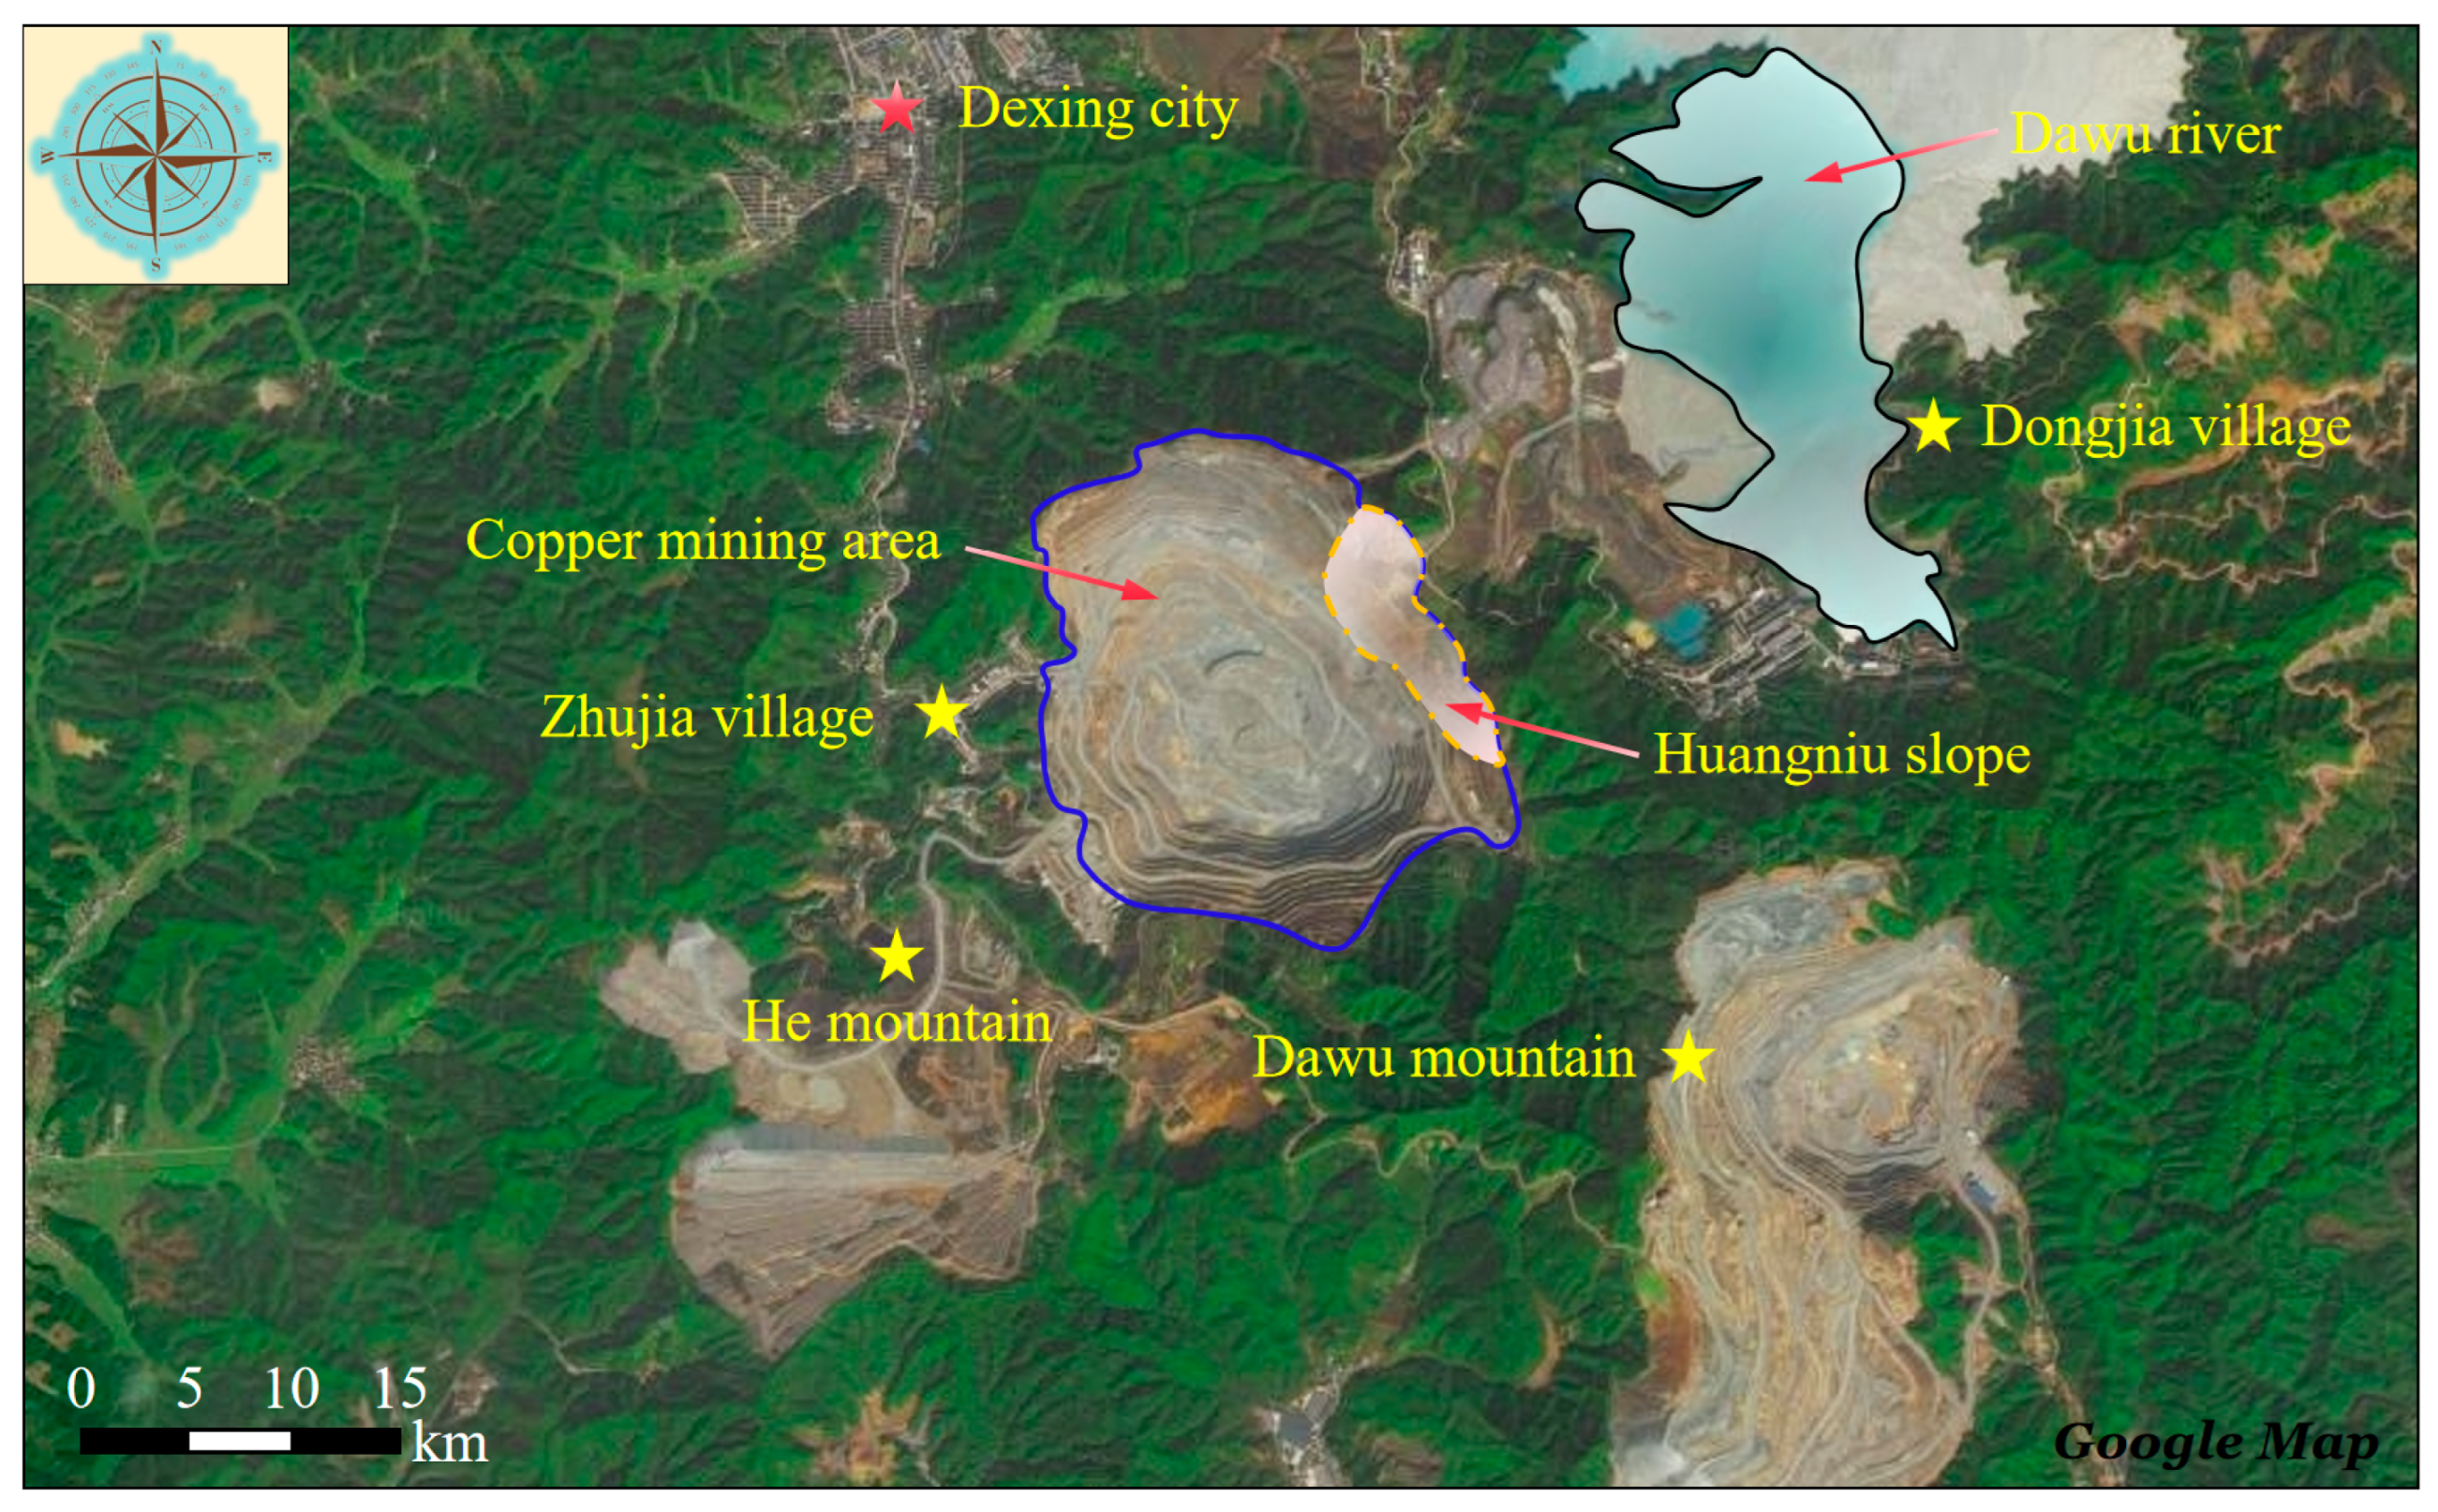
2.1. Study Area

The Huangniu slope in the Dexing Copper Mine (Figure 1) is located in Sizhou Town, Dexing City, Jiangxi Province, China. Here, the slope surface is covered with artificial fill, and the lower part is the mined area, which is a rock slope created by human excavation. The cross-section of the study area has a height of about 548.5 m and a length of about 400 m. The slope point cloud model indicates that the average dip direction and angle of the slope are 238° and 42°, respectively. The slope surface has several artificial platforms, and the lower part is the mined area. Furthermore, the engineering geological exploration shows that the lithology of the study area is mainly muddy and sandy as well as tuffaceous phyllite. The slope exposes many small faults and fractures (Figure 2), resulting in the poor integrity of the rock mass. According to the field investigation, the main failure modes of the slope are wedge failure (Figure 2a) and plane failure (Figure 2b). Accordingly, the rock mass is prone to instability under engineering disturbances [30,31].
The study area was located in a subtropical, monsoon, humid climate zone, with an even precipitation distribution throughout the year, a long rainy season, four distinct seasons, a hot and rainy summer, and mild and moist winter. Figure 3 represents the temperature and precipitation changes in the study area. The annual average temperature is 17.7 °C, the highest temperature is 39.6 °C, and the lowest temperature is 2.4 °C. Most of the rainfall is concentrated from March to August, accounting for about 73.7% of the annual precipitation. September to December is the dry season. Therefore, the slope is prone to failure in summer [32,33,34].

2.2. Rock Mechanics Parameter Setting

2.2.1. Specimen Preparation

Representative phyllite samples were selected from the field, utilizing an unmanned aerial vehicle (UAV) to avoid the broken rock mass area. Subsequently, the samples were processed into standard rock specimens, and the basic cutting of the rock samples was performed using a rock cutter. For the subsequent laboratory tests, the rock samples were cut into cylindrical standard specimens with a diameter of 50 mm and a height of 100 mm and disc-shaped standard specimens with a diameter of 50 mm and a height of 25 mm for the Brazilian splitting test. After the rock-cutting stage, the rock sample specimens were polished using a grinding machine, and fine polishing was performed using diamond sand.

2.2.2. Brazilian Splitting Test

The Brazilian splitting test was performed on the rock specimens. A sample was placed on a fixed groove, and a vertical load was applied in the diameter direction until the specimen was damaged. The load at the time of failure of each specimen was recorded, and then the tensile strength σt (Mpa) of the rock sample was calculated by:
σ t = 2 p t π D h
where pt is the load at the time of failure of the rock sample, N; D is the diameter of the sample, mm; and h is the height of the sample, mm.

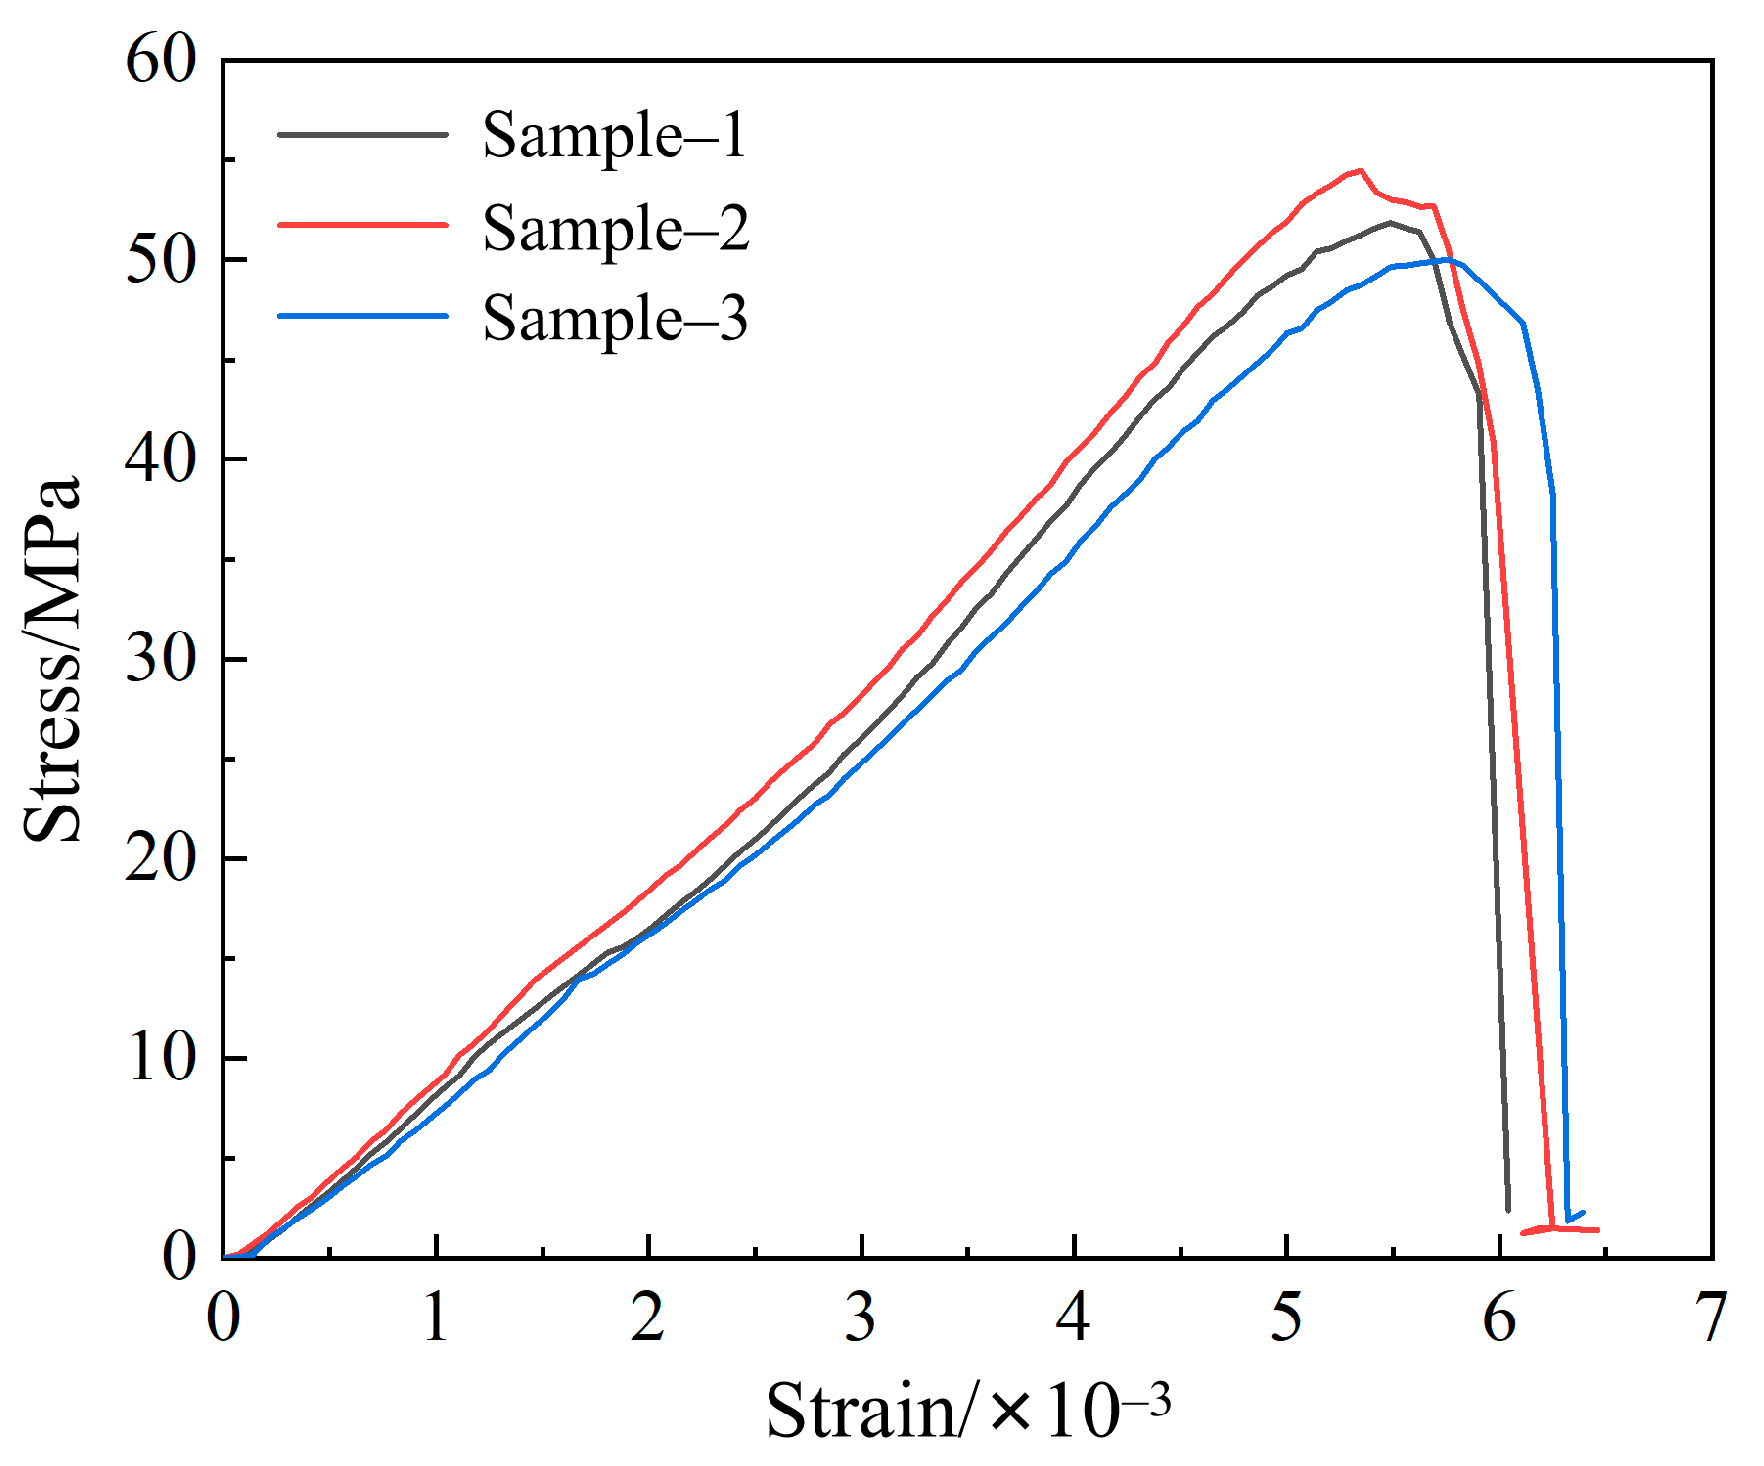
2.2.3. Uniaxial Compression Test

A uniaxial compression test was performed on the processed rock specimens, and the uniaxial compression strength, σd (MPa), elastic modulus, E (MPa), as well as Poisson’s ratio, μ, of the rock were calculated by analyzing the stress–strain curve. An electro-hydraulic servo universal testing machine was utilized, and the loading rate was kept at 0.5 mm/min during the experiment. the obtained stress–strain curve is depicted in Figure 4.
According to the data obtained from the uniaxial compression test, σd, E, and μ are calculated by:
σ d = P d S E = σ c ε v μ = ε v ε h
where Pd is the load at the ultimate failure, N; S is the cross-sectional area of the rock specimen, mm2; σc is the stress at 60% of the ultimate failure, MPa; εv is the axial strain; and εh is the radial strain.

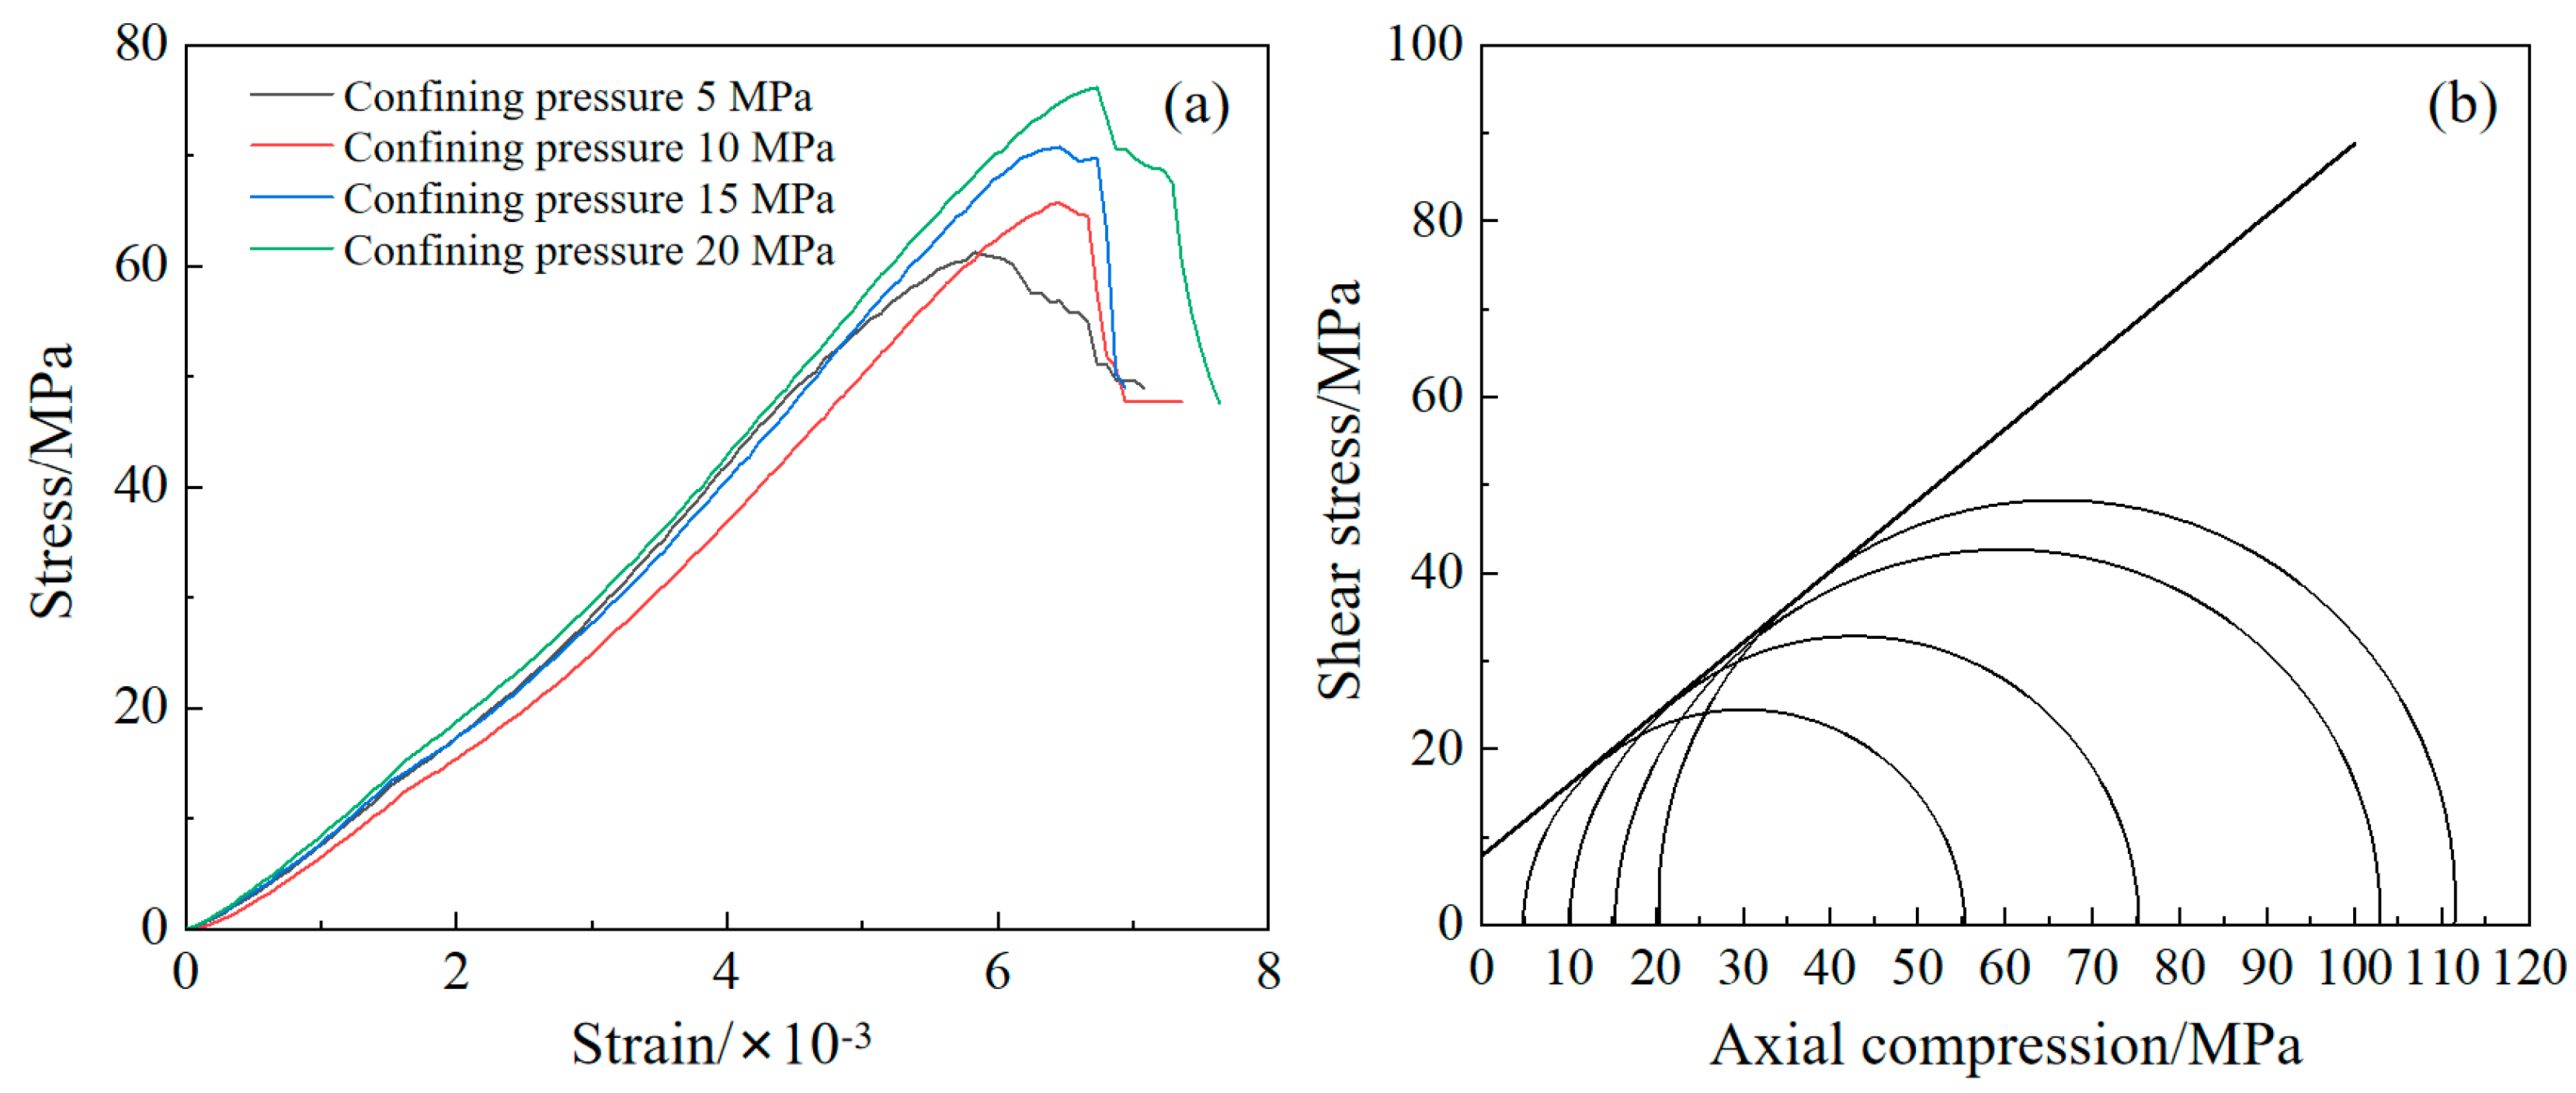
2.2.4. Triaxial Compression Test

In the real world, rocks are subjected to vertical pressure, but usually in a multi-directional compression situation. The triaxial compression test can simulate the stress state of the rock sample under three-directional compression [35]. A triaxial compression tester was used to perform the test. By changing the confining pressure (i.e., 5 MPa, 10 MPa, 15 MPa, and 20 MPa), the compressive behavior of the rock specimen is measured (Figure 5a) and the shear strength envelope curve is drawn (Figure 5b), thereby obtaining the cohesion, C, and the internal friction angle, Φ, of the specimen.

2.2.5. Measured Mechanical Parameters

The data of the Brazilian splitting test, uniaxial compression test, as well as triaxial compression test were sorted, and the rock mechanics parameters are shown in Table 1. Among them, the determination of joint surfaces “C” and “Φ” and their value methods were calculated by the peak shear strength equation with three-dimensional joint morphology parameters proposed by Xia et al. [36].
Because the field sampling avoided the broken rock mass area, the rock samples in the mechanical test were relatively intact. Nevertheless, the actual rock mass of the slope had a lot of fractures due to weathering, unloading, and other effects, showing the characteristics of heterogeneity, anisotropy, and discontinuity, and its mechanical properties were also variable. Considering the properties of the rock mass and the influence of environmental factors, the parameters obtained in the mechanical test did not fully represent the mechanical characteristics of the natural rock mass. Thus, the measured rock mechanical parameters were weakened by the Hoek–Brown equation [37,38,39,40,41], and the weakened results are shown in Table 2.

2.3. Similarity Material

The deformation process of slopes cannot be fully replicated in physical models. Only general insights can be derived from reduced-scale physical models that satisfy the similarity theory. The similarity simulation experiment is an important scientific method, and it is the most effective method for some large-scale physical engineering experiments that cannot be realized in nature due to safety, uncontrollability, and other reasons. This process uses the similarity characteristics between things to study the natural laws in a limited space. This research used similarity simulation experiments to establish a laboratory model of the slope in the study area.

2.3.1. Similar Parameter Setting

This experiment was a complex open-pit to underground mining project, so various conditions were needed to ensure the similarity between the model and the prototype [42,43]. In addition to the boundary and initial conditions, the physical model parameters must satisfy the similarity criteria. The subscript p denotes the similarity simulation prototype parameters, and m denotes the similarity simulation model parameters. According to the engineering geological investigation and existing conditions, the similarity coefficients were determined as follows [22]:
G e o m e t r y s i m i l a r i t y c o n s t a n t α l = l m l p = 1:250
T i m e s i m i l a r i t y c o n s t a n t α t = t m t p 1:14
B u l k d e n s i t y s i m i l a r i t y c o n s t a n t α r = γ m γ p = 0.625
S t r e s s s i m i l a r i t y c o n s t a n t α σ = σ m σ p = γ m × l m γ p × l p = 2.5 × 10 3
F o r c e s i m i l a r i t y c o n s t a n t α p = F m F p = α r α l 3 = 4 × 10 8
S t r a i n s i m i l a r i t y c o n s t a n t α ε = 1
E l a s t i c m o d u l u s s i m i l a r i t y c o n s t a n t α E = α r α L = 2.5 × 10 3
P o i s s o n s r a t i o s i m i l a r i t y c o n s t a n t α μ = 1
I n t e r n a l f r i c t i o n a n g l e s i m i l a r i t y c o n s t a n t α Φ = 1

2.3.2. Similar Material Proportioning

The selection and proportioning of similar materials were the key to simulating the slope [44,45]. The density of the similar material and the prototype material should be relatively similar to provide a reliable scale for subsequent calculations. It also requires that the physical properties of these two materials are similar and the mechanical indicators are relatively stable [46]. The material should have a granular bulk, so that it can have a better shape after stacking, air-drying, and cementing. This kind of material needs to have a denser structure and a larger friction angle after production, which is closer to the actual rock mass. Economic factors should also be considered under the conditions of practicality. In the process of selecting materials, the model construction should be planned according to the solidification time, and a scheme where materials can be recycled, are harmless, and easy to handle is preferred. Moreover, the mechanical parameters close to the precalculated parameters can be obtained by adjusting the material ratio [47,48].
Through multiple experiments, the scheme with the smallest error from the theoretical value was finally selected. The main materials were sand, lime, and gypsum, plus a small amount of mica powder and borax. In a similar physical experiment, the cementing materials were 60-mesh coarse sand, 120-mesh fine sand, 600-mesh lime, and 800-mesh gypsum. The design proportions are shown in Table 3, where coarse sand and fine sand are the main materials, and lime and gypsum can enhance the cohesiveness. Borax plays the role of retardation when making materials, and mica powder can play the role of filling during the air-drying interval when building the model. The amount of water used was 1/7 of the total amount, and the borax and mica powder were both 1/90 of the water amount.
The mass, Q (kg), of each material can be determined by:
Q = V × ρ × K
where V is the model volume, m3; ρ is the material density, kg/m3; and K is the material loss coefficient. According to Table 3, the mass values of different materials can be observed in Table 4.

2.4. Artificial Simulation Rainfall Test

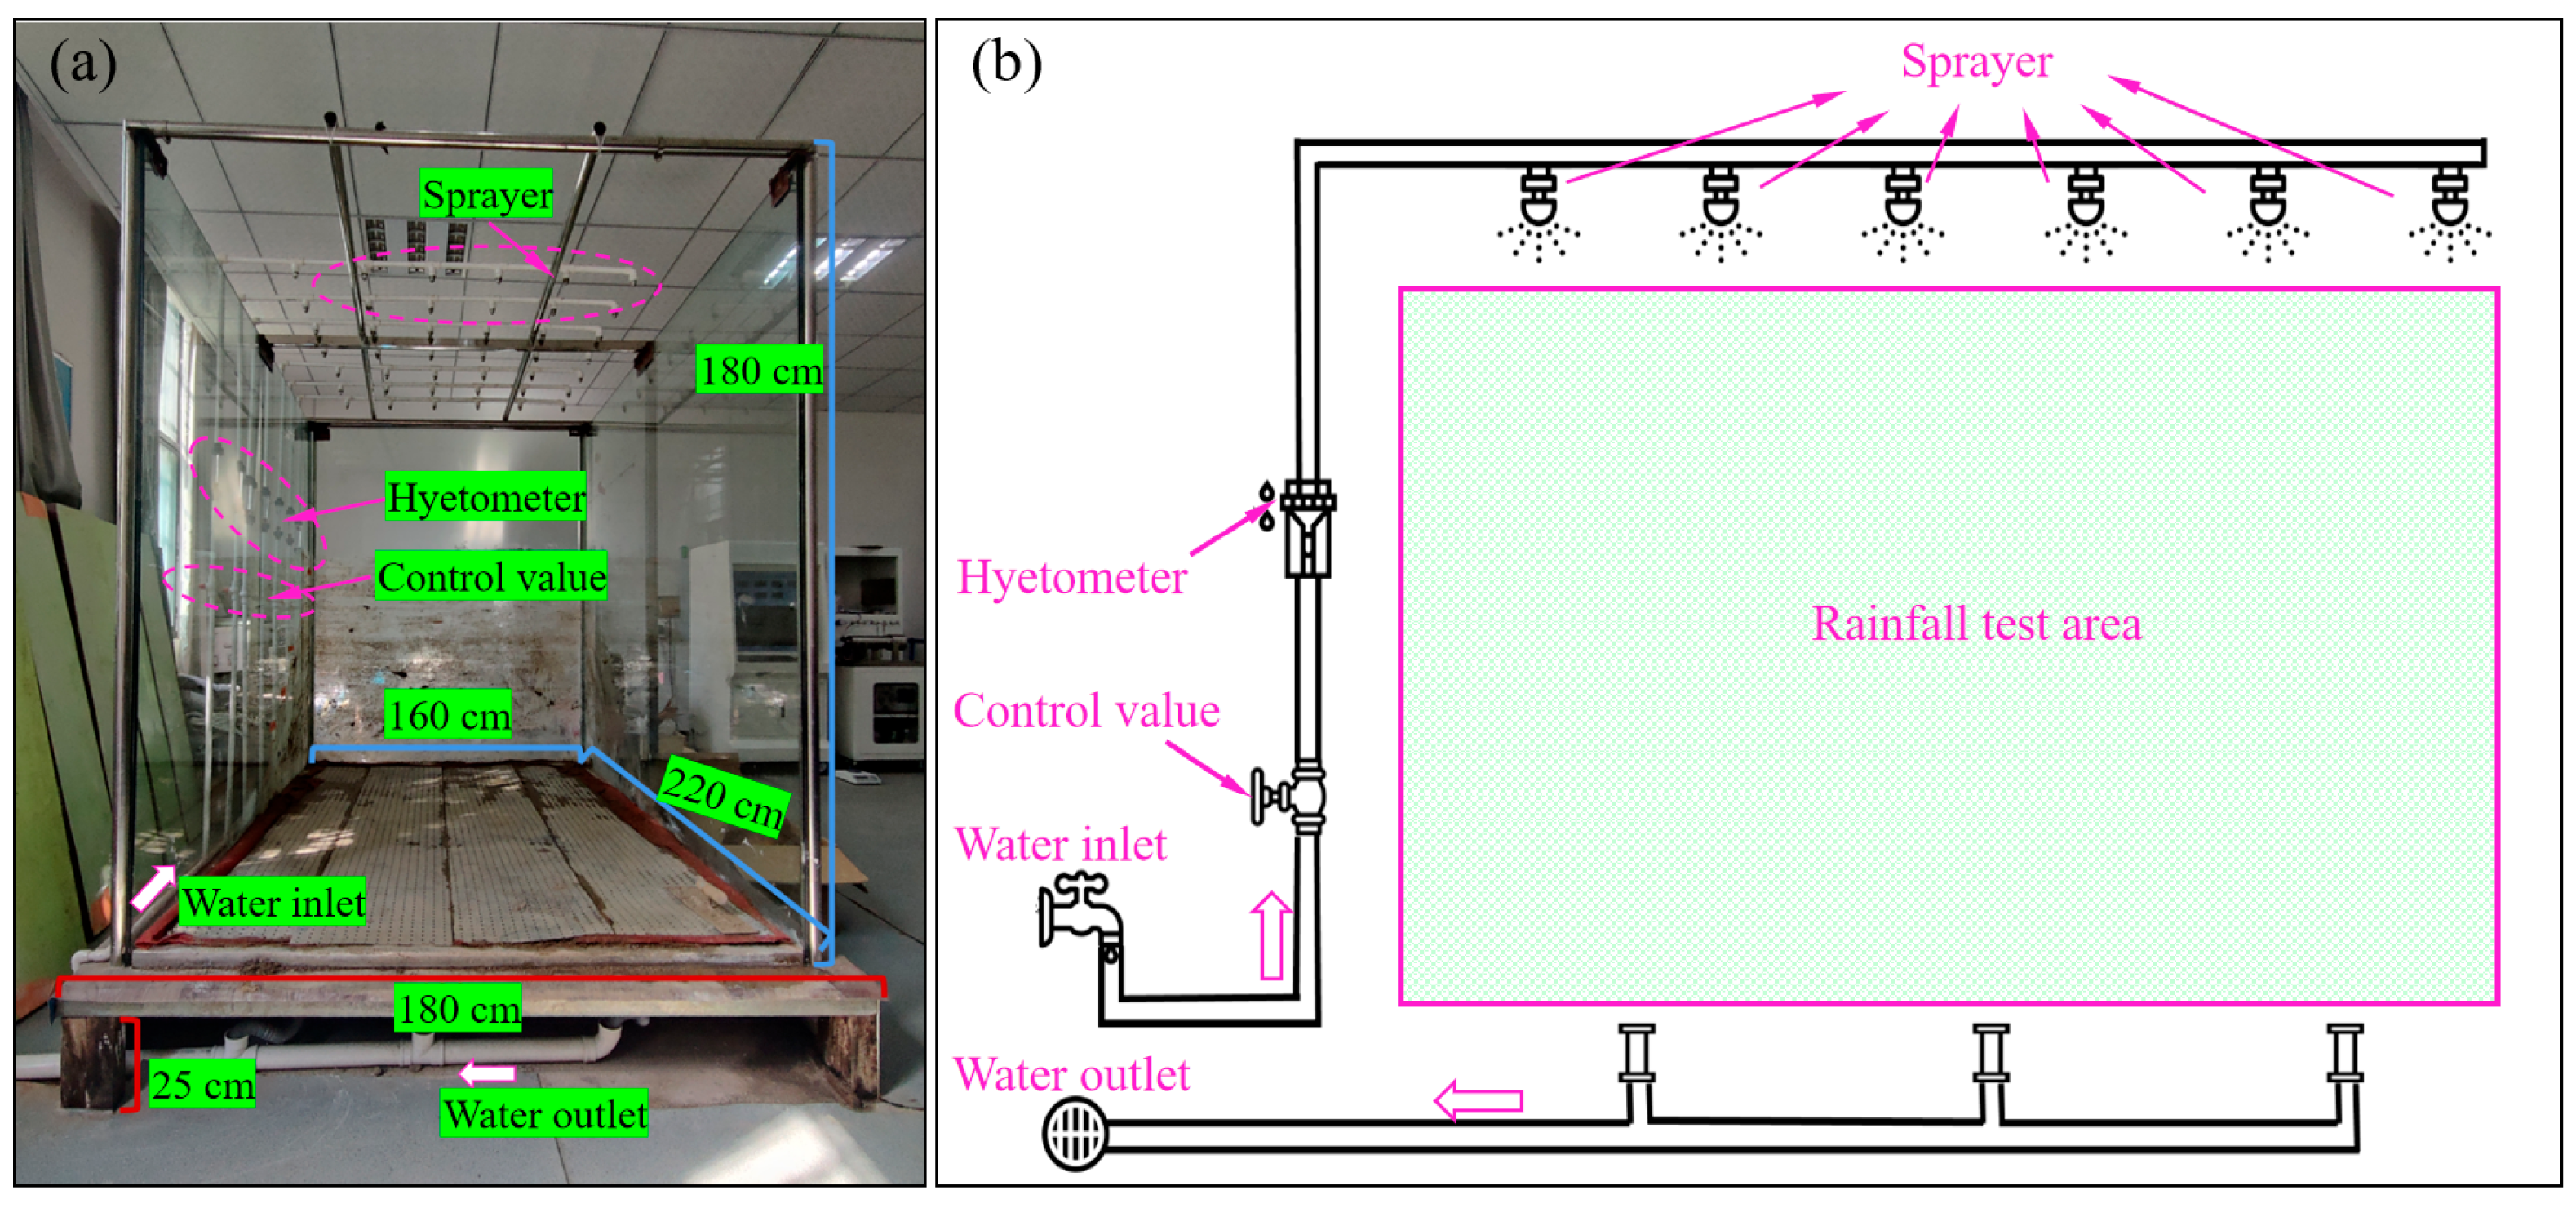
2.4.1. Test Bench Design

To meet the requirements of the coupling effect of excavation unloading and heavy rainfall, the experiment was carried out on an artificial simulation rainfall test bench. The bench consisted of the base and rainfall test areas. The base had a size of 250 cm × 180 cm × 25 cm. Above the base, there was a rainfall test area surrounded by double- layer composite tempered glass on three sides. Moreover, under the premise of ensuring observability, the glass could constrain the model, meet the boundary conditions, and prevent rainwater from leaking out. The rainfall test area had a size of 2.2 m × 1.6 m × 1.8 m (Figure 6a).

2.4.2. Rainfall System Design

To better simulate natural rainfall, a nozzle-type artificial rainfall device was utilized. It could produce uneven raindrop sizes with a certain initial velocity, which was more in line with reality. The rainfall intensity could be controlled by a water pressure-regulation device, which had good applicability for this experiment. To ensure sufficient rainfall and a uniform spray area, a total of 7 columns of rainfall nozzles were set up, 6 in each column, arranged at equal intervals (Figure 6a). The rainfall intensity could be controlled by adjusting the water amount, and the adjustable range was 0~60 L per hour. The base was equipped with a drainage system (Figure 6b).

2.4.3. Rainfall Uniformity Test

This study used the uniformity coefficient, k (%), to judge whether the rainfall system was reliable [49,50,51]. The k method generally requires the placement of multiple cylinders evenly in the rainfall area. It needs to simulate a period of rainfall, record the precipitation capacity collected in the cylinder, and calculate the rainfall uniformity according to:
k = 1 i = 1 n L i L n L
where n is the number of cylinders; Li is the value of each cylinder, mm/h; and L is the average value of the cylinders, mm/h. In the rainfall uniformity test, 12 labeled cylinders were utilized. All cylinders were placed in a rectangular shape evenly in the rainfall test area. Two groups of rainfall intensities of 20 mm/h and 40 mm/h were selected for the rainfall uniformity test, according to the measured data and Equation (13), k20 = 96.05% and k40 = 96.92%. Accordingly, it could be determined that the rainfall system could effectively simulate rainfall in reality and meet the experimental requirements.

2.5. Similarity Simulation Experiment Procedure
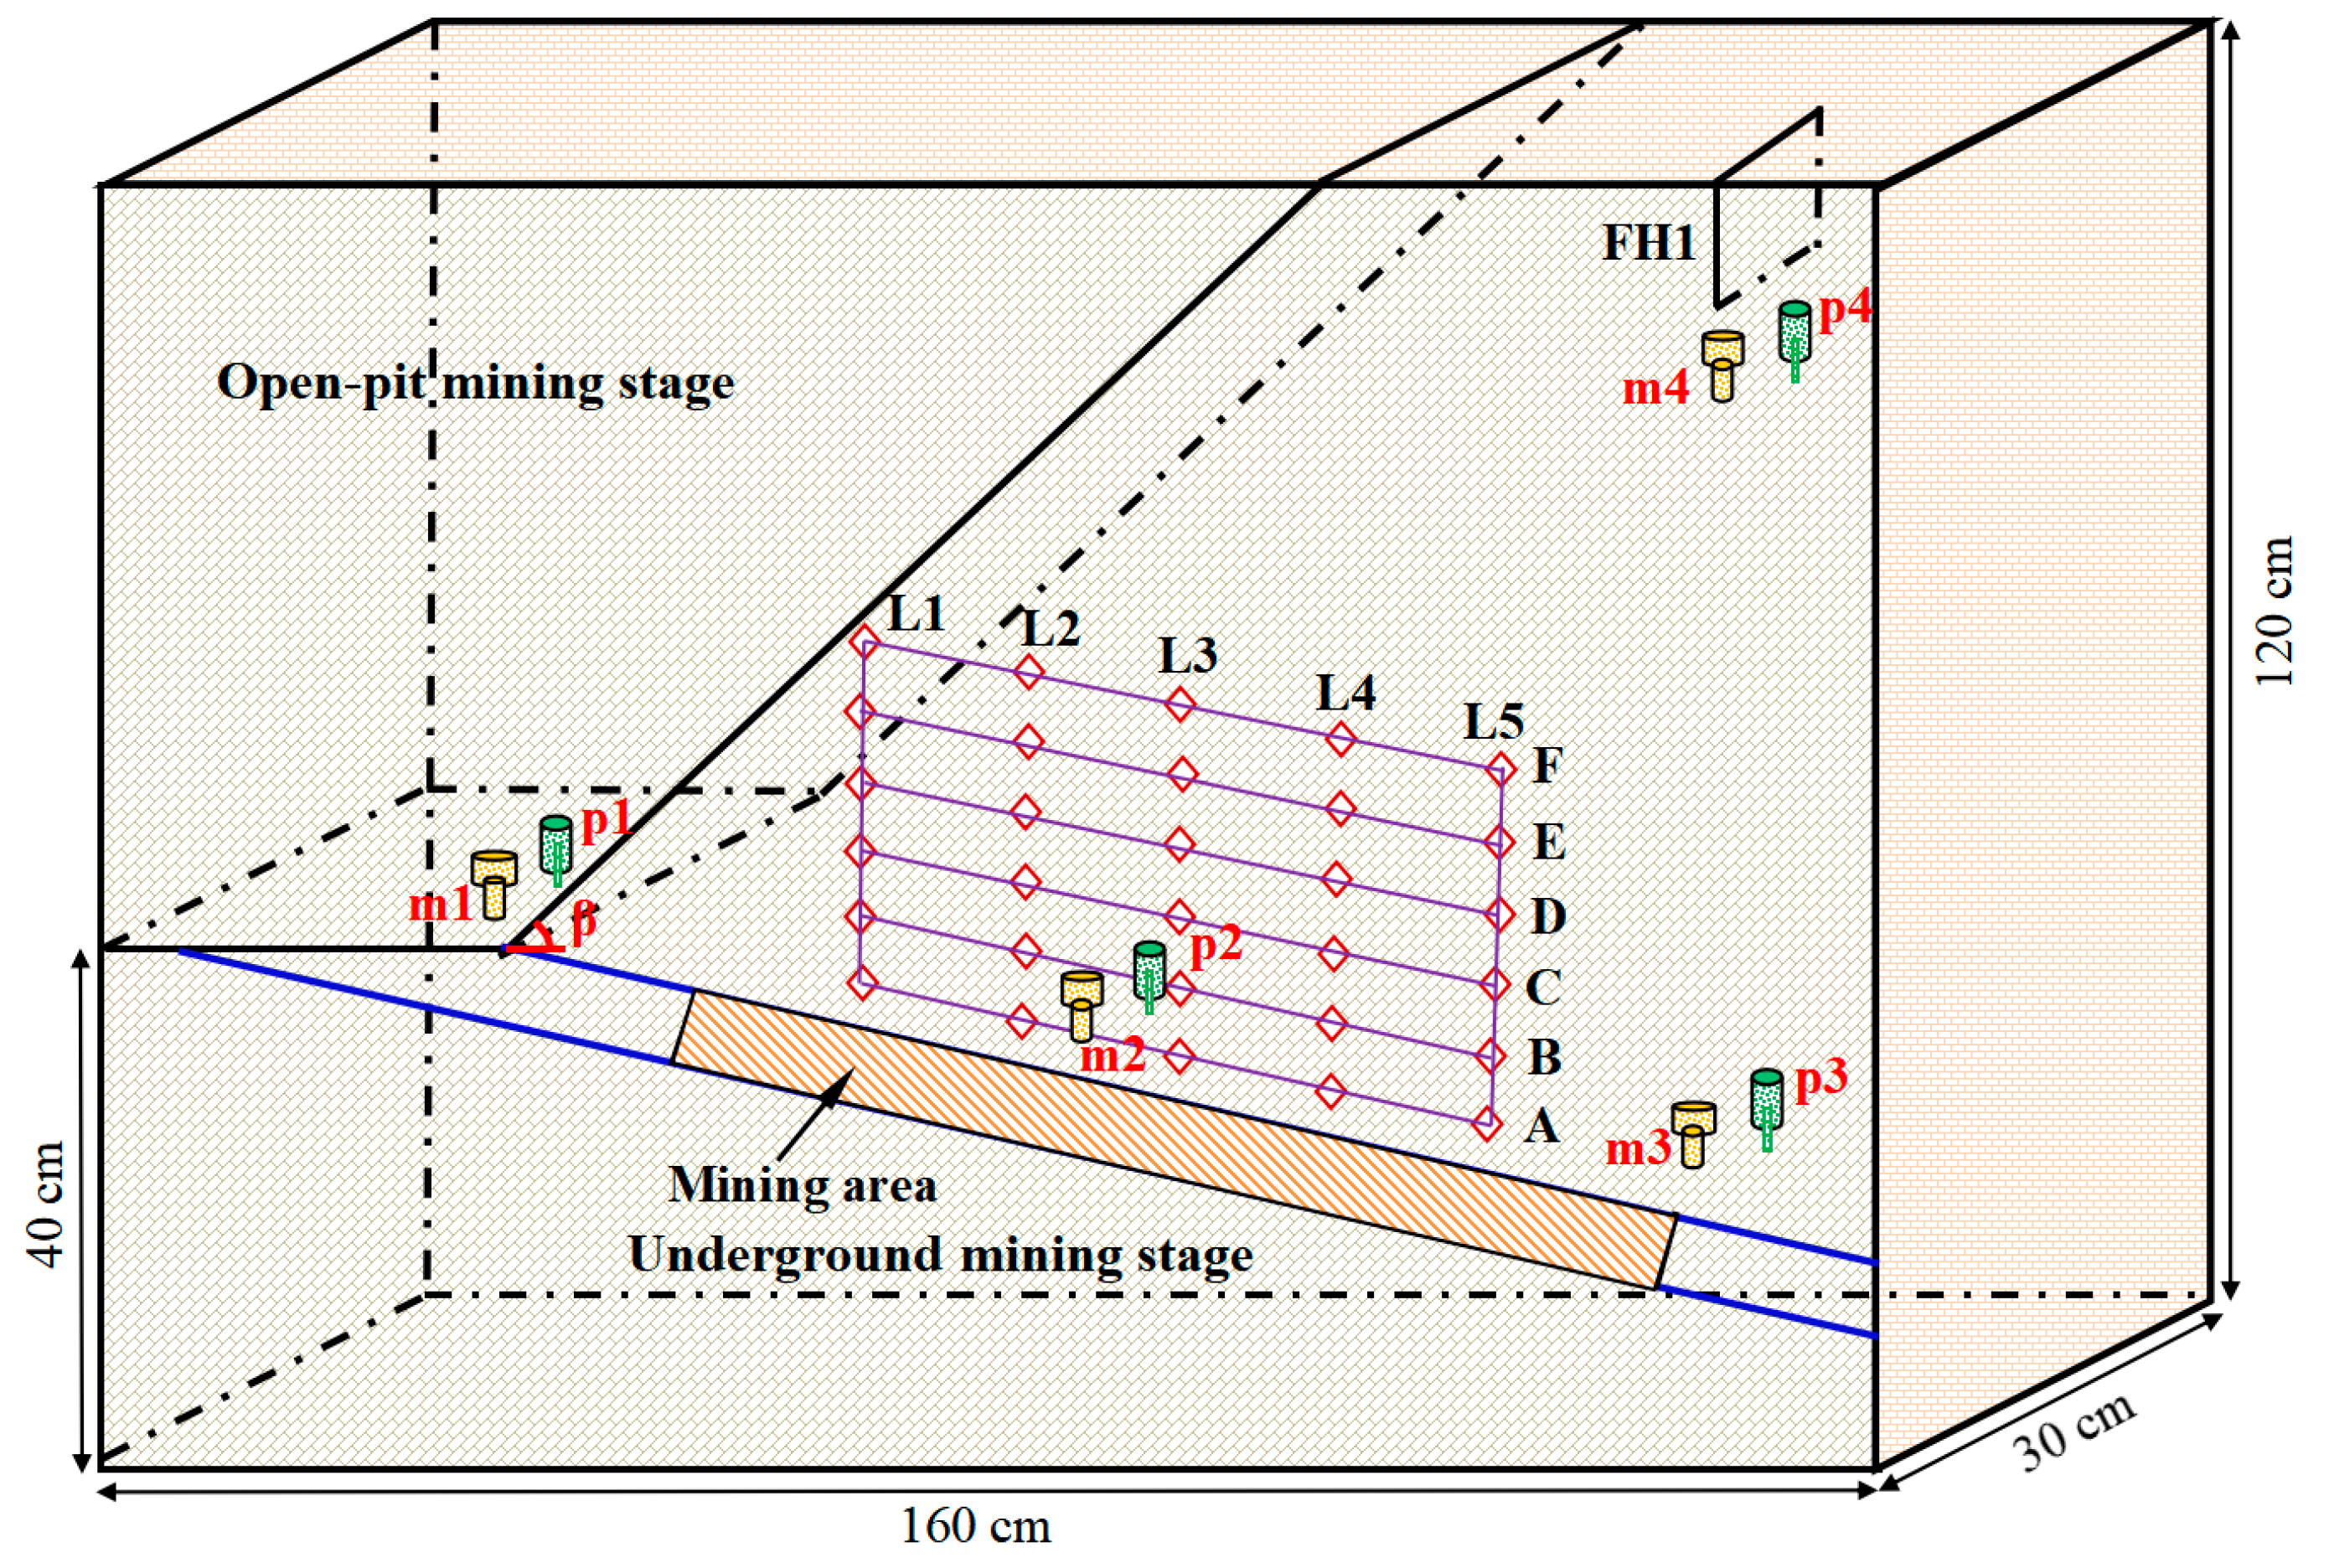
2.5.1. Slope Model

The creation of the large-scale slope model included (1) marking the model size and sensor location on a glass wall of a model box; (2) weighing the different materials and pouring them into a blender to mix them thoroughly; (3) installing a baffle (length × width × height = 160 cm × 3 cm × 30 cm), injecting the mixed material from the bottom to the top and compacting it; (4) when the mixture was filled into each layer of the baffle height, we sprinkled a layer of mica powder and let it dry for 1 to 2 d; (5) continuing with installing the baffle and injecting the mixture, embedding the water content and pore water pressure sensors (Figure 7b,c); (6) as the physical model was stacked to the fourth layer of the baffle, the initial crack FH1 was prefabricated (Figure 7a); (7) after drying the model for 20 d, removing the baffle and drying it for another 3 to 5 d; and (8) installing and debugging the three-view stereo camera and data acquisition device to carry out the experiments (Figure 7f).

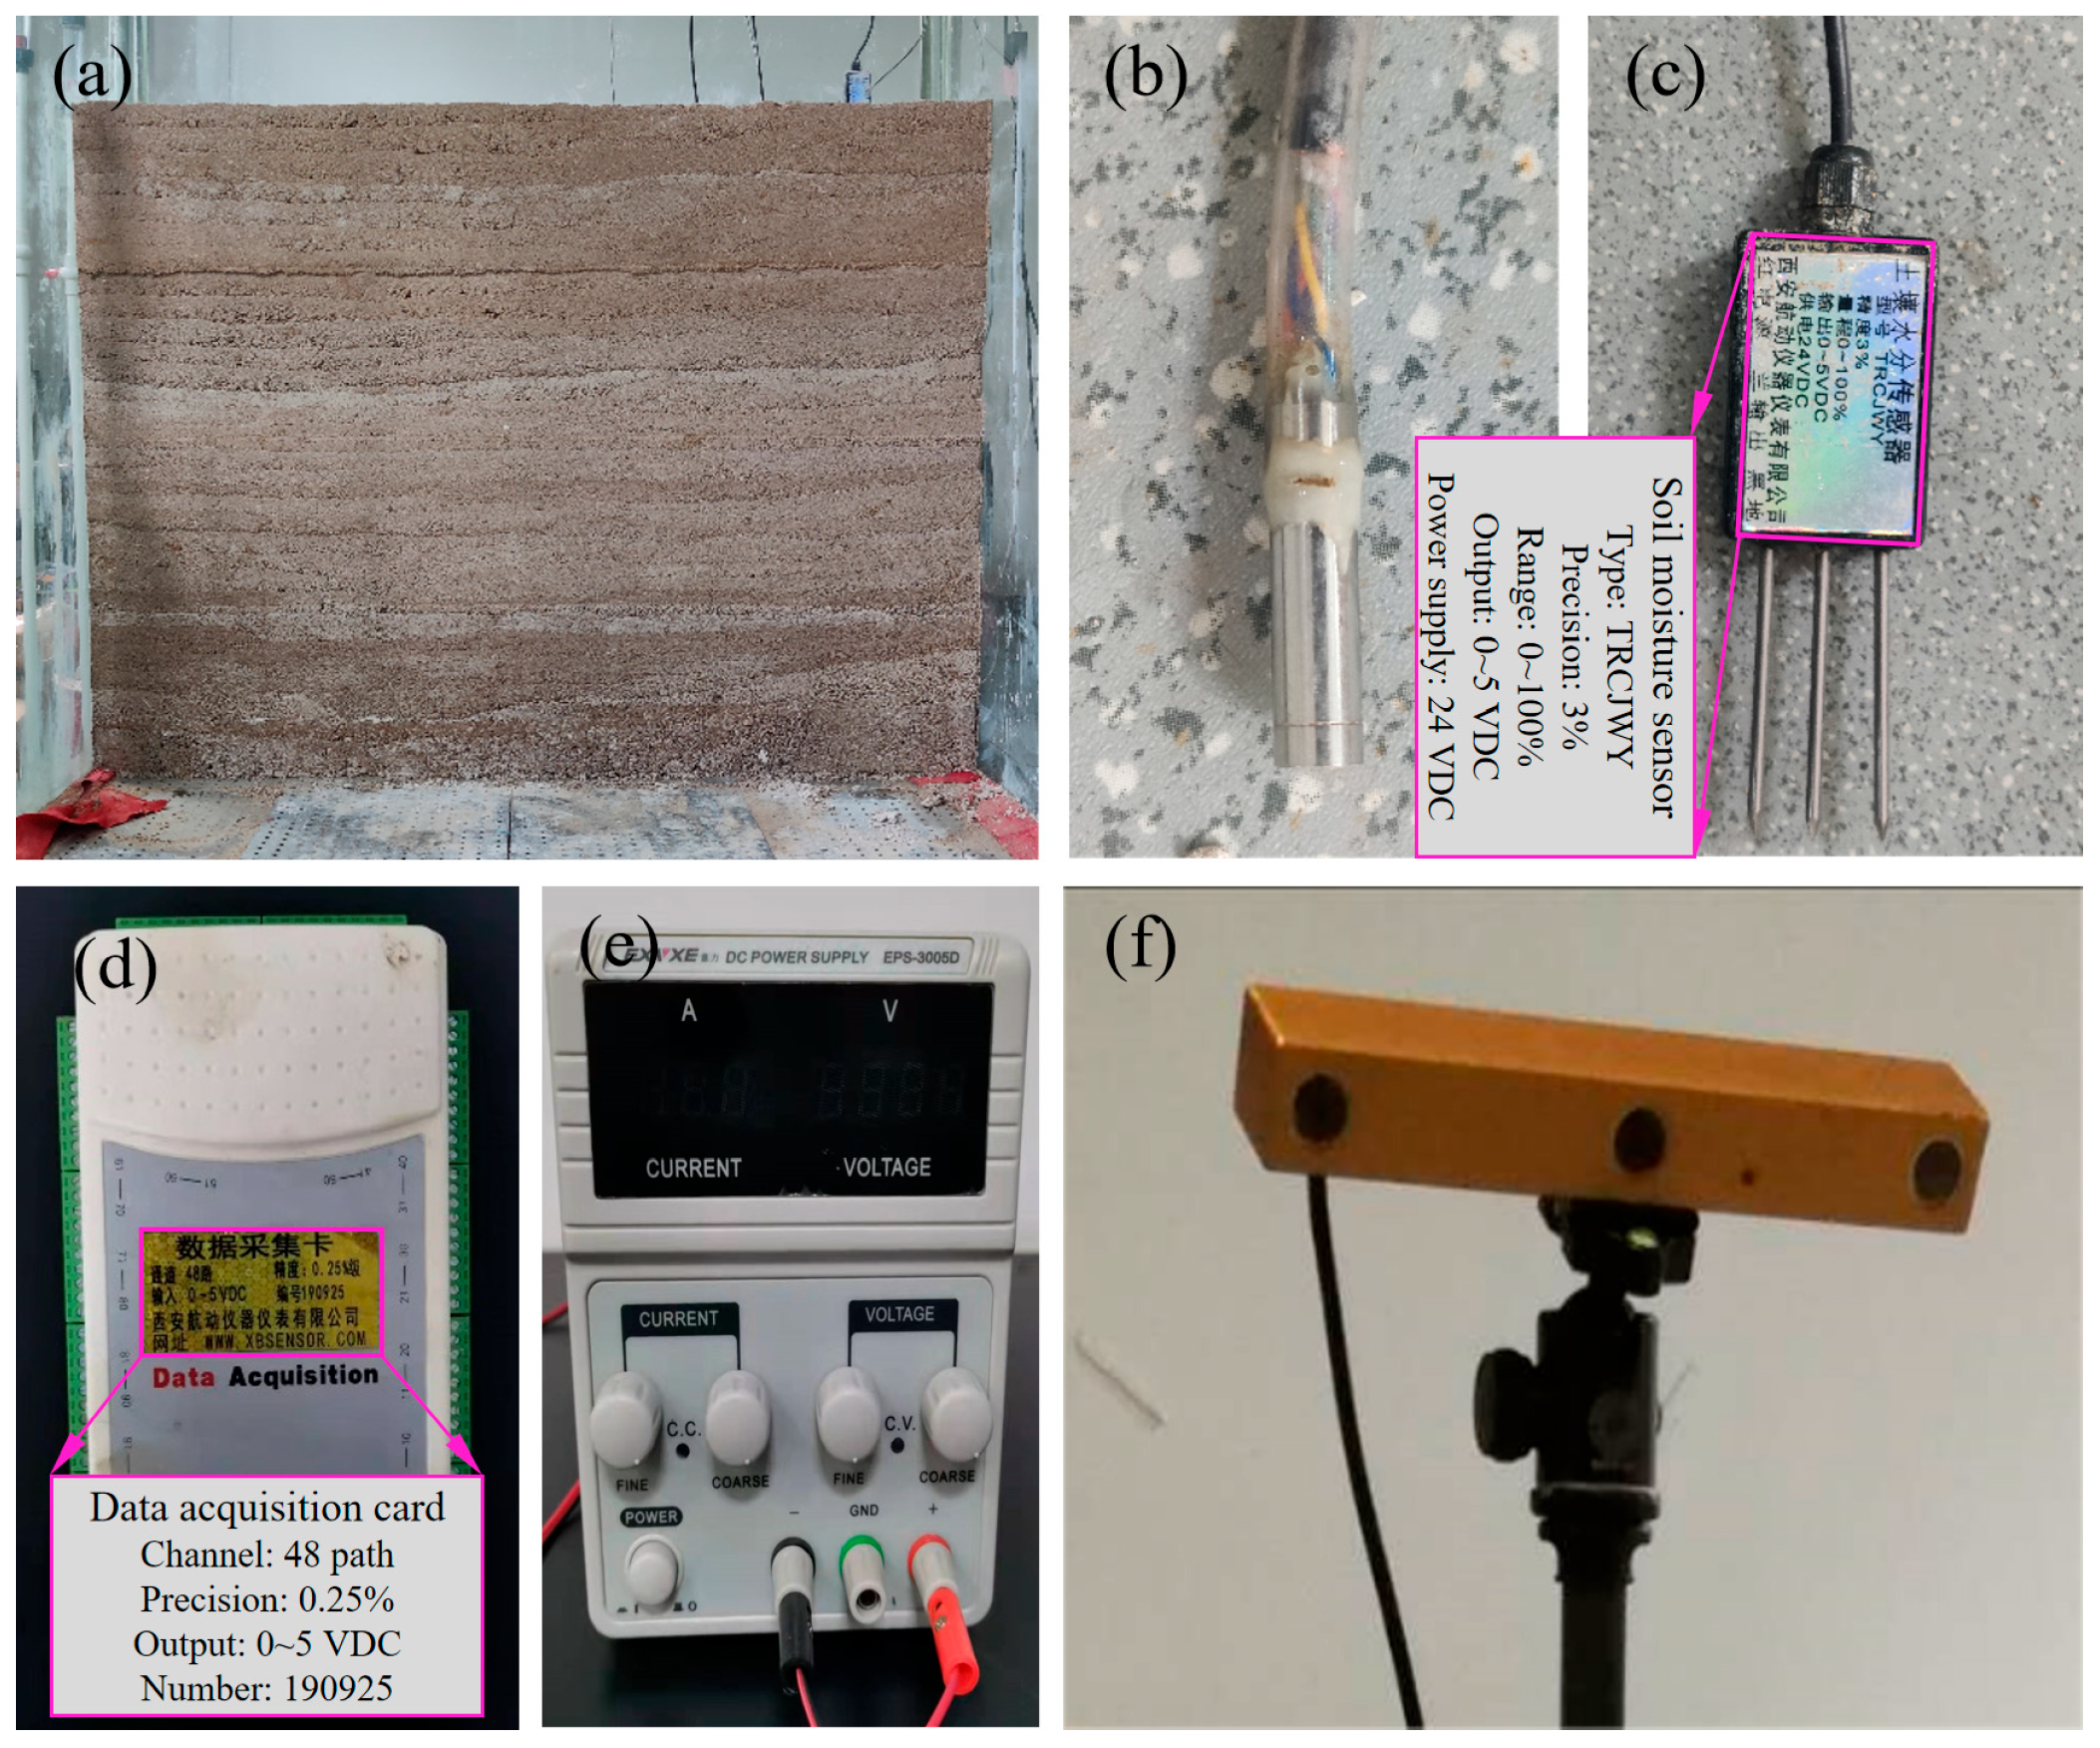
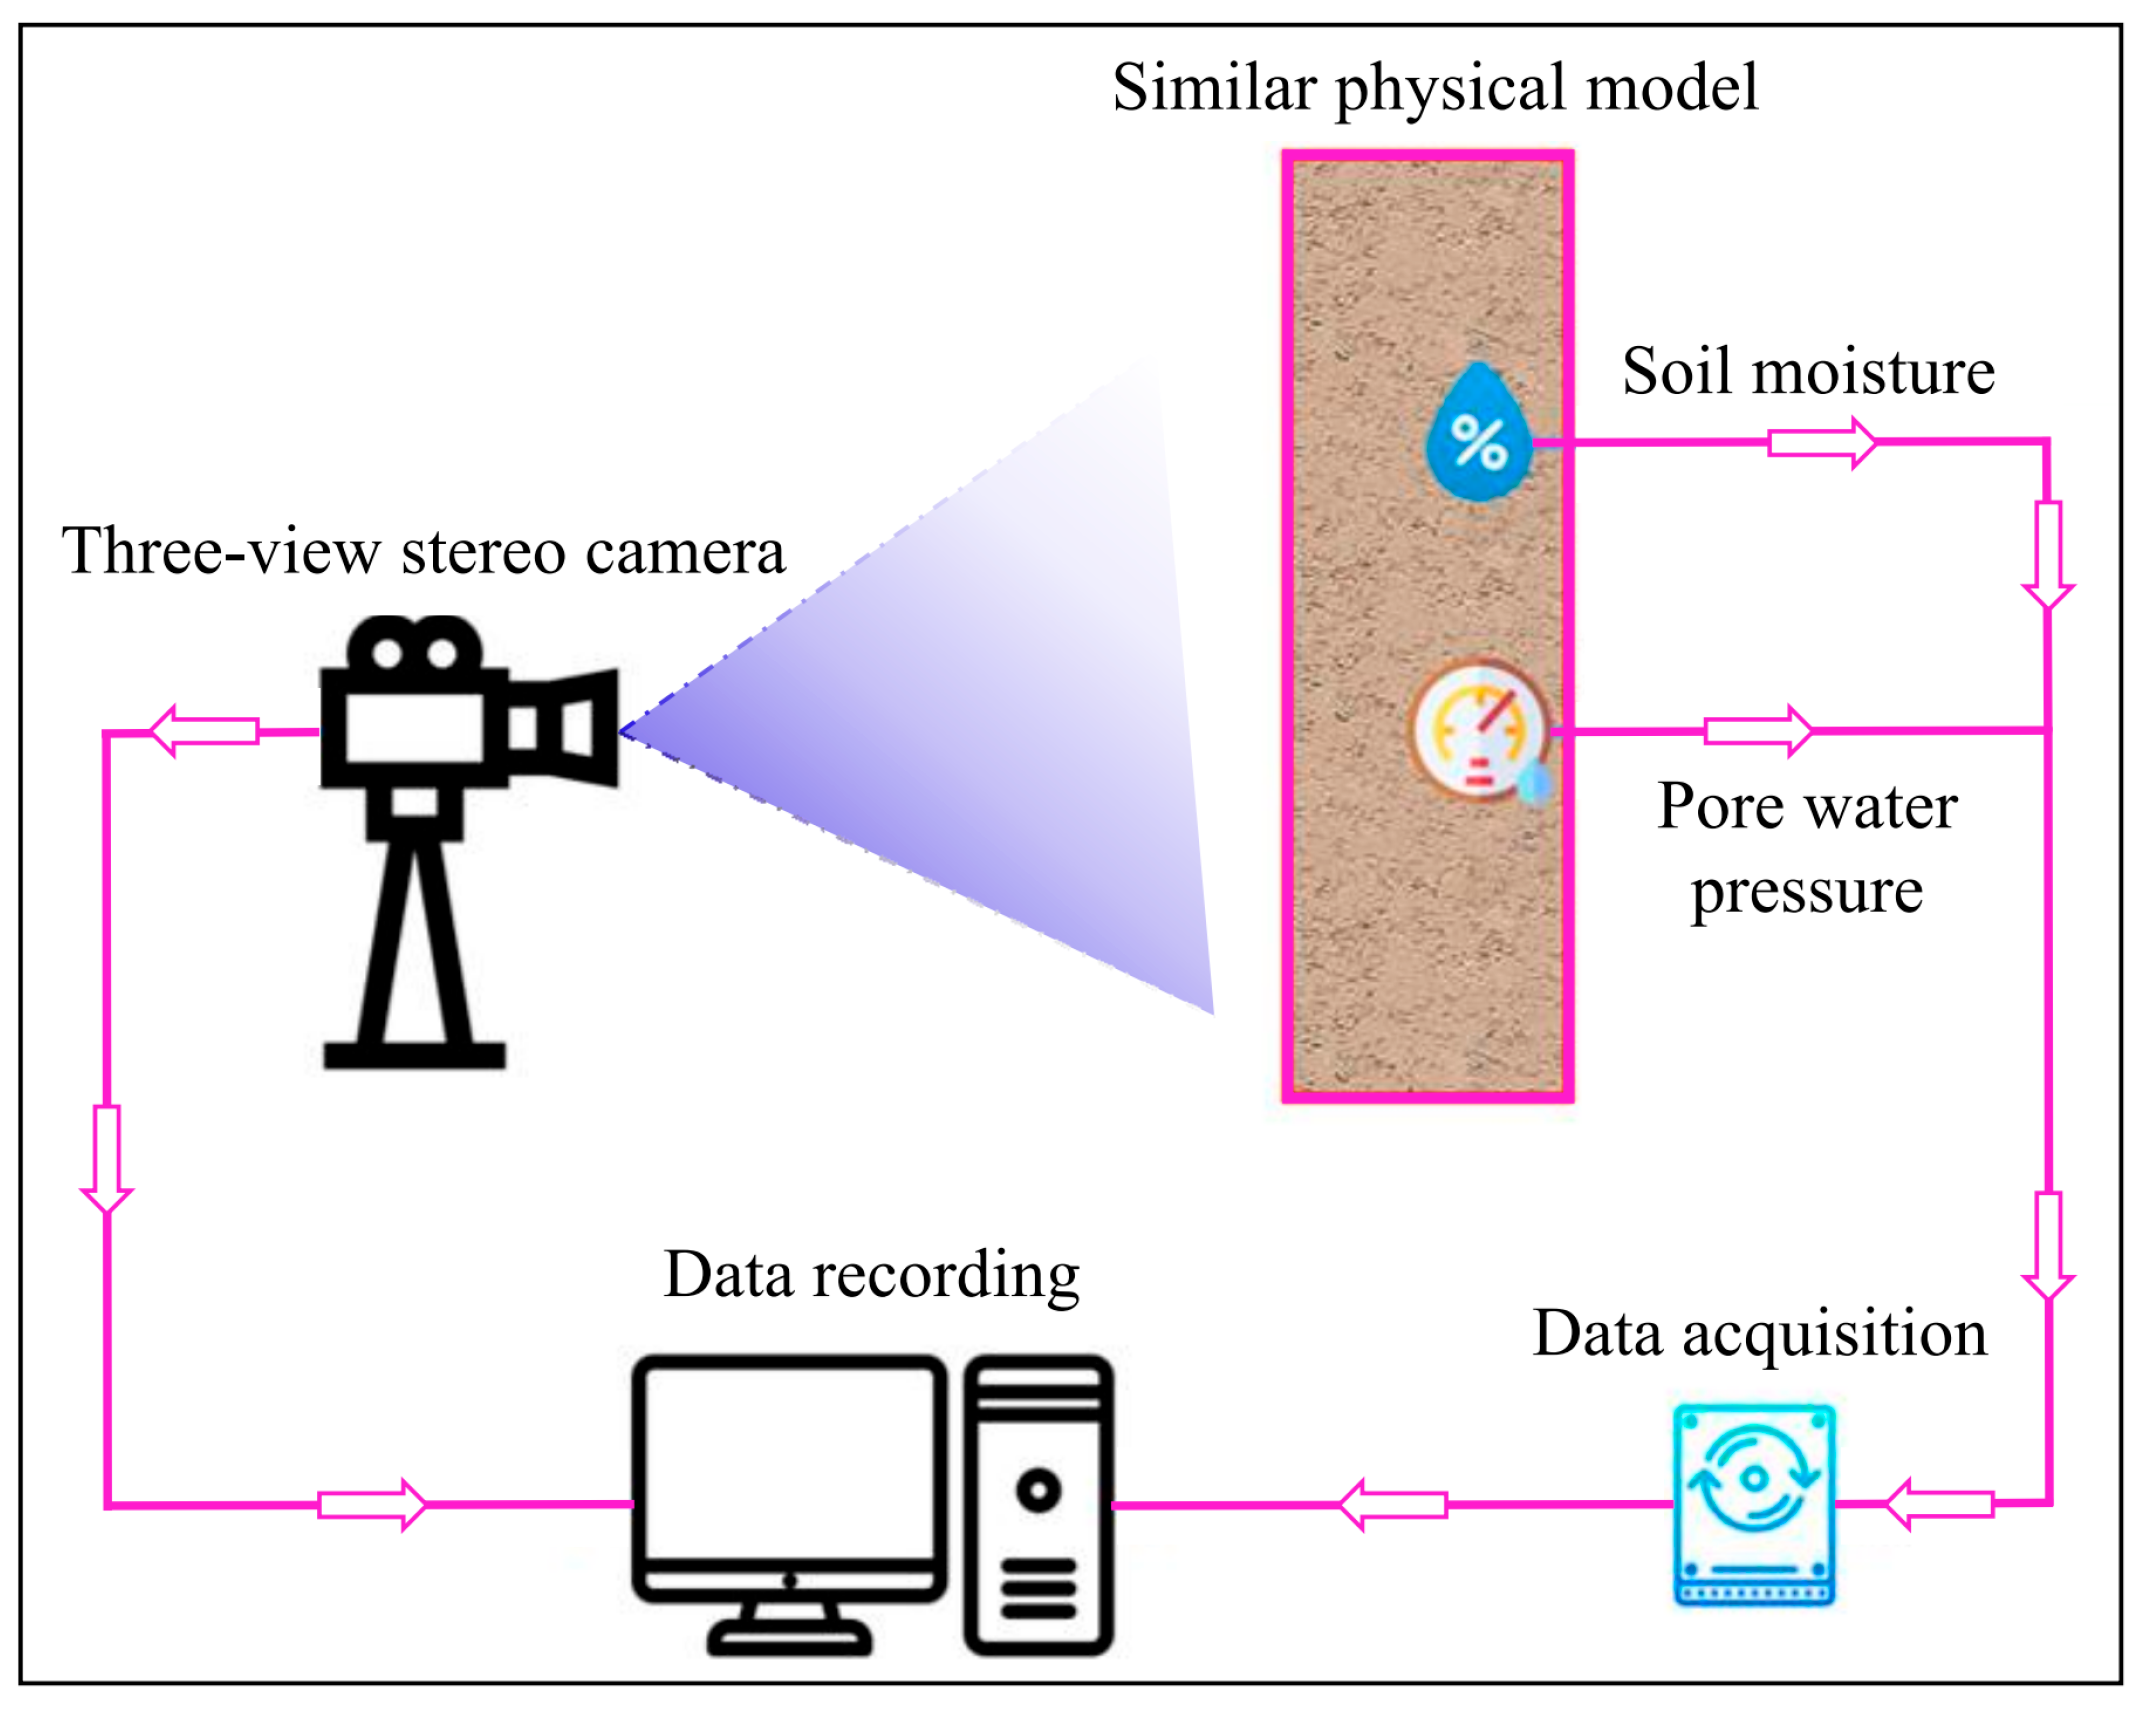
2.5.2. Data Acquisition

The data acquisition was divided into sensor and image acquisition systems, which were used to record the internal and surface states of the slope model, respectively. The sensor acquisition system consists of pore water pressure sensors (Figure 7b), three-needle soil moisture sensors (Figure 7c), data acquisition cards (Figure 7d), and direct-current stabilized power supplies (Figure 7e). A total of 4 pore water pressure sensors and 4 soil moisture sensors were utilized in this experiment. Moreover, the image acquisition system used a three-view stereo camera, with a resolution of 1280 × 960, which had the function of the automatic correction of lens distortions and camera position deviations (Figure 7f). It could directly connect with the computer to record data. The data obtained by the camera contained image information and point cloud coordinates. Combining the two obtained the displacement and damage of the model.
As depicted in Figure 8, the sensors are connected to the data acquisition card, which transfers the internal monitoring data of the model to the computer for recording. The three-view camera can record the whole process of external damage to the model during the experiment. The combination of the two helps us to better analyze and understand the slope model.

2.5.3. Monitoring System

An important task in the physical experiment is to arrange the soil moisture and pore water pressure sensors. The 8 sensors correspond to 8 monitoring points. As shown in Figure 9, the deepest monitoring point is 70 cm away from the upper plane of the model. The moisture monitoring point, h1, and water pressure monitoring point, k1, are located 10 cm away from the upper surface of the model. The moisture monitoring point, h2, and the water pressure monitoring point, k2, are located at the open-pit to underground mining platform, about 10 cm deep. The moisture monitoring points, h3, h4, and the water pressure monitoring points, k3, k4, are located about 10 cm away from the goaf. Displacement measurement points are arranged along the direction of the goaf, with 5 displacement measurement lines in total, mainly distributed above the mining area. Each measurement line had 6 measurement points, which were utilized to record the overburden displacement.

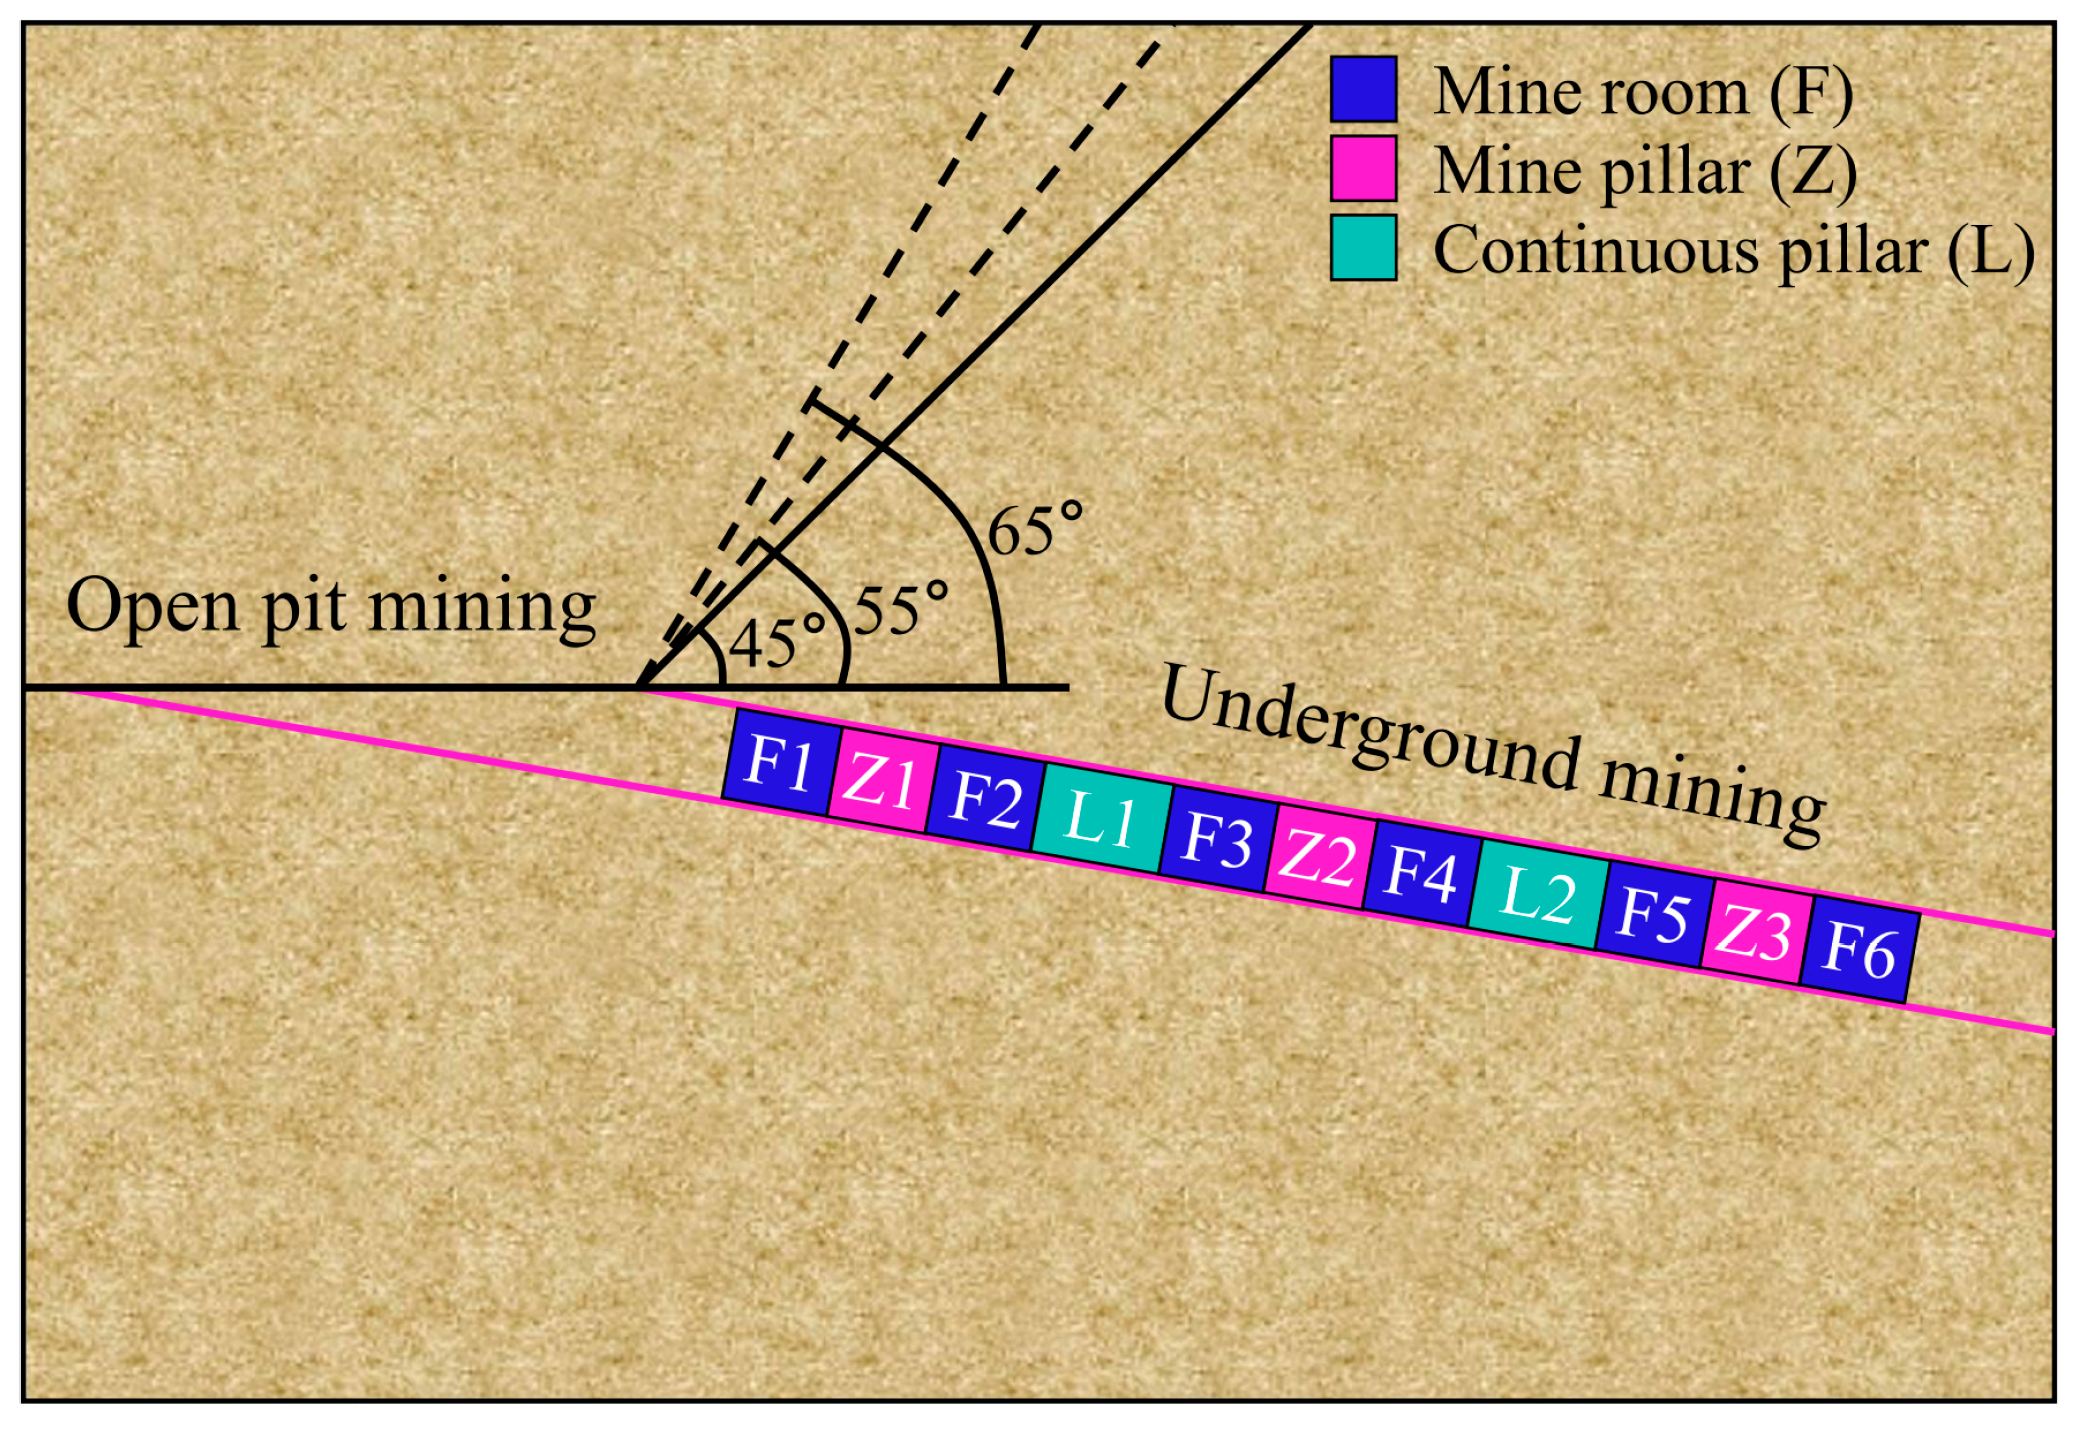
2.5.4. Experimental Scheme

Before the experiment, it was necessary to check whether the test bench was firm, clean the drainage system, and pre-test whether the sensors were working normally. After setting up and adjusting the three-view stereo camera and computer system, the experiment was carried out. As depicted in Figure 10, in the open-pit mining stage, the physical model was open-pit mined, and rainfall was simulated at the same time. The total rainfall duration was 1 h and the intensity was 10 mm/h. According to the field investigation, the excavation stopped at the 40 cm open-pit platform, with a slope angle of 45°. After the open-pit mining was completed, it was converted to underground mining. Here, the mining method used was the room and pillar method. There was a total of 3 groups, 2 mine rooms in each group, and the mine rooms were set to 10 cm. A mine pillar of 7 cm was left between each mine room, and a continuous mine pillar of 14 cm was left between each group of mine rooms. There were 3 mine pillars and 2 continuous mine pillars in total. A group of mine rooms was excavated each time, and rainfall was simulated at the same time with an intensity of 20 mm/h. After each group was completed, rainfall was simulated with an intensity of 40 mm/h for 10 min, and the experimenters were left to facilitate the three-view camera to record the surface morphology of the model.
After the open-pit to underground mine room mining, the mine pillar mining stage was performed. There was a total of 3 reserved mine pillars, and 1 mine pillar was mined each time. Rainfall was simulated at the same time with an intensity of 20 mm/h. After each mining stage was completed, rainfall was simulated with an intensity of 40 mm/h for 10 min.
When the underground mine room pillar mining was completed, continuous mine pillar mining was carried out. There was a total of 2 reserved continuous mine pillars, and 1 continuous mine pillar was mined each time. Rainfall was simulated at the same time with an intensity of 20 mm/h. After each mining stage was completed, rainfall was simulated with an intensity of 40 mm/h for 10 min. After the above steps were completed, a group of experiments was completed, and the slope angles of 55° and 65° were repeated after cleaning.
The specific experimental scheme is shown in Table 5.
The synchronous process of rainfall and mining resulted in the continuous discharge of rainwater from the drainage pipeline of the model box, flowing outside the rock mass and infiltrating it. Throughout the entire experiment, there was no accumulation of rainwater, indicating a well-functioning drainage system.

3. Results and Discussion

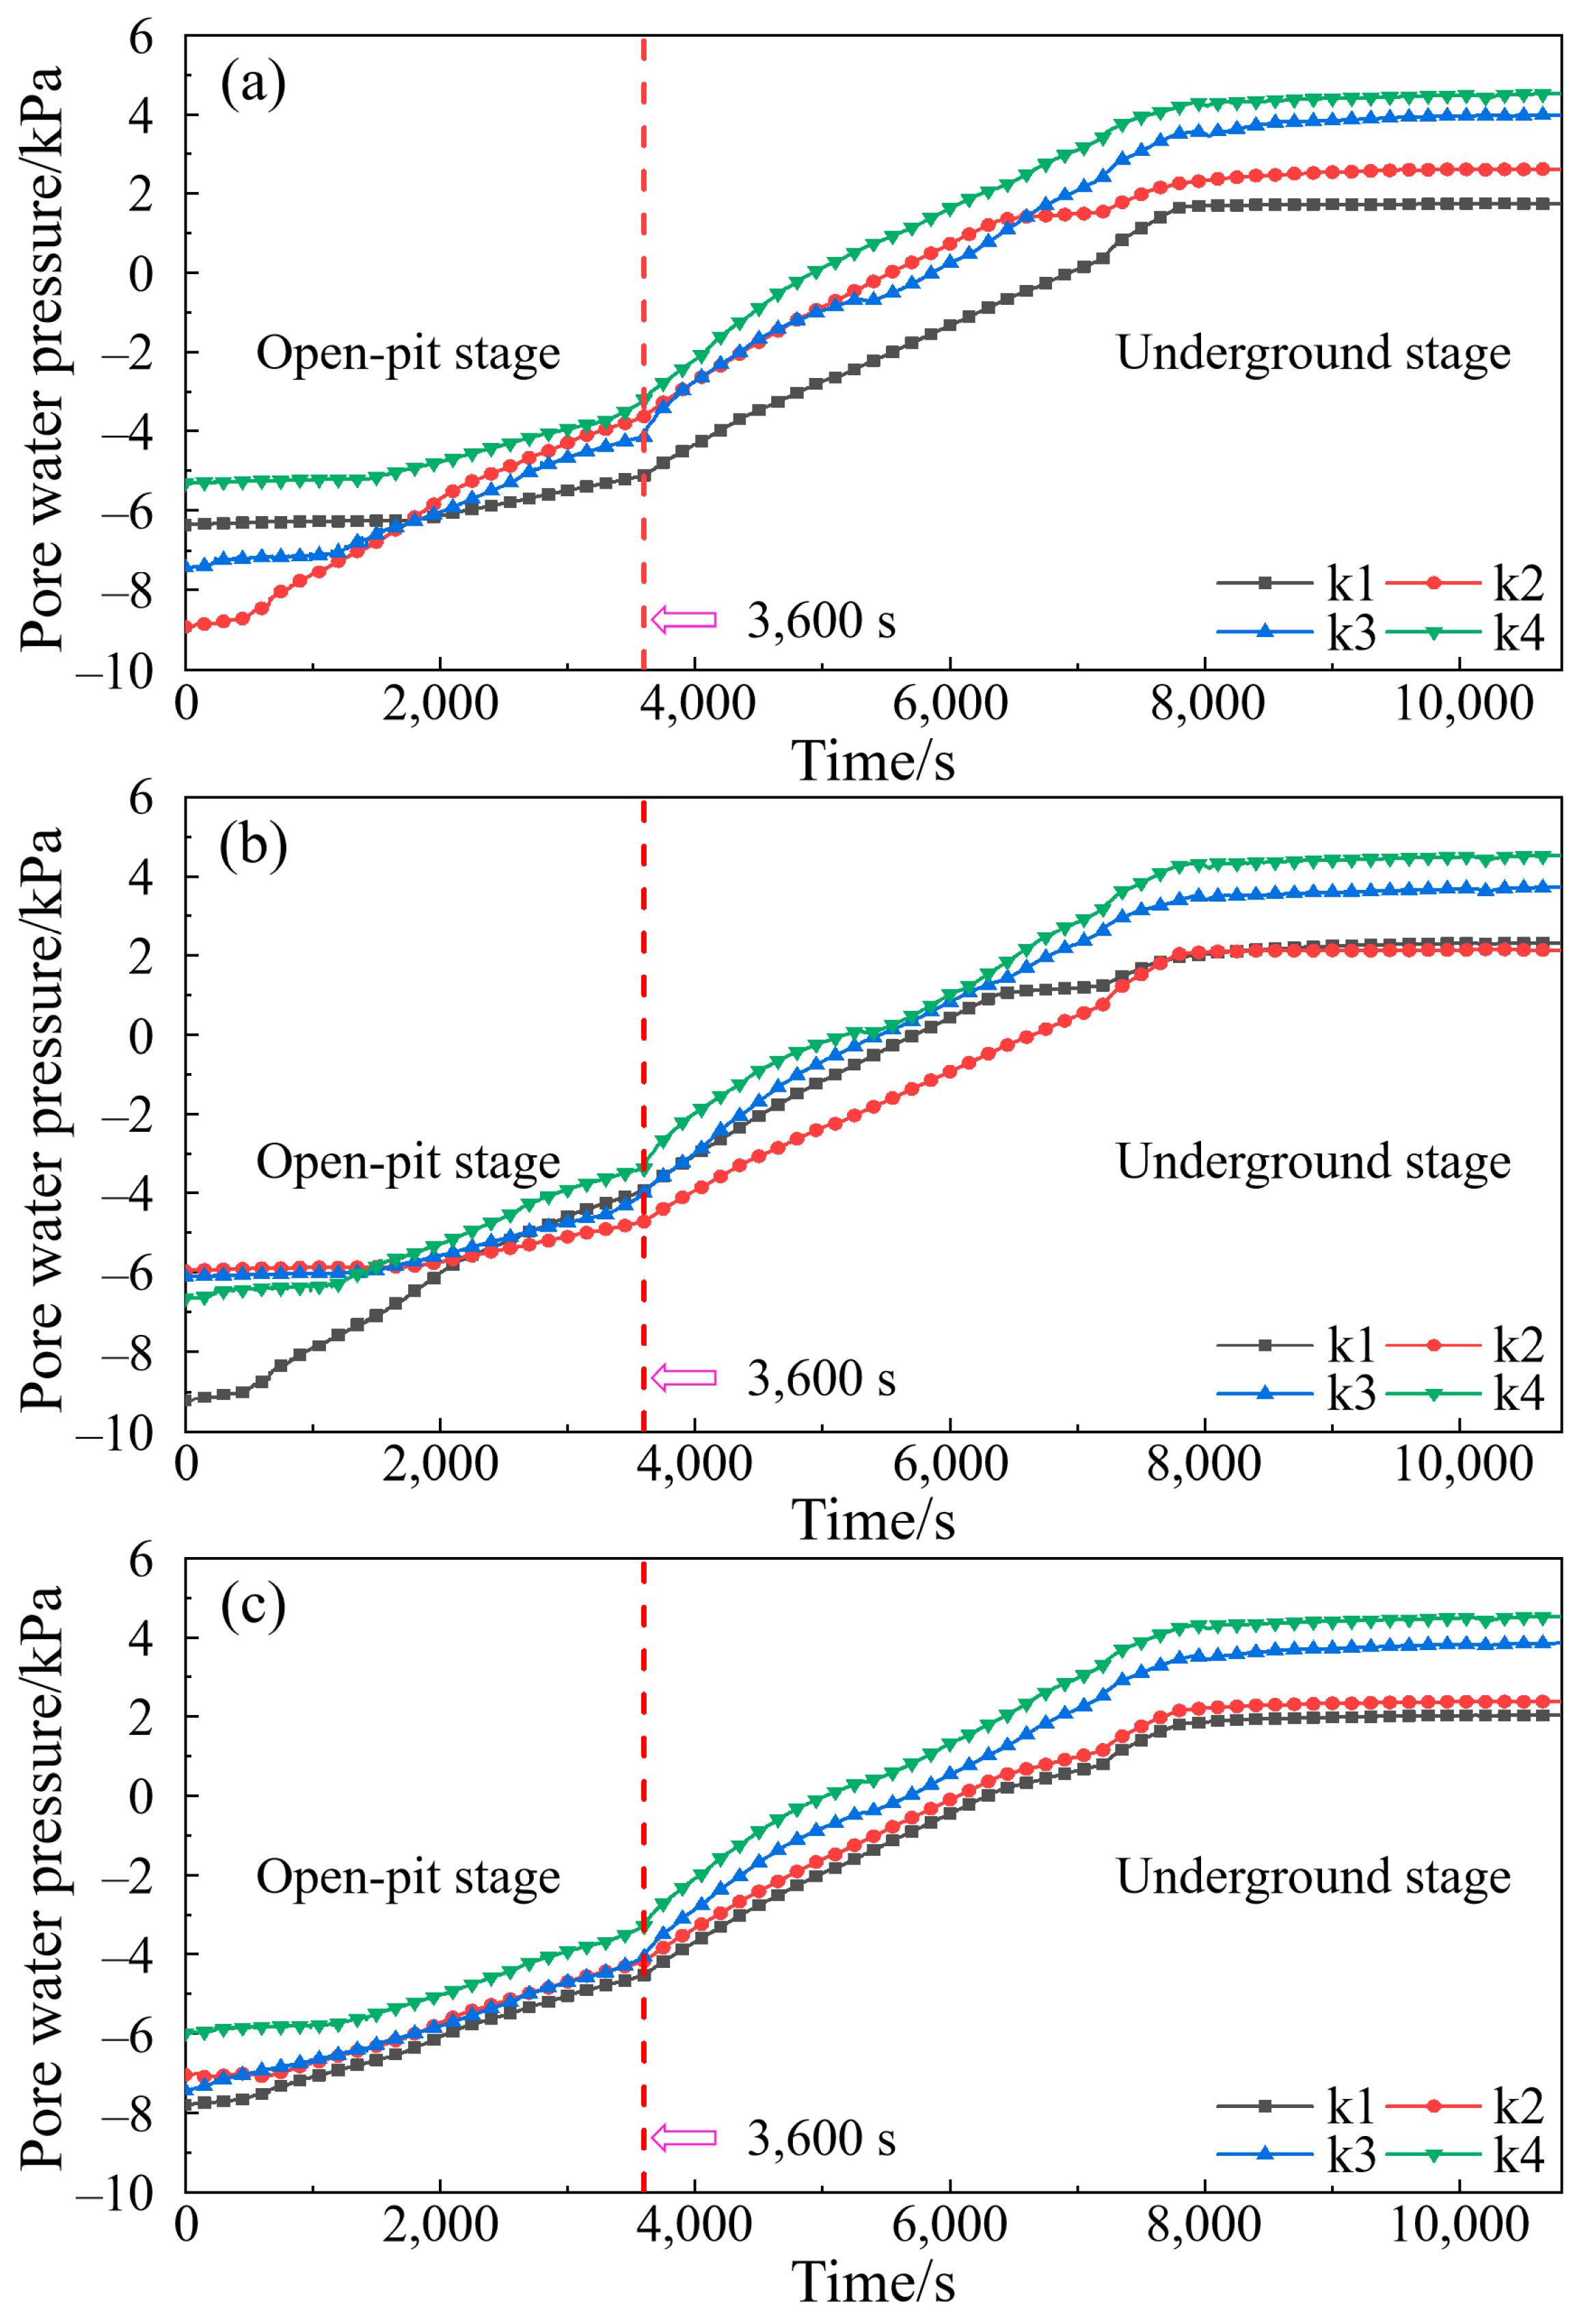
3.1. Variation Characteristics of Pore Water Pressure

According to the experimental scheme, the variation in pore water pressure under different slope angles was obtained, as depicted in Figure 11. The overall law of pore water pressure was that the values of k3 and k4 at a specific depth were higher than those of k1 on the upper surface and k2 on the open-pit platform. The maximum pore water pressure was k4, with an average of 4.53 kPa, slightly higher than k3 in the range of 0.55~0.85 kPa. This was because the position of k4 was deeper than k2, which made the pore water pressure at k4 higher under the same rainfall scenario. Moreover, for the two monitoring points mentioned above, affected by the water accumulation, k2 on the lower slope was slightly larger than k1 on the upper surface, and the difference between the two values was in the range of 0.18~0.53 kPa. The minimum pore water pressure was k1, with an average of 2.03 kPa.
In the underground mining stage, due to the change in rainfall intensity, the rate of the pore water pressure increased, with a growth rate of about 0.48%. The pore water pressure before the open-pit mining stage was negative, indicating that it was unsaturated soil and mainly had matrix suction. With the process of rainfall, the values of all monitoring points slowly increased and turned positive and mainly had pressure, and the internal particles changed from an inward infiltration state to a free seepage state for water molecules [52,53,54]. The pore water pressure of each monitoring point changed from negative to positive in the later stage of growth and tended to become stable in about 30 min. The growth stage of each monitoring point was about 100 min, accounting for 60% of the total experimental time.
The pore water pressure of each monitoring point at the beginning of the experiment under three slope angles was different, which was due to unavoidable errors in the production process of different models, resulting in different initial states. However, it can be seen that the monitoring points above generally enter the rapid growth stage earlier than the sensors inside, and the growth rate in the open-pit mining stage mainly depends on the negative value of each place. A smaller value represents the greater suction of the soil, which can produce a faster change rate, but it also tends to a stable growth state after a certain time. In the underground mining stage, to facilitate the construction, the rainfall intensity constantly changes, which also causes the increase in pore water pressure at that stage to fluctuate constantly, which shows that the change in pore water pressure is sensitive to rainfall intensity.

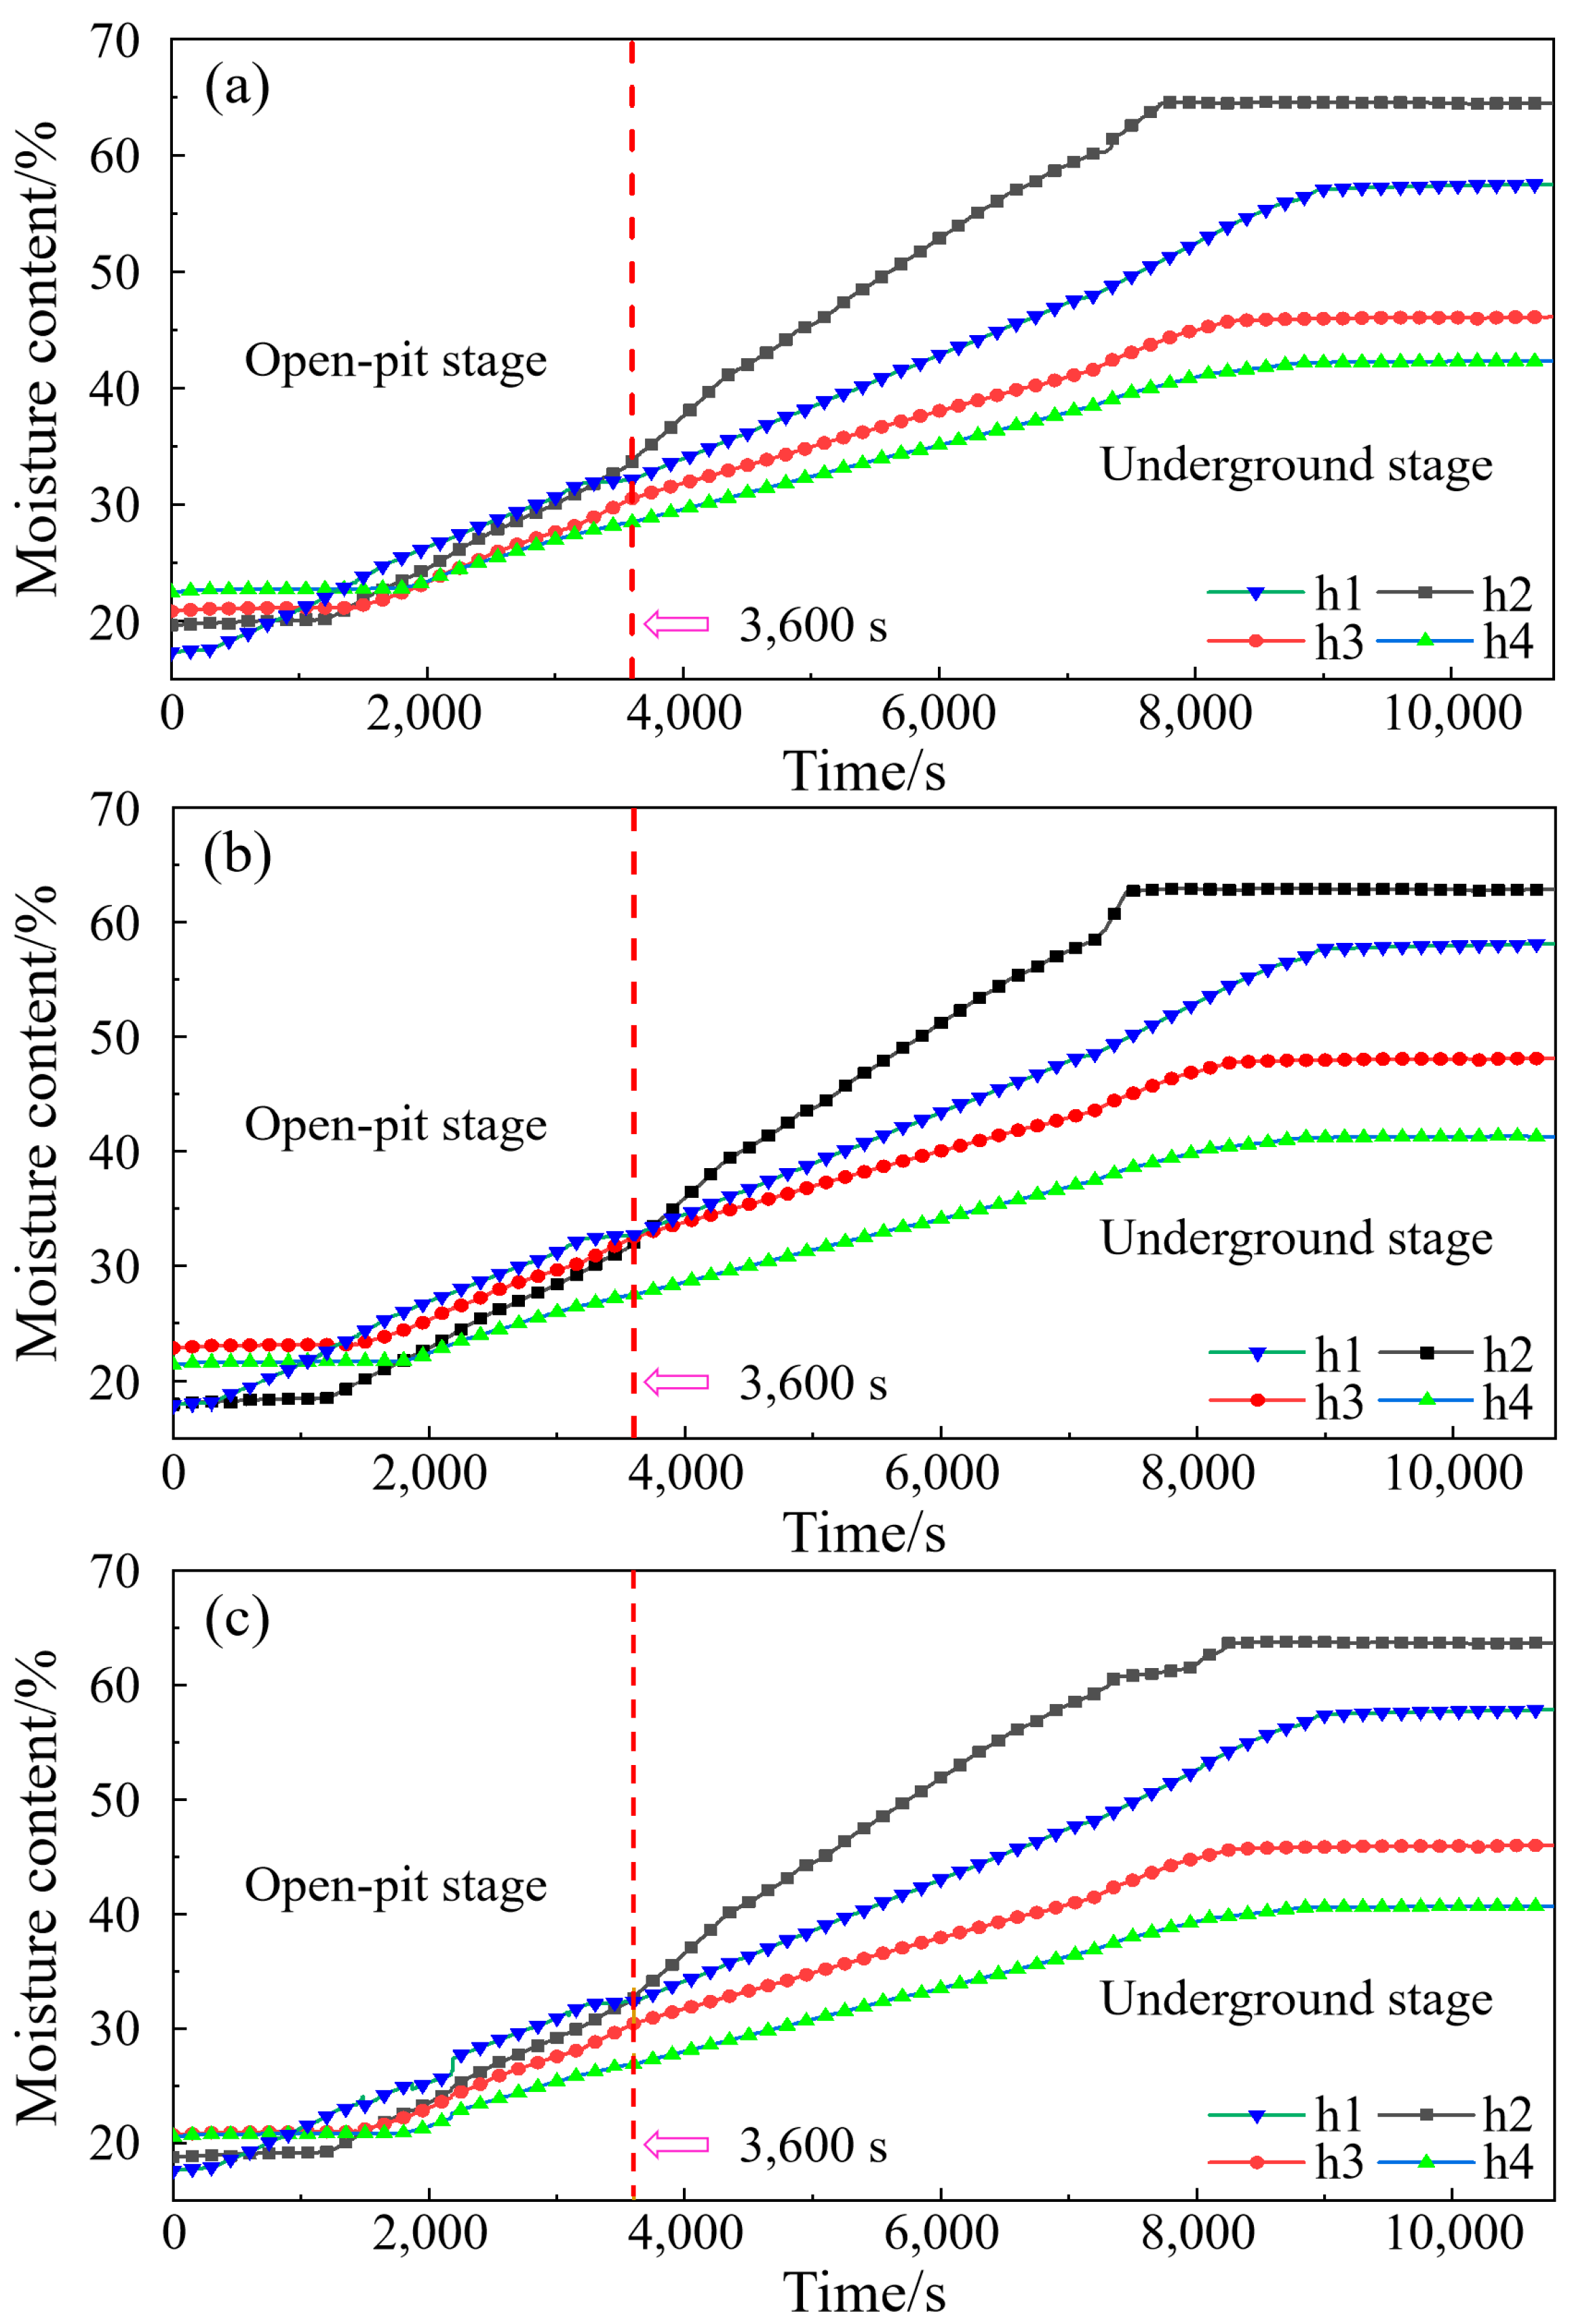
3.2. Variation Characteristics of Moisture Content

According to the experimental scheme, the variation in moisture content under different slope angles was observed, as shown in Figure 12. The basic law of moisture content data recorded at four locations under different slope angles is the same. h1 and h2 are located 10 cm below the upper surface and the open-pit platform surface, respectively, and are the first places affected by rainfall. The moisture content in these two places changes earlier than the sensors in the model interior, h3 and h4, and the measured values are larger. The initial values of the surface sensors are lower than those of the internal sensors, which is due to the fact that the materials need to be added with water to create the model during the model stacking process. Even after drying, the rock mass inside the model still stores water, while the exposed surface is drier.
The value of h2 on the open-pit platform is obviously higher than that of h1 after the open-pit mining stage, and the change rate of the value also increases significantly. This is because h2 is located below the open-pit mining slope, which is affected by both rainfall and the accumulated water flowing down from the upper surface. The change rate of h1 in the underground mining stage is 0.43% per minute on average, which is 0.2% higher than that in the open-pit mining stage. After the experiment, the moisture contents of h1 and h2 above were higher than those of h3 and h4 inside the model. The maximum moisture content was h2 on the open-pit platform, with an average of 63.67%, which was 22.37% higher than that of h4 inside. Compared with the values of each monitoring point under the slope angles, the difference in the moisture content between the platform and upper surface was in the range of 0.46~0.83%. The moisture content inside the 65° slope model was 0.42% lower than that of the 55° slope model and 0.68% lower than that of the 45° slope angle.

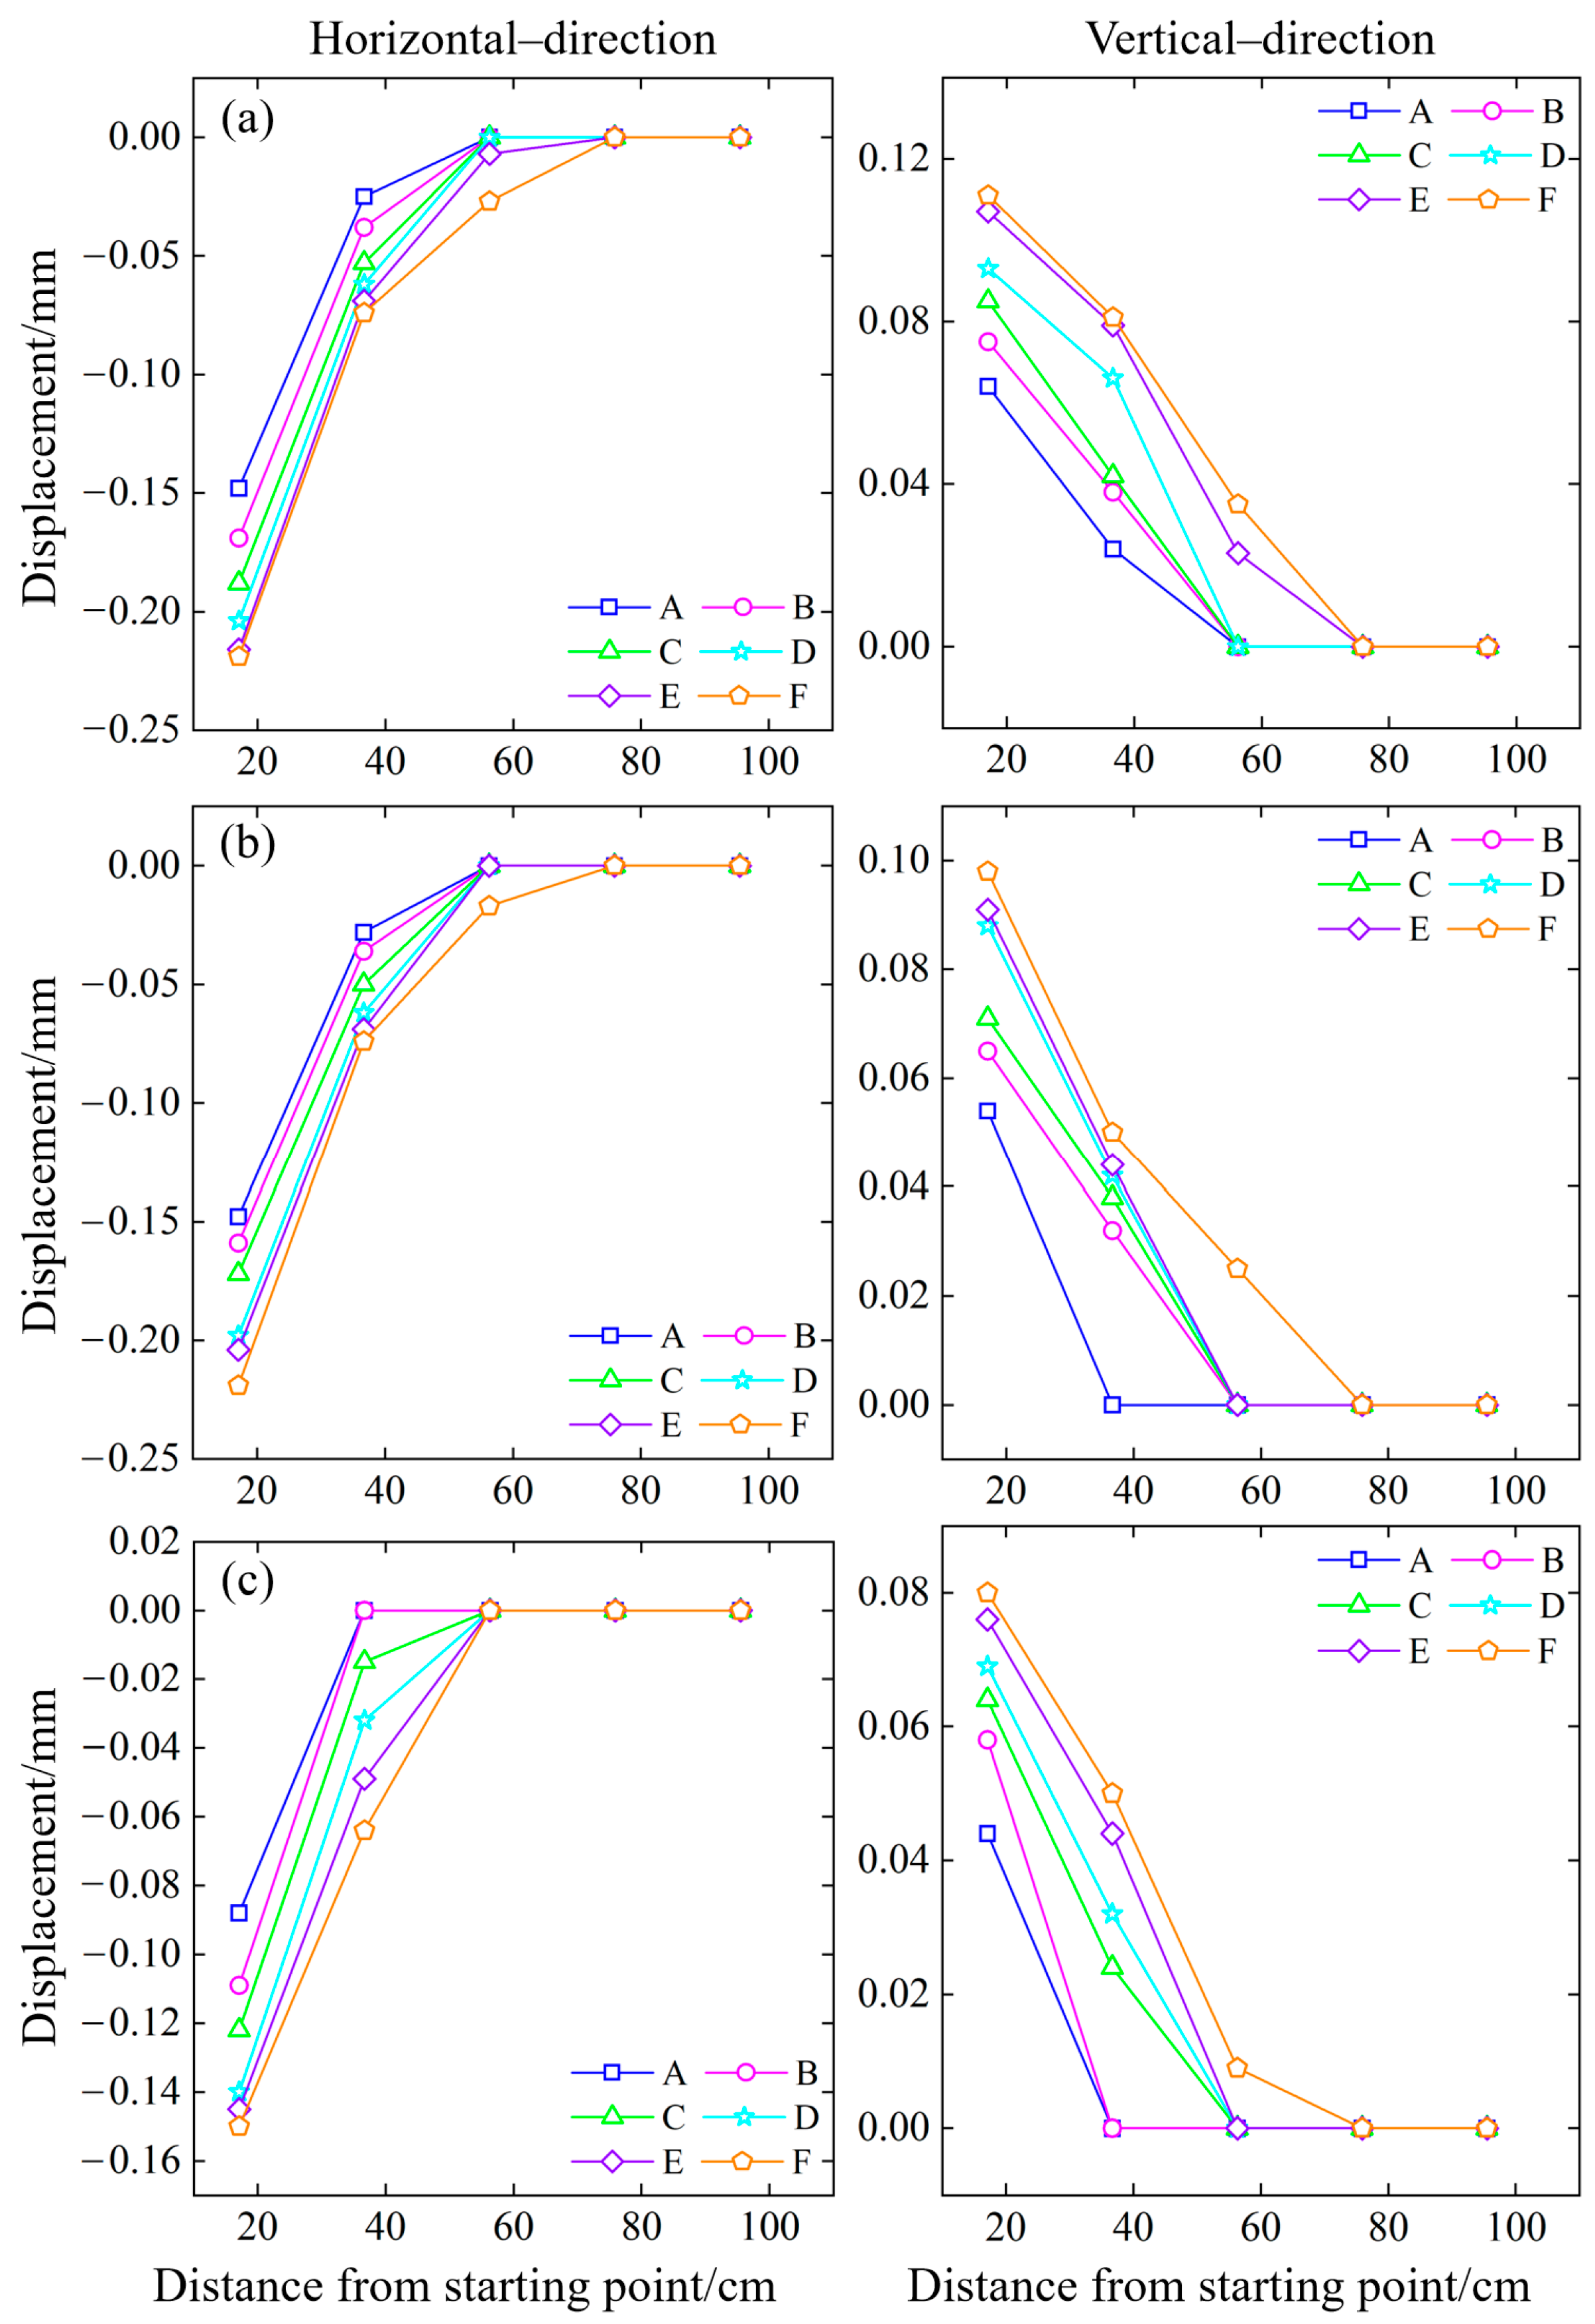
3.3. Variation Characteristics of Rock Mass Displacement

Before mining, the rock mass is affected by the geological activities and self-weight stress of the surrounding mining operations, as well as the external forces of the environment, rainfall infiltration, and other factors, which cause some deformation and damage inside the rock mass and accumulate some energy. As the mining operation changes from open pit to underground, the stress field of the underground ore body is inevitably damaged, and the most obvious manifestation of this change is the deformation and movement of the rock mass around the underground mining area. By recording the rock mass displacement under the combined action of heavy rainfall and mining unloading, analyzing its damage characteristics is helpful to summarize the influence of mining during rainfall on the underground mining area under different slope angles.
The measuring lines are divided according to the vertical distance from the mining area, and the measuring lines with vertical distances of 10.1 cm, 20.2 cm, 30.3 cm, 40.4 cm, 50.5 cm, and 60.6 cm are marked as A, B, C, D, E and F, respectively. The point at the slope angle is taken as the starting position in the horizontal direction, and the first measuring point is located above the first mine room, as shown in Figure 13. The values of the horizontal relative displacement of the measuring point are set as negative left and positive right, and the vertical displacement is positive up and negative down. The displacement of the models with different slope angles at different stages was analyzed.
The open-pit mining stage is also the slope-cutting stage. According to the effective monitoring of the rock mass by the three-view stereo camera, we obtained the displacement value changes in each measuring point in the slope-cutting process, as depicted in Figure 14. This calculation method is based on the conversion relationship between object distance and pixel focal length. By setting the relation between the object distance and pixel focal length, the three-view stereo camera can calculate the change in pixel point in the monitoring image, and then calculate the actual displacement change value of the monitoring point. It can be seen that the overall displacement in the open-pit mining stage is not large, and the measuring points near the slope cutting face make a slight movement towards the working face (upper left), while the measuring points far away from the working face are hardly affected. By comparing the horizontal and vertical displacement changes in each measuring point, it was found that the most affected measuring line in the open-pit mining stage was F, and the maximum horizontal and vertical displacement points were both near the working face of the F measuring line. They were 10.1 cm away from the starting point. Moreover, the average horizontal displacement was −0.184 cm and the vertical displacement was −0.096 cm. As the measuring line extends deeper into the rock, the displacement changes in each direction decrease in turn, and the measuring point closer to the interior has a reduced displacement, which can almost be ignored. The maximum horizontal and the maximum displacement points both appear in the 45° slope model, and the 65° slope model changes less. The change value of the 55° model is similar to that of the 45° model. The models with varying slope angles exhibit relative stability during the open-pit mining stage, and there is no significant overall displacement. Comparing the subtle changes, a larger slope angle has a smaller impact on the model.
After the open-pit mining stage, underground room mining was carried out. In this experiment, a total of six rooms were mined, and two rooms were grouped together, totaling three groups of mine rooms. Figure 15 shows the displacement changes in the first group of mine rooms in this stage. Because the goaf was inclined to the right, the monitoring points moved to the right, horizontally, after the first room was mined, and the monitoring points far away from the first group moved slightly to the left to balance the internal stress field. The maximum horizontal displacement point was on the A measuring line, which was 10.1 cm away from the starting point. The average horizontal displacement was −0.12 mm, which moved 0.064 mm to the right compared with the open-pit mining stage. After the first group of rooms was mined, the overlying rock above rooms F1 and F2 subsided, and the maximum vertical displacement point was 10.1 cm away from the starting point, with an average vertical displacement of 0.265 m. The measuring points far away from the mining area also presented a downward trend, and the vertical displacement of each measuring point on the measuring line was inversely proportional to the distance between the measuring line and the mining area. A farther distance indicated a reduced impact. Fine fractures extended from the corners above the room. During the mining of the first group of rooms, the horizontal displacement was not affected by the slope angle, and the maximum horizontal displacement under each slope angle differed by no more than 0.02 mm. The maximum vertical displacement occurred in the 65° slope model, which was −0.288 mm. The vertical displacement of the 55° slope angle was the smallest, which was −0.238 mm.
As the working face advanced, under the influences of mining and rainfall, the phenomena of overlying rock subsidence and rock–soil collapse occurred in the mining of the second group of mine rooms, and the fractures that were generated continued to grow, showing signs of penetration and connection. Figure 16 represents the displacement changes in the mine rooms during the underground mining stage (second group). As the second group of rooms were mined, the measuring points above them had a slight tendency to move to the left, and the maximum horizontal displacement point appeared 56.3 cm away from the starting point on the A measuring line, which was above pillar Z2, with an average maximum horizontal displacement of −0.26 mm. The 45° slope model showed the maximum horizontal displacement. The horizontal displacement of the previous measuring points increased and persistent fractures appeared at the corner of the mine room. The vertical displacement continued to increase and the maximum vertical displacement was 17.1 cm away from the starting point on the A measuring line, with an average value of −0.82 mm. The horizontal displacement of the measuring point, which was 36.7 cm away from the starting point, changed the most, increasing by 1.39 times compared to the mining of the first group of mine rooms. The measuring points that were 56.3 cm and 75.9 cm away from the starting point began to sink, and the fractures above the second group of mine rooms appeared and gradually combined with the cracks above the first group of mine rooms to form a semi-ellipse. The 65° slope model had the greatest vertical displacement and the 55° model had the smallest vertical displacement, with a difference of 0.22 mm.
The mining operation continued to advance, and the F5 and F6 mine rooms were mined. At this time, the expansion of fractures was more obvious. Since the mine rooms had been completely mined, the support force of the goaf was provided by the pillars and the boundary pillars. Figure 17 shows the displacement changes in the mine rooms during the mining stage (third group). Compared with the first and second mining groups, the horizontal displacement presents a greater change, which indicates that the mining of the third group forms a new stress balance inside the model. The maximum horizontal displacement is 17.1 cm away from the starting point on the A measuring line, with an average value of −0.47 mm, which increases by 1.04 times compared with the second group. The measuring points above mine rooms F5 and F6 moved to the left, and the measuring points farther away from the starting point moved significantly to the left compared with the second group, with an average displacement of −0.24 mm. It can be seen that the 65° slope model has the greatest horizontal displacement and the 55° model has the smallest one. Here, the vertical displacement of the model continued to increase and the displacement points above the mine rooms presented the greatest increase. The displacements of the 45°, 55°, and 65° models increased by an average of −0.41 mm, −0.34 mm, and −0.34 mm, respectively. The maximum displacement measuring points were the two points closest to the starting point, and the measuring lines further away from the vertical distance of the goaf also had large displacements.
After the room mining stage, the model produced more fractures, and the pillars and boundary pillars were in a critical state. In the pillar mining stage, a partial collapse and persistent interlayer fractures occurred in the overlying rock area. At this time, the calculation of the horizontal displacement was no longer possible. The vertical displacement of each model during the mining of the three groups of pillars is as depicted in Figure 18, Figure 19 and Figure 20.
Since Z1 is located between mine rooms F1 and F2, it plays a supporting role. After the mining operation, the area above pillar Z1 experienced significant subsidence due to gravitational forces, while the measuring points located further away from the goaf exhibited comparatively smaller displacements, leading to interlayer fractures. The maximum displacement point was on the A measuring line and was 17.1 cm away from the starting point, with an average vertical displacement of −1.772 cm. When the Z2 pillar was mined, only continuous pillar L1 remained in the area to provide support. It can be seen that the measuring points above L1 sank slightly, by about −0.11 cm, and that the measuring points above Z2 sank significantly. However, the displacement is lower than that above Z1, with an average value of −1.643 cm. At the same time, persistent fractures and a partial collapse occurred in the overlying rock area. After the Z3 pillar was mined, the measuring points that were 95.5 cm away from the starting point presented large displacements, with an average value of -1.36 cm. After the continuous pillar, L2, was loaded, the measuring points above it sank slightly, by about −0.09 cm. Compared with the mining of the Z1 and Z2 pillars, its descent was less, reducing by about 0.13 cm. In the pillar mining stage, it can be seen that the 55° model has fewer affected measuring lines, and only the A measuring line has large vertical displacements. The 45° model has large displacement measuring lines, A and B, and the 65° model has the large displacement measuring lines of A, B, and C.
After the continuous pillars, L1 and L2, were mined, the overlying rock area lost its support completely. Thus, the overlying rock collapsed and fractures developed rapidly, forming a semi-elliptical damage area. Here, the vertical displacements of each model during the mining of the continuous pillars L1 and L2 are depicted in Figure 21 and Figure 22. After the continuous pillar, L1, was mined, the A and B measuring line areas above L1 of the three slope models all collapsed completely, but the 55° model presented a smaller change than the 45° and 65° models on the C measuring line. This indicates that the area affected by the 65° model is larger and that the collapse area of the 55° model is smaller. Therefore, it can be seen that, after a complete excavation, all models have large vertical displacements and the overlying rock collapses. Compared with the 45° and 55° models, there are large displacement values on the C measuring line of the 65° model. The values of displacement points at distances of 56.3 cm and 75.9 cm from the starting point are lower in the 55° model, indicating that, in the middle regions, its downward-sinking activity is reduced. The values of displacement points at distances far from the goaf are low for all models, indicating that fractures only develop here without large-scale detachment phenomena.

3.4. Analysis of Evolution Characteristics of Rock Mass Instability

In the physical model experiment conducted at angles of 45°, 55°, and 65°, the evolution characteristics of various rock instability fractures were observed. The types of fractures varied across different stages of the experiment, with some cracks even forming collapse regions post-development and penetration. The calibration of these fracture networks, as depicted in Figure 23, demonstrates that open-pit slope mining has a minimal impact on underground space with virtually no evidence of cracks. However, the stress arch mechanism can induce vertical cracks at the periphery of the under- ground mine room (Figure 23a,g). Due to the small vertical displacement of overlying rock (Figure 15, Figure 16 and Figure 17), the degree of damage is small; thus, fewer separation cracks are generated. Here, the 55° slope model exhibits no separation cracks; however, the vertical cracks at the periphery of the mine room evolve into arc cracks (Figure 23d). When entering the pillar mining stage, the vertical displacement of overlying rock intensifies (Figure 18, Figure 19 and Figure 20). This stage is characterized by a high occurrence of separation cracks, with branching cracks extending around them (Figure 23b,h). The branching cracks generated by the separation cracks at different positions are interconnected (Figure 23h), resulting in the partial shedding of the rock epidermis. During the continuous pillar mining stage, these interconnected separation cracks persist in developing and collapsing (Figure 23c,f), resulting in the generation of new separation fractures in distant, overlying rocks. Moreover, after the completion of the experiment, the separation cracks reached a state of equilibrium and did not undergo further collapse. However, some microbranching cracks emerge in their vicinity (Figure 23i).

4. Conclusions

This research conducted an indoor slope failure test based on the similarity theory. The selection area of slope rock samples depended on a UAV. The mechanical properties of the rock were measured, such as elastic modulus, Poisson’s ratio, tensile strength, cohesion, and internal friction angle, and we used these data to perform a strength reduction calculation and obtain the relevant parameters of the similarity simulation experiment. Rainfall, model, data acquisition, and monitoring systems were designed. The rock mass movement in the transition from open-pit mining to underground mining with different slope angles under the rainfall–mining coupling effect was determined. The pore water pressure, moisture content, and displacement of each stage were analyzed, and the internal activity law of the rock mass was explored. The following conclusions were obtained:
(1)
The experiment shows how rainfall–mining coupling affects the pore water pressure during the transition from open-pit to underground mining. The pore water pressure is higher in the deep rock mass than on the upper surface and the open-pit platform. Rainfall and slope water increase the pore water pressure on the open-pit platform. In the underground mining stage, the pore water pressure rate rises by 0.48%. The pore water pressure is negative before the open-pit mining stage, indicating unsaturated soil. As the experiment continues, the pore water pressure becomes positive, and the internal particles shift from inward penetration to free seepage. The pore water pressure changes from negative to positive in the late growth stage and stabilizes at about 30 min. The growth stage lasts about 100 min or 60% of the experiment time. The pore water pressure at the top increases more quickly than the internal pressure.
(2)
The moisture content of the upper surface and the open-pit platform changes first and has a higher final value. The surface moisture content value is lower than the internal moisture content of the model. Rainfall and water accumulation from the upper surface cause the moisture content of the open-pit platform to change significantly after the open-pit mining stage. After the experiment, the moisture content on the upper surface and the platform is higher than that inside the model. The open-pit platform has the maximum moisture content, and the moisture content decreases with the depth.
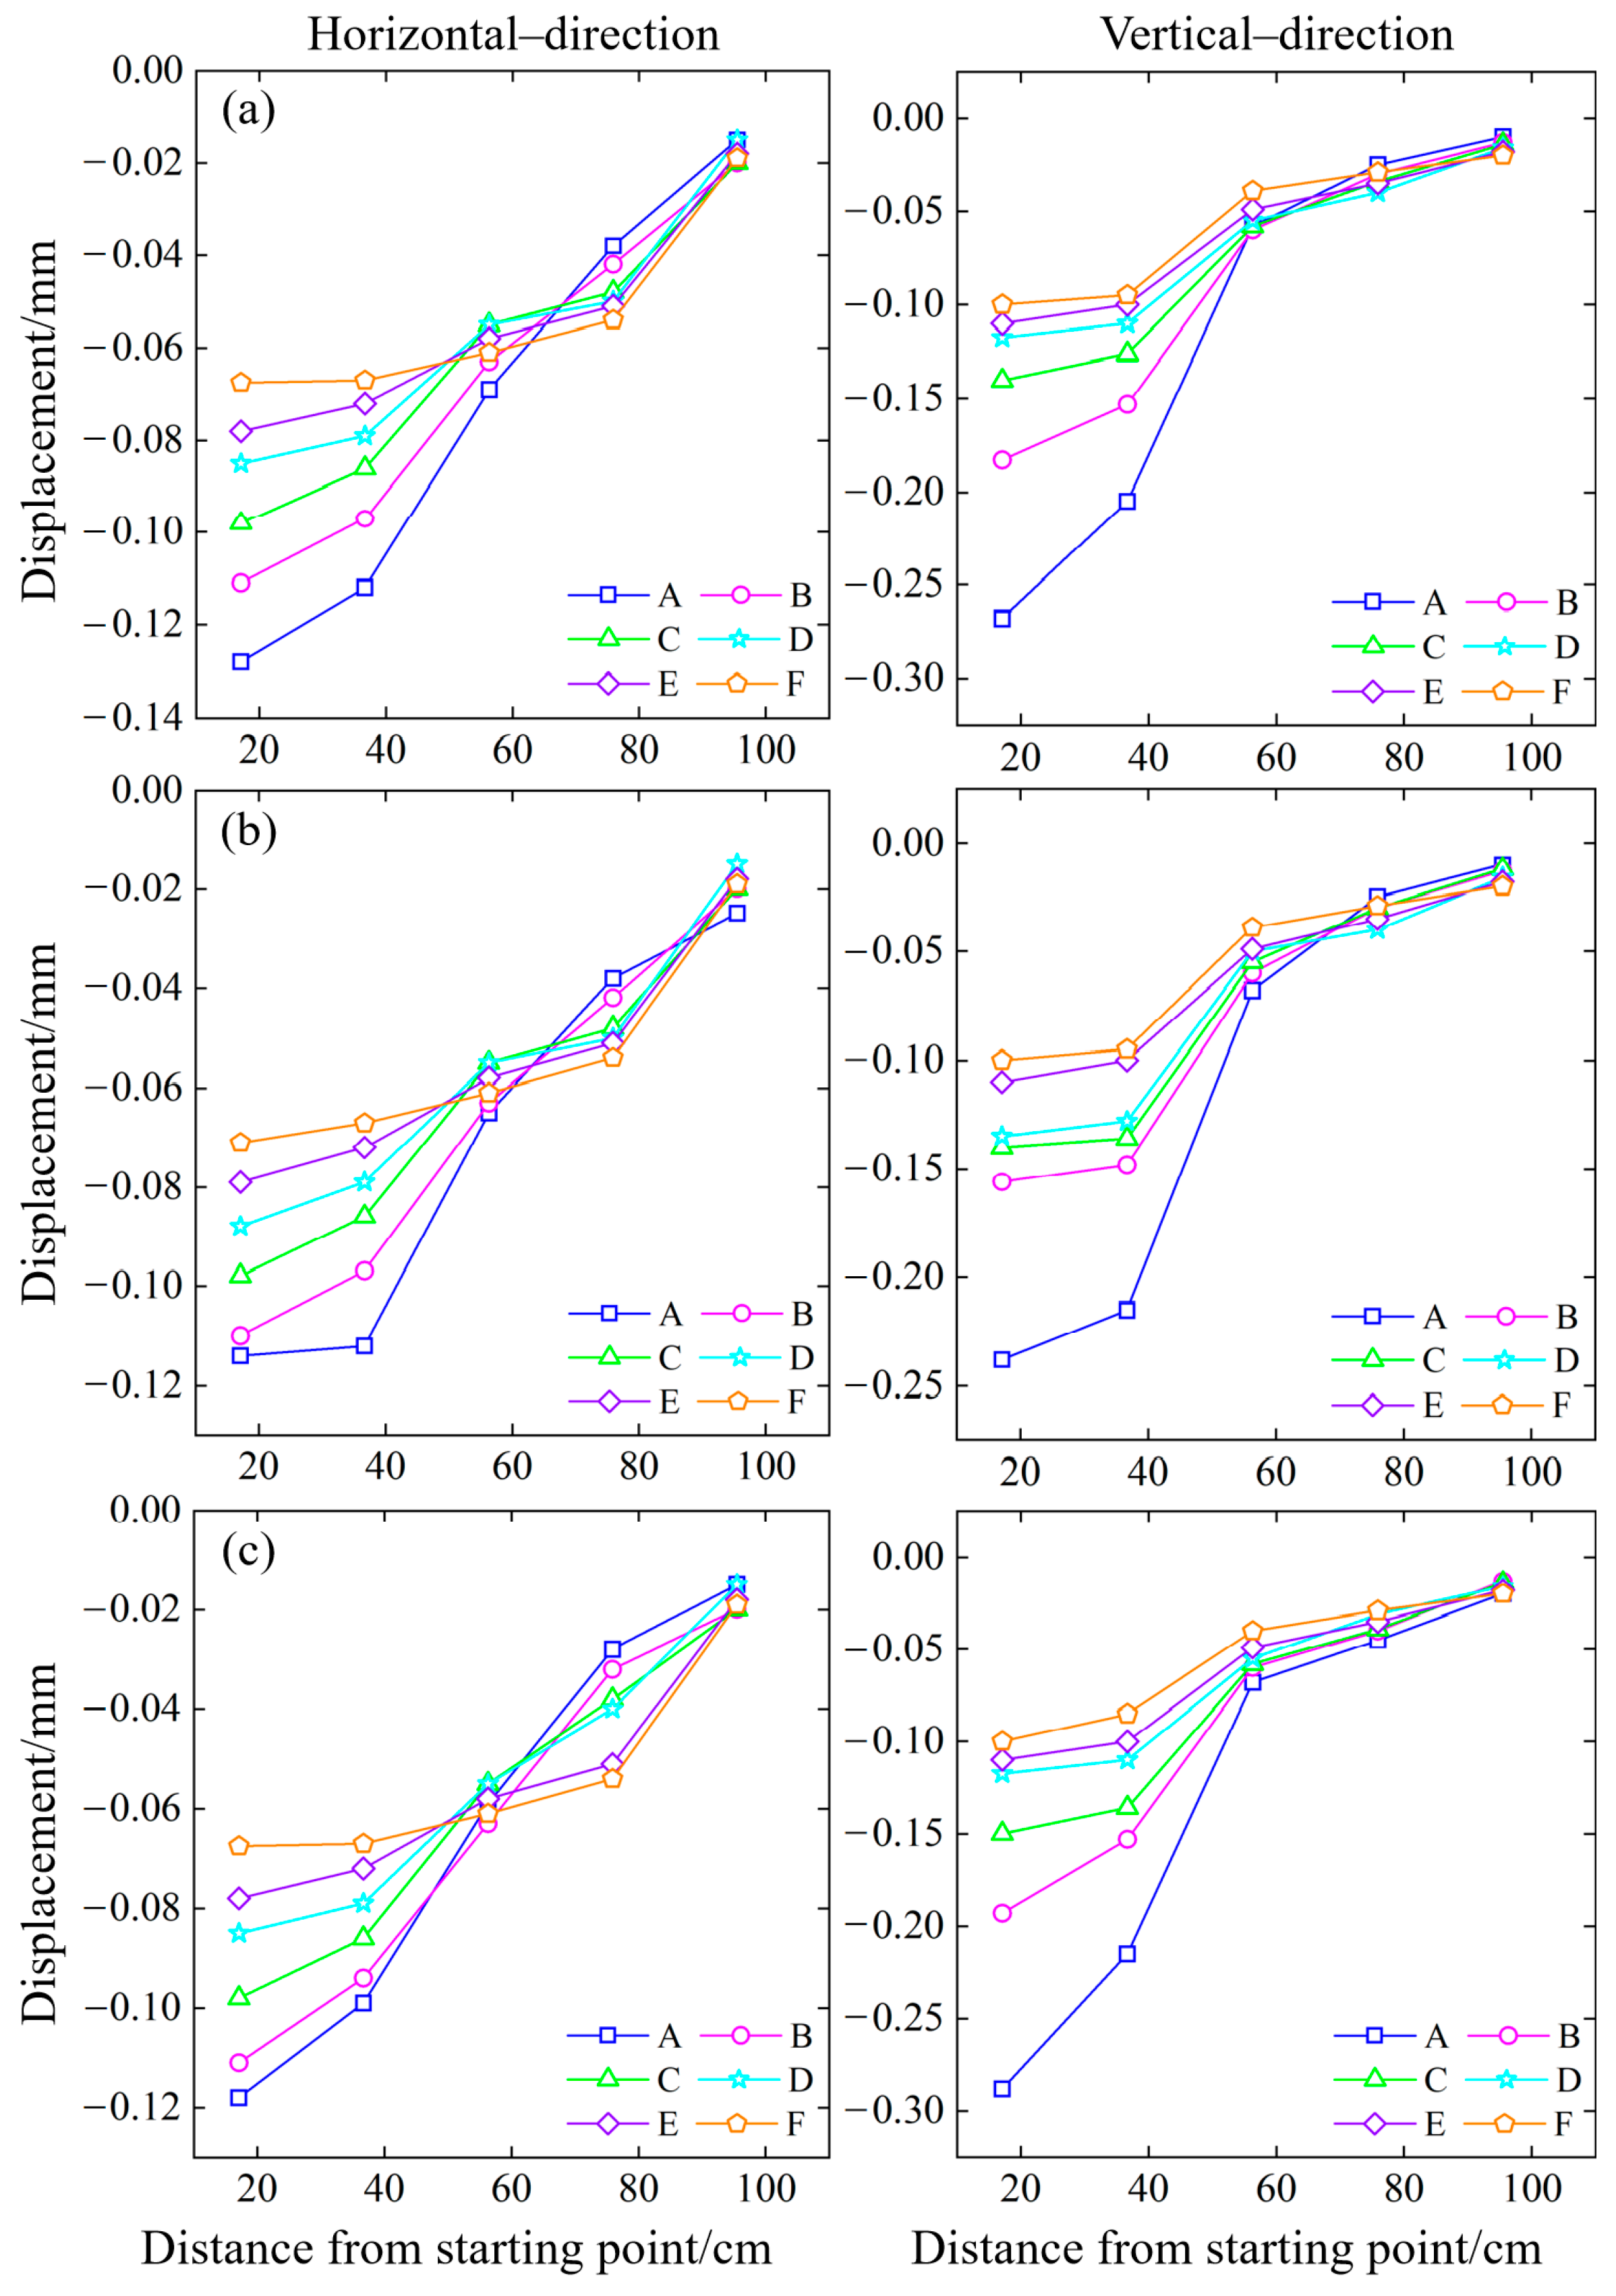
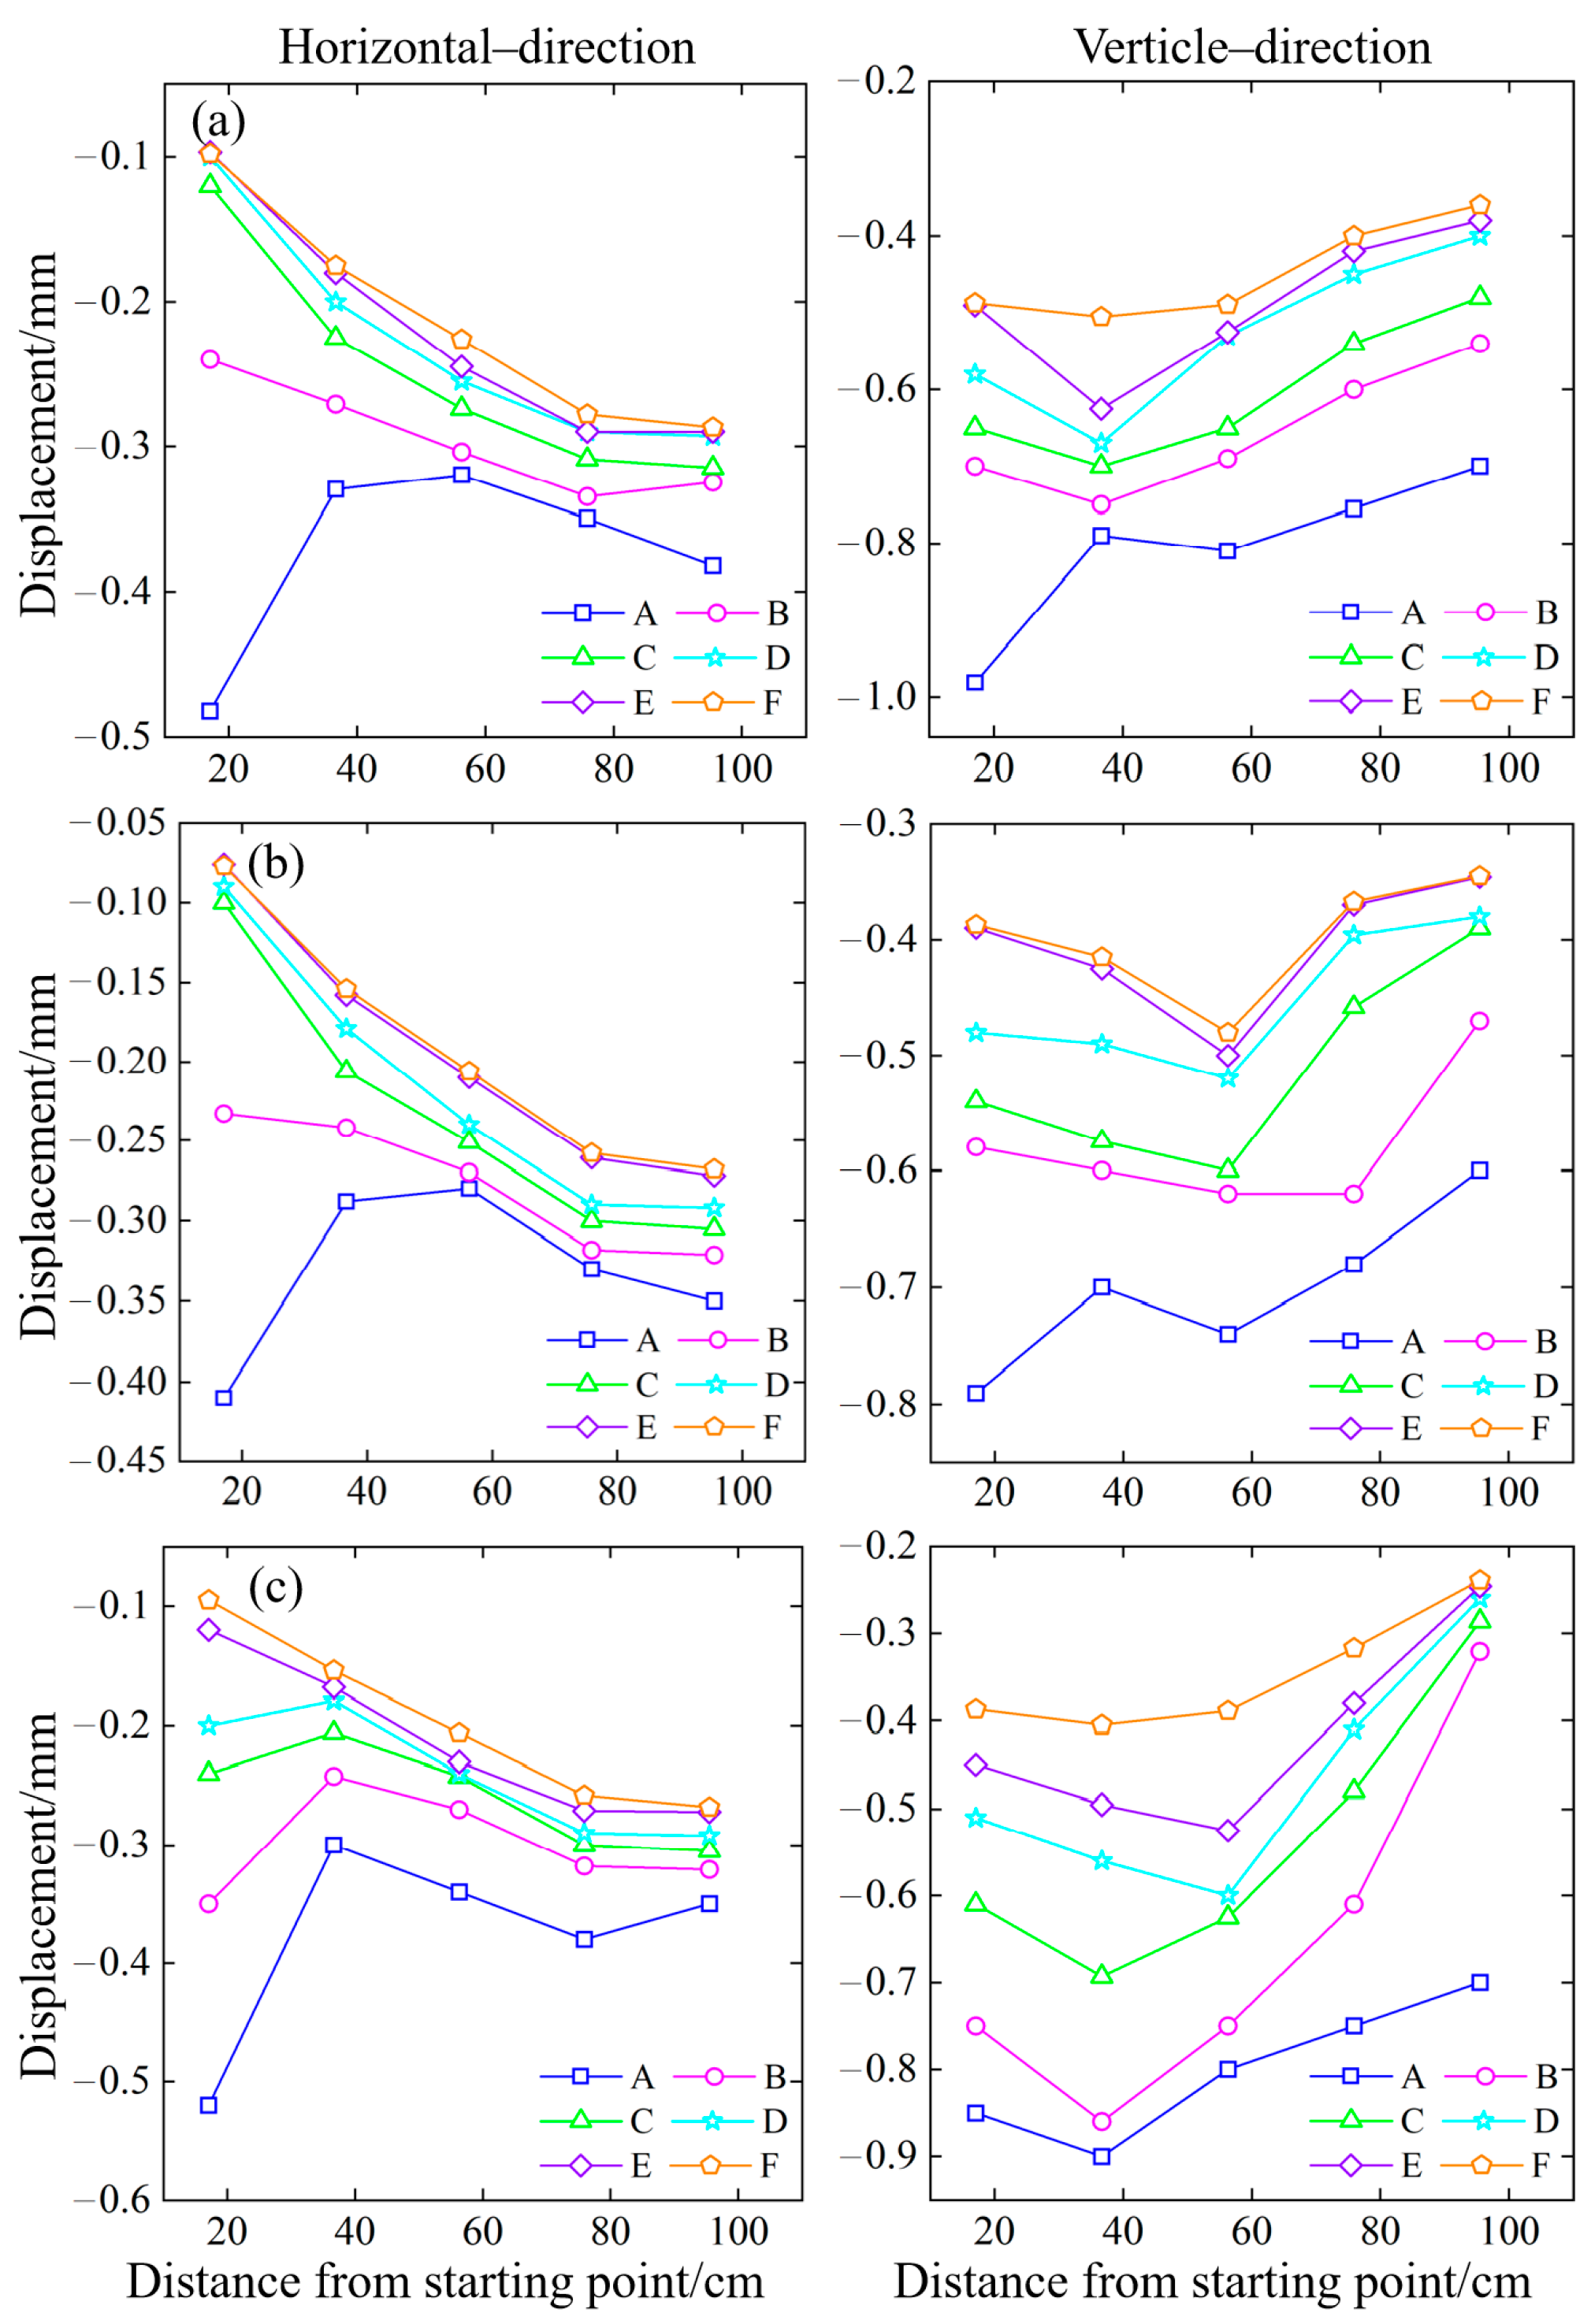
(3)
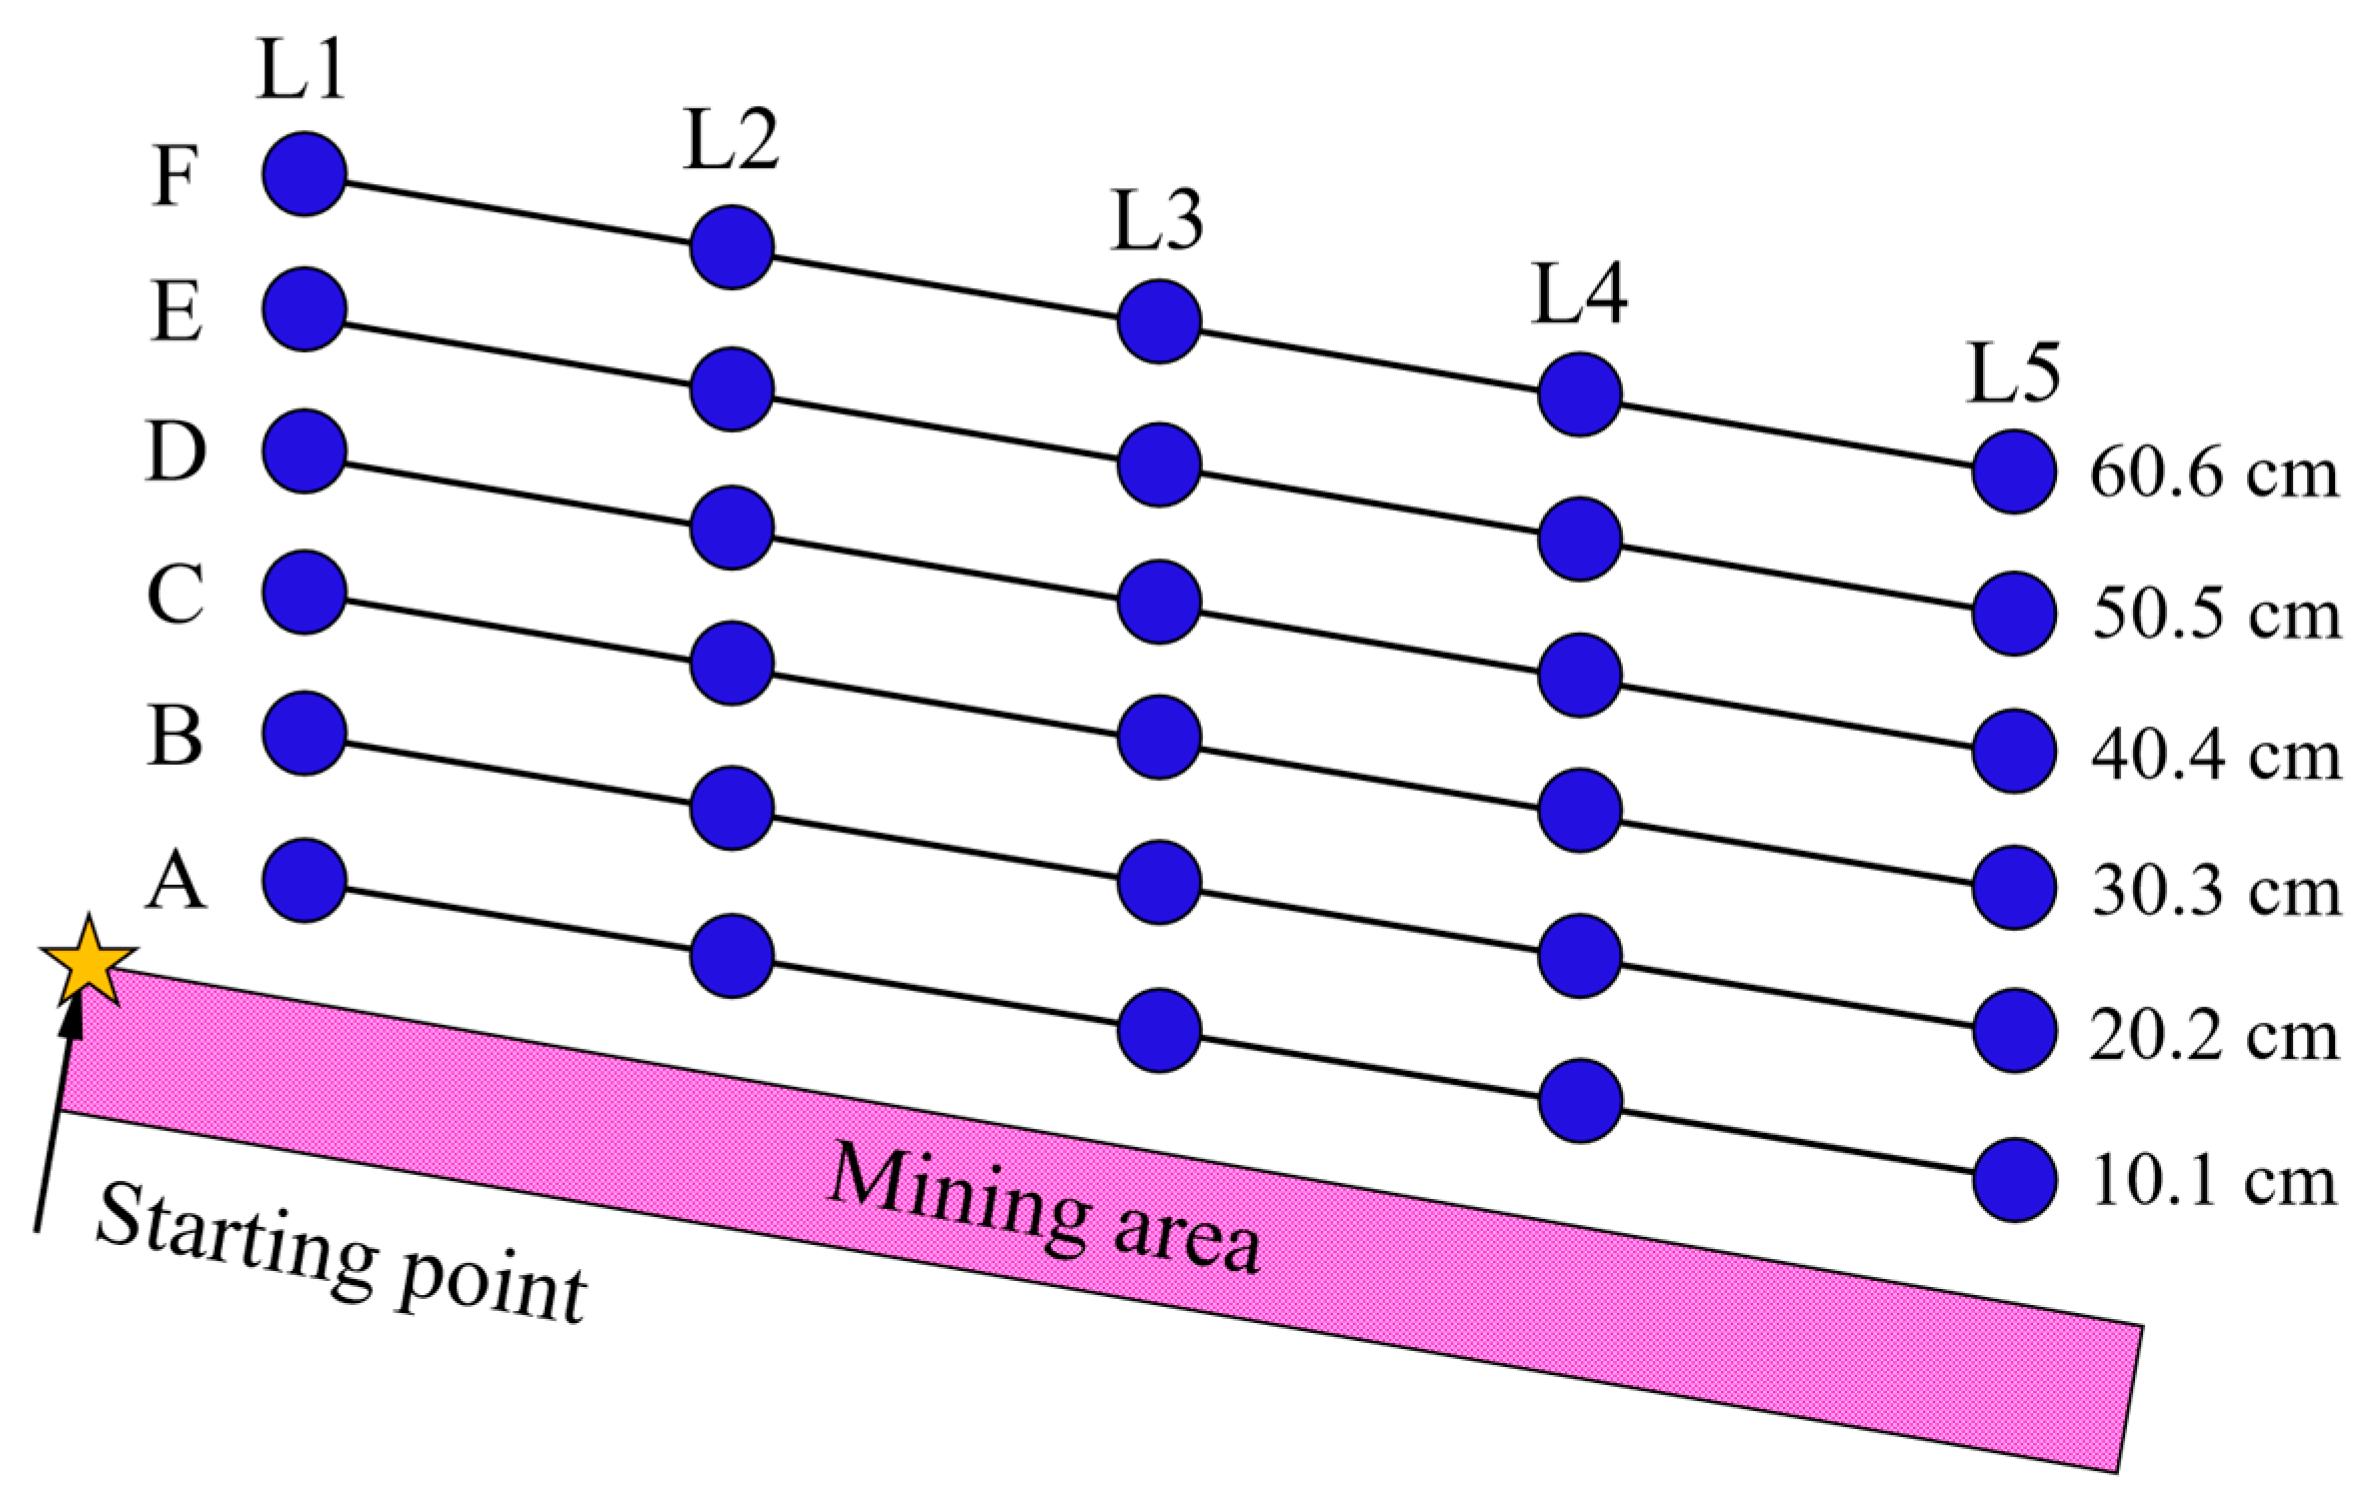
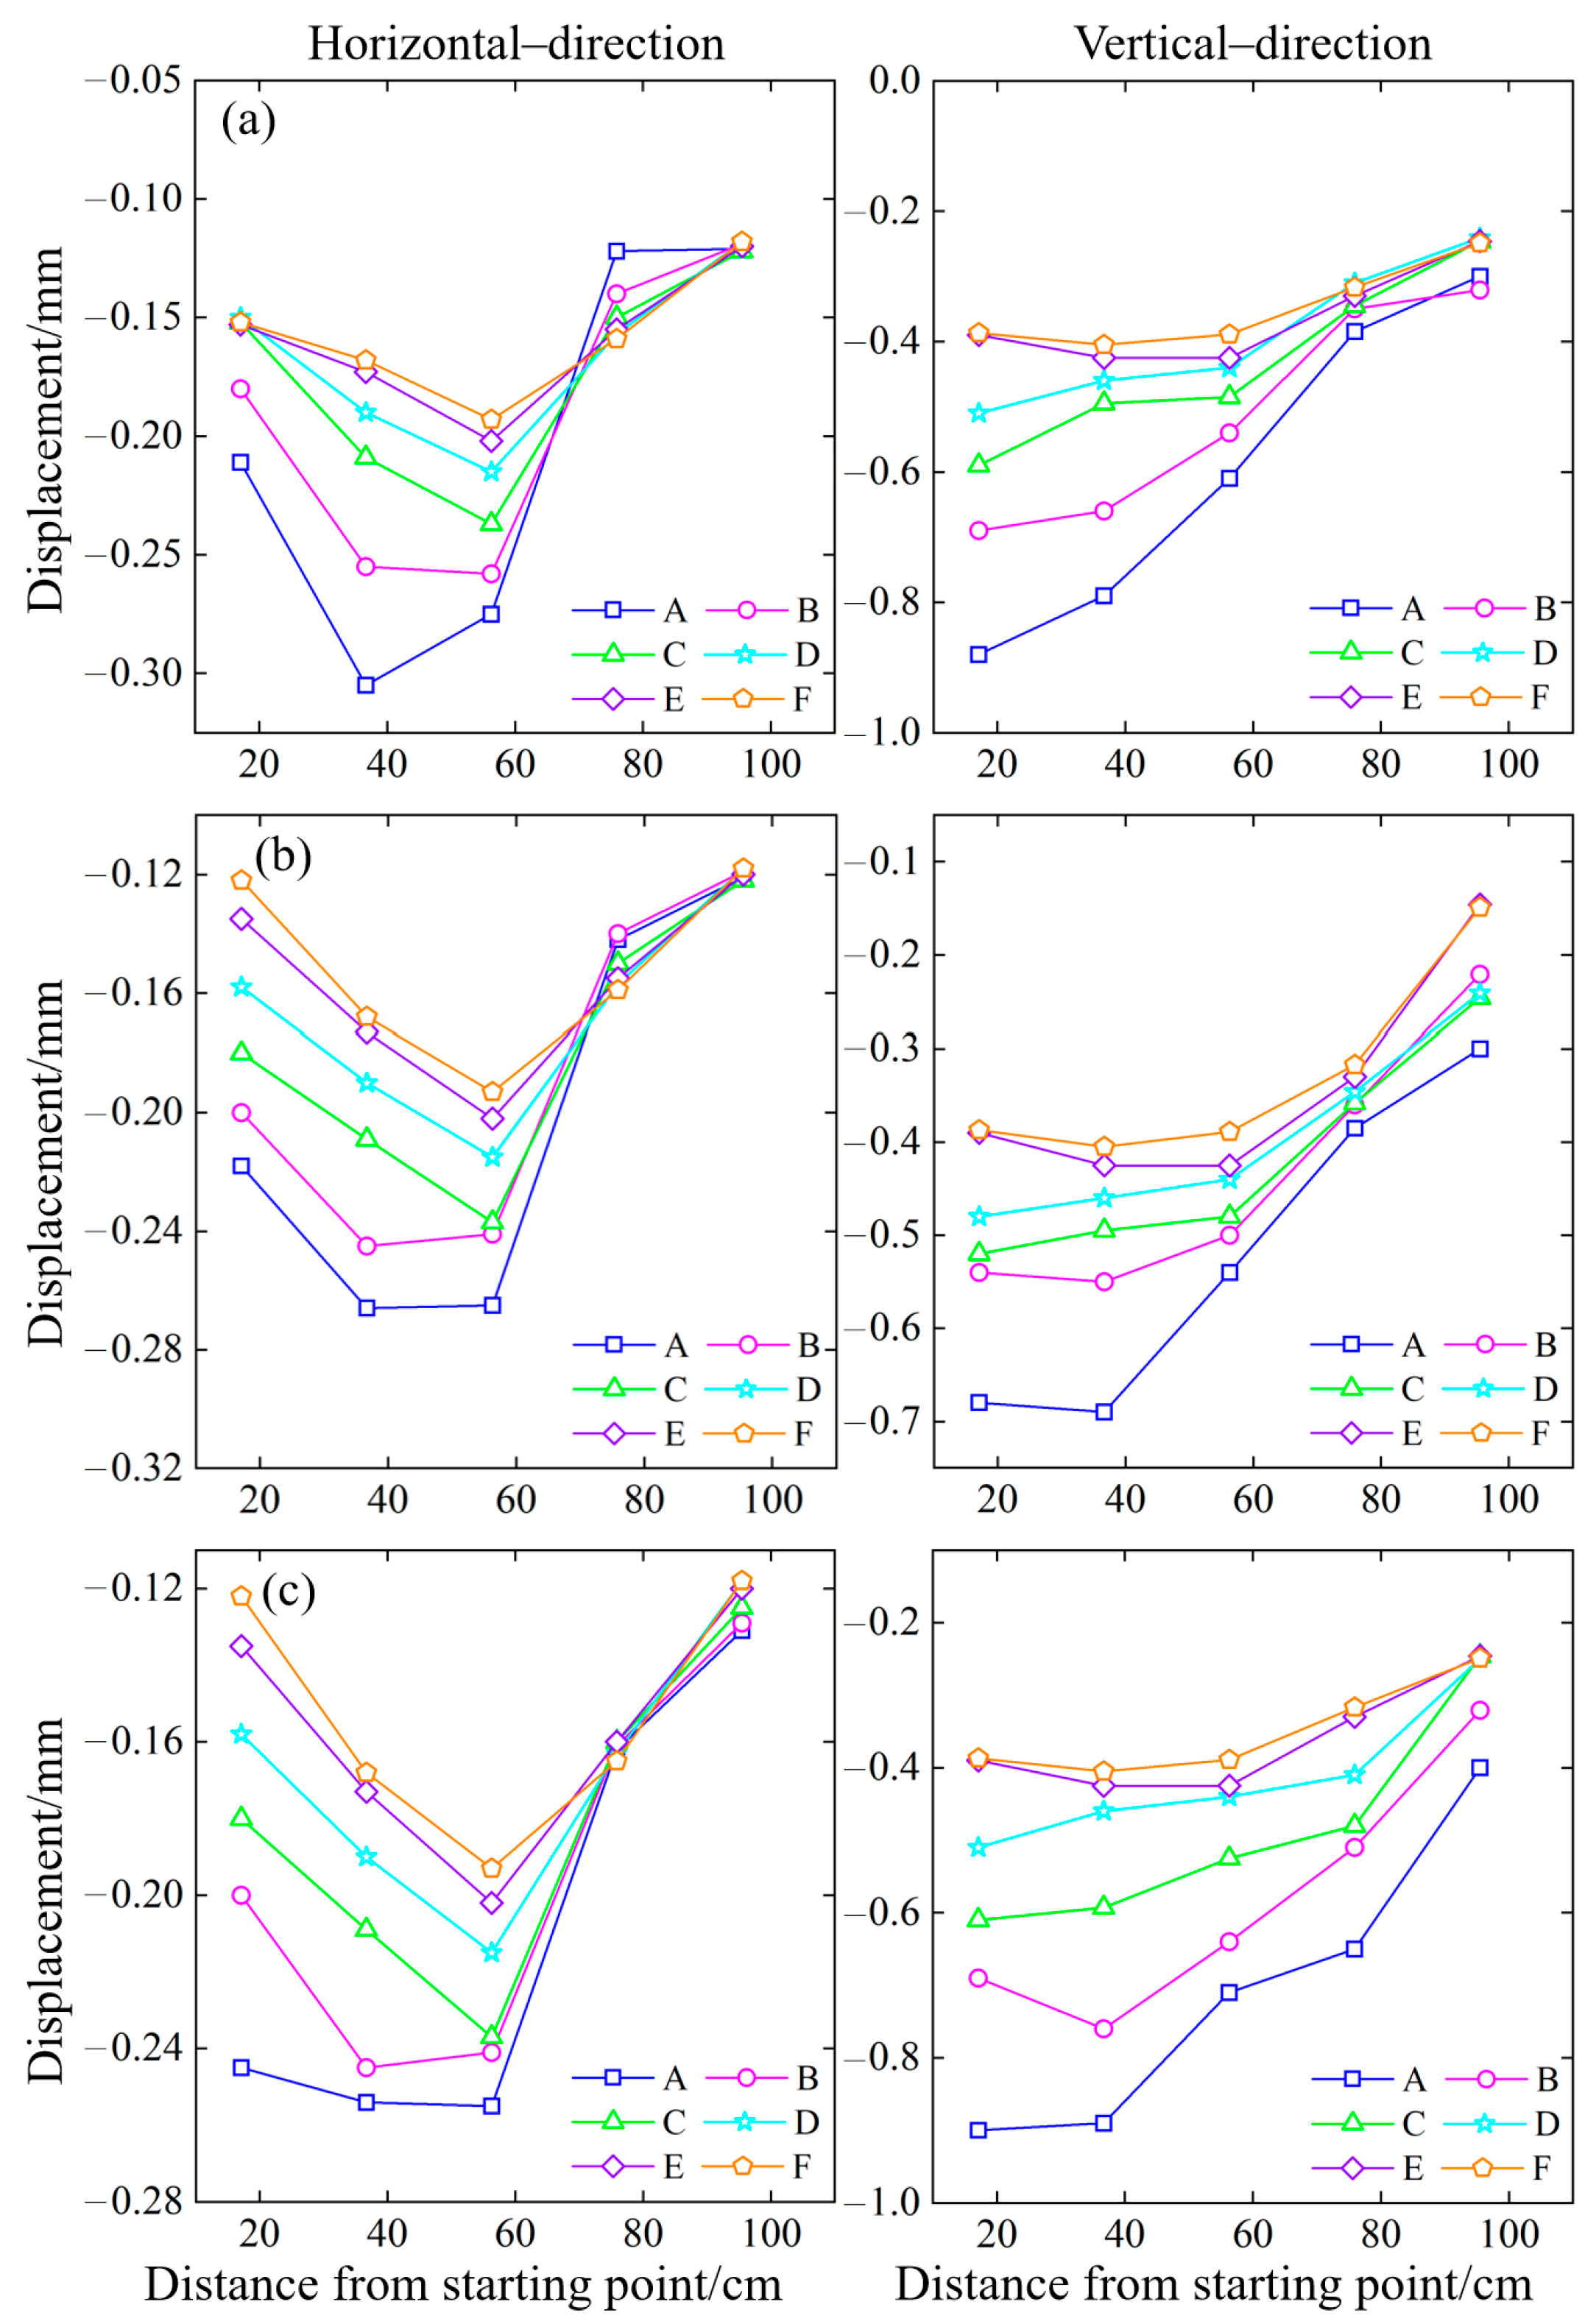
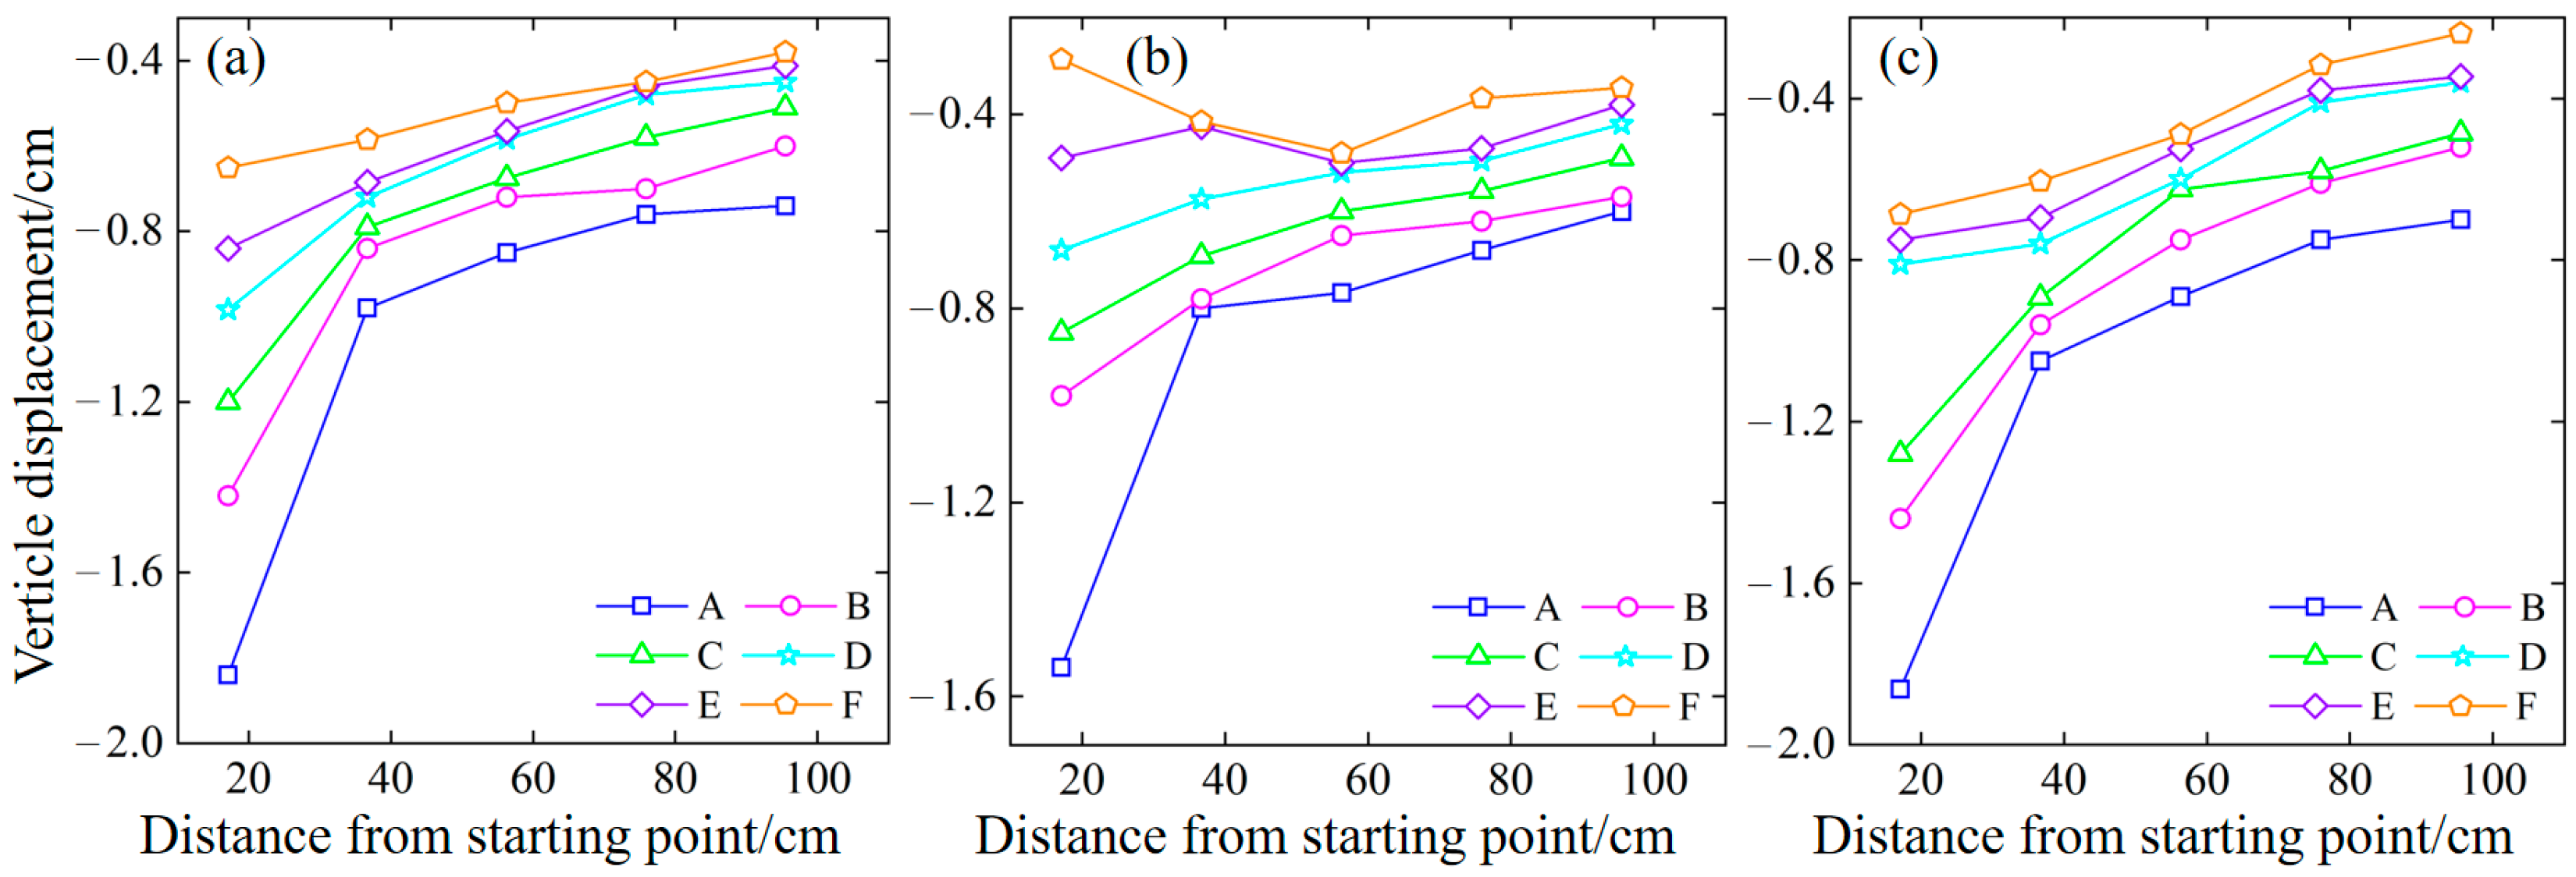
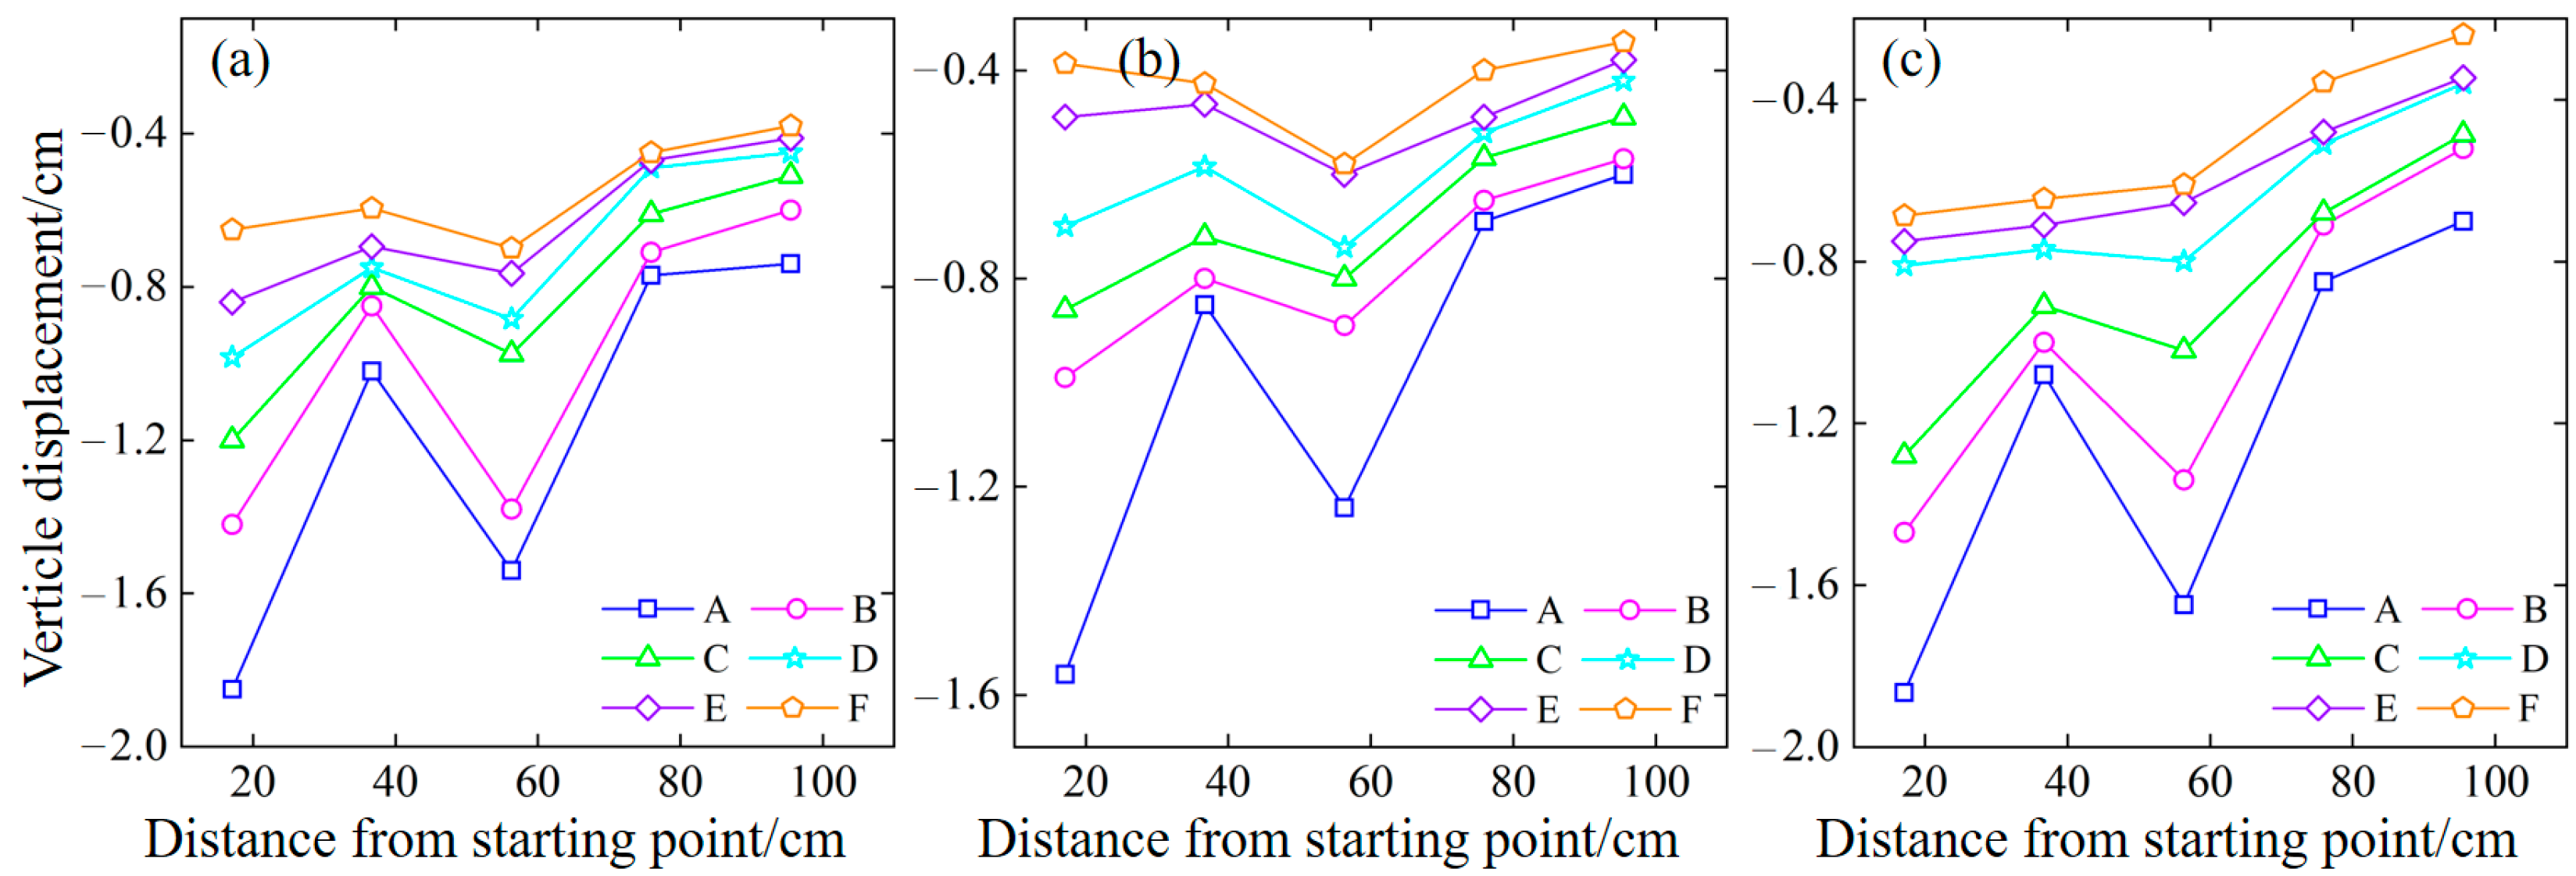
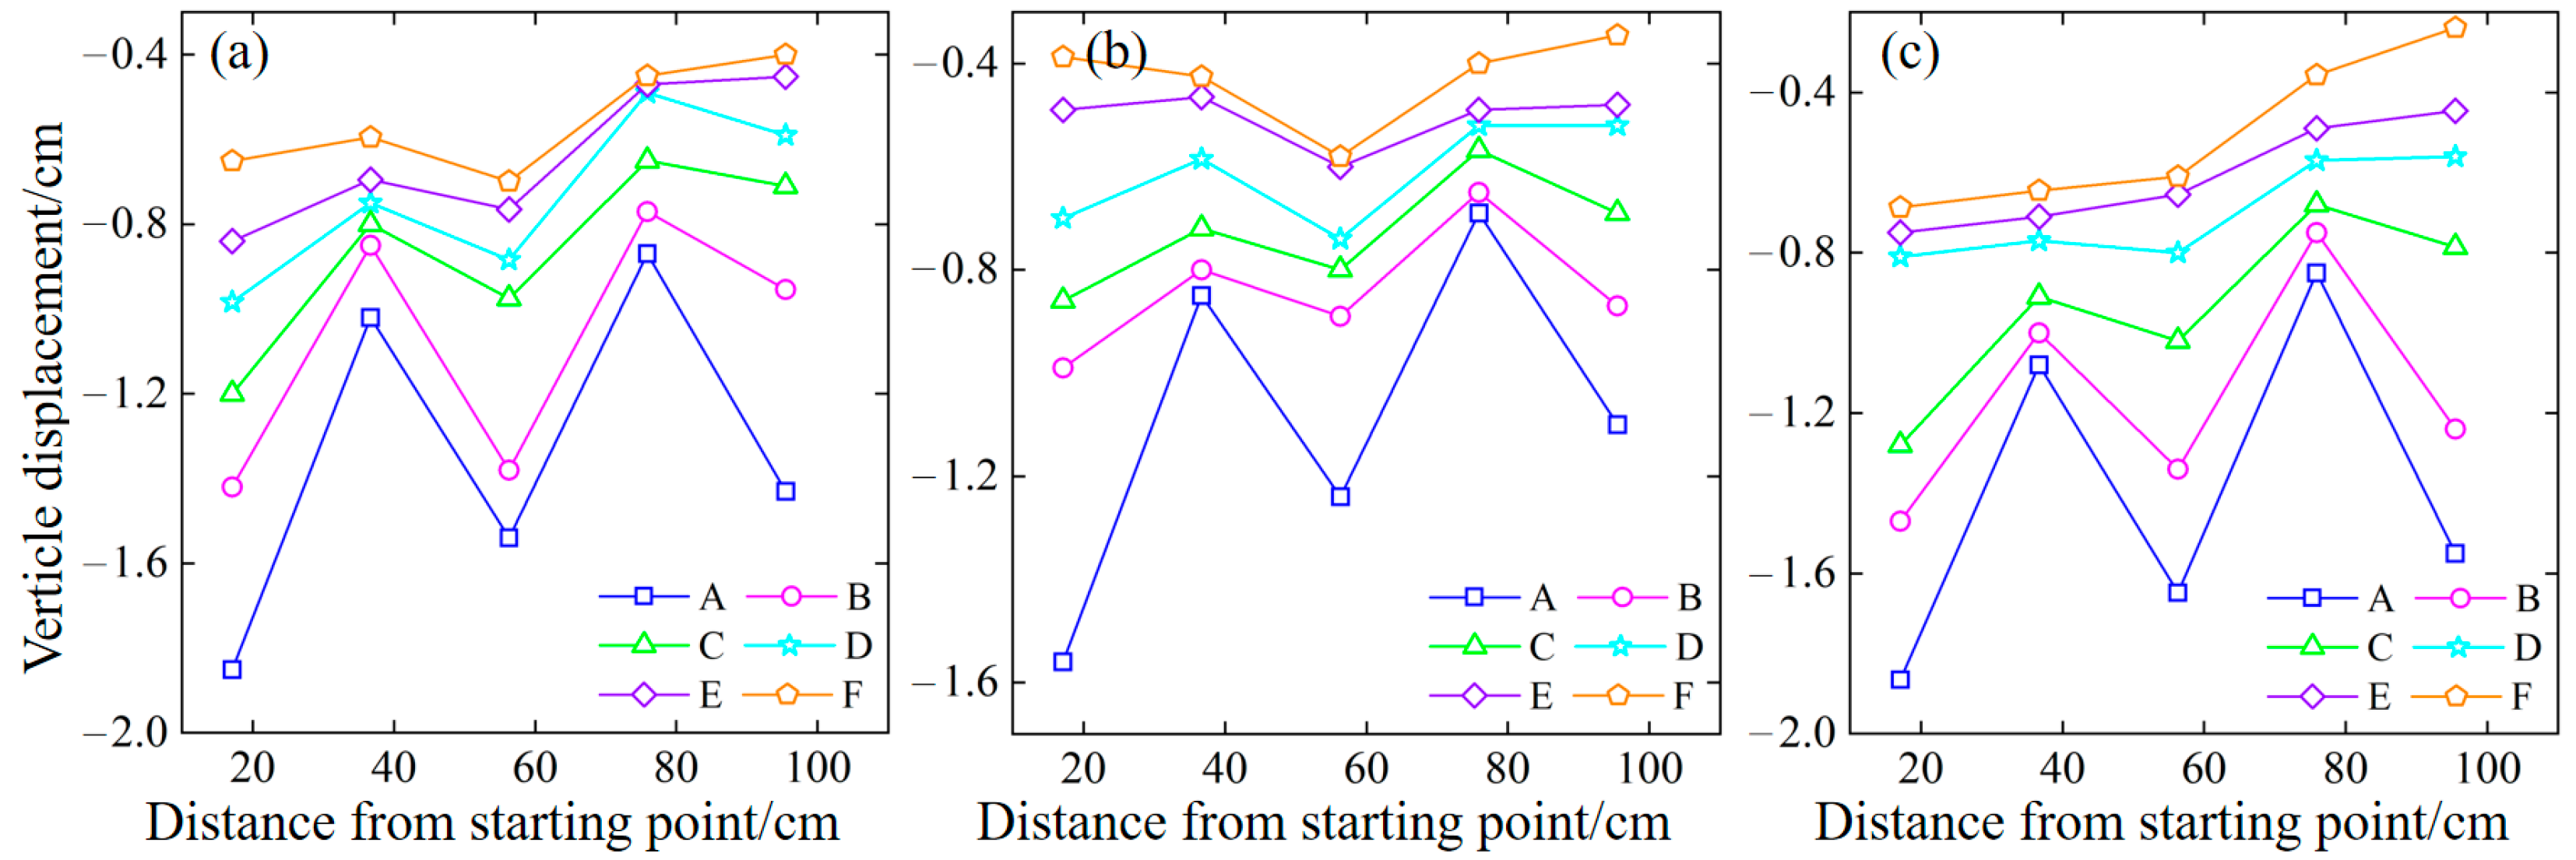
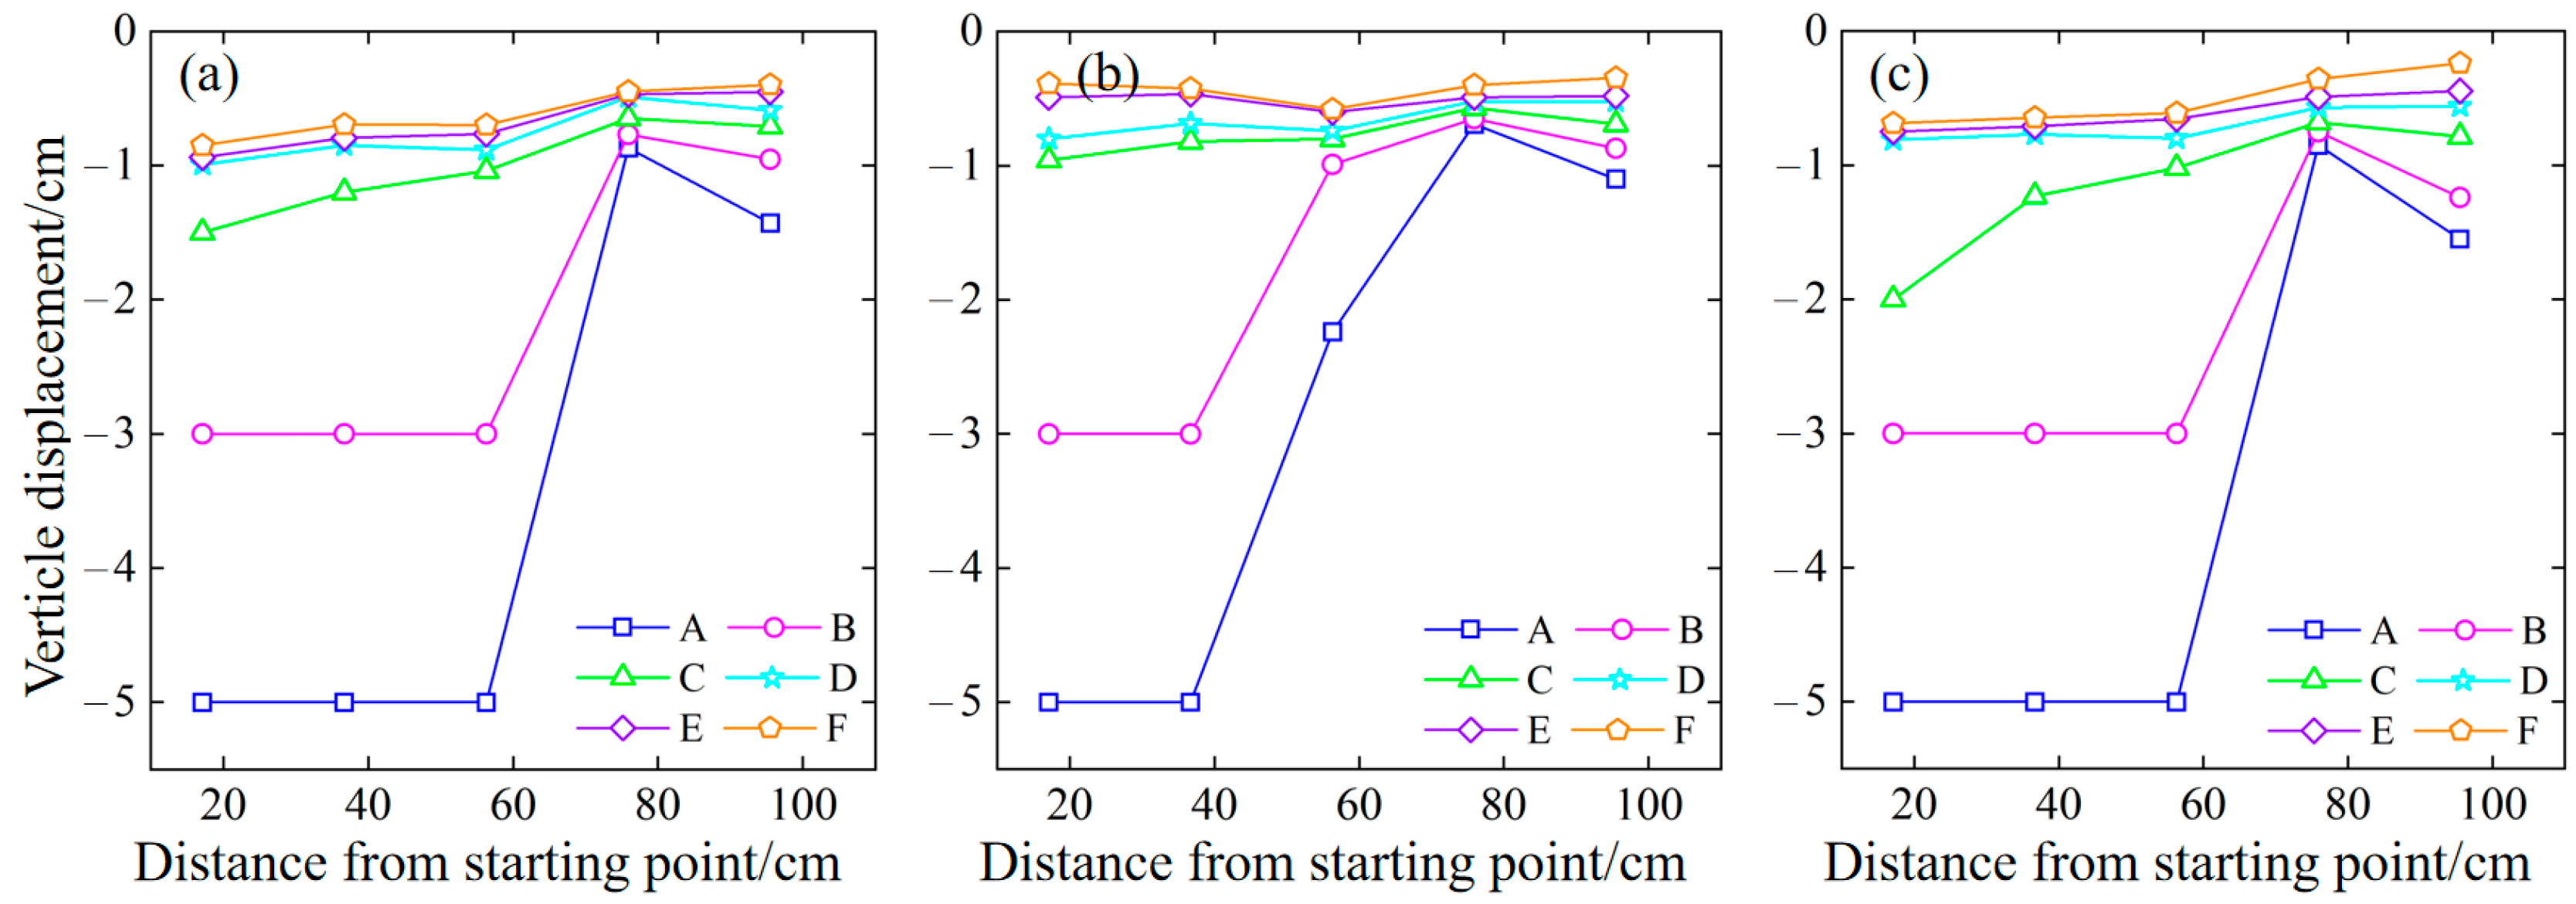
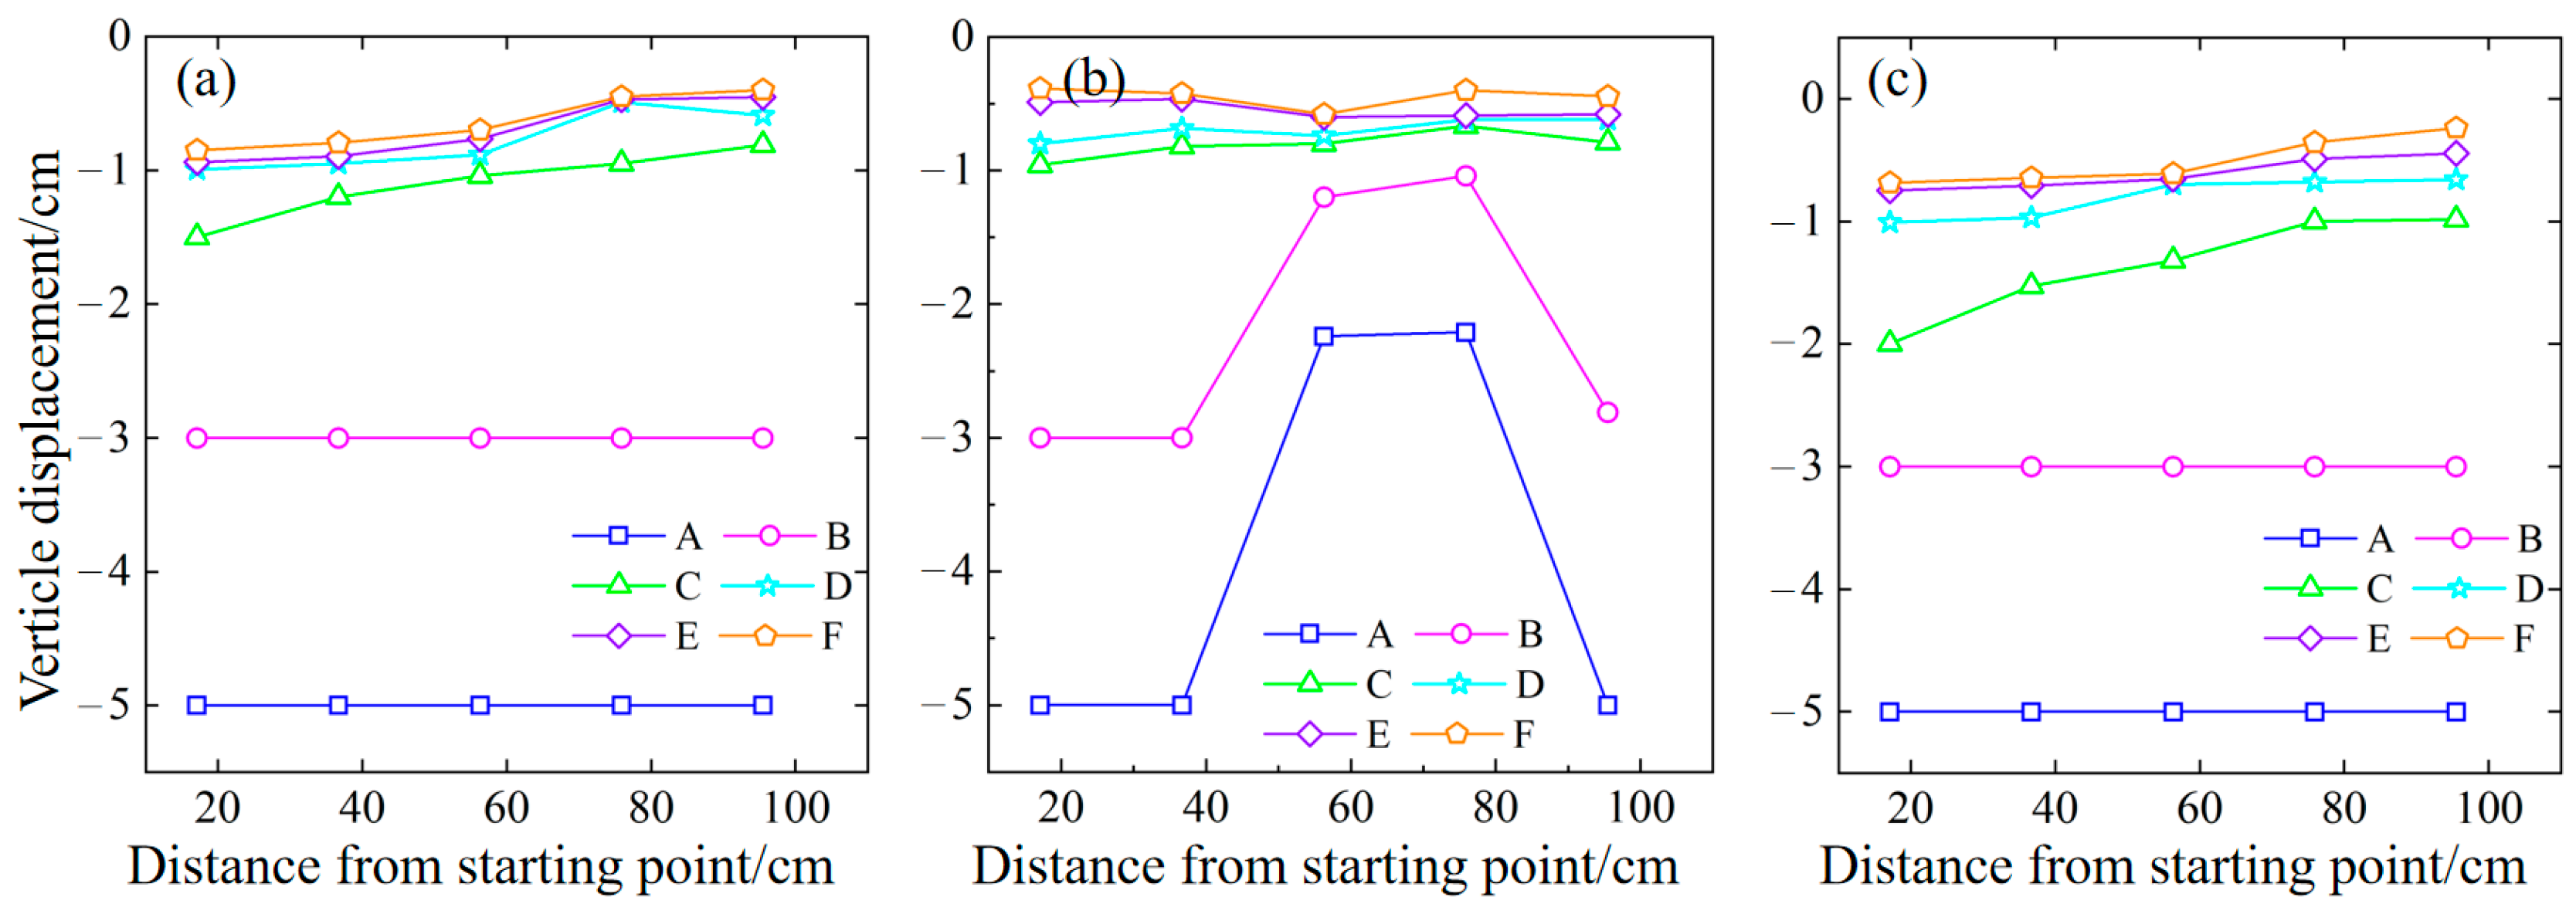
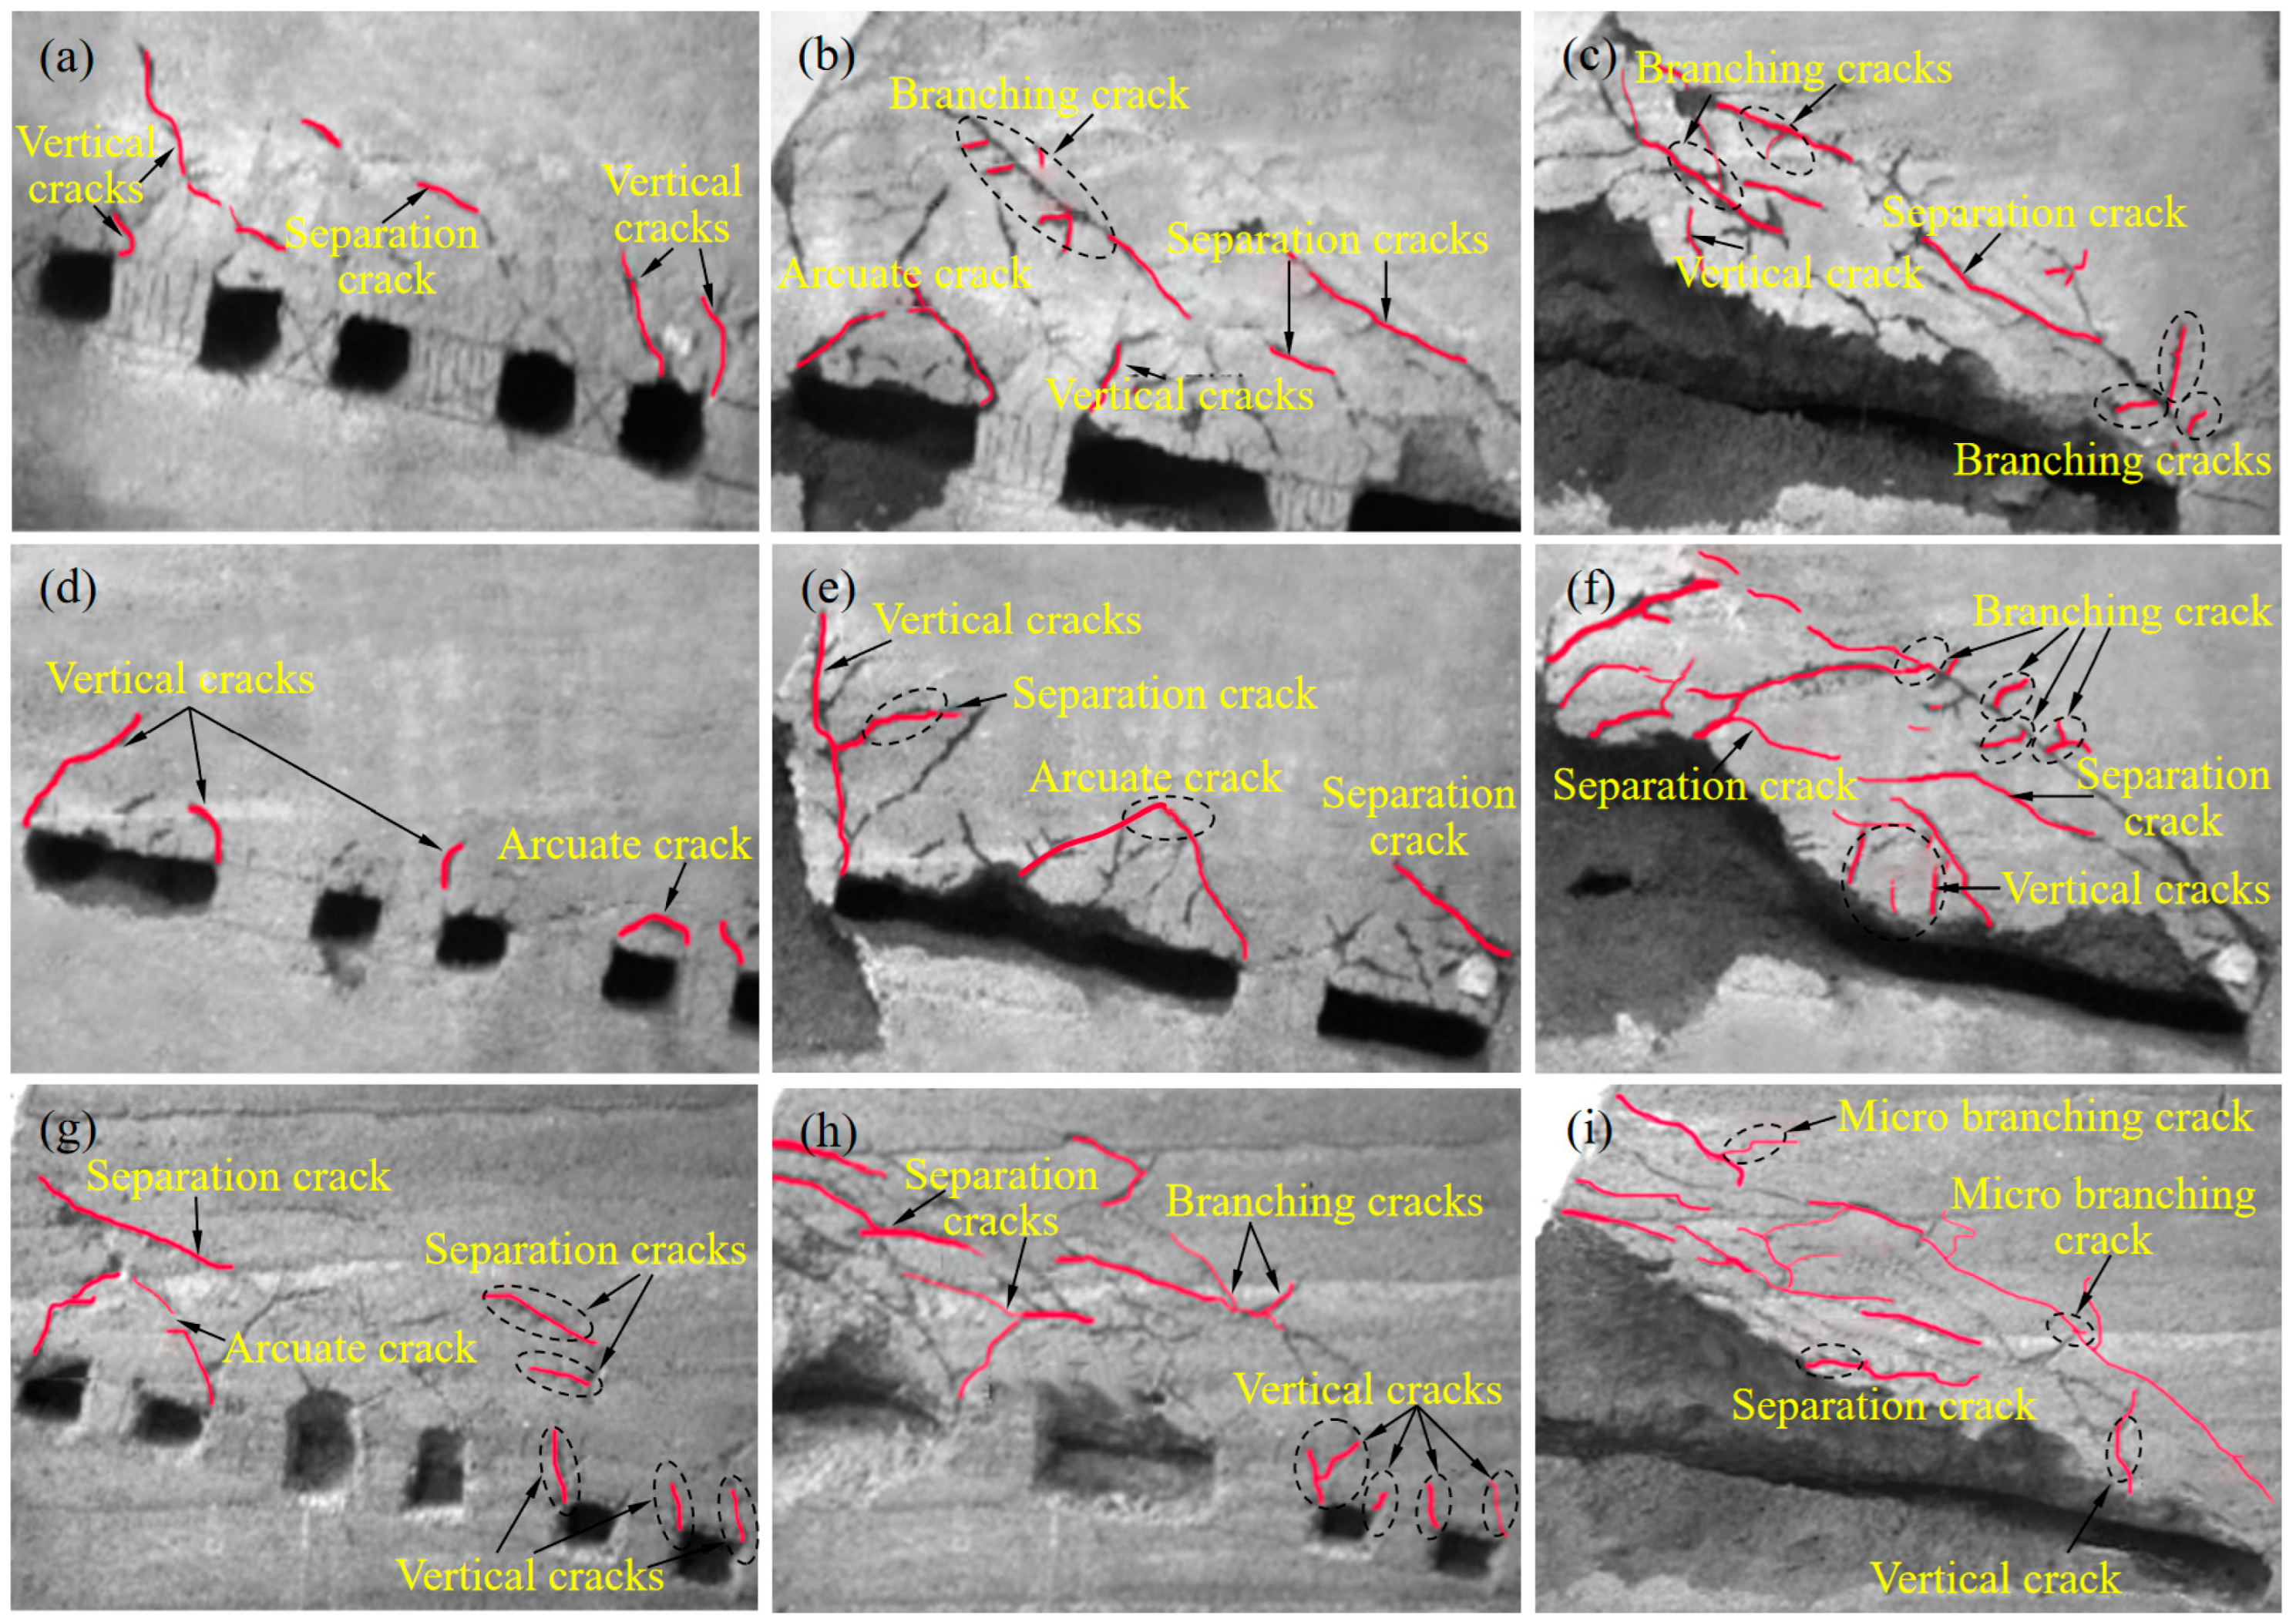
During the open-pit mining stage, the rock mass displaces to the upper left and the top area suffers the most damage. Here, the maximum horizontal and vertical displacement points are both near the upper working face. During the underground mining stage, the model exhibits vertical fractures and the overall displacement moves slightly to the left. Microfractures propagate in the corner, above the mine. The mine room fractures grow and intersect, forming a semi-ellipse. During the pillar mining stage, the overlying rock area displaces significantly and fractures persist. After continuous pillar mining, the overlying rock collapses extensively. The 45° model displacement changes mainly occur in the A and B measuring lines. The 55° model displacement value in the middle area is low, mainly in the front of the mined area. Furthermore, the 65° model displacement influence area is the largest. There is a large displacement in the A, B, and C measuring lines. In our future plans, we will extensively employ MatDEM discrete element numerical simulation calculations to investigate the fracture evolution characteristics and instability mechanisms of fractured rock masses under the combined effects of rainfall and mining. Additionally, we aim to effectively compare and validate these findings with the results obtained from physical simulation experiments.

Author Contributions

Conceptualization, Q.L., Y.W. and X.L.; methodology, Q.L.; software, Q.L.; validation, Y.W., X.L. and B.G.; formal analysis, Q.L.; investigation, X.L.; resources, X.L.; data curation, B.G.; writing—original draft preparation, Q.L.; writing—review and editing, X.L.; visualization, Y.W.; supervision, B.G.; project administration, X.L.; funding acquisition, X.L. All authors have read and agreed to the published version of the manuscript.

Funding

The research work was funded by the Research Fund of National Natural Science Foundation of China (NSFC) (No. 42277154), National Key Research and Development Project (No. 2023YFC2907305), Guizhou Province Science and Technology Planning Project (No. Guizhou science and technology cooperation support (2022) common 229), National Natural Science Foundation of Shandong Province of China (NSFC) (No. ZR2022ME188), the State Key Laboratory of Coal Resources and Safe Mining, CUMT (No. SKLCRSM22KF009), and the project of Slope safety control and disaster prevention technology innovation team of “Youth Innovation Talent Introduction and Education Plan” of Shandong Colleges and universities (Grant No. Lu Jiao Ke Han (2021) No. 51).

Data Availability Statement

Most of the data generated during this study are included in the article. For other datasets, please contact the corresponding authors with reasonable requests.

Acknowledgments

We would like to express our gratitude to Yulin Xie and Jiawen Wang for their invaluable assistance in determining the material ratio, constructing the physical model, and conducting large-scale similar physical simulation experiments involving excavation and rainfall processes.

Conflicts of Interest

Author Yunmin Wang was employed by the Sinosteel Maanshan General Institute of Mining Research Co., Ltd. The remaining authors declare that the research was conducted in the absence of any commercial or financial relationships that could be construed as a potential conflict of interest.

References

  1. Christmann, P. Mineral Resource Governance in the 21st Century and a sustainable European Union. Miner. Econ. 2021, 34, 187–208. [Google Scholar] [CrossRef]
  2. Whittle, D.; Brazil, M.; Grossman, P.A.; Rubinstein, J.H.; Thomas, D.A. Combined optimisation of an open-pit mine outline and the transition depth to underground mining. Eur. J. Oper. Res. 2018, 268, 624–634. [Google Scholar] [CrossRef]
  3. Zhao, J.; Ma, Y.; Lin, B.; Lan, Z.; Shi, W. Geomechanical mode of mining landslides with gently counter-inclined bedding-a case study of Madaling landslide in Guizhou Province. Chin. J. Rock Mech. Eng. 2016, 35, 2217–2224. [Google Scholar]
  4. Tao, Z.G.; Zhu, C.; He, M.C.; Karakus, M. A physical modeling-based study on the control mechanisms of Negative Poisson’s ratio anchor cable on the stratified toppling deformation of anti-inclined slopes. Int. J. Rock Mech. Min. 2021, 138, 104632. [Google Scholar] [CrossRef]
  5. Li, X.; Li, Q.; Wang, Y.; Liu, W.; Hou, D.; Zheng, W.; Zhang, X. Experimental study on instability mechanism and critical intensity of rainfall of high-steep rock slopes under unsaturated conditions. Int. J. Min. Sci. Technol. 2023, 33, 1243–1260. [Google Scholar] [CrossRef]
  6. Zhu, C.; He, M.C.; Karakus, M.; Zhang, X.H.; Tao, Z.G. Numerical simulations of the failure process of anaclinal slope physical model and control mechanism of negative Poisson’s ratio cable. Bull. Eng. Geol. Environ. 2021, 80, 3365–3380. [Google Scholar] [CrossRef]
  7. Lu, W.B.; Yang, J.H.; Yan, P.; Chen, M.; Zhou, C.B.; Luo, Y.; Jin, L. Dynamic response of rock mass induced by the transient release of in-situ stress. Int. J. Rock Mech. Min. 2012, 53, 129–141. [Google Scholar] [CrossRef]
  8. Liu, Y.Q.; Chen, J.P.; Tan, C.; Zhan, J.W.; Song, S.Y.; Xu, W.L.; Yan, J.H.; Zhang, Y.S.; Zhao, M.Y.; Wang, Q. Intelligent scanning for optimal rock discontinuity sets considering multiple parameters based on manifold learning combined with UAV photogrammetry. Eng. Geol. 2022, 309, 106851. [Google Scholar] [CrossRef]
  9. Li, X.; Li, Q.; Hu, Y.; Chen, Q.; Peng, J.; Xie, Y.; Wang, J. Study on Three-Dimensional Dynamic Stability of Open-Pit High Slope under Blasting Vibration. Lithosphere 2022, 2021, 6426550. [Google Scholar] [CrossRef]
  10. Yan, J.H.; Xing, X.S.; Li, X.S.; Zhu, C.; Han, X.D.; Zhao, Y.; Chen, J.P. Forecasting the Landslide Blocking River Process and Cascading Dam Breach Flood Propagation by an Integrated Numerical Approach: A Reservoir Area Case Study. Remote Sens. 2023, 15, 4669. [Google Scholar] [CrossRef]
  11. Liu, W.; Li, Q.H.; Yang, C.H.; Shi, X.L.; Wan, J.F.; Jurado, M.J.; Li, Y.P.; Jiang, D.Y.; Chen, J.; Qiao, W.B.; et al. The role of underground salt caverns for large-scale energy storage: A review and prospects. Energy Storage Mater. 2023, 63, 103045. [Google Scholar] [CrossRef]
  12. Soltani, K.A.; Osanloo, M. A Set of Classified Integer Programming (IP) Models for Optimum Transition from Open Pit to Underground Mining Methods. Nat. Resour. Res. 2020, 29, 1543–1559. [Google Scholar] [CrossRef]
  13. Zhang, Q.L.; Zhang, B.Y.; Chen, Q.S.; Wang, D.L.; Gao, X. Safety Analysis of Synergetic Operation of Backfilling the Open Pit Using Tailings and Excavating the Ore Deposit Underground. Minerals 2021, 11, 818. [Google Scholar] [CrossRef]
  14. Li, X.; Yang, S.; Wang, Y.M.; Nie, W.; Liu, Z.F. Macro-Micro Response Characteristics of Surrounding Rock and Overlying Strata towards the Transition from Open-Pit to Underground Mining. Geofluids 2021, 2021, 5582218. [Google Scholar] [CrossRef]
  15. Zhao, Y.; Yang, T.H.; Bohnhoff, M.; Zhang, P.H.; Yu, Q.L.; Zhou, J.R.; Liu, F.Y. Study of the Rock Mass Failure Process and Mechanisms During the Transformation from Open-Pit to Underground Mining Based on Microseismic Monitoring. Rock Mech. Rock Eng. 2018, 51, 1473–1493. [Google Scholar] [CrossRef]
  16. Zhu, C.; He, M.C.; Karakus, M.; Cui, X.B.; Tao, Z.G. Investigating Toppling Failure Mechanism of Anti-dip Layered Slope due to Excavation by Physical Modelling. Rock Mech. Rock Eng. 2020, 53, 5029–5050. [Google Scholar] [CrossRef]
  17. Cui, F.; Li, B.; Xiong, C.; Yang, Z.; Peng, J.; Li, J.; Li, H. Dynamic triggering mechanism of the Pusa mining-induced landslide in Nayong County, Guizhou Province, China. Geomat. Nat. Hazards Risk 2022, 13, 123–147. [Google Scholar] [CrossRef]
  18. Deliveris, A.V.; Theocharis, A.I.; Koukouzas, N.C.; Zevgolis, I.E. Numerical Slope Stability Analysis of Deep Excavations Under Rainfall Infiltration. Geotech. Geol. Eng. 2022, 40, 4023–4039. [Google Scholar] [CrossRef]
  19. Doumbouya, L.; Guan, C.S.; Bowa, V.M. Influence of Rainfall Patterns on the Slope Stability of the Lumwana (the Malundwe) Open Pit. Geotech. Geol. Eng. 2020, 38, 1337–1346. [Google Scholar] [CrossRef]
  20. Du, W.; Chai, J.; Zhang, D.; Ouyang, Y.; Liu, Y. Study on Quantitative Characterization of Coupling Effect between Mining-Induced Coal-Rock Mass and Optical Fiber Sensing. Sensors 2022, 22, 5009. [Google Scholar] [CrossRef]
  21. Jhanwar, J.C.; Thote, N.R. Slope Failures in the Opencast Coal Mines of Wardha Valley Coalfield in Central India: A Study. Rock Mech. Rock Eng. 2011, 44, 635–640. [Google Scholar] [CrossRef]
  22. Li, Q.; Song, D.; Yuan, C.; Nie, W. An image recognition method for the deformation area of open-pit rock slopes under variable rainfall. Measurement 2022, 188, 110544. [Google Scholar] [CrossRef]
  23. Liu, W.; Du, J.W.; Li, Q.H.; Shi, X.L.; Chen, J.; Yi, W.K.; He, T.; Li, D.P.; Dong, Y.K.; Jiang, D.Y.; et al. Feasibility analysis on the utilization of TWH-caverns with sediment space for gas storage: A case study of Sanshui salt mine. J. Energy Storage 2024, 75, 109576. [Google Scholar] [CrossRef]
  24. Li, Z.Q.; Xue, Y.G.; Li, S.C.; Zhang, L.W.; Wang, D.; Li, B.; Zhang, W.; Ning, K.; Zhu, J.Y. Deformation features and failure mechanism of steep rock slope under the mining activities and rainfall. J. Mt. Sci. 2017, 14, 31–45. [Google Scholar] [CrossRef]
  25. Ma, G.; Hu, X.; Yin, Y.; Luo, G.; Pan, Y. Failure mechanisms and development of catastrophic rockslides triggered by precipitation and open-pit mining in Emei, Sichuan, China. Landslides 2018, 15, 1401–1414. [Google Scholar] [CrossRef]
  26. Nian, G.Q.; Chen, Z.H.; Zhu, T.Y.; Zhang, L.F.; Zhou, Z. Experimental study on the failure of fractured rock slopes with anti-dip and strong weathering characteristics under rainfall conditions. Landslides 2024, 21, 165–182. [Google Scholar] [CrossRef]
  27. Wang, C.; Min, H.; Zhu, T.; Wang, H.; Qin, W.; Zhang, G. Failure mechanism and stability analysis of the landslide: A case study for open pit iron mine in Xichang, Sichuan, China. Nat. Hazards 2023, 116, 663–691. [Google Scholar] [CrossRef]
  28. Xiang, P.; Ji, H.; Geng, J.; Zhao, Y. Characteristics and Mechanical Mechanism of In Situ Unloading Damage and Core Discing in Deep Rock Mass of Metal Mine. Shock Vib. 2022, 2022, 5147868. [Google Scholar] [CrossRef]
  29. Li, S.; Niu, Y.; Wang, B.; Gao, Y.; Zhu, Y. Influence of Rainfall Infiltration on Stability of Granite Residual Soil High Slope. Math. Probl. Eng. 2022, 2022, 1920403. [Google Scholar] [CrossRef]
  30. Rudy, A.C.A.; Lamoureux, S.F.; Treitz, P.; Collingwood, A. Identifying permafrost slope disturbance using multi-temporal optical satellite images and change detection techniques. Cold Reg. Sci. Technol. 2013, 88, 37–49. [Google Scholar] [CrossRef]
  31. Smith, J.V. Self-stabilization of toppling and hillside creep in layered rocks. Eng. Geol. 2015, 196, 139–149. [Google Scholar] [CrossRef]
  32. Khan, M.S.; Hossain, S.; Ahmed, A.; Faysal, M. Investigation of a shallow slope failure on expansive clay in Texas. Eng. Geol. 2017, 219, 118–129. [Google Scholar] [CrossRef]
  33. Spooner, I.; Batterson, M.; Catto, N.; Liverman, D.; Broster, B.E.; Kearns, K.; Isenor, F.; McAskill, G.W. Slope failure hazard in Canada’s Atlantic Provinces: A review. Atl. Geol. 2013, 49, 1–14. [Google Scholar] [CrossRef]
  34. Shin, H. Static and quasi-static slope stability analyses using the limit equilibrium method for mountainous area. Geomech. Eng. 2023, 34, 187–195. [Google Scholar]
  35. Li, X.; Peng, J.; Xie, Y.; Li, Q.; Zhou, T.; Wang, J.; Zheng, W. Influence of High-Temperature Treatment on Strength and Failure Behaviors of a Quartz-Rich Sandstone under True Triaxial Condition. Lithosphere 2022, 2022, 3086647. [Google Scholar] [CrossRef]
  36. Xia, C.; Tang, Z.; Xiao, W.; Song, Y. New Peak Shear Strength Criterion of Rock Joints Based on Quantified Surface Description. Rock Mech. Rock Eng. 2014, 47, 387–400. [Google Scholar] [CrossRef]
  37. Xia, K.; Chen, C.; Liu, X.; Wang, Y.; Liu, X.; Yuan, J. Estimating shear strength of high-level pillars supported with cemented backfilling using the Hoek-Brown strength criterion. J. Rock Mech. Geotech. 2024, 16, 454–469. [Google Scholar] [CrossRef]
  38. Langford, J.C.; Diederichs, M.S. Quantifying uncertainty in Hoek-Brown intact strength envelopes. Int. J. Rock Mech. Min. 2015, 74, 91–102. [Google Scholar] [CrossRef]
  39. Masoumi, H.; Roshan, H.; Hagan, P.C. Size-Dependent Hoek-Brown Failure Criterion. Int. J. Geomech. 2017, 17, 04016048. [Google Scholar] [CrossRef]
  40. Li, X.; Li, Q.; Hou, G.; Zhang, F.; Lu, J. Investigation on the disaster mechanism and dynamic evolution of a dump slope using experimental and numerical methods: Case study, Kunyang phosphate mine, China. Geol. J. 2023, 2023, 1–16. [Google Scholar] [CrossRef]
  41. Hoek, E.; Brown, E. The Hoek-Brown failure criterion and GSI—2018 edition. J. Rock Mech. Geotech. 2019, 11, 445–463. [Google Scholar] [CrossRef]
  42. Bois, T.; Bouissou, S.; Guglielmi, Y. Influence of major inherited faults zones on gravitational slope deformation: A two- dimensional physical modelling of the La Clapie’re area (Southern French Alps). Earth Planet. Sc. Lett. 2008, 272, 709–719. [Google Scholar] [CrossRef]
  43. McFall, B.C.; Mohammed, F.; Fritz, H.M.; Liu, Y.B. Laboratory experiments on three-dimensional deformable granular landslides on planar and conical slopes. Landslides 2018, 15, 1713–1730. [Google Scholar] [CrossRef]
  44. Zhang, B.; Fang, K.; Tang, H.; Sumi, S.; Ding, B. Block-flexure toppling in an anaclinal rock slope based on multi-field monitoring. Eng. Geol. 2023, 327, 107340. [Google Scholar] [CrossRef]
  45. Moo-Young, H.; Myers, T.; Tardy, B.; Ledbetter, R.; Vanadit-Ellis, W.; Kim, T. Centrifuge simulation of the consolidation characteristics of capped marine sediment beds. Eng. Geol. 2003, 70, 249–258. [Google Scholar] [CrossRef]
  46. Wang, H.; Jiang, Z.; Xu, W.; Wang, R.; Xie, W. Physical model test on deformation and failure mechanism of deposit landslide under gradient rainfall. Bull. Eng. Geol. Environ. 2022, 81, 66. [Google Scholar] [CrossRef]
  47. Adhikary, D.P.; Dyskin, A.V.; Jewell, R.J.; Stewart, D.P. A study of the mechanism of flexural toppling failure of rock slopes. Rock Mech. Rock Eng. 1997, 30, 75–93. [Google Scholar] [CrossRef]
  48. Ding, B.; Han, Z.; Zhang, G.; Beng, X.; Yang, Y. Flexural Toppling Mechanism and Stability Analysis of an Anti-dip Rock Slope. Rock Mech. Rock Eng. 2021, 54, 3721–3735. [Google Scholar] [CrossRef]
  49. Aksoy, H.; Unal, N.; Cokgor, S.; Gedikli, A.; Yoon, J.; Koca, K.; Inci, S.; Eris, E. A rainfall simulator for laboratory-scale assessment of rainfall-runoff-sediment transport processes over a two-dimensional flume. Catena 2012, 98, 63–72. [Google Scholar] [CrossRef]
  50. Green, D.; Pattison, I. Christiansen uniformity revisited: Re-thinking uniformity assessment in rainfall simulator studies. Catena 2022, 217, 106424. [Google Scholar] [CrossRef]
  51. Lora, M.; Camporese, M.; Salandin, P. Design and performance of a nozzle-type rainfall simulator for landslide triggering experiments. Catena 2016, 140, 77–89. [Google Scholar] [CrossRef]
  52. Han, Y.; Wang, Q.; Xia, W.; Liu, J.; Wang, J.; Chen, Y.; Shen, J. Experimental study on the hydraulic conductivity of unsaturated dispersive soil with different salinities subjected to freeze-thaw. J. Hydrol. 2020, 583, 124297. [Google Scholar] [CrossRef]
  53. Shen, J.; Wang, Q.; Chen, Y.; Han, Y.; Zhang, X.; Liu, Y. Evolution process of the microstructure of saline soil with different compaction degrees during freeze-thaw cycles. Eng. Geol. 2020, 304, 106699. [Google Scholar] [CrossRef]
  54. Liu, W.; Duan, X.; Li, Q.; Wan, J.; Zhang, X.; Fang, J.; Jiang, D.; Chen, J. Analysis of pressure interval/injection and production frequently on stability of large-scale supercritical CO2 storage in salt caverns. J. Clean. Prod. 2023, 433, 139731. [Google Scholar] [CrossRef]
Figure 1. Location of the study area (Google Earth).
Water 16 00740 g001
Figure 2. Failure status of Huangniu rock slope: (a) wedge failure mode; (b) plane failure mode.
Water 16 00740 g002
Figure 3. Monthly average temperature and precipitation in the study area over the past 20 years.
Water 16 00740 g003
Figure 4. Uniaxial compression stress–strain curve.
Water 16 00740 g004
Figure 5. The test results: (a) triaxial compression stress–strain curve; (b) triaxial compression envelope curve.
Water 16 00740 g005
Figure 6. Similar physical simulation test device. (a) Test bench; (b) rainfall system.
Water 16 00740 g006
Figure 7. Similar physical test process. (a) Slope model; (b) pore water pressure sensor; (c) soil moisture sensor; (d) data acquisition card; (e) direct-current stabilized power supply; (f) three-view stereo camera.
Water 16 00740 g007
Figure 8. Data acquisition system.
Water 16 00740 g008
Figure 9. Layout of monitoring points.
Water 16 00740 g009
Figure 10. Experimental scheme.
Water 16 00740 g010
Figure 11. Variations in pore water pressure in various slope models: (a) 45° slope; (b) 55° slope; (c) 65° slope.
Water 16 00740 g011
Figure 12. Variations in moisture content in various slope models: (a) 45° slope; (b) 55° slope; (c) 65° slope.
Water 16 00740 g012
Figure 13. Layout of displacement measuring lines.
Water 16 00740 g013
Figure 14. Variations in rock mass displacement in the open-pit mining stage: (a) 45° slope model; (b) 55° slope model; (c) 65° slope model.
Water 16 00740 g014
Figure 15. Variations in rock mass displacement in the underground room mining stage (first group of mine rooms): (a) 45° slope model; (b) 55° slope model; (c) 65° slope model.
Water 16 00740 g015
Figure 16. Variations in rock mass displacement in the underground room mining stage (second group of mine rooms): (a) 45° slope model; (b) 55° slope model; (c) 65° slope model.
Water 16 00740 g016
Figure 17. Variations in rock mass displacement in the underground room mining stage (third group of mine rooms): (a) 45° slope model; (b) 55° slope model; (c) 65° slope model.
Water 16 00740 g017
Figure 18. Variations in rock mass displacement in the underground pillar mining stage (Z1 pillar): (a) 45° slope model; (b) 55° slope model; (c) 65° slope model.
Water 16 00740 g018
Figure 19. Variations in rock mass displacement in the underground pillar mining stage (Z2 pillar): (a) 45° slope model; (b) 55° slope model; (c) 65° slope model.
Water 16 00740 g019
Figure 20. Variations in rock mass displacement in the underground pillar mining stage (Z3 pillar): (a) 45° slope model; (b) 55° slope model; (c) 65° slope model.
Water 16 00740 g020
Figure 21. Variations in rock mass displacement in the continuous pillar mining stage (L1 pillar): (a) 45° slope model; (b) 55° slope model; (c) 65° slope model.
Water 16 00740 g021
Figure 22. Variations in rock mass displacement in the continuous pillar mining stage (L2 pillar): (a) 45° slope model; (b) 55° slope model; (c) 65° slope model.
Water 16 00740 g022
Figure 23. Evolution characteristics of rock mass instability fractures in different periods: (a) F6 mining completed (45°); (b) Z3 mining completed (45°); (c) L2 mining completed (45°); (d) Z1 mining completed (55°); (e) L1 mining completed (55°); (f) L2 mining completed (55°); (g) F6 mining completed (65°); (h) Z2 mining completed (65°); (i) L2 mining completed (65°).
Water 16 00740 g023
Table 1. Rock mechanics parameters.
σd/MPaσt/MPaE/GPaμC/MPaΦC of Joint Surface/MPaΦ of Joint Surface/°
52.114.1024.200.157.7838.380.1628.96
Table 2. Rock mechanics parameters after weakening.
σd/MPaσt/MPaE/GPaμC/MPaΦC of Joint Surface/MPaΦ of Joint Surface/°
26.101.038.100.155.2027.800.1020.99
Table 3. Main material proportions.
LithologyProportion
PhylliteCoarse SandFine SandLimeGypsum
151025
Table 4. Different material proportions.
MaterialCoarse Sand/kgFine Sand/kgLime/kgGypsum/kgWater/kgBorax/gMica Powder/g
Q23715831.607972.220.800.80
Table 5. Experimental scheme.
Similar Physical ModelsMining StageRainfall Intensity (mm/h)Mining Area* RMC Time (min)* IR Time (min)Total Time (h)
Slope height = 200 m
Slope angle = 45°/55°/65°
Open-pit mining10Ore body6001
Underground mining20F1, F25/0.75
40Ore body/10
20F3, F45/
40Ore body/10
20F5, F65/
40Ore body/10
20Z15/0.75
40Ore body/10
20Z25/
40Ore body/10
20Z35/
40Ore body/10
20L15/0.5
40Ore body/10
20L25/
40Ore body/10
Note: * The acronyms RMC and IR represent rainfall-mining coupling and independent rainfall, respectively.
Disclaimer/Publisher’s Note: The statements, opinions and data contained in all publications are solely those of the individual author(s) and contributor(s) and not of MDPI and/or the editor(s). MDPI and/or the editor(s) disclaim responsibility for any injury to people or property resulting from any ideas, methods, instructions or products referred to in the content.

