Abstract
Private wells are susceptible to contamination from flooding and are exempt from the federal requirements of the Safe Drinking Water Act. Consequently, well users must manage (e.g., disinfect) and maintain (e.g., regularly test) their own wells to ensure safe drinking water. However, well user practices and perceptions of well water quality in the years following a natural disaster are poorly characterized. An online follow-up survey was administered in October 2020 to private well users who had previously experienced Hurricane Harvey in 2017. The survey was successfully sent to 436 participants, and 69 surveys were returned (15.8% return rate). The survey results indicate that well users who had previously experienced wellhead submersion or a positive bacteria test were more likely to implement well stewardship practices (testing and disinfection) and to report the feeling that their well water was safe. While the majority of well users believed that their water was safe (77.6%), there was a significant decrease in well water being used for drinking, cooking, and for their pets after Hurricane Harvey. Generally, these well users tend to maintain their wells at higher rates than those reported in other communities, but there continues to be a critical need to provide outreach regarding well maintenance practices, especially before natural disaster events occur.
1. Introduction
The increasing frequency and intensity of extreme weather events affecting coastal communities poses a significant public health threat for individuals relying on private wells for their drinking and domestic household needs [1,2]. Floodwaters have been shown to increase the incidence and transmission of waterborne diseases for individuals relying on well water as a drinking water source [3,4,5,6]. Public water systems are federally required, as per the Safe Drinking Water Act (SDWA), to ensure the safety and quality of their drinking water supplies [7,8,9]. In contrast, private wells are exempt from the SDWA, and all well maintenance and stewardship (e.g., well and pump inspection, disinfection, and well water quality monitoring), especially after a natural disaster, are the sole responsibility of the well user [10]. During natural disaster events, public water systems are required to provide appropriate staffing at water utility facilities, to issue boil water notices and/or emergency disinfection guidelines, and to carefully monitor drinking water quality and operations [11]. However, such information and resources are limited for private well users.
Preventive well maintenance and well stewardship, especially after natural disasters, are critical for mitigating the adverse health outcomes associated with contaminated well water (e.g., gastrointestinal illnesses and exposure to heavy metals) [10,12,13,14,15]. However, proper well stewardship by private well users is a significant challenge for public health, especially given that there are no federal laws or requirements for managing private wells and state-level guidance remains limited [16,17,18]. Barriers exist which inhibit private well users from seeking and/or implementing proper well stewardship, and can include factors such as a lack of the resources needed to test or treat well water, a lack of knowledge regarding what well water testing and treatment entails, complacency, cost, the inconvenience of testing, and privacy concerns [16,19,20]. For example, well water testing by private well users remains extremely limited [17,21], with a previous study identifying only a 10% annual testing rate among well users in Wisconsin [17,21] or the fact that testing only occurs when concerns for water quality arise [22,23]. The critical need for proper well stewardship increases after a natural disaster/emergency event, especially given that waterborne illnesses from contaminated well water continue to be observed due to unsafe drinking water [3,24,25,26].
Communities across the Texas Gulf Coast experienced extensive flooding after Hurricane Harvey. The storm made landfall on 25 August 2017 and caused infrastructural damage and the contamination of numerous public and private water systems [27]. Our previous work estimated that 131,506 to 263,012 private wells in the region were impacted by the floodwaters from Hurricane Harvey [5]. Compared to non-flood conditions, after Hurricane Harvey we identified a 1.5× increase in well water samples testing positive for total coliforms and a 2.8× increase in samples testing positive for Escherichia coli (E. coli) [5]. Well water contamination is suspected to have occurred through wellhead inundation by floodwater and physical damage to the well system or through the floodwater contamination of shallow groundwater. Furthermore, we identified elevated human health risks that were associated with drinking, showering/bathing, and washing food/dishes with contaminated well water after Hurricane Harvey [28]. However, the risk perceptions and well stewardship practices of well users who had previously experienced a natural disaster remain weakly understood.
In this study we characterize well user behaviors and perceptions regarding well water quality and stewardship after experiencing Hurricane Harvey. Specifically, we assess well user stewardship (e.g., testing, disinfection, and adding a well treatment device) and well water uses (drinking, cooking, and bathing) and perceptions. Building on our prior work [5], we resurveyed our participants three years after Hurricane Harvey to assess well user perceptions and behaviors after experiencing the impacts of a natural disaster. Understanding the behaviors and practices of well users in the years following a natural disaster event can inform opportunities for educational outreach and future research needs.
2. Materials and Methods
2.1. Survey Development and Distribution
In collaboration with the Texas Well Owner Network (TWON), a program led by Texas A&M AgriLife Extension, a follow-up survey was administered in October 2020; the survey included questions regarding well water testing and disinfection, the current uses of well water, and the perceptions of well water three years after Hurricane Harvey (Supplementary Materials). This survey was adapted from our initial questionnaire, which was first distributed in the fall of 2017 to well users immediately following Hurricane Harvey; the questionnaire was part of a citizen science well water sampling campaign which provided well water testing, as described in our previous work [5]. The specific questions evaluated in this study are listed in Table 1. The well water quality test results for fecal indicator bacteria (FIB) (specifically, total coliforms and Escherichia coli (E. coli)) were included in the analysis; these results were collected in 2017 immediately after Hurricane Harvey for each survey participant. Demographic data (county of residence, education, ethnicity, and annual income) were also collected in the 2017 survey. This 2020 survey was administered electronically via Qualtrics (Qualtrics XM, Utah, USA) and included 28 questions; the survey required less than 15 min to complete. The survey distribution and communication procedures followed online survey administration methods [29]. An initial pre-contact email was sent to notify those who had participated in 2017 of this follow-up study; this was followed by an email that included the link to the survey and then two reminder emails each week for two weeks. The follow-up survey was conducted with Texas A&M University Institutional Review Board approval (IRB2017-0760M).

Table 1.
Specific survey questions included in the analysis.
Of the original survey participants who completed the 2017 questionnaire (n = 630), 79.0% provided email addresses (n = 498). However, several email addresses were determined to be no longer valid (n = 62), leaving a total number of 436 valid email addresses to be used for survey distribution. In total, 69 surveys were completed, resulting in a submission rate of 15.8%. There were 7 surveys that were started and not completed (for a total of n = 76 surveys); these were therefore omitted from the data analysis. The survey question response rates for the individual questions varied since some respondents selected to skip specific questions (there were no survey questions that were required to be completed). For those who elected to respond to the survey, there was a 91% completion rate. The responses to the questions regarding perceptions of well water, well stewardship, and well water uses were evaluated to characterize well user behavior three years after experiencing Hurricane Harvey. There was no incentive payment included in the survey distribution.
2.2. Statistical Analyses
Descriptive statistics were used to evaluate the responses from the 2020 follow-up survey. Pearson’s chi-square tests of independence and Fisher’s exact tests were utilized to assess the associations between the demographic characteristics, the well water stewardship practices, the wellhead being submerged, the positive bacteria tests in the well water, and the perceptions of well water quality. McNemar’s paired sample proportion tests evaluated the differences in reported water uses before and after flooding. When conducting the statistical analyses, the “Don’t Know” and missing responses were generally omitted. The “No” and “Don’t Know” responses were combined only for the question “Do you feel your water is safe?”, given that the perception of the water not being safe and uncertainty about the safety of the water are relatively similar. The statistical package for Social Sciences (SPSS) Version 29 was used for all data analyses. Some data (specifically the Likert scale questions) were modified so that they could be evaluated as nominal variables. We assumed a null hypothesis that response frequencies would not differ among the various questions. The significance level was defined as α < 0.1.
3. Results
3.1. Demographics of Survey Well Users
The survey participants predominantly identified as white (84.8%), with only 4.5% (n = 3) and 1.5% (n = 1) identifying as Hispanic/Latino or Black/African American, respectively (Table 2). Participants from 14 different counties completed the follow-up survey, with 33.8% (n = 23) living in Wharton County, followed by Victoria (19.1%, n = 13) and Harris Counties (10.3%, n = 7). Nearly two-thirds of respondents had a bachelor’s degree or post-college education (59.7%, n = 40), while 35.8% (n = 24) reported having a high school diploma or having completed some college. Specifically, 14.9% (n = 10) reported having a high school diploma, 20.9% (n = 14) reported having completed some college, 40.3% (n = 27) had a college degree, and 19.4% (n = 13) had a post-college degree (master’s degree or PhD). The information regarding annual income was less informative, given that 35.8% (n = 24) of the participants provided “prefer not to answer”. Of the information available, 14.9% (n = 10) reported an income of USD 45,000 or less; 29.9% (n = 20) reported an income between USD 45,001 and USD 85,000; and 19.4% (n = 13) reported an income of USD 85,001 or higher. In this survey, the percentage of participants who identified as being white and having a college degree or higher was greater than that of the overall Texas population [30].
Table 2.
Demographics and water consumption of participants.
Regarding drinking well water from the tap, the participants were nearly evenly split between those who drank water with filtration or treatment (36.2%, n = 25), those who drank water without filtration or treatment (34.8%, n = 24), and those who did not drink water from the tap (29%, n = 20). The majority of the participants (45.8%, n = 22) reported drinking eight cups of water per day (approximately 1.89 L). This verified a key assumption utilized in human health risk assessments. A common assumption used to estimate the human health risks associated with exposure is that an individual will ingest approximately one to two liters of water per day [31].
3.2. Well Stewardship
Well stewardship activities, including well water testing and disinfecting a well system, typically have low rates of implementation by well users. Nearly half of the respondents (46.3%, n = 31) indicated that they or someone else had disinfected their well system, while approximately 44.7% (n = 30) reported never disinfecting their well, and 9.0% (n = 6) identified as not knowing whether they had ever disinfected their well (Figure 1). For those who had disinfected their well, 80.6% (n = 25) reported doing it themselves and only 19.4% (n = 6) reported having someone else do it. Of the respondents who indicated that they had disinfected their well system, 41.9% (n = 13) reported disinfecting due to a “concern for contamination from flooding/heavy rains”, while 22.6% (n = 7) disinfected due to a positive bacteria test or for routine maintenance. Only 12.9% (n = 4) disinfected due to taste or odor issues. No stewardship practices or demographics were identified as being associated with well disinfection, which is consistent with the findings from the 2017 survey [5] (Table S2).
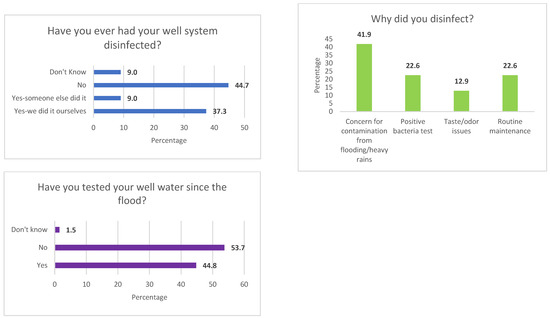
Figure 1.
Well water disinfection and testing practices reported by well users three years after experiencing Hurricane Harvey.
Well water testing occurred at relatively similar percentages to those of well system disinfection. Approximately 44.8% (n = 30) of the respondents reported testing their well water since Hurricane Harvey (Figure 1), which is higher than the well testing rates previously reported by well users in Texas [32]. Nearly 57.1% of well users who reported testing their well since Hurricane Harvey also reported having their well system disinfected, while 45.5% of well users who reported not testing their well did report that they had disinfected their well system. However, this was not a significant association (p = 0.363; Table S1), which may be attributable to the small sample size. Interestingly, testing well water since Hurricane Harvey was not identified as having a significant association with demographics (income, education, and counties) or stewardship (disinfection, treatment, and submerged wellhead) (Table S3).
3.3. Wellhead Submersion, Water Quality, and Well Treatment Devices
Of the well users who participated, 27.9% (n = 19), reported that their wellhead was submerged, while 72.1% (n = 49) reported that their wellhead was not submerged, or they did not know if it had been submerged by flooding. Of the 19 well users who reported that their wellhead was submerged, only 15.8% (n = 3) reported that they had raised the casing of their wellhead. Overall, while more than one-third of the participants (37.7%, n = 26) had wells that tested positive for total coliform, only 4.3% (n = 3) had tested positive for E. coli after Hurricane Harvey. However, for the well users who reported that their wellhead was submerged, there was a significant association with the well testing positive for E. coli (p = 0.011) (Table S4). The same association was not identified for wells that had tested positive for total coliform (p = 0.518). Well users reporting that their wellhead was submerged and testing their well since the Hurricane Harvey flooding were not identified as being significantly associated (p = 0.707) (Table S3). Interestingly, there was a significant association between a well being submerged and the well users feeling that their well water was safe (p = 0.066) (Table S4). Additionally, wellhead submersion was not significantly associated with demographics, well water testing, well disinfection, or whether a treatment system had been added (Table S4).
The wells that tested positive for total coliform had a significant association with the well water being tested (p = 0.026); yet, the wells that tested positive for E. coli did not (p = 0.106) (Table S3). While the wells that were disinfected did not have a significant association with testing positive for total coliform (p = 0.716), there was a significant association with testing positive for E. coli (p = 0.081) (Table S2). Feeling that the water was safe was significantly associated with the wells testing positive for total coliforms (p = 0.012) and E. coli (p = 0.060) (Table S5). Additionally, a significant association was identified between income and the participants who had well water that tested positive for total coliforms (p = 0.025) (Table S5) (however, this may have been skewed by the large percentage of participants who preferred not to answer the income question). No significant associations were identified between bacteria detected in the well water and county of residence and education (Table S5).
The well users were asked if they had a water treatment device in their home and if it had been added after Hurricane Harvey. When the respondents were asked if they had a water treatment device installed in their home drinking water system, 27.4% responded that they did not have any treatment system, while 25.5% indicated that they had a water softener, and 17.0% indicated that they had a sediment filter (Figure S1). Treatment systems that would help mitigate bacteria contamination, including a chlorinator (0.9%), reverse osmosis (6.6%), and ultraviolet light (0.9%), were not reported as being widely used. For the well users who had water treatment devices installed, only 10.5% (n = 4) indicated that the system was added after Hurricane Harvey. For those homes which had water treatment devices, there was an association with location (Wharton County vs. other counties, p = 0.077), income (p = 0.055), and feeling that their well water was safe (p = 0.002) (Table 3). Other well stewardship practices, education, and previously having had well water tested for FIB were not significantly associated with a water treatment device being added.
Table 3.
Demographic and stewardship associations with well water treatment device being added after Hurricane Harvey.
3.4. Perceptions of Well Water Safety
The well users were asked if they felt that their well water was safe. Overall, 77.6% (n = 52) of the well users responded that they felt their well water to be safe, with 19.4% responding “don’t know” and only 3% (n = 2) reporting that they felt their water to be unsafe. The greatest percentage of participants who reported feeling that their water was safe also drank their well water from the kitchen tap (76.9%). Of the well users who reported not drinking their well water, most reported “don’t know” with regard to their well water safety. Of the two participants who indicated that they did not feel that their well water was safe, both reported drinking their well water without filtration/treatment (Figure 2).
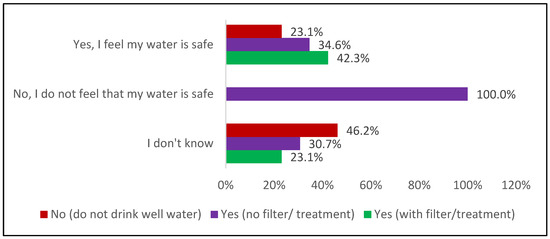
Figure 2.
Perceptions of well water safety for well users who report drinking (with and without filter/treatment) and not drinking their well water.
The well user perceptions regarding their feelings about whether their well water was safe for drinking, cooking, and bathing and their comfort in managing their well were evaluated along with well stewardship practices (Table S6). Conducting well water testing was associated with feeling that the water was safe to drink (p = 0.085). Well users who had a positive total coliform water quality test were also associated with feeling whether their water was safe for bathing (p = 0.035). No other associations were identified between well stewardship, FIB water quality tests, and well water perceptions.
3.5. Domestic Water Uses before and after Flooding
To evaluate how well users use/used their well water before and after the Hurricane Harvey flooding, the participants were asked to identify the ways that their well water had been used for domestic needs. Domestic water uses that included cooking (p = 0.083), drinking (p = 0.059), and using water for pets (p = 0.046) showed a statistically significant decrease in use after the flood (Table 4, Supplementary Figure S2). While there was no significant difference in drinking water sources, there was a decrease in well users reporting the drinking of unfiltered well water, and an increase in the use of bottled water (and filtered well water) after the flood. The increase in drinking bottled or filtered well water instead of unfiltered well water suggests a change in perception by the well users regarding the suitability of their well water quality for drinking. There was no difference in the use of well water for bathing before and after the flooding.
Table 4.
Well water uses before and after Hurricane Harvey among well users.
4. Discussion
Our previous work evaluating the human health risks associated with wells affected by Hurricane Harvey identified elevated human health risks for well users exposed to contaminated well water [28]. An estimated 15,000 well users experienced floodwater inundation and up to 500,000 well users may have been affected by the Hurricane Harvey flooding [5]. The responses to this survey suggest that well users experiencing a positive test for FIB in their well water and/or flooding (e.g., wellhead submersion) tend to engage in well stewardship practices (disinfecting and testing) that would help protect their well water quality.
4.1. Well Stewardship after a Natural Disaster
While professional associations (e.g., American Water Works Association) and state and federal agencies provide an array of resources, guidelines, and requirements for public water utilities to assist in natural disaster preparedness and management, guidance for private wells remains limited. Public utilities, such as those in Texas, are advised to not only prepare their facilities and operations in advance of a natural disaster event [11], but also to have comprehensive guidance regarding sampling, planning for emergency drinking water, and risk communication [33]. While the Centers for Disease Control and Prevention and the U.S. Environmental Protection Agency both provide general guidance for private well management before and after a natural disaster, specific guidelines for well stewardship (e.g., frequency of testing, disinfection protocols, etc.) are developed by state agencies, which vary greatly among the states or may not even be available [18]. As a result, well stewardship practices, under both disaster and non-natural disaster conditions, are critical for ensuring safe drinking water and protecting public health. Within the three years since Hurricane Harvey, 44.8% of the well users who participated in the survey reported having tested their well water at least once. Other studies have reported a range of well testing rates by well users, ranging from only 10% of Wisconsin well users testing their well water within 12 months [17] to 79% of New Jersey well owners testing their well water prior to an outreach event [34]. Given that Texas has no private well water testing requirements (unlike New Jersey, which requires wells to be tested for real estate transactions [34,35]), the well water testing rate reported here is relatively greater than that of other well owner/user studies.
Well users are strongly encouraged to have their well disinfected after a flood event to inactivate any microbial pathogens. However, proper well disinfection, commonly called shock chlorination, is often implemented by the well user and can be improperly administered [36]. Water chemistries, organic matter, and the appropriate application of chlorine can all affect the disinfection efficacy [37]. The majority of well users (53.7%) in the study reported not ever having their well disinfected (or not knowing). Of the 46.3% who have disinfected their well, most indicated that they had disinfected their well themselves. Gilliland et al. [38] evaluated the impact of a pilot well disinfection class on well user knowledge after a flood event. Post-class surveys completed by the participants showed an 88% improvement in knowledge of disinfection procedures, and 46% of participants improved their technical knowledge of well disinfection. In this study, for the well users who reported disinfecting their well, there was an association with receiving a positive E.coli test result; this was not the case with the total coliform tests. The proportion of well users who reported never disinfecting their well, and of those who had disinfected and did so by themselves, emphasizes the critical need for well users to have access to reliable platforms (online chlorination calculators, workshops, and informational resources) that would provide the appropriate protocols for disinfection, especially during natural disasters when well maintenance professionals may not be readily available.
Additionally, wellhead submersion is a significant pathway for well water contamination. Of the 19 well users who reported having their wellhead submerged (27.9%), only 3 (15.8%) reported having raised the casing of their wellhead since Hurricane Harvey. Boellstorff et al. (2021) reported that wells that had been submerged after Hurricane Harvey were much more likely to test positive for both total coliforms (56% vs. 37%) and E. coli (23% vs. 3%) than wells that were not submerged. Given the low number of well users who had reported raising their well casing, efforts to inform or potentially regulate raising wellhead casings to a minimum height should be pursued. Currently, the Texas Administrative Code (16 TAC, section 76.100(a)(5)) requires wellheads to be cased above previous flood levels (even if that exceeds 36 inches) for wells located in floodplains [39]. The increased protection and long-term resiliency that a raised wellhead casing provides emphasizes the value of this well stewardship practice for public health protection. Financial assistance to well users to subsidize and aid in meeting the costs for raising wellhead casings should be considered.
4.2. Demographics and Well Water Perceptions and Stewardship
Previous work has indicated that education and income are significant predictors impacting well stewardship [17,21,40,41]. While education was not identified to be associated with any well stewardship practices, a lower income was found to be associated with wells that had tested positive for total coliforms (p = 0.025) and with well users who reported having water treatment devices added (p = 0.055). Location (Wharton County vs. other counties) was also identified as being significantly associated with well users who had had water treatment devices added (p = 0.077). The lack of association between the demographic characteristics could be due to the small sample size and/or survey design or because, as in some cases, the demographic factors were found to be unrelated to water testing practices [20]. The location of residence has also been found to influence health risks and well water management, as has been suggested in this study [42,43].
The perceived risk can directly influence well stewardship practices. A well user’s perception of their water’s safety or quality can affect decisions regarding whether to test or treat well water. For example, a low perceived risk will often result in well owners not testing or treating their water [20]. The feeling that the well water was safe to drink was associated with well water testing (p = 0.096). Overall, the well users felt strongly that their well water was safe (77.6%), which is supported by previous studies indicating that well users believe their well water is equal to or even superior to (from a safety perspective) water from public systems, and they often feel that they are in control of their own well water quality [23,44]. Future work aimed at understanding what factors drive this perception of feeling that water is safe should be investigated, as it may identify opportunities to engage with well users and develop effective intervention strategies that may improve well stewardship practices.
Risk perception may also affect well stewardship following a natural disaster. While not all well users who participated in the study had their wellheads submerged/inundated by floodwater, the Hurricane Harvey flooding impacted nearly the entire Texas Gulf Coast region. Previous work has identified that not experiencing significant damage after enduring a risk may influence individuals to think that they will not be impacted by future risks (i.e., natural disasters) [19,45]. All the survey participants had previously been a part of post-Hurricane Harvey well water testing campaigns, and prior experience with flooding did appear to influence well stewardship practices.
4.3. Study Limitations
This study, despite its limitations, provides an assessment of well user perceptions three years after experiencing a significant natural disaster event. A relatively small proportion of well users who participated in the original survey administered in the fall of 2017 immediately after Hurricane Harvey participated in this follow-up survey. However, fourteen different counties were represented in the study, providing a broad representation of the Texas Gulf Coast area. Given that the follow-up survey was not in the original study design following the distribution of the first survey, it is probably inappropriate to apply pre- and post-study analyses between the two surveys. This survey is an example of a cross-sectional study, and while informative, it does have its limitations regarding the ability to infer well user behavior and motivations.
The follow-up survey was administered online during the COVID-19 pandemic in October and November 2020. While online surveys are relatively inexpensive to administer and can gather data quickly and minimize survey error, there are limitations that should be considered [46], including the fact that online surveys require participants to have access to reliable internet. Given that all the participants were contacted with email addresses provided by the first survey, it was assumed that all the contacted individuals would have internet access. However, many private well users live in rural areas and there may have been limitations involved in the accessing and/or completing of the survey. The survey design also allowed the participants to easily skip questions, and it was shorter than the first survey to increase completion [29,46].
Even with these limitations, the results from the study are critically informative in representing well user stewardship after experiencing a natural disaster event. Well stewardship activities appear to be implemented following a positive bacteria test or after experiencing wellhead submersion. Future work which examines the perceptions regarding why well users implement/do not implement these stewardship practices after a natural disaster or positive bacteria test is recommended. While this study is unique to a specific region of the Gulf Coast of Texas and the well water perceptions could potentially differ from those of well users in other areas, it could be representative of those communities impacted by hurricane flooding or of those living in other coastal areas. Evaluating why well users believe their well water is safe/unsafe for different household uses should also be investigated. Lastly, as extreme weather events continue to occur and increase in severity due to climate change, evaluating well user perceptions and behaviors over time may be informative for educational outreach and risk communication.
4.4. Conclusions
The well users who participated in this study had been previously impacted by Hurricane Harvey and had participated in a well water testing campaign and educational outreach. The participants in this study indicated that they perceived their well water to be safe and implemented well stewardship practices (e.g., testing and disinfection) at rates similar to and/or higher than previously reported in the literature [17,32,34,43]. The information gained from this study is informative for well user outreach efforts in Texas and other coastal areas in the United States that are impacted by natural disasters/flooding events.
Knowledge and educational outreach are critical components for overcoming barriers that may be preventing well stewardship. Future outreach should consider the perceptions and social norms of well users and continue/expand upon current educational efforts to implement workshops and well water testing events in these rural communities. Outreach before disaster events that includes information regarding where to have well water tested and well disinfection protocols is needed. Due to their proximity to the Gulf of Mexico, the participants in this study will likely experience flooding in the future, further emphasizing the critical importance of increasing well stewardship engagement. Survey evaluations are useful tools that can provide information about gaps or disconnects in well water perceptions and well management practices; this information is needed in order to identify potential public health risks and to develop disaster management recommendations for well users.
Supplementary Materials
The following supporting information can be downloaded at: https://www.mdpi.com/article/10.3390/w15223943/s1. Figure S1: Installed water treatment devices; Figure S2: Differences in domestic water uses as identified before and after the flooding; Table S1: Crosstabulation of well water testing and well system disinfection; Table S2: Well disinfection and associations with demographics and other stewardship practices; Table S3: Well water testing associations with demographics and other stewardship practices; Table S4: Wellhead submerged from flooding and associations with demographics and other stewardship practices; Table S5: Bacteria test results and associations with well stewardship and demographics; Table S6: Well water perceptions and associations with well stewardship practices and previous bacteria tests.
Author Contributions
Conceptualization, A.C.G., D.E.B. and D.M.G.; methodology, A.C.G., D.E.B., K.J.P. and D.M.G.; formal analysis, A.C.G.; resources, D.E.B., K.J.P. and D.M.G.; writing—original draft preparation, A.C.G.; writing—review and editing, A.C.G., D.E.B., K.D.M., D.M.G., K.J.P., K.S.M. and T.J.G.; visualization, A.C.G.; supervision, D.E.B., D.M.G. and T.J.G.; project administration, D.E.B., D.M.G. and K.J.P.; funding acquisition, D.E.B., D.M.G. and K.J.P. All authors have read and agreed to the published version of the manuscript.
Funding
This work was also made possible in part by partial support from the National Science Foundation Rapid Response Research (RAPID) Program under Grant Number 1760296. The project was also partially supported through the Federal Emergency Management Agency Texas Division of Emergency Management funding under Grant Numbers 97036/1006700 and through the Clean Water Act §319(h) Nonpoint Source funding from the Texas State Soil and Water Conservation Board and the United States Environmental Protection Agency under Grant Numbers 10-04 and 13-08. Its contents are solely the responsibility of the authors and do not necessarily represent the official views of the National Science Foundation, Federal Emergency Management Agency, the Texas State Soil and Water Conservation Board, or the United States Environmental Protection Agency. K.J.P. was partially supported by an Early-Career Research Fellowship from the Gulf Research Program of the National Academies of Sciences, Engineering, and Medicine. A.G. and K.D.M. were partially supported by the Southwest Center for Occupational and Environmental Health (www.SWCOEH.org (accessed on 21 September 2023), the Centers for Disease Control and Prevention (CDC)/National Institute for Occupational Safety and Health (NIOSH) Education and Research Center at The University of Texas Health Science Center at Houston School of Public Health, and awardee of Grant No. T42OH008421.
Data Availability Statement
Data sharing is not applicable to this article, due to the sensitive nature of the data collected and the need to keep well user information confidential.
Conflicts of Interest
The authors declare no conflict of interest. The funders had no role in the design of the study; in the collection, analyses, or interpretation of data; in the writing of the manuscript; or in the decision to publish the results.
References
- USGCRP Impacts, Risks, and Adaptation in the United States: Fourth National Climate Assessment, Volume II; U.S. Global Change Research Program: Washington, DC, USA, 2018; p. 1515.
- Petkova, E.P.; Ebi, K.L.; Culp, D.; Redlener, I. Climate Change and Health on the U.S. Gulf Coast: Public Health Adaptation Is Needed to Address Future Risks. Int. J. Environ. Res. Public Health 2015, 12, 9342–9356. [Google Scholar] [CrossRef] [PubMed]
- Eccles, K.M.; Checkley, S.; Sjogren, D.; Barkema, H.W.; Bertazzon, S. Lessons Learned from the 2013 Calgary Flood: Assessing Risk of Drinking Water Well Contamination. Appl. Geogr. 2017, 80, 78–85. [Google Scholar] [CrossRef]
- Stallard, M.A.; Mulhern, R.; Greenwood, E.; Franklin, T.; Engel, L.S.; Fisher, M.B.; Sobsey, M.D.; Zanib, H.; Noble, R.T.; Stewart, J.R.; et al. Occurrence of Male-Specific and Somatic Coliphages and Relationship with Rainfall in Privately-Owned Wells from Peri-urban and Rural Households. Water Res. X 2021, 12, 100102. [Google Scholar] [CrossRef]
- Pieper, K.J.; Jones, C.N.; Rhoads, W.J.; Rome, M.; Gholson, D.M.; Katner, A.; Boellstorff, D.E.; Beighley, R.E. Microbial Contamination of Drinking Water Supplied by Private Wells after Hurricane Harvey. Environ. Sci. Technol. 2021, 55, 8382–8392. [Google Scholar] [CrossRef] [PubMed]
- Murphy, H.M.; Thomas, M.K.; Schmidt, P.J.; Medeiros, D.T.; McFADYEN, S.; Pintar, K.D.M. Estimating the Burden of Acute Gastrointestinal Illness Due to Giardia, Cryptosporidium, Campylobacter, E. Coli O157 and Norovirus Associated with Private Wells and Small Water Systems in Canada. Epidemiol. Infect. 2016, 144, 1355–1370. [Google Scholar] [CrossRef]
- USEPA. United States Safe Drinking Water Act; USEPA: Washington, DC, USA, 1974; Volume § 300f. [Google Scholar]
- USEPA. United States Safe Drinking Water Act Amendments of 1996; USEPA: Washington, DC, USA, 1996. [Google Scholar]
- Sowby, R.B. The Safe Drinking Water Act at 50: A Policy Model for Grand Challenges. Water Resour. Res. 2023, 59, e2023WR035172. [Google Scholar] [CrossRef]
- Zheng, Y.; Flanagan, S.V. The Case for Universal Screening of Private Well Water Quality in the U.S. and Testing Requirements to Achieve It: Evidence from Arsenic. Environ. Health Perspect. 2017, 125, 085002. [Google Scholar] [CrossRef]
- Texas Commission on Environmental Quality Preparing Your Public Water System for a Natural Disaster. Available online: https://www.tceq.texas.gov/drinkingwater/homeland_security/disasterprep/disasterprep.html (accessed on 11 October 2023).
- Krolik, J.; Evans, G.; Belanger, P.; Maier, A.; Hall, G.; Joyce, A.; Guimont, S.; Pelot, A.; Majury, A. Microbial Source Tracking and Spatial Analysis of E. Coli Contaminated Private Well Waters in Southeastern Ontario. J. Water Health 2013, 12, 348–357. [Google Scholar] [CrossRef]
- Chique, C.; Hynds, P.D.; Andrade, L.; Burke, L.; Morris, D.; Ryan, M.P.; O’Dwyer, J. Cryptosporidium Spp. in Groundwater Supplies Intended for Human Consumption—A Descriptive Review of Global Prevalence, Risk Factors and Knowledge Gaps. Water Res. 2020, 176, 115726. [Google Scholar] [CrossRef]
- Chique, C.; Hynds, P.; Burke, L.P.; Morris, D.; Ryan, M.P.; O’Dwyer, J. Contamination of Domestic Groundwater Systems by Verotoxigenic Escherichia Coli (VTEC), 2003–2019: A Global Scoping Review. Water Res. 2021, 188, 116496. [Google Scholar] [CrossRef]
- Shaw, W.D.; Walker, M.; Benson, M. Treating and Drinking Well Water in the Presence of Health Risks from Arsenic Contamination: Results from a U.S. Hot Spot. Risk Anal. 2005, 25, 1531–1543. [Google Scholar] [CrossRef] [PubMed]
- Fox, M.A.; Nachman, K.E.; Anderson, B.; Lam, J.; Resnick, B. Meeting the Public Health Challenge of Protecting Private Wells: Proceedings and Recommendations from an Expert Panel Workshop. Sci. Total Environ. 2016, 554–555, 113–118. [Google Scholar] [CrossRef] [PubMed]
- Malecki, K.M.C.; Schultz, A.A.; Severtson, D.J.; Anderson, H.A.; VanDerslice, J.A. Private-Well Stewardship among a General Population Based Sample of Private Well-Owners. Sci. Total Environ. 2017, 601–602, 1533–1543. [Google Scholar] [CrossRef] [PubMed]
- Bowen, K.; Krishna, T.; Backer, L.; Hodgins, K.; Waller, L.A.; Gribble, M.O. State-Level Policies Concerning Private Wells in the United States. Water Policy 2019, 21, 428–435. [Google Scholar] [CrossRef] [PubMed]
- Morris, L.; Wilson, S.; Kelly, W. Methods of Conducting Effective Outreach to Private Well Owners—A Literature Review and Model Approach. J. Water Health 2015, 14, 167–182. [Google Scholar] [CrossRef]
- Kreutzwiser, R.; de Loë, R.; Imgrund, K.; Conboy, M.J.; Simpson, H.; Plummer, R. Understanding Stewardship Behaviour: Factors Facilitating and Constraining Private Water Well Stewardship. J. Environ. Manag. 2011, 92, 1104–1114. [Google Scholar] [CrossRef]
- Knobeloch, L.; Gorski, P.; Christenson, M.; Anderson, H. Private Drinking Water Quality in Rural Wisconsin. J. Environ. Health 2013, 75, 16–21. [Google Scholar]
- Flanagan, S.V.; Marvinney, R.G.; Zheng, Y. Influences on Domestic Well Water Testing Behavior in a Central Maine Area with Frequent Groundwater Arsenic Occurrence. Sci. Total Environ. 2015, 505, 1274–1281. [Google Scholar] [CrossRef]
- Hooks, T.; Schuitema, G.; McDermott, F. Risk Perceptions Toward Drinking Water Quality Among Private Well Owners in Ireland: The Illusion of Control. Risk Anal. 2019, 39, 1741–1754. [Google Scholar] [CrossRef]
- Stokdyk, J.; Borchardt, M.; Firnstahl, A.; Bradbury, K.; Muldoon, M.; Kieke, B. Assessing Private Well Contamination in Grant, Iowa, and Lafayette Counties, Wisconsin: The Southwest Wisconsin Groundwater and Geology Study; USGS: Reston, VA, USA, 2022; p. 66. [Google Scholar]
- O’Sullivan, M.B.; Garvey, P.; O’Riordan, M.; Coughlan, H.; McKeown, P.; Brennan, A.; McNamara, E. Increase in VTEC Cases in the South of Ireland: Link to Private Wells? Eurosurveillance 2008, 13, 18991. [Google Scholar] [CrossRef]
- Rowles III, L.S.; Hossain, A.I.; Ramirez, I.; Durst, N.J.; Ward, P.M.; Kirisits, M.J.; Araiza, I.; Lawler, D.F.; Saleh, N.B. Seasonal Contamination of Well-Water in Flood-Prone Colonias and Other Unincorporated U.S. Communities. Sci. Total Environ. 2020, 740, 140111. [Google Scholar] [CrossRef]
- Blake, E.S.; Zelinsky, D.A. Hurricane Harvey (AL092017); National Oceanic and Atmospheric Administration and National Weather Service: Washington, DC, USA, 2018; p. 77. [Google Scholar]
- Gitter, A.; Boellstorff, D.E.; Mena, K.D.; Gholson, D.M.; Pieper, K.J.; Chavarria, C.A.; Gentry, T.J. Quantitative Microbial Risk Assessment for Private Wells in Flood-Impacted Areas. Water 2023, 15, 469. [Google Scholar] [CrossRef]
- Dillman, D.A.; Smyth, J.D.; Christian, L.M. Internet, Phone, Mail, and Mixed-Mode Surveys: The Tailored Design Method; John Wiley & Sons: Hoboken, NJ, USA, 2014; ISBN 978-1-118-45614-9. [Google Scholar]
- U.S. Census Bureau QuickFacts: Texas. Available online: https://www.census.gov/quickfacts/fact/table/TX/PST045222 (accessed on 13 July 2023).
- U.S. EPA Exposure Factors Handbook: 2011 Edition; National Center for Environmental Assessment: Washington, DC, USA, 2011.
- Gholson, D.M.; Boellstorff, D.E.; Cummings, S.R.; Wagner, K.L.; Dozier, M.C. Consumer Water Quality Evaluation of Private and Public Drinking Water Sources. J. Water Health 2018, 16, 369–379. [Google Scholar] [CrossRef] [PubMed]
- US EPA, O. Emergency Response for Drinking Water and Wastewater Utilities. Available online: https://www.epa.gov/waterutilityresponse (accessed on 16 October 2023).
- Seliga, A.; Spayd, S.E.; Procopio, N.A.; Flanagan, S.V.; Gleason, J.A. Evaluating the Impact of Free Private Well Testing Outreach on Participants’ Private Well Stewardship in New Jersey. J. Water Health 2022, 20, 1–11. [Google Scholar] [CrossRef] [PubMed]
- NJDEP-Division of Water Supply & Geoscience. Available online: https://www.state.nj.us/dep/watersupply/pw_pwta.html (accessed on 1 August 2023).
- Eykelbosh, A.J. Review of Guidelines for Shock Chlorination in Private Wells; National Collaborating Centre for Environmental Health: Vancouver, BC, Canada, 2013. [Google Scholar]
- Pieper, K.J.; Rhoads, W.J.; Saucier, L.; Katner, A.; Barrett, J.R.; Edwards, M. Improving State-Level Emergency Well Disinfection Strategies in the United States. Sci. Total Environ. 2020, 720, 137451. [Google Scholar] [CrossRef]
- Gilliland, A.E.; Gholson, D.M.; Boellstorff, D.E.; Pieper, K.J.; Straif-Bourgeois, S.; Katner, A. Natural Disaster Emergency Response to Private Well User Needs: Evaluation of a Pilot Outreach Approach. J. Environ. Health 2020, 83, 16–24. [Google Scholar]
- Boellstorff, D.E.; Sanchez, R.; Ables, S. How Is Groundwater Quality Affected by Wellhead Impacts from Flooding during Natural Disasters? Texas Groundwater Protection Committee Groundwater Issues Subcommittee: Austin, TX, USA, 2021. [Google Scholar]
- Lothrop, N.; Wilkinson, S.T.; Verhougstraete, M.; Sugeng, A.; Loh, M.M.; Klimecki, W.; Beamer, P.I. Home Water Treatment Habits and Effectiveness in a Rural Arizona Community. Water 2015, 7, 1217–1231. [Google Scholar] [CrossRef]
- Roche, S.M.; Jones-Bitton, A.; Majowicz, S.E.; Pintar, K.D.M.; Allison, D. Investigating Public Perceptions and Knowledge Translation Priorities to Improve Water Safety for Residents with Private Water Supplies: A Cross-Sectional Study in Newfoundland and Labrador. BMC Public Health 2013, 13, 1225. [Google Scholar] [CrossRef]
- Teschke, K.; Bellack, N.; Shen, H.; Atwater, J.; Chu, R.; Koehoorn, M.; MacNab, Y.C.; Schreier, H.; Isaac-Renton, J.L. Water and Sewage Systems, Socio-Demographics, and Duration of Residence Associated with Endemic Intestinal Infectious Diseases: A Cohort Study. BMC Public Health 2010, 10, 767. [Google Scholar] [CrossRef]
- MacDonald, G.J.; Pieper, K.J. Strategies to Improve Private-Well Water Quality: A North Carolina Perspective. Environ. Health Perspect. 2017, 125, 076001. [Google Scholar] [CrossRef]
- Schuitema, G.; Hooks, T.; McDermott, F. Water Quality Perceptions and Private Well Management: The Role of Perceived Risks, Worry and Control. J. Environ. Manag. 2020, 267, 110654. [Google Scholar] [CrossRef] [PubMed]
- Fitzpatrick-Lewis, D.; Yost, J.; Ciliska, D.; Krishnaratne, S. Communication about Environmental Health Risks: A Systematic Review. Environ. Health 2010, 9, 67. [Google Scholar] [CrossRef] [PubMed]
- Ritter, L.A.; Sue, V.M. Introduction to Using Online Surveys. New Dir. Eval. 2007, 2007, 5–14. [Google Scholar] [CrossRef]
Disclaimer/Publisher’s Note: The statements, opinions and data contained in all publications are solely those of the individual author(s) and contributor(s) and not of MDPI and/or the editor(s). MDPI and/or the editor(s) disclaim responsibility for any injury to people or property resulting from any ideas, methods, instructions or products referred to in the content. |
© 2023 by the authors. Licensee MDPI, Basel, Switzerland. This article is an open access article distributed under the terms and conditions of the Creative Commons Attribution (CC BY) license (https://creativecommons.org/licenses/by/4.0/).