
Analyzing Temporal Patterns of Temperature, Precipitation, and Drought Incidents: A Comprehensive Study of Environmental Trends in the Upper Draa Basin, Morocco

 , ,
, ,  and
and
Abstract
:1. Introduction
2. Materials and Methods
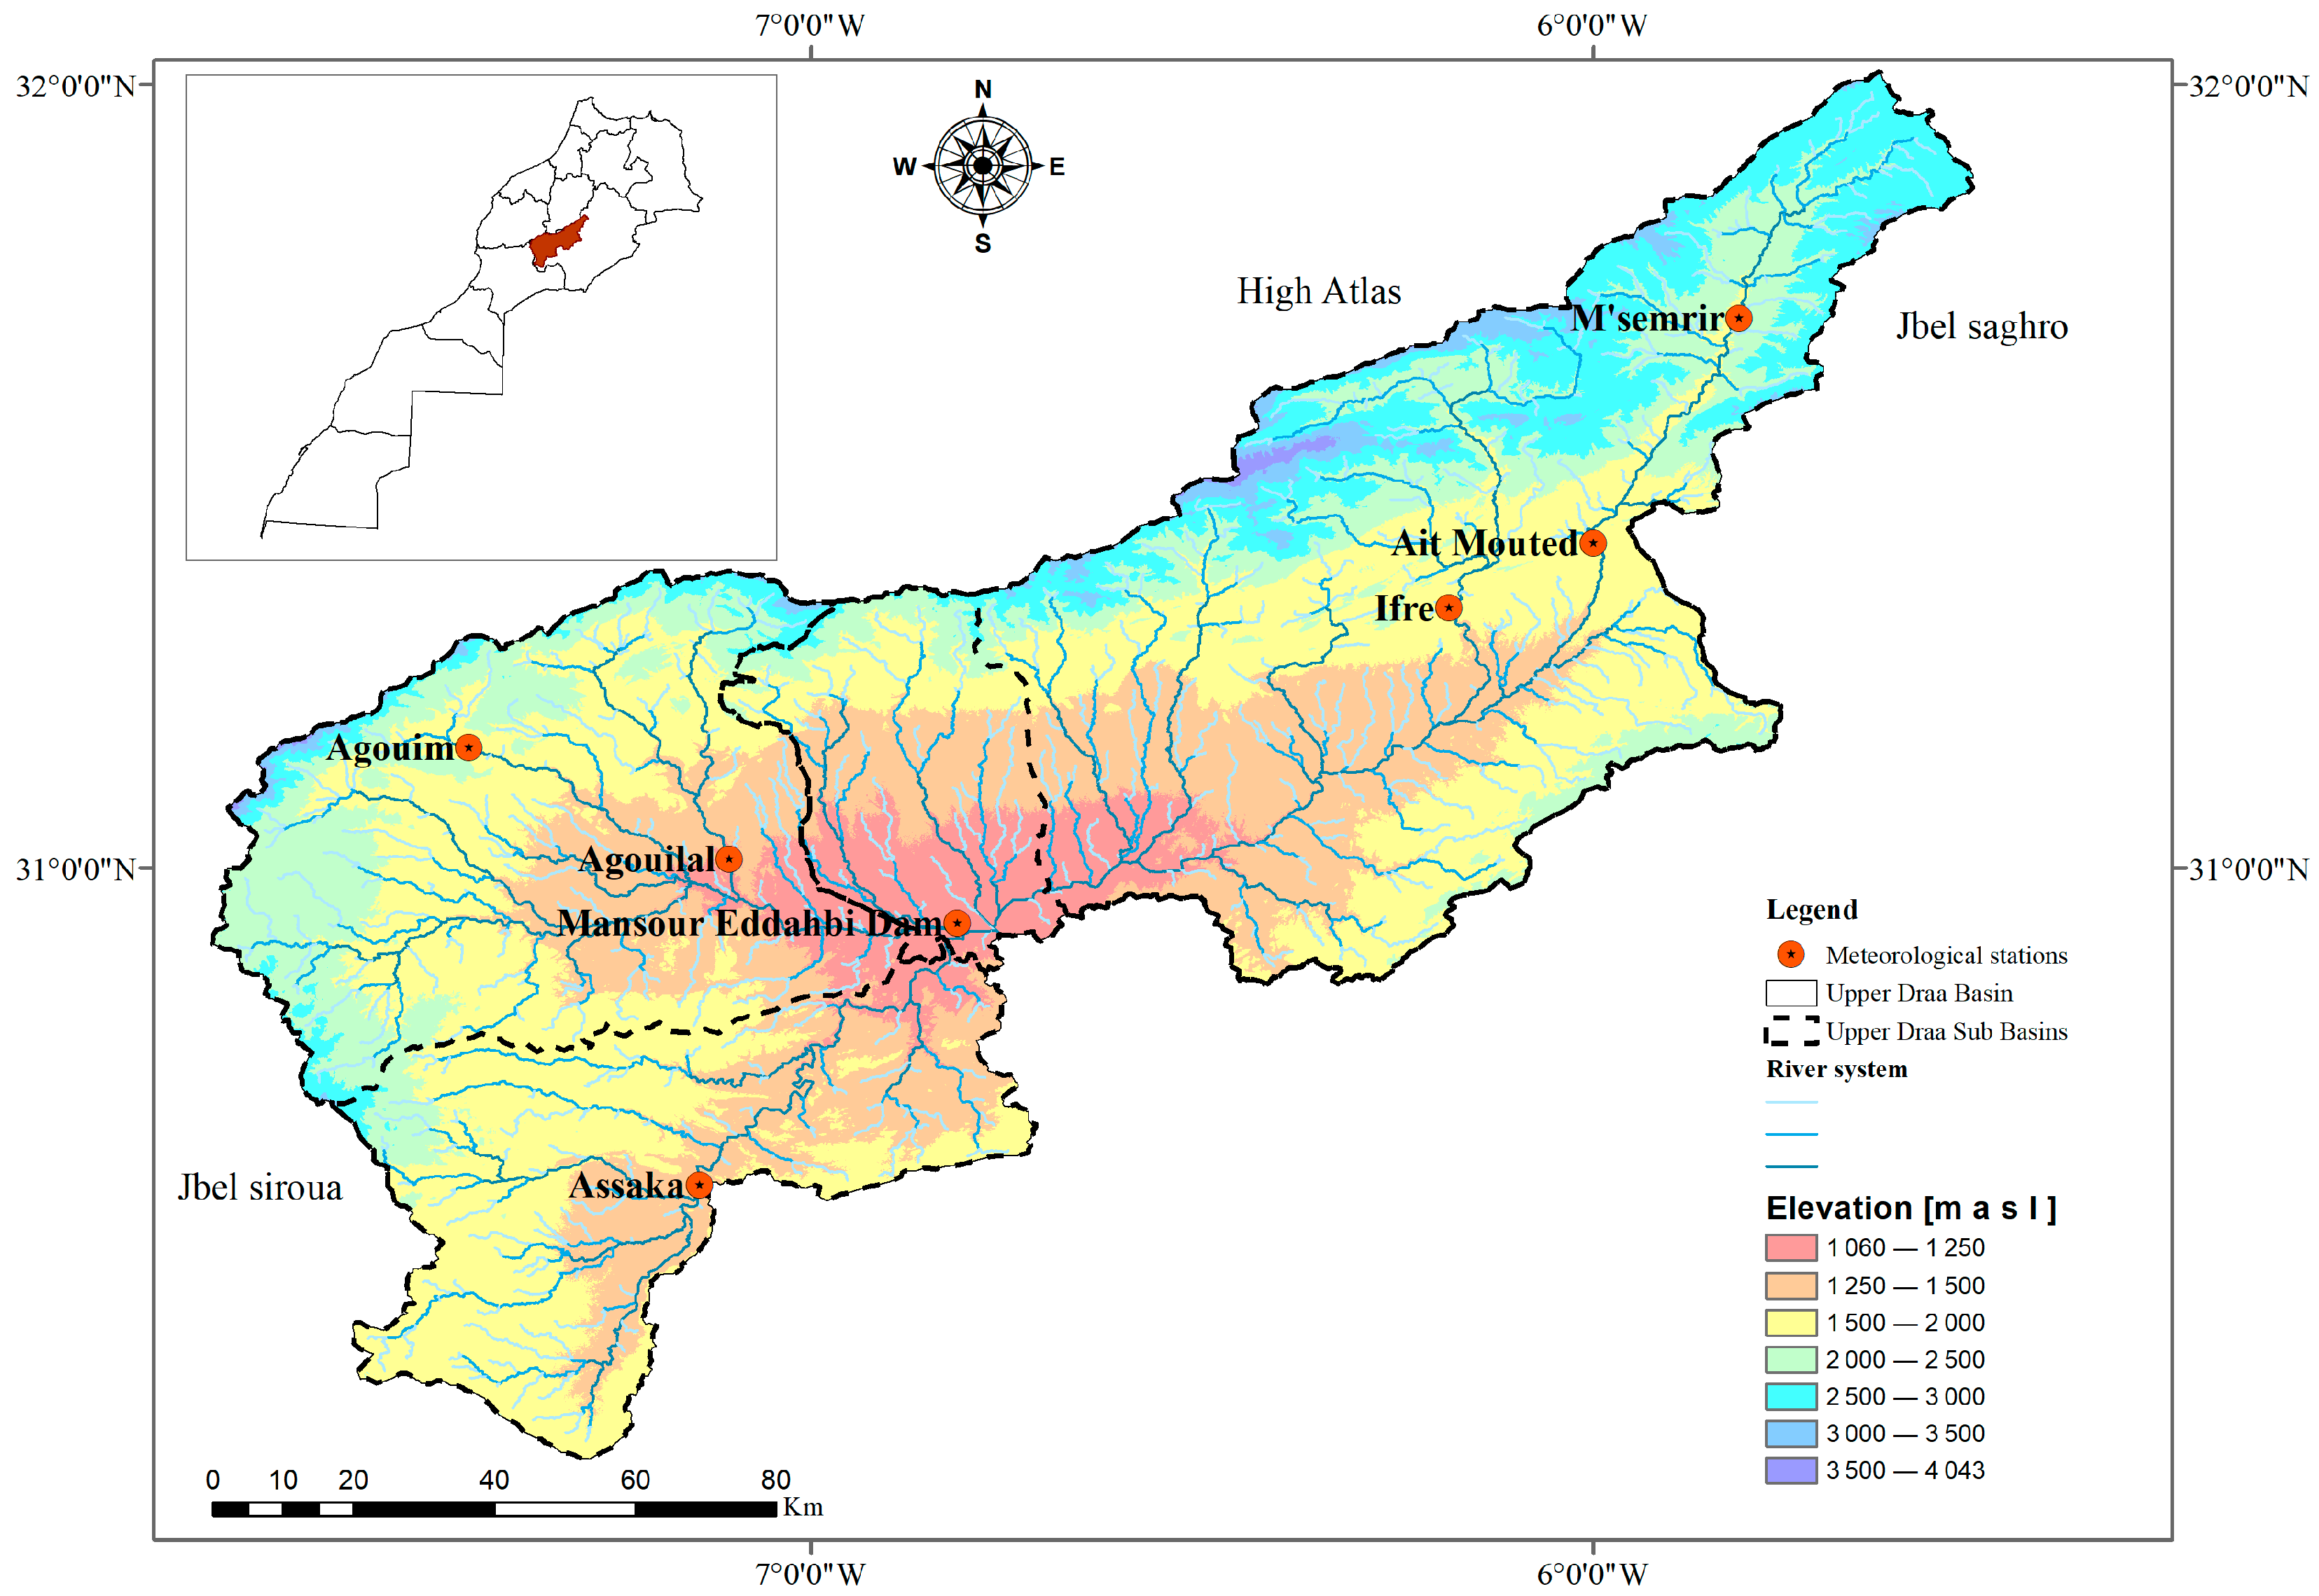
2.1. Study Area
2.2. Climate Data
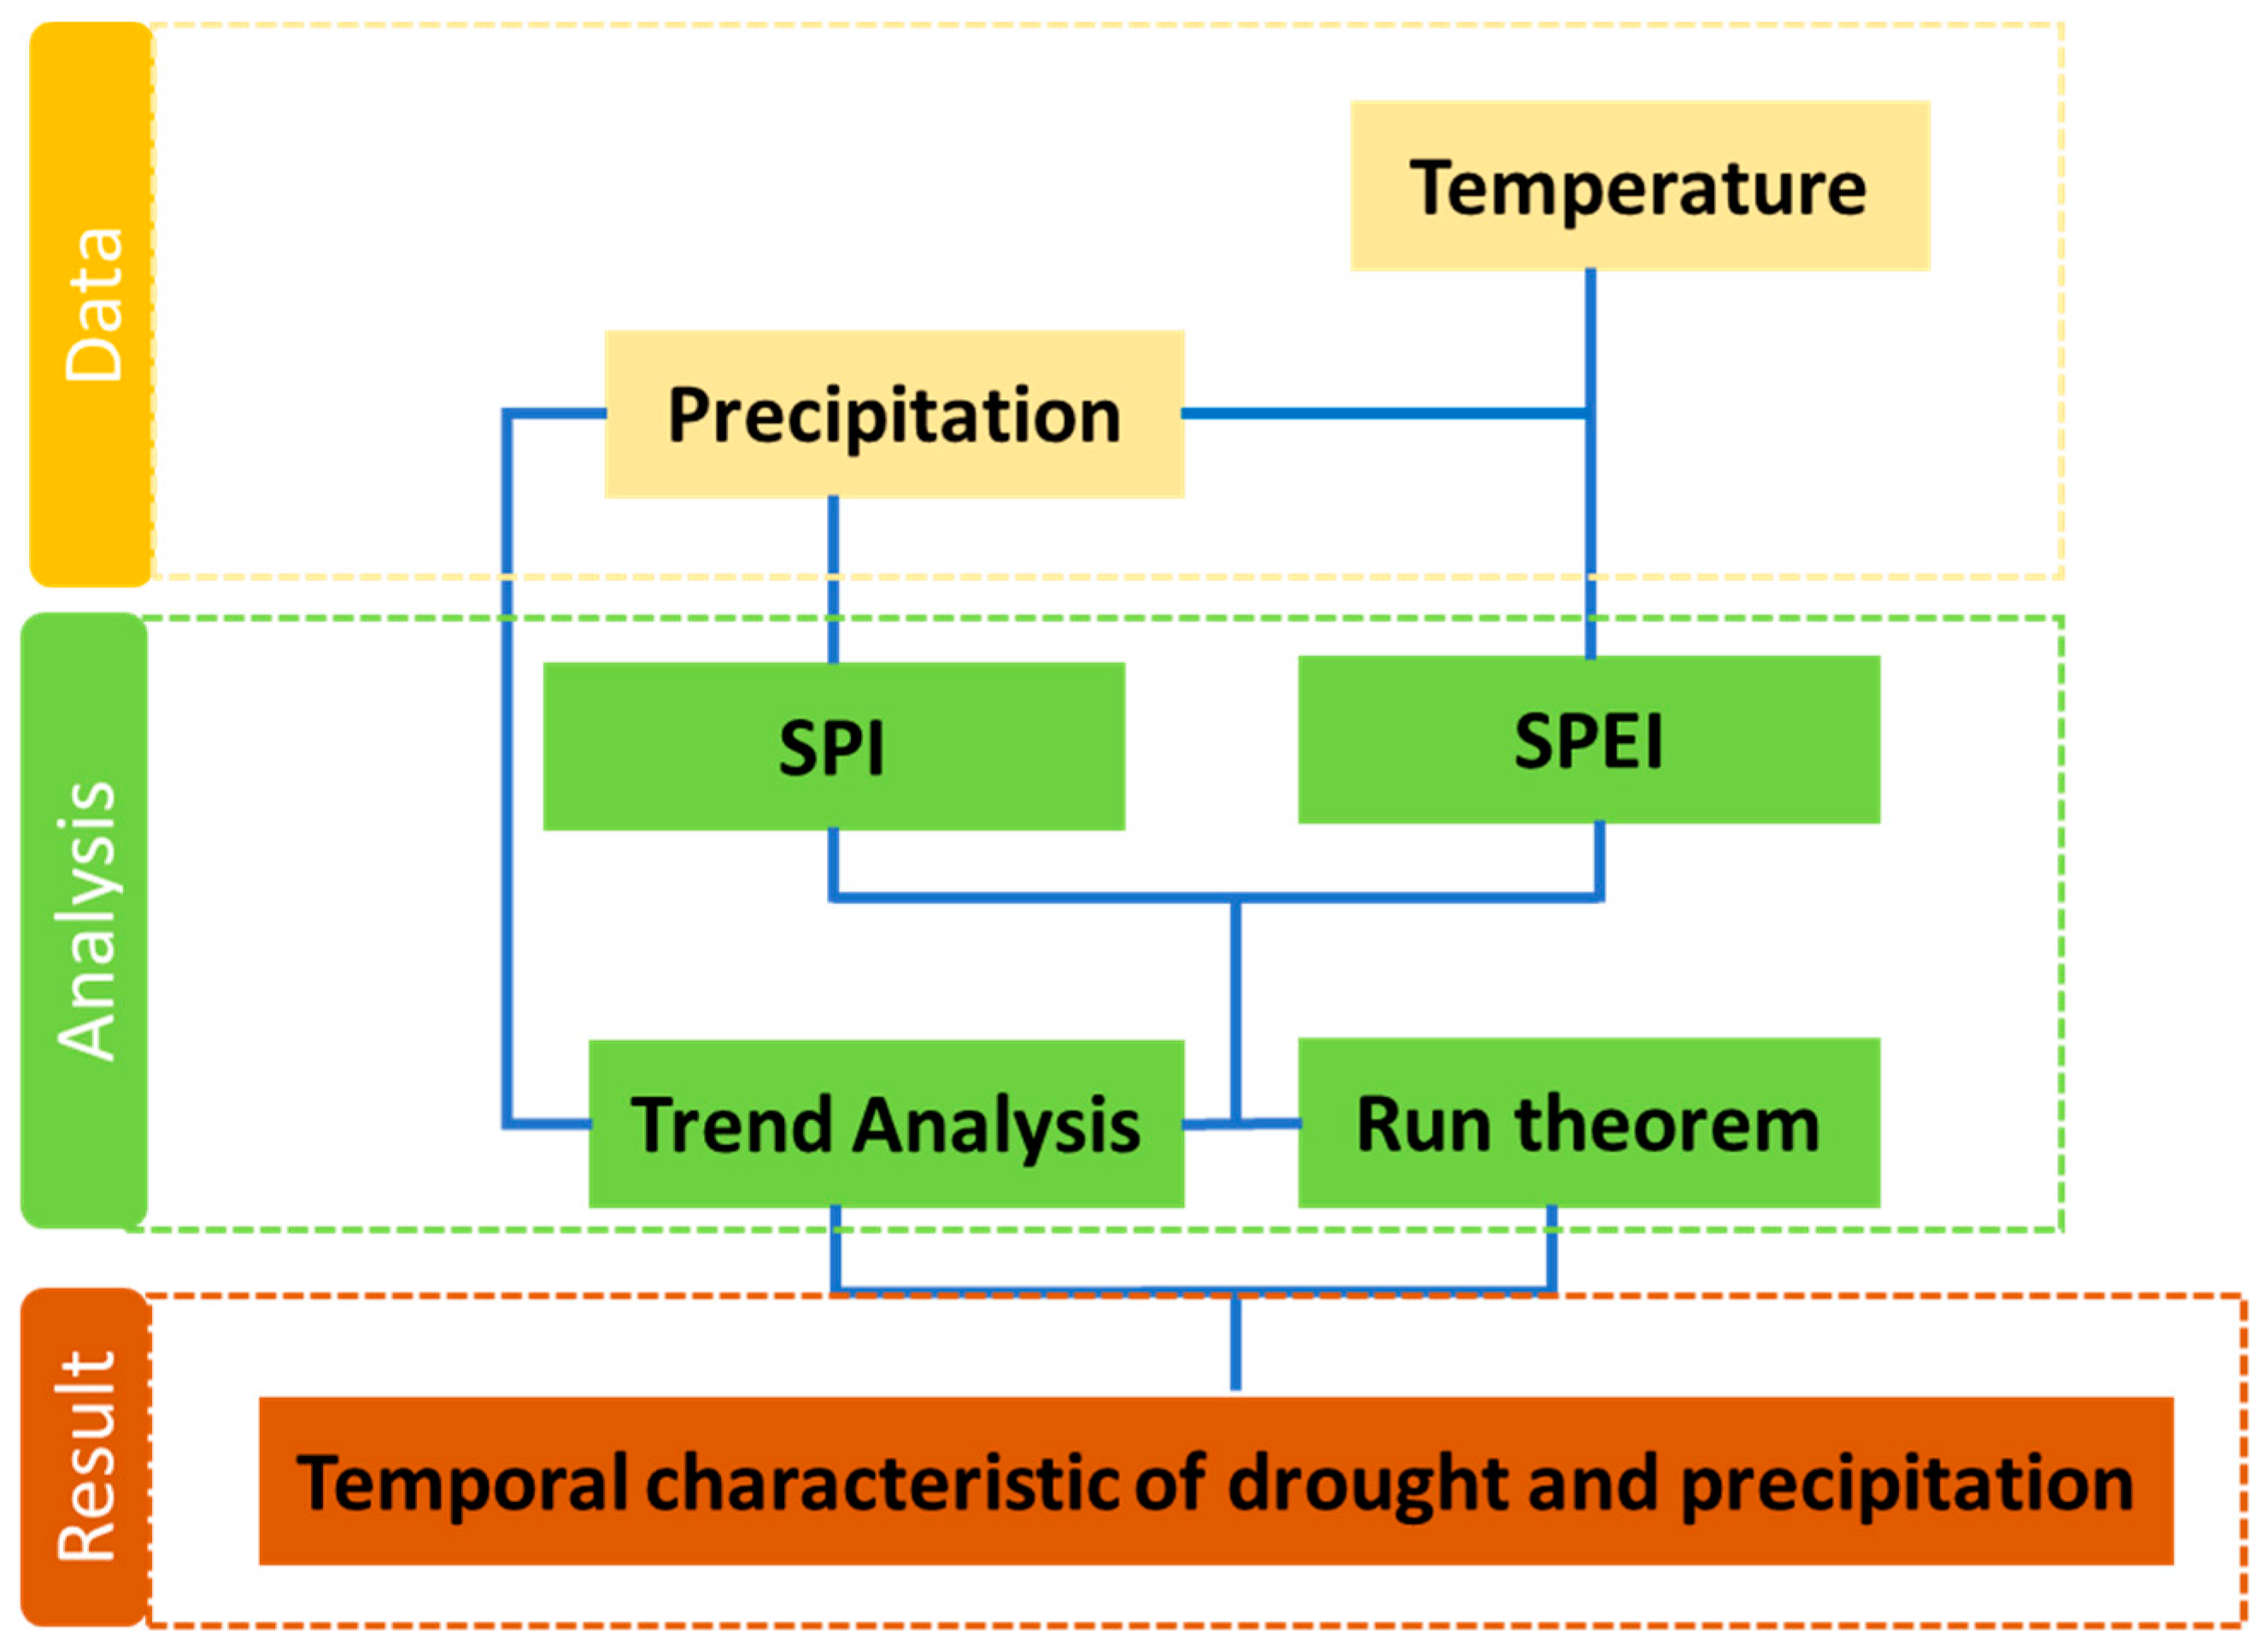
2.3. Methodology
2.3.1. Trend Analysis
2.3.2. Drought Indices Analysis
2.3.3. Drought Characterization
3. Results and Discussion
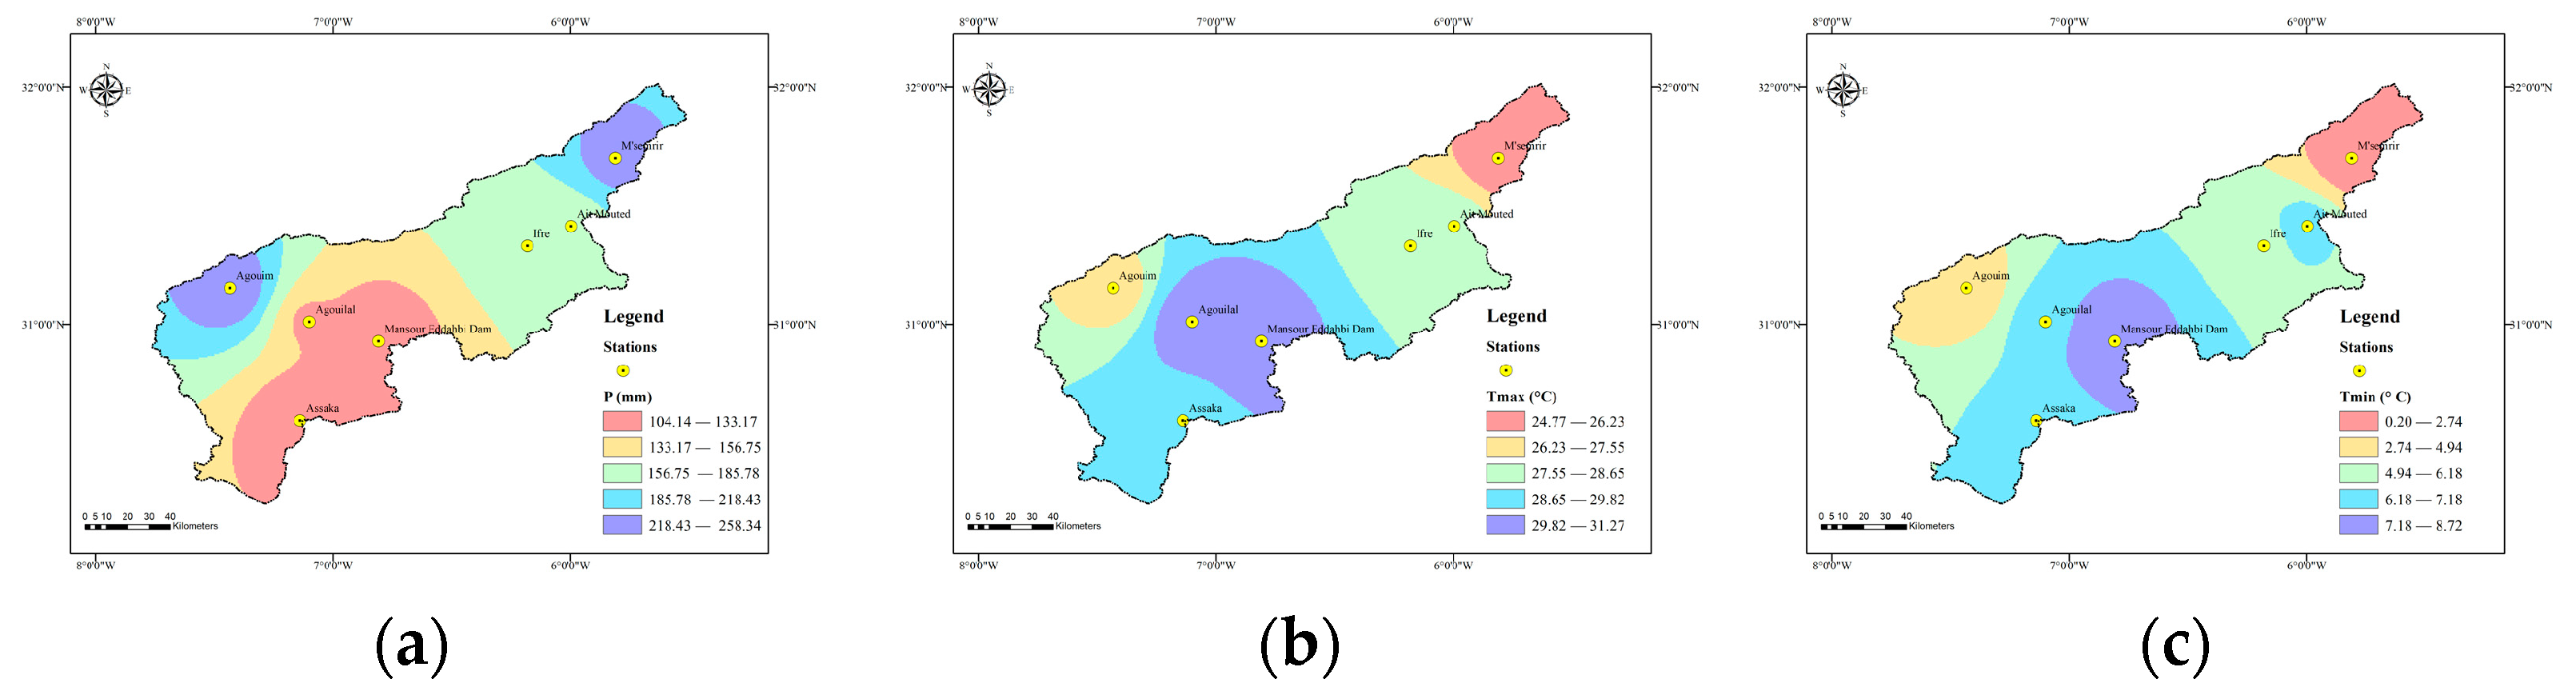
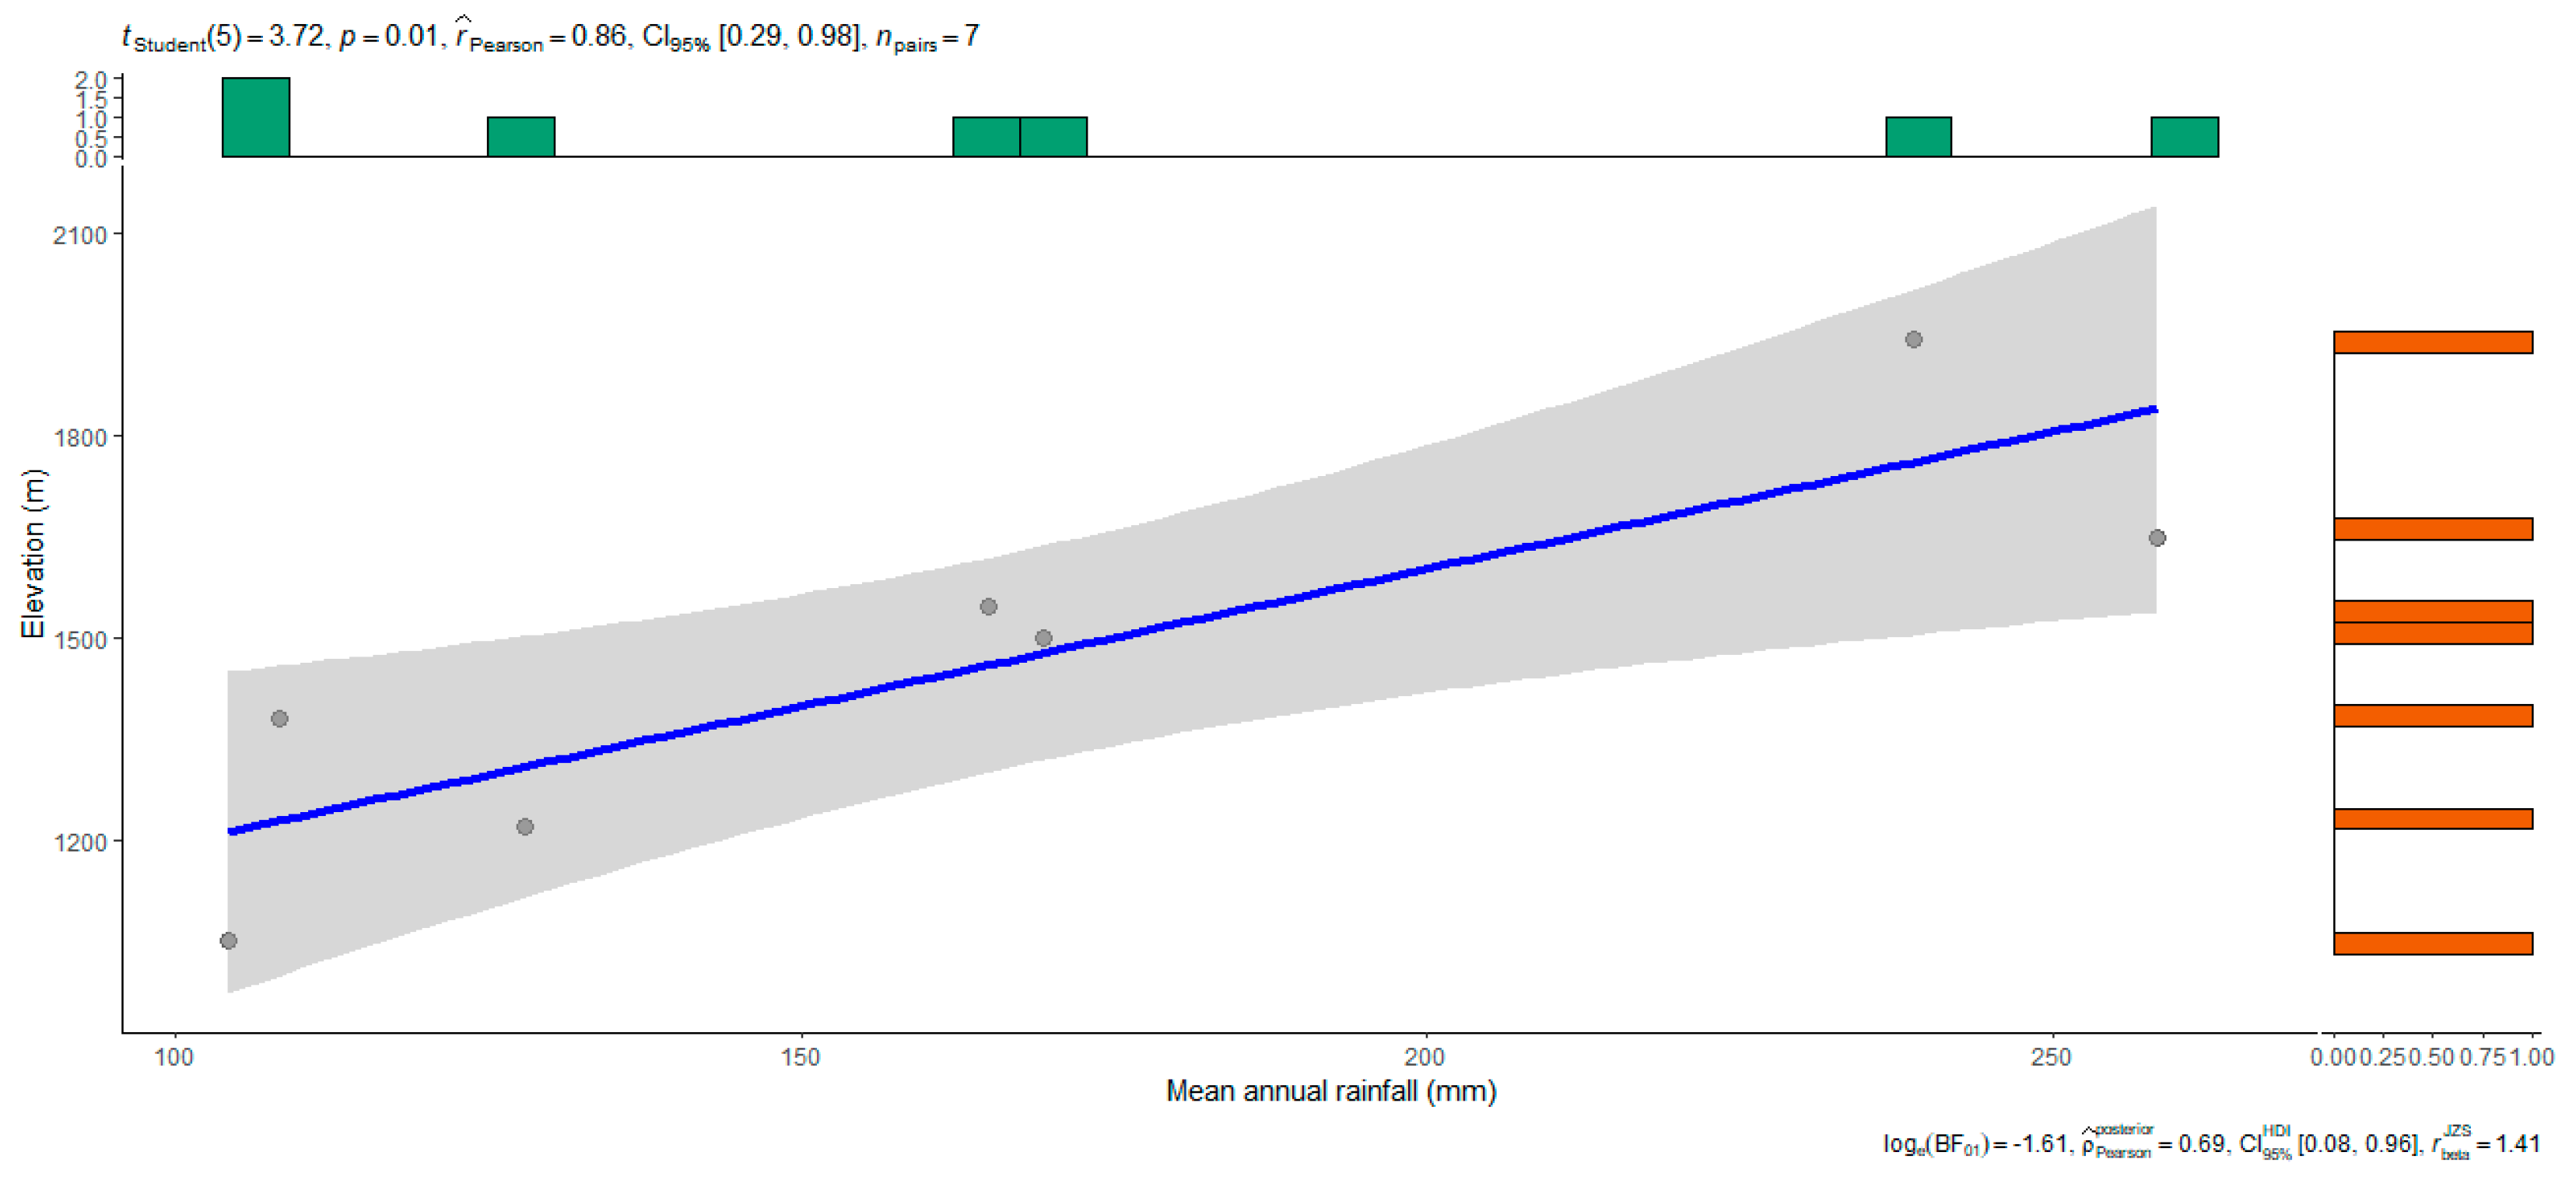
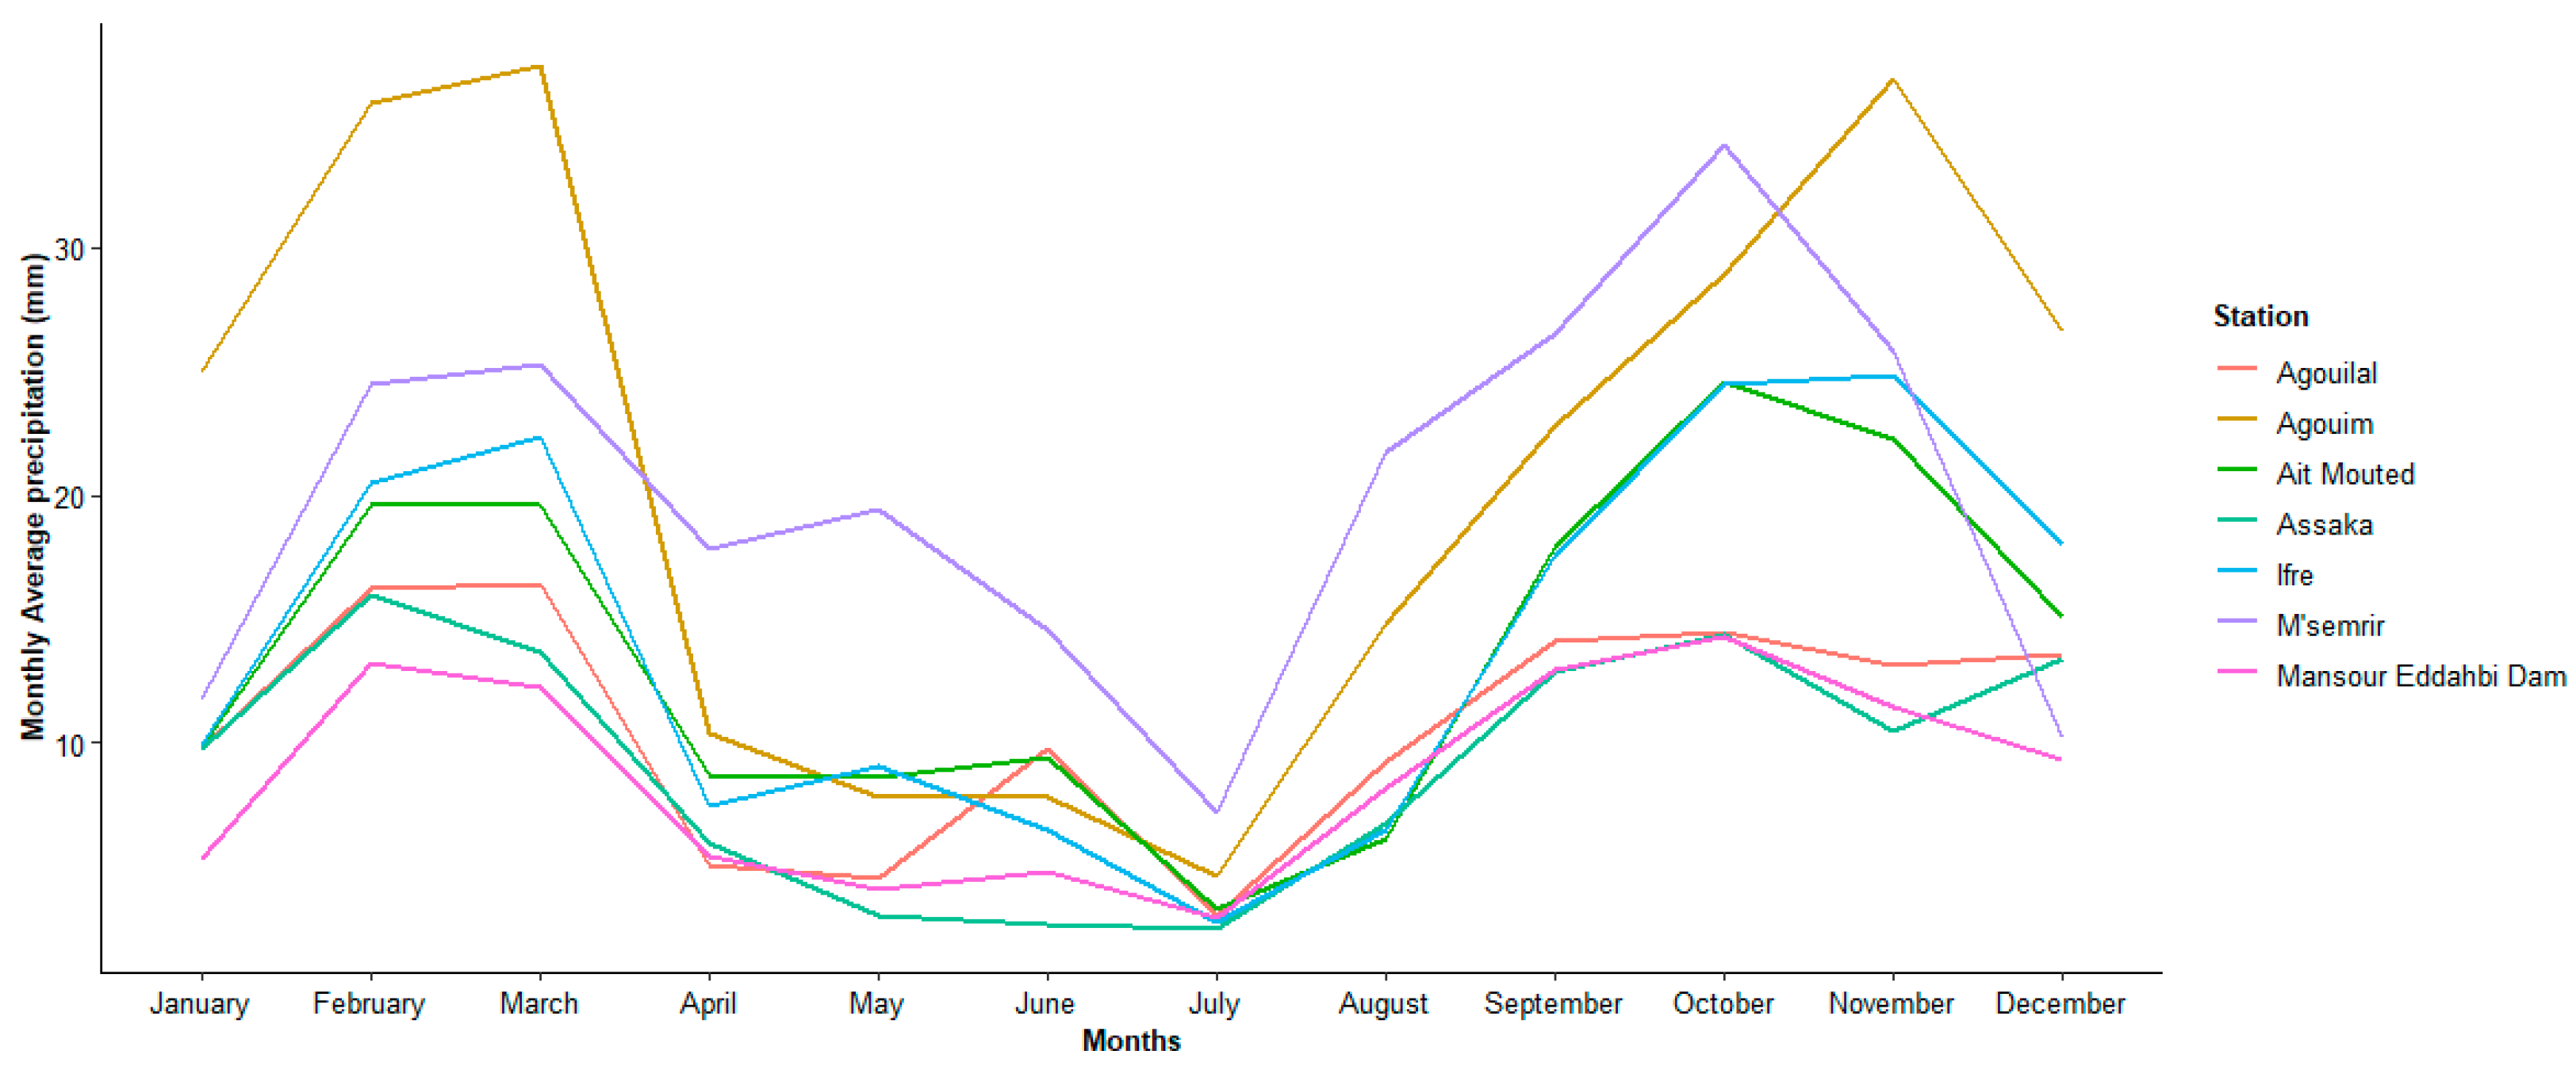
3.1. Rainfall and Temperature Variability
3.2. Annual and Monthly Trend Analysis
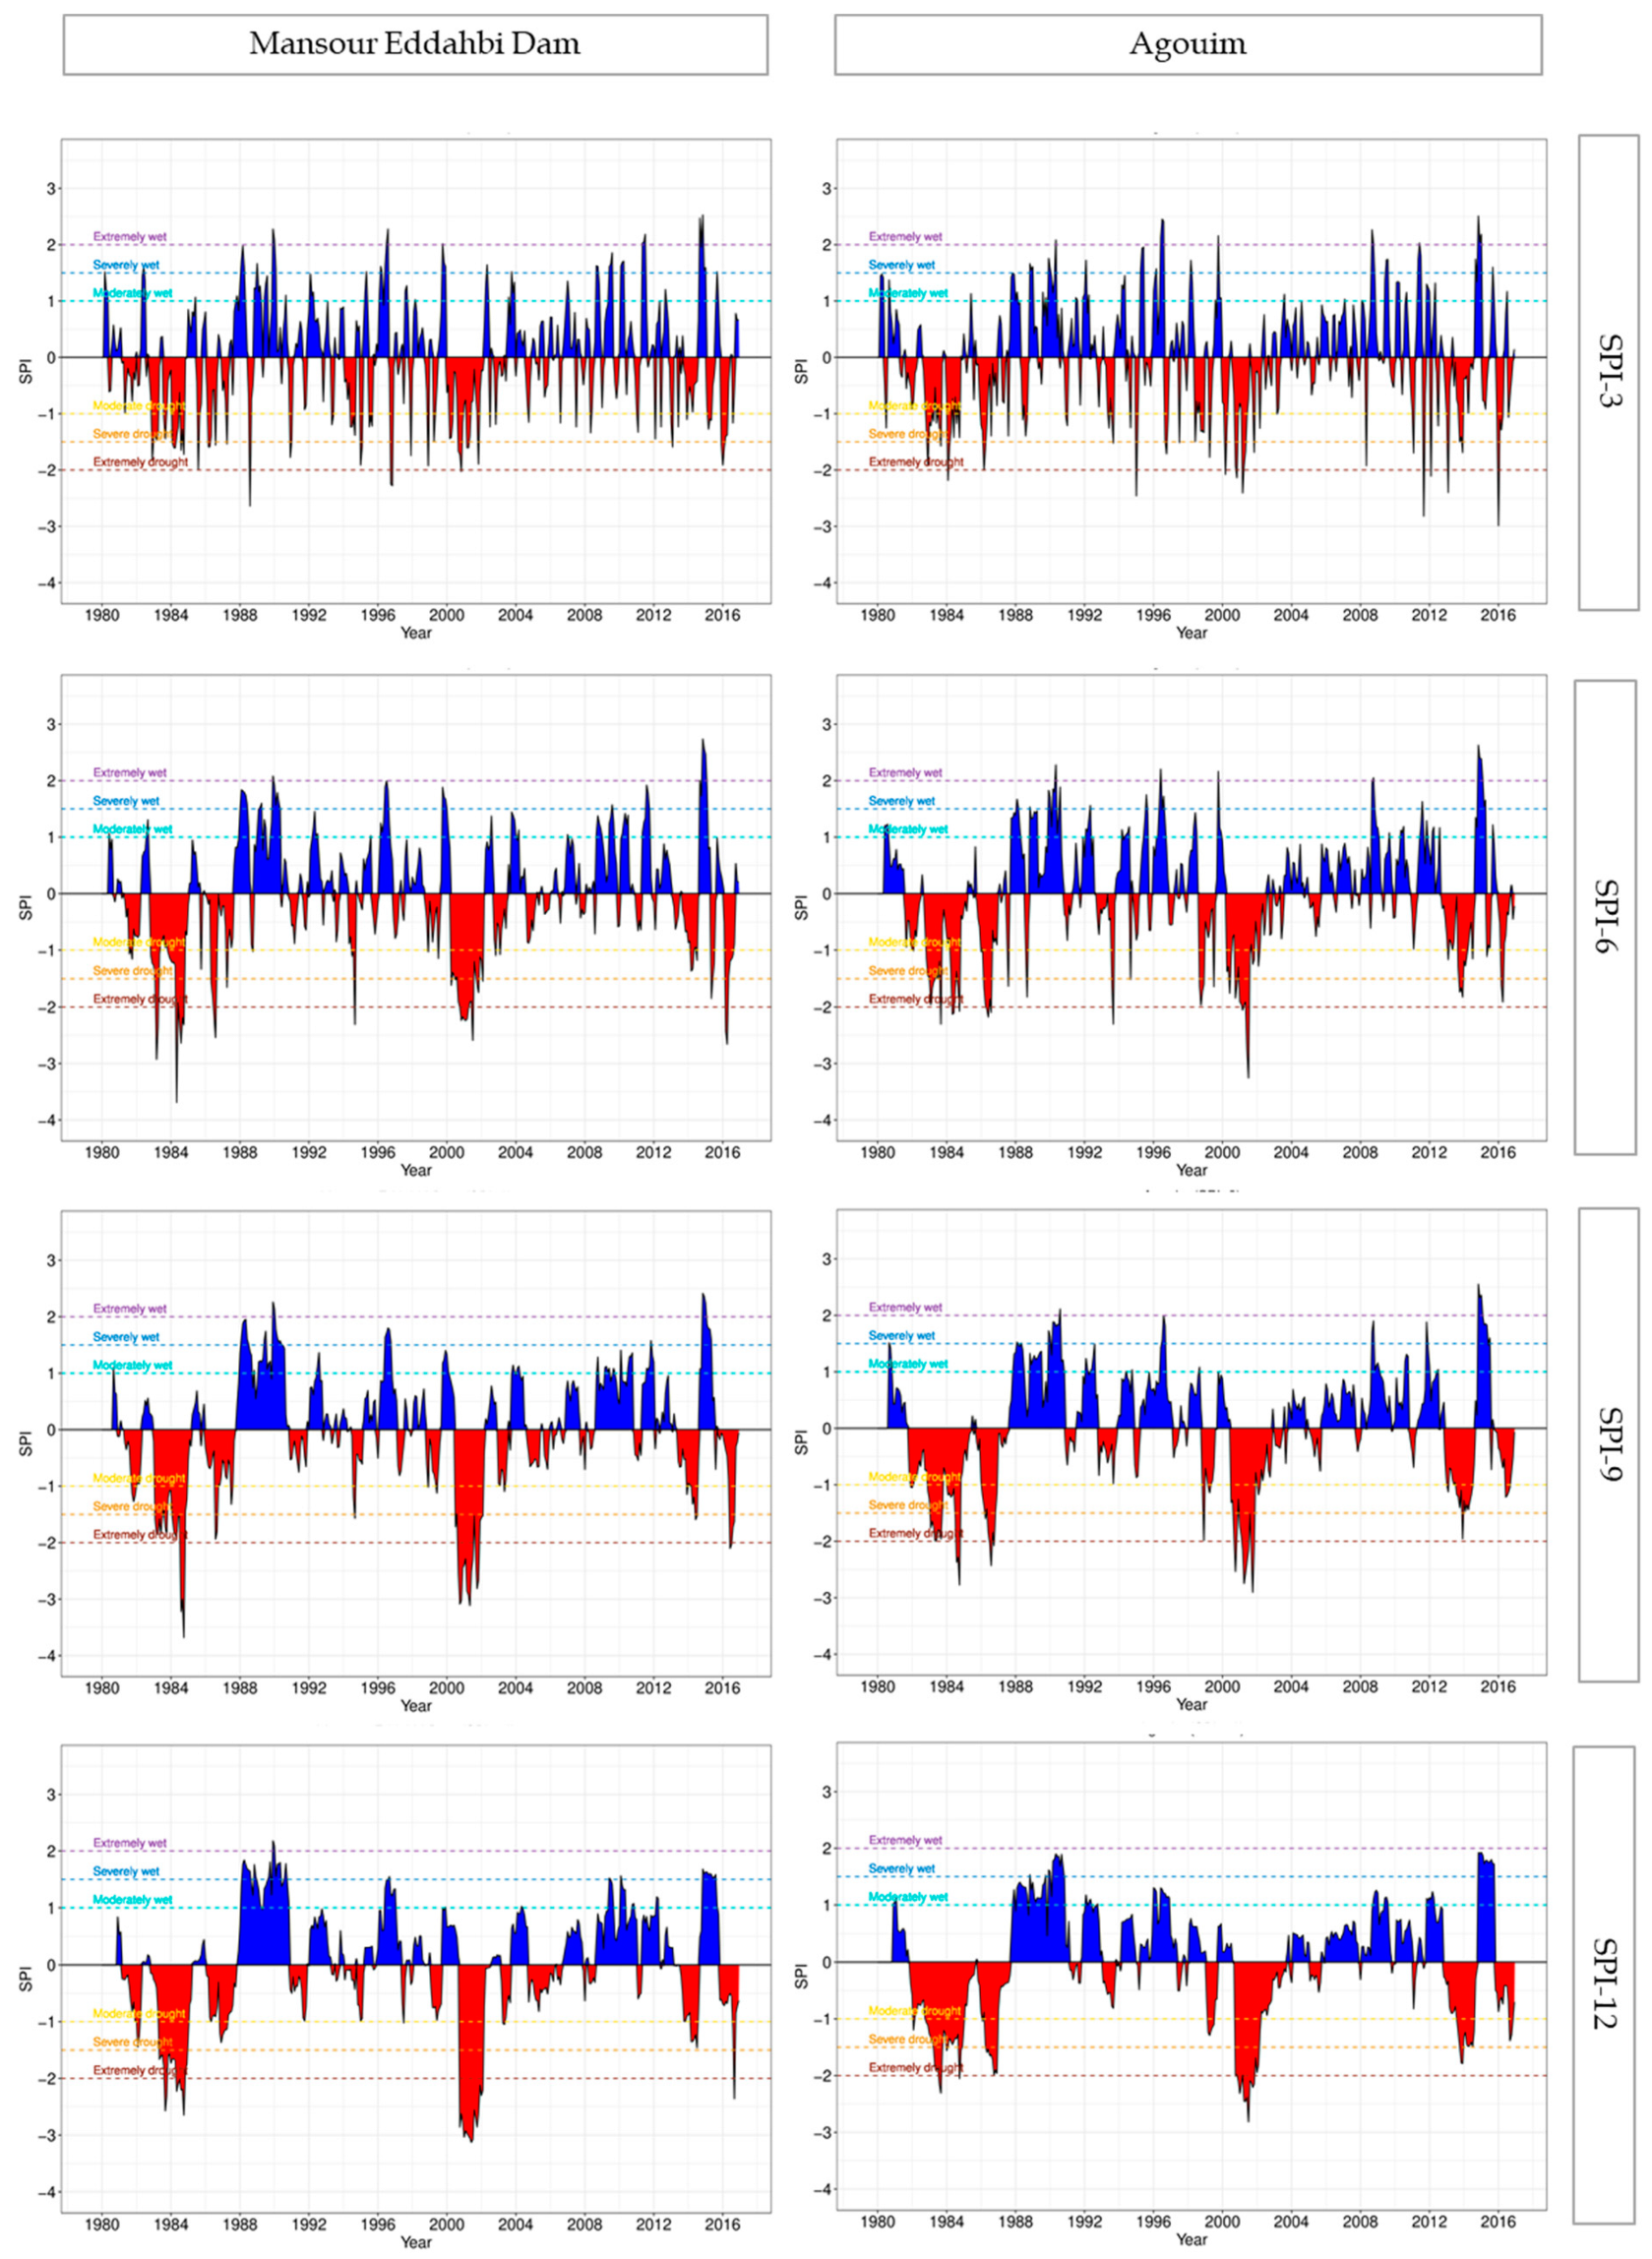
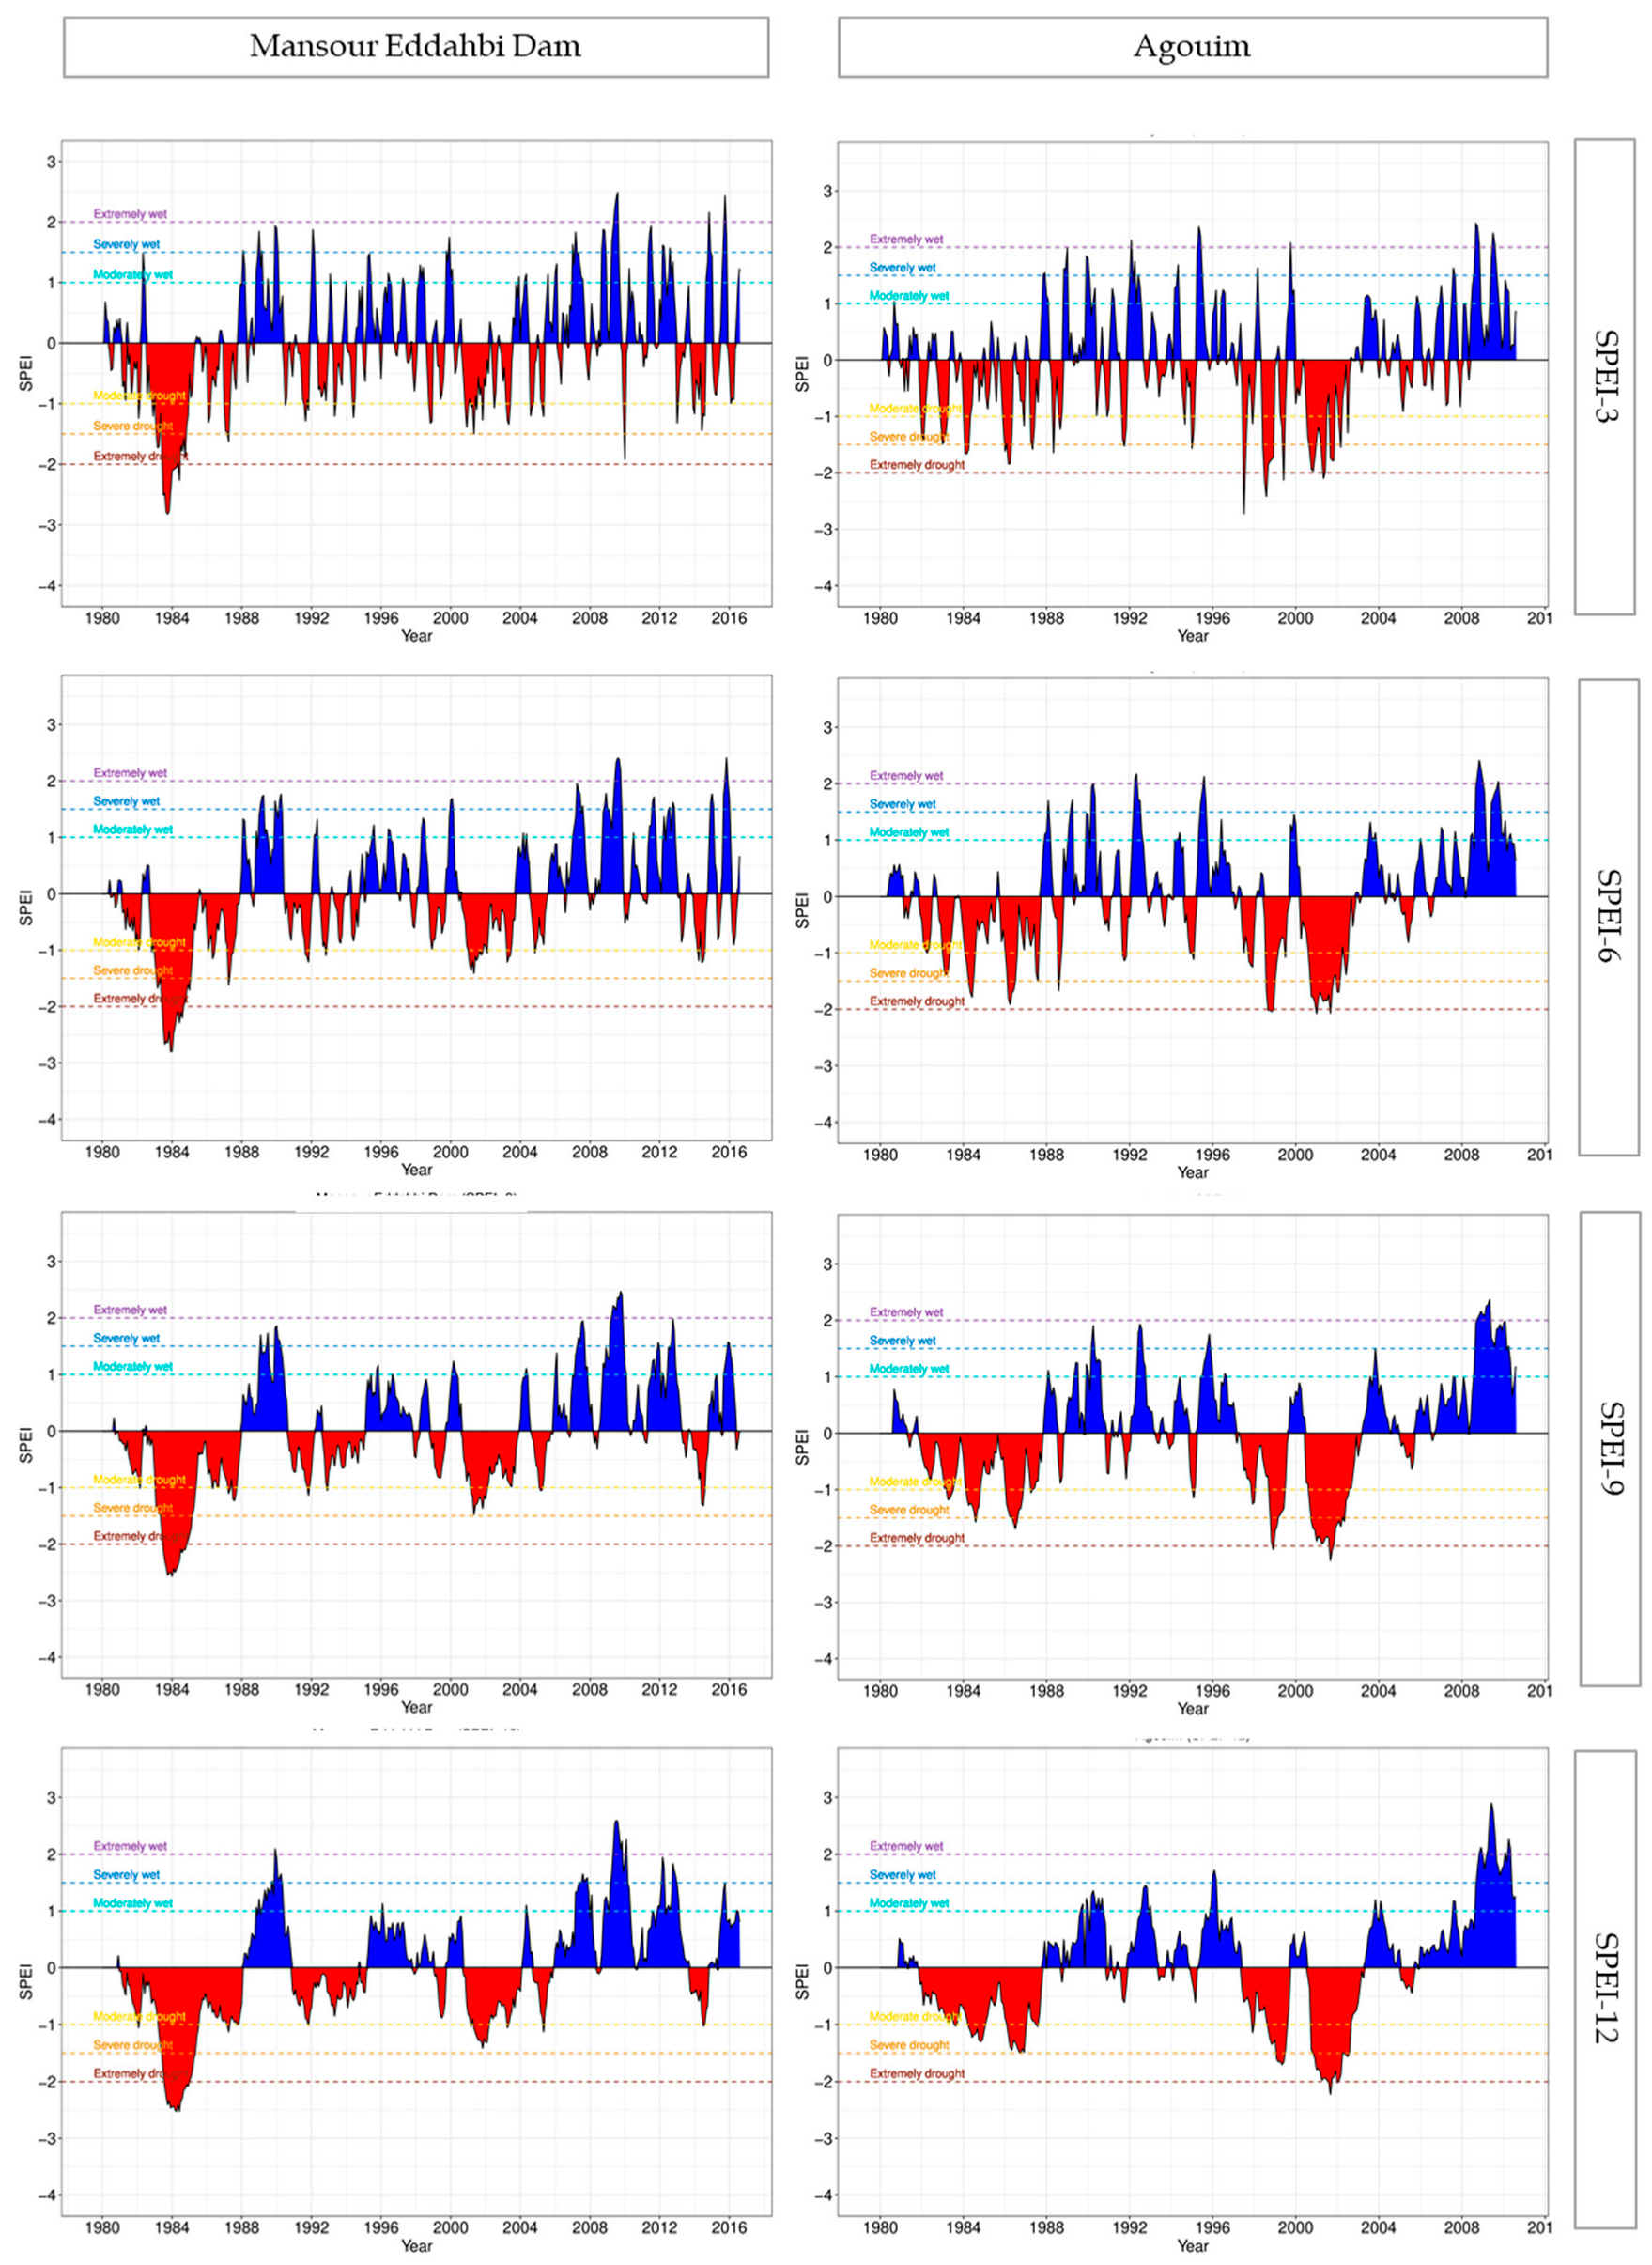
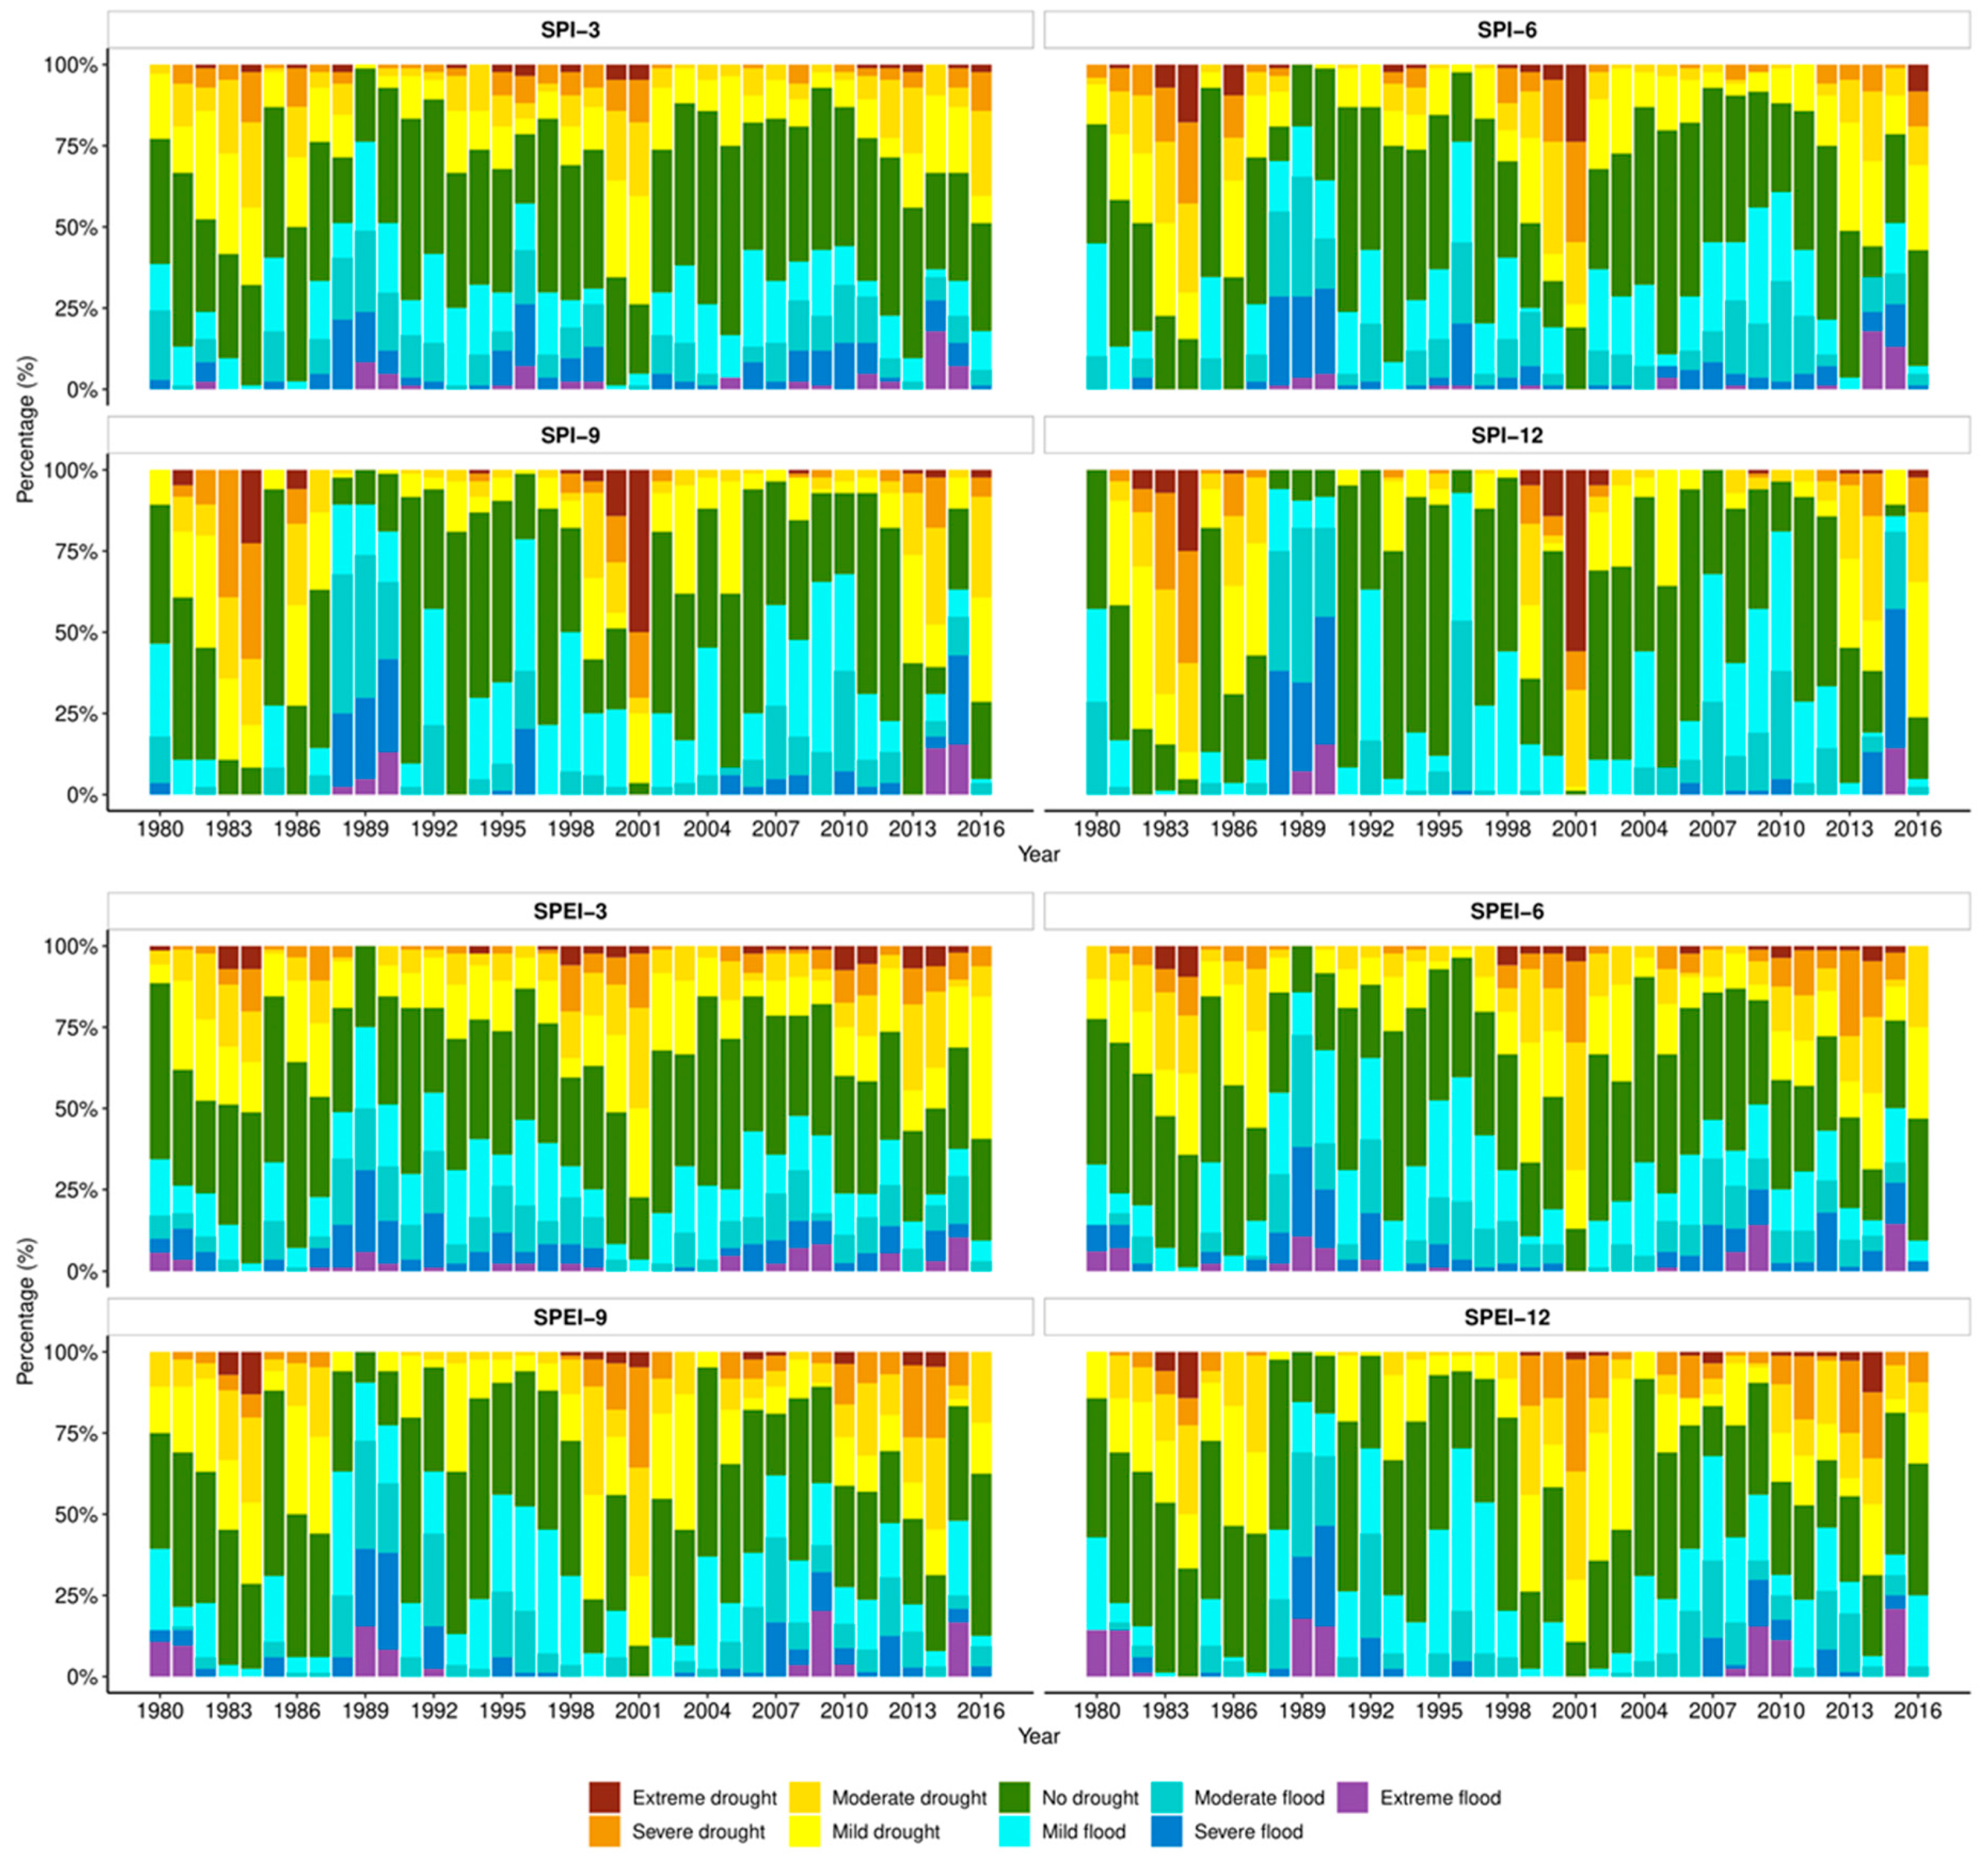
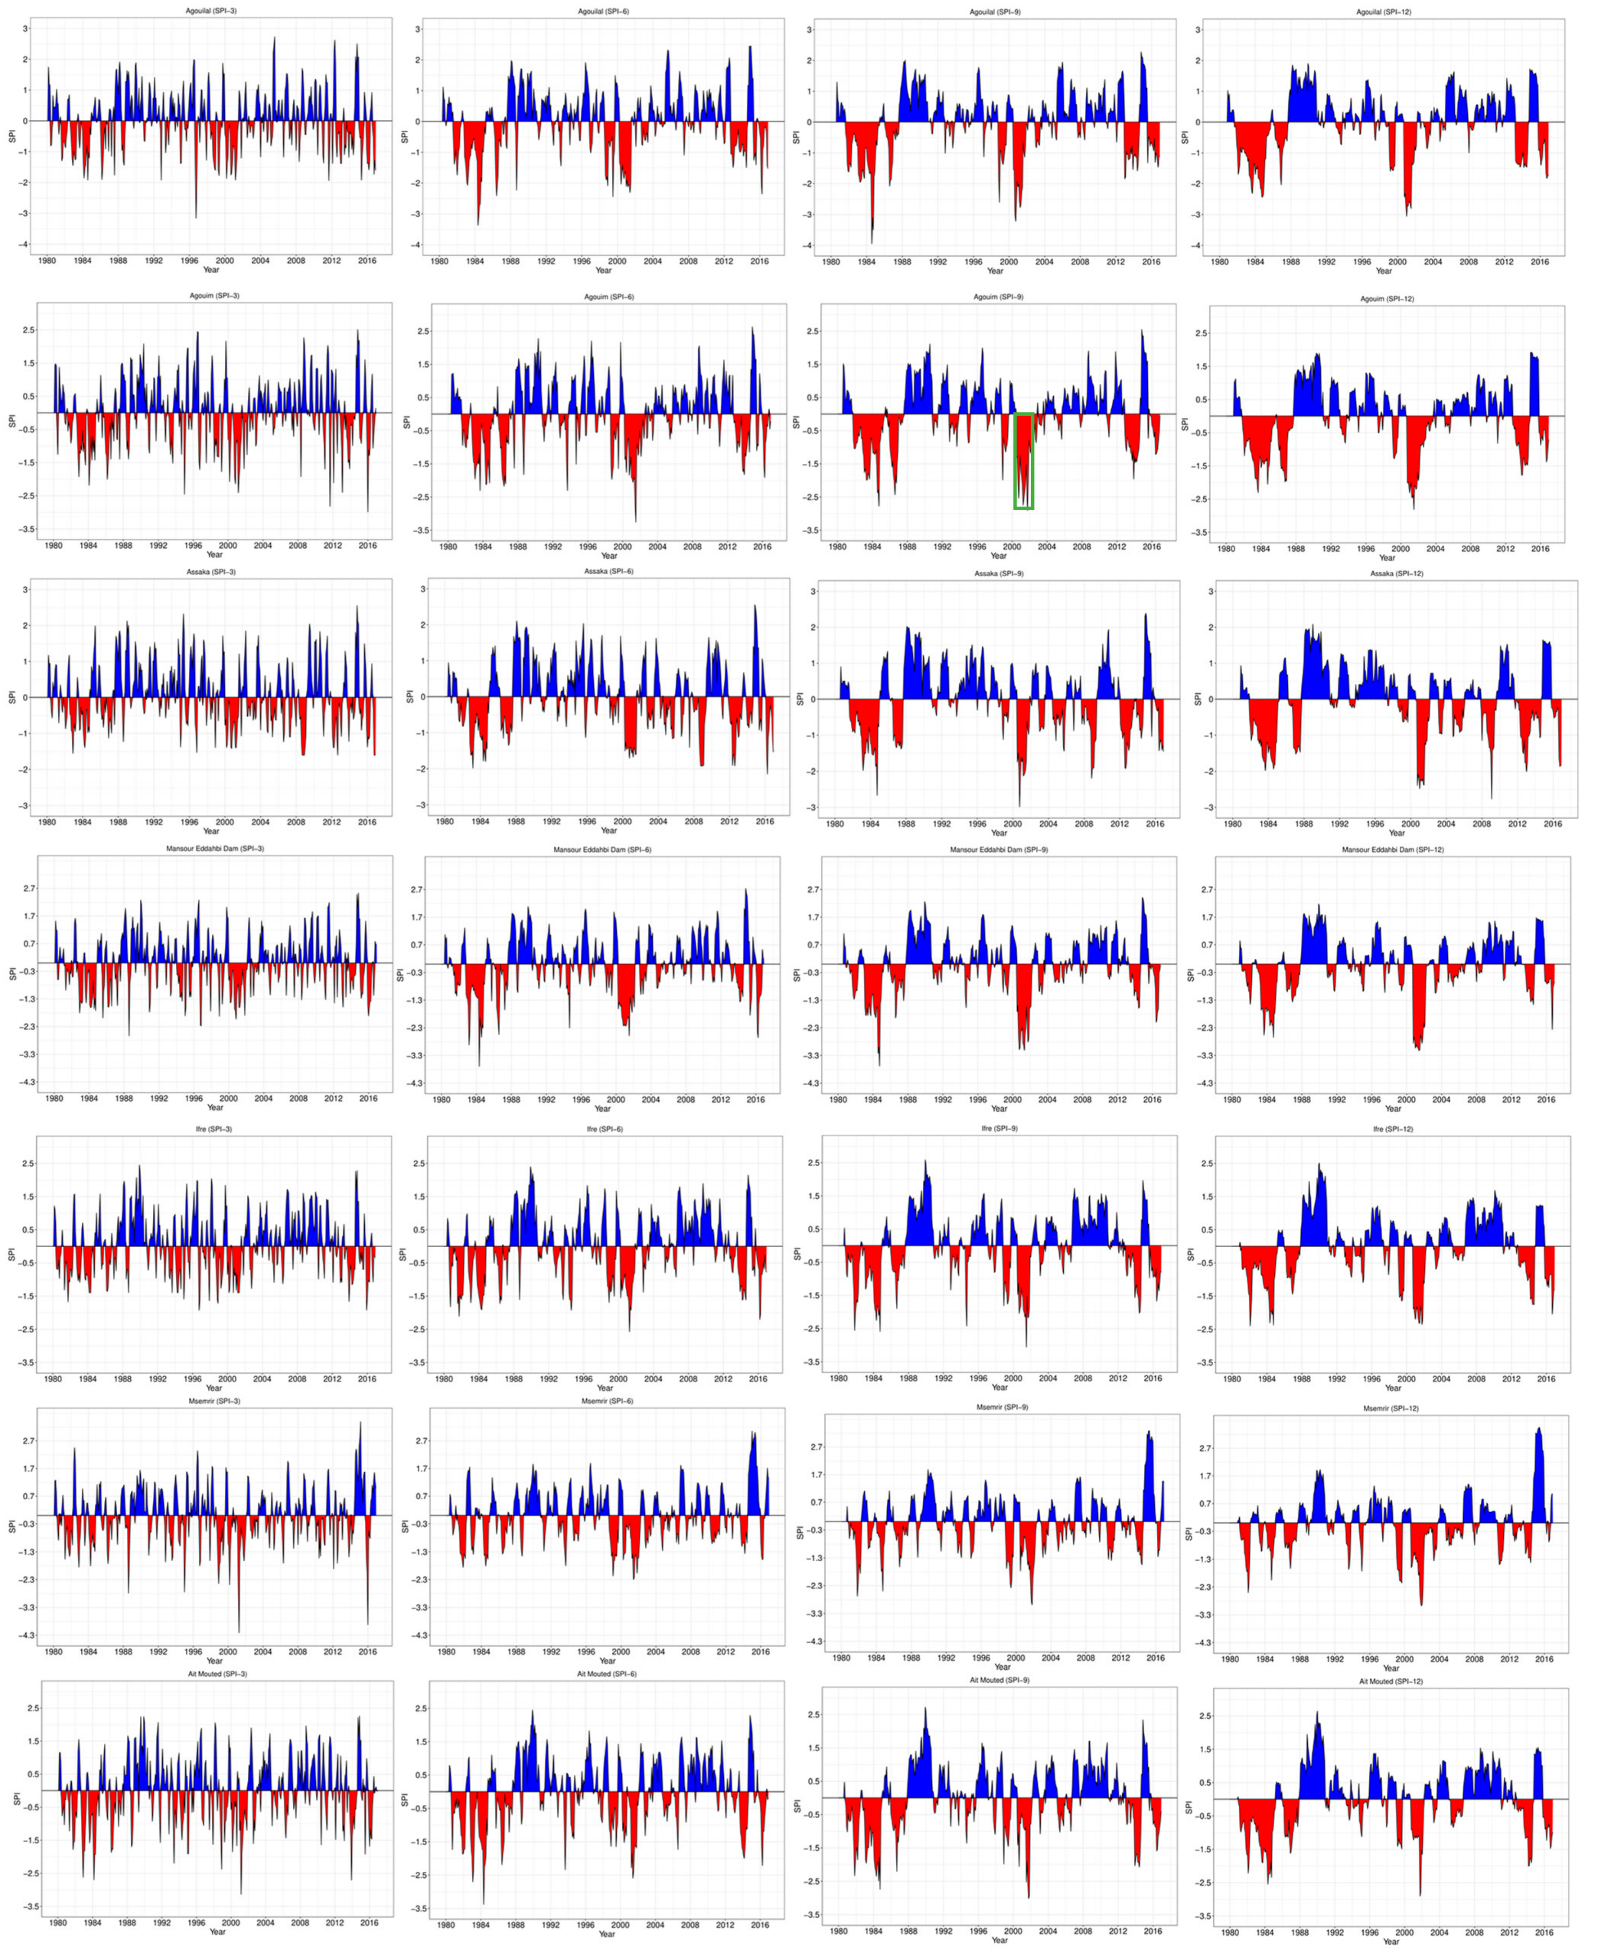
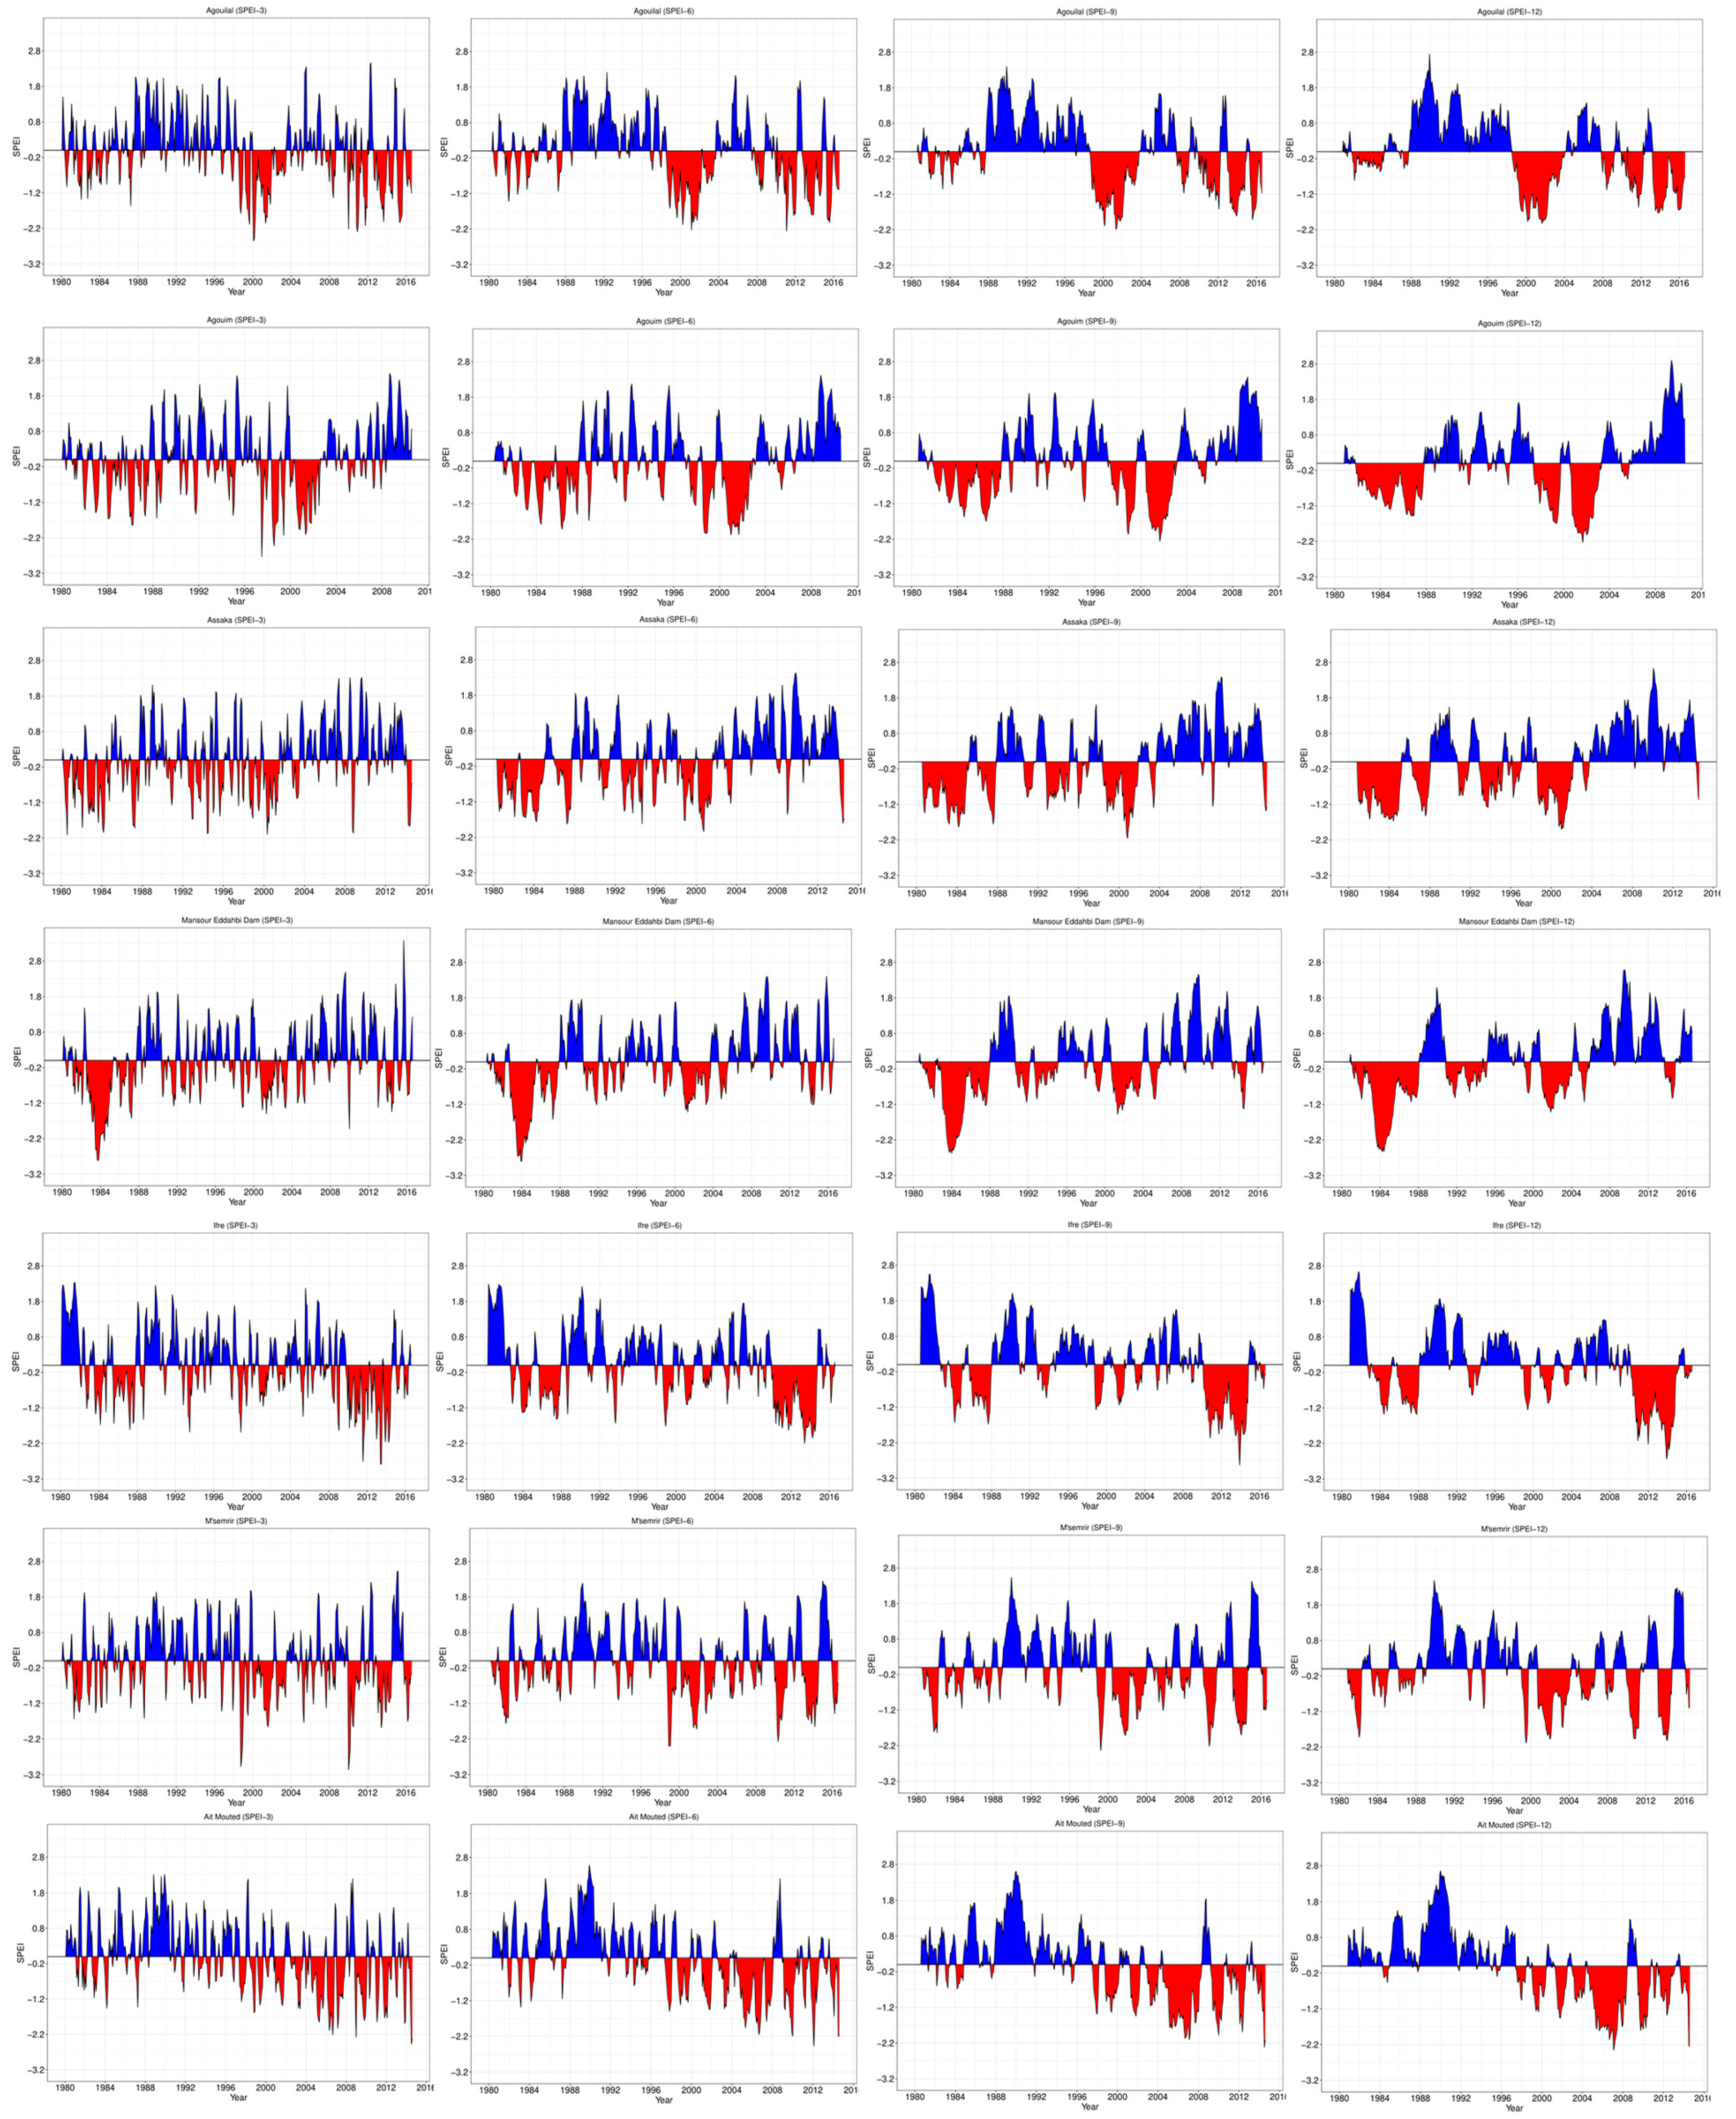
3.3. Analysis of Drought Characteristics
4. Conclusions
Author Contributions
Funding
Data Availability Statement
Conflicts of Interest
Appendix A

| Mansour Eddahbi Dam | Mann–Kendall Test | Sen’s Slope | M’semrir | Mann–Kendall Test | Sen’s Slope | ||||||
|---|---|---|---|---|---|---|---|---|---|---|---|
| Z | Kendall’s Tau | p-Value | Trend | Z | Kendall’s Tau | p-Value | Trend | ||||
| January | −0.96 | −0.12 | 0.34 | No trend | 0.00 | January | −1.38 | −0.16 | 0.17 | No trend | −0.20 |
| February | −1.07 | −0.13 | 0.29 | No trend | −0.01 | February | −0.47 | −0.06 | 0.64 | No trend | −0.07 |
| March | −0.14 | −0.02 | 0.89 | No trend | 0.00 | Mars | 1.35 | 0.16 | 0.18 | No trend | 0.41 |
| April | 0.74 | 0.09 | 0.46 | No trend | 0.00 | April | −0.68 | −0.08 | 0.50 | No trend | −0.06 |
| May | −0.72 | −0.09 | 0.47 | No trend | 0.00 | May | −0.18 | −0.02 | 0.85 | No trend | −0.03 |
| June | 0.59 | 0.07 | 0.56 | No trend | 0.00 | June | 0.18 | 0.02 | 0.85 | No trend | 0.02 |
| July | 1.02 | 0.13 | 0.31 | No trend | 0.00 | July | 1.79 | 0.21 | 0.07 | No trend | 0.10 |
| August | 1.78 | 0.21 | 0.08 | No trend | 0.18 | August | 0.73 | 0.09 | 0.46 | No trend | 0.20 |
| September | 1.01 | 0.12 | 0.31 | No trend | 0.16 | September | 1.77 | 0.20 | 0.08 | No trend | 0.63 |
| October | 1.27 | 0.15 | 0.20 | No trend | 0.12 | October | 0.60 | 0.07 | 0.55 | No trend | 0.18 |
| November | −0.89 | −0.11 | 0.37 | No trend | 0.00 | November | −0.17 | −0.02 | 0.86 | No trend | −0.01 |
| December | −0.15 | −0.02 | 0.88 | No trend | 0.00 | December | −0.75 | −0.09 | 0.45 | No trend | −0.08 |
| Assaka | Mann–Kendall Test | Sen’s Slope | Ifre | Mann–Kendall Test | Sen’s Slope | ||||||
| Z | Kendall’s Tau | p-Value | Trend | Z | Kendall’s Tau | p-Value | Trend | ||||
| January | −2.55 | −0.31 | 0.01 * | Trend detected | −0.07 | January | −0.86 | −0.11 | 0.39 | No trend | 0.00 |
| February | −1.50 | −0.18 | 0.13 | No trend | −0.03 | February | −0.86 | −0.10 | 0.39 | No trend | 0.00 |
| Mars | −0.20 | −0.02 | 0.84 | No trend | 0.00 | Mars | 0.67 | 0.08 | 0.50 | No trend | 0.11 |
| April | −2.12 | −0.26 | 0.03 * | Trend detected | 0.00 | April | −0.24 | −0.03 | 0.81 | No trend | 0.00 |
| May | −1.69 | −0.21 | 0.09 | No trend | 0.00 | May | −0.94 | −0.12 | 0.35 | No trend | 0.00 |
| June | −0.69 | −0.09 | 0.49 | No trend | 0.00 | June | 0.44 | 0.06 | 0.66 | No trend | 0.00 |
| July | −0.85 | −0.11 | 0.40 | No trend | 0.00 | July | −0.07 | −0.01 | 0.95 | No trend | 0.00 |
| August | 0.04 | 0.01 | 0.97 | No trend | 0.00 | August | −0.56 | −0.07 | 0.57 | No trend | 0.00 |
| September | 1.52 | 0.18 | 0.13 | No trend | 0.20 | September | 2.31 | 0.28 | 0.02 * | Trend detected | 0.37 |
| October | 0.16 | 0.02 | 0.87 | No trend | 0.00 | October | 1.16 | 0.14 | 0.25 | No trend | 0.20 |
| November | −1.40 | −0.17 | 0.16 | No trend | −0.05 | November | −0.25 | −0.03 | 0.80 | No trend | 0.00 |
| December | −0.43 | −0.05 | 0.67 | No trend | 0.00 | December | −0.79 | −0.10 | 0.43 | No trend | 0.00 |
| Agouim | Mann–Kendall Test | Sen’s Slope | Ait Mouted | Mann–Kendall Test | Sen’s Slope | ||||||
| Z | Kendall’s Tau | p-Value | Trend | Z | Kendall’s Tau | p-Value | Trend | ||||
| January | −0.55 | −0.06 | 0.58 | No trend | −0.12 | January | −0.84 | −0.10 | 0.40 | No trend | −0.03 |
| February | −0.87 | −0.10 | 0.39 | No trend | −0.30 | February | −0.49 | −0.06 | 0.63 | No trend | −0.01 |
| Mars | −0.56 | −0.07 | 0.57 | No trend | −0.19 | Mars | 0.98 | 0.11 | 0.33 | No trend | 0.20 |
| April | 0.53 | 0.07 | 0.59 | No trend | 0.00 | April | −0.88 | −0.11 | 0.38 | No trend | −0.05 |
| May | 0.28 | 0.03 | 0.78 | No trend | 0.00 | May | 0.34 | 0.04 | 0.73 | No trend | 0.00 |
| June | 1.37 | 0.17 | 0.17 | No trend | 0.00 | June | −0.16 | −0.02 | 0.87 | No trend | 0.00 |
| July | 1.63 | 0.19 | 0.10 | No trend | 0.06 | July | 0.97 | 0.12 | 0.33 | No trend | 0.00 |
| August | 1.83 | 0.22 | 0.07 | No trend | 0.23 | August | 0.88 | 0.10 | 0.38 | No trend | 0.05 |
| September | 1.06 | 0.12 | 0.29 | No trend | 0.20 | September | 2.32 | 0.27 | 0.02 * | Trend detected | 0.49 |
| October | 0.43 | 0.05 | 0.67 | No trend | 0.10 | October | 1.37 | 0.16 | 0.17 | No trend | 0.31 |
| November | −0.49 | −0.06 | 0.63 | No trend | −0.12 | November | −0.04 | −0.01 | 0.97 | No trend | 0.00 |
| December | −0.81 | −0.10 | 0.42 | No trend | −0.07 | December | −0.87 | −0.10 | 0.38 | No trend | −0.07 |
| Agouilal | Mann–Kendall Test | Sen’s Slope | |||||||||
| Z | Kendall’s Tau | p-Value | Trend | ||||||||
| January | −1.15 | −0.14 | 0.25 | No trend | 0.00 | ||||||
| February | −1.04 | −0.13 | 0.30 | No trend | −0.03 | ||||||
| Mars | 0.00 | 0.00 | 1.00 | No trend | 0.00 | ||||||
| April | 0.46 | 0.06 | 0.64 | No trend | 0.00 | ||||||
| May | −0.58 | −0.07 | 0.56 | No trend | 0.00 | ||||||
| June | −0.01 | 0.00 | 0.99 | No trend | 0.00 | ||||||
| July | 0.29 | 0.04 | 0.77 | No trend | 0.00 | ||||||
| August | 0.38 | 0.05 | 0.70 | No trend | 0.04 | ||||||
| September | 1.54 | 0.18 | 0.12 | No trend | 0.25 | ||||||
| October | 0.41 | 0.05 | 0.68 | No trend | 0.02 | ||||||
| November | −1.20 | −0.15 | 0.23 | No trend | −0.03 | ||||||
| December | −0.45 | −0.06 | 0.65 | No trend | 0.00 | ||||||
| Mansour Eddahbi Dam | Mann–Kendall Test | Sen’s Slope | M’semrir | Mann–Kendall Test | Sen’s Slope | ||||||
|---|---|---|---|---|---|---|---|---|---|---|---|
| Z | Kendall’s Tau | p-Value | Trend | Z | Kendall’s Tau | p-Value | Trend | ||||
| January | 3.17 | 0.37 | 0.002 * | Trend detected | 0.10 | January | 1.48 | 0.18 | 0.14 | No trend | 0.03 |
| February | 1.60 | 0.19 | 0.11 | No trend | 0.05 | February | −0.90 | −0.11 | 0.37 | No trend | −0.04 |
| Mars | 2.34 | 0.27 | 0.02 * | Trend detected | 0.09 | Mars | −0.76 | −0.09 | 0.45 | No trend | −0.03 |
| April | 2.74 | 0.32 | 0.006 * | Trend detected | 0.10 | April | 0.29 | 0.04 | 0.77 | No trend | 0.01 |
| May | 2.95 | 0.34 | 0.003 * | Trend detected | 0.14 | May | −0.34 | −0.04 | 0.73 | No trend | −0.01 |
| June | 2.91 | 0.34 | 0.003 * | Trend detected | 0.14 | June | 1.94 | 0.23 | 0.05 | No trend | 0.04 |
| July | 3.56 | 0.43 | 0.0004 * | Trend detected | 0.16 | July | 1.20 | 0.14 | 0.23 | No trend | 0.02 |
| August | 3.39 | 0.39 | 0.0007 * | Trend detected | 0.12 | August | −0.04 | −0.01 | 0.97 | No trend | 0.00 |
| September | 2.87 | 0.33 | 0.004 * | Trend detected | 0.10 | September | −0.16 | −0.02 | 0.88 | No trend | 0.00 |
| October | 2.82 | 0.34 | 0.005 * | Trend detected | 0.13 | October | 0.07 | 0.01 | 0.94 | No trend | 0.00 |
| November | 1.71 | 0.21 | 0.09 | No trend | 0.06 | November | −0.16 | −0.02 | 0.88 | No trend | 0.00 |
| December | 2.28 | 0.27 | 0.02* | Trend detected | 0.06 | December | −0.87 | −0.11 | 0.39 | No trend | −0.03 |
| Assaka | Mann–Kendall Test | Sen’s Slope | Ifre | Mann–Kendall Test | Sen’s Slope | ||||||
| Z | Kendall’s Tau | p-Value | Trend | Z | Kendall’s Tau | p-Value | Trend | ||||
| January | 3.63 | 0.43 | 0.0003 * | Trend detected | 0.11 | January | 1.52 | 0.18 | 0.13 | No trend | 0.05 |
| February | 1.50 | 0.18 | 0.13 | No trend | 0.04 | February | −1.44 | −0.17 | 0.15 | No trend | −0.06 |
| Mars | 1.42 | 0.17 | 0.16 | No trend | 0.04 | Mars | −0.63 | −0.07 | 0.53 | No trend | −0.02 |
| April | 3.25 | 0.38 | 0.001 * | Trend detected | 0.14 | April | 1.26 | 0.15 | 0.21 | No trend | 0.03 |
| May | 4.09 | 0.48 | 0.00 * | Trend detected | 0.18 | May | −0.17 | −0.02 | 0.86 | No trend | 0.00 |
| June | 3.33 | 0.40 | 0.0009 * | Trend detected | 0.16 | June | 1.23 | 0.14 | 0.22 | No trend | 0.06 |
| July | 4.42 | 0.53 | 0.00 * | Trend detected | 0.17 | July | 1.21 | 0.14 | 0.22 | No trend | 0.05 |
| August | 2.90 | 0.35 | 0.003 * | Trend detected | 0.14 | August | 1.95 | 0.23 | 0.05 | No trend | 0.09 |
| September | −0.07 | −0.01 | 0.94 | No trend | 0.00 | September | −0.01 | 0.00 | 0.99 | No trend | 0.00 |
| October | −0.07 | −0.01 | 0.94 | No trend | 0.00 | October | 1.10 | 0.13 | 0.27 | No trend | 0.05 |
| November | 2.62 | 0.31 | 0.009 * | Trend detected | 0.08 | November | −0.31 | −0.04 | 0.75 | No trend | −0.01 |
| December | 3.39 | 0.41 | 0.0007 * | Trend detected | 0.09 | December | 1.06 | 0.13 | 0.29 | No trend | 0.04 |
| Agouim | Mann–Kendall Test | Sen’s Slope | Ait Mouted | Mann–Kendall test | Sen’s Slope | ||||||
| Z | Kendall’s Tau | p-Value | Trend | Z | Kendall’s Tau | p-Value | Trend | ||||
| January | 1.94 | 0.25 | 0.05 | No trend | 0.07 | January | −0.31 | −0.04 | 0.76 | No trend | −0.02 |
| February | 2.37 | 0.30 | 0.01 * | Trend detected | 0.08 | February | −0.06 | −0.01 | 0.95 | No trend | 0.00 |
| Mars | 1.63 | 0.21 | 0.10 | No trend | 0.04 | Mars | 0.28 | 0.04 | 0.78 | No trend | 0.01 |
| April | −0.37 | −0.05 | 0.71 | No trend | −0.02 | April | 1.53 | 0.19 | 0.13 | No trend | 0.08 |
| May | 0.54 | 0.07 | 0.59 | No trend | 0.04 | May | 1.35 | 0.17 | 0.18 | No trend | 0.06 |
| June | 0.39 | 0.05 | 0.70 | No trend | 0.02 | June | 0.76 | 0.09 | 0.45 | No trend | 0.03 |
| July | 2.08 | 0.27 | 0.037 * | Trend detected | 0.09 | July | 1.23 | 0.15 | 0.22 | No trend | 0.04 |
| August | 0.37 | 0.05 | 0.71 | No Trend | 0.01 | August | 1.08 | 0.13 | 0.28 | No trend | 0.08 |
| September | −0.87 | −0.11 | 0.39 | No Trend | −0.04 | September | −1.24 | −0.16 | 0.21 | No trend | −0.05 |
| October | −0.53 | −0.07 | 0.60 | No Trend | −0.03 | October | 0.37 | 0.05 | 0.71 | No trend | 0.01 |
| November | 1.09 | 0.14 | 0.28 | No Trend | 0.05 | November | −0.37 | −0.05 | 0.71 | No trend | −0.01 |
| December | 1.23 | 0.16 | 0.22 | No Trend | 0.04 | December | 0.14 | 0.02 | 0.89 | No trend | 0.00 |
| Agouilal | Mann–Kendall Test | Sen’s Slope | |||||||||
| Z | Kendall’s Tau | p-Value | Trend | ||||||||
| January | 1.28 | 0.15 | 0.20 | No trend | 0.04 | ||||||
| February | 1.68 | 0.20 | 0.09 | No trend | 0.06 | ||||||
| Mars | 1.15 | 0.14 | 0.25 | No trend | 0.02 | ||||||
| April | 2.38 | 0.29 | 0.017 * | Trend detected | 0.06 | ||||||
| May | 2.04 | 0.24 | 0.041 * | Trend detected | 0.06 | ||||||
| June | 3.82 | 0.45 | 0.0001 * | Trend detected | 0.10 | ||||||
| July | 3.98 | 0.47 | 0.07 | No trend | 0.10 | ||||||
| August | 4.13 | 0.48 | 0.036 * | Trend detected | 0.12 | ||||||
| September | 2.48 | 0.30 | 0.013 * | Trend detected | 0.06 | ||||||
| October | 2.57 | 0.30 | 0.01 * | Trend detected | 0.09 | ||||||
| November | 0.30 | 0.04 | 0.77 | No trend | 0.00 | ||||||
| December | 1.95 | 0.24 | 0.05 | No trend | 0.08 | ||||||
| Mansour Eddahbi Dam | Mann–Kendall Test | Sen’s Slope | M’semrir | Mann–Kendall Test | |||||||
|---|---|---|---|---|---|---|---|---|---|---|---|
| Z | Kendall’s Tau | p-Value | Trend | Z | Kendall’s Tau | p-Value | Trend | Sen’s Slope | |||
| January | 0.45 | 0.05 | 0.66 | No trend | 0.02 | January | 1.74 | 0.20 | 0.08 | No trend | 0.06 |
| February | −1.62 | −0.19 | 0.10 | No trend | −0.07 | February | −0.12 | −0.02 | 0.91 | No trend | 0.00 |
| Mars | −0.25 | −0.03 | 0.80 | No trend | −0.01 | Mars | 0.13 | 0.02 | 0.90 | No trend | 0.00 |
| April | 1.61 | 0.19 | 0.11 | No trend | 0.04 | April | 2.35 | 0.28 | 0.018 * | Trend detected | 0.07 |
| May | 0.31 | 0.04 | 0.75 | No trend | 0.00 | May | 2.05 | 0.24 | 0.0408 * | Trend detected | 0.06 |
| June | 0.00 | 0.00 | 1.00 | No trend | 0.00 | June | 2.22 | 0.26 | 0.026 * | Trend detected | 0.04 |
| July | 0.64 | 0.08 | 0.52 | No trend | 0.01 | July | 3.48 | 0.42 | 0.0005 * | Trend detected | 0.05 |
| August | 0.22 | 0.03 | 0.82 | No trend | 0.00 | August | 3.13 | 0.38 | 0.0017 * | Trend detected | 0.05 |
| September | −1.28 | −0.15 | 0.20 | No trend | −0.02 | September | 0.84 | 0.10 | 0.40 | No trend | 0.01 |
| October | 0.80 | 0.10 | 0.43 | No trend | 0.02 | October | 1.69 | 0.21 | 0.09 | No trend | 0.05 |
| November | 0.17 | 0.02 | 0.86 | No trend | 0.00 | November | 1.23 | 0.15 | 0.22 | No trend | 0.04 |
| December | −0.53 | −0.06 | 0.60 | No trend | −0.03 | December | 1.03 | 0.13 | 0.30 | No trend | 0.03 |
| Mann–Kendall Test | Sen’s Slope | Mann–Kendall Test | Sen’s Slope | ||||||||
| Assaka | Z | Kendall’s Tau | p-Value | Trend | Ifre | Z | Kendall’s Tau | p-Value | Trend | ||
| January | −3.09 | −0.36 | 0.002 * | Trend detected | −0.13 | January | 2.62 | 0.31 | 0.008 * | Trend detected | 0.13 |
| February | −1.64 | −0.19 | 0.10 | No trend | −0.07 | February | 1.32 | 0.15 | 0.19 | No trend | 0.08 |
| Mars | 0.52 | 0.06 | 0.60 | No trend | 0.02 | Mars | 2.93 | 0.34 | 0.003 * | Trend detected | 0.10 |
| April | 1.05 | 0.13 | 0.29 | No trend | 0.05 | April | 3.12 | 0.36 | 0.0018 * | Trend detected | 0.12 |
| May | 1.38 | 0.16 | 0.17 | No trend | 0.05 | May | 3.11 | 0.36 | 0.0019 * | Trend detected | 0.10 |
| June | 0.38 | 0.05 | 0.70 | No trend | 0.01 | June | 2.40 | 0.28 | 0.0164 * | Trend detected | 0.05 |
| July | 1.67 | 0.20 | 0.10 | No trend | 0.03 | July | 3.72 | 0.44 | 0.0002 * | Trend detected | 0.07 |
| August | −1.34 | −0.16 | 0.18 | No trend | −0.02 | August | 3.09 | 0.37 | 0.0020 * | Trend detected | 0.05 |
| September | −0.90 | −0.11 | 0.37 | No trend | −0.03 | September | 2.16 | 0.26 | 0.03 * | Trend detected | 0.07 |
| October | −0.27 | −0.03 | 0.79 | No trend | −0.01 | October | 3.17 | 0.37 | 0.001 * | Trend detected | 0.10 |
| November | 0.54 | 0.07 | 0.59 | No trend | 0.02 | November | 2.22 | 0.26 | 0.026 * | Trend detected | 0.09 |
| December | −3.80 | −0.46 | 0.0001 * | Trend detected | −0.14 | December | 2.76 | 0.33 | 0.006 * | Trend detected | 0.10 |
| Agouim | Mann–Kendall Test | Sen’s Slope | Ait Mouted | Mann–Kendall Test | Sen’s Slope | ||||||
| Z | Kendall’s Tau | p-Value | Trend | Z | Kendall’s Tau | p-Value | Trend | ||||
| January | −2.35 | −0.3 | 0.019 * | Trend detected | −0.15 | January | 1.09 | 0.13 | 0.28 | No trend | 0.07 |
| February | −1.94 | −0.25 | 0.05 | No trend | −0.15 | February | 0.64 | 0.08 | 0.52 | No trend | 0.03 |
| Mars | −2.4 | −0.31 | 0.016 * | Trend detected | −0.24 | Mars | 2.29 | 0.27 | 0.0221 * | Trend detected | 0.1 |
| April | −1.02 | −0.13 | 0.31 | No trend | −0.06 | April | 2.94 | 0.36 | 0.0033 * | Trend detected | 0.09 |
| May | −0.99 | −0.13 | 0.32 | No trend | −0.05 | May | 3.44 | 0.41 | 0.0006 * | Trend detected | 0.14 |
| June | −1.84 | −0.24 | 0.07 | Trend detected | −0.08 | June | 3.3 | 0.4 | 0.0001 * | Trend detected | 0.14 |
| July | −1.55 | −0.2 | 0.12 | No trend | −0.04 | July | 4.17 | 0.5 | 0.0000 * | Trend detected | 0.14 |
| August | −1.43 | −0.18 | 0.15 | No trend | −0.04 | August | 3.56 | 0.43 | 0.0004 * | Trend detected | 0.11 |
| September | −2.14 | −0.27 | 0.032 * | Trend detected | −0.07 | September | 3.59 | 0.43 | 0.0003 * | Trend detected | 0.14 |
| October | 0.81 | 0.11 | 0.42 | No trend | 0 | October | 2.48 | 0.3 | 0.0133 * | Trend detected | 0.1 |
| November | −0.26 | −0.03 | 0.8 | No trend | −0.01 | November | 3.51 | 0.42 | 0.0004 * | Trend detected | 0.14 |
| December | −0.44 | −0.06 | 0.66 | No trend | −0.02 | December | 1.44 | 0.18 | 0.15 | No trend | 0.07 |
| Agouilal | Mann–Kendall Test | Sen’s Slope | |||||||||
| Z | Kendall’s Tau | p-Value | Trend | ||||||||
| January | 0.38 | 0.05 | 0.70 | No trend | 0.01 | ||||||
| February | 1.37 | 0.16 | 0.17 | No trend | 0.06 | ||||||
| Mars | 1.31 | 0.15 | 0.19 | No trend | 0.05 | ||||||
| April | 2.82 | 0.33 | 0.005 * | Trend detected | 0.13 | ||||||
| May | 2.95 | 0.34 | 0.003 * | Trend detected | 0.11 | ||||||
| June | 3.43 | 0.40 | 0.0006 * | Trend detected | 0.09 | ||||||
| July | 4.86 | 0.56 | 0.00 * | Trend detected | 0.12 | ||||||
| August | 4.61 | 0.53 | 0.00 * | Trend detected | 0.13 | ||||||
| September | 2.87 | 0.34 | 0.004 * | Trend detected | 0.07 | ||||||
| October | 3.35 | 0.39 | 0.0008 * | Trend detected | 0.10 | ||||||
| November | 3.25 | 0.38 | 0.001 * | Trend detected | 0.12 | ||||||
| December | −1.20 | −0.14 | 0.23 | No trend | −0.03 | ||||||


References
- Guan, X.; Zang, Y.; Meng, Y.; Liu, Y.; Lv, H.; Yan, D. Study on Spatiotemporal Distribution Characteristics of Flood and Drought Disaster Impacts on Agriculture in China. Int. J. Disaster Risk Reduct. 2021, 64, 102504. [Google Scholar] [CrossRef]
- Van der Wiel, K.; Bintanja, R. Contribution of Climatic Changes in Mean and Variability to Monthly Temperature and Precipitation Extremes. Commun. Earth Environ. 2021, 2, 1. [Google Scholar] [CrossRef]
- Almazroui, M.; Saeed, F.; Islam, M.N.; Alkhalaf, A.K. Assessing the Robustness and Uncertainties of Projected Changes in Temperature and Precipitation in AR4 Global Climate Models over the Arabian Peninsula. Atmos. Res. 2016, 182, 163–175. [Google Scholar] [CrossRef]
- Sa’adi, Z.; Shahid, S.; Chung, E.S.; bin Ismail, T. Projection of Spatial and Temporal Changes of Rainfall in Sarawak of Borneo Island Using Statistical Downscaling of CMIP5 Models. Atmos. Res. 2017, 197, 446–460. [Google Scholar] [CrossRef]
- Sung, J.H.; Chung, E.S.; Kim, Y.; Lee, B.R. Meteorological Hazard Assessment Based on Trends and Abrupt Changes in Rainfall Characteristics on the Korean Peninsula. Theor. Appl. Climatol. 2017, 127, 305–326. [Google Scholar] [CrossRef]
- Pour, S.H.; Shahid, S.; Chung, E.S.; Wang, X.J. Model Output Statistics Downscaling Using Support Vector Machine for the Projection of Spatial and Temporal Changes in Rainfall of Bangladesh. Atmos. Res. 2018, 213, 149–162. [Google Scholar] [CrossRef]
- Zahabiyoun, B.; Goodarzi, M.R.; Bavani, A.R.M.; Azamathulla, H.M. Assessment of Climate Change Impact on the Gharesou River Basin Using SWAT Hydrological Model. Clean—Soil Air Water 2013, 41, 601–609. [Google Scholar] [CrossRef]
- Sung, J.H.; Chung, E.S. Development of Streamflow Drought Severity–Duration–Frequency Curves Using the Threshold Level Method. Hydrol. Earth Syst. Sci. 2014, 18, 3341–3351. [Google Scholar] [CrossRef]
- Mohsenipour, M.; Shahid, S.; Chung, E.-S.; Wang, X.-J. Changing Pattern of Droughts during Cropping Seasons of Bangladesh. Water Resour. Manag. 2018, 32, 1555–1568. [Google Scholar] [CrossRef]
- Ahmed, K.; Shahid, S.; bin Harun, S.; Wang, X.J. Characterization of Seasonal Droughts in Balochistan Province, Pakistan. Stoch. Environ. Res. Risk Assess. 2016, 30, 747–762. [Google Scholar] [CrossRef]
- Chevuturi, A.; Klingaman, N.P.; Turner, A.G.; Guo, L.; Vidale, P.L. Projected Changes in the East Asian Hydrological Cycle for Different Levels of Future Global Warming. Atmosphere 2022, 13, 405. [Google Scholar] [CrossRef]
- Montaseri, M.; Amirataee, B. Comprehensive Stochastic Assessment of Meteorological Drought Indices. Int. J. Climatol. 2017, 37, 998–1013. [Google Scholar] [CrossRef]
- Tsatsaris, A.; Kalogeropoulos, K.; Stathopoulos, N.; Louka, P.; Tsanakas, K.; Tsesmelis, D.E.; Krassanakis, V.; Petropoulos, G.P.; Pappas, V.; Chalkias, C. Geoinformation Technologies in Support of Environmental Hazards Monitoring under Climate Change: An Extensive Review. ISPRS Int. J. Geo-Inf. 2021, 10, 94. [Google Scholar] [CrossRef]
- Gaznayee, H.A.A.; Al-Quraishi, A.M.F.; Mahdi, K.; Messina, J.P.; Zaki, S.H.; Razvanchy, H.A.S.; Hakzi, K.; Huebner, L.; Ababakr, S.H.; Riksen, M.; et al. Drought Severity and Frequency Analysis Aided by Spectral and Meteorological Indices in the Kurdistan Region of Iraq. Water 2022, 14, 3024. [Google Scholar] [CrossRef]
- Bhaga, T.D.; Dube, T.; Shekede, M.D.; Shoko, C. Impacts of Climate Variability and Drought on Surface Water Resources in Sub-Saharan Africa Using Remote Sensing: A Review. Remote Sens. 2020, 12, 4184. [Google Scholar] [CrossRef]
- Sheik Mujabar, P. Spatial-Temporal Variation of Land Surface Temperature of Jubail Industrial City, Saudi Arabia Due to Seasonal Effect by Using Thermal Infrared Remote Sensor (TIRS) Satellite Data. J. Afr. Earth Sci. 2019, 155, 54–63. [Google Scholar] [CrossRef]
- He, J.; Li, B.; Yu, Y.; Sun, L.; Zhang, H.; Malik, I.; Wistuba, M.; Yu, R. Temporal Variability of Temperature, Precipitation and Drought Indices in Hyper-Arid Region of Northwest China for the Past 60 Years. Atmosphere 2022, 13, 1561. [Google Scholar] [CrossRef]
- Sebbar, A.; Mohammed, H.; Fougrach, H.; Badri, W. Étude Des Variations Climatiques De La Région Centre Du Maroc. 25ème Colloq. L’association Int. Climatol. Grenoble 2012, 2012, 709–714. [Google Scholar]
- Umar, D.A.; Ramli, M.F.; Aris, A.Z.; Jamil, N.R.; Aderemi, A.A. Evidence of Climate Variability from Rainfall and Temperature Fluctuations in Semi-Arid Region of the Tropics. Atmos. Res. 2019, 224, 52–64. [Google Scholar] [CrossRef]
- Choukrani, G.; Hamimsa, A.; Said, M.E.M.; Babqiqi, A. Diagnostic et Projection Future Du Changement Climatique En Zone Aride. Cas de La Région Marrakech-Safi (Maroc). Diagnosis and Future Projection of Climate Change in Arid Zone. Case of Marrakech-Safi Region (Morocco). Larhyss J. 2018, 36, 49–63. [Google Scholar]
- Wen, X.; Wu, X.; Gao, M. Spatiotemporal Variability of Temperature and Precipitation in Gansu Province (Northwest China) during 1951–2015. Atmos. Res. 2017, 197, 132–149. [Google Scholar] [CrossRef]
- Hänsel, S.; Medeiros, D.M.; Matschullat, J.; Petta, R.A.; de Mendonça Silva, I. Assessing Homogeneity and Climate Variability of Temperature and Precipitation Series in the Capitals of North-Eastern Brazil. Front. Earth Sci. 2016, 4, 29. [Google Scholar] [CrossRef]
- Acharki, S.; Amharref, M.; El Halimi, R.; Bernoussi, A.S. Assessment by Statistical Approach of Climate Change Impact on Water Resources: Application to the Gharb Perimeter (Morocco). Rev. Sci. l’Eau 2019, 32, 291–315. [Google Scholar] [CrossRef]
- Chand, M.; Bhattarai, B.; Baral, P.; Pradhananga, N. Trend Analysis of Temperature Data for Narayani River Basin, Nepal. Sci 2019, 1, 21. [Google Scholar] [CrossRef]
- Iqbal, M.A.; Penas, A.; Cano-Ortiz, A.; Kersebaum, K.C.; Herrero, L.; del Río, S. Analysis of Recent Changes in Maximum and Minimum Temperatures in Pakistan. Atmos. Res. 2016, 168, 234–249. [Google Scholar] [CrossRef]
- Khomsi, K.; Mahe, G.; Sinan, M.; Snoussi, M. Hydro-Climatic Variability in Two Moroccan Basins: Comparative Analysis of Temperature, Rainfall and Runoff Regimes. IAHS-AISH Proc. Reports 2013, 359, 183–190. [Google Scholar]
- Yao, J.; Chen, Y. Trend Analysis of Temperature and Precipitation in the Syr Darya Basin in Central Asia. Theor. Appl. Climatol. 2015, 120, 521–531. [Google Scholar] [CrossRef]
- Archer, D.H.A. Analysis of Temperature Trends in Sutluj River Basin, India. J. Earth Sci. Clim. Chang. 2014, 5, 222. [Google Scholar] [CrossRef]
- Dore, M.H.I. Climate Change and Changes in Global Precipitation Patterns: What Do We Know ? Environ. Int. 2005, 31, 1167–1181. [Google Scholar] [CrossRef]
- Knippertz, P.; Christoph, M.; Speth, P. Long-Term Precipitation Variability in Morocco and the Link to the Large-Scale Circulation in Recent and Future Climates. Meteorol. Atmos. Phys. 2003, 83, 67–88. [Google Scholar] [CrossRef]
- Xu, S.; Yu, Z.; Yang, C.; Ji, X.; Zhang, K. Trends in Evapotranspiration and Their Responses to Climate Change and Vegetation Greening over the Upper Reaches of the Yellow River Basin. Agric. For. Meteorol. 2018, 263, 118–129. [Google Scholar] [CrossRef]
- Hartmann, D.L.; Klein Tank, M.A.M.G.; Rusticucci, M.; Alexander, L.V.; Brönnimann, S.; Charab, Y.; Dentener, F.J.; Dlugokencky, E.J.; Easterling, D.R.; Kaplan, A.; et al. Observations: Atmosphere and Surface. In Climate Change 2013: The Physical Science Basis. Contribution of Working Group I to the Fifth Assessment Report of the Intergovernmental Panel on Climate Change; Stocker, T.F., Qin, G.-K.D., Plattner, M., Tignor, S.K., Allen, J., Boschung, A., Nauels, Y.X., Eds.; Cambridge University Press: Cambridge, UK, 2013; Volume 44, pp. 159–254. ISBN 9781107415324. [Google Scholar]
- Bouras, E.H.; Jarlan, L.; Er-Raki, S.; Balaghi, R.; Amazirh, A.; Richard, B.; Khabba, S. Cereal Yield Forecasting with Satellite Drought-Based Indices, Weather Data and Regional Climate Indices Using Machine Learning in Morocco. Remote Sens. 2021, 13, 3101. [Google Scholar] [CrossRef]
- Verner, D.; Treguer, D.; Redwood, J.; Christensen, J.; McDonnell, R.; Elbert, C.; Konishi, Y.; Belghazi, S. Climate Variability, Drought, and Drought Management in Morocco’s Agricultural Sector; World Bank Group: Washington, DC, USA, 2018. [Google Scholar]
- Zkhiri, W.; Tramblay, Y.; Hanich, L.; Jarlan, L.; Ruelland, D. Spatiotemporal Characterization of Current and Future Droughts in the High Atlas Basins (Morocco). Theor. Appl. Clim. 2018, 135, 593–605. [Google Scholar] [CrossRef]
- Henchiri, M.; Igbawua, T.; Javed, T.; Bai, Y.; Zhang, S.; Essifi, B.; Ujoh, F.; Zhang, J. Meteorological Drought Analysis and Return Periods over North and West Africa and Linkage with El Niño–Southern Oscillation (Enso). Remote Sens. 2021, 13, 4730. [Google Scholar] [CrossRef]
- Sun, Y.; Solomon, S.; Dai, A.; Portmann, R.W. How Often Does It Rain? J. Clim. 2006, 19, 916–934. [Google Scholar] [CrossRef]
- Dracup, J.A.; Lee, K.S.; Paulson, E.G. On Definitions of Droughts. WATER Resour. Res. 1980, 16, 297–302. [Google Scholar] [CrossRef]
- Mishra, A.K.; Singh, V.P. Drought Modeling—A Review. J. Hydrol. 2011, 403, 157–175. [Google Scholar] [CrossRef]
- AghaKouchak, A. A Multivariate Approach for Persistence-Based Drought Prediction: Application to the 2010—2011 East Africa Drought. J. Hydrol. 2015, 526, 127–135. [Google Scholar] [CrossRef]
- Soydan Oksal, N.G. Comparative Analysis of the Influence of Temperature and Precipitation on Drought Assessment in the Marmara Region of Turkey: An Examination of SPI and SPEI Indices. J. Water Clim. Chang. 2023, 14, 3096–3111. [Google Scholar] [CrossRef]
- McKee, T.B.; Doesken, N.J.; Kleist, J. The Relationship of Drought Frequency and Duration to Time Scales. In Proceedings of the Eighth Conference on Applied Climatology, Anaheim, CA, USA, 17–22 January 1993; pp. 179–184. [Google Scholar]
- Vicente-Serrano, S.M.; Beguería, S.; López-Moreno, J.I. A Multiscalar Drought Index Sensitive to Global Warming: The Standardized Precipitation Evapotranspiration Index. J. Clim. 2010, 23, 1696–1718. [Google Scholar] [CrossRef]
- Spinoni, J.; Naumann, G.; Vogt, J.V.; Barbosa, P. The Biggest Drought Events in Europe from 1950 to 2012. J. Hydrol. Reg. Stud. 2015, 3, 509–524. [Google Scholar] [CrossRef]
- Dukat, P.; Bednorz, E.; Ziemblińska, K.; Urbaniak, M. Trends in Drought Occurrence and Severity at Mid-Latitude European Stations (1951–2015) Estimated Using Standardized Precipitation (SPI) and Precipitation and Evapotranspiration (SPEI) Indices. Meteorol. Atmos. Phys. 2022, 134, 1–21. [Google Scholar] [CrossRef]
- Gurrapu, S.; Chipanshi, A.C.; Sauchyn, D.; Howard, A. Comparison of the SPI and SPEI on Predicting Drought Conditions and Streamflow in the Canadian Prairies. In Proceedings of the 28th Conference on Hydrology—94th American Meteorological Society Annual Meeting, Atlanta, GA, USA, 2–6 February 2014. [Google Scholar]
- Tefera, A.S.; Ayoade, J.O.; Bello, N.J. Comparative Analyses of SPI and SPEI as Drought Assessment Tools in Tigray Region, Northern Ethiopia. SN Appl. Sci. 2019, 1, 265. [Google Scholar] [CrossRef]
- Agoussine, M.; El, M.; Saidi, M.; Igmoullan, B.; Ayyad, U.C.; Géosciences, L. De Reconnaissance Des Ressources En Eau Du Bassin d ’ Ouarzazate. Bull. l’Institut Sci. Rabat Sect. Sci. Terre 2004, 26, 81–92. [Google Scholar]
- Schulz, O.; Finckh, M.; Goldbach, H. Hydro-Meteorological Measurements in the Drâa Catchment. In Impacts of Global Change on the Hydrological Cycle in West and Northwest Africa; Springer: Berlin/Heidelberg, Germany, 2010; pp. 122–131. ISBN 9783642129568. [Google Scholar]
- Schulz, O.; Busche, H.; Benbouziane, A. Decadal Precipitation Variances and Reservoir Inflow in the Semi-Arid Upper Drâa Basin (South-Eastern Morocco). In Environmental Science and Engineering; Springer: Berlin/Heidelberg, Germany, 2008; pp. 166–178. [Google Scholar]
- Ait Ahmad, M. The Upstream Part of the Oued Draa Watershed: Contribution to the Hydroclimatic and Hydrogeomorphological Study of a Semi-Arid Atlasic; Faculty of Arts and Humanities, University Ibn Zohr: Agadir, Morocco, 2019. [Google Scholar]
- Klose, A. Soil Characteristics and Soil Erosion by Water in a Semi-Arid Catchment (Wadi Drâa, South Morocco) under the Pressure of Global Change. Ph.D. Thesis, Faculty of Mathematics and Sciences, University of Bonn, Bonn, Germany, 2009. Available online: http://hss.ulb.uni-bonn.de/2009/1959/1959.htm (accessed on 24 September 2023).
- Cappy, S. Hydrogeological Characterization of the Upper Drâa Catchment: Morocco; Universitäts-und Landesbibliothek Bonn: Bonn, Germany, 2006. [Google Scholar]
- Hussain, F.; Nabi, G.; Waseem Boota, M. Rainfall Trend Analysis By Using the Mann-Kendall Test & Sen’S Slope Estimates: A Case Study of District Chakwal Rain Gauge, Barani Area, Northern Punjab Province, Pakistan. Sci. Int. 2015, 27, 3159–3165. [Google Scholar]
- Sen, P.K. Estimates of the Regression Coefficient Based on Kendall’s Tau. J. Am. Stat. Assoc. 1968, 63, 1379–1389. [Google Scholar] [CrossRef]
- Said, A.; Ahmed, A. Drought Variability in Agadir’s Region (Southern Morocco)—Recent and Future Trends. Ecol. Eng. Environ. Technol. 2023, 24, 241–250. [Google Scholar] [CrossRef]
- Acharki, S.; Singh, S.K.; do Couto, E.V.; Arjdal, Y.; Elbeltagi, A. Spatio-Temporal Distribution and Prediction of Agricultural and Meteorological Drought in a Mediterranean Coastal Watershed via GIS and Machine Learning. Phys. Chem. Earth 2023, 131, 103425. [Google Scholar] [CrossRef]
- Driouech, F.; ElRhaz, K.; Moufouma-Okia, W.; Arjdal, K.; Balhane, S. Assessing Future Changes of Climate Extreme Events in the CORDEX-MENA Region Using Regional Climate Model ALADIN-Climate. Earth Syst. Environ. 2020, 4, 477–492. [Google Scholar] [CrossRef]
- An, S.; Park, G.; Jung, H.; Jang, D. Assessment of Future Drought Index Using SSP Scenario in Rep. of Korea. Sustainability 2022, 14, 4252. [Google Scholar] [CrossRef]
- Ndayiragije, J.M.; Li, F. Monitoring and Analysis of Drought Characteristics Based on Climate Change in Burundi Using Standardized Precipitation Evapotranspiration Index. Water 2022, 14, 2511. [Google Scholar] [CrossRef]
- Montes-Vega, M.J.; Guardiola-Albert, C.; Rodríguez-Rodríguez, M. Calculation of the SPI, SPEI, and GRDI Indices for Historical Climatic Data from Doñana National Park: Forecasting Climatic Series (2030–2059) Using Two Climatic Scenarios RCP 4.5 and RCP 8.5 by IPCC. Water 2023, 15, 2369. [Google Scholar] [CrossRef]
- Yevjevich, V. An Objective Approach to Definitions and Investigations of Continental Hydrologic Droughts. J. Hydrol. 1969, 7, 353. [Google Scholar] [CrossRef]
- Fritzsche, P. Development of a Satellite-Based Dynamic Regional Vegetation Model for the Drâa Catchment; Rheinische Friedrich-Wilhelms-Universität Bonn: Bonn, Germany, 2010. [Google Scholar]
- Pepin, N.C.; Arnone, E.; Gobiet, A.; Haslinger, K.; Kotlarski, S.; Notarnicola, C.; Palazzi, E.; Seibert, P.; Serafin, S.; Schöner, W.; et al. Climate Changes and Their Elevational Patterns in the Mountains of the World. Rev. Geophys. 2022, 60, e2020RG000730. [Google Scholar] [CrossRef]
- Bouizrou, I.; Aqnouy, M.; Bouadila, A. Spatio-Temporal Analysis of Trends and Variability in Precipitation across Morocco: Comparative Analysis of Recent and Old Non-Parametric Methods. J. Afr. Earth Sci. 2022, 196, 104691. [Google Scholar] [CrossRef]
- Alemu, M.M.; Bawoke, G.T. Analysis of Spatial Variability and Temporal Trends of Rainfall in Amhara Region, Ethiopia. J. Water Clim. Chang. 2020, 11, 1505–1520. [Google Scholar] [CrossRef]
- Asfaw, A.; Simane, B.; Hassen, A.; Bantider, A. Variability and Time Series Trend Analysis of Rainfall and Temperature in Northcentral Ethiopia: A Case Study in Woleka Sub-Basin. Weather Clim. Extrem. 2018, 19, 29–41. [Google Scholar] [CrossRef]
- Eddoughri, F.; Lkammarte, F.Z.; El Jarroudi, M.; Lahlali, R.; Karmaoui, A.; Yacoubi Khebiza, M.; Messouli, M. Analysis of the Vulnerability of Agriculture to Climate and Anthropogenic Impacts in the Beni Mellal-Khénifra Region, Morocco. Sustainability 2022, 14, 13166. [Google Scholar] [CrossRef]
- Brahim, Y.A.; Saidi, M.E.M.; Kouraiss, K.; Sifeddine, A.; Bouchaou, L. Analysis of Observed Climate Trends and High Resolution Scenarios for the 21st Century in Morocco. J. Mater. Environ. Sci. 2017, 8, 1375–1384. [Google Scholar]
- Rotnicka, J.; Malik, I.; Maciej, D. Simultaneous Growth Releases and Reductions among Populus Alba as an Indicator for Floods in Dry Mountains (Morocco). Ecol. Indic. J. 2021, 129, 107874. [Google Scholar] [CrossRef]
- Rojan, E.; Dłużewski, M.; Krzemień, K. Sediment Budget of High Mountain Stream Channels in an Arid Zone (High Atlas Mountains, Morocco). Catena 2020, 190, 104530. [Google Scholar] [CrossRef]
- Graf, K. Drinking Water Supply in the Middle Drâa Valley, South Morocco. Options for Action in the Context of Water Scarcity and Institutional Constraints; Universität zu Köln: Köln, Germany, 2010. [Google Scholar]
- Morante-Carballo, F.; Montalván-Burbano, N.; Quiñonez-Barzola, X.; Jaya-Montalvo, M.; Carrión-Mero, P. What Do We Know about Water Scarcity in Semi-Arid Zones? A Global Analysis and Research Trends. Water 2022, 14, 2685. [Google Scholar] [CrossRef]
- Berger, E.; Bossenbroek, L.; Beermann, A.J.; Schäfer, R.B.; Znari, M.; Riethmüller, S.; Sidhu, N.; Kaczmarek, N.; Benaissa, H.; Ghamizi, M.; et al. Social-Ecological Interactions in the Draa River Basin, Southern Morocco: Towards Nature Conservation and Human Well-Being Using the IPBES Framework. Sci. Total Environ. 2021, 769, 144492. [Google Scholar] [CrossRef] [PubMed]
- Xoplaki, E. Climate Variability over the Mediterranean; Inauguraldissertation der Philosophisch-naturwissenschaftlichen Fakultät der Universität Bern: Bern, Switzerland, 2002. [Google Scholar]
- Lamb, P.J.; Peppler, R.A. North Atlantic Oscillation: Concept and an Application. Bull. Am. Meteorol. Soc. 1987, 68, 1218–1225. [Google Scholar] [CrossRef]
- Trigo, R.M.; Pozo-Vázquez, D.; Osborn, T.J.; Castro-Díez, Y.; Gámiz-Fortis, S.; Esteban-Parra, M.J. North Atlantic Oscillation Influence on Precipitation, River Flow and Water Resources in the Iberian Peninsula. Int. J. Climatol. 2004, 24, 925–944. [Google Scholar] [CrossRef]


| SPI/SPEI Values | Category |
|---|---|
| 2.00 and above | Extremely wet |
| 1.50 to 1.99 | Severely wet |
| 1.00 to 1.49 | Moderately wet |
| 0.99 to −0.99 | Normal |
| −1.00 to −1.49 | Moderate drought |
| −1.50 to −1.99 | Severe drought |
| −2.0 and less | Extreme drought |
| Rainfall | Mann–Kendall Test | Sen’s Slope | |||
|---|---|---|---|---|---|
| Z | Kendall’s Tau | p-Value | Trend | ||
| Mansour Eddahbi Dam | 0.59 | 0.07 | 0.56 | No trend | 0.63 |
| M’semrir | 1.22 | 0.14 | 0.22 | No trend | 1.34 |
| Assaka | −1.22 | −0.14 | 0.22 | No trend | −1.35 |
| Ifre | 1.02 | 0.12 | 0.31 | No trend | 1.22 |
| Agouim | −0.33 | −0.04 | 0.74 | No trend | −0.56 |
| Ait Mouted | 1.01 | 0.12 | 0.31 | No trend | 0.92 |
| Agouilal | −0.3 | −0.04 | 0.76 | No trend | −0.35 |
| Tmin | Mann–Kendall Test | Sen’s Slope | Tmax | Mann–Kendall Test | Sen’s Slope | ||||||
|---|---|---|---|---|---|---|---|---|---|---|---|
| Z | Kendall’s Tau | p-Value | Trend | Z | Kendall’s Tau | p-Value | Trend | ||||
| Mansour Eddahbi Dam | 4.90 | 0.56 | 0.00 * | Trend detected | 0.10 | Mansour Eddahbi Dam | 0.59 | 0.07 | 0.56 | No trend | 0.01 |
| M’semrir | −1.09 | −0.13 | 0.28 | No trend | −0.02 | M’semrir | 2.87 | 0.33 | 0.00 * | Trend detected | 0.04 |
| Assaka | 3.72 | 0.43 | 0.00 * | Trend detected | 0.08 | Assaka | −2.29 | −0.27 | 0.00 * | Trend detected | −0.04 |
| Ifre | 0.98 | 0.11 | 0.33 | No trend | 0.02 | Ifre | 3.57 | 0.41 | 0.00 * | Trend detected | 0.09 |
| Agouim | 0.99 | 0.13 | 0.32 | No trend | 0.03 | Agouim | −2.24 | −0.29 | 0.00 * | Trend detected | −0.07 |
| Ait Mouted | 1.33 | 0.16 | 0.18 | No trend | 0.03 | Ait Mouted | 4.80 | 0.56 | 0.00 * | Trend detected | 0.11 |
| Agouilal | 4.85 | 0.56 | 0.00 * | Trend detected | 0.07 | Agouilal | 4.77 | 0.55 | 0.00 * | Trend detected | 0.08 |
| SPI | SPEI | |||||||
|---|---|---|---|---|---|---|---|---|
| Duration | Frequency | Intensity | Duration | Frequency | Intensity | |||
| Mansour Eddahbi Dam | SPI-3 | 2.00 | 16.67 | −1.46 | SPEI-3 | 2.63 | 14.32 | −1.51 |
| SPI-6 | 3.89 | 15.77 | −1.65 | SPEI-6 | 4.21 | 13.41 | −1.55 | |
| SPI-9 | 5.33 | 14.41 | −1.84 | SPEI-9 | 5.40 | 12.27 | −1.60 | |
| SPI-12 | 6.33 | 12.84 | −1.94 | SPEI-12 | 4.80 | 10.91 | −1.66 | |
| Agouim | SPI-3 | 1.77 | 15.54 | −1.50 | SPEI-3 | 2.85 | 15.49 | −1.56 |
| SPI-6 | 3.19 | 15.09 | −1.63 | SPEI-6 | 4.13 | 16.85 | −1.48 | |
| SPI-9 | 6.08 | 16.44 | −1.61 | SPEI-9 | 7.25 | 15.76 | −1.51 | |
| SPI-12 | 9.63 | 17.34 | −1.61 | SPEI-12 | 8.71 | 16.58 | −1.47 | |
| Agouilal | SPI-3 | 1.97 | 15.54 | −1.44 | SPEI-3 | 3.10 | 14.77 | −1.54 |
| SPI-6 | 3.83 | 15.54 | −1.68 | SPEI-6 | 3.48 | 16.59 | −1.49 | |
| SPI-9 | 4.47 | 17.12 | −1.69 | SPEI-9 | 6.83 | 18.64 | −1.44 | |
| SPI-12 | 7.36 | 18.24 | −1.67 | SPEI-12 | 7.60 | 17.27 | −1.49 | |
| M’semrir | SPI-3 | 1.70 | 14.19 | −1.58 | SPEI-3 | 2.26 | 15.91 | −1.45 |
| SPI-6 | 3.39 | 13.74 | −1.44 | SPEI-6 | 4.27 | 14.55 | −1.49 | |
| SPI-9 | 3.30 | 14.86 | −1.49 | SPEI-9 | 6.09 | 15.23 | −1.49 | |
| SPI-12 | 4.62 | 13.51 | −1.57 | SPEI-12 | 6.00 | 15.00 | −1.52 | |
| Assaka | SPI-3 | 1.97 | 10.14 | −1.31 | SPEI-3 | 2.81 | 18.27 | −1.41 |
| SPI-6 | 3.94 | 14.19 | −1.46 | SPEI-6 | 3.71 | 18.75 | −1.38 | |
| SPI-9 | 5.21 | 16.44 | −1.51 | SPEI-9 | 4.93 | 17.79 | −1.36 | |
| SPI-12 | 8.20 | 18.47 | −1.53 | SPEI-12 | 5.93 | 19.95 | −1.33 | |
| Ifre | SPI-3 | 1.71 | 11.94 | −1.30 | SPEI-3 | 2.21 | 14.09 | −1.52 |
| SPI-6 | 4.00 | 16.22 | −1.50 | SPEI-6 | 4.44 | 16.14 | −1.45 | |
| SPI-9 | 6.09 | 15.09 | −1.67 | SPEI-9 | 5.14 | 16.36 | −1.49 | |
| SPI-12 | 6.60 | 14.86 | −1.60 | SPEI-12 | 9.75 | 17.73 | −1.47 | |
| Ait Mouted | SPI-3 | 1.86 | 15.54 | −1.55 | SPEI-3 | 3.17 | 17.55 | −1.43 |
| SPI-6 | 3.75 | 16.89 | -1.61 | SPEI-6 | 3.59 | 18.99 | −1.41 | |
| SPI-9 | 3.82 | 14.64 | −1.65 | SPEI-9 | 5.92 | 17.07 | −1.49 | |
| SPI-12 | 7.30 | 16.44 | −1.51 | SPEI-12 | 7.11 | 15.38 | −1.54 | |
Disclaimer/Publisher’s Note: The statements, opinions and data contained in all publications are solely those of the individual author(s) and contributor(s) and not of MDPI and/or the editor(s). MDPI and/or the editor(s) disclaim responsibility for any injury to people or property resulting from any ideas, methods, instructions or products referred to in the content. |
© 2023 by the authors. Licensee MDPI, Basel, Switzerland. This article is an open access article distributed under the terms and conditions of the Creative Commons Attribution (CC BY) license (https://creativecommons.org/licenses/by/4.0/).
Share and Cite
El Qorchi, F.; Yacoubi Khebiza, M.; Omondi, O.A.; Karmaoui, A.; Pham, Q.B.; Acharki, S. Analyzing Temporal Patterns of Temperature, Precipitation, and Drought Incidents: A Comprehensive Study of Environmental Trends in the Upper Draa Basin, Morocco. Water 2023, 15, 3906. https://doi.org/10.3390/w15223906
El Qorchi F, Yacoubi Khebiza M, Omondi OA, Karmaoui A, Pham QB, Acharki S. Analyzing Temporal Patterns of Temperature, Precipitation, and Drought Incidents: A Comprehensive Study of Environmental Trends in the Upper Draa Basin, Morocco. Water. 2023; 15(22):3906. https://doi.org/10.3390/w15223906
Chicago/Turabian StyleEl Qorchi, Fadoua, Mohammed Yacoubi Khebiza, Onyango Augustine Omondi, Ahmed Karmaoui, Quoc Bao Pham, and Siham Acharki. 2023. "Analyzing Temporal Patterns of Temperature, Precipitation, and Drought Incidents: A Comprehensive Study of Environmental Trends in the Upper Draa Basin, Morocco" Water 15, no. 22: 3906. https://doi.org/10.3390/w15223906
APA StyleEl Qorchi, F., Yacoubi Khebiza, M., Omondi, O. A., Karmaoui, A., Pham, Q. B., & Acharki, S. (2023). Analyzing Temporal Patterns of Temperature, Precipitation, and Drought Incidents: A Comprehensive Study of Environmental Trends in the Upper Draa Basin, Morocco. Water, 15(22), 3906. https://doi.org/10.3390/w15223906