Article

Experimental Study of the Freeze–Thaw Damage of Alpine Surface Coal Mine Roads Based on Geopolymer Materials

1
School of Mines, China University of Mining and Technology, Xuzhou 221116, China
2
State Key Laboratory of Coal Resources and Safe Mining, China University of Mining and Technology, Xuzhou 221116, China
*
Author to whom correspondence should be addressed.
Water 2023, 15(22), 3903; https://doi.org/10.3390/w15223903
Submission received: 10 October 2023 / Revised: 31 October 2023 / Accepted: 1 November 2023 / Published: 9 November 2023
(This article belongs to the Special Issue Research on Rock Mechanics under Freeze-Thaw Action)

Abstract

:
In the process of mining and transportation, the temporary non-hardened mine-road structure is mainly a mixture of soil and stone, which very easily produces dust hazards via crushing and wind transportation. Geopolymers can be used in the road’s soil and stone mixture so that the road reaches certain strength requirements in line with the short-term use of the mine. However, in alpine open-pit coal mines, which are subject to the influence of weather changes, freezing and thawing phenomena will affect the long-term use of the road and its normal and safe operation. An open-pit coal mine in Xinjiang, China, was chosen as the research object of alpine open-pit coal mines. Using the method of indoor testing, different freeze–thaw freezing temperatures, different numbers of cycles, changes in the mechanical properties of the mine-road materials, and microscopic changes were studied. From the experimental results, it was determined that with a reduction in the freeze–thaw freezing temperature, the specimen strength declines after stabilizing, and with an increase in the number of freeze–thaw cycles, the specimen strength exhibits a linear decline. The specimen’s internal structure gradually changed from dense to loose; the fracture mode changed from toughness fractures to crystal fractures after the removal of the maximum load reduction. The uniaxial compressive strength was reduced to 61%; the tensile strength was reduced to 49%. The fracture zone of the specimen was analyzed using energy spectra, and the main elements changed from O (57.19%), Si (17.07%), and Al (12.19%) without freezing and thawing to O (49.76%), Si (15.70%) and Ca (11.09%) after freezing and thawing.

1. Introduction

In the processes of mining and transportation in open-pit coal mines, due to their temporary non-hardened mine-road structure being mainly a mixture of soil and stone, in the reciprocal crushing by coal vehicles, the road surface is increasingly crushed to form a large number of crushed stone particles, which seriously affect the normal operation of coal vehicles [1]. Geopolymer materials, as a new type of inorganic polymer material in soil and stone mixture remodeling, can open new avenues in slag, fly ash, and other solid waste research as the main raw materials. With the help of the “alkali excitation” reaction, a new type of cement can be formed [2,3,4], which can be used in the construction of open-pit mine transportation roads [5,6].
In terms of performance and function, geopolymer materials have a series of advantages, such as high strength, high temperature resistance, acid and alkali corrosion resistance, low permeability, and an adjustable coefficient of thermal expansion [7,8]. In addition, the mechanical properties of the geopolymer can be further improved by mixing a certain amount of calcium aluminate cement (CAC) [9] and additional alkaline salt [10]. Their raw materials are abundant, and the use of solid wastes, such as metakaolin [11,12], fly ash [13,14], limestone [15], etc., can reduce energy and resource consumption and environmental pollution. It is an environmentally friendly green building material, which is conducive to the sustainable development of society and has been extensively studied as a building material and in other fields [16,17,18]. Sujitra [19] synthesized fibers by mixing geopolymer powder with a polyethersulfone (PES)-N-methyl-2 pyrrolidone (NMP) solution; the slurry was extruded and then converted into fibers by the phase transformation method. Nabeel [20] compared the engineering properties of normal-strength FAGP and high-strength AAS concrete with OPC concrete in terms of workability, dry density, ultrasonic pulse velocity (UPV), compressive strength, indirect tensile strength, flexural strength, direct tensile strength, and stress–strain behavior during compression and direct tension. For the study of material properties under freeze–thaw conditions, Shima [21] investigated the effect of frost conditions on the physical and mechanical properties of a geopolymer concrete (GPC) containing two different microencapsulated phase change materials (MPCMs). They found that the deterioration of the concrete induced by freezing and thawing may result in microcracks appearing in the weak interfacial transition zone between the two, and the incorporation of MPCMs provided excellent resistance to freeze–thaw cycles and also a small reduction in the compressive strength. Huajun Zhu [22] analyzed the mineral phase formation, the structural and chemical composition of modified fly ash, and the effect of modified fly ash on the compressive properties, as well as the strength and frost resistance of slag-based geopolymers, using XRD, FESEM, and EDS. Chamila [23] studied the effects of three different low calcium fly ash geopolymer concretes containing chloride casting subjected to a wet grinding cycle and investigated the long-term corrosion conditions of embedded steel bars in fly ash geopolymer concretes.
Scholars from various countries have carried out extensive research on the freezing damage mechanism of concrete, have performed a lot of theoretical and experimental work, and have put forward several theories. Among these theories, it has been postulated that the combination of the hydrostatic pressure hypothesis and the osmotic pressure hypothesis is more successful in explaining the freezing and thawing damage mechanism. This has also been studied from the perspective of rainfall [24]. However, most of the current research is aimed at concrete materials and their physical and mechanical characteristics [25,26,27], and there are fewer studies on geopolymer-modified mining road materials, especially in alpine mining areas. The mechanism of freeze–thaw damage to road materials is also not well studied.
The use of modified geopolymers as mine-road materials not only makes full use of mines’ solid waste but also improves the strength of road materials [28,29]. However, China’s open-pit coal mines are mainly concentrated in Inner Mongolia as well as Xinjiang. Due to their high latitude, the cold climate, and a large number of alpine open-pit coal mines, the freeze–thaw damage phenomenon is common on roads. Freeze–thaw damage to mining road materials will cause damage to the road, thus affecting the normal operation process and transportation safety of the mining transportation system, resulting in serious safety accidents and economic losses. Therefore, it is necessary to focus on the mechanical property changes after freeze–thaw damage to geopolymer-modified mine-road materials. The research task is to explore different freeze–thaw freezing temperatures and different cycle times and the mechanical properties of the modified mine-road materials and to study the change rule and freeze–thaw damage mechanism. The purpose of this research is to provide theoretical support for the safe use of open-pit mine roads in alpine regions and to protect the normal production and construction of mines.

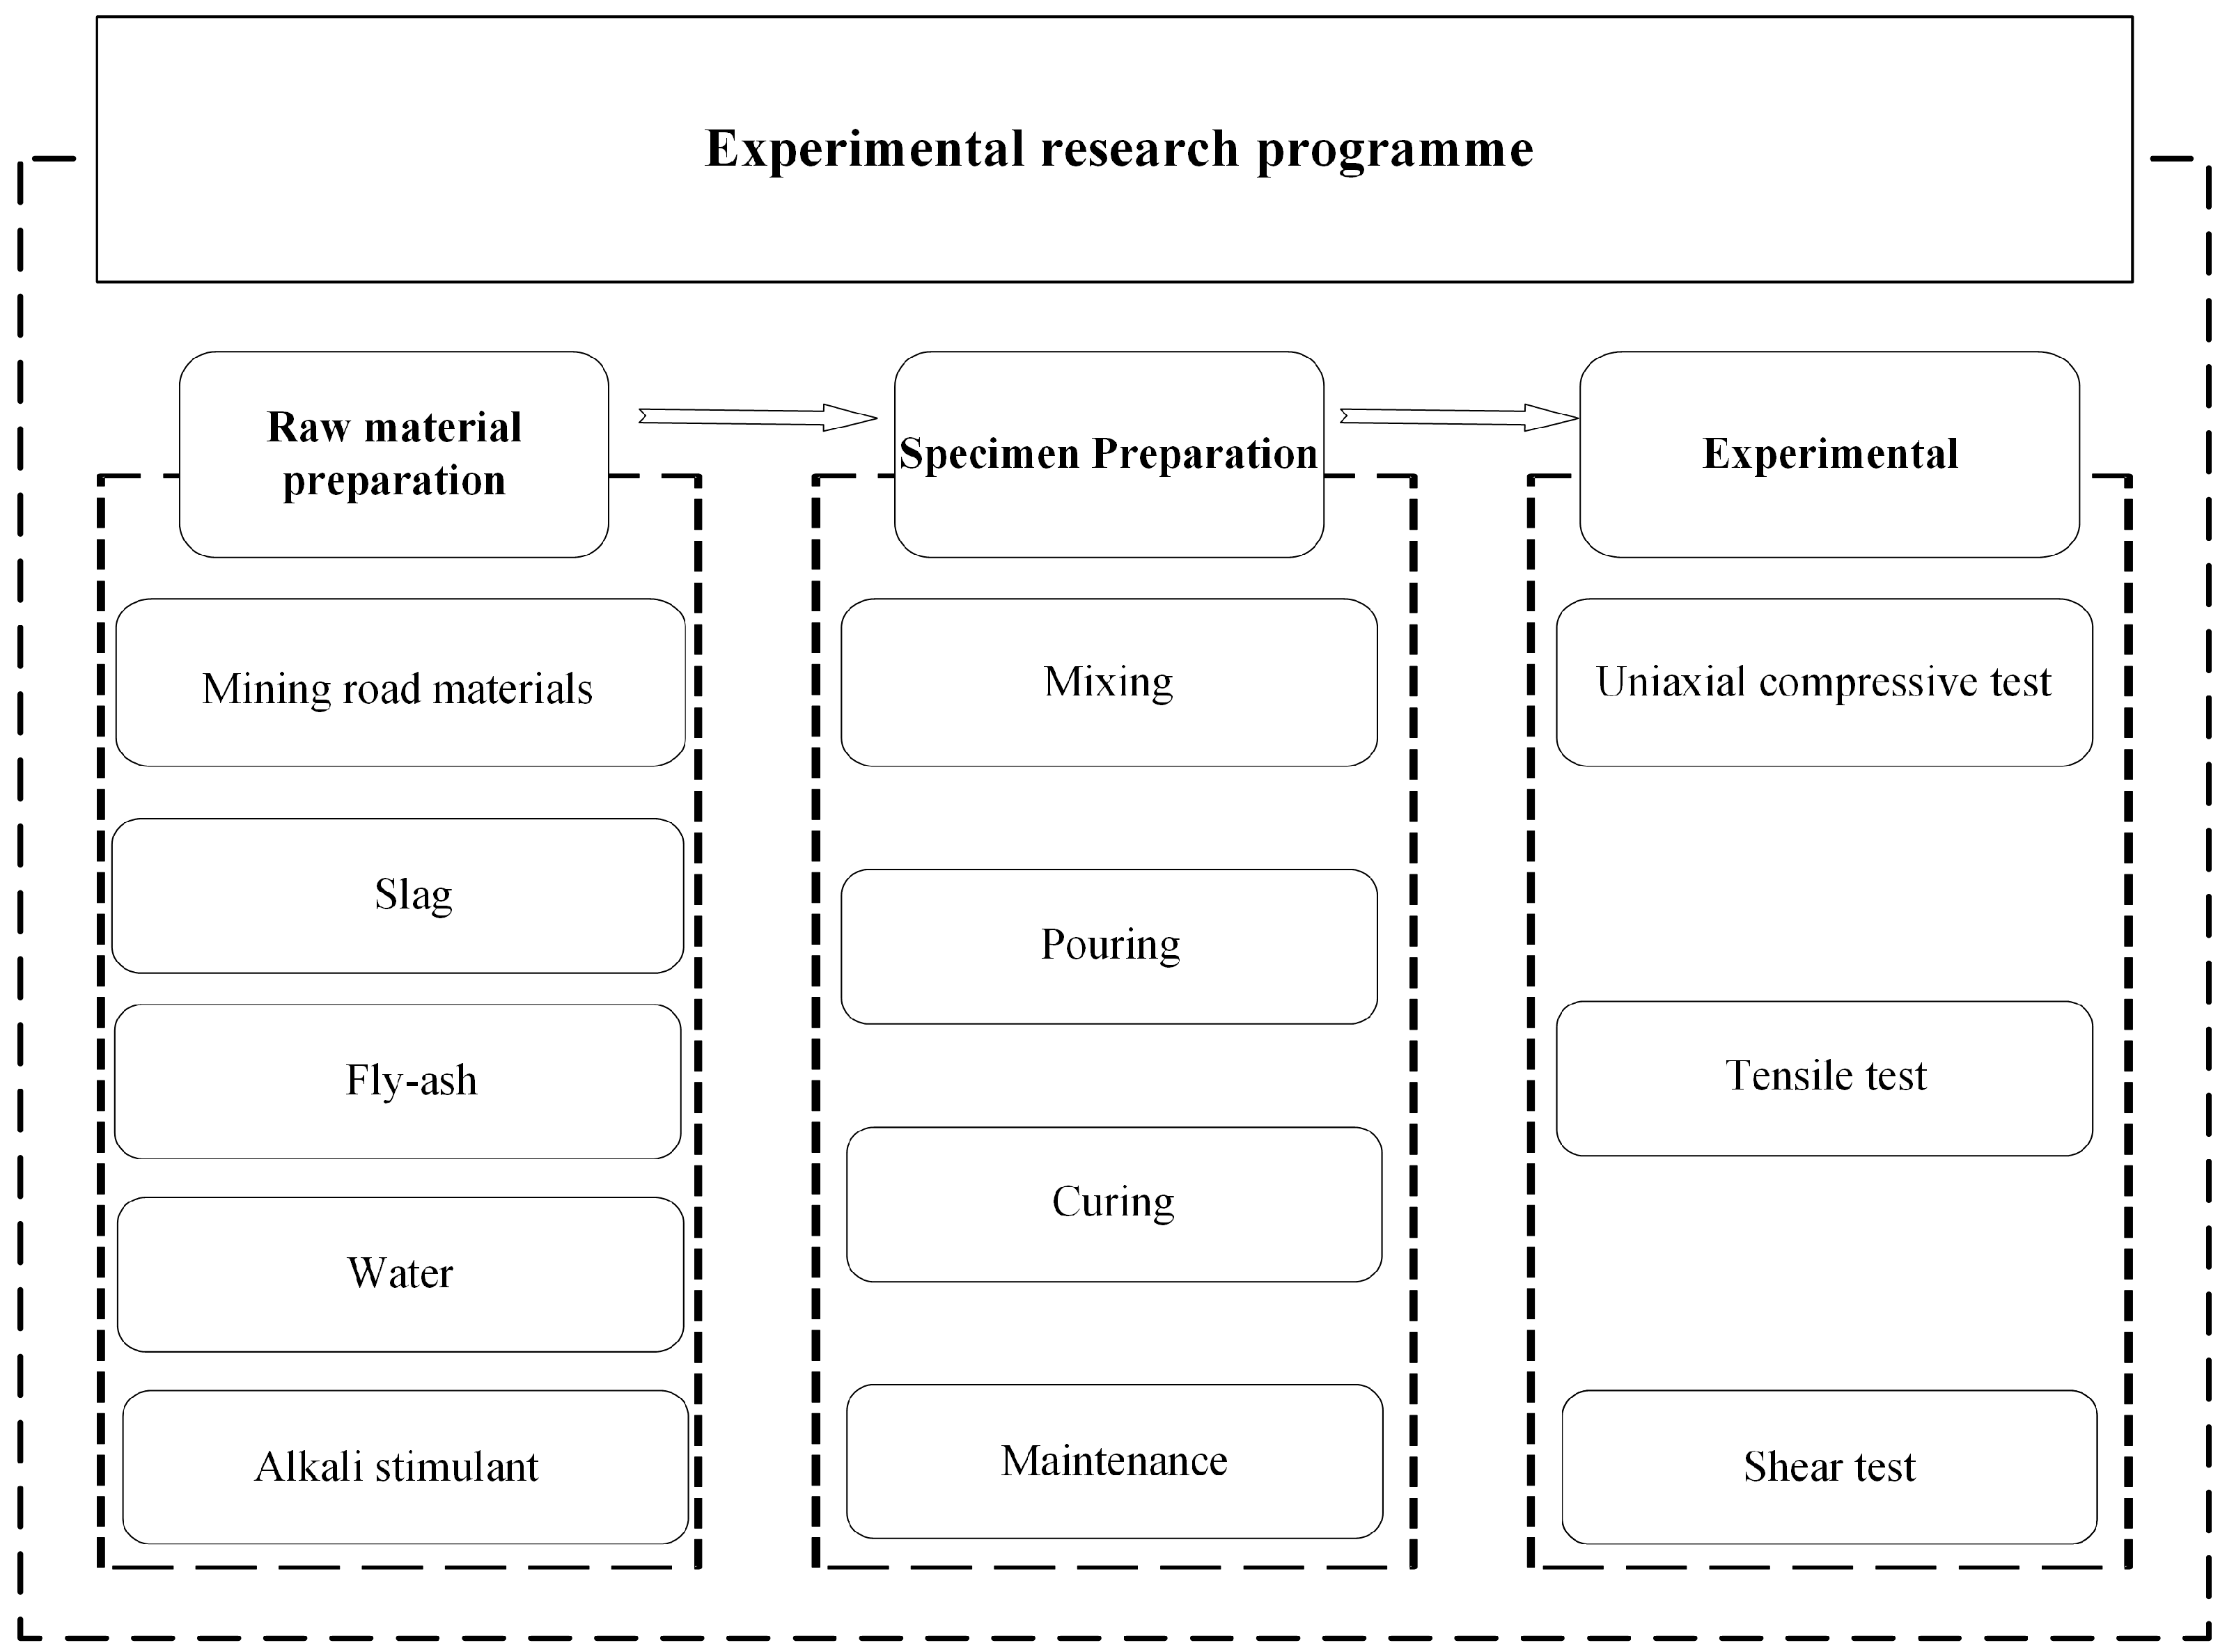
2. Materials and Methods

This section explains the entire process of specimen preparation and testing, as depicted in Figure 1.

2.1. Road Material

One of the main geopolymer materials used in this study is road material taken from mine roads in an open-pit mine in Xinjiang, China. Most of the roads in this mine are temporary and unhardened, mainly consisting of soil and stone mixtures. This matches the characteristics of the majority of open-pit coal mines in Xinjiang, China. The basic parameters of its physical and mechanical properties, as well as the particle size distribution, are shown in Table 1 and Table 2.
To promote practical application, the main geopolymer configuration material for the road surface bulk material of the mine was selected. The road material from the mine was utilized as the primary material during the application stage in each mining area to achieve the desired outcome of solid waste utilization.

2.2. Slag and Fly Ash

The reasons for using slag and fly ash as raw materials in this study are two-fold. They meet the requirements for water-hardening cementitious properties and the glassy texture necessary for geopolymer preparation. On the other hand, the materials can be obtained from industrial sites such as ironworks and power plants located near the mines, which provides convenient conditions for subsequent on-site application.
Slag is the molten material obtained when smelting pig iron in the blast furnace of ironworks. After quenching into granules with water, it becomes industrial solid waste. Most of the slag is vitreous and has the potential to harden when exposed to water. Fly ash is the fine ash captured from the flue gas of pulverized coal-fired boilers in thermal power plants. It is the main solid waste discharged from coal-fired power plants and is predominantly glassy with volcanic ash characteristics.
The slag micro-powder and Class F Grade I fly ash used in this test were purchased from a processing plant near the mine (Zhanteng Mineral Products Processing Factory, Shijiangzhuang, China). The slag and fly ash were tested using X-ray fluorescence spectrometry (XRF) and the Winner3003 laser particle sizing instrument (Jinan Weina Particle Instrument Co. Ltd, Jinan, China.). The chemical compositions are shown in Table 3 and Table 4.

2.3. Alkali Stimulant

Considering the need to make the results of this research more applicable universally and to avoid limitations in on-site large-scale application due to the specificity of alkaline excitants, a sodium silicate was used as the alkaline excitant in this study. This sodium silicate can be easily obtained in large quantities from common chemical manufacturers (Wuxi Yanxiang Chemical Materials Co., Ltd., Wuxi, China). The specific sodium silicate used in this research has an initial modulus of 3.38. The specific parameters are shown in Table 5.
Since a low-modulus alkali exciter with a modulus of n = 1.5 was used in this test, and the initial modulus of the purchased sodium silicate was n = 3.38, NaOH needs to be added for mixing. The sodium silicate with a modulus of 3.38 has a SiO2 content of 26.13% and a Na2O content of 8.25%. To adjust the modulus to 1.5, 16.2 g of NaOH should be added for every 100 g of sodium silicate with a modulus of 3.38.

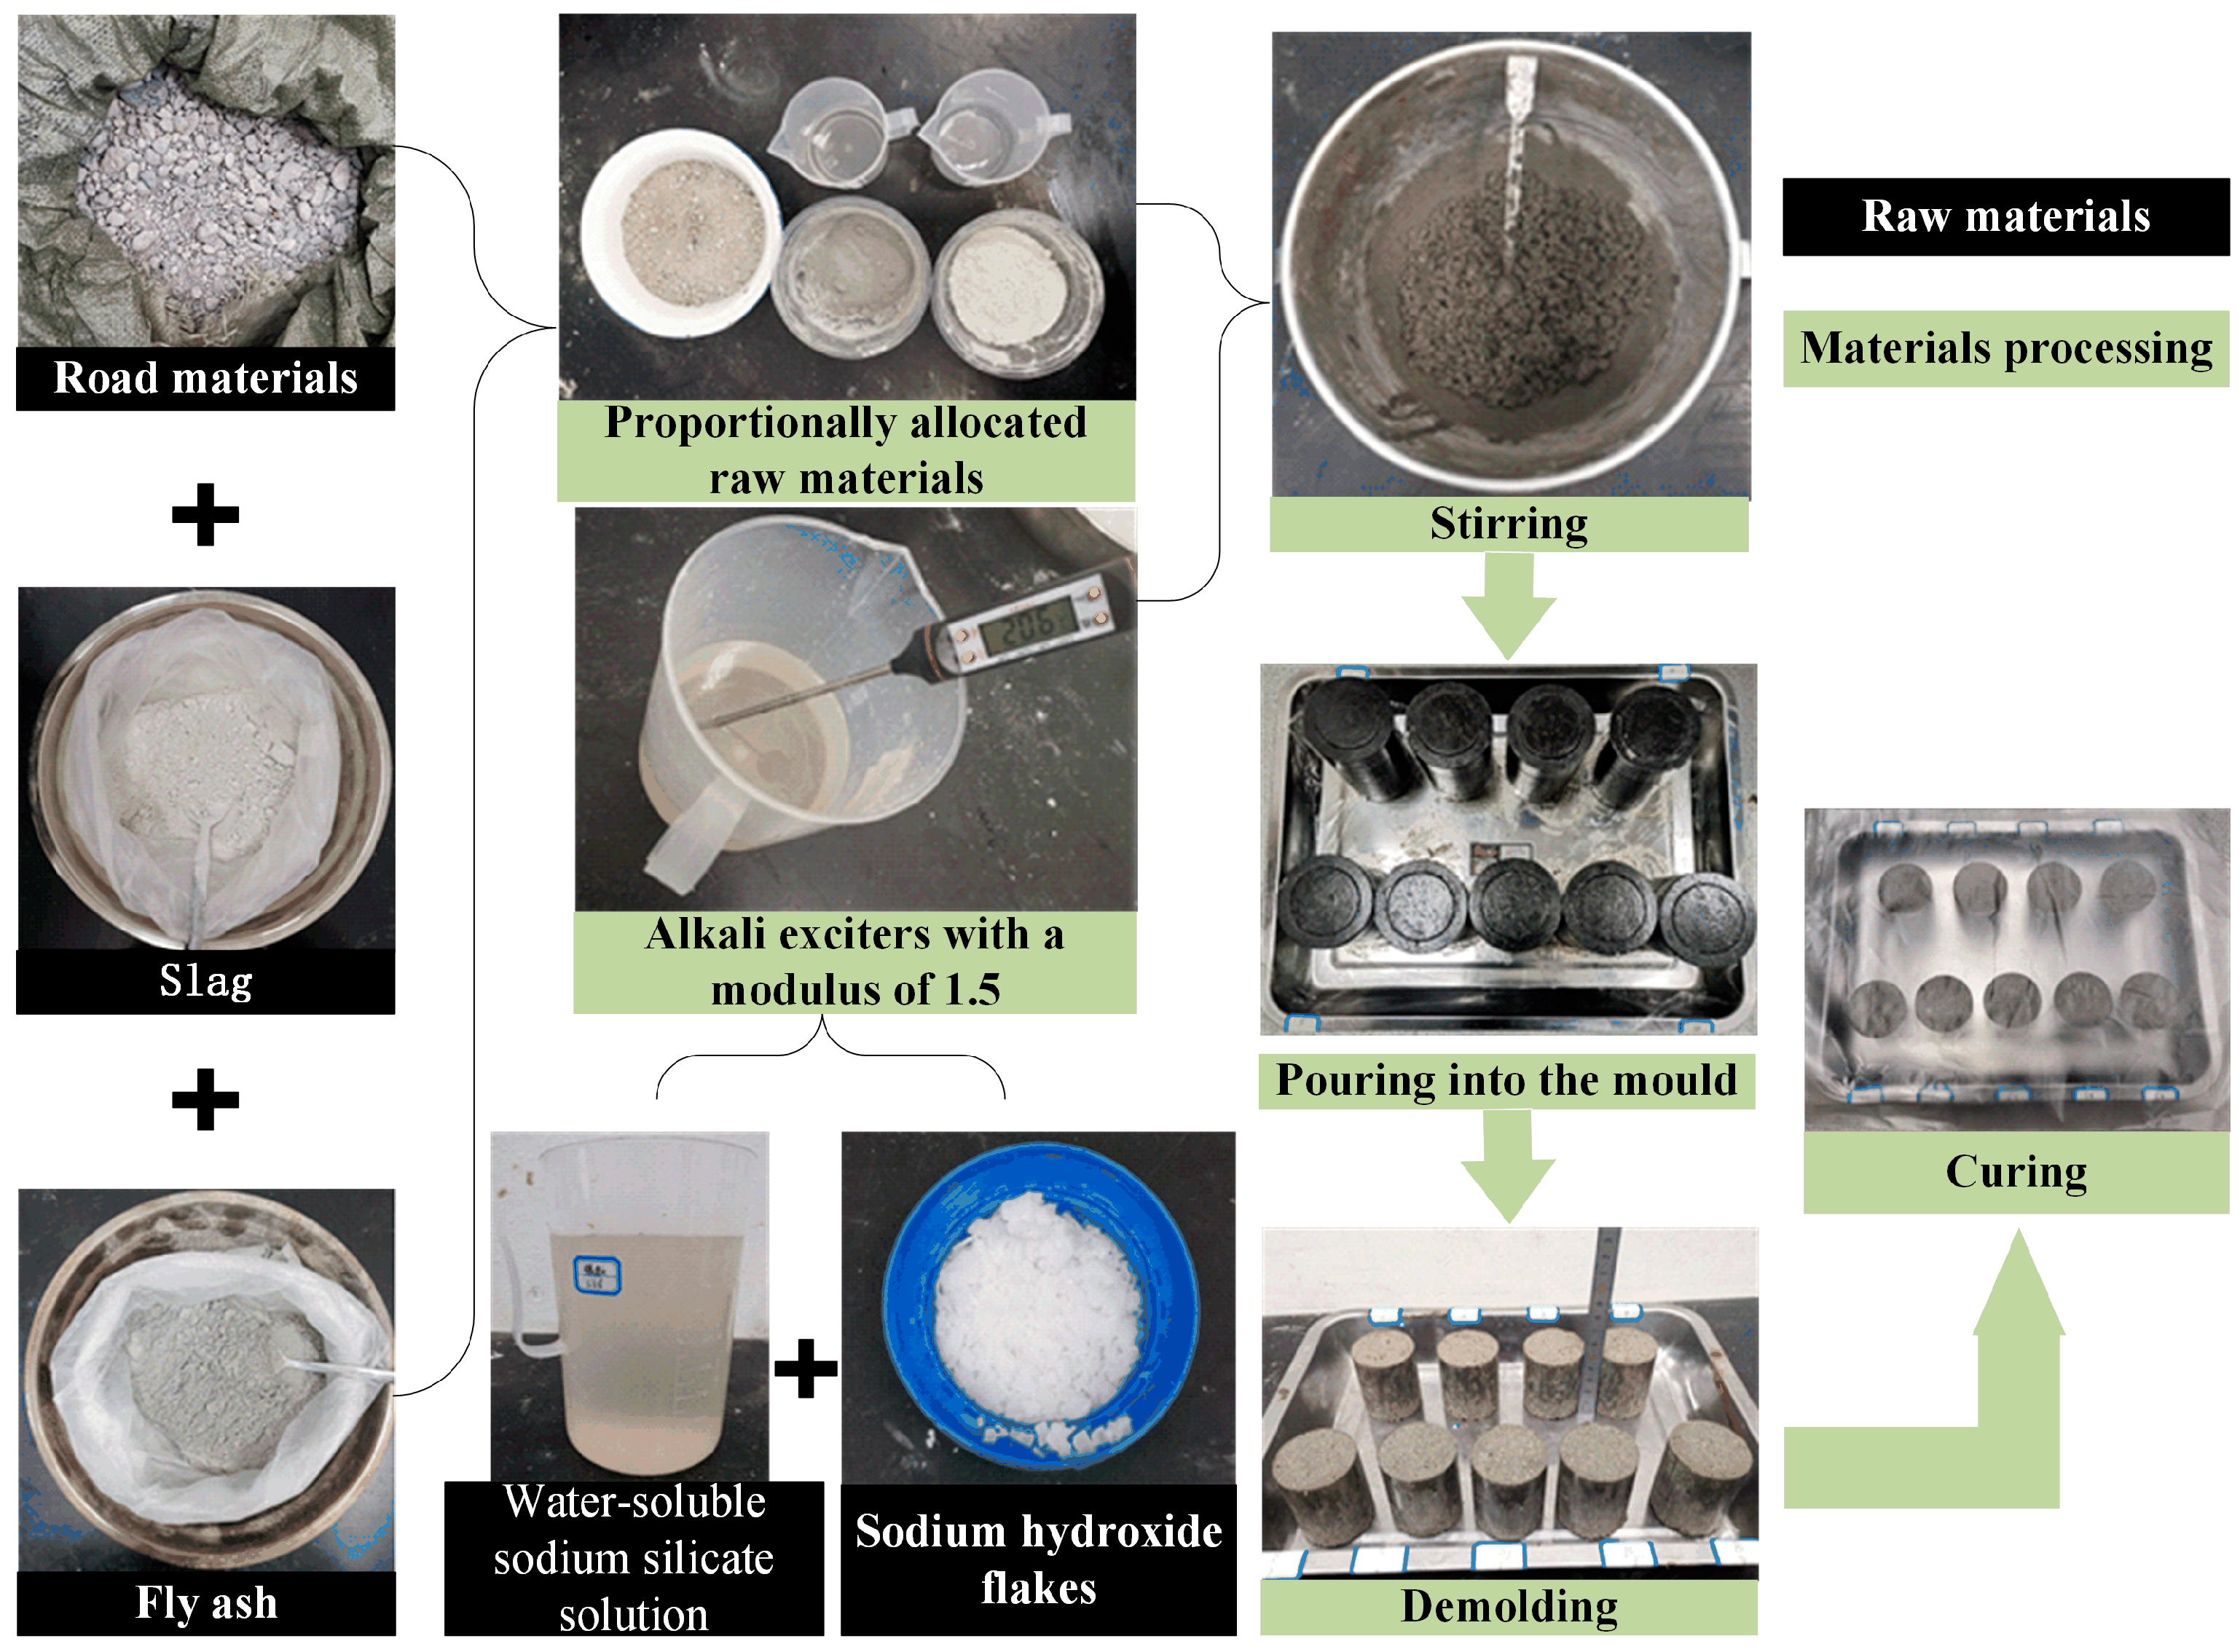
2.4. Mixing, Pouring, Curing and Maintenance

The detailed process of making a sample is shown in Figure 2.
In this study, based on the team’s previous research, the material ratios were configured as follows: 68 g of slag, 23 g of fly ash, 360 g of road material, modulus of 1.5, 40 g of water-soluble sodium silicate, and 10 g of water. After mixing the ground polymer, the specimen is poured into a 150 × 300 mm cylindrical mold. The test cylinder is then left to rest on the demolder for 4 h before removing the specimen. During the operation, it is important to ensure that the force is evenly distributed both on the upper and lower parts. Carefully remove the specimen from the tray on the test bench and cover it with a plastic bag to prevent water droplets from directly dripping onto the specimen, which could affect its maintenance. The specimen was then placed in a standard curing room with a temperature of 20 ± 2 °C and a relative humidity set at 95%. It was cured for a period of 28 days. After curing, the specimen was subjected to the uniaxial compressive, tensile, and shear tests.

2.5. Test Methods and Procedure

The tensile strength, compressive strength, and shear strength trends of the specimens at various freezing temperatures can be determined through the test, as depicted in Figure 3.
The specimens were placed in a fully automated low-temperature freeze–thaw tester (Equipment Model: JC ZDR 5, Xinyuan Electromechanical Instrument Factory, Fushun, China) to undergo freeze–thaw cycles at various freezing temperatures and different numbers of cycles. The tested geopolymers were then analyzed using macro-mechanical and microstructural techniques. The main equipment used for these analyses were the WDW-300 electronic universal testing machine (Sansi Yongheng Technology Co. Ltd, Bingbo, China) and the FEI Quanta TM 250 scanning electron microscope (FEI Corporation, Hillsboro, OR, USA), respectively.
Uniaxial compressive tests were conducted with an initial test force of 200 N and an initial test speed of 5 mm/min. The tests were controlled by displacement loading, with the speed set to 0.5 mm/min. The end mode was set to measure the percentage of fracture, with the end conditions set at 50%. Additionally, an additional end mode was set to measure the maximum test force value of 300 kN. The specimen is loaded in accordance with the test settings until it is destroyed. The Brazilian test method is used at a loading speed of 0.05 MPa/s until destruction.
The shear strength was adjusted based on the shear angle. Then, the specimen was placed in the mold. The mold, along with the specimen, was placed on the testing machine and pressurized. The specimen was loaded at a rate of 0.05 MPa/s until shear damage occurred. In this study, four inclination angles of 40°, 50°, 60°, and 70° were selected to induce shear damage based on the available molds.
Microstructure testing was conducted on the specimen after its destruction. The specimen size was approximately 10 mm × 10 mm × 5 mm, with a flat surface and a clear cross-section. Small pieces were dried, dehydrated, and treated with a gold spray coating. The test chamber was then evacuated and pressurized to 20 kV. The target of observation was identified, and a 40-times magnification was selected.

3. Results

This section may be divided into subheadings. It should provide a concise and precise description of the experimental results, their interpretation, and the conclusions that can be drawn from the experiment.

3.1. Mechanical Properties at Different Freezing Temperatures

The physical and mechanical properties of the specimens at different freeze–thaw cycle temperatures are shown in Figure 4.
It can be seen from Figure 4a that with the freeze–thaw freezing temperature decreasing, the uniaxial compressive strength curve clearly shows a backward and downward trend. The highest point of the curve decreases significantly, and the slope gradually changes from steep to slow. This indicates that the internal cracks of the specimen develop gradually. After reaching the peak value, there is a relatively gentle strain-softening stage, which exhibits obvious ductility characteristics. Under the influence of the freeze–thaw cycles, the decline in the latter part of the curve also increases slowly. This means that the specimen will deteriorate more rapidly after reaching its ultimate bearing capacity.
From Figure 4b, it can be observed that with the freeze–thaw freezing temperature decreasing, there is a clear downward and forward trend in the tensile strength curve. The highest point of the curve is significantly lower, indicating a significant reduction in the tensile strength of the specimen. The highest point of the strain curve decreases, suggesting that internal fissures in the specimen gradually develop. The change in the slope of the curve is not obvious, indicating that the fissures continue to grow. After reaching the peak stress, the curve descends almost linearly, indicating that the fissures quickly connect, leading to sudden failure under force. This process occurs within a very short period of time, unaffected by the freeze–thaw cycles. The freeze–thaw cycle does not impact the rapid strength reduction observed in the latter half of the curve, highlighting the brittle characteristics of the specimen.
As shown in Figure 4c, the impact of freezing temperature on the shear strength of the specimen at various shear angles is consistent. Specifically, the lower the freezing temperature, the lower the shear strength. As the temperature drops, the shear performance of the specimen initially decreases and then gradually stabilizes. According to the shear angle on the specimen, shear damage occurs at different impacts. The main analysis focuses on the change in shear strength at 50° and 60°. Specific performance: At a shear angle of 50°, the shear strength significantly decreased from no freeze–thaw to −5 °C. As the freezing temperature continued to decrease, the slope of the curve decreased, and the reduction tended to flatten. At a shear angle of 60°, the shear strength also significantly decreased from no freeze–thaw to −5 °C. However, in the −5 °C to −15 °C stage, the shear strength decreased less. As the freezing temperature continued to decrease, the curve direction followed a similar trend as under 50°.

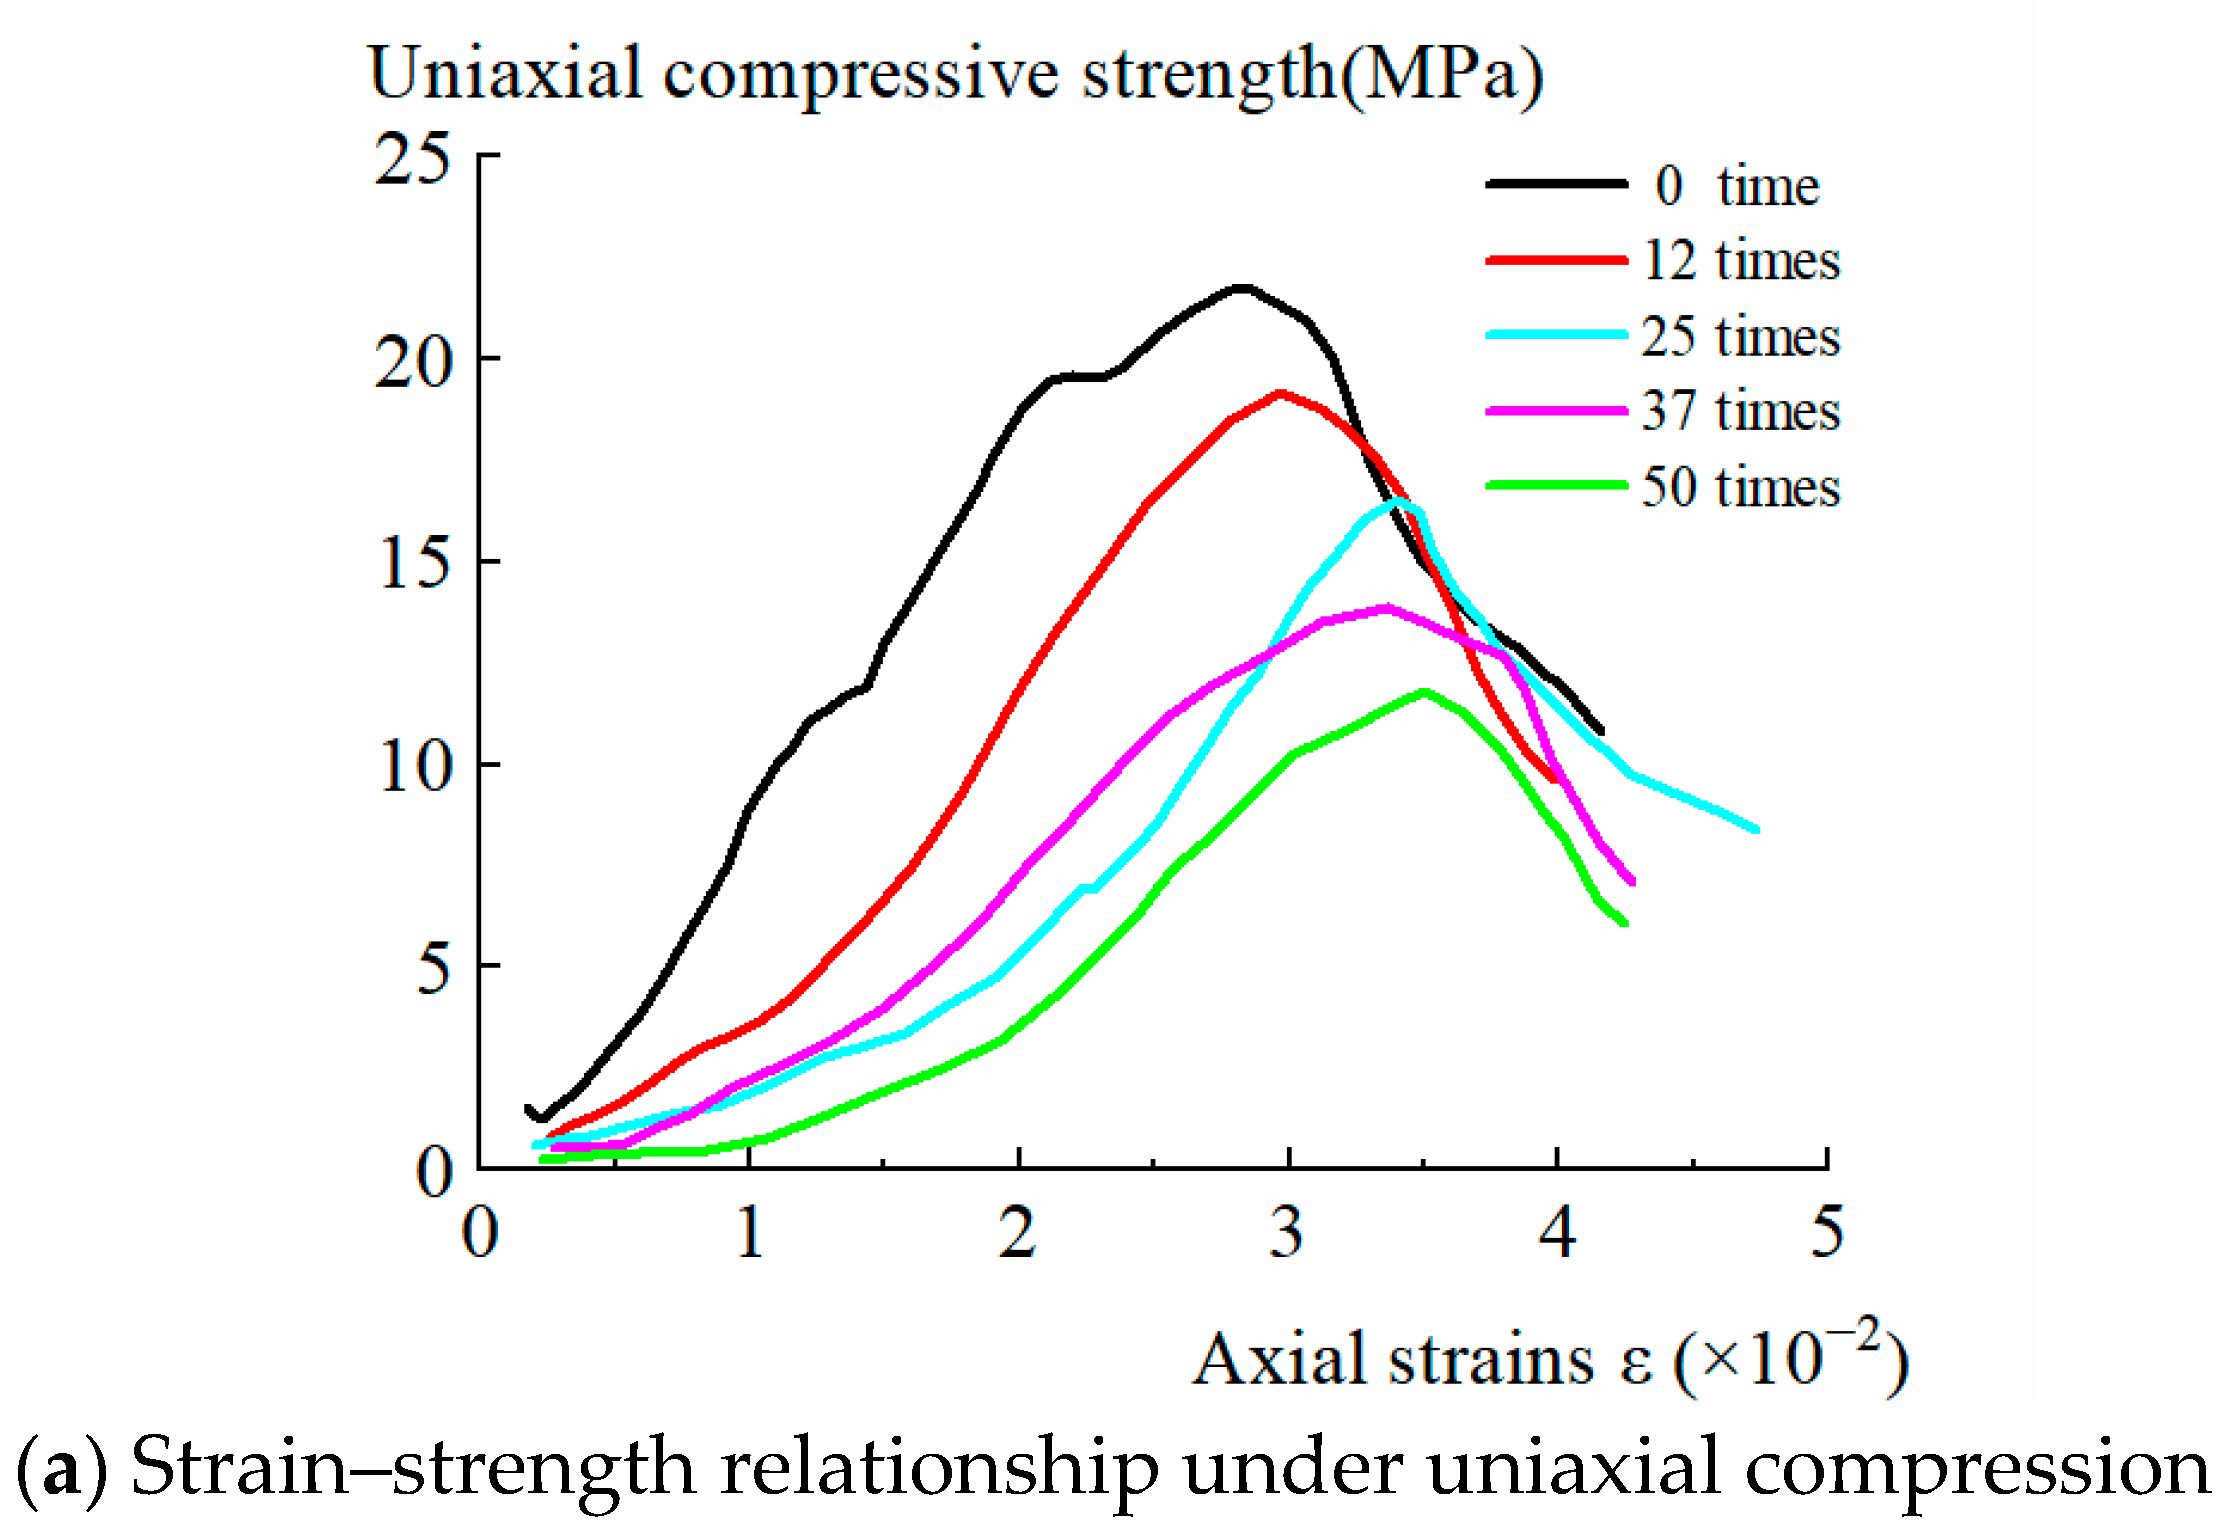
3.2. Mechanical Properties at Different Number of Cycles

The tensile strength, compressive strength, and shear strength trends of the specimens under different cycle times can be obtained through the test, as shown in Figure 5.
From Figure 5a, it can be observed that as the number of freeze–thaw cycles increases, the uniaxial compressive curve exhibits a clear backward and downward trend. The highest point of the curve decreases significantly, and the slope gradually changes from steep to slow, indicating a gradual development of internal cracks in the specimen. After reaching the peak value, there is a relatively gentle strain-softening stage, exhibiting obvious ductility characteristics. Under the influence of freeze–thaw cycles, the decline in the latter half of the curve increases slowly. This means that the specimen’s load-bearing capacity will attenuate more quickly after reaching its ultimate load-bearing capacity. Due to the increase in the number of cycles, the angle between the first half of the strain–strength curve of the specimen and the horizontal coordinate gradually decreases. This indicates that the compaction time of the microcracks increases, suggesting that the internal damage degree of the specimen accumulates and intensifies with each cycle.
As seen in Figure 5b, the curve clearly shifts forward and downward with an increase in the number of freeze–thaw cycles. The highest point of the curve is significantly lower, indicating a significant reduction in the tensile strength of the specimen. The highest point of the strain curve decreases, suggesting that internal fissures in the specimen gradually develop. The change in the slope of the curve is not obvious, indicating that the fissures continue to grow. After reaching the peak stress, the curve descends almost linearly, indicating that the fissures quickly connect, leading to sudden specimen failure under force. This process occurs within a very short period of time, unaffected by the freeze–thaw cycles. The freeze–thaw cycle does not impact the rapid strength reduction observed in the latter half of the curve, highlighting the brittle characteristics of the specimen.
As can also be seen from Figure 5c, the number of cycles at different shear angles and the effect of the number of cycles on shear strength follow a similar pattern. Specifically, as the number of cycles increases, the shear strength decreases. With an increase in the number of cycles, the shear performance of the specimen initially decreases and then stabilizes. According to the shear angle of the specimen, shear damage occurs at different impacts. The main objective is to analyze the change in shear strength under 50° and 60°. Specific performance: At a shear angle of 50°, there is a slight decrease in shear strength, ranging from 0 to 12 times this stage. As the number of cycles increases, there is a linear reduction in shear strength. Similarly, at a shear angle of 60°, the trend of the curve is essentially the same as at 50°.

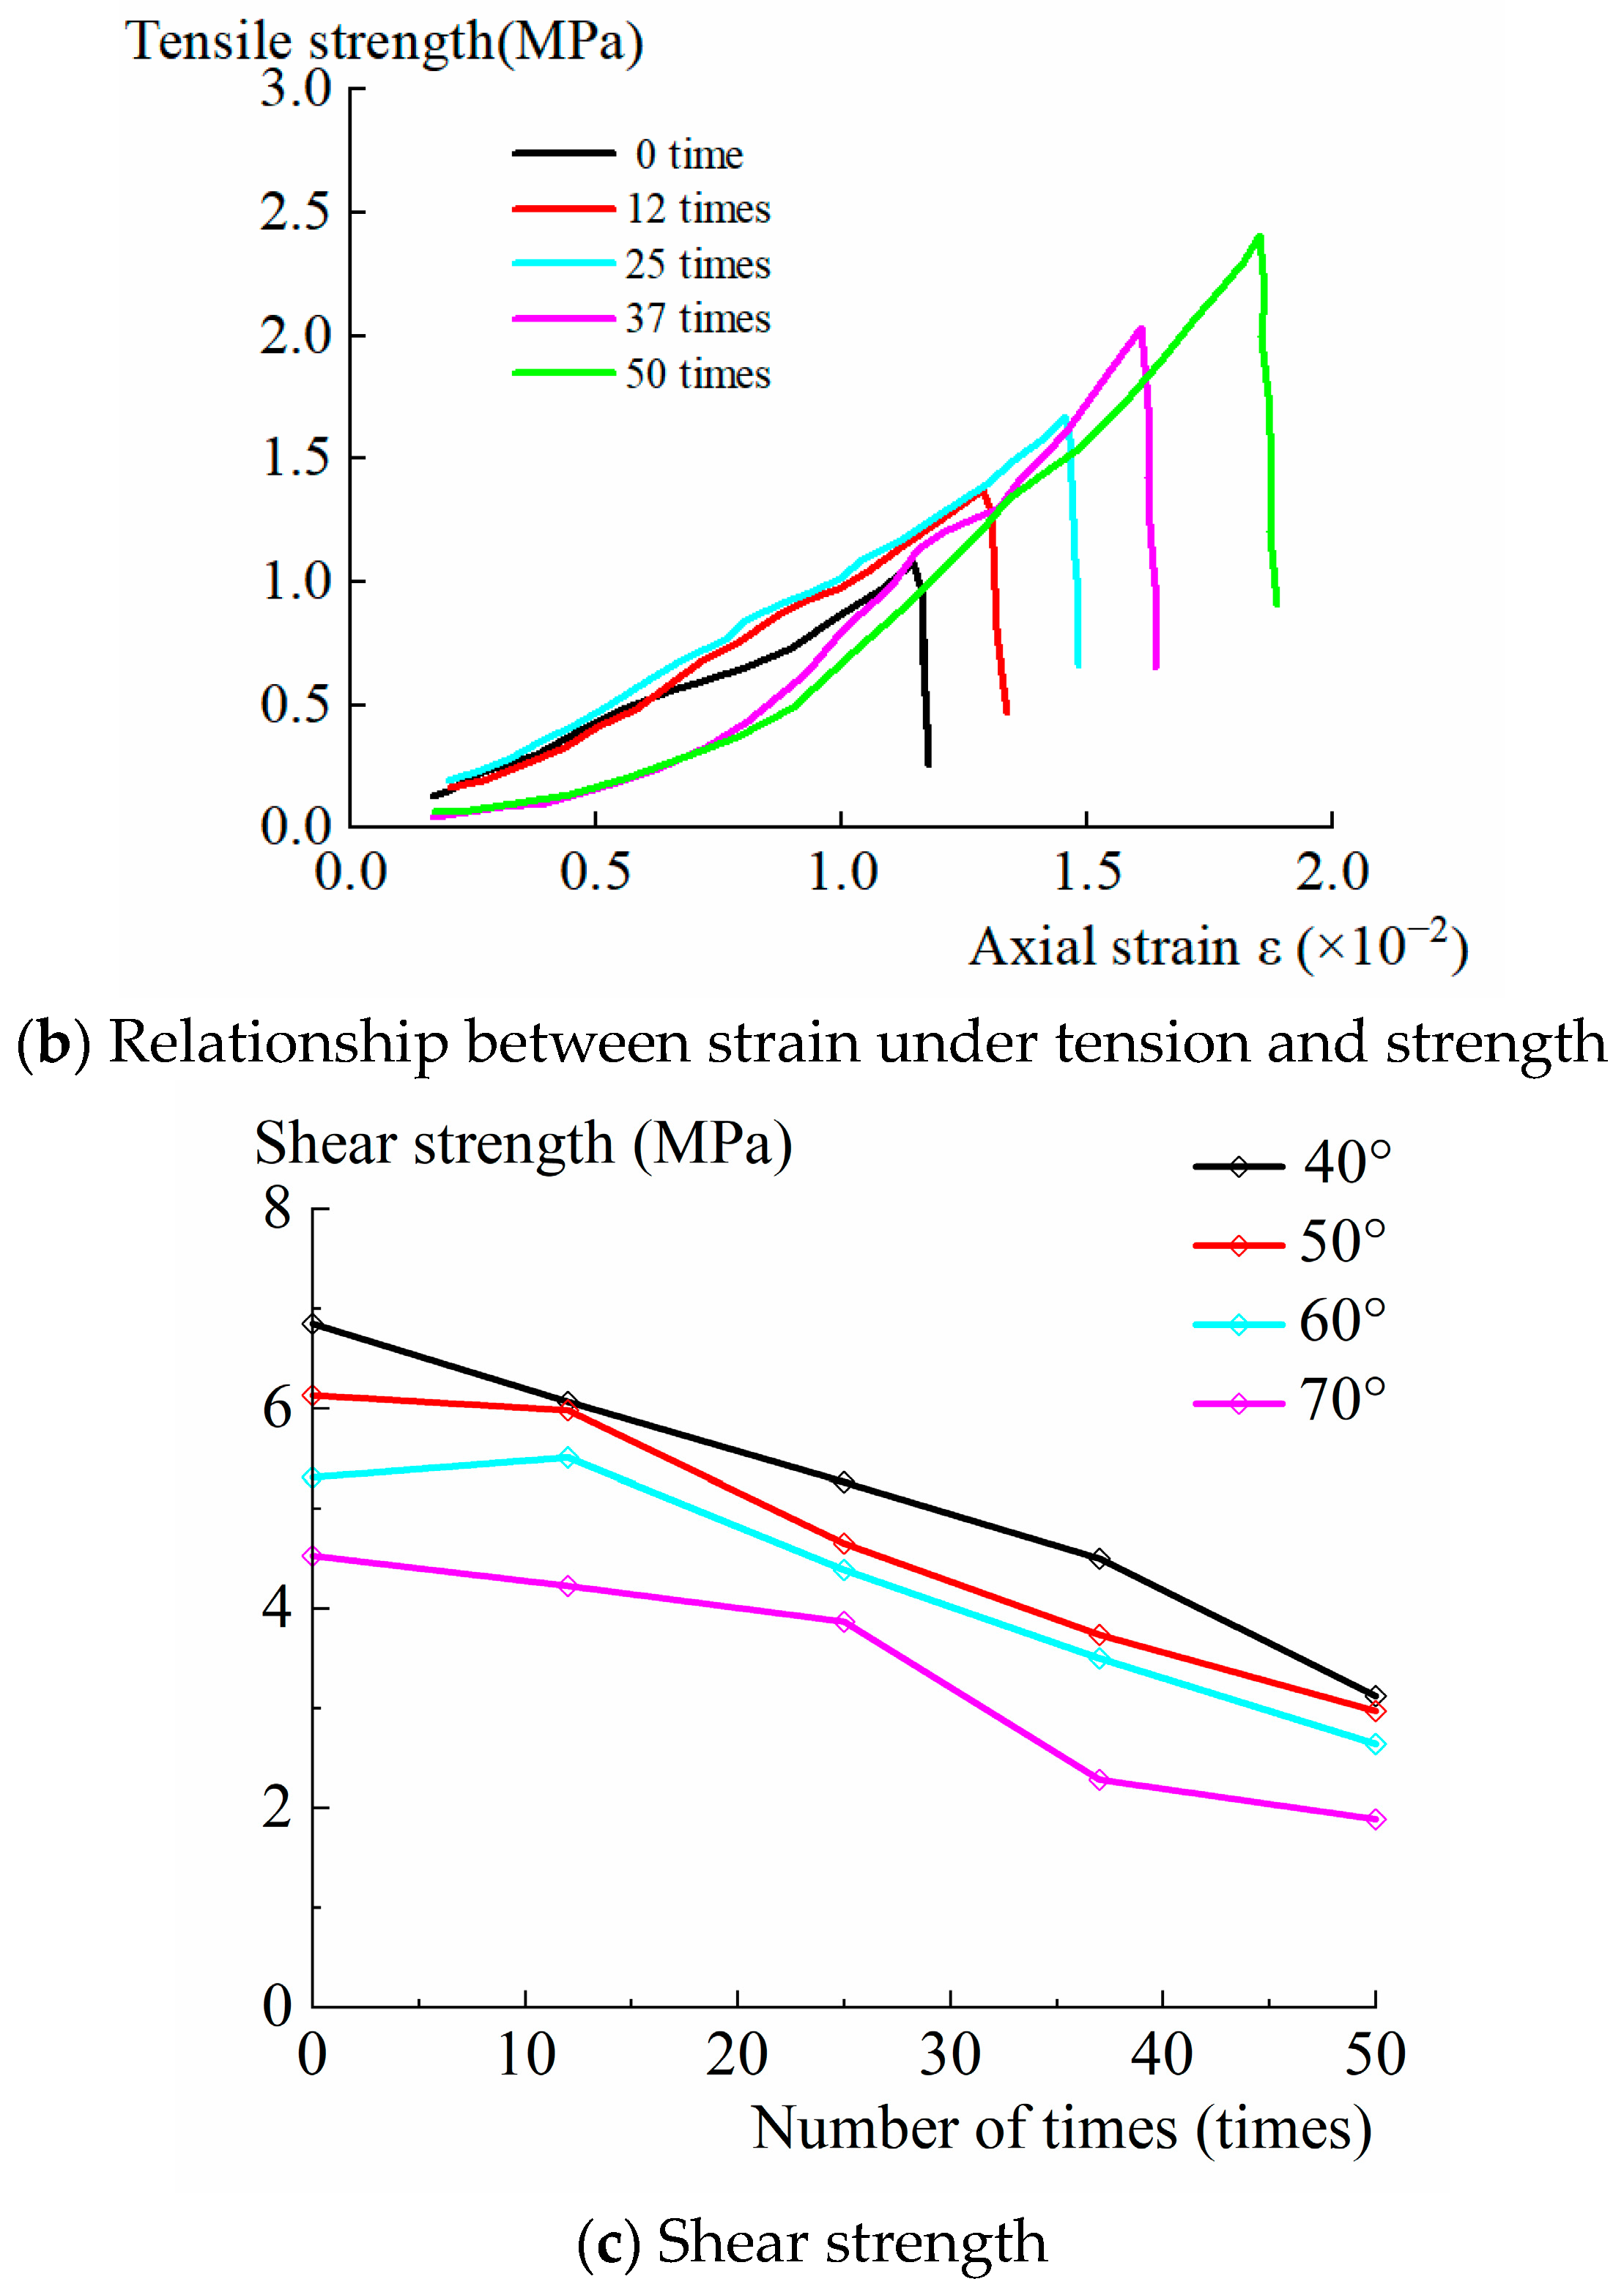
3.3. Microstructural Changes under Freeze–Thaw Damage

Scanning electron microscopy can be used to observe the microstructure of geopolymer-modified mine-road material specimens. However, due to the non-homogeneous nature of these composite materials, they are likely to contain certain structural weaknesses. In this section, the fracture area of the specimen will be magnified under 40× magnification, and energy spectrum analysis data will be generated to analyze the crack information using the specimen microscope. The information regarding the crack in the specimen is shown in Figure 6.
The differences in the morphological characteristics of the fracture zone are mainly reflected in the following: without freeze–thaw, two cracks with a width of 10 μm can be observed in the scanning range across the fracture. The crack periphery is slightly rough, and there is a distribution of crystals around the fracture. The fracture tearing manifests itself as a ductile fracture. Under 12 cycles of freeze–thaw, the number of cracks increases, but the width of a single crack narrows to below 5 μm. There is a single crack running through the individual crystals, and their edges are flush with each other. There are significant crystal penetration characteristics that are typical of crystal penetration. Under 25 cycles of freeze–thaw, the fracture surface is smoother, and there is a single crack running through the crystal. The width of the crack is wider at about 5–10 μm, which is typical of crystal penetration. The significant characteristics of penetrating crystal fracture are as follows: after undergoing freeze–thaw cycles 25 times, the fracture surface appears relatively smooth with a single crack running through the crystal. The width of this crack is approximately 5–10 μm, which is typical for penetrating crystal fracture. After undergoing freeze–thaw cycles 37 times, two obvious cracks can be observed. One of these cracks runs through the entire crystal, while the other bifurcates during the crack expansion process, resulting in the formation of microcracks at both ends. This type of fracture is also considered a penetrating crystal fracture. Under 50 freeze–thaw cycles, a large number of cracks and hole defects emerge from the inside of the specimen. These cracks converge and penetrate the area of the hole, forming a comprehensive network of defects. The cracks also penetrate each other, resulting in perforation cracks.
The elemental distribution in the fracture zone of the specimens under different numbers of freeze–thaw cycles is shown in Figure 7.
Elemental differences in the fracture zone are mainly reflected in the following: Under no freeze–thaw condition, the sample as a whole is dominated by three elements—O, Si, and Al. There is no significant difference between the elements around the two obvious cracks and the rest of the sample. The weight ratios of these elements are as follows: O—57.19%, Si—17.07%, and Al—12.19%. However, under 12 cycles of freeze–thaw, the sample as a whole is dominated by three elements—O, Ca, and Si, and the elements around the cracks are distributed in an aggregated manner. After undergoing 12 cycles of freezing and thawing, the entire sample consists primarily of O, Ca, and Si elements. Several cracks are surrounded by elements that are distributed in an aggregated manner. The weight ratio of the O element is 55.37%, the Ca element is 13.93%, and the Si element is 11.59%. After 25 cycles of freezing and thawing, the sample is mainly composed of O, Si, and Ca elements, with the weight ratio of O element being 48.74%, Si element being 18.87%, and Ca element being 11.59%. After undergoing 37 cycles of freezing and thawing, the specimen is primarily composed of three elements: oxygen (O), calcium (Ca), and silicon (Si). The weight ratio of oxygen is 51.41%, calcium is 15.39%, and silicon is 12.74%. After undergoing 50 cycles of freezing and thawing, the specimen is still dominated by the same three oxygen weight ratios of oxygen (49.76%), silicon (15.70%), and calcium (11.09%).

4. Discussion

4.1. Under Different Freezing Temperatures

By analyzing the variations in mechanical properties of the specimens at various freezing temperatures, it was observed that they followed a linear decrease pattern. The generated trend line exhibited a high degree of fitting to the test values, as indicated by the goodness-of-fit R2 value close to 1. Information on the fitting results of the test data at various temperatures is shown in Figure 8.
As can be seen from Figure 8, overall, the internal damage of the specimen occurs continuously with the reduction of freezing temperature.
From Figure 8a, it can be seen that the damage inside the specimen is clearly manifested in the decay of uniaxial compressive strength. According to the trend of the curve, the change process can be roughly divided into two stages. First, when the freezing temperature is less than −15 °C, the strength of the decay is particularly noticeable. This is especially evident from the freezing and thawing to the freezing temperature of −5 °C, where the slope of decay is the steepest. Second, when the freezing temperature is greater than −15 °C, the strength of the decay starts to weaken, and the curve gradually becomes flatter. The phenomenon can be understood as fatigue damage occurring in the specimen. As the freeze–thaw freezing temperature decreases, the fatigue damage reaches a critical value, causing microcracks to transition from rapid expansion. This is characterized by a rapid decline in strength and a reduction in flatness, i.e., when subjected to the same number of freeze–thaw cycles, lowering the freezing temperature diminishes the compressive properties of the specimen. Additionally, the process of freezing and thawing enhances the formation and expansion of cracks, resulting in a decrease in compressive strength.
As shown in Figure 8b, the damage that occurred inside the specimen is evident from the significant decrease in tensile strength. According to the trend of the curve, the change process can be roughly divided into two stages. In the first stage, when the freezing temperature is less than −15 °C, the strength of the attenuation is particularly obvious. This is especially true from the freezing and thawing to the freezing temperature of −5 °C, where the slope of its attenuation is the largest. In the second stage, when the freezing temperature is greater than −15 °C, the strength of the attenuation begins to weaken, and the curve gradually becomes flat. The phenomenon can be understood as fatigue damage occurring in the specimen. As the freeze–thaw freezing temperature decreases, the fatigue damage reaches a critical value, causing microcracks to transition from rapid expansion to slow expansion. This is characterized by a rapid decline in strength and a reduction in flatness. Under the same number of freeze–thaw cycles, reducing the freezing temperature weakens the tensile properties of the specimen. Conversely, freeze–thaw improves the degree of crack formation and expansion, ultimately resulting in a reduction of tensile strength.
Based on Figure 8c,d, it can be observed that the cohesive force of the specimens showed a linear decrease during the process of reducing freezing temperature. After the freeze–thawing cycle at −35 °C, the cohesive force of the specimens was reduced to 53% of that of the specimens that did not undergo freezing and thawing. The angle of internal friction of the specimens decreased as the freezing temperature decreased from no freezing and thawing to −15 °C and increased as the freezing temperature decreased from −15 °C to −35 °C. As the temperature decreases, the angle of internal friction shows a tendency to initially decrease and then increase. In other words, there is no clear relationship between the change in the angle of internal friction and the freezing temperature.
It can be observed that the decline in the shear strength of the specimen during the freezing and thawing process is primarily caused by changes in the bonding properties between the internal particles. The linkage effect gradually weakens, causing the original particle aggregation to disperse. This results in a rapid decrease in cohesion of the specimen. The freezing and thawing cycle does not have a significant impact on the particle gradation and contact mode, and the macroscopic manifestation of the internal friction angle does not show a regular change.

4.2. Under Different Cycle Times

By analyzing the variation in mechanical properties of the specimens at different cycle times, it was observed that they followed a linear decrease pattern. The generated trend line had a high goodness of fit (R2 close to 1), indicating a strong correlation between the fitted line and the actual test values. Information on the fitting results of the test data for various numbers of freeze–thaw cycles are displayed in Figure 9.
As can be seen from Figure 9, overall, the specimen’s internal damage occurs continuously with an increase in the number of cycles.
From Figure 9a, it can be observed that the damage inside the specimen exhibits a linear decrease in uniaxial compressive strength. The phenomenon can be understood as the specimen undergoing an increasing number of freezing and thawing cycles, which leads to the continuous generation of new cracks and the intensification of internal damage. As the number of micro-fractures increases, the effective particle contact area in any section of the specimen decreases, resulting in a reduction in specimen strength. The uniaxial compressive strength shows a linear decline with an increasing number of cycles, indicating that the specimen has not yet reached the critical value for fatigue damage.
As shown in Figure 9b, the internal damage of the specimen indicates a linear decrease in tensile strength. The phenomenon can be understood as the specimen undergoing an increasing number of freezing and thawing cycles, which leads to the continuous generation of new fissures. As a result, internal damage intensifies, and the number of micro-fissures increases, reducing the effective contact area of particles in any section of the specimen. This reduction in contact area ultimately weakens the specimen’s strength. The tensile strength decreases linearly with an increase in the number of cycles, indicating that the specimen has not yet reached the critical value for fatigue damage internally.
According to Figure 9c,d, the cohesive force of the specimens exhibited a linear decrease as the number of cycles increased. After undergoing 50 freeze–thaw cycles, the cohesive force of the specimens was reduced to 42% of that of the non-freezing and thawing specimens. The angle of internal friction of the specimen decreases from 0 to 25 cycles, increases from 25 to 37 cycles, and then decreases again from 37 to 50 cycles. As the number of cycles increases, the angle of internal friction shows a tendency to decrease, then increase and decrease again. In other words, there is no clear relationship between the change in the angle of internal friction and the number of cycles.
The results of this test are consistent with the existing research results [30,31]. Additionally, as the number of freeze–thaw cycles increases, the water in the specimen forms ice crystals, causing changes in the distribution morphology of the original particles. This leads to the enlargement of the original microcracks, resulting in a looser overall structure and more severe damage. The macroscopic effect is a noticeable weakening of the cohesion of the specimen. However, the freeze–thaw cycle has little impact on the particle gradation and the contact mode of the specimen. The macroscopic effect is that the angle of internal friction does not show any regular changes.

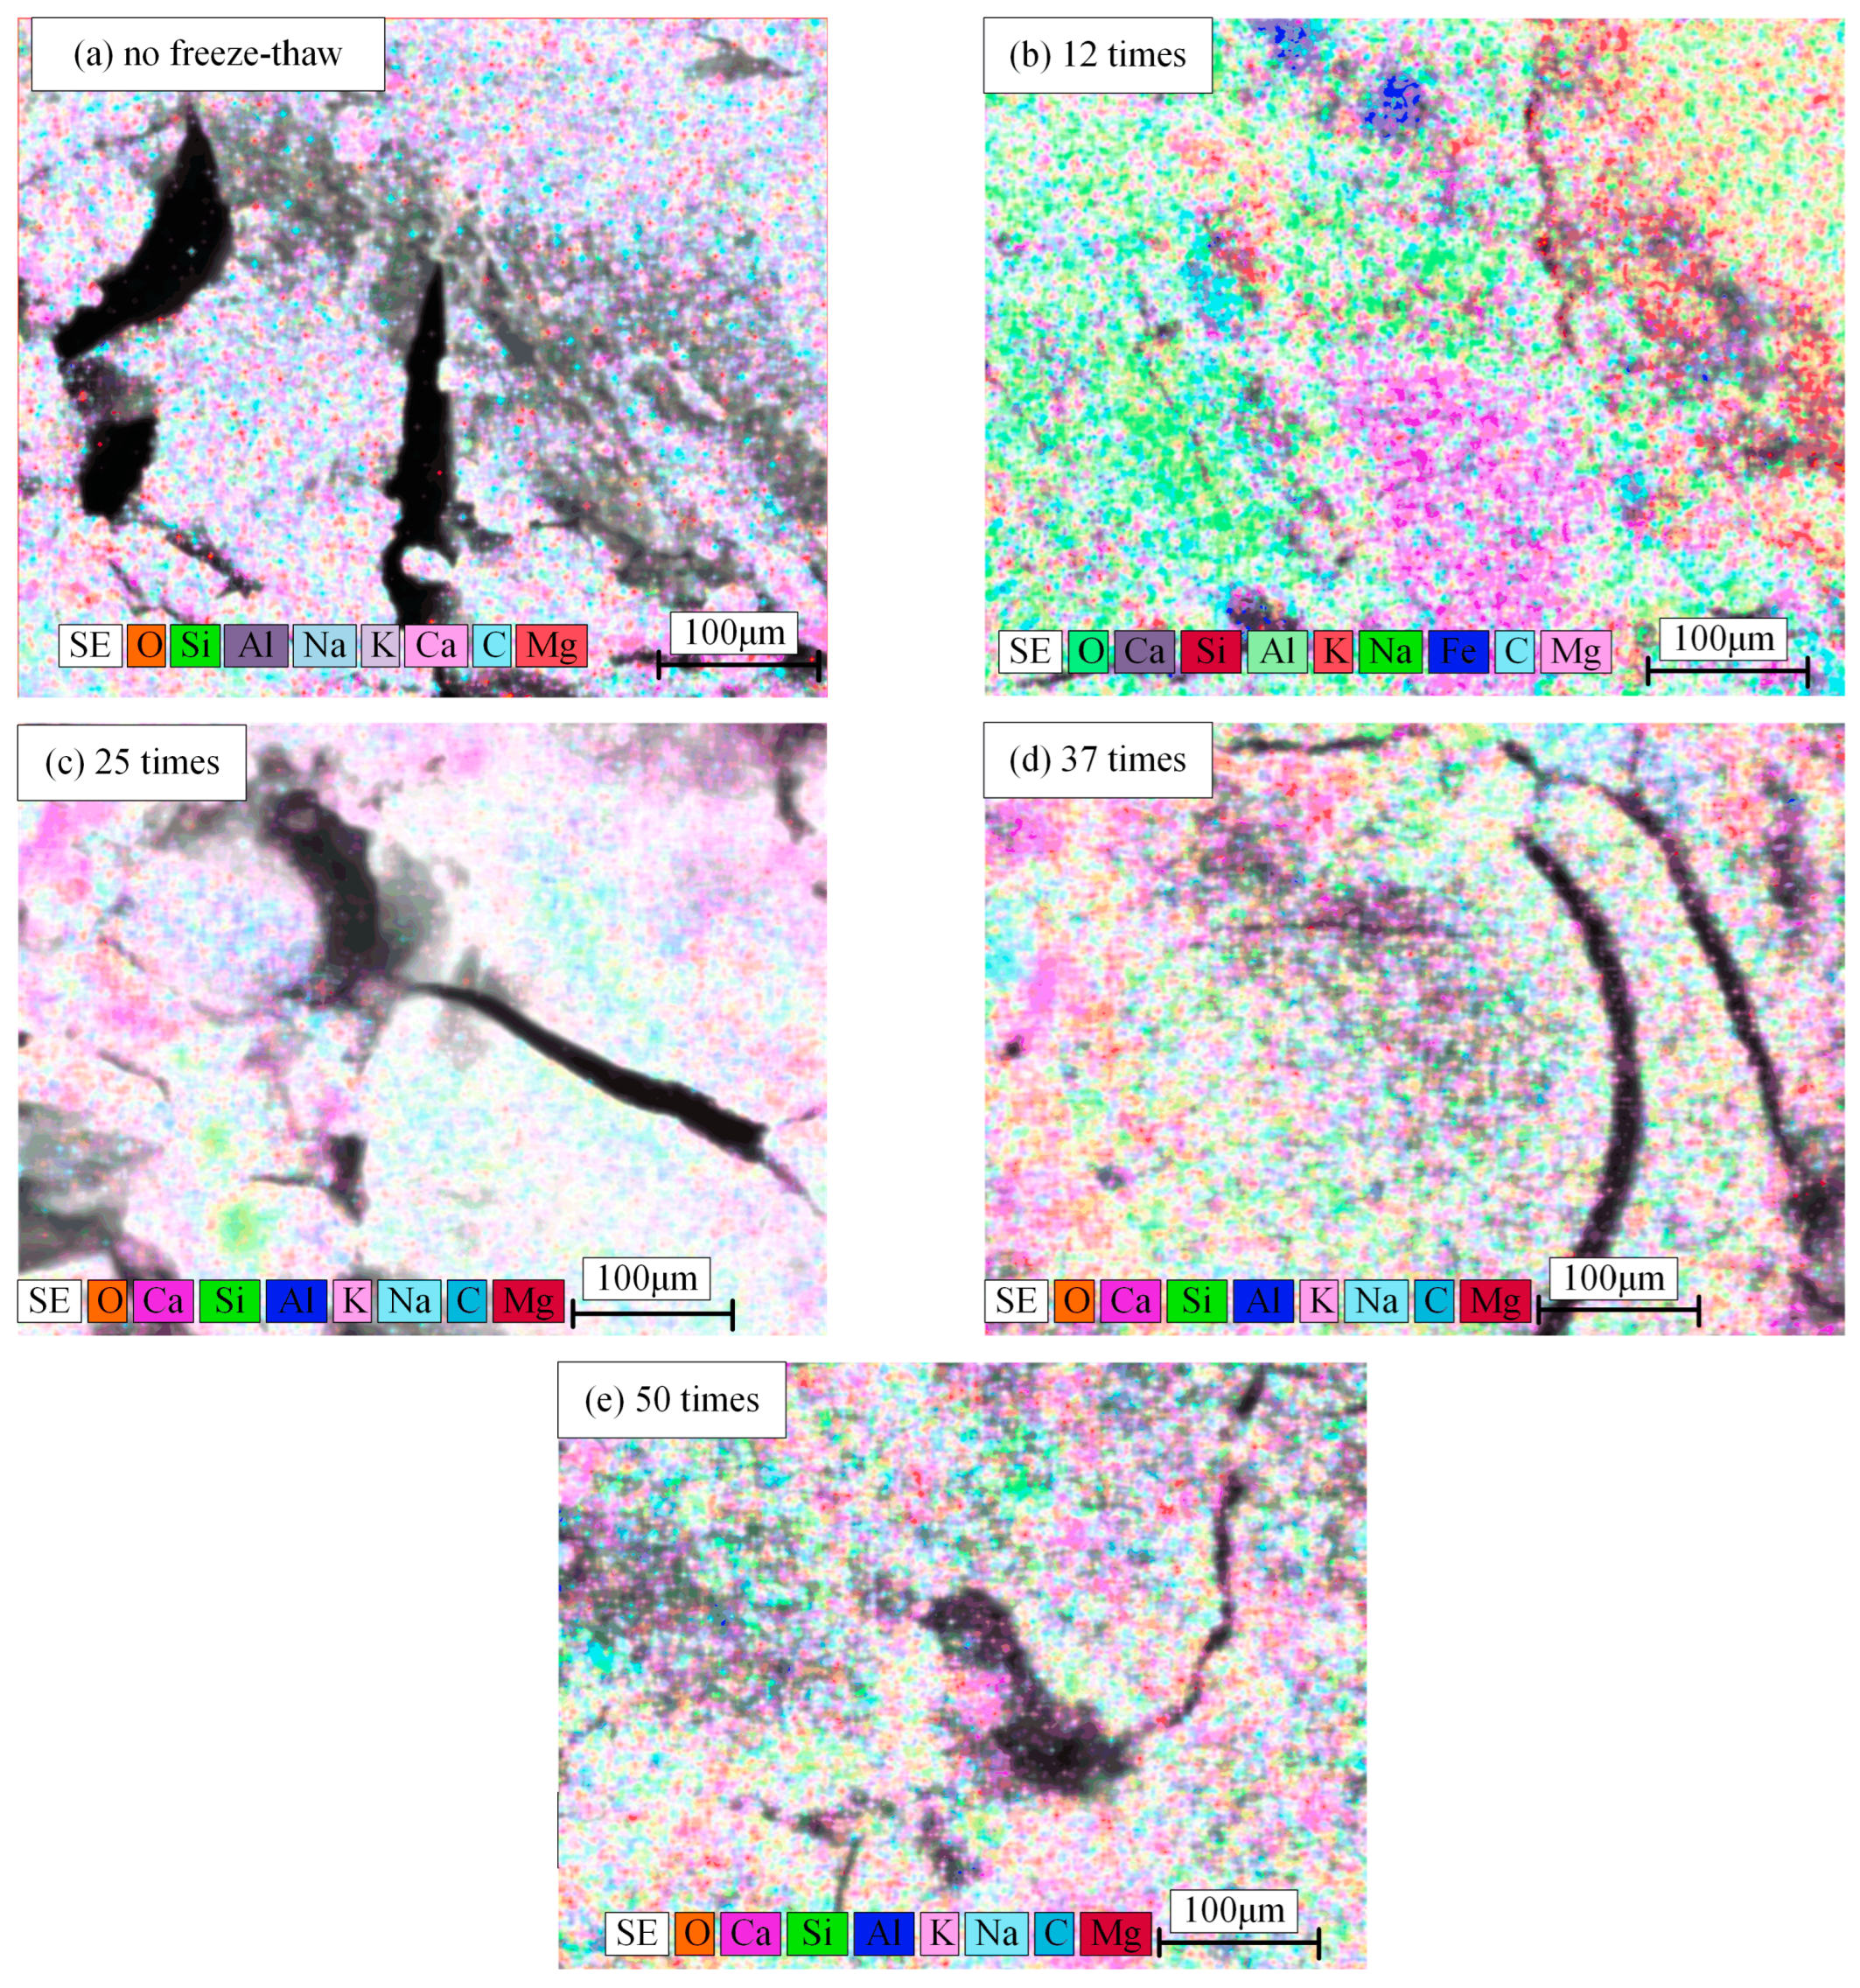
4.3. Microstructure Changes

(1) Unlike the results of existing studies [32], this study not only analyzed the evolution of mechanical properties under different numbers of freezing and thawing cycles but also discovered differences in the fracture morphology of the specimens when subjected to varying numbers of cycles. This indicates the detrimental effect of freezing and thawing on geopolymer-modified mine-road materials.
According to the characteristics of the morphology of the specimen, the impact load on the specimen’s fracture mode under freezing and thawing can be determined. Without freezing and thawing, the fracture mode of the specimen is mainly dominated by toughness. With 12 and 25 characteristics of the morphology, the specimen shifts to mainly crystalline perforation, indicating that the damage to the specimen starts to become evident with increasing cycles of freezing and thawing. With 37 cycles of freezing and thawing, the fracture mode of the specimen is mainly through-crystal fracture, with some instances of along-crystal fracture. Under 50 cycles of freezing and thawing, the fracture mode of the specimen is dominated by along-crystal fracture, and the damage caused by freezing and thawing is further reflected in some instances.
From the perspective of fracture mechanics, the energy consumption of the fracture modes of the specimens under impact loading can be ranked as follows: ductile fracture (high) > perforation fracture (average) > rim fracture (low). According to the fracture mode and energy consumption law, it can be deduced that at the macro level, the specimen experiences a decrease in the energy required for mechanical destruction after freeze–thaw damage as the number of cycles increases. This is a mechanical test that measures the energy required for a material to become weaker, resulting in a decrease in the maximum load it can withstand. This reduction in strength leads to a decline in mechanical properties. With the increase in the number of freeze–thaw cycles, the internal cracks of the specimen also continue to extend and expand. This leads to a decrease in internal structural bonding and densification, and a decline in the macroscopic mechanical properties.
(2) According to the results of the uniaxial compressive test and the energy spectrum scanning of the fracture zone micro-morphology, differences in the distribution of elements in the fracture zone of the specimen can be observed under different cycle times. As discussed in the second chapter of this paper, the specimen is primarily composed of mine-road materials, slag, fly ash, and alkali exciters. Analyzing the spectrum information, it can be seen that the composition of the fracture zone material remains basically unchanged, but there are changes in the main elements. Prior to freezing and thawing, there were no elements of O, Si, and Al, but after freezing and thawing, the elements of O, Ca, and Si were present, indicating a change from Al to Ca. Regardless of the number of freezing and thawing cycles, the main elements in all four groups of specimens were O, Ca, and Si, with only the order of Ca and Si changing before and after some cycles. The slag contains 36.76% CaO and 15.29% Al2O3. The fly ash, on the other hand, has 24.01% Al2O3 and 0.69% CaO. According to the changes in elemental proportion observed after freezing and thawing of the specimen, it can be concluded that the rupture area of the specimen before freezing and thawing is primarily caused by fly ash agglomeration. However, after freezing and thawing, the rupture area is dominated by slag agglomeration. This indicates that slag is more susceptible to deterioration. This indicates that slag is more susceptible to deterioration after freezing and thawing compared to fly ash. In the subsequent research on antifreeze performance, in order to enhance its effectiveness, it is recommended to decrease the amount of slag and increase the amount of fly ash.

5. Conclusions

The mechanical properties of geopolymers in freeze–thaw environments are highly dependent on the freezing temperature and number of cycles. These factors affect the main elements and fracture modes of geopolymers. The changes in the mechanical properties and micro-morphological patterns of geopolymers under the influence of freeze–thaw environments are as follows:
(1)
With the decrease in freeze–thaw freezing temperature, the strength of the specimen follows a pattern of initially decreasing and then stabilizing. The uniaxial compressive strength decreased from 21.62 MPa to 13.19 MPa after fitting a quadratic curve and subjecting it to a freeze–thaw cycle at −35 °C. This represents a strength reduction of 61%. Similarly, the tensile strength decreased from 2.43 MPa to 1.19 MPa after fitting a quadratic curve and subjecting it to the same freeze–thaw cycle. This represents a strength reduction of 49%, which is greater than the loss in uniaxial compressive strength.
(2)
With an increase in the number of freeze–thaw cycles, the strength of the specimen showed a linear decrease according to the law of change. The uniaxial compressive strength after fitting was found to be a linear function of reduction. From no freeze–thaw, the strength reduced from 21.62 MPa to 11.63 MPa, resulting in a discount of 54%. Similarly, the tensile strength after fitting was also a linear function of reduction. It decreased from 2.43 MPa to 1.09 MPa, resulting in a discount of 45%. This discount is greater than the loss of uniaxial compressive strength.
(3)
With an increase in the number of freeze–thaw cycles, the internal structure of the specimen gradually becomes looser, transitioning from dense to loose. The fracture mode changes from ductile fracture to perforation fracture and then to along-crystal fracture. Additionally, the magnitude of energy dissipation at the time of destruction gradually decreases, resulting in a decrease in the maximum load at the time of destruction. The main elements also change from O, Si, and Al under no freeze–thaw conditions to O, Ca, and Si after freeze–thaw. This change is attributed to the high content of CaO in the slag and the high content of Al2O3 in fly ash. It is possible to achieve a reduction in strength of up to 45%, which is greater than the loss of uniaxial compressive strength. Based on the Al2O3 content, it can be concluded that the rupture area of the specimen before freezing and thawing is primarily caused by fly ash agglomeration. However, after freezing and thawing, the rupture area is mainly due to slag agglomeration. This indicates that slag is more susceptible to the detrimental effects of freezing and thawing compared to fly ash.
This study provides strong evidence of the mechanisms that cause changes in the mechanical properties and micro-morphology of geopolymers when exposed to freeze–thaw cycles at different temperatures. The study of macroscopic mechanical property changes and microscopic dimensions is highly significant for the research and development of high-strength geopolymers in freeze–thaw environments.

Author Contributions

Conception, X.Z.; Methodology, W.Z.; Software, L.T.; Validation, X.Z.; Formal analysis, X.Z.; Survey, W.Z.; Resources, Y.Y.; Data organization, Y.Y.; Writing—original draft preparation, L.T.; Writing—review and editing, L.T.; Visualization, Y.T.; Supervision, X.L.; Project administration, X.L.; Funding acquisition, X.L. All authors have read and agreed to the published version of the manuscript.

Funding

This research was funded by Lu Xiang under Grant No. [52204159] (National Natural Science Foundation of China) and [BK20221125] (Natural Science Foundation of Jiangsu Province).

Data Availability Statement

The data that support the findings of this study are available from the corresponding author upon reasonable request.

Acknowledgments

All authors would like to express their gratitude to the Editorial Board for their guidance and handling of the article. Additionally, Lixiao Tu and Xiang Lu are extremely thankful to the reviewers for their valuable feedback, which greatly improved the quality of the article. Each of your comments was instrumental in enhancing the overall content. All authors thank you for your financial support and relevant technical support.

Conflicts of Interest

The authors declare no conflict of interest.

References

  1. Thompson, R.; Visser, A.; Miller, R.; Lowe, T. Development of real-time mine road maintenance management system using haul truck and road vibration signature analysis. Transp. Res. Rec. 2003, 1819, 305–312. [Google Scholar] [CrossRef]
  2. Xu, X.; Zhang, J.; Yang, R. Structure and properties of alkali-inspired ground polymer cementitious building materials. J. Ezhou Univ. 2011, 18, 45–48. [Google Scholar]
  3. Huang, K.; Ma, Y.; Guo, Y.; Li, Z. Properties of Alkali-activated Fly Ash/Slag Composite System. Bull. Chin. Ceram. Soc. 2015, 34, 2769–2774. [Google Scholar] [CrossRef]
  4. Madhav, T.V.; Reddy, I.V.R.; Ghorpade, V.G.; Jyothirmai, S. Compressivestrength study of geopolymer mortar using quarry rock dust. Mater. Lett. 2018, 231, 105–108. [Google Scholar] [CrossRef]
  5. Kawalec, J.; Grygierek, M.; Koda, E.; Osinski, P. Lessons Learned on Geosynthetics Applications in Road Structures in Silesia Mining Region in Poland. Appl. Sci. 2019, 9, 1122. [Google Scholar] [CrossRef]
  6. Segui, P.; Safhi, A.e.M.; Amrani, M.; Benzaazoua, M. Mining Wastes as Road Construction Material: A Review. Minerals 2023, 13, 90. [Google Scholar] [CrossRef]
  7. Hu, Y. Mechanical and High Temperature Resistance Properties of Fly Ash Geopolymer. Master’s Thesis, China University of Mining and Technology, Xuzhou, China, 2017. [Google Scholar]
  8. Patel, Y.J.; Shah, N. Development of self-compacting geopolymer concrete as a sustainable construction material. Sustain. Environ. Res. 2018, 28, 412–421. [Google Scholar] [CrossRef]
  9. Cao, Y.F.; Tao, Z.; Pan, Z.; Wuhrer, R. Effect of calcium aluminate cement on geopolymer concrete cured at ambient temperature. Constr. Build. Mater. 2018, 191, 242–252. [Google Scholar] [CrossRef]
  10. Davidovits, J.; Huaman, L.; Davidovits, R. Ancient geopolymer in south-American monument. SEM and petrographic evidence. Mater. Lett. 2019, 235, 120–124. [Google Scholar] [CrossRef]
  11. Celik, A.; Yilmaz, K.; Canpolat, O.; Al-Mashhadani, M.M.; Aygörmez, Y.; Uysal, M. High-temperature behavior and mechanical characteristics of boron waste additive metakaolin based geopolymer composites reinforced with synthetic fibers. Constr. Build. Mater. 2018, 187, 1190–1203. [Google Scholar] [CrossRef]
  12. Chen, X.; Zhou, M.K.; Shen, W.G.; Zhu, G.R.; Ge, X.X. Mechanical properties and microstructure of metakaolin-based geopolymer compound-modified by polyacrylic emulsion and polypropylene fibers. Constr. Build. Mater. 2018, 190, 680–690. [Google Scholar] [CrossRef]
  13. Novais, R.M.; Carvalheiras, J.; Capela, M.N.; Seabra, M.P.; Pullar, R.C.; Labrincha, J.A. Incorporation of glass fibre fabrics waste into geopolymer matrices: An eco-friendly solution for off-cuts coming from wind turbine blade production. Constr. Build. Mater. 2018, 187, 876–883. [Google Scholar] [CrossRef]
  14. Xue, X.; Liu, Y.L.; Dai, J.G.; Poon, C.S.; Zhang, W.D.; Zhang, P. Inhibiting efflorescence formation on fly ash-based geopolymer via silane surface modification. Cem. Concr. Compos. 2018, 94, 43–52. [Google Scholar] [CrossRef]
  15. van Leeuwen, R. The Effects of Limestone Powder Particle Size on the Mechanical Properties and the Life Cycle Assessment of Concrete. J. Civ. Eng. Res. 2016, 6, 104–113. [Google Scholar] [CrossRef]
  16. Zheng, J.; Qin, W. Progress of research on geopolymer materials. New Build. Mater. 2002, 4, 11–12. [Google Scholar]
  17. Zhang, S.; Gong, K. Geopolymer. J. Mater. Sci. Eng. 2003, 3, 430–436. [Google Scholar]
  18. Duan, H.; Ni, W.; Li, J. Geopolymers in New Building Materials. New Build. Mater. 2004, 1, 14–15. [Google Scholar]
  19. Onutai, S.; Kobayashi, T.; Thavorniti, P.; Jiemsirilers, S. Porous fly ash-based geopolymer composite fiber as an adsorbent for removal of heavy metal ions from wastewater. Mater. Lett. 2019, 236, 30–33. [Google Scholar] [CrossRef]
  20. Farhan, N.A.; Sheikh, M.N.; Hadi, M.N.S. Investigation of engineering properties of normal and high strength fly ash based geopolymer and alkali-activated slag concrete compared to ordinary Portland cement concrete. Constr. Build. Mater. 2019, 196, 26–42. [Google Scholar] [CrossRef]
  21. Pilehvar, S.; Szczotok, A.M.; Rodríguez, J.F.; Valentini, L.; Lanzón, M.; Pamies, R.; Kjoniksen, A.L. Effect of freeze-thaw cycles on the mechanical behavior of geopolymer concrete and Portland cement concrete containing micro-encapsulated phase change materials. Constr. Build. Mater. 2019, 200, 94–103. [Google Scholar] [CrossRef]
  22. Zhu, H.J.; Liang, G.W.; Xu, J.; Wu, Q.S.; Du, J.Z. Surface-modification of fly ash and its effect on strength and freezing resistance of slag based geopolymer. Constr. Build. Mater. 2019, 199, 574–580. [Google Scholar] [CrossRef]
  23. Gunasekara, C.; Law, D.; Bhuiyan, S.; Setunge, S.; Ward, L. Chloride induced corrosion in different fly ash based geopolymer concretes. Constr. Build. Mater. 2019, 200, 502–513. [Google Scholar] [CrossRef]
  24. Li, X.; Li, Q.; Wang, Y.; Liu, W.; Hou, D.; Zheng, W.; Zhang, X. Experimental study on instability mechanism and critical intensity of rainfall of high-steep rock slopes under unsaturated conditions. Int. J. Min. Sci. Technol. 2023; in press. [Google Scholar] [CrossRef]
  25. Meng, Q.F.; Wu, C.Q.; Su, Y.; Li, J.; Liu, J.; Pang, J.B. A study of steel wire mesh reinforced high performance geopolymer concrete slabs under blast loading. J. Clean. Prod. 2019, 210, 1150–1163. [Google Scholar] [CrossRef]
  26. Wang, X.; Li, S.; Sun, Y.; Zhang, C.; Liu, G. Influence of freeze-thaw cycling on the soil mechanical properties of open-pit mine dump under different moisture contents. Environ. Earth Sci. 2021, 80, 279. [Google Scholar] [CrossRef]
  27. Hao, S.; Pabst, T. Effect of freeze-thaw and wetting-drying cycles on the CBR, shear strength, stiffness and permanent deformation of crushed waste rocks. Road Mater. Pavement Des. 2023, 24, 1233–1253. [Google Scholar] [CrossRef]
  28. Wu, Z. High Technique Concrete. Bull. Chin. Ceram. Soc. 1994, 1, 41–45. [Google Scholar] [CrossRef]
  29. Ghadir, P.; Ranjbar, N. Clayey soil stabilization using geopolymer and Portland cement. Constr. Build. Mater. 2018, 188, 361–371. [Google Scholar] [CrossRef]
  30. Wei, D.; Zhu, P.; Gao, S.; Yan, X.; Liu, H.; Fan, H. Comprehensive Evaluation of the Sustainability of Waste Concrete towards Structural Concrete Application in Freeze-Thaw Environment. Materials 2022, 15, 6153. [Google Scholar] [CrossRef]
  31. Feng, Q.; Hou, S.; Liu, W.; Zhang, S.; Li, W.; Tian, M. Study on the simulation method and mesoscopic characteristics of rock freeze-thaw damage. Comput. Geotech. 2023, 153, 105038. [Google Scholar] [CrossRef]
  32. Feng, Q.; Jin, J.; Zhang, S.; Liu, W.; Yang, X.; Li, W. Study on a Damage Model and Uniaxial Compression Simulation Method of Frozen-Thawed Rock. Rock Mech. Rock Eng. 2022, 55, 187–211. [Google Scholar] [CrossRef]
Figure 1. Experimental research program.
Water 15 03903 g001
Figure 2. Sample-making process.
Water 15 03903 g002
Figure 3. Test Flow.
Water 15 03903 g003
Figure 4. Mechanical properties of specimens under different freezing temperatures.
Water 15 03903 g004
Figure 5. Mechanical properties of specimens under different cycle times.
Water 15 03903 g005aWater 15 03903 g005b
Figure 6. Microstructural and morphological characteristics of the fracture zone of the specimen.
Water 15 03903 g006
Figure 7. Elemental scanning map of the fracture zone of the specimen.
Water 15 03903 g007
Figure 8. Fitting curves of mechanical properties of specimens at different temperatures.
Water 15 03903 g008
Figure 9. Fitting curve of mechanical properties of specimen under different cycle times.
Water 15 03903 g009
Table 1. Basic parameters of physical and mechanical properties.
ItemsCapacityWater ContentCohesionThe Angle of Internal Friction
Parameters14.07 kN/m31.279%2.563 kPa36.32°
Table 2. Particle size distribution.
Caliber/mm0.150.30.61.182.364.759.5161926.531.5
Mass/g212039403642289843959413105252798415915811413
Percentage %4.528.407.776.189.3820.0822.455.978.873.373.01
Table 3. Chemical composition of slags.
Chemical CompositionCaOSiO2Al2O3MgOCO3TiO2SNa2OK2OOthers
Proportion36.7628.3615.298.317.751.150.990.430.320.64
Table 4. Chemical composition of fly ash.
Chemical CompositionSiO2Al2O3CO3K2OFe2O3Na2OCaOMgOTiO2Others
Proportion61.0924.018.072.461.560.890.690.540.470.21
Table 5. Parameters of sodium silicate.
ItemsModulusBaume DegreesSiO2%Na2O%Fe%Water Insoluble Matter %Solid Content %Water Content %
Parameters3.3839.526.138.250.020.234.665.4
Disclaimer/Publisher’s Note: The statements, opinions and data contained in all publications are solely those of the individual author(s) and contributor(s) and not of MDPI and/or the editor(s). MDPI and/or the editor(s) disclaim responsibility for any injury to people or property resulting from any ideas, methods, instructions or products referred to in the content.

