Abstract
To investigate freeze–thaw cycle effects on the energy dissipation and strength characteristics of cement soils under impact loading, impact compression tests were carried out using a split Hopkinson pressure bar on cement soils under various freeze–thaw cycles (0, 1, 3, 6 and 10 times). The Zhu–Wang–Tang (ZWT) model was modified to predict the relationship between deformation and strength in cement soils under various test conditions. The obtained test results revealed that the freeze–thaw cycle number and impact pressure had significant effects on the fractal dimension, strength and absorbed energy of cement soils and there existed a critical freeze–thaw cycle number. It was found that the increase of the freeze–thaw cycle number gradually decreased strength and absorbed energy and increased the fractal dimension. When freeze–thaw cycle number was between 0–6, strength, fractal dimension and absorbed energy were significantly changed. For freeze–thaw cycle numbers greater than 6, the effects of the above factors were gradually alleviated. A modified constitutive model was able to accurately describe cement soil mechanical responses under high strain rate conditions, and the relative error between the predicted and experimental results was in the range of ±7%.
1. Introduction
The mechanical properties of foundation soils in different engineering environments are greatly affected by environmental factors [1,2]. Seasonal frozen soils are extensively scattered all over the world. Negative temperatures in winter result in water freezing in geotechnical structures. When the temperature is increased to above 0 °C, frozen soil begins to melt, and the phenomena of mud pumping, soil weakening and strength reduction occur [3]. As a strong weathering process, cyclic freeze–thaw alternation has strong effects on soil structure and is the main reason for the destruction of geotechnical structures [4]. To meet engineering requirements, the mechanical responses of soil in seasonal frozen soil areas have to be enhanced. Cement soil is consisted of soil, cement and other components in appropriate proportions. Due to its advantages, such as convenient construction, low cost and low vibration, cement soil is extensively employed in foundation reinforcement and foundation pit support [5]. Therefore, the investigation of the mechanical properties of cement soil under freeze–thaw cycles is necessary.
In cold regions, cement soil undergoes freeze–thaw cycles. Numerous mechanical tests and damage detection experiments have been performed to evaluate the effects of the freeze–thaw cycle. Wang et al. [6] and Zhao et al. [7] explored the effects of the freeze–thaw cycle on the strength and deformation characteristics of cement soil and determined the softening stress–strain relationship of cement soil. Chen et al. [8] performed the compressive strength, shear strength and permeability tests of cement soils under different freeze–thaw cycle numbers and derived a regression curve equation. Research has revealed that the addition of admixtures and fibers can improve the frost resistance of cement soil [9,10,11]. Lake et al. [12] studied the damage mechanism of the freeze–thaw cycles on the mechanical properties of cement soils. The above research mainly focused on static mechanics and microstructures. In the safety design of cement soil reinforcement projects, the soil bears not only the static load generated by external earth pressure and the self-weight of overlying structure, but also dynamic loads, such as instantaneous impact (simple airport runway base reinforcement) as well as mechanical and blasting vibration impacts (adjacent building demolition construction, earthquake, etc.) [13,14]. Therefore, it is necessary to study the mechanical behaviors of cement soils in a multi-strain rate range. Ma et al. [15] investigated the effects of the metakaolin (MK) content and curing age on the dynamic mechanical properties and pore structures of geopolymer cement soils and studied pore size distribution and microstructure using scanning electron microscopy and nuclear magnetic resonance. Gao et al. [13] explored the failure modes and dynamic stress–strain characteristics of cement soils under impact load and evaluated the influences of fiber and sand contents on their energy dissipation and dynamic strength. However, few studies have been conducted on cement soil dynamic characteristics under freeze–thaw conditions.
Numerical analysis is commonly used to describe the properties of geomaterials in geotechnical research. The validity of numerical analysis results depends on the applied effective constitutive model. Therefore, the development of constitutive model is of high practical significance. In recent years, with the progress of cement soil research, the constitutive model of cement soil has received extensive attention. According to damage theory and test results, Tong et al. [16] developed the damage theory model of cement soil. Since cement soil has similar structure to over-consolidated remolded clay, Sun et al. [17] established an elastoplastic constitutive model based on a unified hardening model which conformed to cement soil mechanical properties. However, although the above constitutive model had a rigorous theoretical basis, it had too many parameters which were difficult to determine and its numerical convergence was difficult, thus limiting its application in practical engineering. Therefore, Hu et al. [18] developed the Duncan–Chang model of cement soil, taking into account fiber content. However, this model was not able to reflect softening characteristics. Wang et al. [19] performed triaxial tests on cement soil and established a mechanical model to take into account strain-softening characteristics. The existing constitutive models of cement soil can only reflect strain-hardening or strain-softening characteristics and cannot describe the effects of freeze–thaw cycles and strain rate on mechanical properties.
In the current research, a split Hopkinson pressure bar (SHPB) test system, 37 mm in diameter, was used to perform uniaxial impact compression tests on cement soil under freeze–thaw conditions. The effects of impact pressure and freeze–thaw cycles on the fractal dimension, strength and absorbed energy of cement soils were investigated. Finally, the Zhu–Wang–Tang (ZWT) model was modified to predict the deformation and strength properties of cement soil under impact loading.
2. Test
2.1. Testing Material
Test soil was collected from a subgrade in Hefei city, Anhui province, China. The gradation curve of soil is illustrated in Figure 1. The liquid limit and plastic index were 50.5% and 24.6, respectively, so that the tested soil can be classified as high liquid limit clay (CH) based on the Unified Soil Classification System (ASTM-2487). The mineral compositions of the tested soil are listed in Table 1.
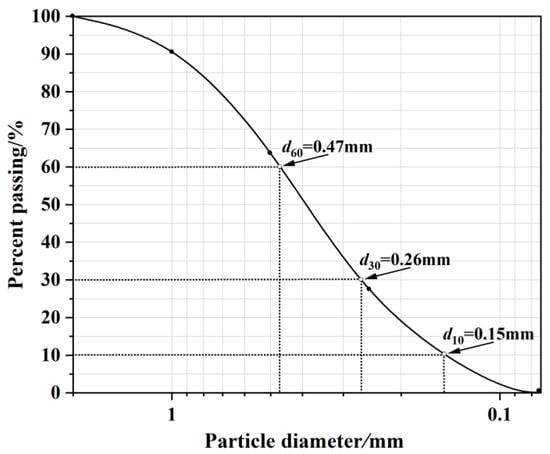
Figure 1.
Gradation curve of soil.

Table 1.
The characteristic parameters of the tested soil.
PO·42.5 ordinary Portland cement produced by the Huainan Bagongshan Cement Plant was adopted in tests, and the considered characteristic parameters are listed in Table 2.
Table 2.
The characteristic parameters of cement.
Metakaolin with 20 m2/g specific surface area and a 1 μm average particle size with a fineness of 1250 meshes and an activity index of more than 110 were adopted. The characteristic parameters are listed in Table 3.
Table 3.
The characteristic parameters of metakaolin.
Moreover, analytically pure granular sodium hydroxide with a net content of ≥95% was applied.
2.2. Specimen Preparation
Undisturbed soil samples were dried at 105 °C for 24 h in an oven and passed through a 2 mm sieve after being crushed. Soil samples were mixed according to their original moisture content (26.5%) and placed in a moisturizing dish for 24 h. Then, cement, MK and NaOH at 12.0%, 3.0% and 1.5% of dry soil mass, respectively, were added to wet soil. After uniform mixing, soil samples was placed in a mold and compacted. Five specimens were prepared in each group.
2.3. Test Scheme
After a curing age of 180 d, the samples were soaked in water for 24 h and their surface moisture was eliminated through drying. According to ASTM D560(2003), samples were wrapped in plastic films to prevent water loss from the samples during the freeze–thaw cycles and placed in freeze–thaw boxes. When frozen, samples were kept at a constant temperature of −20 °C for 12 h and after being melted, they were kept at a constant temperature of 20 °C for 12 h. This process was assumed as one freeze–thaw cycle. Specimens were weighed after 0, 1, 3, 6 and 10 freeze–thaw cycles. After the freeze–thaw cycles were over, the impact load tests were performed at different impact pressures (0.08, 0.10 and 0.12 MPa). When calculating strength, fractal dimension and energy from the test results, the maximum and minimum values were eliminated and the average of the middle three values were considered.
2.4. Testing Equipment
The dynamic mechanical properties of cement soil were evaluated on an SHPB test system. The test system consisted of a striker bar, transmitter bar, incident bar and damper. The elastic bars were composed of aluminum with a diameter of 37 mm. The lengths of the striker bar, incident bar and transmitter rod bar were 600, 2000 and 2000 mm, respectively. The data acquisition system consisted of an oscilloscope and a super dynamic strain gauge, as illustrated in Figure 2. Due to low wave impedance of cement soil, a semiconductor strain gauge was attached onto the transmitter bar to collect the original waveform signals, as shown in Figure 3. Based on the collected data, a simplified three-wave method was applied to draw the specimen stress–strain curve. As shown in Figure 4, the trends of the εi(t) + εr(t) and εt(t) curves were consistent. The number of intersection points of the two curves was greater than three, and the two curves basically coincided. Therefore, under impact load, the cement soil sample satisfied dynamic stress equilibrium condition.
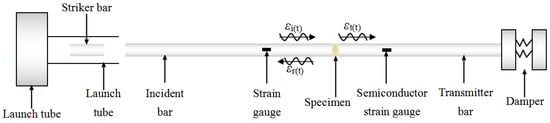
Figure 2.
Test device schematic diagram.
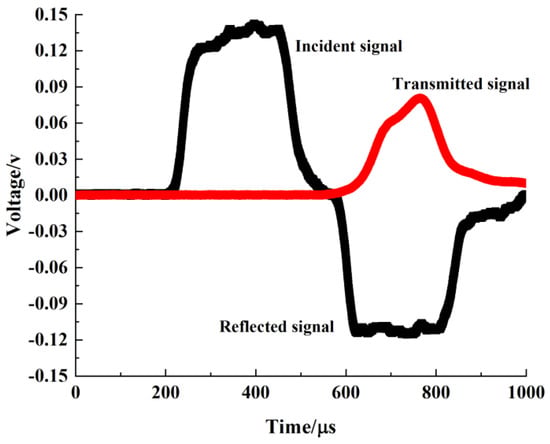
Figure 3.
Dynamic original waveform of cement clay.
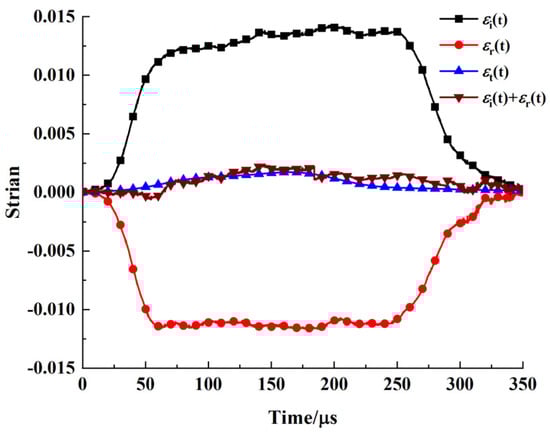
Figure 4.
Stress equilibrium diagram.
3. Test Results and Analysis
The strength and fractal dimension of the samples under different test conditions are summarized in Table 4.
Table 4.
Summary of test results.
3.1. Mass Loss Rate
Figure 5 shows that increase of the freeze–thaw cycle number decreased the change rate and average mass and increased the mass loss rate of the sample. During the freeze–thaw cycles of pore water, the internal structure of cement soil is continuously expanded and shrunk, gradually dissolving cement-based gel cementing material and continuously decreasing the cement clay density [9]. During the tests, it was found that when specimens were exposed to freeze–thaw cycles, fine cracks appeared on their surface and some particles fell off the surface. Therefore, the quality of sample was gradually decreased.
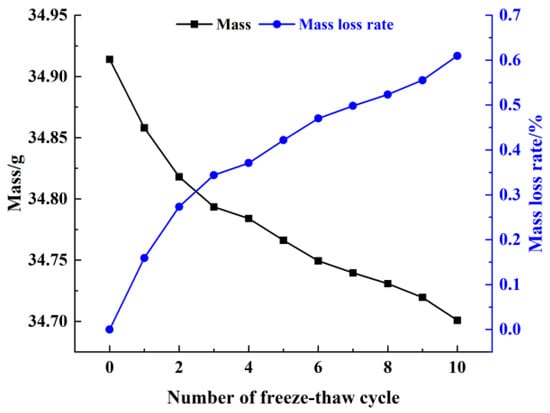
Figure 5.
Freeze–thaw cycle effects on mass and mass loss rate.
3.2. Strength
As illustrated in Figure 6, the increase of freeze–thaw cycle number decreased the cement soil strength under different impact pressures. After three freeze–thaw cycles, the cement soil dynamic compressive strengths under 0.08, 0.10 and 0.12 MPa pressure were decreased by 27.12%, 18.23% and 12.45%, respectively. Since cement soil was saturated before the freeze–thaw cycles, capillary water in the internal pores was changed from a liquid to a solid during the freezing process, resulting in an approximate 9% volume increase. The increased volume resulted in the generation of expansion pressure on the internal pore walls, which increased the number of internal irreparable cracks [20]. From 3 to 10 freeze–thaw cycles, strength was decreased relatively slowly. Since no additional water entered the cracks to supplement, the generated expansion cracks could not continue expanding and only small internal saturated cracks continued to expand. Therefore, the increase of freeze–thaw cycle number decreased specimen strength. Repeated freeze–thaw cycle cumulative damage led to continuous expansion and connection of micro-cracks, giving rise to serious damage and the fracture of cement-soil materials and gradual freeze–thaw damage [3]. Therefore, the alternation and erosion of freeze–thaw cycles in cold regions was among the major reasons for the destruction as well as reinforcement of cement soils.
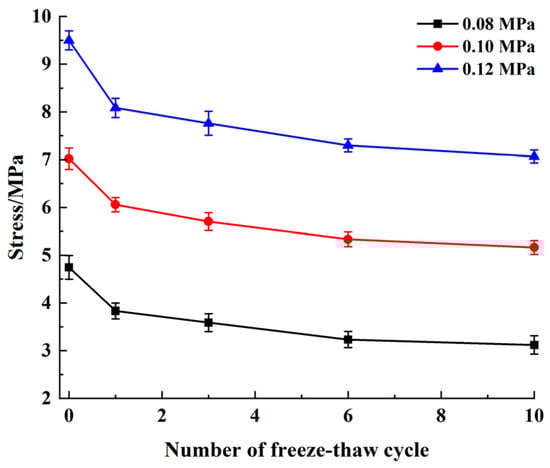
Figure 6.
Effect of freeze–thaw cycles on sample strength.
Freeze–thaw cycles significantly affect the strength of cement soils. With the increase of freeze–thaw cycle number, the strength of the cement soil gradually decreases. When there was no water supplement during the melting process, the strength reduction rate of the sample was gradually decreased, as shown in Figure 7. However, if the water was replenished during the melting process, the strength was approximately linearly increased with freeze–thaw cycle number, as illustrated in Figure 8.
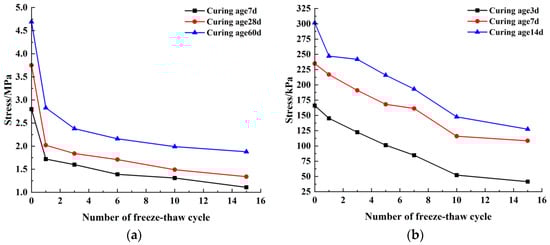
Figure 7.
No water supplement during melting process: (a) Cement clay [21]; (b) Cement silty sand [22].
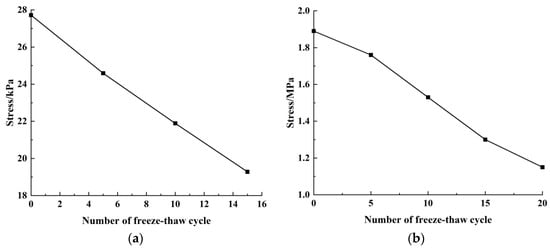
Figure 8.
Water supplement during melting process: (a) Cement silty clay [23]; (b) Cement silty clay [8].
In the frozen state, the volume of water inside the sample expanded when it changed from liquid to solid, which increased the damage degree inside the sample. Because no new water entered the crack to supplement, expansion volume could not continue to expand and only the internal tiny saturated cracks continued to develop. Therefore, as the number of freeze–thaw cycles was increased, the strength was decreased relatively slowly. If the sample was melted in water, more water entered the sample during melting process. Under the action of freeze–thaw cycles, the cracks inside the sample continued to expand and penetrate, aggravating the sample damage degree and causing the cement soil strength to continue to decline.
The increase of impact pressure linearly increased the cement soil dynamic compressive strength, as illustrated in Figure 9. Specimen strain rate was positively correlated with impact pressure. Many studies have revealed that under medium and high strain rate loadings, the increase of strain rate linearly increased the strength of geomaterials, such as frozen soil [24], cement soil [14], concrete [25], rock [26], etc. Under impact load, the increase of the strain rate increased the number of cracks inside the specimen, and when the specimen reached failure state, this process required more energy.
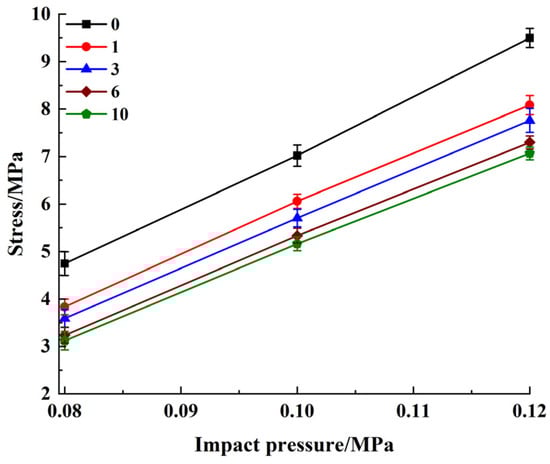
Figure 9.
Effect of impact pressure on strength.
3.3. Shape Features
When exposed to the impact load, cement soils presented a broken state. By increasing impact pressure and the freeze–thaw cycle number, the fragmentation degree of the specimen was increased. To analyze the cement soil crushing degree, fractal dimension was applied to quantitatively describe the influences of impact pressure and freeze–thaw cycle number. Specimen fragments were collected and fragments with various particle size distributions (0~0.25, 0.25~0.6, 0.6~1.18, 1.18~2.36, 2.36~4.75 and 4.75~9.5 mm) were weighed using a high-precision electronic scale. The calculation equation of fractal dimension was stated as [27]:
where M is the total mass of specimen; Mr is the total mass of fragments smaller in size than r; r is fragment particle size; and b is fragment distribution parameter.
By plotting the ln[Mr/M]-lnr curve and performing linear fitting, the value of b was obtained to be equal to the slope of the curve. It was seen from Figure 10 that the correlation coefficient (R2) of linear fitting was higher than 0.99, which revealed the self-similarity of cement soil under impact load.
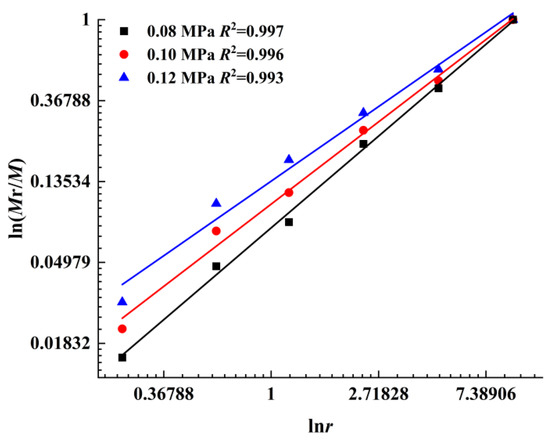
Figure 10.
Variations of fragmentation degree under different impact pressures.
Figure 11 showed that at constant impact pressure, the increase of the freeze–thaw cycle number increased the fractal dimension and decreased the growth rate; however, at constant freeze–thaw cycle number, increase of strain rate linearly increased fractal dimension, as shown in Figure 12. Larger fractal dimensions indicated higher fragment numbers, smaller fragment sizes and higher damage degrees [26].
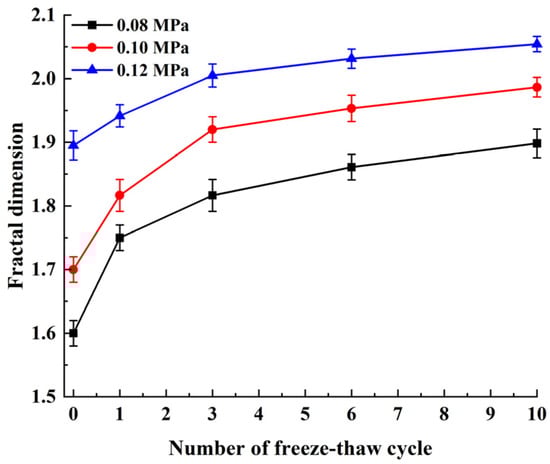
Figure 11.
Freeze–thaw cycle number effect on fractal dimension.
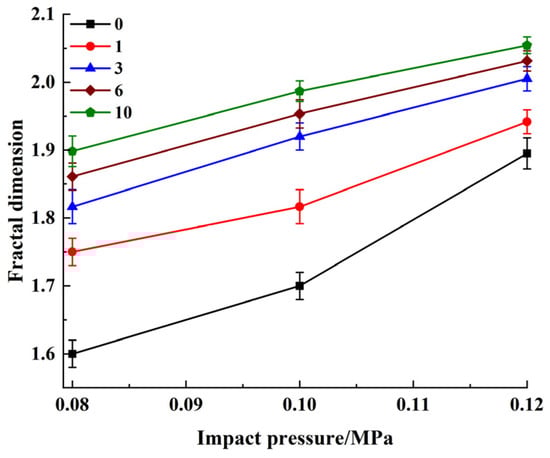
Figure 12.
Impact pressure effect on fractal dimension.
The influences of impact pressure and the freeze–thaw cycle number on fragmentation are shown in Figure 13. It was seen from the figure that the increase of the freeze–thaw cycle number increased the damage degree, which significantly decreased specimen resistance against damage and deformation. Therefore, the fragmentation degree of specimen was gradually increased. As shown in Figure 13a,b, macroscopically, the proportions of small particles were gradually increased and those of large particles were decreased. Several theories and experiments have shown that increase of impact pressure (strain rate) increased dynamic load. Hence, by increasing the impact pressure from 0.08 to 0.12 MPa, the difference of cement soil broken particle size was decreased, as shown in Figure 13c,d. It was obvious that the specimen crushing degree under impact load was controlled by both the impact pressure and freeze–thaw cycle number.
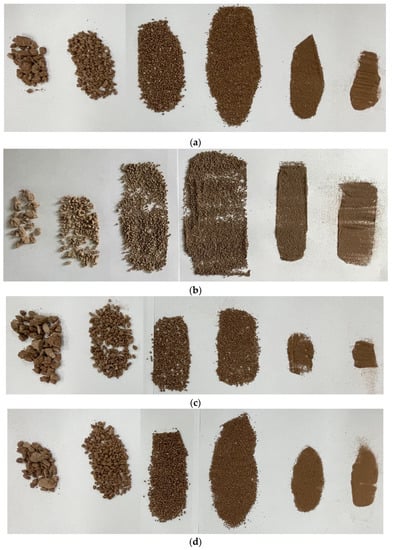
Figure 13.
Crushing particle size under different test conditions. (a) Freeze–thaw cycle: 0, 0.10 MPa; (b) Freeze–thaw cycle: 10, 0.10 MPa; (c) Freeze–thaw cycle: 1, 0.08 MPa; (d) Freeze–thaw cycle: 1, 0.12 MPa.
3.4. Energy Dissipation Characteristics
Based on the law of conservation of energy and 1D stress wave hypothesis, the calculation methods of incident energy (Wi), reflected energy (Wr) and transmitted energy (Wt) in SHPB tests were as follows [26]:
where σi is incident stress, σr is reflected stress, σt is transmitted stress (all in MPa), εi(t) is incident strain, εr(t) is reflected strain, εt(t) is transmitted strain, E0 is elastic modulus, A0 is cross-sectional area and C0 is the longitudinal wave velocity of elastic bars.
When performing SHPB tests, the interface of specimen and bar was coated with an appropriate amount of Vaseline as lubricant. Therefore, the energy consumption of end friction between the specimen and bar was ignored in the calculations. The absorbed energy (Ws) of specimen was calculated using Equation (6):
Since cement soil had a low wave impedance, the incident waveform observed in the test was not much different from a reflected waveform, and the absorbed energy calculated by Equation (6) had a large error and was not applicable. Here, stress uniformity assumption was εt(t) = εi(t) + εr(t). Combining Equations (3)–(5), Equation (6) was simplified as:
where σr is reflected stress, σt is transmitted stress, E0 is elastic modulus, A0 is cross-sectional area and C0 is compression bar longitudinal wave velocity.
The incident energy (Wi), reflected energy (Wr), transmitted energy (Wt) and absorbed energy (Ws) are listed in Table 5.
Table 5.
Summary of energy results.
Specimen failure process was accompanied by energy dissipation, so it was necessary to study the evolution of absorbed energy, reflected energy, incident energy and transmitted energy of cement soils under impact load. According to test results, the effect of the freeze–thaw cycle number on the energy time history curves under different impact pressures was consistent. Therefore, as presented in Figure 14, only the test data obtained at 0.08 MPa were adopted for analysis. By the passage of time, the incident energy of stress wave rapidly increased to maximum value during propagation and then remained stable. The stability of absorbed energy indicated that the specimens failed. Because of low wave impedance of cement soil and high number of pores inside the sample, a large proportion of incident energy was reflected and transmission energy was low [28]. Specimens produced different damage degrees under different freeze–thaw cycle numbers; therefore, the energy time history curves showed some differences.
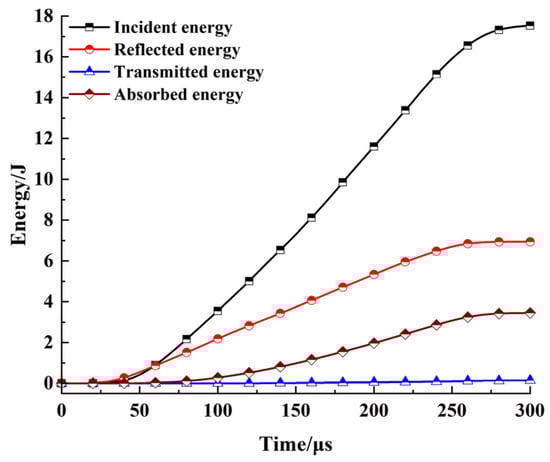
Figure 14.
Energy–time curves of cement soil.
Under impact load, the energy absorbed by the specimens was stored as strain energy, dissipation energy and kinetic energy. The energy stored in specimens during deformation was strain energy. Dissipated energy was used for crack generation and development. Kinetic energy was carried by broken specimens as they flied out [24]. It was observed that the absorbed energy affected the deformation, failure and damage degree of specimens; therefore, it was necessary to investigate absorbed energy.
The energy dissipation properties of specimens were determined by external energy and initial damage state [28]. Freeze–thaw cycles significantly influenced initial damage state. External energy was mainly determined by the striker bar impact velocity, which was closely related to impact pressure. It was seen from Figure 15 that the increase of freeze–thaw cycle number decreased the absorbed energy and reduction range. The reason for this was that freeze–thaw cycles increased the severity of damage inside the specimen, decreasing the resistance of the specimen to damage and deformation; therefore, low energy was required to reach failure state. Overall, absorbed energy was increased by increasing impact pressure. Figure 13 shows that as the impact pressure was increased, the specimen damage degree and required energy were increased.
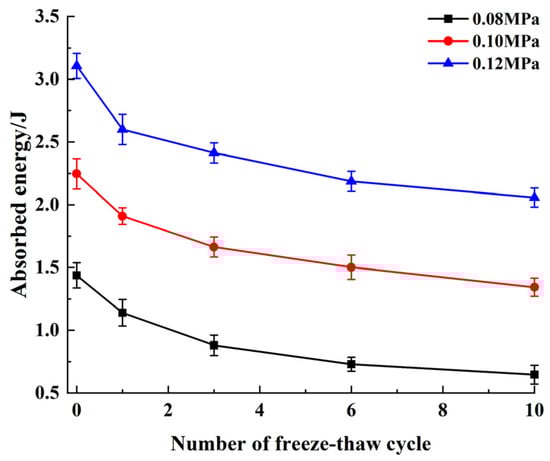
Figure 15.
Freeze–thaw cycle effect on absorbed energy.
The energy absorption rate and strength of the cement soil under different impact pressures were almost linearly related, as illustrated in Figure 16. Most of the absorbed energy was applied for the destruction of specimen internal structure and a small fraction was dissipated by acousto-optic heat. The bearing capacity of geomaterials is positively correlated with the energy consumed during their failure. Because the increase of the impact load increased the number of cracks generated inside the specimen, the failure mode was gradually transformed from a relatively complete bulk crushing to a small or even crushing state. Specimens absorbed more energy when they reached failure [29].
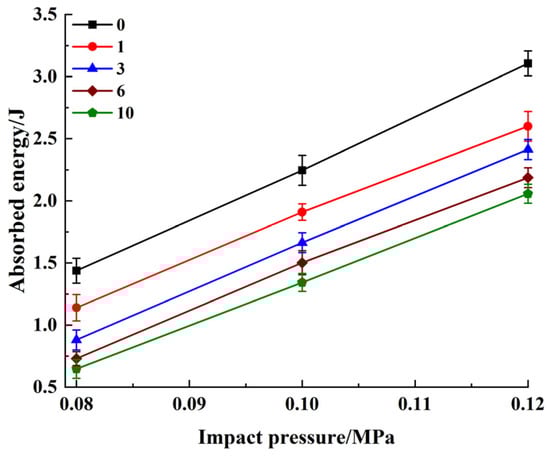
Figure 16.
Effect of impact pressure on absorbed energy.
4. The Modified Dynamic Constitutive Model
4.1. Derivation Process
ZWT model was able to describe the deformation and strength characteristics of materials from quasi-static load to impact load range (10−4~103 s−1). The model consisted of a transient response element, which was unrelated to strain rate, one is the transient response element, which is unrelated to the strain rate, and the other is the transient response, which is related to the strain rate and is composed of two Maxwell elements, as shown in Figure 17. The mathematical expression of the model was expressed as Equation (8) [24]:
where E0, E1, E2, α and β are elastic constants, and θ1 and θ2 are relaxation times of low-frequency and high-frequency Maxwell elements, respectively.
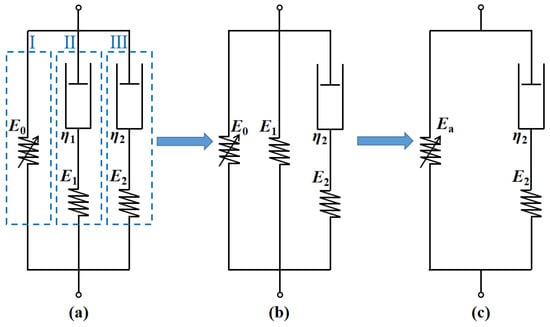
Figure 17.
Comparison of theoretical and test results. (a) impact pressure: 0.08 MPa; (b) impact pressure: 0.10 MPa; (c) impact pressure: 0.12 MPa.
Under impact load, the stress–strain curve was almost linear in the initial stage; therefore, the first part of Equation (8) could be simplified, as shown in Equation (9):
In a high strain rate range (1~100s−1), the time relaxation of a low-frequency Maxwell element with a characteristic time of 0.1 s was not sufficient, which could be simplified as a Hooke element with an E1 elastic constant, as shown in Equation (10) and Figure 14b:
As can be seen from Figure 14b, two parallel Hooke elements (E0 and E1) existed. To further simplify the equation, an equivalent Hooke element (Ea) was used instead, as shown in Equation (11) and Figure 14c:
Equation (12) states the modified ZWT model as:
Equation (13) states the mathematical expression of the strain equivalence principle. Combining Equations (12) and (13) gave a ZWT model, including damage variables, as given in Equation (14):
where σ* and σ are effective stress and nominal stress, respectively, (MPa) and D is the damage variable.
4.2. Damage Variable
It was seen from Figure 13 that the damage degree was influenced by the strain rate and freeze–thaw cycles, both of which had to be considered when establishing the damage variable (D12), as expressed in Equation (15):
where D1 and D2 are damage variables due to freeze–thaw cycle and strain rate, respectively, and D12 is damage variable considering both strain rate and freeze–thaw cycle. The mathematical expressions of D1 and D2 are stated in Equations (16) and (17), respectively:
where σn and σ0 are peak stress after n and 0 freeze–thaw cycles, respectively, (MPa):
where is the reference strain rate and A, α and β are material constants.
Introducing Equations (15)–(17) into (14) gave:
where, σn and σ0 are the peak stress after n and 0 freeze–thaw cycles, respectively, (MPa); is the reference strain rate and A, α and β are material constants; θ2 is the relaxation time of high-frequency Maxwell elements; and E2 and Ea are the elastic constants of high-frequency Maxwell element and the equivalent Hooke element, respectively.
Under constant strain rate loading, Equation (18) could be simplified to Equation (19) as:
The parameters in Equation (19) are the same as those in Equation (18).
4.3. Model Verification
Cement clay dynamic stress–strain curves drawn according to test and constitutive model results under different conditions were compared, as illustrated in Figure 18. Table 6 summarizes the model parameters. It was seen from the figure that a dynamic constitutive model curve agreed well with the experimental curve, especially the simulation effect of the post-peak descending curve was better, indicating that it was appropriate to consider cement soil damage in the model.
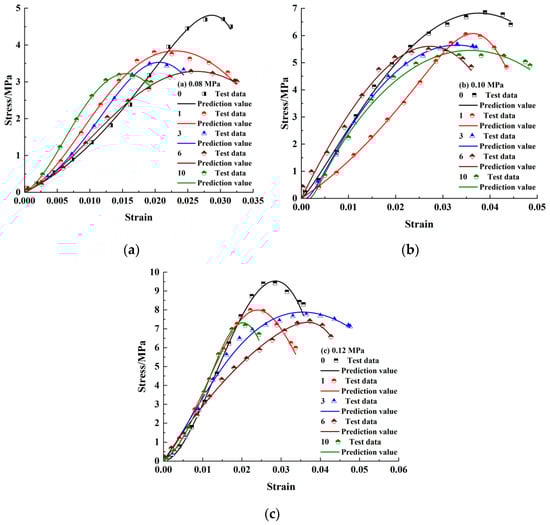
Figure 18.
Comparison of theoretical and test results: (a) 0.08 MPa; (b) 0.10 MPa; (c) 0.12 MPa.
Table 6.
Fitting parameters of cement clay.
Relative error was applied to quantitatively measure the applicability of the developed model, as stated in Equation (20):
where σtest and σpre are the test and predicted values, respectively, (MPa).
As shown in Figure 19, the developed model had a high prediction accuracy and the relative errors obtained for 0.08, 0.10 and 0.12 MPa were in the ranges of −4.46~4.40%, −4.95~6.42% and −6.11~6.61%, respectively. This indicated that the modified ZWT model accurately reflected the deformation and strength of cement soil under impact loading.
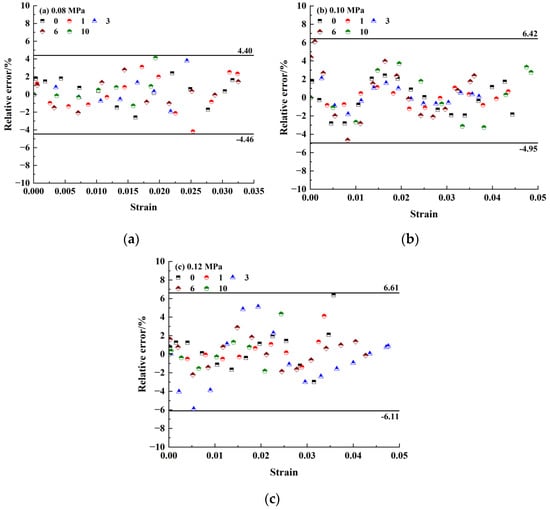
Figure 19.
Relative error of cement soils under different test conditions: (a) 0.08 MPa; (b) 0.10 MPa; (c) 0.12 MPa.
5. Conclusions
(1) Impact pressure and freeze–thaw cycles significantly affected cement soil strength. After three freeze–thaw cycles, the sample strength under impact pressures of 0.08, 0.10 and 0.12 MPa was decreased by 27.12%, 18.23% and 12.45%, respectively. By increasing the freeze–thaw cycle number, the strength change trend of the samples tended to be stable. Cement soil strength was linearly increased by increasing the impact pressure.
(2) There was a critical freeze–thaw cycle number for fractal dimension and absorbed energy. For freeze–thaw cycle numbers from 0 to 6, change rates of the fractal dimension and absorbed energy were high; for freeze–thaw cycle numbers above 6, the two above parameters were less affected by the freeze–thaw cycle number. Fractal dimension and absorbed energy were positively correlated with impact pressure.
(3) According to the modified ZWT model, a dynamic constitutive model suitable for cement soil was developed by introducing the damage variable, considering freeze–thaw cycle number and strain rate. Relative errors for 0.08, 0.10 and 0.12 MPa were in the ranges of −4.46~4.40%, −4.95~6.42% and −6.11~6.61%, respectively.
Limitations: In the current research, the effects of impact pressure and the freeze–thaw cycle number on the dynamic mechanical characteristics of cement soils were investigated, but the weakening mechanism of the freeze–thaw cycles on sample strength was not studied. Scanning electron microscope and nuclear magnetic resonance tests need to be performed to further evaluate the influence of the freeze–thaw cycles on cracks and pores inside the samples.
Application: In cold regions, cement soil undergoes freeze–thaw cycles. In the safety design of cement soil reinforcement projects, the soil bears not only the static load generated by external earth pressure and the self-weight of overlying structure, but also dynamic loads, such as instantaneous impact (simple airport runway base reinforcement) as well as mechanical and blasting vibration impacts (adjacent building demolition construction, earthquake, etc.).
Author Contributions
K.H. (Kun Huang), H.W. and K.H. (Kai Huang) designed the experiments; K.H. (Kun Huang) and K.H. (Kai Huang) carried out the experiments; H.W. analyzed the experimental results; K.H. (Kun Huang) analyzed data and developed the analysis tools; K.H. (Kun Huang) wrote the manuscript. All authors have read and agreed to the published version of the manuscript.
Funding
The present is funded by the National Natural Science Foundation of China (No.50874003).
Data Availability Statement
The original contributions presented in the study are included in the article, further inquiries can be directed to the corresponding author.
Conflicts of Interest
The authors declare no conflict of interest.
References
- Eskisar, T.; Altun, S.; Kalipcilar, I. Assessment of Strength Development and Freeze-Thaw Performance of Cement Treated Clays at Different Water Contents. Cold Reg. Sci. Technol. 2015, 111, 50–59. [Google Scholar] [CrossRef]
- Shang, H.S.; Yi, T.H.; Song, Y.P. Behavior of Plain Concrete of a High Water-Cement Ratio after Freeze-Thaw Cycles. Materials 2012, 5, 1698–1707. [Google Scholar] [CrossRef]
- Liu, H.; Sun, S.; Wei, H.; Li, W. Effect of Freeze-Thaw Cycles on Static Properties of Cement Stabilised Subgrade Silty Soil. Int. J. Pavement Eng. 2022, 23, 3770–3782. [Google Scholar] [CrossRef]
- Yang, B.; Ji, R.J.; Lan, Q.; Yang, J.-M.; Xu, J. Sulfate Freeze-Thaw Resistance of Magnesium Potassium Phosphate Cement Mortar. Materials 2022, 15, 3342. [Google Scholar] [CrossRef]
- Shibi, T.; Kamei, T. Effect of Freeze-Thaw Cycles on the Strength and Physical Properties of Cement-Stabilised Soil Containing Recycled Bassanite and Coal Ash. Cold Reg. Sci. Technol. 2014, 106, 36–45. [Google Scholar] [CrossRef]
- Wang, T.L.; Liu, J.K.; Tian, Y.H. Static Properties of Cement and Lime Modified Soil Subjected to Freeze-Thaw Cycles. Rock Soil Mech. 2011, 32, 193–198. (In Chinese) [Google Scholar] [CrossRef]
- Zhao, Z.Y.; Shen, X.D.; Song, X.Y. Experimental Study on Frost-resistance of Red Clay Cemented Soil. Bull. Chin. Ceram. Soc. 2012, 31, 702–705+710. (In Chinese) [Google Scholar] [CrossRef]
- Chen, S.L.; Shi, J.J.; Yu, T. Effect of Freezing-thawing Cycle on the Mechanical Behaviors of Cemented Soil. J. Basic Sci. Eng. 2014, 22, 343–349. (In Chinese) [Google Scholar] [CrossRef]
- Cui, H.H.; Pei, G.L.; Yao, S.J.; Wang, G.Y.; Zhang, Z.G. Experimental Study of Mechanical Properties of Cement Soil of Different Curing Time Subjected to Freezing-Thawing Cycles. J. Glaciol. Geocryol. 2018, 40, 110–115. (In Chinese) [Google Scholar]
- Ding, M.T.; Zhang, F.; Ling, X.Z. Effects of Freeze-Thaw Cycles on Mechanical Properties of Polypropylene Fiber and Cement Stabilized Clay. Cold Reg. Sci. Technol. 2018, 154, 155–165. [Google Scholar] [CrossRef]
- Kumar, P.; Singh, S.P. Fiber-reinforced Fly Ash Subbases in Rural Roads. J. Transp. Eng. 2008, 134, 171–180. [Google Scholar] [CrossRef]
- Guo, Q.; Wei, M.L.; Du, G.Y.; Xue, H.C.; Liu, S.Y. Research on Strength Behavior and Micro-mechanism of AMC Stabilized High Liquid Limit Clay. J. China Univ. Min. Technol. 2018, 47, 838–845. (In Chinese) [Google Scholar] [CrossRef]
- Lake, C.B.; Yousif, M.A.M.; Jamshidi, R.J. Examining Freeze-thaw Effects on Performance and Morphology of a Lightly Cemented Soil. Cold Reg. Sci. Technol. 2017, 134, 33–44. [Google Scholar] [CrossRef]
- Gao, C.H.; Ma, Q.Y. Analysis of Silty Clay Stabilized by Cement Mortar Based on Split Hopkinson Pressure Bar Experimental. Acta Mater. Compos. Sin. 2018, 35, 1629–1635. (In Chinese) [Google Scholar] [CrossRef]
- Ma, Q.Y.; Gao, C.H. Effect of Basalt Fiber on the Dynamic Mechanical Properties of Cement-Soil in SHPB Test. J. Mater. Civ. Eng. 2018, 30, 04018185. [Google Scholar] [CrossRef]
- Ma, D.D.; Ma, Q.Y.; Huang, K.; Zhang, R.R. Pore Structure and Dynamic Mechanical Properties of Geopolymer Cement Soil Based on Nuclear Magnetic Resonance Technique. Chin. J. Geotech. Eng. 2021, 43, 572–578. (In Chinese) [Google Scholar]
- Tong, X.F.; Gong, X.N.; Jiang, Y.S. Elastic-plastic Damage Model of Cement-Stabilized Soil. Eng. Mech. 2002, 19, 33–38. (In Chinese) [Google Scholar]
- Sun, K.; Chen, Z.L.; Lu, D.C. An Elastoplastic Constitutive Model Incorporating Cementation Effect of Stabilizer-Treated Soils. Rock Soil Mech. 2018, 39, 1589–1597. (In Chinese) [Google Scholar]
- Hu, Y.Y.; Yu, Q.Z.; Zhang, C.J. Duncan-chang model for fiber reinforced solidified sludge. J. Zhejiang Univ. Eng. Sci. 2017, 51, 1500–1508. (In Chinese) [Google Scholar]
- Wang, J.; Ding, G.Y.; Pan, L.Y. Study of Mechanics Behavior and Constitutive Model of Cemented Soil Under Static Triaxial Tests. Rock Soil Mech. 2010, 31, 1407–1412. (In Chinese) [Google Scholar] [CrossRef]
- Sagidullina, N.; Abdialim, S.; Kim, J.; Satyanaga, A.; Moon, S.-W. Influence of Freeze–Thaw Cycles on Physical and Mechanical Properties of Cement-Treated Silty Sand. Sustainability 2022, 14, 7000. [Google Scholar] [CrossRef]
- Zhang, J.S.; Duan, X.L. Effects of Freeze-thaw Cycles on Damage Characteristics and Energy Dissipation of Soil-cement at Different Ages. Bull. Chin. Ceram. Soc. 2019, 38, 2144–2151. (In Chinese) [Google Scholar]
- Wang, H.B.; Chen, C. Experimental Study on the Strength of Cement Soil Impacted by the Nano-CaCO3 Under the Cycling of Freeze-thaw. Sci. Technol. Eng. 2017, 17, 348–353. [Google Scholar]
- Ma, D.D.; Xiang, H.S.; Ma, Q.Y.; Kaunda, E.E.; Huang, K.; Su, Q.Q.; Yao, Z.M. Dynamic Damage Constitutive Model of Frozen Silty Soil with Prefabricated Crack under Uniaxial Load. J. Eng. Mech. 2021, 147, 04021033. [Google Scholar] [CrossRef]
- Li, R.; Liu, L.; An, H.; Wang, Y. Study on Dynamic Constitutive Model of Polypropylene Concrete under Real-Time High-Temperature Conditions. Appl. Sci. 2022, 12, 1482. [Google Scholar] [CrossRef]
- Mishra, S.; Chakraborty, T.; Matsagar, V.; Loukus, J.; Bekkala, B. High Strain-Rate Characterization of Deccan Trap Rocks Using SHPB Device. J. Mater. Civ. Eng. 2018, 30, 04018059. [Google Scholar] [CrossRef]
- Liu, L.; Wang, Y.; An, H. Fractal Characteristics and Energy Dissipation of Granite After High-Temperature Treatment Based on SHPB Experiment. Front. Earth Sci. 2022, 10, 861847. [Google Scholar] [CrossRef]
- Ma, Q.Y.; Huang, K.; Ma, D.D. Energy Absorption Characteristics and Theoretical Analysis of Frozen Clay with Pre-Existing Cracks under Uniaxial Compressive Impact Load. Cold Reg. Sci. Technol. 2021, 182, 103206. [Google Scholar] [CrossRef]
- Zhai, Y.; Meng, F.; Li, Y.; Li, Y.; Zhao, R.; Zhang, Y. Research on Dynamic Compression Failure Characteristics and Damage Constitutive Model of Sandstone after Freeze-Thaw Cycles. Eng. Fail. Anal. 2022, 140, 106577. [Google Scholar] [CrossRef]
Disclaimer/Publisher’s Note: The statements, opinions and data contained in all publications are solely those of the individual author(s) and contributor(s) and not of MDPI and/or the editor(s). MDPI and/or the editor(s) disclaim responsibility for any injury to people or property resulting from any ideas, methods, instructions or products referred to in the content. |
© 2023 by the authors. Licensee MDPI, Basel, Switzerland. This article is an open access article distributed under the terms and conditions of the Creative Commons Attribution (CC BY) license (https://creativecommons.org/licenses/by/4.0/).