Article

A Feasibility Study of Vortex Tube-Powered Membrane Distillation (MD) for Desalination

1
Mechanic Engineering Department, King Saud University, P.O. Box 800, Riyadh 11421, Saudi Arabia
2
Chemical Engineering Department, King Saud University, P.O. Box 800, Riyadh 11421, Saudi Arabia
*
Author to whom correspondence should be addressed.
Water 2023, 15(21), 3767; https://doi.org/10.3390/w15213767
Submission received: 29 August 2023 / Revised: 14 October 2023 / Accepted: 24 October 2023 / Published: 27 October 2023
(This article belongs to the Special Issue Desalination Technologies and Renewable Energy Sources)

Abstract

:
This work theoretically studies the capability of using vortex tubes to provide the necessary heating and cooling energies required by a typical direct-contact membrane distillation (MD) process. The vortex tube generates a temperature separation that can supply the membrane distillation process with sufficiently hot feed and cold permeate with a temperature difference as large as 70 °C. Several structures integrating vortex tubes and MD with and without heat recovery and cascading are proposed and their respective performances are assessed and compared. A maximum distillate production of 38.5 kg/h was obtained at an inlet air pressure of 9 bar, cold air mass ratio of 0.7, and air-to-water mass ratio of 9. The corresponding energy consumption was found to be 25.9 kWh/m3. The production rate can be increased up to 75.2 kg/h and the specific energy consumption can be reduced to 13.3 kWh/m3 when three MD stages were connected in series using the same single vortex tube at the same operating conditions. It is found that the cold fraction plays an important role in the balance between heating and cooling operations. In addition, cold fraction values smaller than 0.7 should be avoided to prevent water from freezing inside the membrane.

1. Introduction

Undoubtedly, the scarcity of drinkable water is the utmost pressing concern in the world knowing that only 30% of the existing freshwater can be easily accessed. This situation is escalating swiftly due to expanding population, urbanization, and modernization. Water shortage is predicted to impact about 6 billion people by 2050 [1,2]. Presently, the applicable solution to the freshwater crisis is saline water desalination. Hitherto, the present reliable desalination technologies are thermal methods such as multi-effect distillation (MED), multistage flash distillation (MSF), and mechanical vapor compression (MVC). In addition, there are membrane-based processes such as Reverse Osmosis (RO) and electrodialysis (ED). Forward osmosis is a promising process for desalination, but it is still in the lab-scale stage. Membrane distillation (MD) stands as a joint thermal and membrane desalination method. There is a wide spectrum of the worldwide capacity and industrial share of these desalination methods. Furthermore, they also differ in the sense of their corresponding energy demand. For example, MSF needs 10 to 16 kWh/m3 and MED uses 5.5 to 9 kWh/m3; RO energy requirements remain at 3 to 4 kWh/m3 for seawater and 0.5 to 2.5 kWh/m3 for brackish water [1]. Similarly, MVC needs 7~15 kWh/m3, FO requires 10~68 kWh/m3, ED demands 1~3.5 kWh/m3, and MD consumes an equivalent 4~40 kWh/m3 [3]. These reported specific energy consumption (SEC) values are given just to indicate how these numbers are still far from the theoretical value of about 1 kWh/m3 for seawater desalination and how the desalination processes are energy intensive. Higher values of the SEC of desalinated water can be found in the literature [4,5,6]. Najib et al. [5] reported that the MD process suffers from high energy consumption values which can be much higher than 200 kWh/m3. A comprehensive comparison between these desalination technologies in terms of energy demand, cost of water, advantages, and disadvantages can be found in [4,5,6]. Regardless of the discrepancy in the degree of energy utilization of these desalination technologies, their energy consumption is disputable due to the rising cost of energy and the tight environmental constraint on fossil fuel usage. These circumstances urged governments and decisionmakers to force industries to search for sustainable desalination processes. As a result, numerous efforts reported coupling different desalination technologies together to minimize the existing limitation and maximize the capabilities of the individual systems. For example, Nafey et al. [7] studied the feasibility of integrating MSF with MED. They concluded that hybridization could reduce the water cost and improve the overall economics compared to the standalone processes. Farsi and Dincer [8] proposed the integration of MED with MD utilizing geothermal energy. They pointed out that most of the exergy destruction takes place in the membrane sheet and the down condenser of the MED. Manesh et al. [9] proposed optimal integration of the existing steam network with a hybrid MED and RO system. They focused on optimizing the steam consumption to power the desalination plant without exploring the structure and design of the hybrid system. Son et al. [10] also focused on the energy utilization in a hybrid desalination plant of MED and the adsorption cycle process. They found that distillate production can be improved by 3~5-fold while using the same energy input. Alternatively, researchers studied the use of low-cost energy sources such as renewable energy or waste energy to drive desalination plants. Reviews and assessments of adopting renewable energy for water desalination can be found in review articles [11,12,13]. In fact, the literature is flooded with research efforts dealing with retrofitting existing and/or developing new desalination technologies.
Despite the plethora of research efforts, the search for more efficient desalination technology is still pressing. In this sense, MD emerges as a promising desalination method known for its attractive attributes. For example, MD can run under atmospheric pressure and modest temperature (40~80 °C), scores about 100% for the salt rejection factor, and can be driven by low-grade energy sources [14,15]. Moreover, it can treat highly concentrated water solutions [16]. However, MD is known for its substantial specific thermal energy consumption [17] due to its low recovery ratio. For this reason, several efforts were reported dealing with improving the energy efficiency of the MD system. For example, incorporating heat recovery systems was studied in [18]. Similarly, brine recirculation was also utilized to amplify the recovery ratio and hence reduce the specific energy consumption [19]. Other researchers proposed the use of a multistage concept [20] where the remaining energy is circulated to several MD units connected in series or parallel. The use of renewable energies is also proposed and investigated [21]. Moreover, hybridization of the MD with another desalination technology is also sought such that the MD can be powered by the reject energy of the original desalination system. For example, Farsi and Dincer [8] investigated the hybridization of MED with MD using geothermal energy.
Therefore, contributing to developing ways to reduce the energy consumption of MD or use an alternative low-cost energy source is a pivotal objective. Thereby, MD is a candidate for being powered by a simple vortex tube which can provide low-grade energy from air waste in industrial plants. The vortex tube is an elementary device that can perform temperature separation without using rotating mechanical components [22]. Due to its energy separation capability, vortex tubes are used in heating and cooling applications [23], refrigeration [24], drying [25], air separation [26], underground mine ventilation [25], and DNA applications [27]. Unlike other energy sources, the vortex tube provides unique features. First, it supplies both heating and cooling energy simultaneously. Secondly, it is simple, compact, and does not incur additional supporting devices such as energy storage, energy conversion, and sophisticated instrumentation and wiring. Thirdly, it supplies constant energy without fluctuation and/or intermittency. It is also worth mentioning that up to the author’s knowledge, none have investigated the use of vortex tubes to power the MD process. Thereby, the novelty of this work is integrating the vortex tube with a typical direct-contact membrane distillation process. The role of the vortex tube is energy generation from low-pressure compressed air at room temperature. The capability of the generated energy to supply the heating and cooling demands to operate the MD system will be assessed and analyzed. The effect of key design parameters on the integrated vortex tube–MD performance will also be investigated.
The following sections are organized as follows. Section two introduces the process studied in this work which is divided into two subsections. First, the structure and modeling equations of the vortex tube are presented. Secondly, the structure and modeling equations of the integrated vortex/MD system are introduced. Section three, which comprises six subsections, is devoted to discussing the simulation results of the proposed process. Section 3.1 focuses on the verification of the empirical model used to represent the vortex tube operation. Section 3.2 discusses the feasibility of using the vortex tube to heat and cool water streams using typical heat exchangers. Section 3.3 and Section 3.4 discuss the feasibility of using the vortex tube to power the MD process with and without heat recovery, respectively. Section 3.5 analyses the energy requirement of the proposed system. Finally, Section 3.6 studies the feasibility of the vortex tube to power multiple stages of MD units connected in series.

2. Process Description
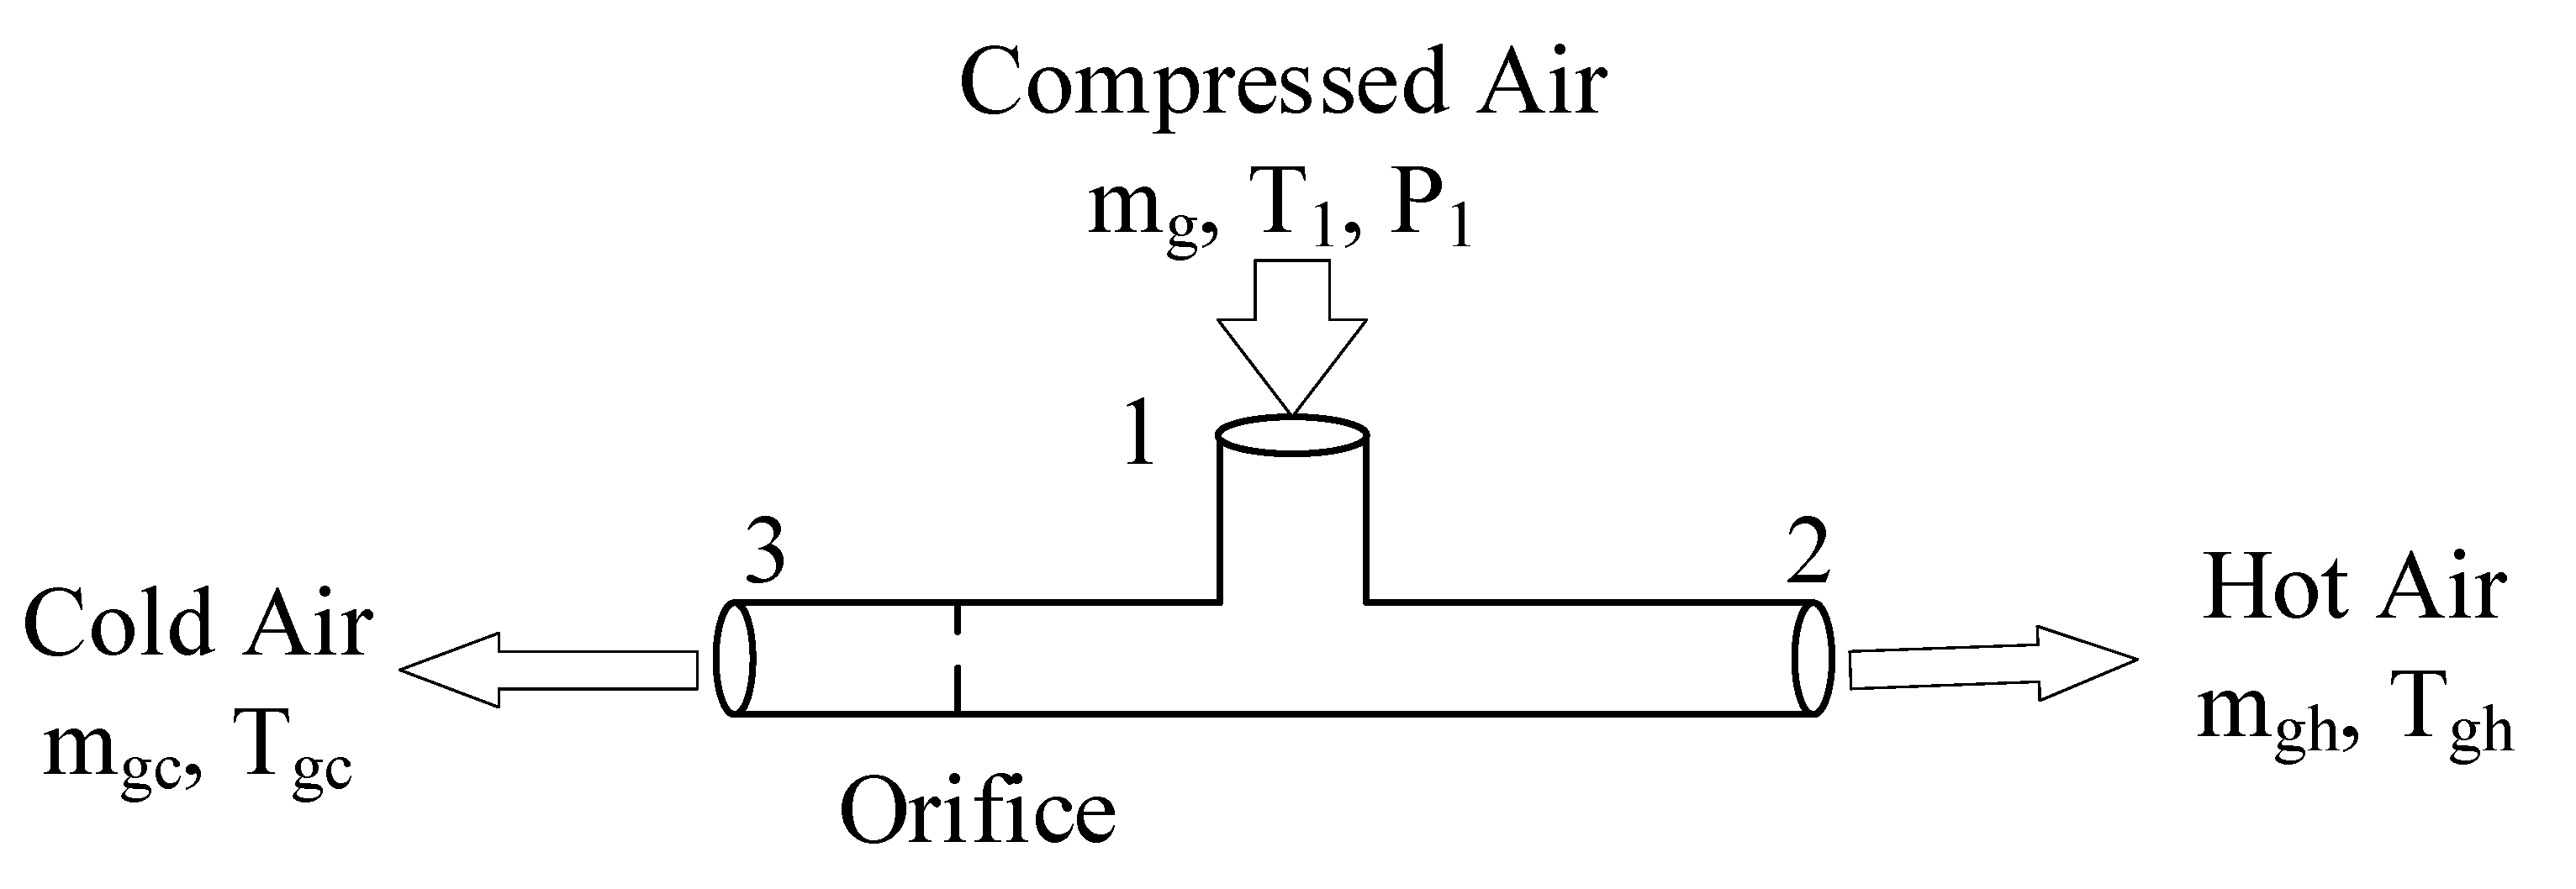
2.1. Vortex Tube

A vortex tube is a simple device that performs temperature separation without any mechanical movement. In this device, compressed air is fed and split into two streams. One stream is at a high temperature and the other is at a low temperature. A schematic of the simplified vortex tube is shown in Figure 1. Usually, it consists of an inlet nozzle, vortex chamber, cold orifice, and hot end tube. Compressed air enters the tube at Section 1 as it passes the nozzle it expands. This creates high angular velocity and causes the so-called “vortex-type” flow. The air then moves to the opposite sides. At one side (Section 2), air exits at a high temperature, while cold air leaves the tube at Section 3. A throttling valve is usually used to control the fraction of the inlet air to exit as cold air [28]. This is known as the cold fraction or the cold air mass ratio. The phenomenon of temperature/energy separation is complex, and a comprehensive description of its physics is still not available. Nevertheless, Shannak [22] managed to develop an empirical model based on experimental tests. A detailed description of the experimental setup and procedure, underlying physics, and model development is given in Shannak [22]. Here, we simply outline the obtained empirical model as follows:
Using mass balance and internal energy balance, the hot and cold temperatures can be calculated using the following expressions:
T 1 T gh = m gh m g m gh m gc 1 F 1 2 + 1
T gc T gh = m gh 2 m gc 2 1 F 2 3
where F1–2 and F2–3 are model parameters determined based on experimental data and formulated in the following empirical equations [22].
1 F 1 2 = T 1 abT 1 + b 2 cd 1 a
1 F 2 3 = T 1 2 bc ye + bg a 2 T 1 + a 2 yc ye + g 1 y 4  
a = 1 / y   1  
b = 1 y
c = 20.5 P 1 P atm 0.6
d = d 1 + d 2 + d 3
d 1 = 47.53 y 6 + 126.69 y 5 135 y 4
d 2 = 72.18 y 3 20.922 y 2
d 3 = 4.884 y + 0.0022
e = ln 1 / y
g = ln 1 / 1 y
y is the cold air mass ratio, i.e., y = m gc / m g , and T1 and P1 are the temperature and pressure of the inlet air, respectively. Patm is the atmospheric pressure. Although this is a simplified empirical model, it was validated by Shannak [22] against experimental data and showed excellent agreement over a range of inlet pressures of 3.5~9 bar and two operating temperatures of 292 and 298 K.

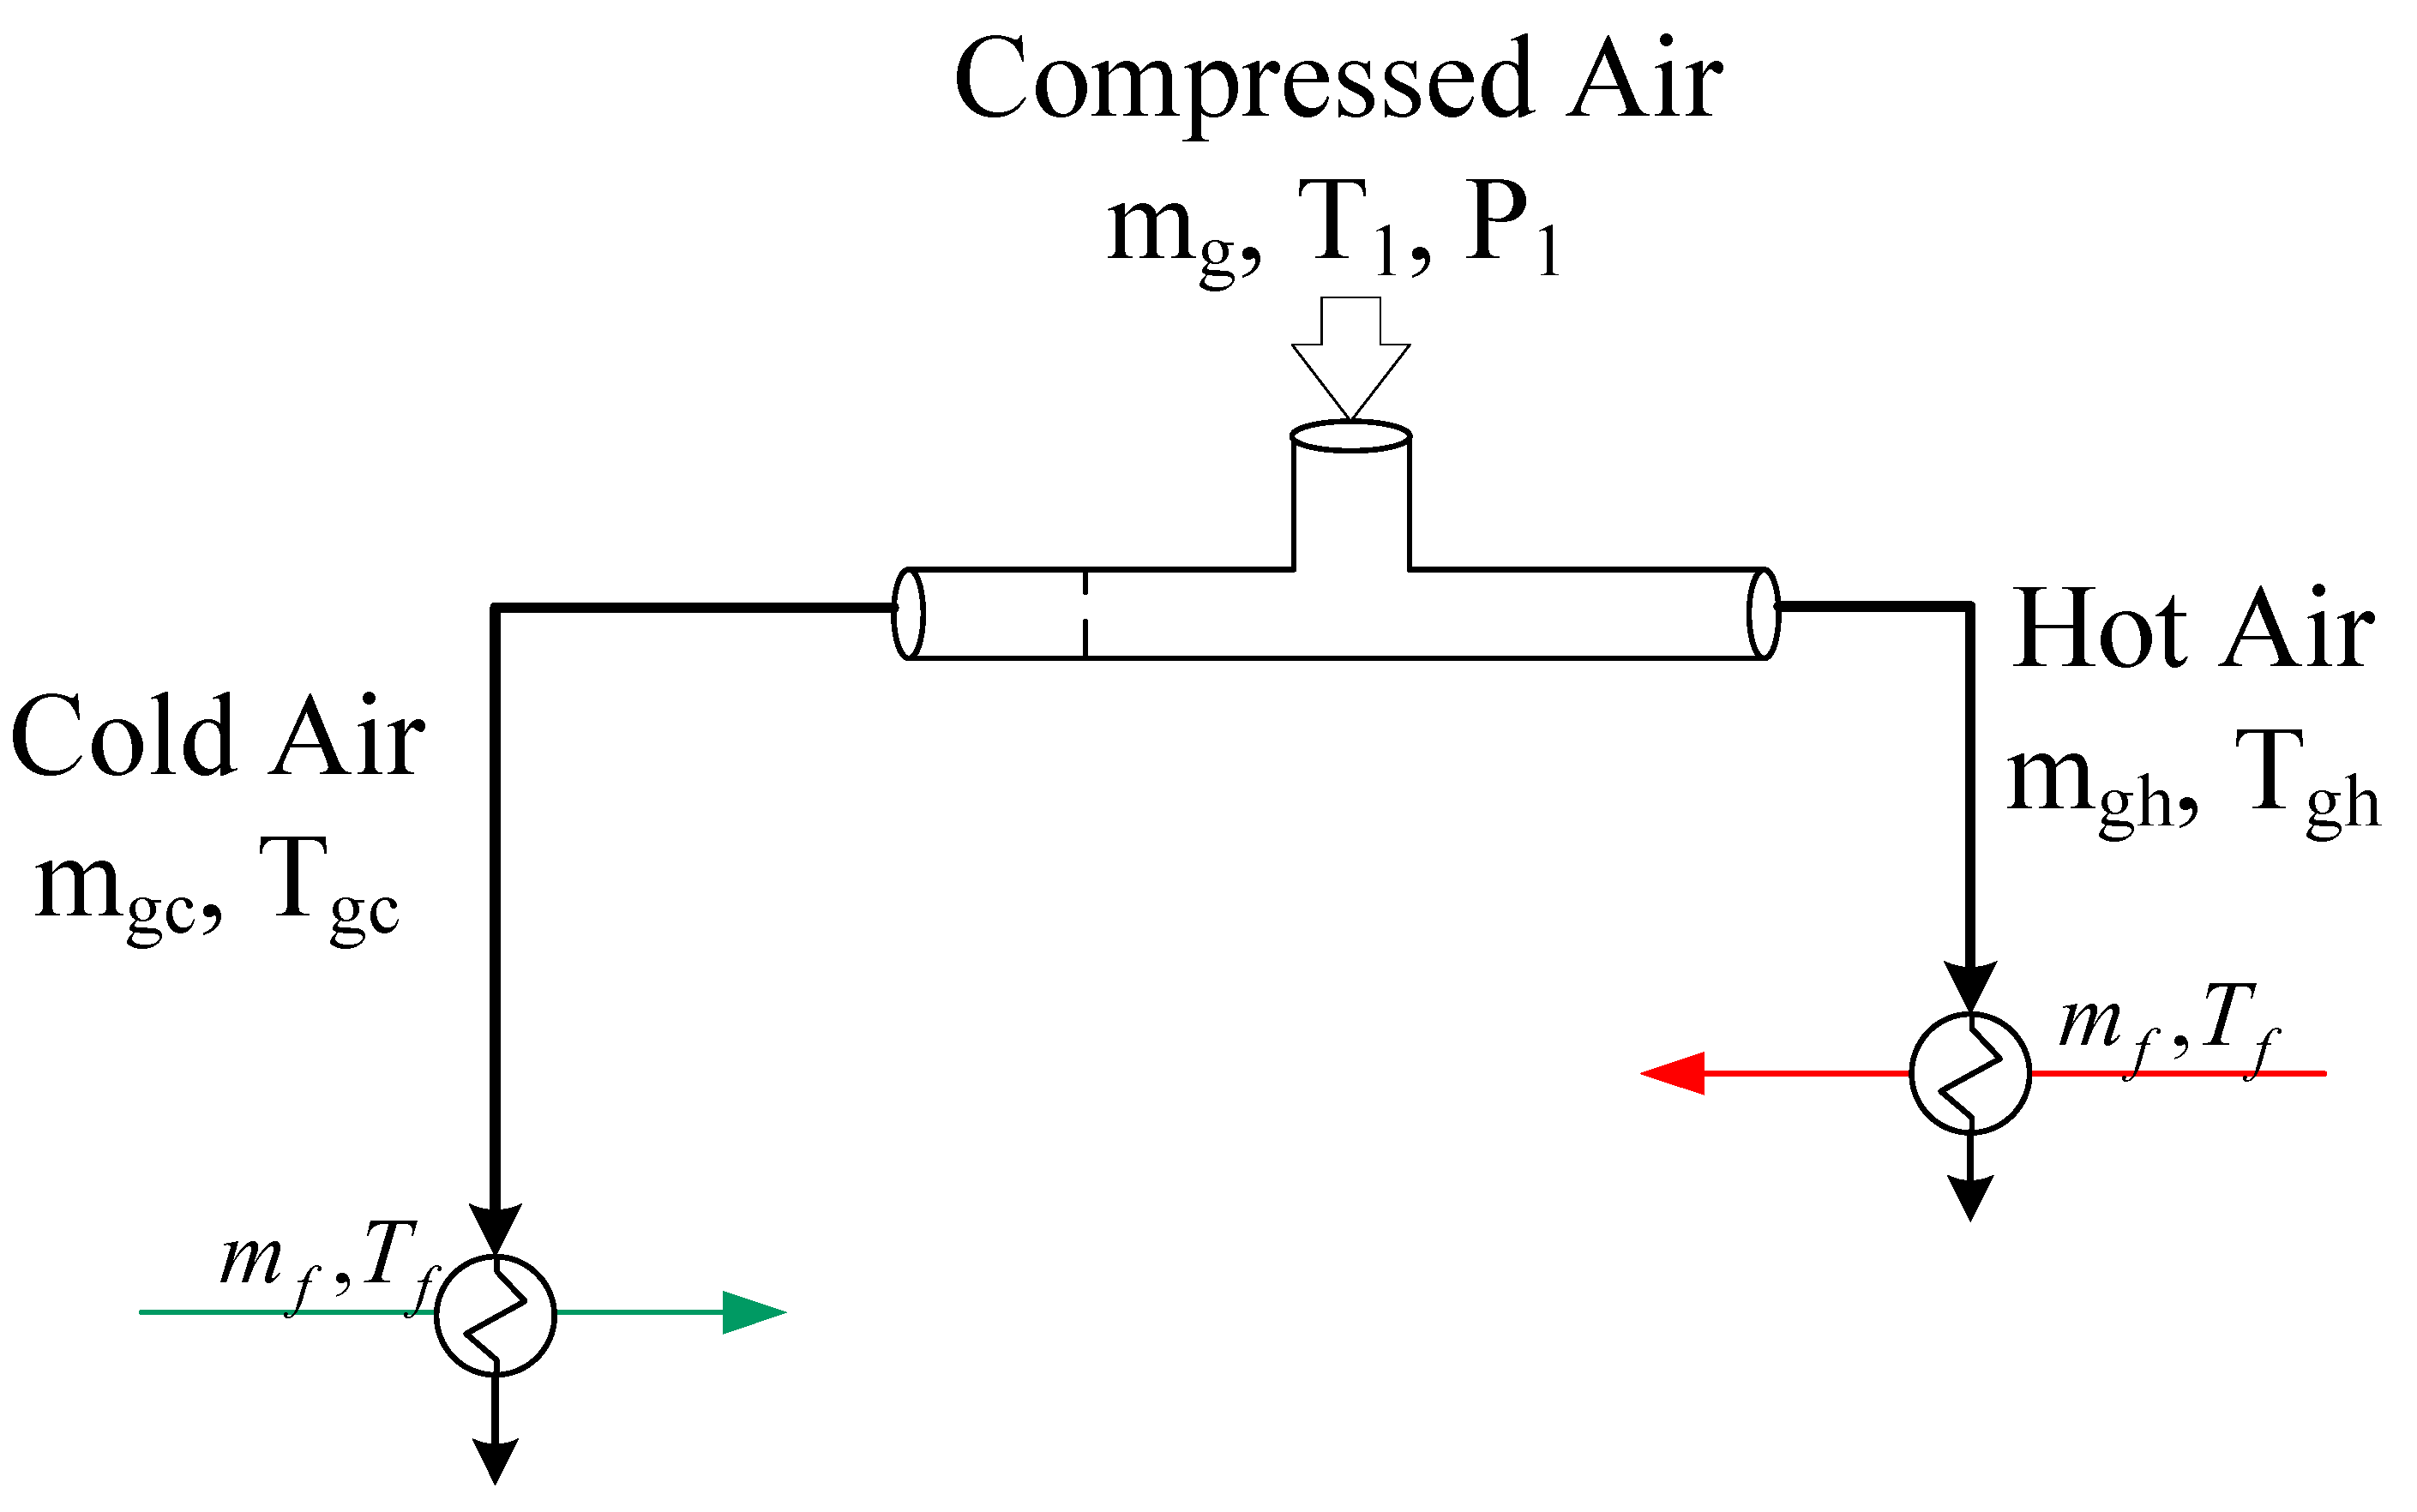
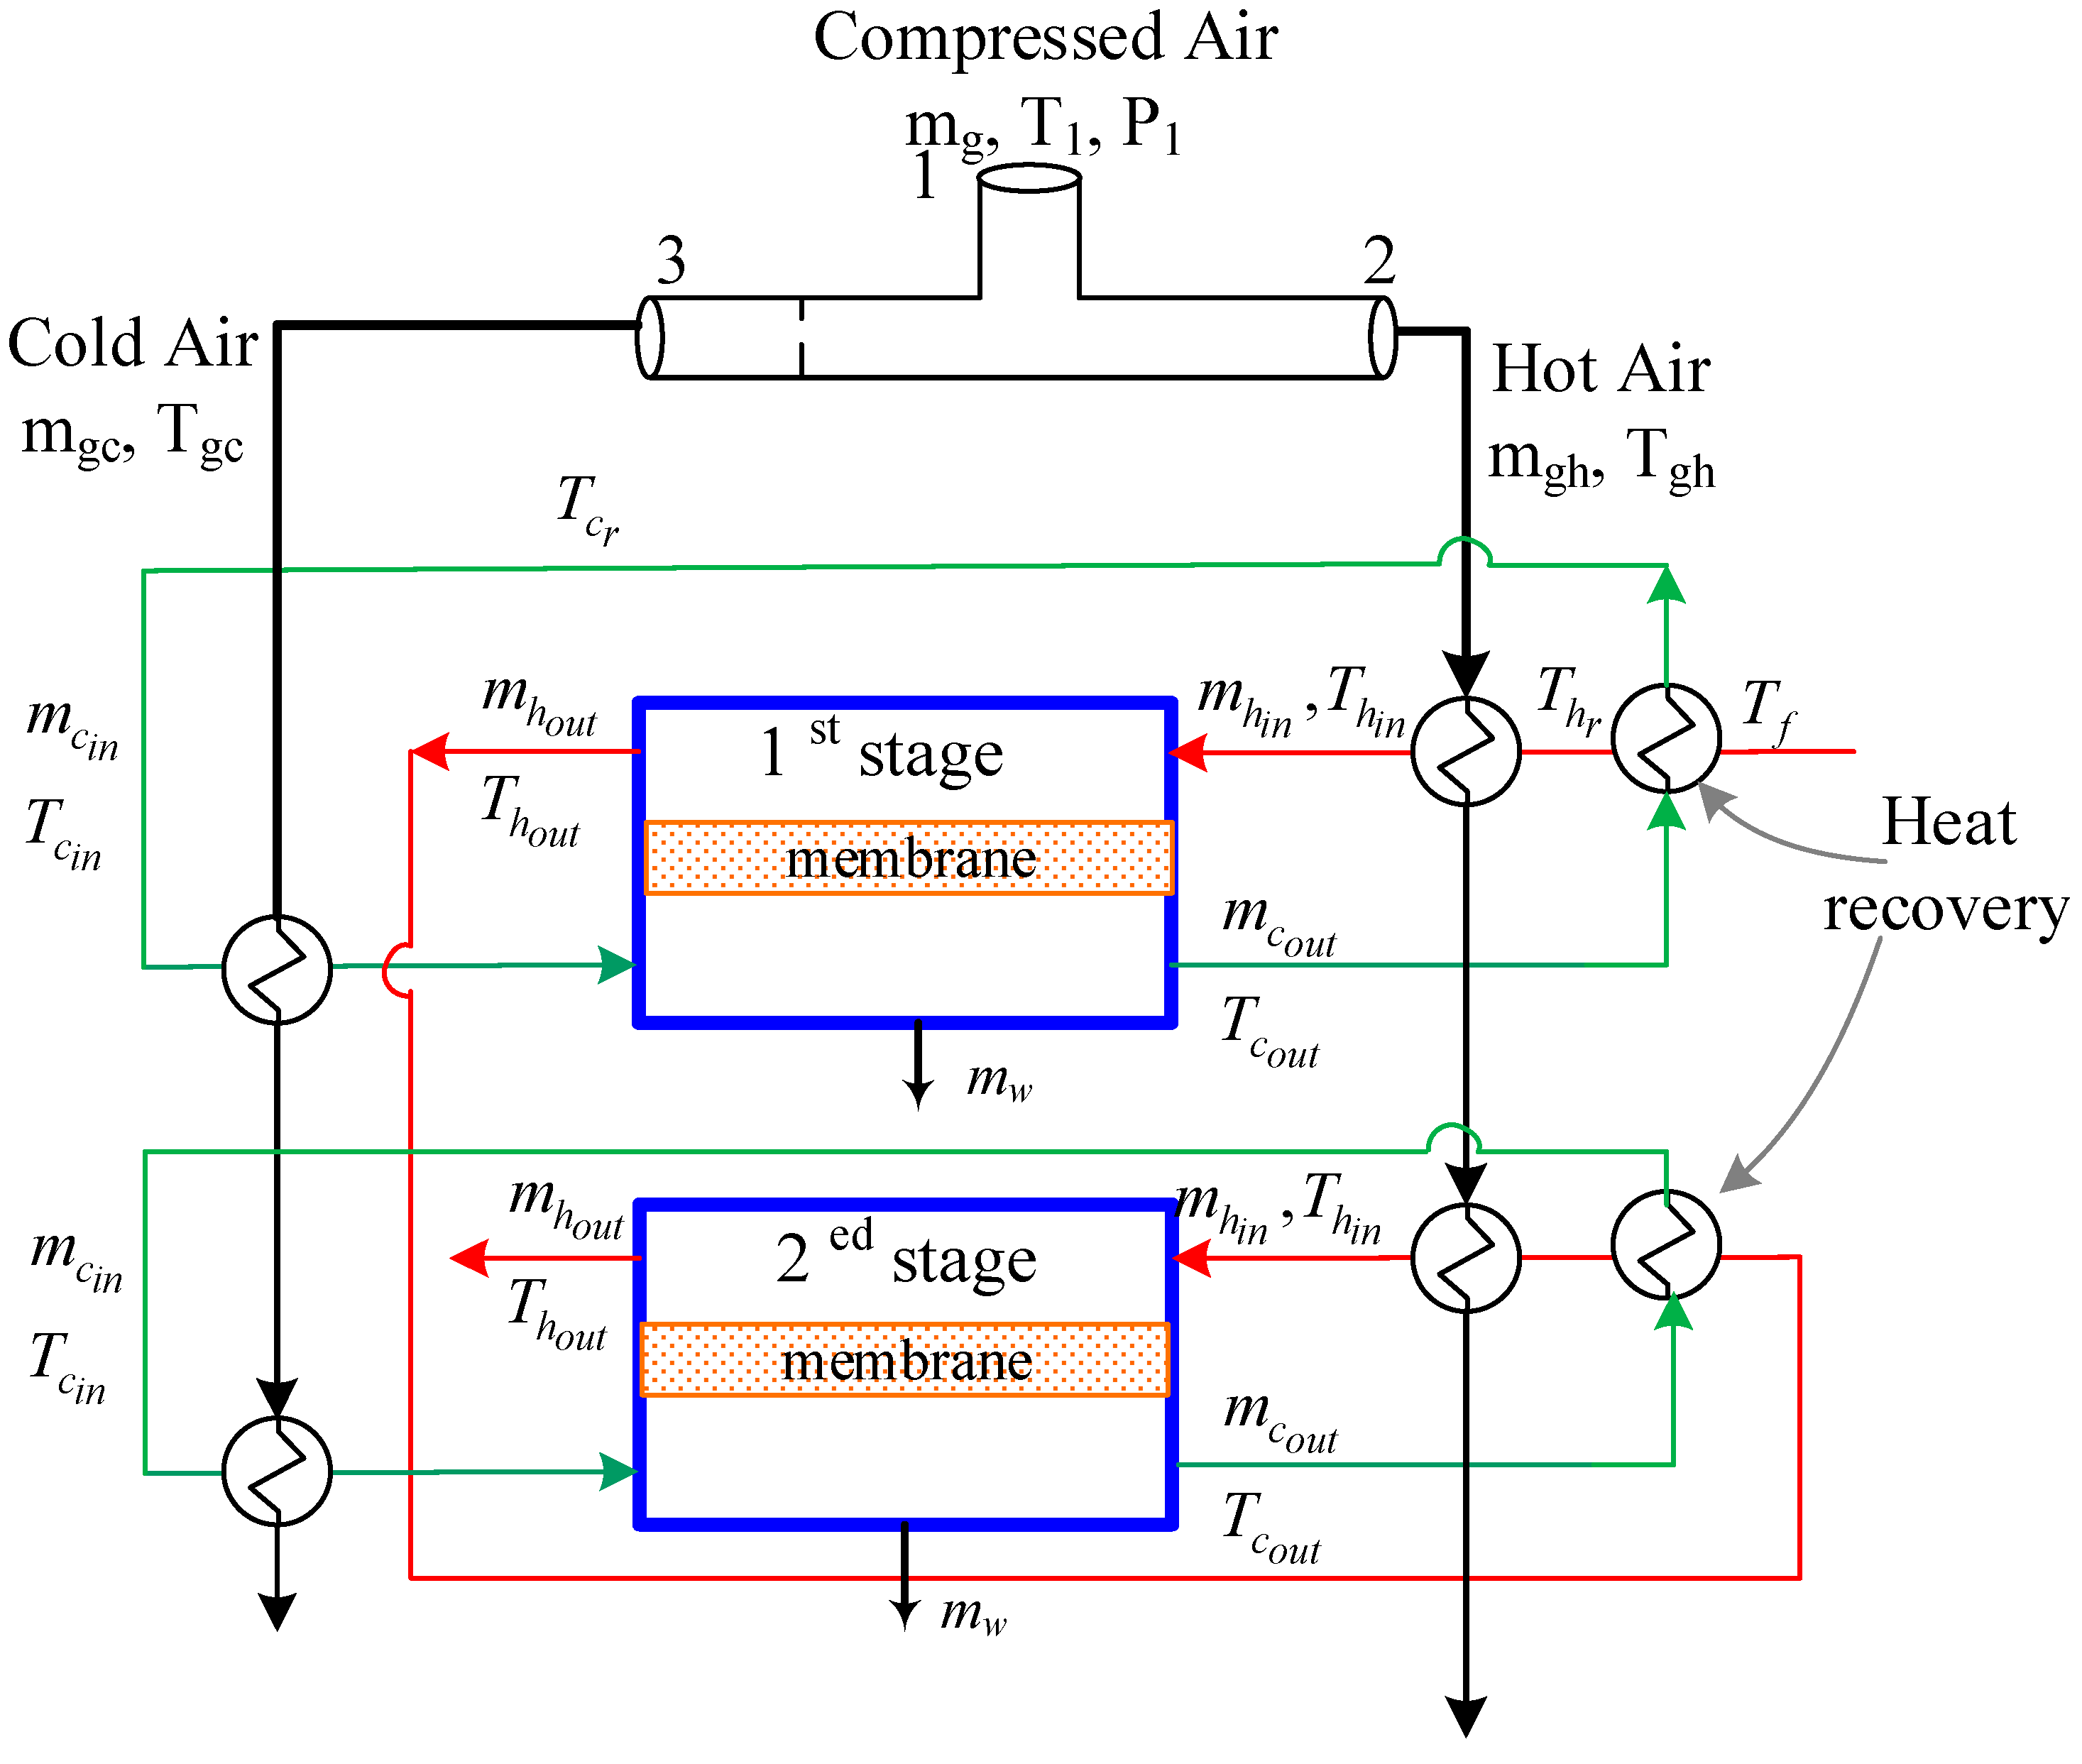
2.2. Integrated Vortex MD System

In this study, we seek to integrate the vortex tube with a typical MD process. In this structure, the role of the tube is to supply the required thermal energy for the MD unit allowing for the feed saline water heating and formed vapor cooling and condensation. Figure 2 displays the proposed structure. In such a structure, the hot air exiting the tube will supply energy to the heat exchanger responsible for preheating the MD feed. On the other hand, the cold air exiting the tube will be used to quench the MD permeate stream. Both the feed and permeate stream are assumed to be available at an arbitrary temperature of Tf = 298 K. The MD module is a typical hybrid thermal and membrane separation process. Heated saline water is usually fed to the membrane. The hot feed provides sensible heat for water vaporization on the hot side of the membrane. Due to the vapor pressure difference, water vapor migrates through the hydrophobic membrane to the permeate side where it condenses and is collected as a distillate product.
The subsystems in Figure 2 are noninteracting. Therefore, solving the vortex equations results in specifying the hot and cold gas temperatures from which the MD inlet temperatures are determined. Knowing the inlet flow rate, temperature, and salinity of both streams of the MD, T h i n , T c i n , m h i n , m c i n , x f , the distillate production rate can be calculated by solving the MD model equations as follows [29,30,31]:
For simplicity, the inlet temperatures will be taken as the bulk temperatures, i.e., T h b = T h i n ,   T c b = T c i n
  • Given the bulk temperature at both sides of the MD membrane ( T h b ,   T c b ), the local heat transfer coefficients ( h f ,   h p ) are calculated from the Nusselt number as follows [15]:
    Nu = 0.298 Re 0.646 Pr 0.316
    where Re = dρu/μ is the Reynolds number and Pr = Cpμ/k is the Prandtl number.
  • Set T h 0 m = T h b   and   T c 0 m = T c b .
  • Calculate the vapor pressure at the membrane interface using [14]:
    P 1 = exp 23.238 3841 T h m 45 1 X f × 10 6
    P 2 = exp 23.238 3841 T c m 45  
  • Knowing the membrane characteristics and the average membrane temperature, i.e., T = T h m + T c m 2 , the membrane coefficient Cm can be estimated utilizing the correlation in [32] according to the designated mechanism:
    • Knudsen flow mechanism, kn > 1:
      C m   k = 2 ε r 3 τ δ 8 M w π R T 1 / 2
    • Molecular diffusion mechanism, kn < 0.01:
      C m D = ε τ δ P D P a M w R T
    • Knudsen–molecular diffusion transition mechanism, 0.01 < kn < 1:
      C m   C = 3 2 τ δ ε r π R T 8 M w 1 / 2 + τ δ ε P a P D R T M w 1
      where the Knudsen number is defined as k n = λ d and λ is the mean free path of water molecules, expressed as (15):
      λ = k B T 2 π P d e 2
P is the average pressure at the membrane interface, kB = 1.380622 × 10⁻²³, and de = 9.29 × 10⁻²⁰.
5.
Calculate the latent heat of vaporization at the average membrane temperature using [33]:
h v T = 1850.7 + 2.8273 T 1.6 × 10 3 T 2
6.
Calculate the mass flux using:
j w = C m P 1 P 2
7.
Compute the overall heat transfer coefficient using [13]:
U = 1 h f + 1 h m + J w h v T h m T c m + 1 h p 1
The membrane heat transfer coefficient (hm) represents the heat resistance due to conduction and can be estimated using [34]:
h m =     k m δ = 1 ε k s + ε k g δ
8.
At equilibrium, the heat convection from the hot side to the membrane interface and heat convection from the membrane interface to the cold side are equal. Hence, the following conditions hold [32]:
U T h b T c b = h f T h b T h m = j w h v + h m T h m T c m
U T h b T c b = h p T c m T c b = j w h v + h m T h m T c m
These constraints can be used to compute new values for T h m   and   T c m .
9.
If T h m = T h 0 m   and   T c m = T c 0 m , then stop the iteration, otherwise set T h 0 m = T h m   and   T c 0 m = T c m and go back to step 3.
When the algorithm converges, the water production is computed as follows:
m w = j w × A m d
And the outlet temperatures are calculated from the following heat balance around the MD module for the hot side and cold side as follows:
m h i n C p T h i n T h o u t = U × A m d × T h b T c b
m c o u t C p T c o u t T c i n = U × A m d × T h b T c b
It should be noted that taking the bulk temperature to be the inlet temperature results in an overestimation of the mass flux. A better simulation can be obtained by taking the bulk temperature as the average value, i.e., T h b = T h i n T h o u t   ,   T c b = T c i n T c o u t   ; however, this will require unknown variables, i.e., T h o u t   and   T c o u t . In this case, the solution procedure will involve two iteration loops. The outer iteration loop fixes T h o u t   and   T c o u t and the inner iteration loop fixes T h m   and   T c m . It is common to compute some performance indicators such as the recovery ratio:
R c = m w m h i n
In addition, the specific energy consumption which is taken as the power of air compressions is as follows:
S E C   k W h m 3 = m g ρ Δ P m w
The characteristic of the membrane sheet to be used in the model is given in Table 1. The MD properties belong to the experimental rig constructed by Solar Spring (see [29,34]).
The MD structure in Figure 2 is not the most efficient in terms of energy utilization. The permeate usually departs the module at a relatively high temperature. The most common practice is to recover this abundant energy by preheating the feed as shown in Figure 3. Moreover, the permeate stream is used as a condenser stream, hence using continuous fresh permeate is not economical. Therefore, it is more practical to recycle the permeate. Because the permeate will be warm even after losing its thermal energy at the heat recovery system, it must be cooled down to the desired inlet temperature. This structure is denoted as MD with heat recovery. In this structure, less heating energy is required because T h r is higher than T f . Conversely, more cooling energy is required because T c r is higher than T f .

3. Results and Discussion

3.1. Vortex Model Validation

This section deals with testing the validity of the Vortex tube model to faithfully represent the reported data and hence to ensure its eligibility to power the MD system. Accordingly, we test the vortex model to generate the air temperature profile. The empirical model Equations (1)–(13) are numerically solved for different inlet air pressures and cold air mass ratios. The result is shown in Figure 4. The trend shown in Figure 4 indicates that the highest hot air temperature can be achieved at a high cold air mass ratio, i.e., around y = 0.8, while the coldest air temperature can be obtained at a lower cold air mass ratio, i.e., around y = 0.4. The intensity of the hot and cold temperatures increases as the inlet air pressure increases. The obtained profile in Figure 4 for the air temperature separation coincides with that reported by Shannak [22]. However, a comparison cannot be generated as numerical values are not given in the reference. Nevertheless, the shape of the profile and the order of magnitude of the hot and cold temperatures are in good agreement. It should be noted that the inlet gas temperature of the reported data is not clearly defined and that the reported data include overlapping experimental measurements. Nevertheless, the challenge with this device is that the maximum hot temperature occurs at the corresponding lower mass rates of the hot stream. Similarly, the minimum cold temperature occurs at the lower mass rate of the cold stream. Hence, there is a tradeoff between capitalizing on the temperature and the mass flow rate.

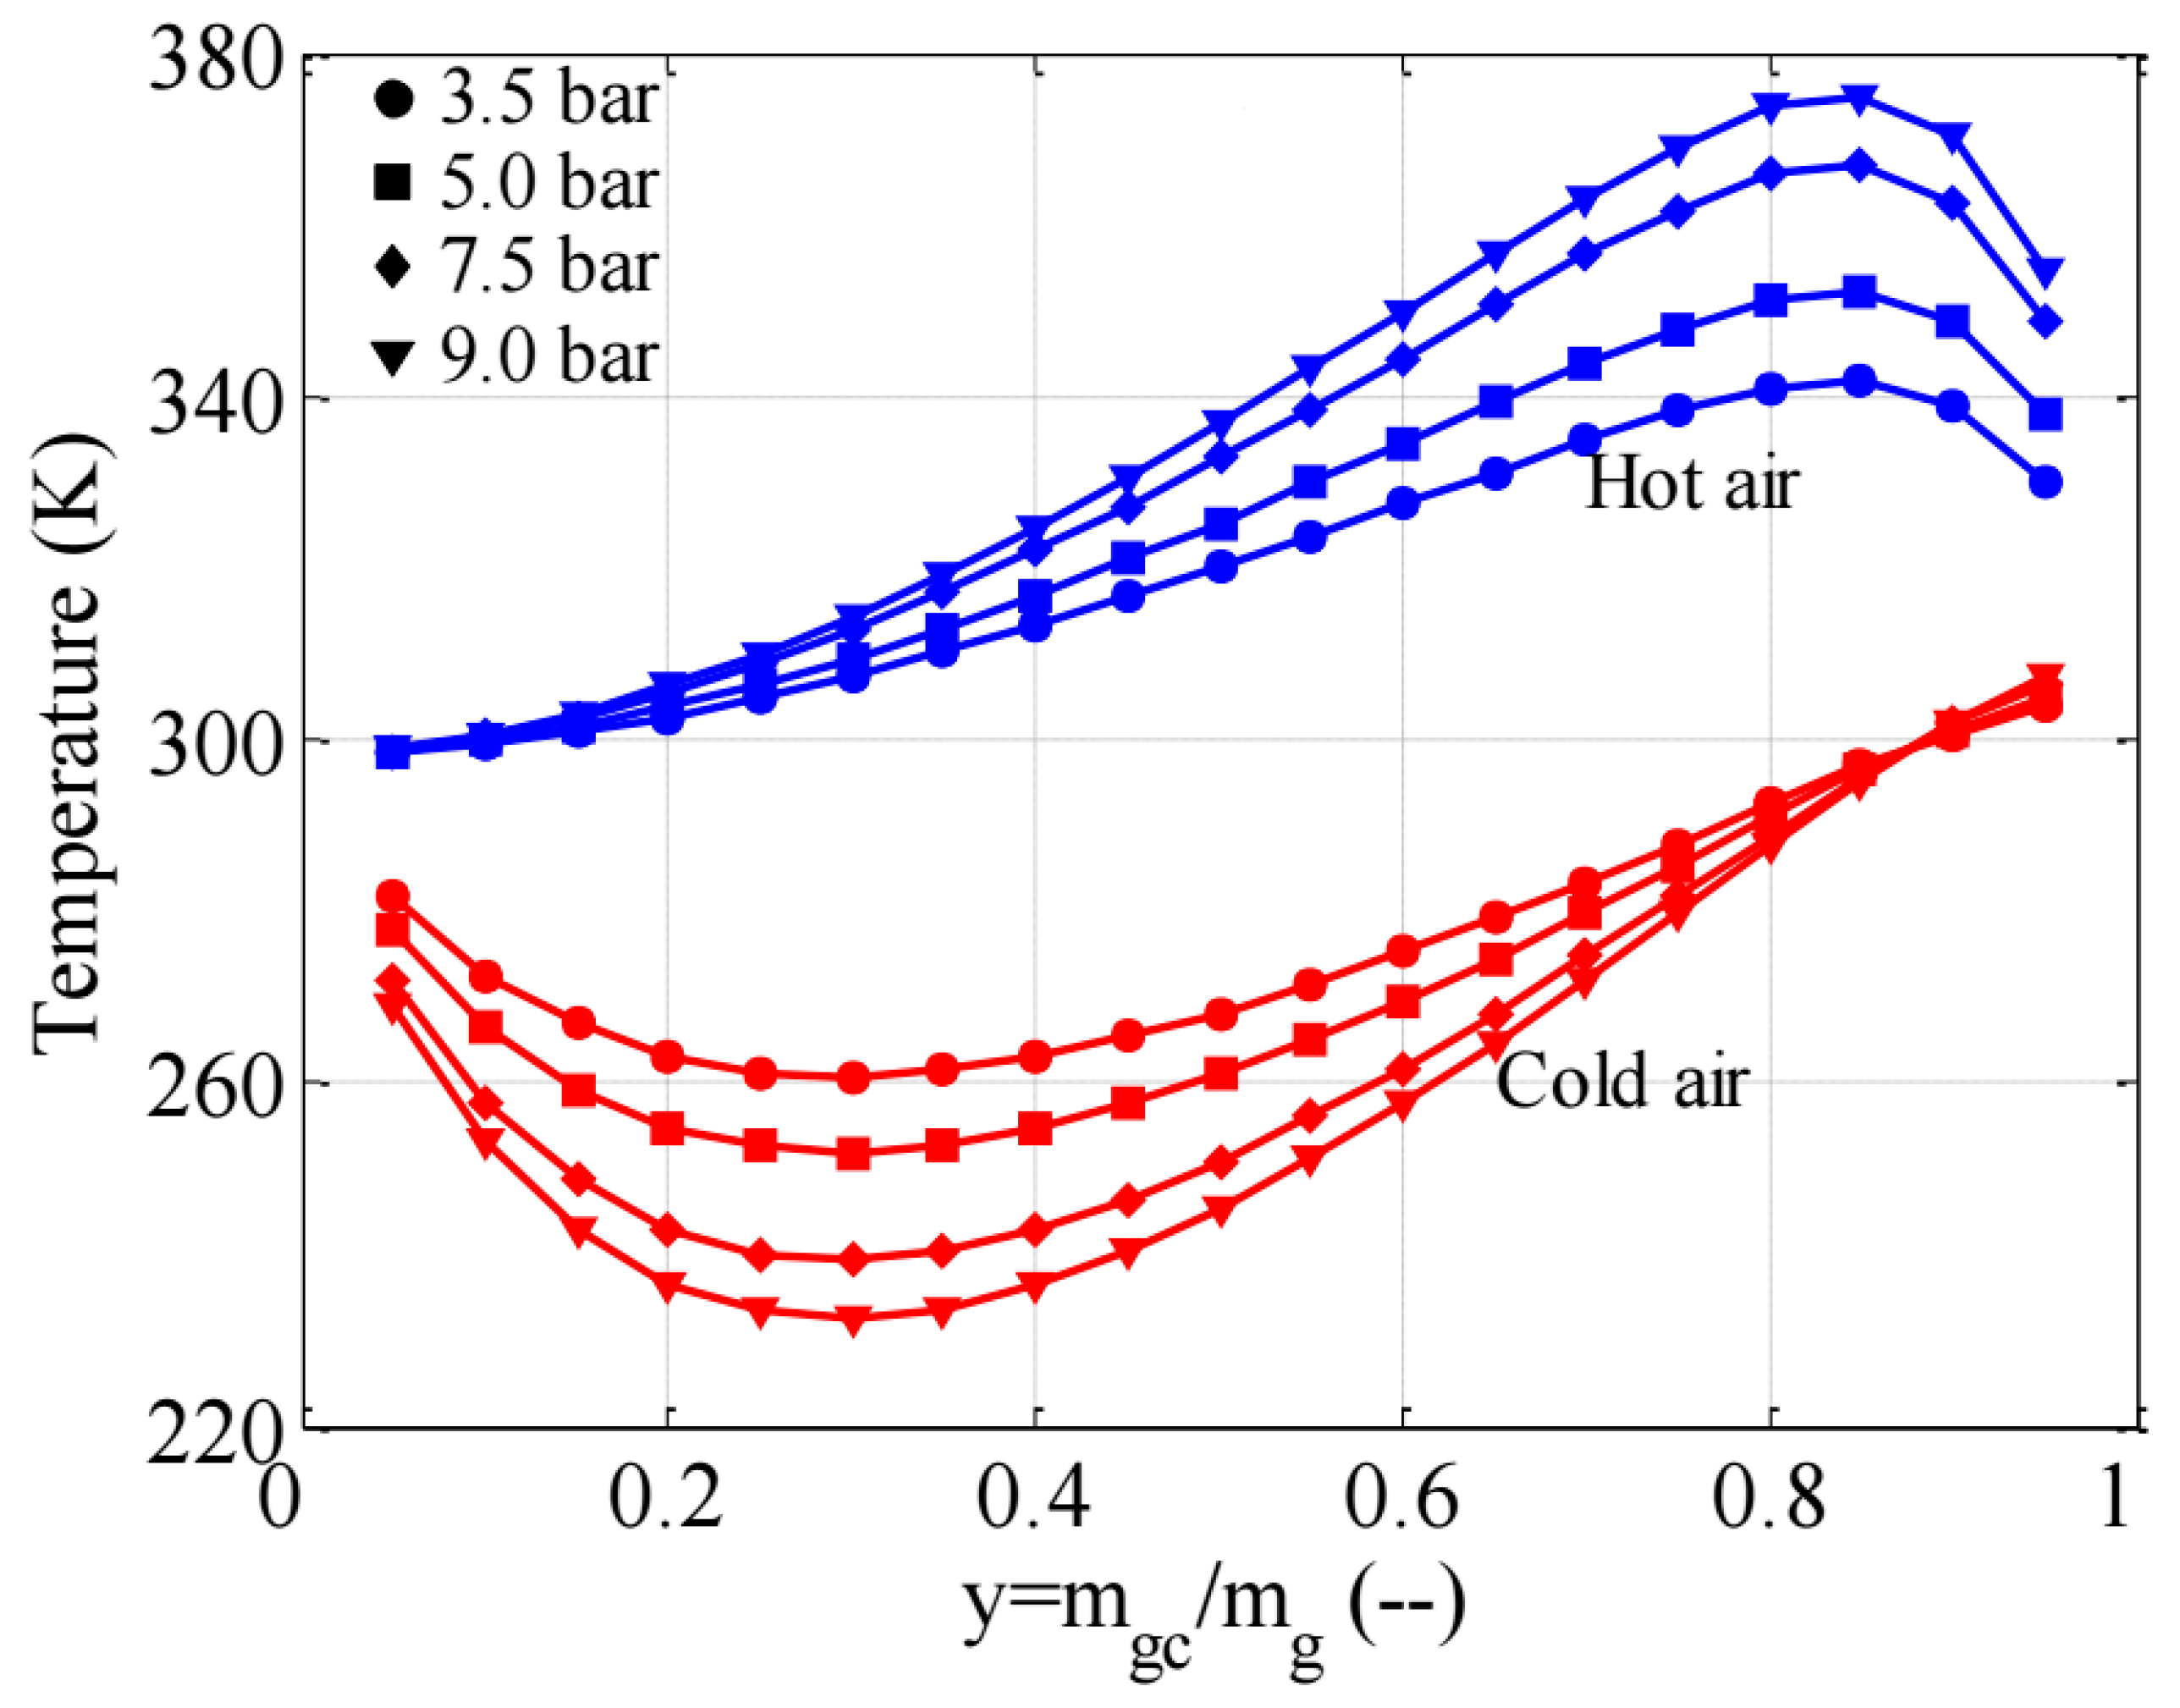
3.2. Heating and Cooling Capability of the Vortex Tube
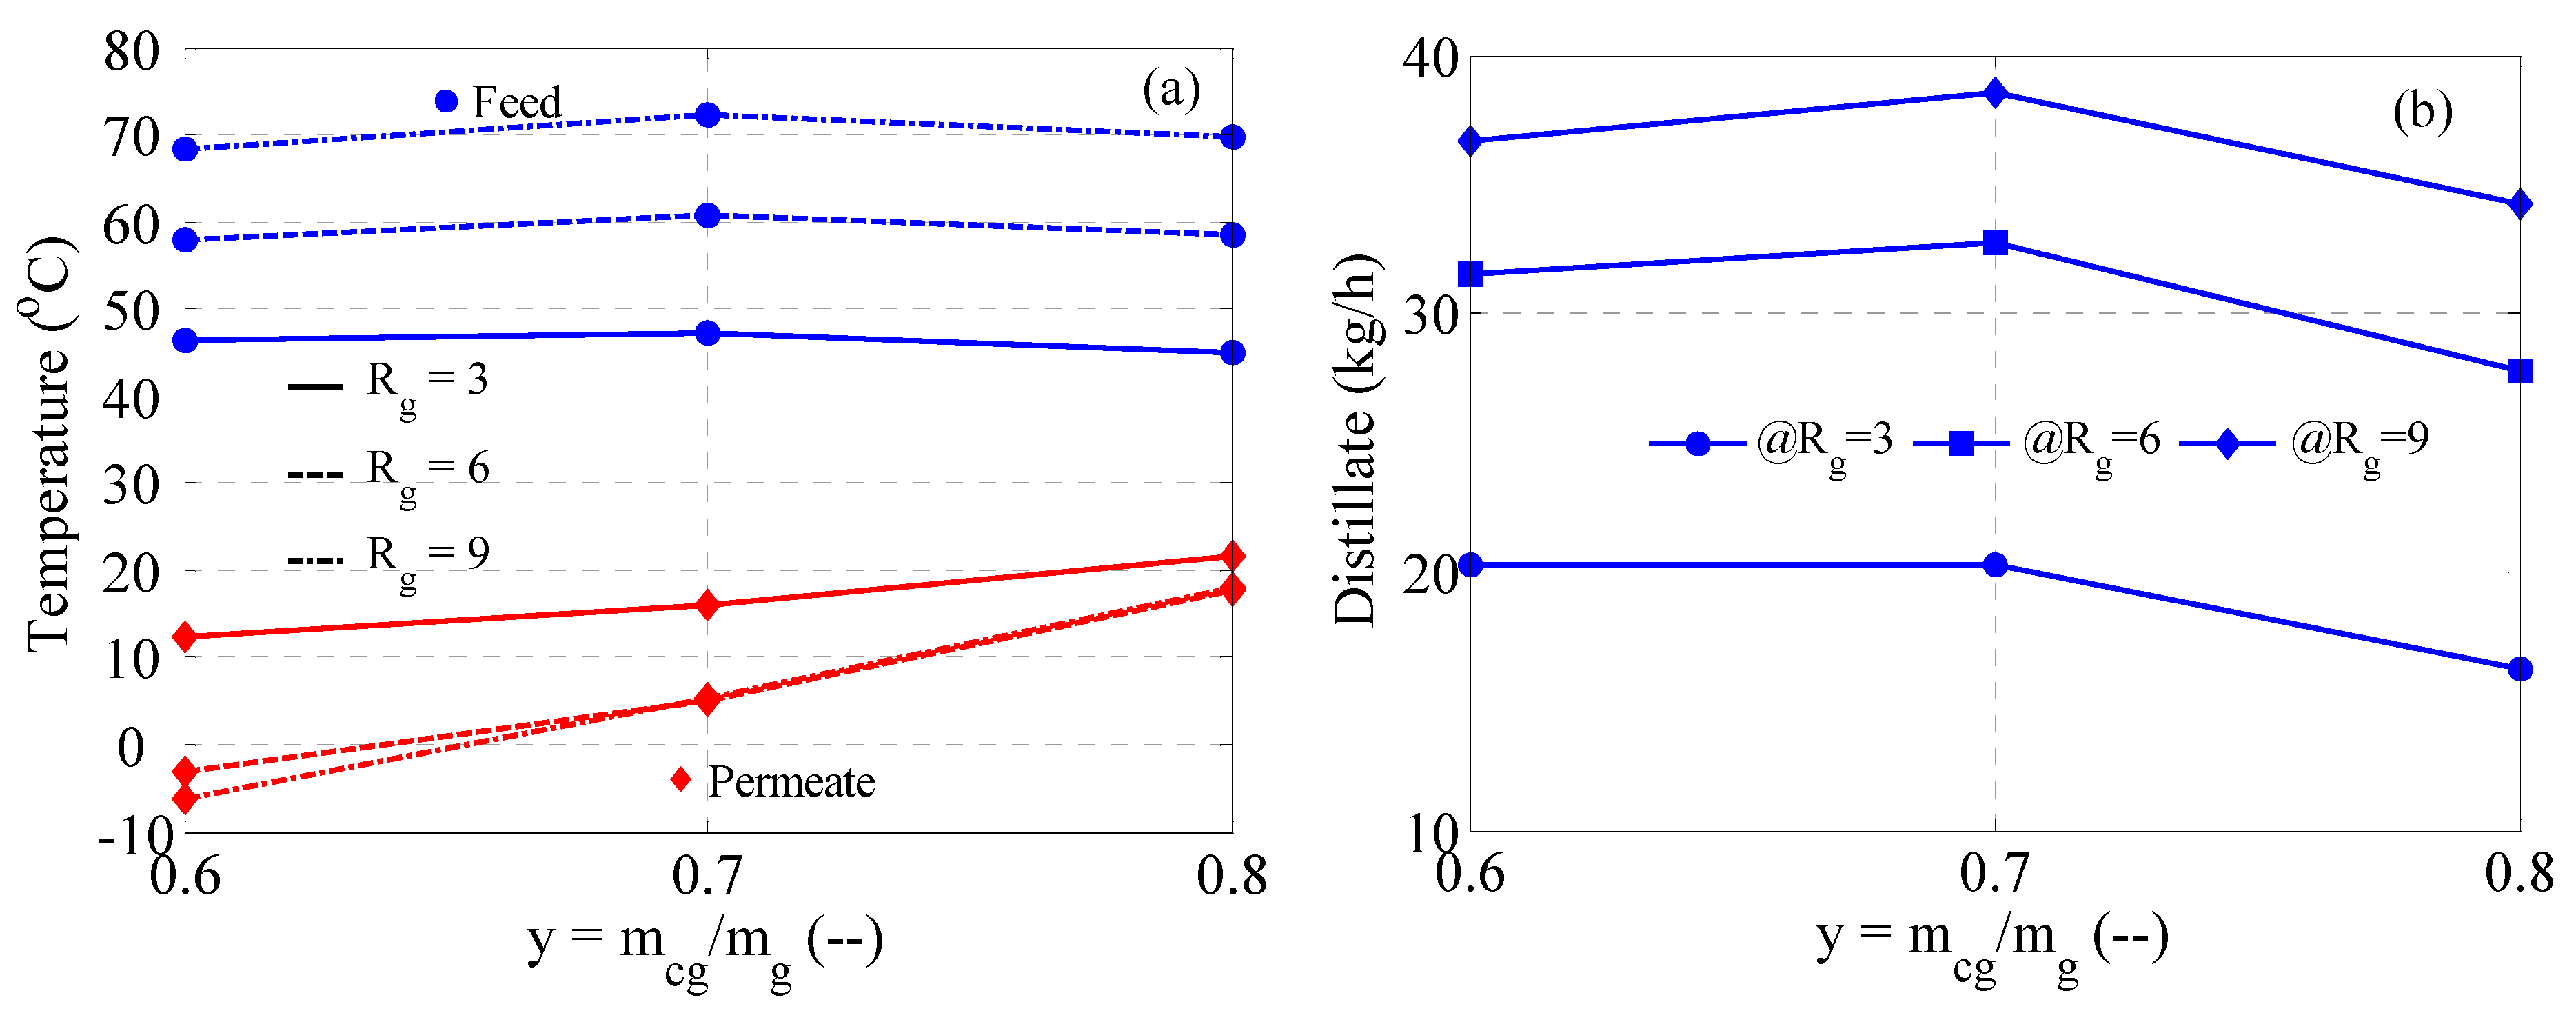
In this section, the effectiveness of the vortex tube exit gases to heat and quench water streams is examined. The schematic displayed in Figure 5 manifests the objective of the test. Such an objective is to determine the operating conditions under which the water streams can be heated and cooled to the desired temperatures required to operate a typical MD process. The hot air is used to heat a water stream of 500 kg/h and a temperature of 25 °C. The cold air is used to cool down a water stream of 500 kg/h and a temperature of 25 °C. The idea is to examine the effect of the inlet gas mass flow rate and the cold mass flow rate ratio on the heat exchanger performance. The efficiency of the heat exchanger is set arbitrarily to 80%. Note that the heat capacity ratio of water to air is 4:1. Thereby, it is of interest to determine at which air mass flow rate the heat transfer between the two gas streams becomes more effective. Moreover, as mentioned earlier, there is a trade-off between cooling and heating in relation to the cold mass flow rate ratio, as is shown in Figure 4. Thus, it is of interest to examine the effect of the cold air mass ratio (y) to balance between heating and cooling. The simulation results using compressed air at 9 bar, 298 K, and a cold air mass ratio of 0.7 are depicted in Figure 6. Note that at y = 0.7, not maximum but sufficiently hot air around 90 °C can be obtained. Similarly, sufficiently cold air around −2 °C can be obtained. A high gas mass rate was used ranging from 3 to 9 times the value of the water mass rate to ensure high capacitance for the gas stream equivalent or even more than the water stream capacitance. We assume that multiple vortex tubes arranged in parallel can be used to accommodate such high gas flow rates. The hot air managed to increase the water temperature from 25 °C to around 40 °C at the air-to-water mass flow ratio of Rg = 3 and from 25 °C to up to 60 °C at Rg = 9. This means that the water stream is not sufficiently heated or has not fully harnessed the thermal energy of the hot air. This is because, at y = 0.7, only 30% of the inlet gas is produced as hot air. Hence, the hot air mass rate is indeed 0.9 to 2.7 times the value of the water stream. This means a much higher air mass rate is needed to fully leverage the thermal energy of the hot air. Conversely, the cold air was able to cool the water stream down to 14 °C at Rg = 3 and to 6 °C at Rg = 6. Afterward, the water temperature reaches an asymptotic value and becomes insensitive to increasing cold air mass rate. This is because the heat exchanger reached its thermodynamic limit set by its preset efficiency. This means that the surplus of cold air is a waste. Nevertheless, the temperature increment on the hot side is larger than that obtained on the cold side. This is because the vortex tube is operating at a maximum hot temperature region. Apparently, y should be carefully adjusted according to the application purposes/priority, i.e., heating or cooling.

3.3. MD Performance

This section studies the feasibility of the vortex tube to provide the necessary heating and cooling requirements to operate the MD process. Despite the limitation, the results shown in Figure 6 showed the ability of the vortex tube to heat and cool water streams and provide a reasonable temperature difference. Provided that the air mass rate surpasses the water mass rate by many folds, the temperature difference can reach up to 50+ °C, which can provide decent driving force for a typical MD unit. Therefore, in this section, the performance of the MD structure shown in Figure 2 is analyzed by taking T f = 298   K ,   m h i n = m c i n = 500   kg / h . The feed is assumed to have a salinity of 5000 ppm to represent typical brackish water. Inlet air at 9 bar and 298 K will be utilized in the vortex tube. The result of the simulation is illustrated in Figure 7 for a range of cold air mass flow fractions between 0.4 and 0.8 and selected values for the air–water mass ratio, Rg. As demonstrated by Figure 7a, a wide water temperature difference can be obtained at a cold fraction of 0.6. The maximum temperature difference amounts to around 68 °C and occurs at the highest air mass ratio (Rg). This is intuitive because a higher air flow rate leads to enhanced heat transfer from the gas phase to the liquid phase. The cold water reaches its smallest value at y = 0.4 because the air becomes the coldest in that region. The unnecessary excess of cold air is again apparent at Rg = 9 as the permeate temperature at a mass fraction of 0.7 and 0.8 coincides with that at Rg = 6. Accordingly, the maximum distillate production occurs at a cold fraction of 0.6 for all air-to-water mass ratios as depicted in Figure 7b. The maximum production approaches 32 kg/h when operating at Rg = 9. Increasing the air-to-water mass flow rate ratio, Rg, from 3 to 9 raises the distillate by about threefold. On another side, operating the vortex tube at a cold air flow rate ratio between 0.5 and 0.7 for not high Rg values has a slight impact on the distillate water production. Water production presents a 6.4% recovery ratio which is common for MD systems [35,36]. However, the system operates at a cryogenic state at Rg > 3 and y 0.7 . This is not acceptable because the permeate may freeze inside the membrane pores plugging the vapor path. Consequently, the acceptable maximum production belongs to the case of y = 0.7 and Rg = 9.

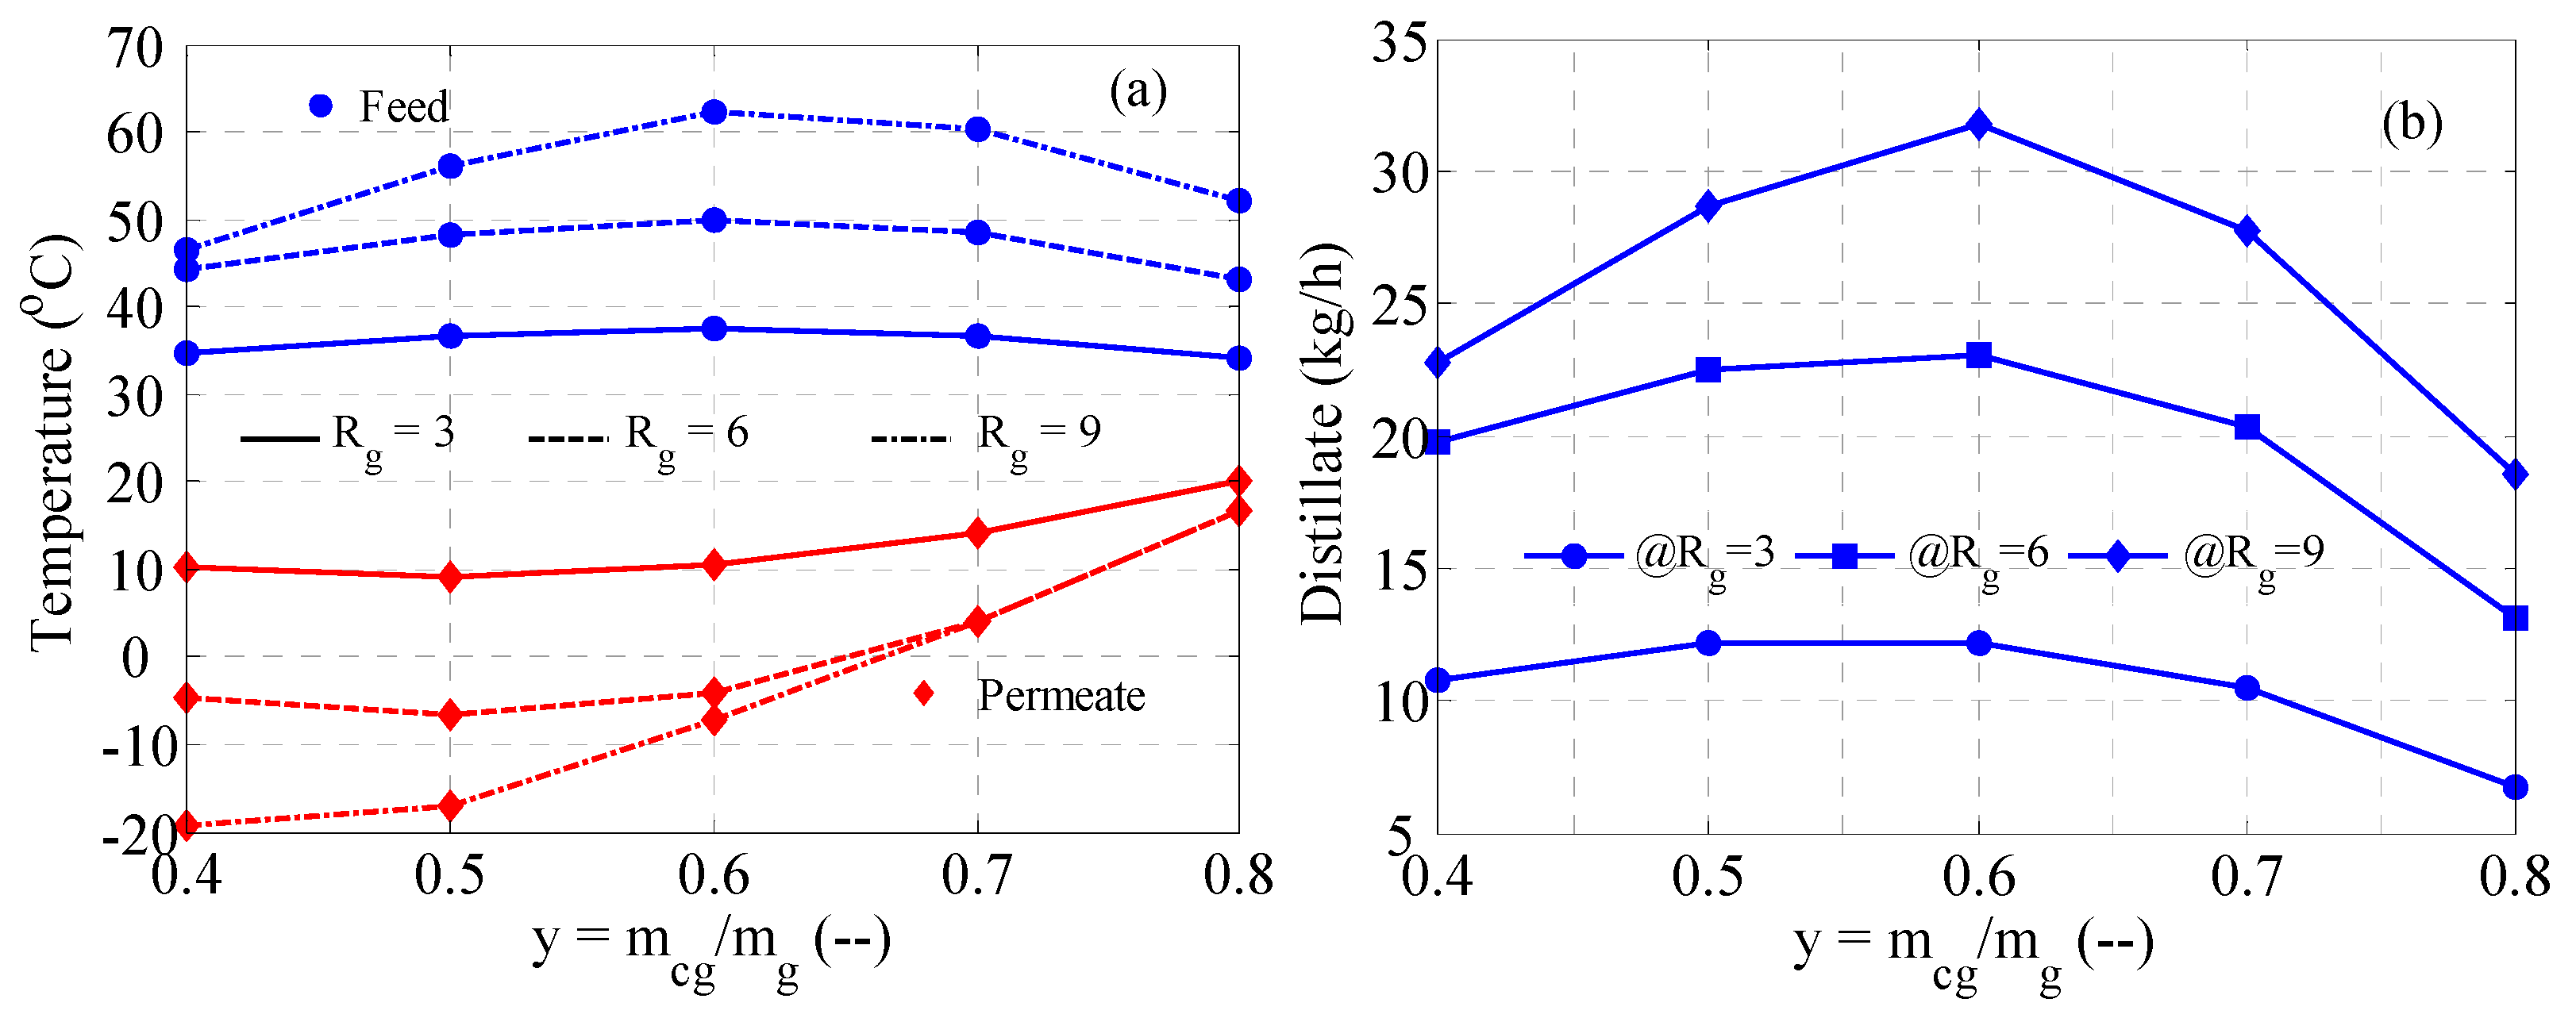
3.4. MD with Heat Recovery Performance

This section studies the feasibility of the vortex tube to power the MD system when heat recovery is involved. In a typical MD operation, a huge amount of energy is transferred from the feed stream to the cold stream. This energy should be recovered and recycled to improve the process’s energy efficiency. The MD structure tested in Section 3.3 does not incorporate a heat recovery system. Hence, the thermal energy of the exiting warm permeate is wasted. Commonly, this abundant energy is recovered by preheating the feed to reduce the heating requirement of the feed and simultaneously reduce the cooling requirement of the permeate stream. For this purpose, the MD structure shown in Figure 3 is examined. The simulation results are depicted in Figure 8. Here, the range of y is shortened to avoid the cryogenic state. As observed in Figure 8a, the maximum temperature difference occurs at y = 0.7 because of the effect of the heat recovery system. Note that the heat recovery system raised the temperature of the feed and that of the permeate. As a result, a wider temperature difference of 77 °C is obtained at Rg = 9, which is 9 °C higher than that obtained without a heat recovery system. At this point, the obtained distillate production approaches 38 kg/h. This is equivalent to a 7.7% recovery ratio.

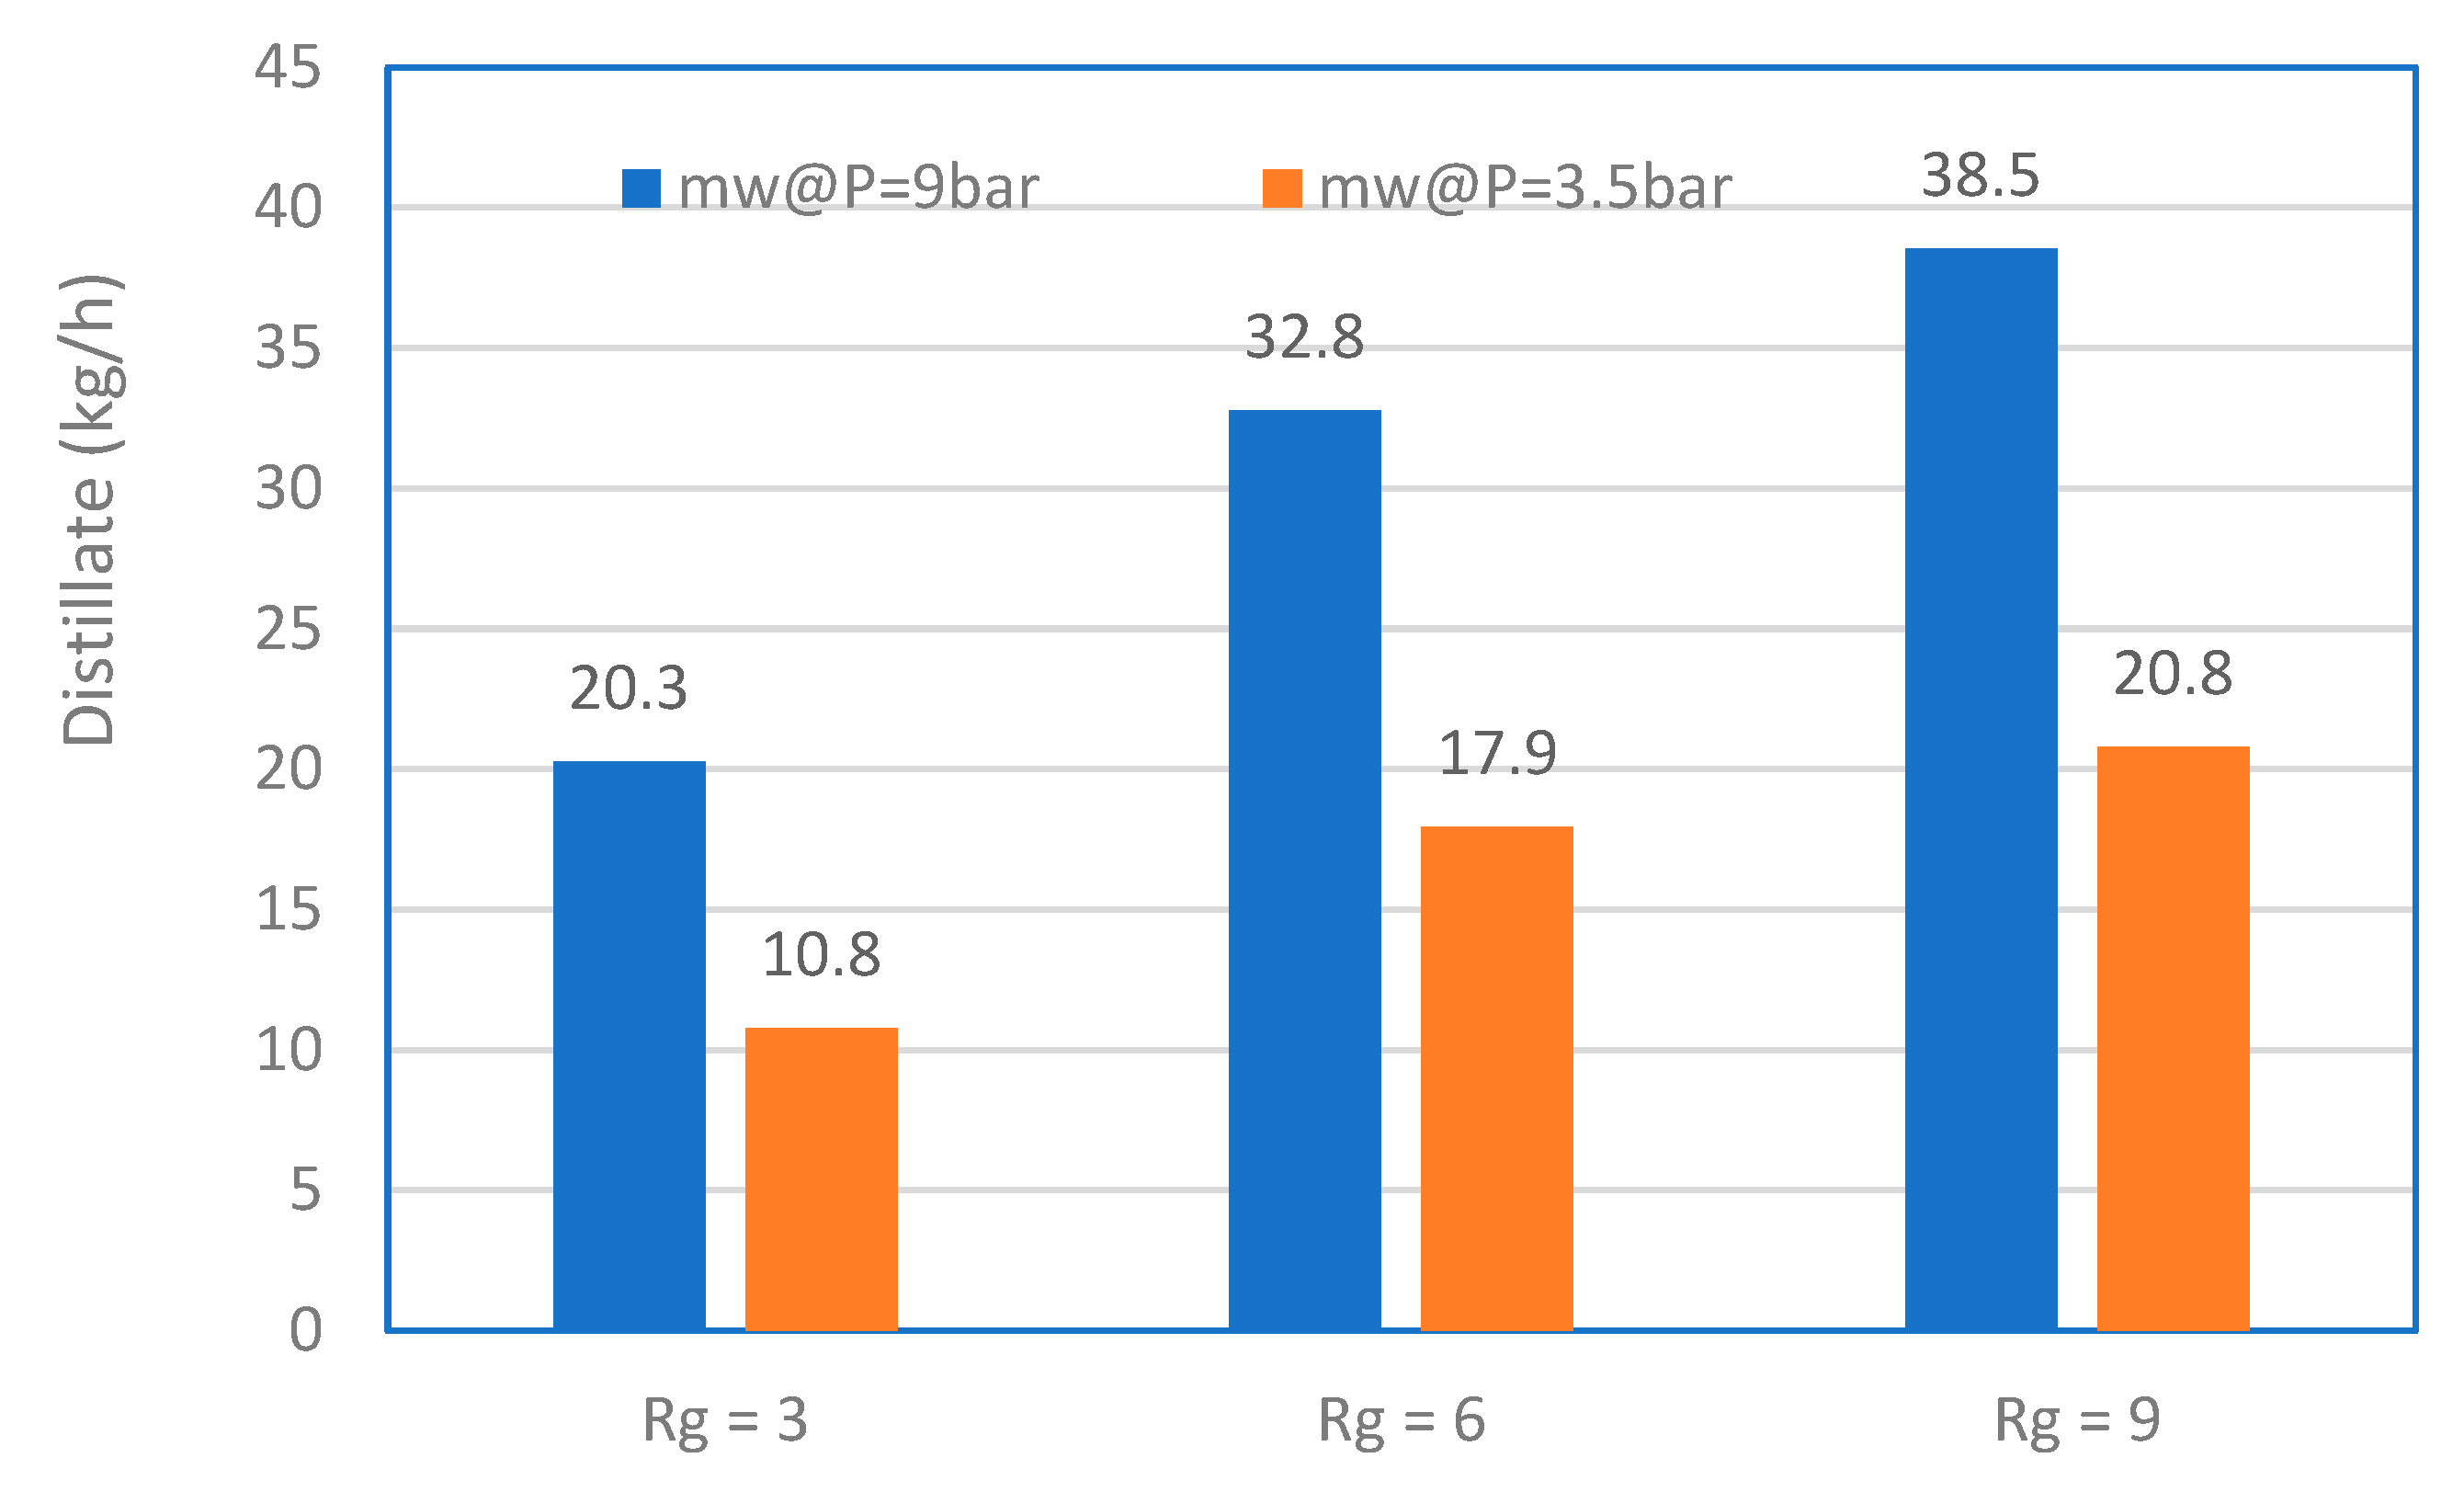
3.5. Energy Consumption

Assessing the energy consumption of water production is a crucial task to undertake. In this section, we compare the performance of the MD with heat recovery at selected inlet air pressures and air-to-water mass ratio values. Comparison is carried out at a fixed mass fraction of 0.7 because it presents the optimal condition for water production far from the cryogenic conditions. A comparison of the distillate production is depicted in Figure 9 for the operating pressures of 3.5 and 9 bar. For both operating pressures, the distillate production improves with the air-to-water mass ratio. Increasing Rg promotes the thermal capacitance of the air and hence enhances the heat transfer between the two streams, leading to a wider temperature difference between the hot and cold gases which enhances the MD distillation potential. At P1 = 3.5 bar, the production increases by 120% when Rg is raised from 3 to 9. At P1 = 9 bar, the production increases by 127% when Rg is raised from 3 to 9. On the other hand, air inlet pressure has a profound impact on water production. For example, at Rg = 9, the production enhances by 85% when P1 is raised from 3.5 to 9 bar. The impact of the inlet pressure on the production is a direct consequence of the temperature separation shown in Figure 4. As the gas pressure increases, the intensity of the separation between the hot and cold air rises, and hence a wider temperature difference at the membrane system is obtained.
The comparison of the specific energy consumption is depicted in Figure 10. Intuitively, the energy consumption rises with Rg as the compression power is directly proportional to the air mass flow rate. For the same reason, energy consumption worsens as the inlet pressure grows. Figure 10 shows that SEC increases almost linearly with Rg with a smaller slope when the heat recovery option is employed. Low SEC values of 9.7, 11.6, and 15 were obtained when using Rg of 3, 6 and 9 respectively. These values are very low when compared with what is reported in the literature for MD systems. This highlights the attractiveness of the proposed hybrid MD vortex tube device. It is worth reminding that the required energy to drive the process is mechanical energy which has a higher grade than low-quality heat from low-temperature waste sources or solar or geothermal sources commonly proposed for MD systems. Evidently, the maximum production of 35.9 kg/h demands the highest specific power consumption of 25.9 kWh/m3. This power consumption is within the reported value by Stillwill and Webber [3]. Nevertheless, the obtained energy consumption encompasses both heating and cooling requirements. Moreover, if waste compressed air is available, this energy is assumed free of cost.

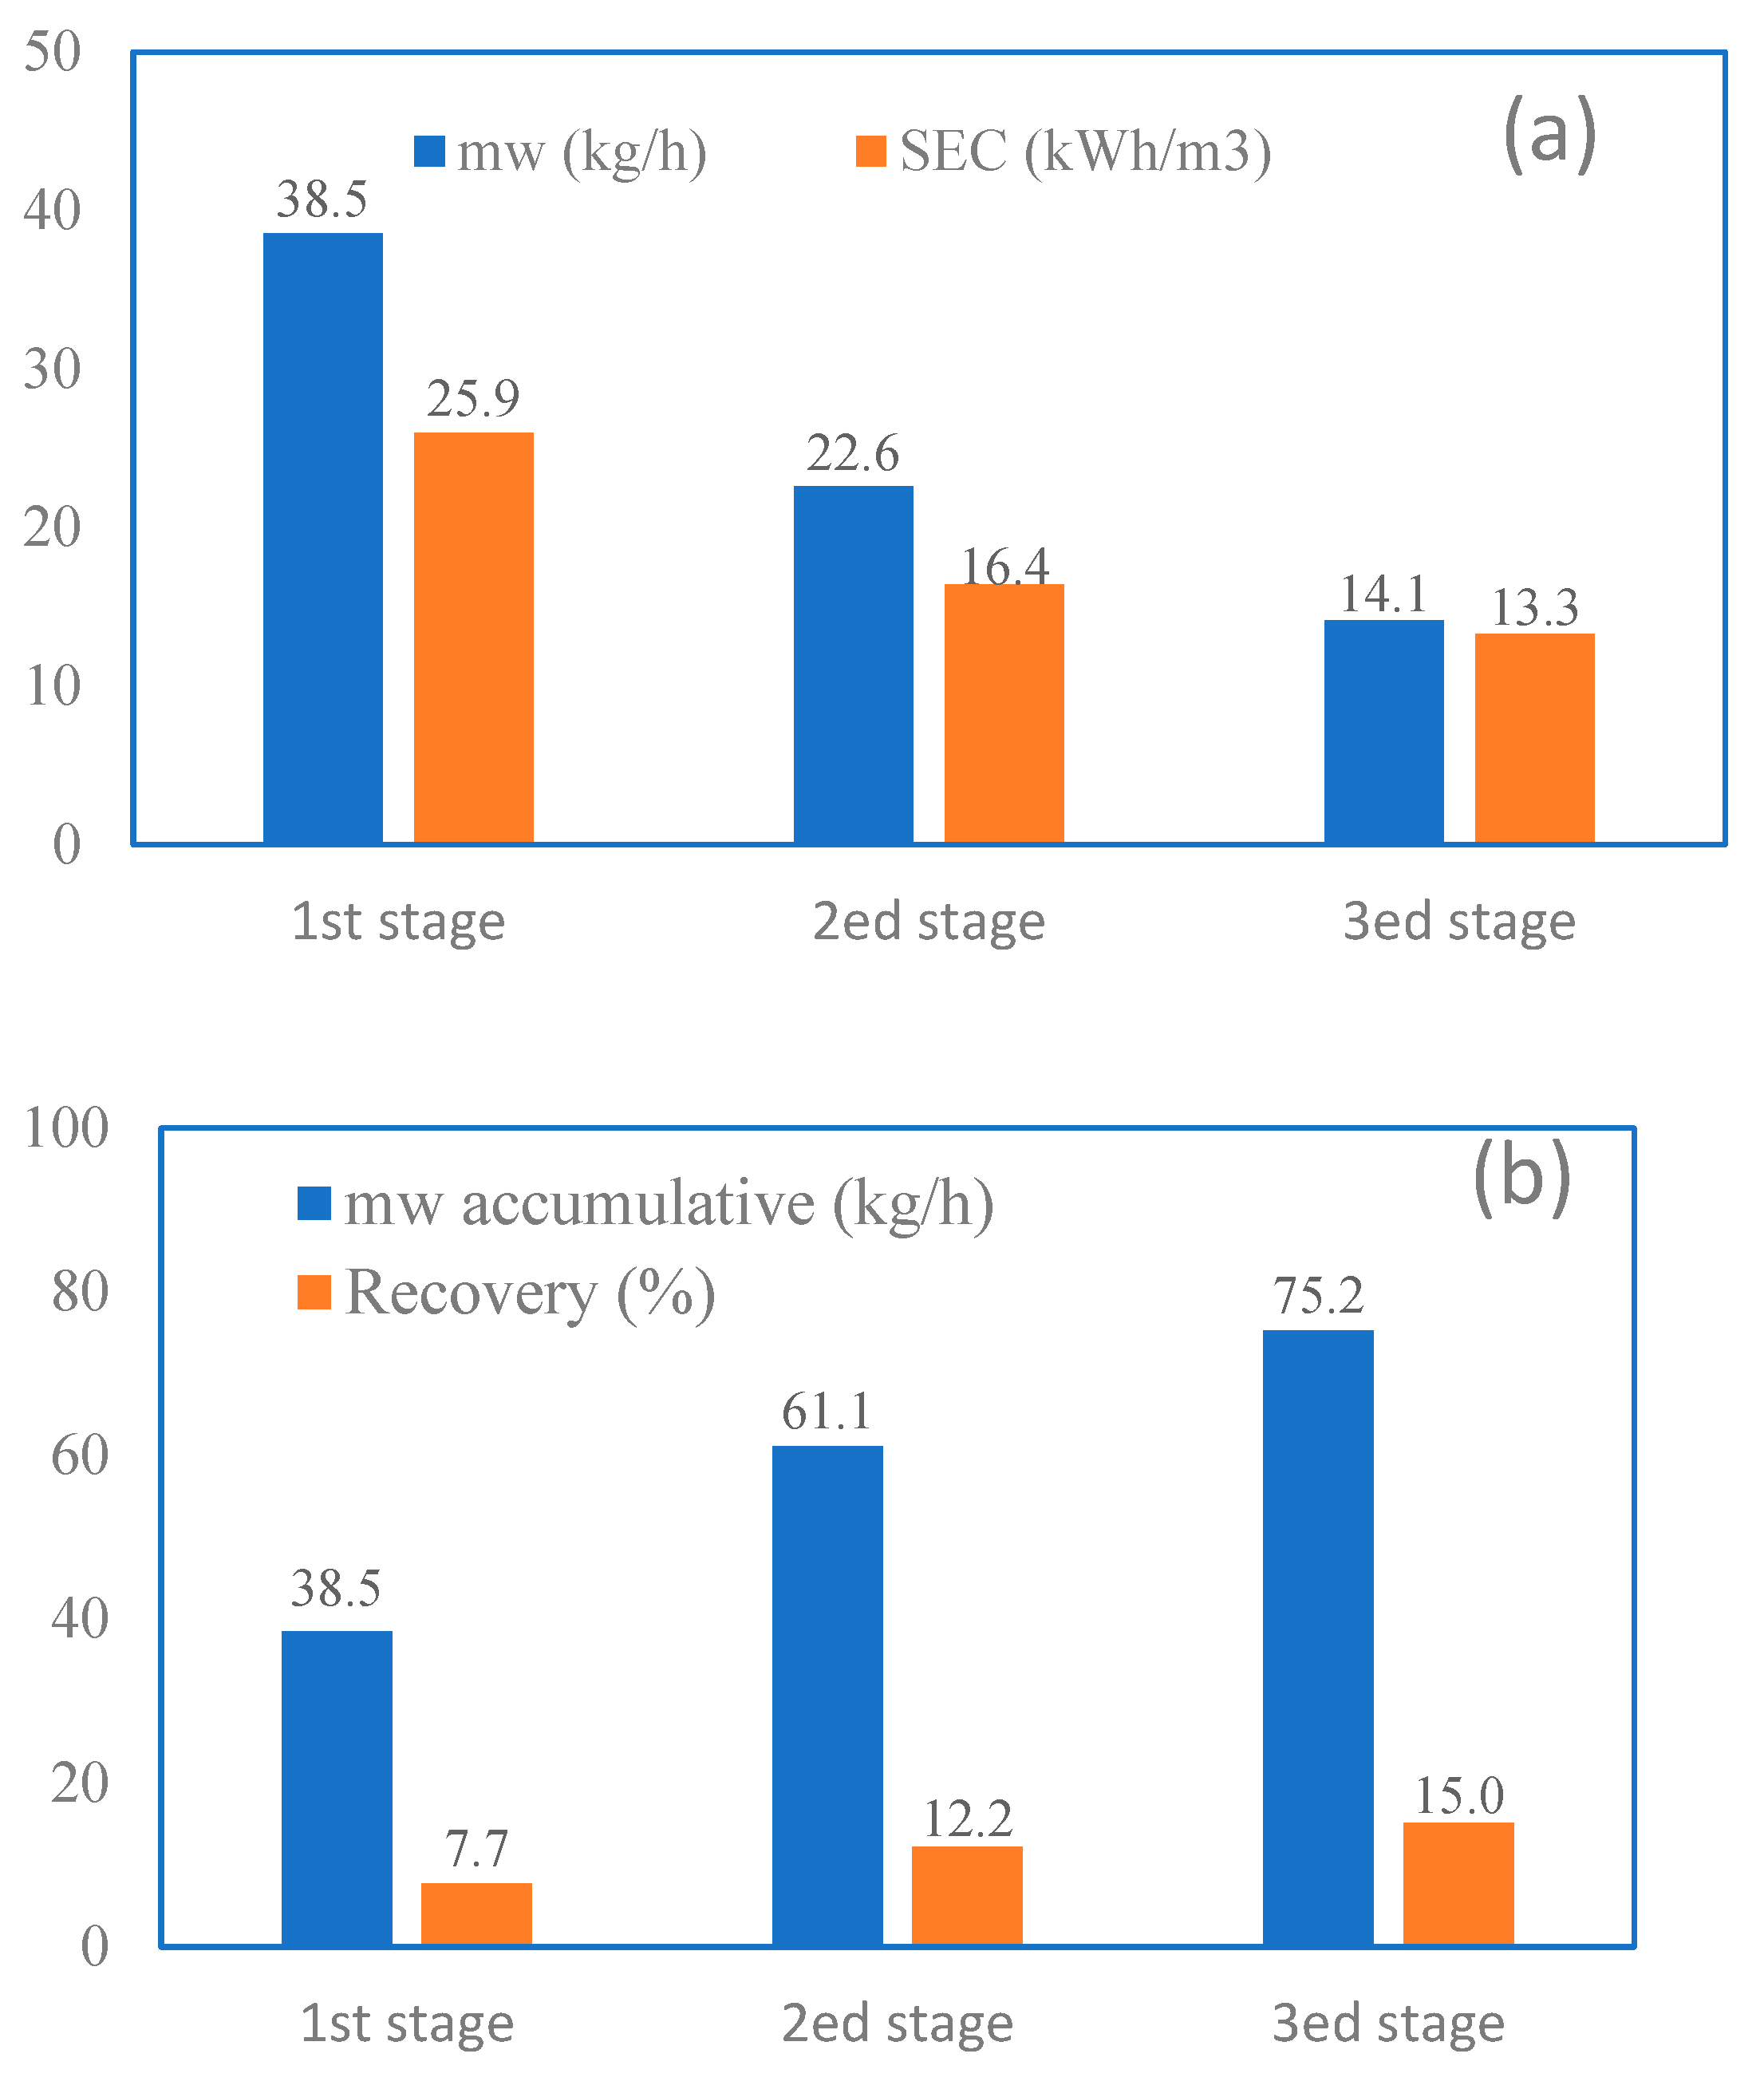
3.6. Cascaded MD in Series

This section examines the capability of the vortex tube to power several MD units connected in series. One way to decrease specific energy consumption is by increasing the production rate. Fortunately, the hot and cold air departing the heat exchangers of the MD system is still at very high and low temperatures, respectively. This means they can still be used to power additional MD modules. By simple analysis, it is found that they can power up to two additional MD stages connected in series as shown in Figure 11. The figure shows only two stages, but a third stage can be connected in the same fashion. The three-stage MD system is simulated using the optimal conditions, in terms of maximum production, of P1 = 9 bar, Rg = 9, and y = 0.7. The result is shown in Figure 12. Figure 12a displays the production rate and normalized SEC stage-wise. Clearly, the distillate production rate decreases from stage to stage until it reaches 14.1 kg/h. The reduction in production is intuitive as the thermal energy of the hot and cold air depletes stage-wise. As a result, the driving force (temperature difference) depletes for each stage downwind. Generally, a wide temperature difference leads to a wide interface temperature difference which positively influences the vapor generation flux. Consequently, the reduction in the driving force causes less vapor flux. Similarly, the specific energy consumption reduces stage-wise. Note that the required energy consumption is fixed for fixed inlet air pressure because it refers to the compression work of the air. However, the specific energy will decrease with stages. This is because the energy consumption is normalized by the accumulative distillate production. The normalized energy consumption is reduced to 13.3 kWh/m3, which is equivalent to around 50% reduction from that for one-stage MD. Figure 12b depicts the accumulative production rate and the corresponding recovery ratio. The accumulative production rate starts at 38.5 kg/h and grows up to 75.2 kg/h due to the contribution of each stage. As a result, the recovery ratio starts from 7.7% and rises to 15%, which means it is almost doubled. The low recovery ratio is not related to the effectiveness of the vortex tube but rather to the inherited limitation of the MD system. The MD system is prone to a low recovery ratio per single pass [36,37,38]. It should be noted that the hot air and the cold air exit the last MD stage at 41 and 22 °C, respectively. These values are not sufficient to power additional MD modules and produce a worthy amount of distillate.

4. Conclusions

This work studies the feasibility of using vortex tubes to power the membrane distillation process. In this case, the vortex tube is used to supply the necessary heating and cooling energy to drive a typical MD unit. The vortex tube was able to power the MD system with sufficient energy using a high air-to-water mass rate ratio. The energy derived from the vortex tube can create a temperature difference of up to 70 °C between the generated hot and cold air. The cold air mass flow rate fraction was also found as an important parameter to balance between heating and cooling. However, values of the cold fraction less than 0.7 were found to operate the MD in cryogenic conditions; hence, these values should be avoided to prevent situations of water freezing inside the membrane. The study focused on proposing various configurations combining vortex tubes and MD devices. This includes a hybrid MD–vortex tube system with and without heat recovery and MD staging. A maximum distillate production of 38.5 kg/h was found when operating at a cold fraction of 0.7, air-to-water mass ratio of 9, and inlet air pressure of 9 bar. The maximum distillate production consumes a specific energy of 25.9 kWh/m3. Moreover, it is found that the air energy is sufficient to drive up to three MD stages in series. In this case, the maximum distillate production can approach 75.2 kg/h at a normalized specific energy consumption of 13.3 kWh/m3.

Author Contributions

Conceptualization, J.O.; Methodology, E.A. and J.O.; Software, E.A.; Validation, E.A.; Investigation, E.A.; Writing—original draft, E.A. and J.O.; Writing—review & editing, J.O. and E.A.; Visualization, J.O. All authors have read and agreed to the published version of the manuscript.

Funding

The authors extend their appreciation to the Deputyship for Research and Innovation, “Ministry of Education” in Saudi Arabia for funding this research (IFKSUOR3-369-1).

Data Availability Statement

Not applicable.

Conflicts of Interest

The authors declare no conflict of interest.

Nomenclature

AmdMD surface area, m2
CmPermeability coefficient, kg/m2sPa
C m k Knudsen mass flux coefficient, kg/m2sPa
C m d Molecular diffusion mass flux coefficient, kg/m2sPa
C m C Transition mass flux coefficient, kg/m2sPa
CpSpecific heat capacity, J/kg K
deCollision diameter of the water vapor and air, m2
hvLatent heat of vaporization for MD, J/kg
hf, hp, hmFeed, permeate, and membrane heat transfer coefficient, W/m2 K
JwMass flux, kg/m2 h
kBBoltzmann constant
kmMembrane conductivity, W/m K
ksSolid phase thermal conductivity, W/m.K
kgGas phase thermal conductivity, W/m.K
knKnudsen number
lChannel height, m
m g Air mass rate, kg/h
m g h Hot air mass rate, kg/h
m h i n ,   m h o u t Inlet and outlet MD feed flow rate, kg/h
m c i n ,   m c o u t Inlet and outlet MD permeate flow rate, kg/s.
m g c Cold air rate, kg/s
m w Distillate mass rate for MD, kg/s
MwMolecular weight
NuNusselt number
P1, P2Vapor pressure at feed and permeate membrane surface, Pa
PAverage membrane interface pressure, Pa
PaEntrapped air pressure, Pa
PDMembrane pressure multiplied by diffusivity, Pa.m2/s
PrPrandtl number
P 1 Inlet air pressure, bar
P d Vapor pressure at T d , Pa
rMembrane pore size, m
RIdeal gas constant, also flow rate ratio
RcRecovery ratio
ReReynolds number
RgAir-to-water mass ratio
SECSpecific energy consumption, kWh/m3
Tgh, TgcAir hot and cold temperature, K
Thb, TcbFeed (hot) and permeate (cold) bulk temperature, K
Thm, TcmFeed and permeate membrane temperature, K
T h i n ,   T h o u t Inlet and outlet MD feed temperature, °C
T c i n ,   T c o u t Inlet and outlet permeate (cold) temperature, °C
T h r Feed temperature leaving heat recovery, °C
T c r Permeate temperature leaving heat recovery, °C
TThe average temperature at the membrane interface, K
T f Intake temperature, °C
T1Air inlet temperature, K
UOverall heat transfer coefficient, W/m2K
X f Feed, ppm
yCold air to inlet air mass ratio
Greek letters
τTortuosity
ρWater density, kg/m3
δMembrane thickness
εPorosity
λMean free path, m

References

  1. Abid, M.B.; Wahab, R.A.; Abdelsalam, M.; Gzara, L.; Moujdin, I.A. Desalination technologies, membrane distillation, and electrospinning, an overview. Heliyon 2023, 9, e12810. [Google Scholar] [CrossRef]
  2. Ravi, J.; Othman, M.H.D.; Matsuura, T.; Bilad, M.R.I.; El-Badawy, T.; Aziz, F.; Ismail, A.; Rahman, M.A.; Jaafar, J. Polymeric membranes for desalination using membrane distillation: A review. Desalination 2020, 490, 114530. [Google Scholar] [CrossRef]
  3. Stillwell, A.S.; Webber, M.E. Predicting the specific energy consumption of reverse osmosis desalination. Water 2016, 8, 601. [Google Scholar] [CrossRef]
  4. Gude, V.G. Energy storage for desalination processes powered by renewable energy and waste heat sources. Appl. Energy 2015, 137, 877–898. [Google Scholar] [CrossRef]
  5. Najib, A.; Orfi, J.; Ali, E.; Saleh, J. Thermodynamic analysis of a direct contact membrane distillation system with and without heat recovery based on experimental data. Desalination 2019, 466, 52–67. [Google Scholar] [CrossRef]
  6. Camacho, L.M.; Dumée, L.; Zhang, J.; Li, J.D.; Duke, M.; Gomez, J.; Gray, S. Advances in membrane distillation for water desalination and purification applications. Water 2013, 5, 94–196. [Google Scholar] [CrossRef]
  7. Nafey, A.; Fath, H.; Mabrouk, A. Thermo-economic investigation of multi effect evaporation (MEE) and hybrid multi effect evaporation—Multi stage flash (MEE-MSF) systems. Desalination 2006, 201, 241–254. [Google Scholar] [CrossRef]
  8. Farsi, A.; Dincer, I. Development and evaluation of an integrated MED/membrane desalination system. Desalination 2019, 463, 55–68. [Google Scholar] [CrossRef]
  9. Manesh, M.K.; Ghalami, H.; Amidpour, M.; Hamedi, M. Optimal coupling of site utility steam network with MED-RO desalination through total site analysis and exergoeconomic optimization. Desalination 2013, 316, 42–52. [Google Scholar] [CrossRef]
  10. Son, H.S.; Shahzad, M.W.; Ghaffour, N.; Ng, K.C. Pilot studies on synergetic impacts of energy utilization in hybrid desalination system: Multi-effect distillation and adsorption cycle (MED-AD). Desalination 2020, 477, 114266. [Google Scholar] [CrossRef]
  11. Goosen, M.F.; Mahmoudi, H.; Ghaffour, N. Today’s and future challenges in applications of renewable energy technologies for desalination. Crit. Rev. Environ. Sci. Technol. 2014, 44, 929–999. [Google Scholar] [CrossRef]
  12. Abdelkareem, M.A.; Assad, M.; Sayed, E.T.; Soudan, B. Recent progress in the use of renewable energy sources to power water desalination plants. Desalination 2018, 435, 97–113. [Google Scholar]
  13. Alkaisi, A.; Mossad, R.; Sharifian-Barforoush, A. A review of the water desalination systems integrated with renewable energy. Energy Procedia 2017, 110, 268–274. [Google Scholar] [CrossRef]
  14. Lawal, D.U.; Khalifa, A.E. Flux prediction in direct contact membrane distillation. Int. J. Mater. Mech. Manuf. 2014, 2, 302–308. [Google Scholar] [CrossRef]
  15. Alkhudhiri, A.; Darwish, N.; Hilal, N. Membrane distillation: A comprehensive review. Desalination 2012, 287, 2–18. [Google Scholar] [CrossRef]
  16. Zhang, Z.; Lokare, O.R.; Gusa, A.V.; Vidic, R.D. Pretreatment of brackish water reverse osmosis (BWRO) concentrate to enhance water recovery in inland desalination plants by direct contact membrane distillation (DCMD). Desalination 2021, 508, 115050. [Google Scholar] [CrossRef]
  17. Panagopoulos, A.; Haralambous, K.-J. Minimal Liquid Discharge (MLD) and Zero Liquid Discharge (ZLD) strategies for wastewater management and resource recovery–Analysis, challenges and prospects. J. Environ. Chem. Eng. 2020, 8, 104418. [Google Scholar] [CrossRef]
  18. Guan, G.; Yang, X.; Wang, R.; Fane, A.G. Evaluation of heat utilization in membrane distillation desalination system integrated with heat recovery. Desalination 2015, 366, 80–93. [Google Scholar] [CrossRef]
  19. Lokare, O.R.; Tavakkoli, S.; Khanna, V.; Vidic, R.D. Importance of feed recirculation for the overall energy consumption in membrane distillation systems. Desalination 2018, 428, 250–254. [Google Scholar] [CrossRef]
  20. Geng, H.; Wang, J.; Zhang, C.; Li, P.; Chang, H. High water recovery of RO brine using multi-stage air gap membrane distillation. Desalination 2015, 355, 178–185. [Google Scholar] [CrossRef]
  21. Lienhard, J.H.; Antar, M.A.; Bilton, A.; Blanco, J.; Zaragoza, G. Solar desalination. Annu. Rev. Heat Transf. 2012, 15, 277–347. [Google Scholar]
  22. Shannak, B.A. Temperature separation and friction losses in vortex tube. Heat Mass Transf. 2004, 40, 779–785. [Google Scholar] [CrossRef]
  23. Nollau, A.; Gerling, D. A new cooling approach for traction motors in hybrid drives. In Proceedings of the 2013 International Electric Machines & Drives Conference, Chigaco, IL, USA, 12–15 May 2013; pp. 456–461. [Google Scholar]
  24. Ahlborn, B.; Keller, J.; Rebhan, E. The heat pump in a vortex tube. J. Non-Equilib. Thermodyn. 1998, 23, 159–165. [Google Scholar] [CrossRef]
  25. Khodorkov, I.; Poshernev, N.; Zhidkov, M. The vortex tube—A universal device for heating, cooling, cleaning, and drying gases and separating gas mixtures. Chem. Pet. Eng. 2003, 39, 409–415. [Google Scholar] [CrossRef]
  26. Balepin, V.; Rosholt, D. Progress in air separation with the vortex tube. In Proceedings of the 9th International Space Planes and Hypersonic Systems and Technolgies Conference, Norfolk, VA, USA, 1–4 November 1999. [Google Scholar]
  27. Ebmeier, R.; Whitney, S.; Alugupally, S.; Nelson, M.; Padhye, N.; Gogos, G.; Viljoen, H. Ranque–Hilsch vortex tube thermocycler for fast DNA amplification and real time optical detection. Rev. Sci. Instrum. 2004, 75, 5356–5359. [Google Scholar] [CrossRef]
  28. Aljuwayhel, N.; Nellis, G.; Klein, S. Parametric and internal study of the vortex tube using a CFD model. Int. J. Refrig. 2005, 28, 442–450. [Google Scholar] [CrossRef]
  29. Ali, E.; Orfi, J. An experimentally calibrated model for heat and mass transfer in full-scale direct contact membrane distillation. Desalin. Water Treat. 2018, 116, 1–18. [Google Scholar] [CrossRef]
  30. Orfi, J.; Najib, A.; Ali Emad Ajbar, A.; Almatrafi, M.; Boumaza, M.; Alhumaizi, K. Membrane distillation and reverse osmosis based desalination driven by geothermal energy sources. Desalin. Water Treat. 2017, 76, 40–52. [Google Scholar] [CrossRef]
  31. Najib, A.; Orfi, J.; Ali, E.; Ajbar, A.; Boumaaza, M.; Alhumaizi, K. Performance analysis of cascaded membrane distillation arrangements for desalination of brackish water. Desalin. Water Treat. 2017, 76, 19–29. [Google Scholar] [CrossRef]
  32. Nakoa, K.; Date, A.; Akbarzadeh, A. A research on water desalination using membrane distillation. Desalin. Water Treat. 2015, 56, 2618–2630. [Google Scholar] [CrossRef]
  33. Fard, A.K.; Manawi, Y.M.; Rhadfi, T.; Mahmoud, K.A.; Khraisheh, M.; Benyahia, F. Synoptic analysis of direct contact membrane distillation performance in Qatar: A case study. Desalination 2015, 360, 97–107. [Google Scholar] [CrossRef]
  34. Winter, D.; Koschikowski, J.; Wieghaus, M. Desalination using membrane distillation: Experimental studies on full scale spiral wound modules. J. Membr. Sci. 2011, 375, 104–112. [Google Scholar] [CrossRef]
  35. He, F.; Gilron, J.; Sirkar, K.K. High water recovery in direct contact membrane distillation using a series of cascades. Desalination 2013, 323, 48–54. [Google Scholar] [CrossRef]
  36. Summers, E.K.; Arafat, H.A. Energy efficiency comparison of single-stage membrane distillation (MD) desalination cycles in different configurations. Desalination 2012, 290, 54–66. [Google Scholar] [CrossRef]
  37. Ali, A.; Tsai, J.-H.; Tung, K.-L.; Drioli, E.; Macedonio, F. Designing and optimization of continuous direct contact membrane distillation process. Desalination 2018, 426, 97–107. [Google Scholar] [CrossRef]
  38. Swaminathan, J.; Chung, H.W.; Warsinger, D.M. Simple method for balancing direct contact membrane distillation. Desalination 2016, 383, 53–59. [Google Scholar] [CrossRef]
Figure 1. Schematic of the vortex tube device.
Water 15 03767 g001
Figure 2. MD Module supported by vortex tube.
Water 15 03767 g002
Figure 3. MD with heat recovery integrated with vortex tube.
Water 15 03767 g003
Figure 4. Temperature of hot and cold air over a range of cold air ratios and inlet air pressures at a fixed air temperature of 298 K.
Water 15 03767 g004
Figure 5. Vortex tube and heat exchanger network.
Water 15 03767 g005
Figure 6. VAir and water temperature as a function of air-to-water mass ratio at fixed cold air mass ratio of 0.7, inlet air pressure of 9 bar, and inlet air temperature of 298 K.
Water 15 03767 g006
Figure 7. Performance variation of MD powered by vortex tube as function of the cold air mass ratio y for T1 = 298 K, P1 = 9 bar, and different values of air–water mass flow rate, Rg (Rg = 3, 6 and 9) ((a) feed and permeate temperatures and (b) Distillate).
Water 15 03767 g007
Figure 8. Performance variation of MD with heat recovery powered by vortex tube as function of the cold air mass ratio y for T1 = 298 K, P1 = 9 bar for different values of air–water mass flow rate ratio, Rg (Rg = 3, 6 and 9) ((a) Feed and permeate temperatures and (b) Distillate).
Water 15 03767 g008
Figure 9. Distillate production at fixed cold mass fraction of 0.7 and operating pressures of 3.5 and 9 bar.
Water 15 03767 g009
Figure 10. Specific energy consumption at selected operating pressures of 3.5 and 9 bar, a cold mass fraction of 0.7 and three values for the air-to-water mass ratio (Rg = 3, 6 and 9).
Water 15 03767 g010
Figure 11. Two stages of MD in series powered by vortex tube.
Water 15 03767 g011
Figure 12. Performance of 3 stages of MD in series powered by vortex tube, P1 = 9 bar, T1 = 298 K, y = 0.7; (a) production rate and SEC, (b) accumulative production rate and recovery ratio.
Water 15 03767 g012
Table 1. Membrane characteristics.
ParameterValue
Effective surface area10 m2
Membrane thickness230 mm
Channel length14 m
Channel height0.7 m
Pore diameter0.2 mm
Channel gap0.2 mm
Porosity0.8
Entry pressure4.1 bar
Disclaimer/Publisher’s Note: The statements, opinions and data contained in all publications are solely those of the individual author(s) and contributor(s) and not of MDPI and/or the editor(s). MDPI and/or the editor(s) disclaim responsibility for any injury to people or property resulting from any ideas, methods, instructions or products referred to in the content.

