Article

An Analysis of Rainfall Characteristics and Rainfall Flood Relationships in Cities along the Yangtze River Based on Machine Learning: A Case Study of Luzhou

1
State Key Laboratory of Simulation and Regulation of Water Cycle in River Basin, China Institute of Water Resources and Hydropower Research, Beijing 100038, China
2
Key Laboratory of River Basin Digital Twinning of Ministry of Water Resources, Beijing 100038, China
3
Key Laboratory of Water Safety for Beijing-Tianjin-Hebei Region of Ministry of Water Resources, Beijing 100038, China
4
China Academy of Urban Planning and Design, Beijing 100044, China
5
College of Water Sciences, Beijing Normal University, Beijing 100875, China
6
The Yi-Shu-Si River Basin Administration, H.R.C, Xuzhou 221018, China
*
Author to whom correspondence should be addressed.
Water 2023, 15(21), 3755; https://doi.org/10.3390/w15213755
Submission received: 6 October 2023 / Accepted: 23 October 2023 / Published: 27 October 2023

Abstract

:
Cities along rivers are threatened by floods and waterlogging, and the relationship between rainstorms and floods is complex. The temporal and spatial distributions of rainstorms directly affect flood characteristics. The location of the rainstorm center determines the flood peaks, volumes, and processes. In this study, machine learning algorithms were introduced to analyze the rain–flood relationship in Luzhou City, Sichuan Province, China. The spatial and temporal patterns of rainstorms in the region were classified and extracted, and flood characteristics generated by various types of rainstorms were analyzed. In the first type, the center of the rainstorm was in the upper reaches of the Tuojiang River, and the resulting flood caused negligible damage to Luzhou. In the second type, the center of the rainstorm occurred in the Yangtze River Basin. Continuously high water levels in the Yangtze River, combined with local rainfall, supported urban drainage. In the third type, the rainstorm center occurred in the upper reaches of the Yangtze and Tuojiang rivers. During the flooding, rainfall from Yangtze River and Tuojiang River moved towards Luzhou together. The movement of the rainstorm center was consistent with the flood routing direction of the Yangtze and Tuojiang rivers, both of which continued to have high water levels. The flood risk is extremely high in this case, making it the riskiest rainfall process requiring prevention.

1. Introduction

Anticipating and predicting flood risks in advance is an urgent issue in urban flood risk management [1,2]. However, the environmental effects of the large-scale expansion of artificial surfaces are becoming more prominent [3,4]. The rapid expansion of urban construction land has transformed outer rivers into inner rivers, reducing storage space, increasing impermeable areas, and exacerbating urban waterlogging [5]. Urban flood disasters are increasing annually. Consequently, there is a higher demand for flood control and drainage systems in cities to defend against these disasters [6].
Riverfront cities are defined as cities that are either intersected by or located along rivers. These cities are susceptible to both floods and waterlogging, and the relationship between heavy rainfall and floods is complex [7]. Flooding and waterlogging in riverfront cities interact with and constrain each other. When rivers experience a surge in floodwaters, the high water levels make it difficult for the waterlogging to dissipate. Flood levels serve as important boundary conditions that directly affect a city’s flood and drainage situations [8,9]. If heavy peak-season rainfall is combined with high river levels, the risk of severe flood disasters in the city increases. The strong drainage capacity of urban areas increases the pressure on river channels to accommodate floods, leading to a higher risk. Riverfront cities in China are characterized by a high population density, large industrial scale, and rapid economic development. As the economy grows, these cities have experienced significant expansion. Therefore, it is crucial to address the main issue of enhancing a city’s flood control and drainage capabilities while simultaneously defending against floods and waterlogging. This requires studying the characteristics and patterns of rainfall and floods that affect urban areas, summarizing the characteristics of rainfall and floods in specific regions, and implementing integrated flood management at the basin, regional, and urban level.
Flooding is primarily affected by the spatiotemporal characteristics of heavy rainfall. The amount, intensity, and spatiotemporal distribution of a rainfall center are clearly correlated with flood disasters on the underlying surface [10,11]. The direction of movement of the heavy rainfall center directly affects the shape of the flood process and the change in peak flow rate [12,13]. During the confluence period, when the average rainfall and intensity are the same, the peak of the rainstorm in the middle or rear reaches can be more than 30% larger than that of the uniform rainfall type [14]. Extracting and summarizing the spatiotemporal characteristics of rainfall refinement, and fully understanding the spatiotemporal variation laws of heavy rainfall and the corresponding flood characteristics are of great significance for improving the level of urban flood risk management [15].
Traditional research on the spatiotemporal distribution of heavy rainfall has focused primarily on single stations. Pilgrim and Cordery summarized the time and position with the highest probability of rainfall peaks [16]. Keifer and Chu analyzed the intensity–duration–frequency relationship of rainfall and concluded that rainfall for any duration is equal to the design rainfall [17]. Huff studied heavy rainfall in Illinois, USA, and divided the entire rainfall duration into four parts, summarizing the four periods with the highest probability of peak rainfall during the rainfall process [18]. Although these results on rainfall characteristics for single stations have been widely applied, they do not reflect the comprehensive characteristics of dynamic changes in rainfall processes in time and space.
Over the past decade, machine learning technology has been increasingly applied, owing to its data-driven approach [19]. It has been used to identify early disaster risks, manage urban floods, and achieve initial results in other areas. Barzegar [20] improved the accuracy of forecasts (up to three months) for Lake Michigan and Lake Ontario WLs by coupling boundary-corrected (BC) maximal overlap discrete wavelet transform (MODWT) data preprocessing with a hybrid convolutional neural network (CNN) long–short term memory (LSTM) deep learning (DL) model. Prodhan [21] observed that MLMs have achieved significant advances in the robustness, effectiveness, and accuracy of the algorithms for drought modeling in recent years. Puttinaovarat [22] proposed a novel flood forecasting system based on fusing meteorological, hydrological, geospatial, and crowdsourced big data in an adaptive machine learning framework, which was able to forecast flood incidents happening in specific areas and time frames. Liu [23] proposed that the rapid prediction of urban flooding can be achieved by using AI technology with numerical simulation models. Amirreza [24] proposed a novel framework based on the stacking ensemble machine learning (SEML) method, which increased the WS modeling accuracy by >43%. Saeed Farzin [25] developed a model by employing data mining algorithms, including an artificial neural network (ANN), an adaptive neuro-fuzzy inference system (ANFIS), the M5 model tree, a least-square support vector machine (LSSVM) and a hybrid of the LSSVM and firefly optimization algorithm (FFA), the scatter interpolation method, and multicriteria decision making, namely, DID. This is presented for the modeling of drugs removal to estimate the drug removal value with good accuracy and without a high cost and several months of laboratory works. Mohammed [26] established four stand-alone and hybridized ML-based FSMs to apply to studies on machine learning (ML)-based flood susceptibility. BAO [27] build basin water and sediment collection simulation technologies, enabling the quantitative identification of basin water and sediment changes via coupling machine learning technology with hydrological models. This technology is widely used.
Current methods for studying rain patterns are based on single stations only and do not reflect the spatial and temporal variability of rainfall. The rainfall process is characterized by variations in time and space and is a multidimensional process of change. And the traditional analysis method cannot analyze the multidimensional characteristics. Machine learning techniques are suitable for application to multidimensional nonlinear change processes. Machine learning technology is an important part of AI technology. It has been developed rapidly in recent years, and has been successfully applied in various fields, such as computer vision, face recognition, and speech recognition.
In this paper, machine learning algorithms are introduced into spatiotemporal distribution feature extraction of rainfall, which solves the traditional problem of analyzing only single-station rainfall data and failing to realize rainfall spatiotemporal feature extraction. Among them, manifold learning is an important algorithm in machine learning, a practical data processing algorithm in the field of machine learning that has been successfully applied in feature classification and extraction [28]. This study introduces the isometric mapping (Isomap) algorithm for manifold learning to analyze rainstorm features using Luzhou City as a case to extract fine-grained features from high-resolution rainfall spatial data via dimensionality reduction, classification, and feature extraction. The corresponding flood features of different spatiotemporal rainfall features were analyzed to provide technical support for urban flood control and drainage planning.

2. Data and Methods

2.1. Data

Luzhou City is located southeast of Sichuan Province. The Yangtze River runs from west to east through the area, where it merges with Tuojiang. The region has abundant precipitation, with an average annual rainfall of 1161 mm; the temporal and spatial distributions of rainfall are uneven. Seventy percent of the rainfall occurs from May to September. Heavy rain usually begins in early May and ends in late September.
To objectively and comprehensively understand the temporal and spatial distribution characteristics of rainfall in Luzhou, we analyzed 1 h interval heavy rainfall data from 1998 to 2021 at several rainfall stations. These stations include Lizhuang and Jiang’an in the upstream Yangtze River in Luzhou, Hejiang downstream of Luzhou, Fushun on the Tuojiang River upstream of Luzhou, and Fuzhi on the Laixi River, a tributary of the Tuojiang River. The distribution of these stations is shown in Figure 1. The rainfall data used in this article are from these stations.
Before conducting the analysis, we first sorted the rainfall data, removed unreasonable data, and then divided the rainfall events. Rainfall with a continuous duration of less than 2 h and a rainfall amount of less than 0.1 mm was considered invalid. First, the rainfall events were divided according to this rule; strong rainfall processes with rainfall amounts of 30 mm or more in one hour or 50 mm or more in six hours were then selected as research samples. Based on the above criteria and processes, 134 strong rainfall processes were screened between 1998 and 2021 to form a research sample set.

2.2. Methods

This study focused on the Isomap algorithm to analyze the dimensionality reduction and feature extraction of rainfall sample data. The technical process is shown in Figure 2.

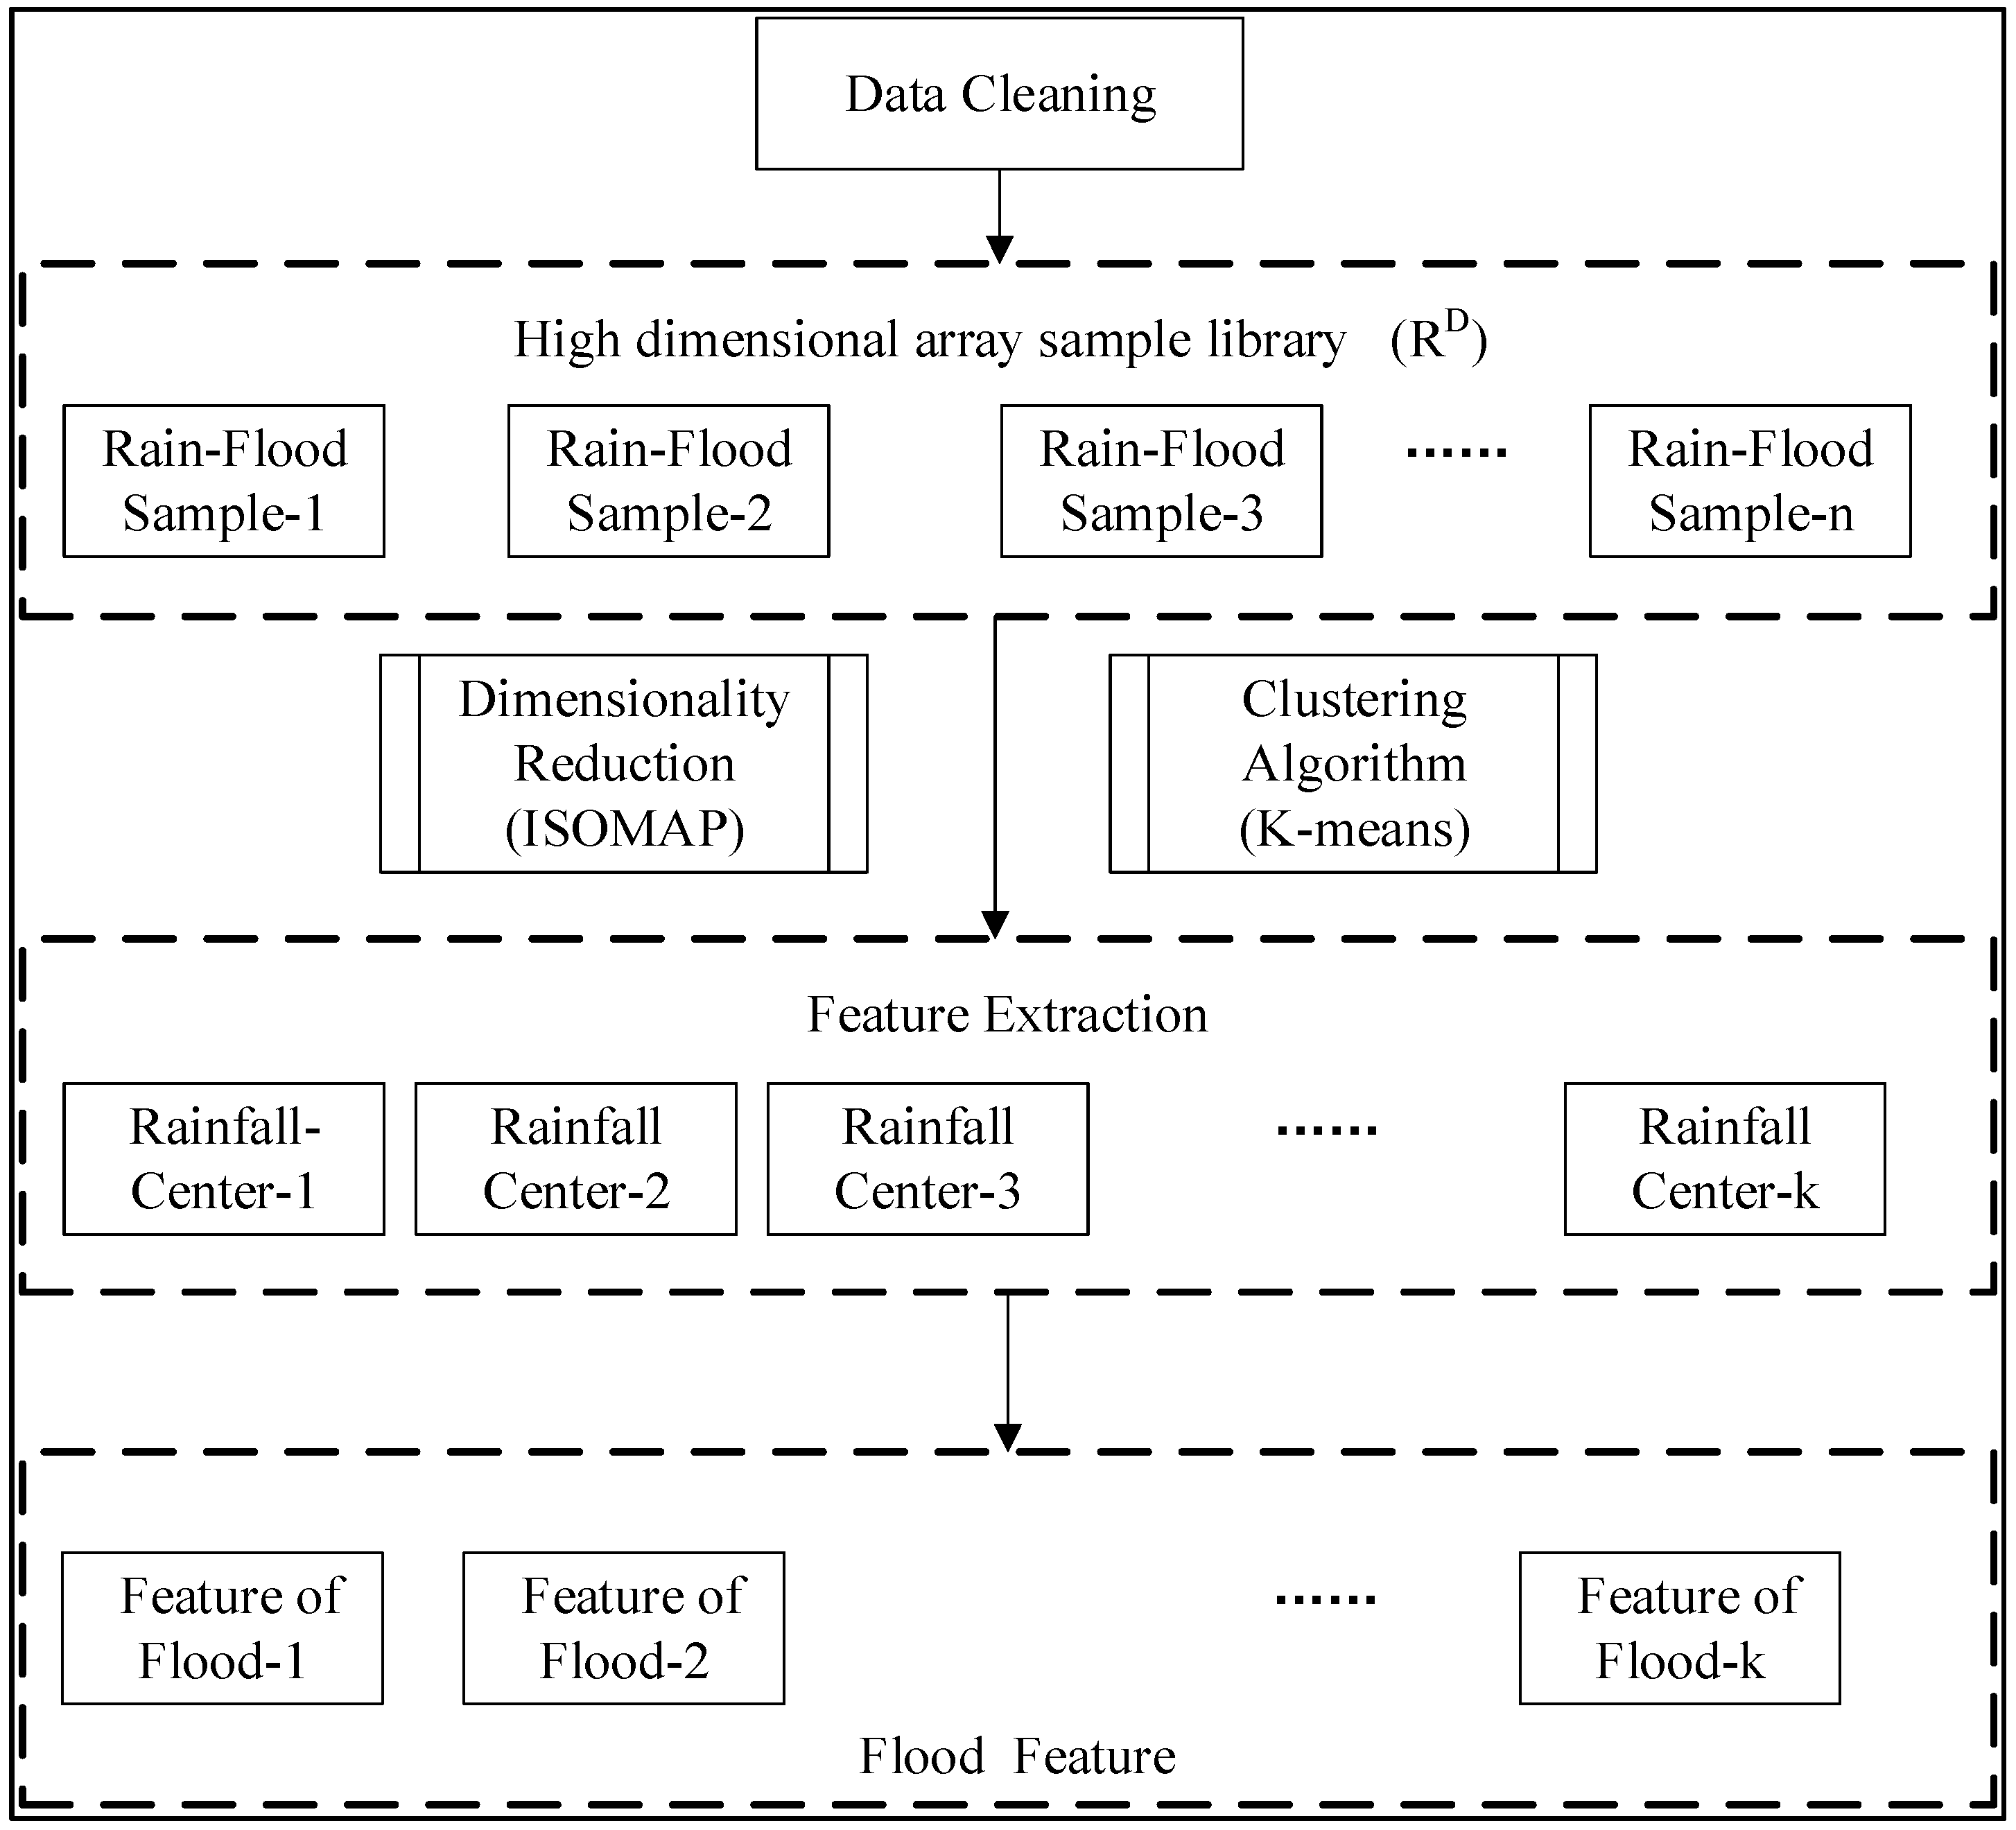
2.2.1. Construction of a Dynamic Characteristics Matrix for Space–Time Distribution of Heavy Rainfall

We established a sample set of rainfall processes, Ω , and obtained a mathematical description of the spatiotemporal dynamic development characteristics of multiple rainfall events as follows:
Ω = X 1 , X 2 , X N
where Ω is the historical sample set of heavy rain, N is the number of heavy rain events, and X j is the proportion matrix of the jth rainfall event,
X j = x 11 j x 21 j x s 1 j x 12 j x 22 j x s 2 j x 1 m j x 2 m j x s m j
in Equation (2), where x i t j is the percentage of precipitation at time t in the jth rainfall event for the ith rain gauge out of all of the precipitation at that time for all rain gauges
x i t j = R i t j / i = 1 s R i t j
where i ranges from 1 to s, t ranges from 1 to m, s is the number of rain gauges, and m is the number of time intervals; R i t j is the amount of rainfall at the i th rain gauge station at time t during the j th rainfall event; s is the total number of rain gauge stations; and m is the number of periods.

2.2.2. Dimensionality Reduction Analysis Based on the Isomap Algorithm

The Isomap algorithm is an unsupervised dimensional reduction method for nonlinear data [29,30]. This is a transformation of the multidimensional scaling (MDS) algorithm and reflects global information through local linearity in manifold learning algorithms. The overall idea is to map each sample from a high-dimensional space to a low-dimensional space while preserving the distance between samples. This allows “effective” features with a lower dimension to express the main features of the original data [28]. In this study, we used the Isomap algorithm for nonlinear dimensional reduction analysis of high-dimensional data.
For the original sample set in space Ω = x 1 , x 2 , x N , each sample, x i , contains the rainfall time and space dimension, D , of a component. In other words, sample x i ’s dimension is D (including x i R D , i = 1,2 , N ). The Isomap algorithm was then used to reduce the dimension to d ( d D ), forming a new sample set in a low-dimensional space, Ω = x 1 , x 2 , x N (where x i R d , d D ,   i = 1,2 , N ). In a low-dimensional space, the dimensions are reduced, but the number of samples remains N. The steps for the Isomap algorithm are as follows:
(1)
Build an adjacent graph, G , by defining input space X as any two samples of vectors x i and x j . Calculate the Euclidean distance between them as d i , j . Then, select the k-nearest points of sample x i as its neighbors. If two samples, x j and x i , have neighboring points, they are connected. The connection length is the Euclidean distance between them, d i , j . This operation is repeated on all points to obtain graph G.
(2)
In graph G, for any two sample vectors x i and x j , set the distance between them as d G i , j . Initialize d G i , j = d i , j if x i and x j are directly connected, otherwise set d G i , j = . Then, update d G i , j . For all samples k = 1 ,   2 ,   N in graph G, calculate the shortest path via d G = m i n d G i , j , d G i , k + d G i , k + 1 . After each iteration, we obtained the shortest path between the sample vectors as D G i , j = d G i , j .
(3)
Let B = D G T D G and solve the eigenvalue decomposition of matrix B
B = Φ Λ Φ T
where the feature vector corresponding to Λ = d i a g ( λ 1 , λ 2 , λ d ) is V = v 1 , v 2 , v d , and the feature vector corresponding to λ j is v j i . Subsequently, the p -th component of the d -dimensional embedding vector y j is equal to λ j v j p . Based on this, the sample set Ω = x 1 , x 2 , x N in the high-dimensional space R D is mapped to the low-dimensional space R d to represent Ω :
Ω = y 1 , y 2 , y 3 , y N d × N = λ 1 v 1 λ 2 v 2 λ 3 v 3 . . . λ d v d d × N

2.2.3. Dynamic Clustering Analysis

The dimensionality-reduced sample set was classified into r subsets, where the samples within each subset are similar, and the samples between subsets are different. Extract the features belonging to each class by calculating the centroid of each subset. This study primarily used dynamic clustering methods to classify samples after dimensionality reduction. The algorithm divides the overall sample sets into r subsets, where the samples within each subset are the most similar, and the samples between subsets are the most different.
During the analysis, we started by randomly selecting r sample points as the initial clustering centers for r subsets. The distance between all samples and these r initial clustering centers was calculated, and each sample was assigned to the subset with the closest center based on the distance. This automatically clustered all samples into subsets and allowed us to obtain the initial classification category numbers and initial subsets.
Next, the average of all samples in each subset was calculated to obtain a new generation of clustering centers. We calculated the distance between all samples and the new clustering center again, automatically clustered, obtained a new clustering center, and calculated the average of all samples in each subset; this process was repeated to compare the clustering centers and averages, Z j p + 1 , of each subset C = { C 1 , C 2 , , C r } in the p th generation and the p + 1 s t generation. If the difference between them was within an acceptable range, the calculations were considered converged. This allowed us to obtain the final subsets and clustering centers of each subset, which are the characteristics of the rainfall spatial distribution.

3. Results and Discussion

The above algorithms were used to analyze 134 heavy rain samples from 1998 to 2021. Based on this analysis, the spatiotemporal distribution of heavy precipitation in Luzhou could be classified into three types. Each type of rainfall has different spatiotemporal distribution characteristics, and the flood processes in the Changjiang and Tuojiang rivers also have their own features. To analyze the flood characteristics corresponding to each type of rainfall, we separately calculated the mean, highest, and lowest flood levels, i.e., H a v g ,   H m a x ,   a n d   H m i n , respectively, for each type of flood process:
H j a v g ¯ = i = 1 n H i j n
where j represents the number of flood events, n the number of periods of the j -th flood event, and H i j represents the water level at the i -th moment:
H j m a x = max H i j
H j m i n = min H i j
where j represents the number of flood events, n represents the number of periods in the j -th flood event, and H j m a x represents the maximum water level in the j -th flood event, i.e., the minimum water level in the j -th flood event, which expresses the magnitude of change in each flood event.
The following figures illustrate the characteristics of different types of rainfall and floods.
1. Type 1 rainfall begins in the upper reaches of the Tuo River and moves downstream to the city of Luzhou. It mainly occurs in the Tuo River Basin and affects the water level of the Tuo River but has a relatively small impact on the water level of the Yangtze River and poses a smaller threat to Luzhou. This type of rainfall occurs less frequently, with 22 occurrences from 1998 to 2021, accounting for 16.4% of the total sample, as shown in Figure 3.
Historically, rainfall on 1 May 2008, and 2 June 2014, followed this pattern. Figure 4, Figure 5, Figure 6 and Figure 7 display the actual rainfall and flood processes.
The high, mean, and maximum water levels were recorded for the floods caused by the rainfall events of Type I, as shown in Figure 7.
Figure 4, Figure 5, Figure 6 and Figure 7 demonstrate that the flood processes corresponding to the first typical rainfall event were mostly single-peaked. As the rainfall center was located in the Tuojiang River Basin, this type of rainfall mainly affected the flood level of the Tuojiang River. The water level of the Tuojiang River fluctuated between 1 and 2 m because of the rainfall; however, this had a negligible effect on the flood level of the Yangtze River. The Yangtze River did not have a significant supporting effect on the Tuojiang River during this type of rainfall; rainfall near Luzhou had a negligible effect on the flood level of the Yangtze River. The flood level of the Yangtze River remained stable, with only small fluctuations in the water level.
2. Type 2 rainfall occurred in the Yangtze River Basin. This type of rainfall was relatively concentrated, with heavy rainfall centered at stations such as Lizhuang and Luzhou. They occurred more frequently during the flood season; a total of 64 events were recorded from 1998 to 2021, accounting for 47.8% of the total sample size, as shown in Figure 8.
Historically, the spatiotemporal characteristics of rainfall on 4 September 2006, and 16 July 2012, fell into this category. Figure 9, Figure 10, Figure 11 and Figure 12 display the actual rainfall and flood processes.
Figure 9, Figure 10, Figure 11 and Figure 12 show that the flood processes corresponding to the second type of typical rainfall event are mostly single-peaked. As the rainfall center occurred in the Yangtze River Basin, the water level in the Yangtze River was high and persisted for a long time, significantly affecting the drainage of Luzhou City. The water level in the Tuo River was also affected by the water level in the Yangtze River; the trend of the water level change was consistent with that of the Yangtze River. The water level in the Tuo River fluctuated significantly, with an average range of change of approximately 4–8 m.
3. Type 3 rainfall had two heavy rain centers located upstream of the Tuojian and Yangtze rivers. The rainfall began upstream of the Tuojian River and was compounded by rainfall upstream of the Yangtze River moving towards Luzhou. The heavy rain center moved in the same direction as the floods in the Yangtze and Tuojian rivers, making it the most unfavorable type of rainfall. This type of rainfall occurred mostly during the main flood season from June to August in the Yangtze River Basin. From 1998 to 2021, there were 48 occurrences, accounting for 35.8% of the total number of samples, as shown in Figure 13.
The spatiotemporal characteristics of rainfall on 18 July 2013, and 21 May 2018, belong to this category. Figure 14, Figure 15, Figure 16 and Figure 17 depict the actual rainfall and flood processes.
Figure 14, Figure 15, Figure 16 and Figure 17 show that the flood process corresponding to the third type of rainfall process was a single-peak type. The rainfall process in the upper reaches of the Tuojian River overlapped with that in the upper reaches of the Yangtze River and moved towards Luzhou. The direction of movement of the rainstorm center was consistent with the flood evolution direction of the Yangtze and Tuojian rivers, which was the most unfavorable rainfall process.
In order to more clearly describe the characteristics of various types of rainfall and the corresponding flood characteristics, this paper describes the spatial and temporal characteristics of each type of rainfall and flood characteristics in the form of a table, as shown in Table 1.
The flood peak durations of the Yangtze and Tuojian rivers were relatively long, lasting approximately 48 h. The water level of the Tuojian River was significantly affected by the level of the Yangtze River flood and was superimposed by heavy local rainfall in the basin. The water level of the Tuojian River remained high for a long period during this type of rainfall. Both the Yangtze and Tuojian rivers continued to remain at a high level, representing an extremely high flood risk.

4. Conclusions

Riverside cities have complex flood relationships, in which external river floods directly affect flood control and drainage within the city. This study distinguishes itself from traditional research methods by introducing machine learning algorithms into the analysis of rainfall–flood relationships. Starting with the temporal and spatial distribution characteristics of rainfall in the region, the flood characteristics caused by different temporal and spatial rainfall characteristics were analyzed. The conclusions are as follows:
  • Traditional methods of analyzing rainfall characteristics focus on rainfall data or surface rainfall at a single station. However, rainfall processes are characterized by spatial and temporal variation. Traditional methods cannot objectively express rainfall variations in time and space. Machine learning technology can quantitatively describe the dynamic temporal and spatial distributions of various types of rainfall. This is consistent with the climatic characteristics of the region. By comparing the featured rainfall process with the typical actual rainfall process, we found that the temporal and spatial distribution characteristics of the two were similar, and that the featured rainfall process was sufficiently representative of the actual rainfall process. Machine learning techniques can be effectively applied in the study and extraction of rainfall’s spatiotemporal distribution features.
  • Rainfall in the Luzhou area can be divided into three types according to the different spatial and temporal distributions. And the flood characteristics formed by different types of rainfall are also different. When analyzing flood characteristics, it is necessary to study the spatial and temporal distribution characteristics of rainfall in the area in order to obtain objective and reasonable conclusions.
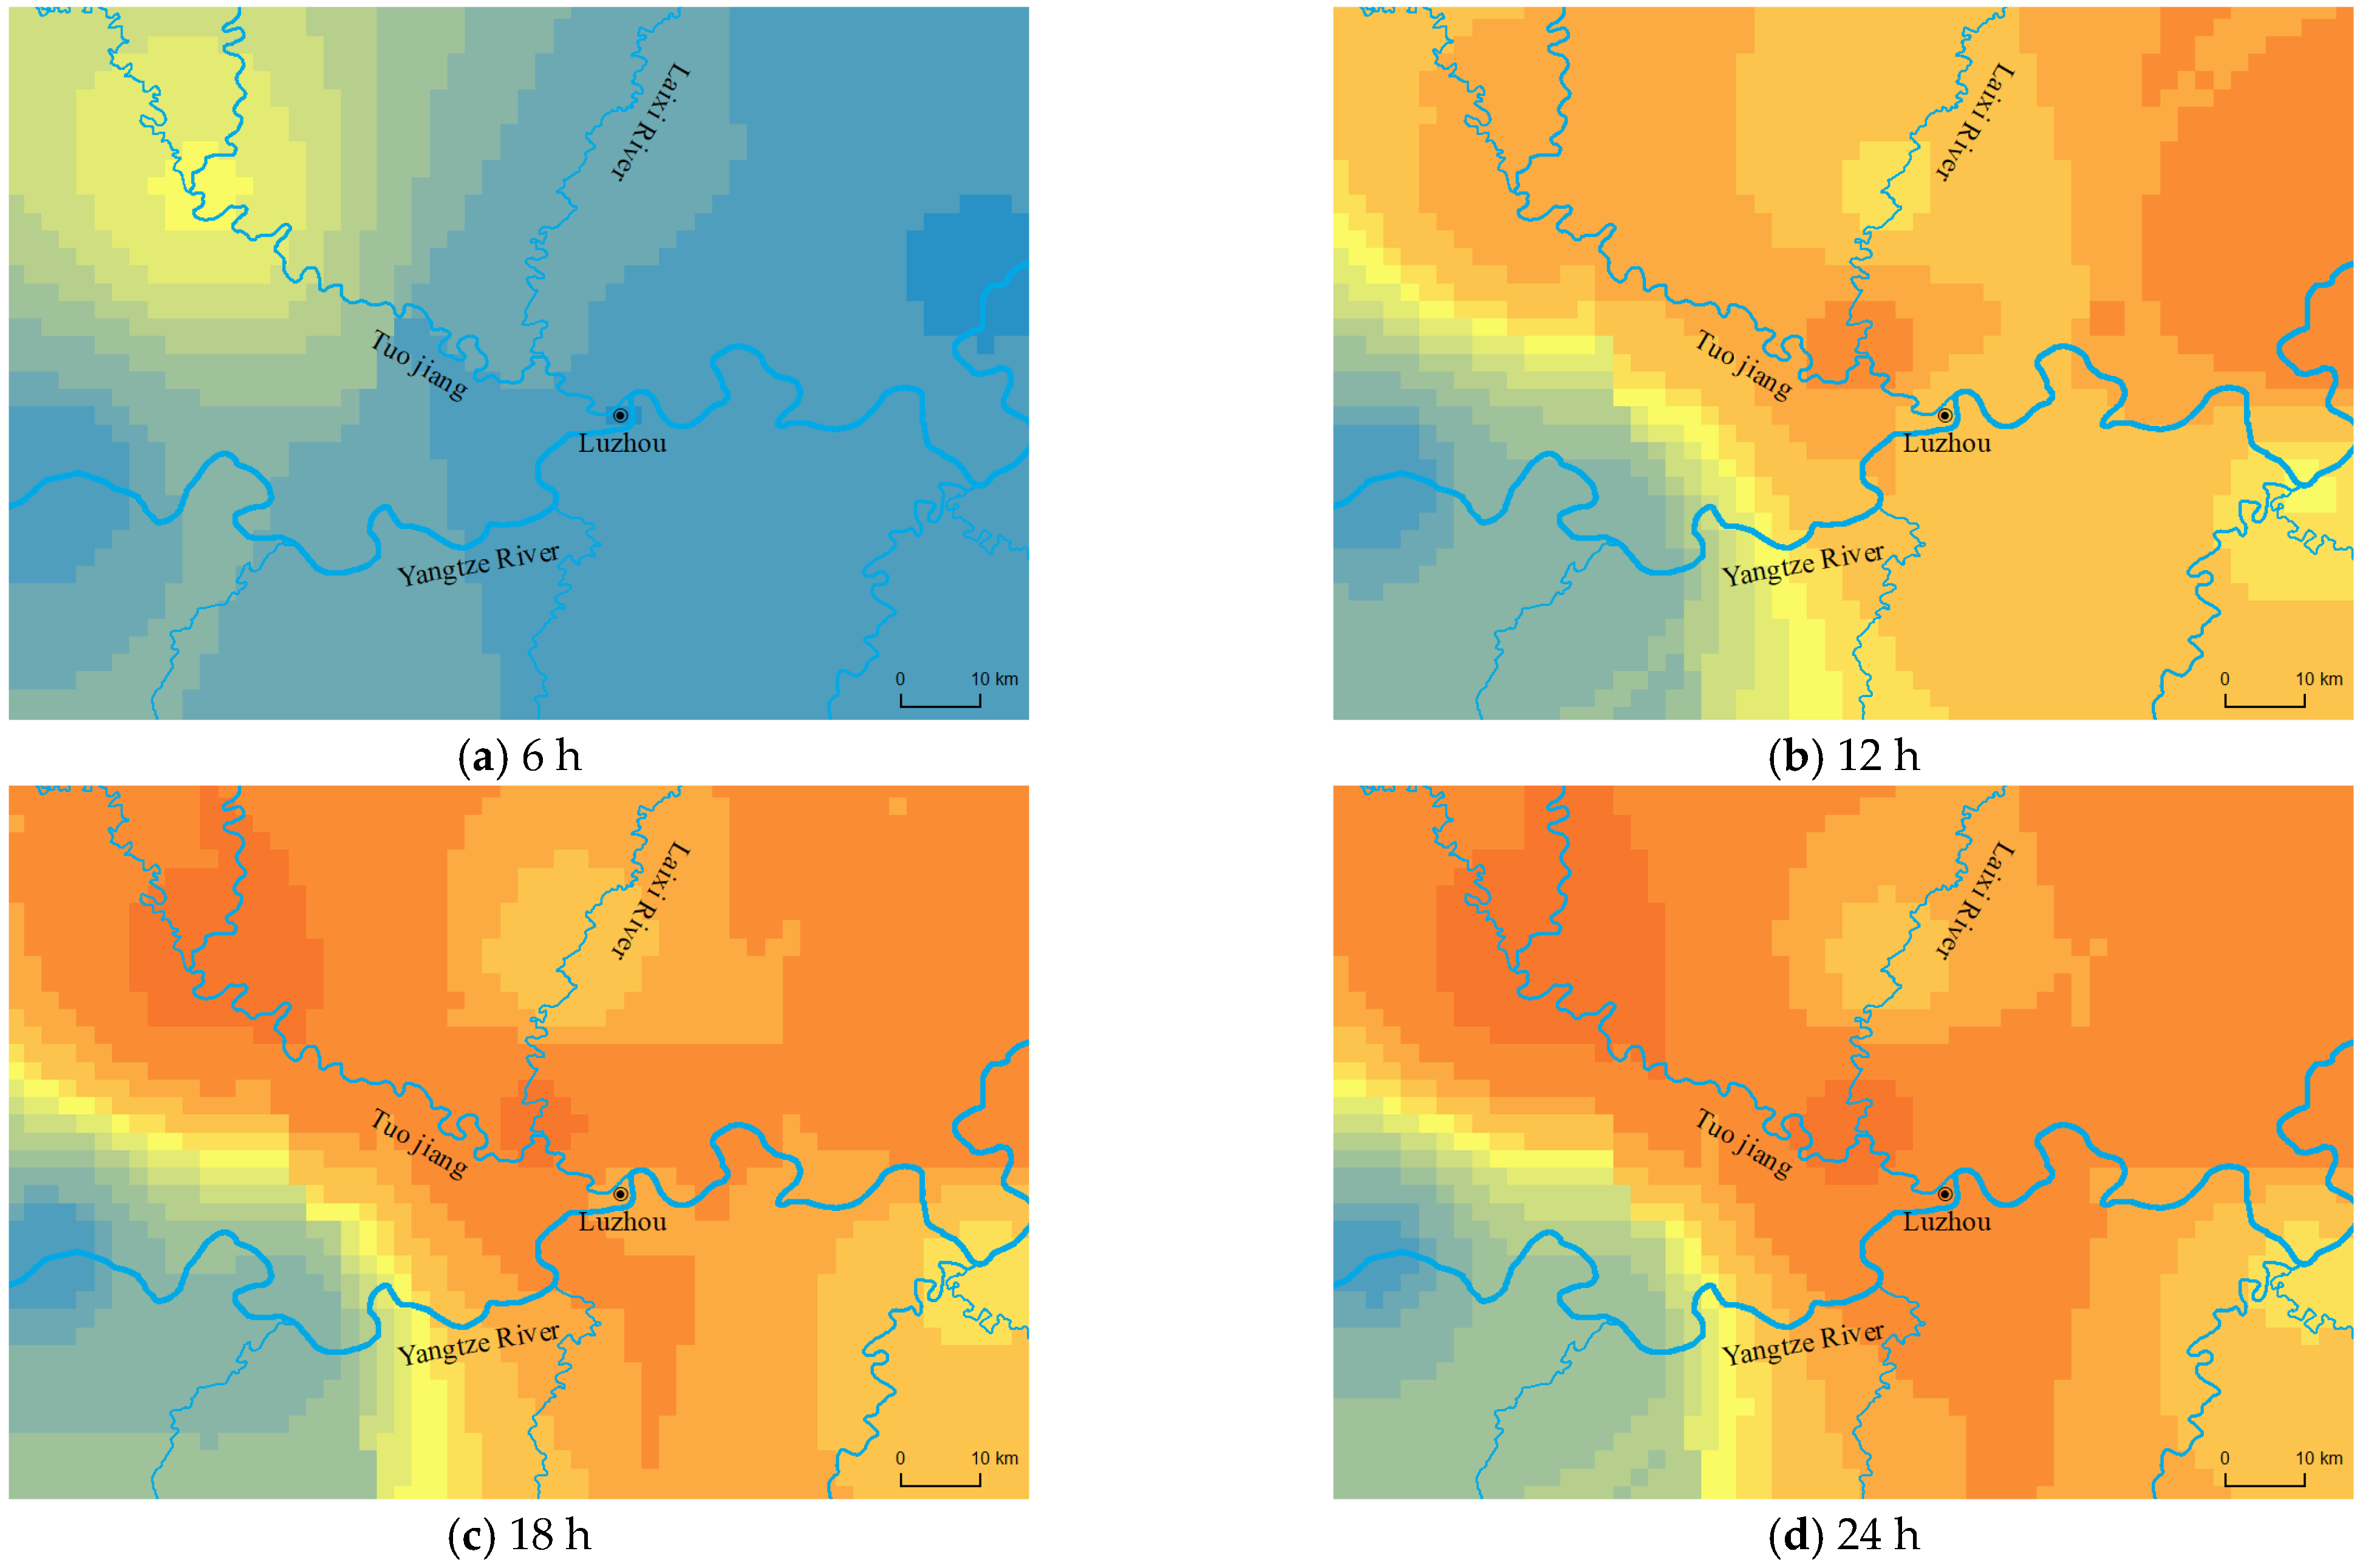
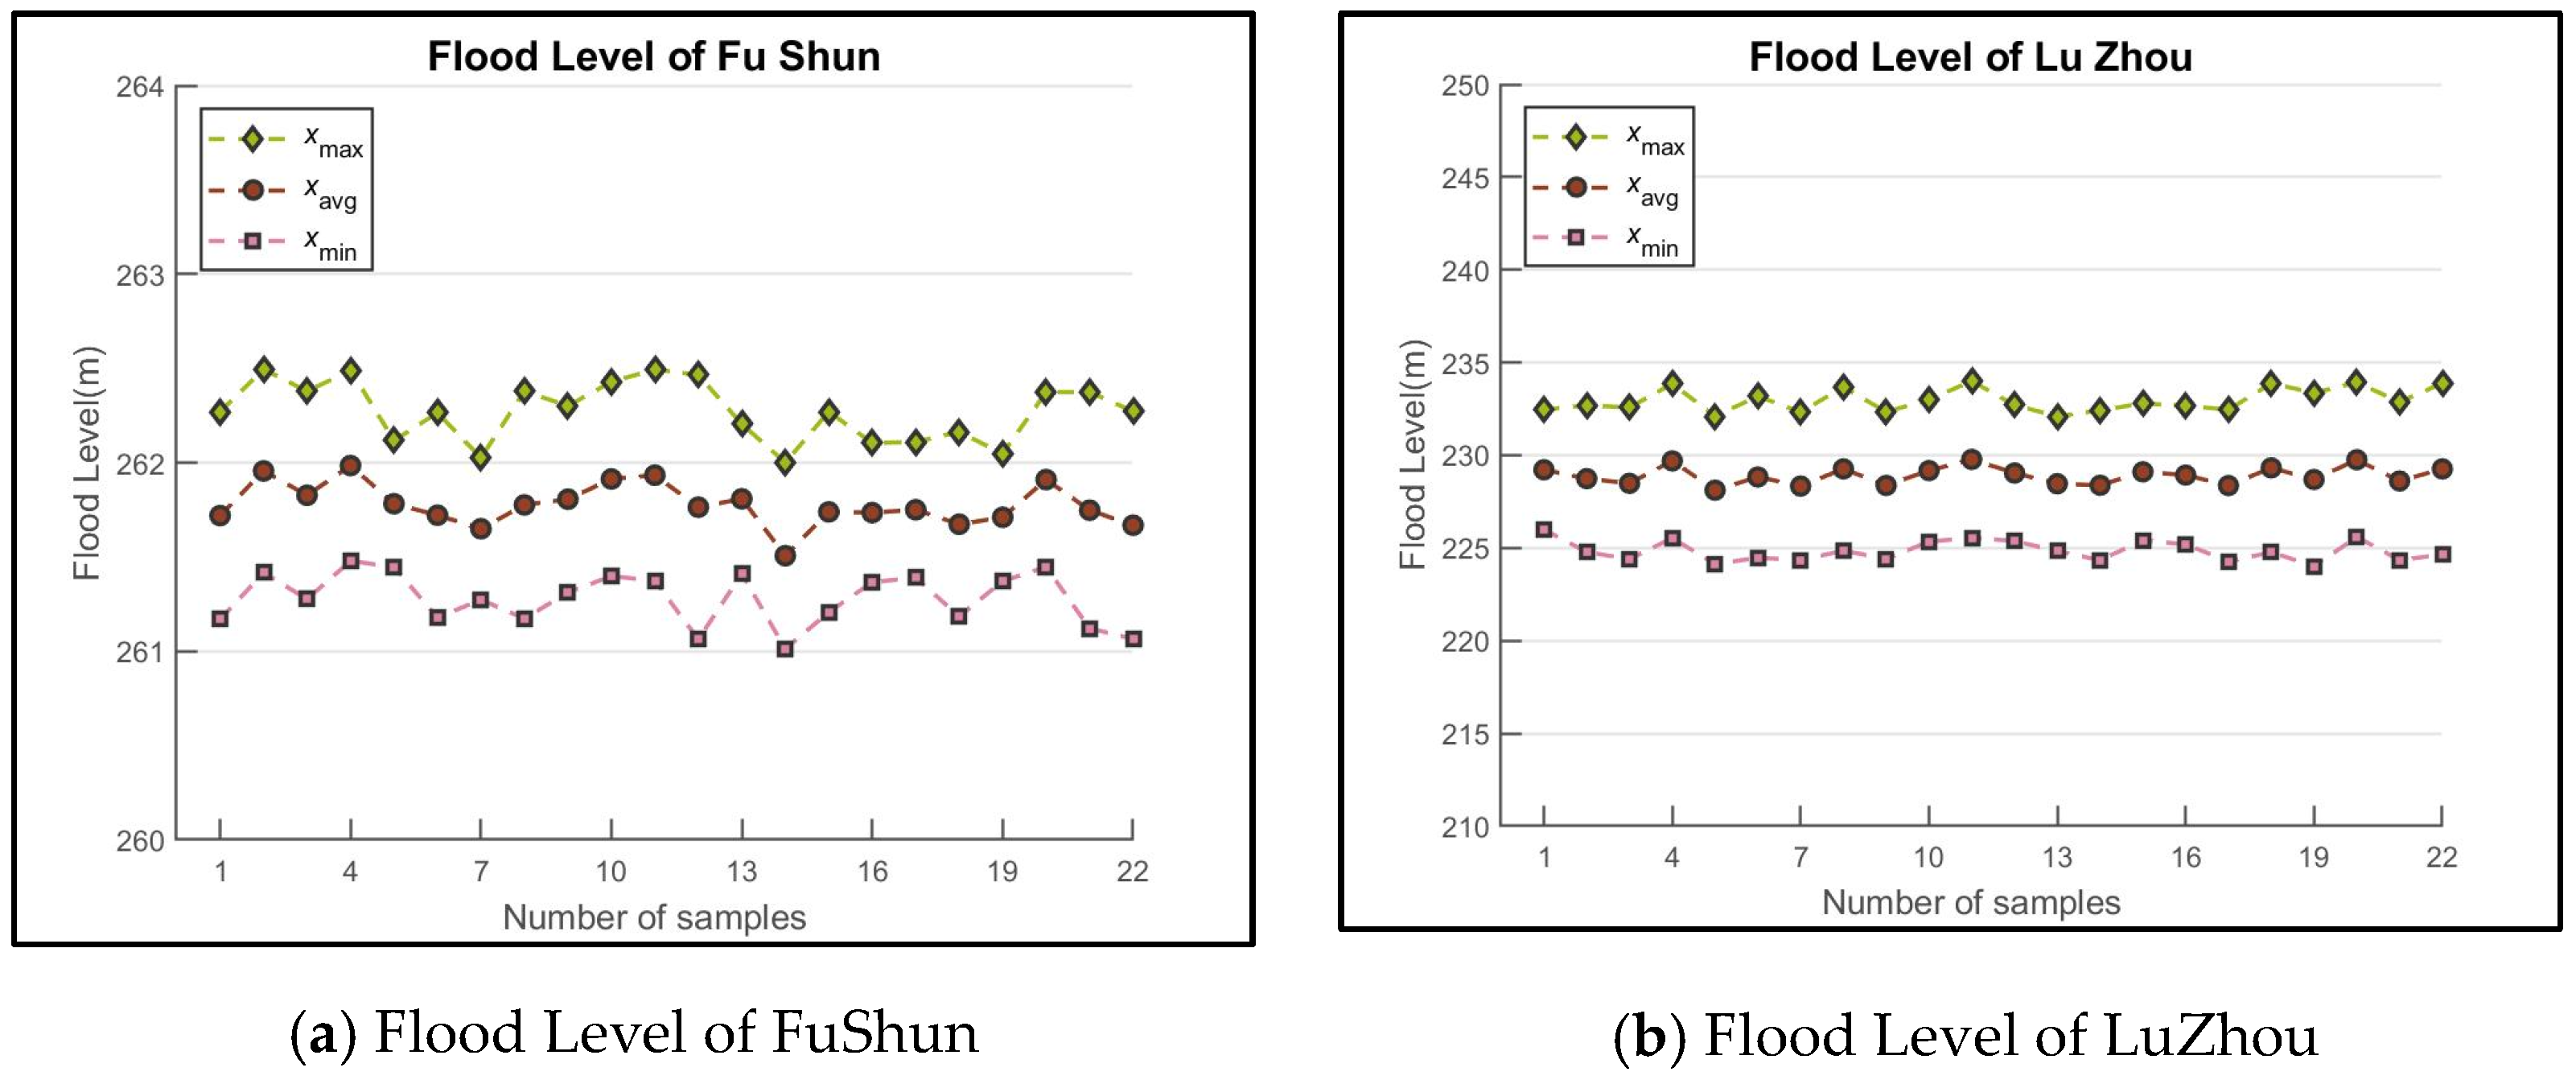
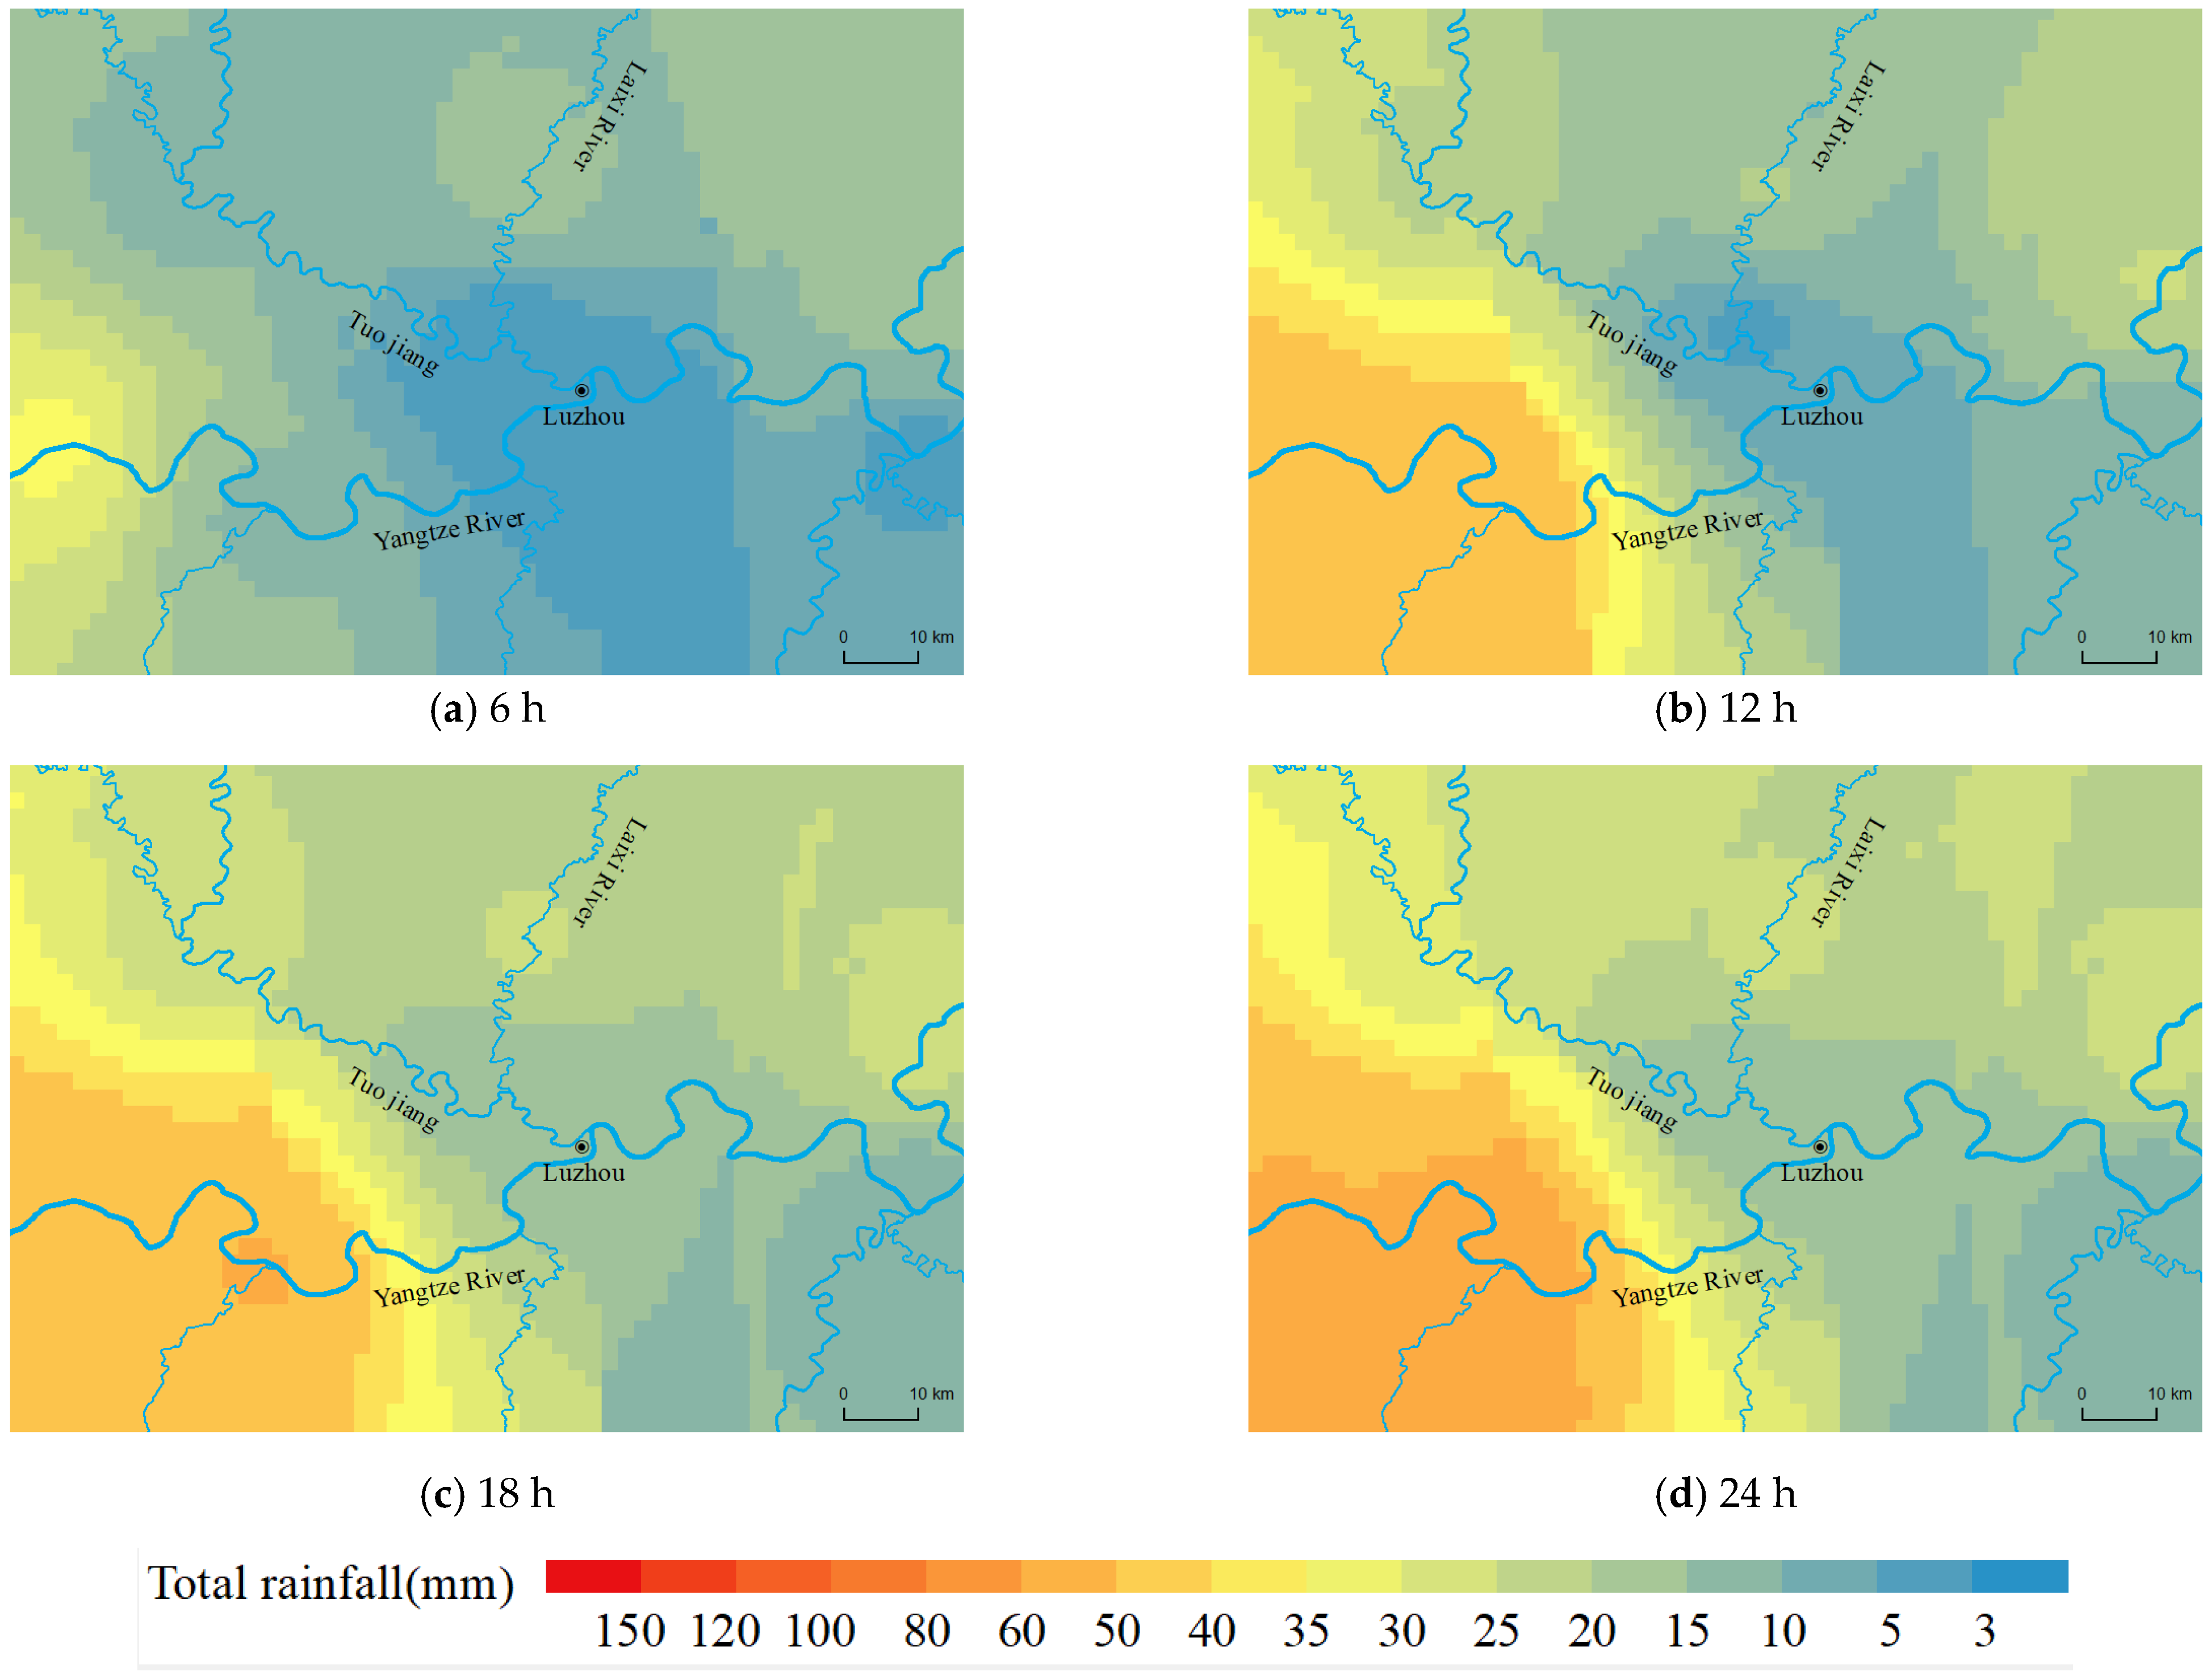
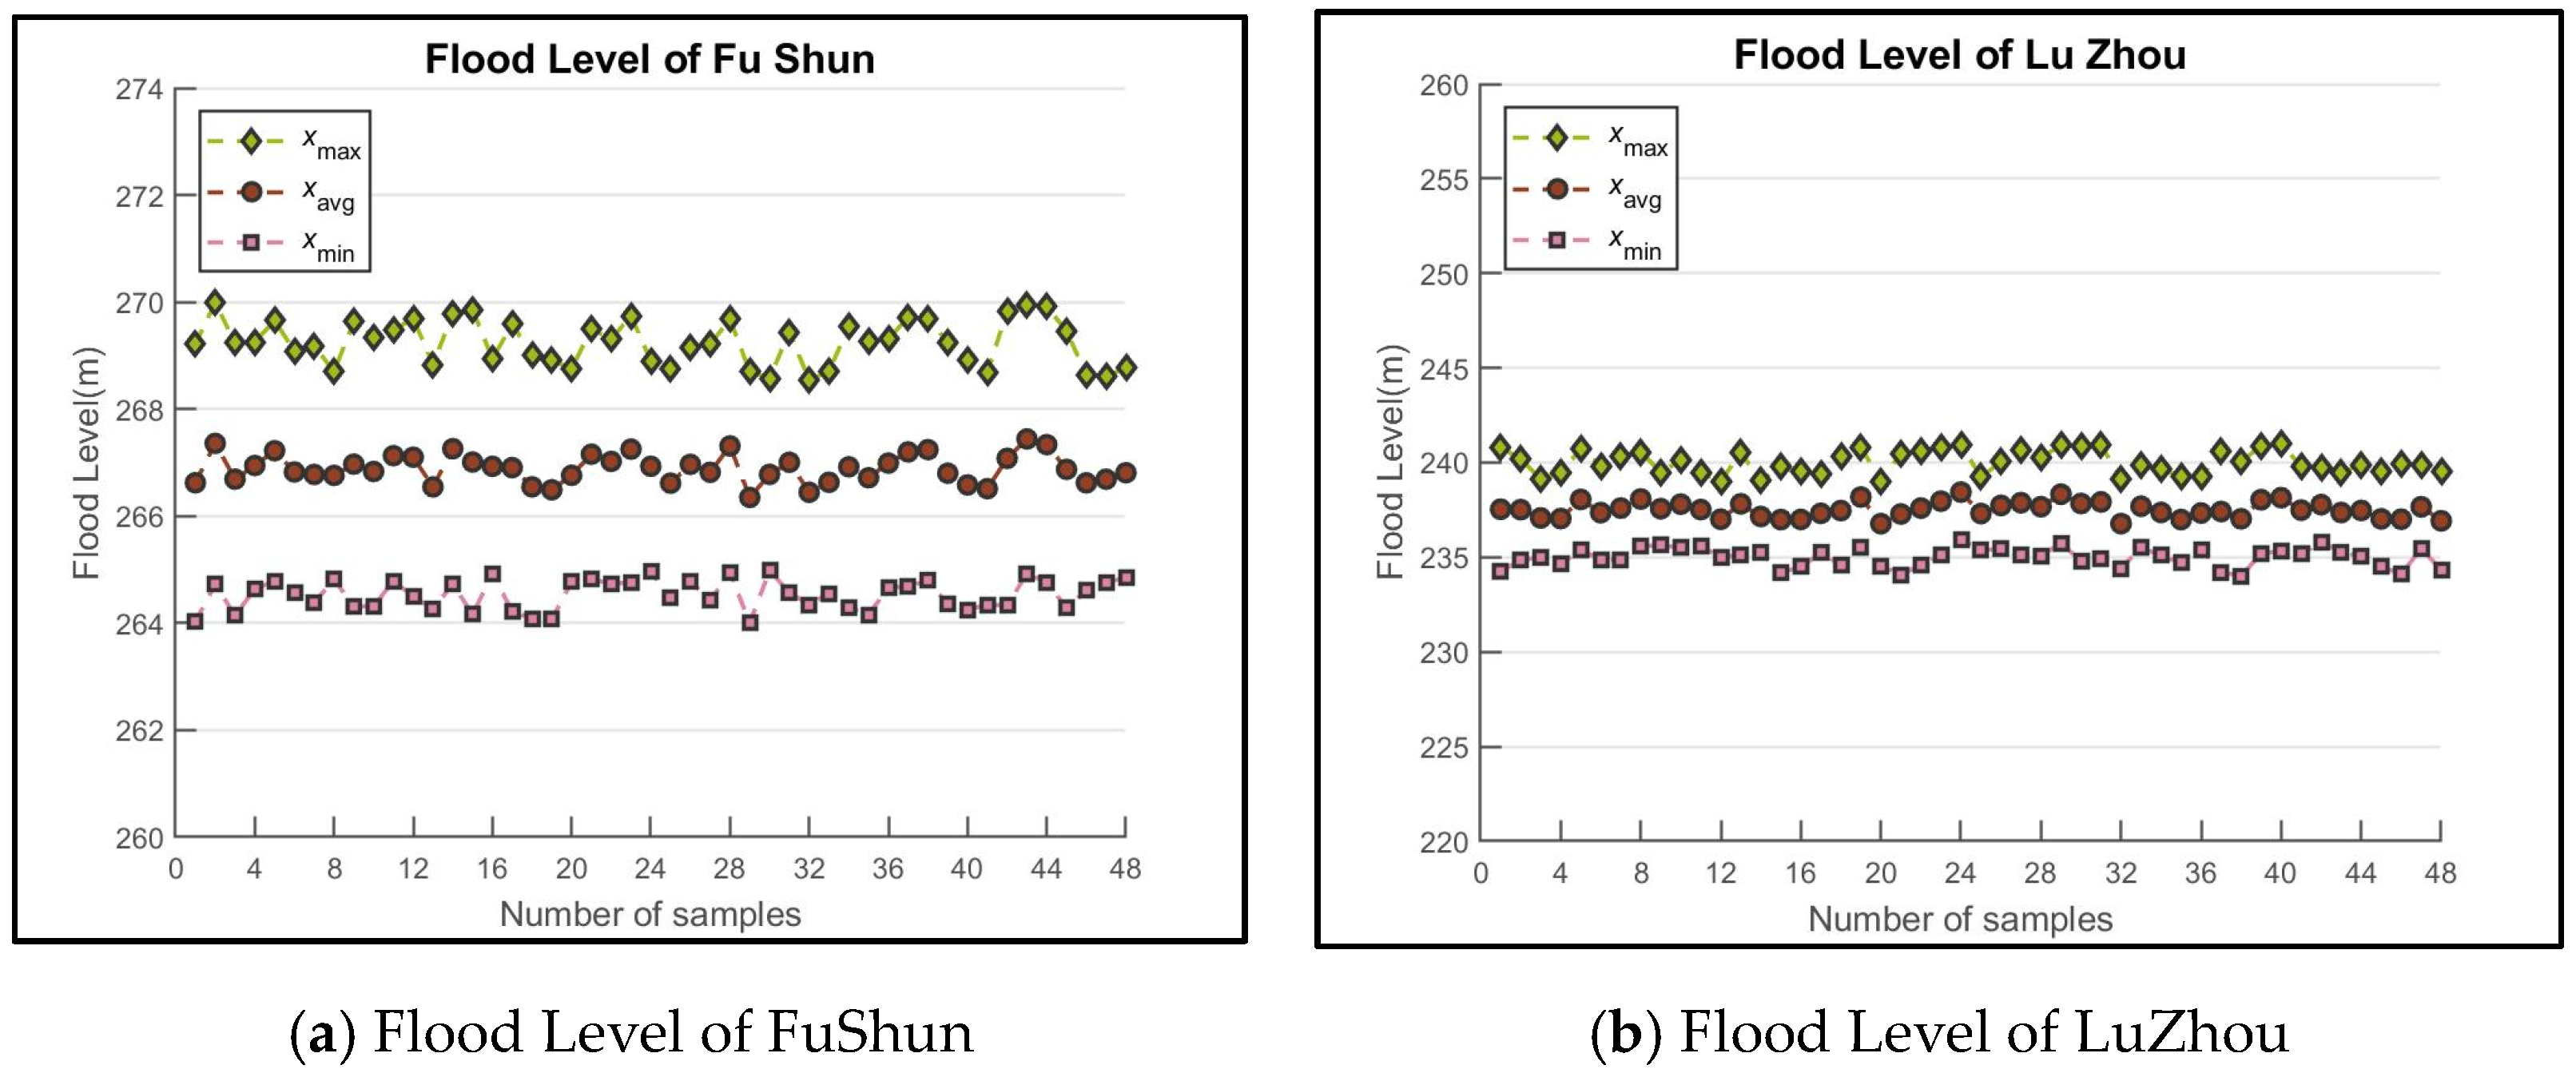
  • River flooding had a negligible impact on urban flood control and drainage. When the rainstorm center was located upstream of the Yangtze and Tuojing rivers, the movement direction of the rainstorm center was consistent with the flood evolution direction of the Yangtze and Tuojing rivers. The Tuojing River was significantly affected by the top support of the Yangtze River, with flood level changes up to 7–8 m. Both the Yangtze and Tuojing rivers maintained high water levels with a high risk of flooding. This is the most unfavorable rainfall process and must be a focus for flood prevention.
  • Although the rainfall–flood relationship obtained in this study applies only to Luzhou, the proposed method is universal. At present, this study only considers Luzhou as an example; the research scope can be further expanded to include the entire basin to obtain more objective results. The results of this study can provide technical support for urban storm risk management, as well as for the design of urban flood control and drainage systems.

Author Contributions

Y.L. (Yesen Liu) and H.R. collected and processed the data, Y.L. (Yuanyuan Liu), J.W. and S.L. proposed the model and analyzed the results, and Y.L. (Yuanyuan Liu), W.H. and Y.L. (Yesen Liu) wrote the manuscript. All authors have read and agreed to the published version of the manuscript.

Funding

This work was supported by the Science and Technology Fundamental Resources Investigation Program [2023FY101002, 2023FY101001].

Data Availability Statement

The participants in this study did not agree for their data to be shared publicly, so supporting data are not available.

Conflicts of Interest

The authors declare no conflict of interest.

References

  1. Allen, M.R.; Ingram, W.J. Constraints on Future Changes in Climate and the Hydrologic Cycle. Nature 2002, 419, 228–232. [Google Scholar] [CrossRef]
  2. Zhang, J.Y.; Wang, Y.T.; He, R.M.; Hu, Q.; Song, X. Discussion on the urban flood and waterlogging and causes analysis in China. Adv. Water Sci. 2016, 27, 485–491. [Google Scholar]
  3. Liu, Y.Y.; Zheng, J.W.; Liu, H.W. Warning and thoughts of extreme rainstorm on urban flood prevention. China Flood Drought Manag. 2021, 31, 21–24. [Google Scholar]
  4. Grimm, N.B.; Faeth, S.H.; Golubiewski, N.E.; Redman, C.L.; Wu, J.; Bai, X.; Briggs, J.M. Global change and the ecology of cities. Science 2008, 319, 756–760. [Google Scholar] [CrossRef]
  5. Camorani, G.; Castellarin, A.; Brath, A. Effects of land-use changes on the hydrologic response of reclamation systems. Phys. Chem. Earth 2005, 30, 561–574. [Google Scholar] [CrossRef]
  6. Mcdonald, R.I.; Green, P.; Balk, D.; Fekete, B.M.; Revenga, C.; Todd, M.; Montgomery, M. Urban growth, climate change, and freshwater availability. Proc. Natl. Acad. Sci. USA 2011, 108, 6312–6317. [Google Scholar] [CrossRef]
  7. Schubert, J.E.; Sanders, B.F.; Smith, M.J.; Wright, N.G. Unstructured mesh generation and landcover-based resistance for hydrodynamic modeling of urban flooding. Adv. Water Resour. 2008, 31, 1603–1621. [Google Scholar] [CrossRef]
  8. Cardoso, M.A.; Almeida, M.C.; Brito, R.S.; Gomes, J.L.; Beceiro, P.; Oliveira, A. 1D/2D stormwater modelling to support urban flood risk management in estuarine areas: Hazard assessment in the Dafundo case study. J. Flood Risk Manag. 2020, 13, e12663. [Google Scholar] [CrossRef]
  9. Liu, Y.Y.; Li, L.; Liu, Y.S.; Chan, P.W.; Zhang, W.H. Dynamic spatial-temporal precipitation distribution models for short-duration rainstorms in Shenzhen, China based on machine learning. Atmos. Res. 2020, 237, 104861. [Google Scholar] [CrossRef]
  10. Wang, G.-Y.; Sun, G.-R.; Li, J.-K.; Li, J. The experimental study of hydrodynamic characteristics of the overland flow on a slope with three-dimensional Geomat. J. Hydron. 2018, 30, 153–159. [Google Scholar] [CrossRef]
  11. Cristiano, E.; Veldhuis, M.T.; Wright, D.B.; Smith, J.A.; van de Giesen, N. The Influence of Rainfall and Catchment Critical Scales on Urban Hydrological Response Sensitivity. Water Resour. Res. 2019, 55, 3375–3390. [Google Scholar] [CrossRef]
  12. Cristiano, E.; ten Veldhuis, M.-C.; van de Giesen, N. Spatial and temporal variability of rainfall and their effects on hydrological response in urban areas—A review. Hydrol. Earth Syst. Sci. 2017, 21, 3859–3878. [Google Scholar] [CrossRef]
  13. Cheng, X.T. Disasters and strategy of comprehensive control of water disaster. J. Catastrophology 2010, 25, 10–15. [Google Scholar]
  14. Berne, A.; Delrieu, G.; Creutin, J.D.; Obled, C. Temporal and spatial resolution of rainfall measurements required for urban hydrology. J. Hydrol. 2004, 299, 166–179. [Google Scholar] [CrossRef]
  15. Liu, Y.Y.; Liu, H.W.; Huo, F.L. An application of machine learning on examining spatial and temporal distribution of short duration rainstorm. J. Hydraul. Eng. 2019, 50, 773–779. [Google Scholar]
  16. Kibler, D.F. Urban Stormwater Hydrology; American Geophysical Union: Washington, DC, USA, 1982. [Google Scholar]
  17. Keifer, C.J.; Chu, H.H. Synthetic storm pattern for drainage design. J. Hydraul. Div. 1957, 83, 1332-1–1332-25. [Google Scholar] [CrossRef]
  18. Huff, F.A. Time distribution of rainfall in heavy storms. Water Resour. Res. 1967, 3, 1007–1019. [Google Scholar] [CrossRef]
  19. Lecun, Y.; Bengio, Y.; Hinton, G. Deep learning. Nature 2015, 521, 436–444. [Google Scholar] [CrossRef]
  20. Barzegar, R.; Aalami, M.T.; Adamowski, J.F. Coupling a Hybrid CNN-LSTM Deep Learning Model with a Boundary Corrected Maximal Overlap Discrete Wavelet Transform for Multiscale Lake Water Level Forecasting. J. Hydrol. 2021, 598, 126196. [Google Scholar] [CrossRef]
  21. Prodhan, F.A.; Zhang, J.; Hasan, S.S.; Sharma, T.P.P.; Mohana, H.P. A review of machine learning methods for drought hazard monitoring and forecasting: Current research trends, challenges, and future research directions. Environ. Model. Softw. 2022, 149, 105327.1–105327.14. [Google Scholar] [CrossRef]
  22. Supattra, P.; Paramate, H. Flood Forecasting System Based on Integrated Big and Crowdsource Data by Using Machine Learning Techniques. IEEE Access 2020, 8, 5885–5905. [Google Scholar]
  23. Liu, Y.Y.; Liu, Y.S.; Zheng, J.W. Intelligent rapid prediction method of urban flooding based on BP neural network and numerical simulation model. J. Hydraul. Eng. 2022, 53, 284–295. [Google Scholar]
  24. Morshed-Bozorgdel, A.; Kadkhodazadeh, M.; Valikhan Anaraki, M.; Farzin, S. A Novel Framework Based on the Stacking Ensemble Machine Learning (SEML) Method: Application in Wind Speed Modeling. Atmosphere 2022, 13, 758. [Google Scholar] [CrossRef]
  25. Farzin, S.; Chianeh, F.N.; Anaraki, M.V.; Mahmoudian, F. Introducing a framework for modeling of drug electrochemical removal from wastewater based on data mining algorithms, scatter interpolation method, and multi criteria decision analysis (DID). J. Clean. Prod. 2020, 266, 122075. [Google Scholar] [CrossRef]
  26. Adnan, M.S.G.; Siam, Z.S.; Kabir, I.; Kabir, Z.; Ahmed, M.R.; Hassan, Q.K.; Rahman, R.M.; Dewan, A. A novel framework for addressing uncertainties in machine learning-based geospatial approaches for flood prediction. J. Environ. Manag. 2023, 326, 116813. [Google Scholar] [CrossRef]
  27. Bao, Z.; Zhang, J.; Wang, G.; He, R.; Jin, J.; Wang, J.; Wu, H. Quantitative assessment of the attribution of runoff and sediment changes based on hydrologic model and machine learning: A case study of the Kuye River in the Middle Yellow River basin. Adv. Water Sci. 2021, 32, 485–496. [Google Scholar]
  28. Bengio, Y.; Paiement, J.F.; Vincent, P.; Delalleau, O.; Roux, N.; Ouimet, M. Out-of-Sample Extensions for LLE, Isomap, MDS, Eigenmaps, and Spectral Clustering. In Advances in Neural Information Processing Systems 16; MIT Press: Cambridge, MA, USA, 2004; Volume 6, pp. 177–184. [Google Scholar]
  29. Tenenbaum, J.B.; de Silva, V.; Langford, J.C. A global geometric framework for nonlinear dimensionality reduction. Science 2000, 290, 2319–2323. [Google Scholar] [CrossRef]
  30. Paiement, A. Integrated Registration, Segmentation, and Interpolation for 3D/4D Sparse Data. Electron. Lett. Comput. Vis. Image Anal. 2015, 14, 6–8. [Google Scholar] [CrossRef]
Figure 1. Study area and distribution of stations whose data were used in this study.
Water 15 03755 g001
Figure 2. Sketch map of the ISOMAP algorithm method.
Water 15 03755 g002
Figure 3. Type 1 rainfall.
Water 15 03755 g003
Figure 4. Rainfall process on 1 May 2008.
Water 15 03755 g004
Figure 5. Rainfall process on 2 June 2014.
Water 15 03755 g005aWater 15 03755 g005b
Figure 6. Flood course line corresponding to Type 1 rainfall.
Water 15 03755 g006
Figure 7. Flood level corresponding to Type 1 rainfall.
Water 15 03755 g007
Figure 8. Type 2 rainfall.
Water 15 03755 g008
Figure 9. Rainfall process on 4 September 2006.
Water 15 03755 g009aWater 15 03755 g009b
Figure 10. Rainfall process on 16 July 2012.
Water 15 03755 g010
Figure 11. Flood course line corresponding to Type 2 rainfall.
Water 15 03755 g011
Figure 12. Flood level corresponding to Type 2 rainfall.
Water 15 03755 g012
Figure 13. Type 3 rainfall.
Water 15 03755 g013
Figure 14. Rainfall process on 18 July 2013.
Water 15 03755 g014aWater 15 03755 g014b
Figure 15. Rainfall process on 21 May 2018.
Water 15 03755 g015
Figure 16. Flood course line corresponding to Type 3 rainfall.
Water 15 03755 g016
Figure 17. Flood level corresponding to Type 3 rainfall.
Water 15 03755 g017
Table 1. Comparison of different types of rainfall and flood characteristics.
Type of RainfallSpatial and Temporal
Characteristics of Rainfall
Morphological Characteristics of Flood ProcessesCharacterization of Maximum and Minimum Flood Levels
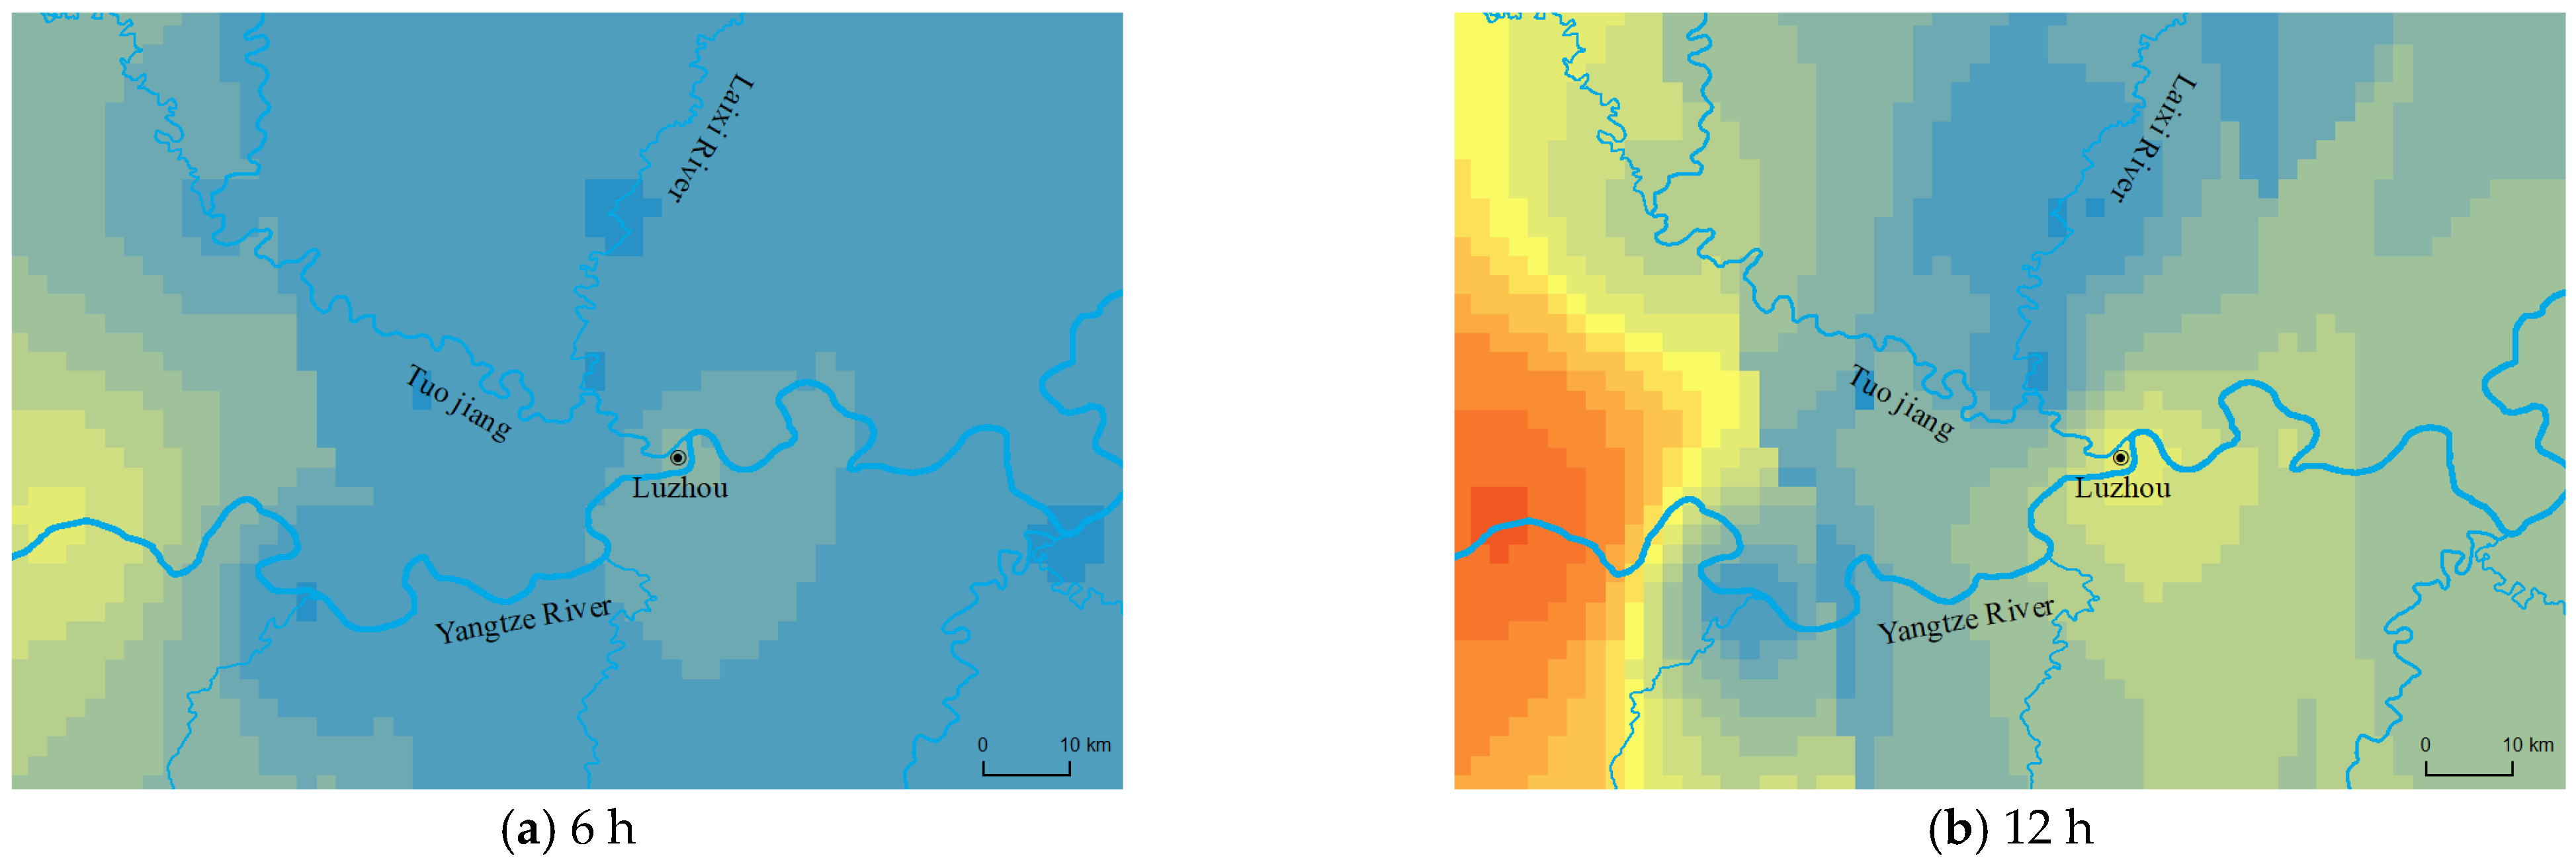
Type IThe center of the storm moved upstream from the Tuogang River toward LuzhouThe flooding process is mostly of the single-peak type, and this type of rainfall mainly affects the flood level of the Tuojiang River.The water level of the Tuo River fluctuated between 1 and 2 m due to rainfall, and the flood level of the Yangtze River remained stable.
Type IIThe center of the storm moved from the upper reaches of the Yangtze River to Luzhou.The flooding process was mostly a single peak, and this type of rainfall mainly affects the flood level of the Yangtze River.The water level of the Tuo River is greatly influenced by the water level of the Yangtze River. The water level of the Tuo River fluctuated greatly, with an average change of about 4–8 m.
Type IIIThe center of the storm moved toward Luzhou from the upper Yangtze River and the upper Tuo River, respectively.The flooding process was mostly a single peak. The rainfall process in the upper reaches of the Tuojian River overlapped with that in the upper reaches of the Yangtze River and moved towards Luzhou.The direction of movement of the rainstorm center was consistent with the flood evolution direction of the Yangtze and Tuojian rivers, which was the most unfavorable rainfall process.
Disclaimer/Publisher’s Note: The statements, opinions and data contained in all publications are solely those of the individual author(s) and contributor(s) and not of MDPI and/or the editor(s). MDPI and/or the editor(s) disclaim responsibility for any injury to people or property resulting from any ideas, methods, instructions or products referred to in the content.

