Article

Monitoring of Extreme Drought in the Yangtze River Basin in 2022 Based on Multi-Source Remote Sensing Data

1
College of Geography and Remote Sensing, Hohai University, Nanjing 211100, China
2
Hydrology and Water Resources Monitoring Center of Xiuhe River, Jiujiang 332000, China
*
Author to whom correspondence should be addressed.
Water 2024, 16(11), 1502; https://doi.org/10.3390/w16111502
Submission received: 24 April 2024 / Revised: 20 May 2024 / Accepted: 22 May 2024 / Published: 24 May 2024

Abstract

:
The Yangtze River Basin experienced a once-in-a-century extreme drought in 2022 due to extreme weather, which had a serious impact on the local agricultural production and ecological environment. In order to investigate the spatial distribution and occurrence of the extreme drought events, this study used multi-source remote sensing data to monitor the extreme drought events in the Yangtze River Basin in 2022. In this study, the gravity satellite data product CSR_Mascon was used to calculate the GRACE Drought Intensity Index (GRACE-DSI), which was analyzed and compared with the commonly used meteorological drought indices, relative soil humidity, and soil water content data. The results show that (1) terrestrial water storage change data can well reflect the change in water storage in the Yangtze River Basin. Throughout the year, the average change in terrestrial water storage in the Yangtze River Basin from January to June is higher than the average value of 33.47 mm, and the average from July to December is lower than the average value of 48.17 mm; (2) the GRACE-DSI responded well to the intensity and spatial distribution of drought events in the Yangtze River Basin region in 2022. From the point of view of drought area, the Yangtze River Basin showed a trend of extreme drought increasing first, and then decreasing in the area of different levels of drought, and the range of drought reached a maximum in September with a drought area of 175.87 km2, which accounted for 97.71 per cent of the total area; at the same time, the area of extreme drought was the largest, with an area of 85.69 km2; (3) the spatial and temporal variations of the GRACE-DSI and commonly used meteorological drought indices were well correlated, with correlation coefficients above 0.750, among which the correlation coefficient of the SPEI-3 was higher at 0.937; (4) the soil moisture and soil relative humidity products from the CLDAS, combined with soil moisture products from the GLDAS, reflect the starting and ending times of extreme drought events in the Yangtze River Basin in 2022 well, using the information from the actual stations. In conclusion, gravity satellite data, analyzed in synergy with data from multiple sources, help decision makers to better understand and respond to drought.

1. Introduction

1.1. Drought

Drought is a climatic phenomenon that is usually defined as the insufficiency of water resources during a prolonged dry spell, resulting in an inability to meet the needs of plants and animals [1]. Drought is one of the major natural disasters facing mankind, and it has a very significant impact on human life and survival. Drought leads to problems in the shortage of drinking water, reduced agricultural production, increased desertification, and destruction of ecosystems, which seriously affect human health, the economy, and social stability [2].
Despite highly advanced modern technology, it is still impossible to avoid the effects of drought on human beings. Indeed, with the rapid development of the global economy and growing population, climatic and environmental problems are becoming increasingly serious, as is water scarcity. These problems have led to increasing global aridity, expanding drought areas, and increasing frequency of droughts [1,2]. Nevertheless, the Intergovernmental Panel on Climate Change (IPCC) concluded in its latest report AR6 that a signal of climate change has not yet emerged beyond natural variability for droughts. As a result, drought has become one of the major issues of global concern, and requires joint efforts of the global community to cope with it. Traditionally, the main means of drought monitoring is to monitor rainfall, evapotranspiration, soil water content, runoff, etc., and then quantify the degree of drought through drought indices. These drought indices are based on different research objects and physical processes, and the variables and calculation methods are not identical, so the monitoring results of the same drought event may differ greatly [3]. However, the causes of drought are complex, including natural and anthropogenic factors [4,5], so the simple consideration of one or more meteorological factors (e.g., precipitation, evapotranspiration) cannot fully reflect the real drought situation. More importantly, most of the data used by these traditional methods are station data, which have defects resulting from uneven distribution of stations and lack of regional data.

1.2. GRACE

GRACE (Gravity Recovery and Climate Experiment mission) gravity satellites provide a long-term effective method for monitoring changes in terrestrial water storage. Gravity satellites have many advantages, such as being independent of ground conditions and allowing continuous, rapid, and repeated observations. Compared with ground observation, it can effectively solve such problems as the lack of depth of ground observation, uneven spatial distribution, insufficient access to information, and uneven distribution of hydrological models. The use of GRACE satellites can obtain globally distributed data with uniform observation scales, and can capture anomalous information on surface water, soil water, and groundwater reserves by detecting changes in the global gravity field and tracking drought events on a global scale [6]. This will support water resource management, drought monitoring, and climate change research on a global scale. Practice has shown that the GRACE time-varying gravity field model can be used to detect the trends in terrestrial water storage changes in medium and long spatial scales. The terrestrial water storage anomaly (TWSA) monitored by GRACE refers to the anomaly of water storage in the vertical direction of the Earth’s land, including snow and ice, surface water, soil water, and groundwater [6]. In addition, both natural and anthropogenic anomalies in terrestrial water storage can effectively be monitored by GRACE [7,8]. Therefore, GRACE gravity satellites have great potential for monitoring regional and global droughts [9].

1.3. Drought Monitoring Using GRACE

In recent years, scholars have carried out a series of research studies on drought monitoring by GRACE. Chen et al. [10], based on GRACE data earlier, found that there was a basin-wide drought in the Amazon basin in 2005. Feng et al. [11] further used GRACE to monitor the 2009 flood and 2010 drought in the Amazon basin. In addition, GRACE has been successfully used to monitor drought events in several regions around the world. Chen et al. [12] studied the drought in the La Plata Basin of South America from 2002 to 2009, including the onset, development, and peak of the drought, through the changes in terrestrial water storage observed by gravity satellites. Long et al. [13] analyzed the drought in the Yunnan-Guizhou Plateau of Southwest China in the last 10 years since 2003, using GRACE data and an artificial neural network model. Yirdaw et al. [14] used the time series of changes in terrestrial water storage monitored by GRACE to obtain the total storage deficit index (TSDI), and analyzed the total storage deficit of the Canadian prairie (three provinces of Canada) in 2002–2003, and then analyzed the impacts of drought and flooding in the Canadian prairie (three provinces of Canada) in 2002–2003. Yi et al. [15] assessed drought in the United States using the GRACE-based hydrological drought index (GHDI), and found that it is similar to the traditional Palmer hydrological drought index (Palmer hydrological drought index (PHDI), indicating that the GHDI has high feasibility in drought monitoring. Zhao et al. [16] proposed the GRACE drought severity index (GRACE-based drought severity index (GRACE-DSI)) to assess global drought intensity and compared it with the PDSI. Liu et al. [17] characterized the drought conditions in major river basins in China from 2002 to 2017 and showed that the improved GRACE-DSI could reasonably capture the drought process compared to the existing non-de-trended GRACE-based drought index. Wang et al. [18] comprehensively identified the temporal evolution, spatial distribution, and trend characteristics of the drought in the North China Plain from 2003 to 2015 by establishing that the GRACE Groundwater Drought Index (GGDI) was used as an indicator for assessing the drought, and utilized the cross wavelet transform technique to elucidate the link between the GGDI and remote correlation factors. Han et al. [19] used the standardized precipitation index (SPI) and groundwater storage anomaly drought severity index (GWSA-DSI) to characterize meteorological and groundwater droughts, respectively, in the Xijiang River Basin (XRB) of China, and proposed a probabilistic framework for determining the high resolution of drought from meteorological to groundwater droughts on a 0.25° grid propagation threshold. Cui et al. [20] referenced the Standardized Precipitation Index (SPI), Standardized Precipitation Evapotranspiration Index (SPI), and Standardized Precipitation Evapotranspiration Index (SPEI) concepts, and constructed the Standardized Terrestrial Water Storage Index (STI) to assess global hydrological drought from multiple time scales; the researchers showed that in persistent drought events, the STI can capture drought events with less noise than other metrics. Rawat et al. [21] used the Terrestrial Water Storage Anomaly (TWSA) and precipitation data to characterize drought propagation, and showed that most drought events are due to TWS depletion by comparing with the CCDI. Foroumandi et al. [22] used a deep learning approach to narrow down Iran’s monthly GRACE-derived terrestrial water storage anomalies (TWSA) down to a spatial resolution of 10 km to generate annual drought frequency and change detection maps from 2002 to 2016 for a deeper understanding of water scarcity in Iran. Han et al. [23] introduced a precipitation-driven drought trigger threshold framework. The framework considered the multi-scale characteristics of cumulative precipitation anomalies, and characterized hydrological drought by combining the drought severity index of terrestrial water storage anomalies, and further explored the dynamics of trigger thresholds over time in the Chinese region as well as the main drivers of these changes. Zhong et al. [24] proposed the standardized GRACE-reconstructed TWSA index (SGRTI) to assess drought severity with a statistical reconstruction method based on the calibration of GRACE observations.
Traditional drought indicators, such as the Standardized Precipitation Index (SPI), the Palmer Drought Severity Index (PDSI) and the self-calibrating Palmer Drought Severity Index (sc-PDSI), are simplified estimates with certain limitations in their formation. Consequently, traditional means of drought monitoring have encountered difficulties due to insufficient ground observations and the associated increased costs.
As the monitoring and assessment method of large-scale hydrological droughts, the GRACE-DSI is the most suitable method for monitoring and assessing droughts. Its strength lies in its ability to provide accurate intra-drought indicators, drought vulnerability assessment, and comprehensive water supply and demand analysis.
However, there are few studies on the analysis of extreme drought in the Yangtze River Basin in 2022 based on GRACE satellites, while the related studies only analyzed GRACE data and did not include other multi-source data for synergistic analysis. Therefore, the main objective of this study is to provide a comprehensive analysis of the 2022 drought by using Gravity Satellite and measured site data. The study focuses on assessing the storage deficit due to drought in the Yangtze River Basin in 2022 using monthly storage anomalies and the GRACE drought index calculated based on them, in synergy with other multi-source satellite data.

2. Study Area, Data and Methods
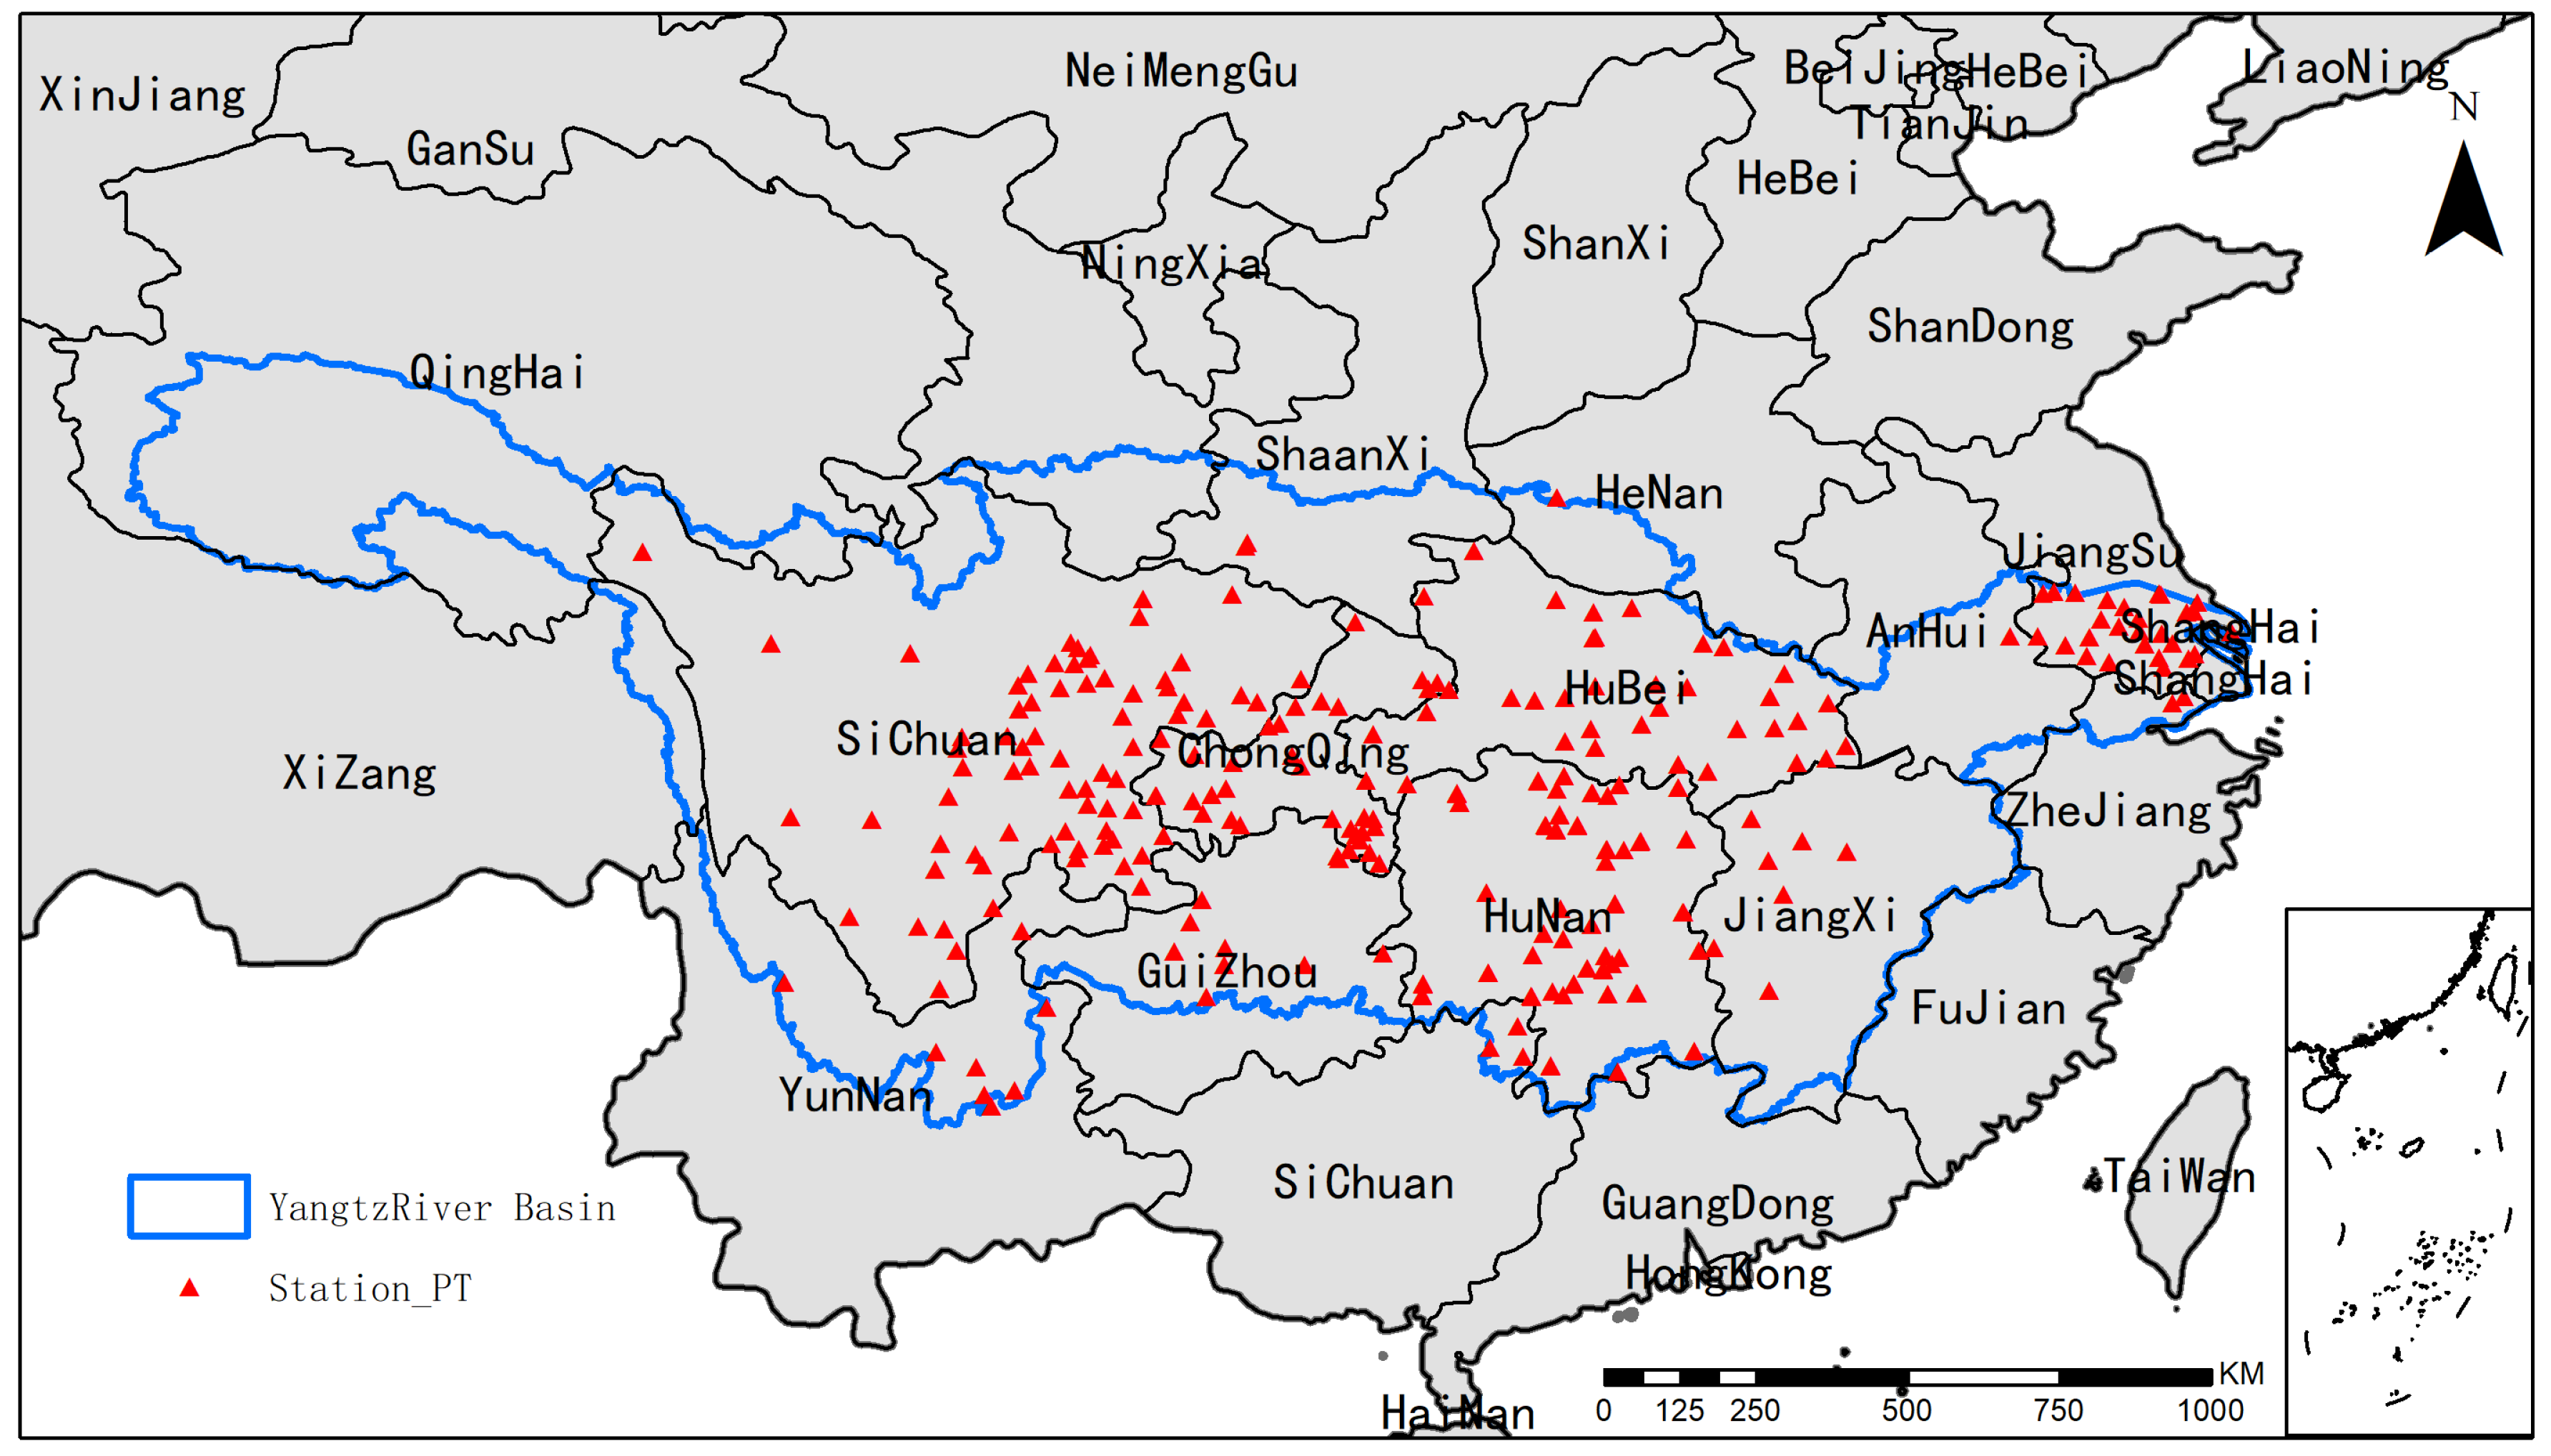
2.1. Study Area

The Yangtze River Basin, as shown in Figure 1, is located between 90°30′ and 122°25′ east longitude and 24°30′ and 35°45′ north latitude, with a total area of approximately 1.8 million square kilometers, accounting for 18.8% of China’s total land area [25]. The Yangtze River originates from the Tanggula Mountains on the Tibetan Plateau and flows from west to east through 19 provinces and autonomous regions, including Qinghai, Tibet, Sichuan, Chongqing, Hubei, and Shanghai. The Yangtze River Basin is rich in water resources and is one of the most important inland waterways in China. It contains 11 secondary basins, of which the Tongtian River, Yalong River, Minjiang River, Hanjiang River, and Dongting Lake basins cover a large area. The Yangtze River Basin has a complex topography, spanning three major terrain terraces in China, with obvious spatial differences in climatic conditions. The differences in the spatial and temporal distributions of precipitation are also large, with only 500 mm of precipitation in the west, while in the east it can be up to 2500 mm, and about 60% of the basin’s precipitation is concentrated in the summer [26]. In recent decades, the frequency of extreme climatic events has increased due to human activities and climate change, and the frequency and intensity of droughts in the Yangtze River basin have shown an upward trend.

2.2. Data Sources and Processing

2.2.1. GRACE-TWSA

The data used in this paper is the Mascon RL06 data product provided by the Center for Space Research (CSR) of the University of Texas, USA, which is used to invert the anomalies of terrestrial water storage in the Yangtze River Basin in this study. The CSR_Mascon data product has a grid resolution of 0.25° × 0.25°, a temporal resolution of one month, and deducts factors such as tides, solid tides, non-tidal tides, and extreme tides, thus avoiding their influence on gravity variations. The Mascon product has a time resolution of 0.25° × 0.25° over a period of one month, and is net of tides, solid tides, non-tidal, and extreme tides, thus avoiding their influence on gravity variations. Due to the application of GIA, GAD, C20, and C30 corrections to the Mascon product, no pre-processing of the data is required [27,28]. The CSR_Mascon data can significantly improve the spatial positioning and amplitude of the inverted TWSA [29], and no additional temporal and spatial constraints are required. In this paper, the spatial resolution of CSR_Mascon data was converted to 0.5° × 0.5° TWSA grid data, which were unified with the resolution of meteorological drought data.

2.2.2. SPI, SPEI

There are several drought indices that are widely used, the most common of which include the Palmer drought severity index (PDSI) [30], the standardized precipitation index (SPI), and the standardized precipitation evapotranspiration index (SPEI) [31]. The PDSI is a physicalized drought index based on the calculation of soil water balance in two layers, unlike statistical drought indices such as the SPEI and SPI. The SPI is a standardized precipitation index, which is calculated by calculating the rainfall [32]. The SPEI is a standardized rainfall index, which is derived by calculating the cumulative sum of rainfall over different time scales, while the SPEI introduces potential evapotranspiration and temperature information to the SPI, which is derived by calculating the cumulative sum of the difference between rainfall and potential evapotranspiration over different time scales. Both types of indices have multi-scale temporal properties, and are capable of identifying different types of droughts and the impacts of droughts on different systems. At large scales, the various indices have their strengths and weaknesses, but it is difficult to obtain definitive conclusions. The SPI and SPEI used in this study were calculated based on rainfall data and potential evapotranspiration data provided by the Climatic Research Unit (CRU).

2.2.3. GLDAS Data

The Global Land Data Assimilation System (GLDAS), launched by NASA, is one of the most widely used land hydrological models [17]. The dataset contains 36 basic hydrological variables, including soil water content, evapotranspiration, and soil temperature, with a temporal resolution of one month and a spatial resolution of 0.25 degrees. The dataset has a start date of January 2000 and is currently updated to January 2023 [33]. In this study, the root zone soil water content data were selected to analyze the spatial and temporal characteristics of agricultural drought from the point of view of agronomic significance of crops.

2.2.4. CLDAS Data

The China Meteorological Administration Land Surface Data Assimilation System (CLDAS-V2.0) near real-time product dataset used in this study was obtained from the China Meteorological Administration (CMA, URL (http://data.cma.cn/)). The “CLDASV2.0” product is an iso-latitudinal and longitudinal grid fusion analysis product covering the Asian region (0–65° N, 60–160° E) at 0.0625° × 0.0625° with 1-h resolution, including atmospheric driving field products (2 m air temperature, 2 m specific humidity, 10 m wind speed, surface air pressure, precipitation, short-wave radiation), surface temperature analysis products, soil moisture products (vertically divided into 5 layers: 0–5, 0–10, 10–40, 40–100, 100–200 cm), soil temperature analysis products (vertically divided into 5 layers: 5, 10, 40, 100, 200 cm), and relative soil moisture analysis products (vertically divided into 3 layers: 0–10 cm, 0–20 cm, 0–50 cm) and five other products. The dataset is developed using ground and satellite observations from various sources and techniques such as STMAS, optimal interpolation (OI), probability density function matching (CDF), physical inversion, and terrain correction, and its quality is better than that of similar products in the international arena in the Chinese region, with a higher spatial and temporal resolution. In order to match the temporal resolution of GRACE and GLDAS data, we resampled the daily-scale time series as monthly averages.

2.3. Methods of Analysis

GRACE-DSI

The GRACE-DSI is a drought-monitoring method based on satellite gravity calculations that can provide consistent monitoring results globally. As a result of the low spatial resolution of GRACE, the GRACE-DSI is mainly applicable to drought monitoring at medium and long scales. Unlike other drought monitoring methods, the GRACE-DSI monitors the drying up of the total terrestrial water reserves in the vertical direction of the Earth, and thus can compensate for the lack of groundwater drought monitoring in existing methods. It can be used for drought monitoring in areas where surface observations (e.g., rainfall) are lacking. Here, drought intensity is quantified by calculating the GRACEDSI with the following formula:
G R A C E D S I i , j = T W S A i , j T W S A j ¯ σ j
where i and j represent years and months, respectively, and T W S A j ¯   a n d   σ j represent the mean and standard deviation of the terrestrial water storage anomaly for month j, respectively.
Table 1 shows the criteria of different data products for the evaluation of drought levels.

3. Results

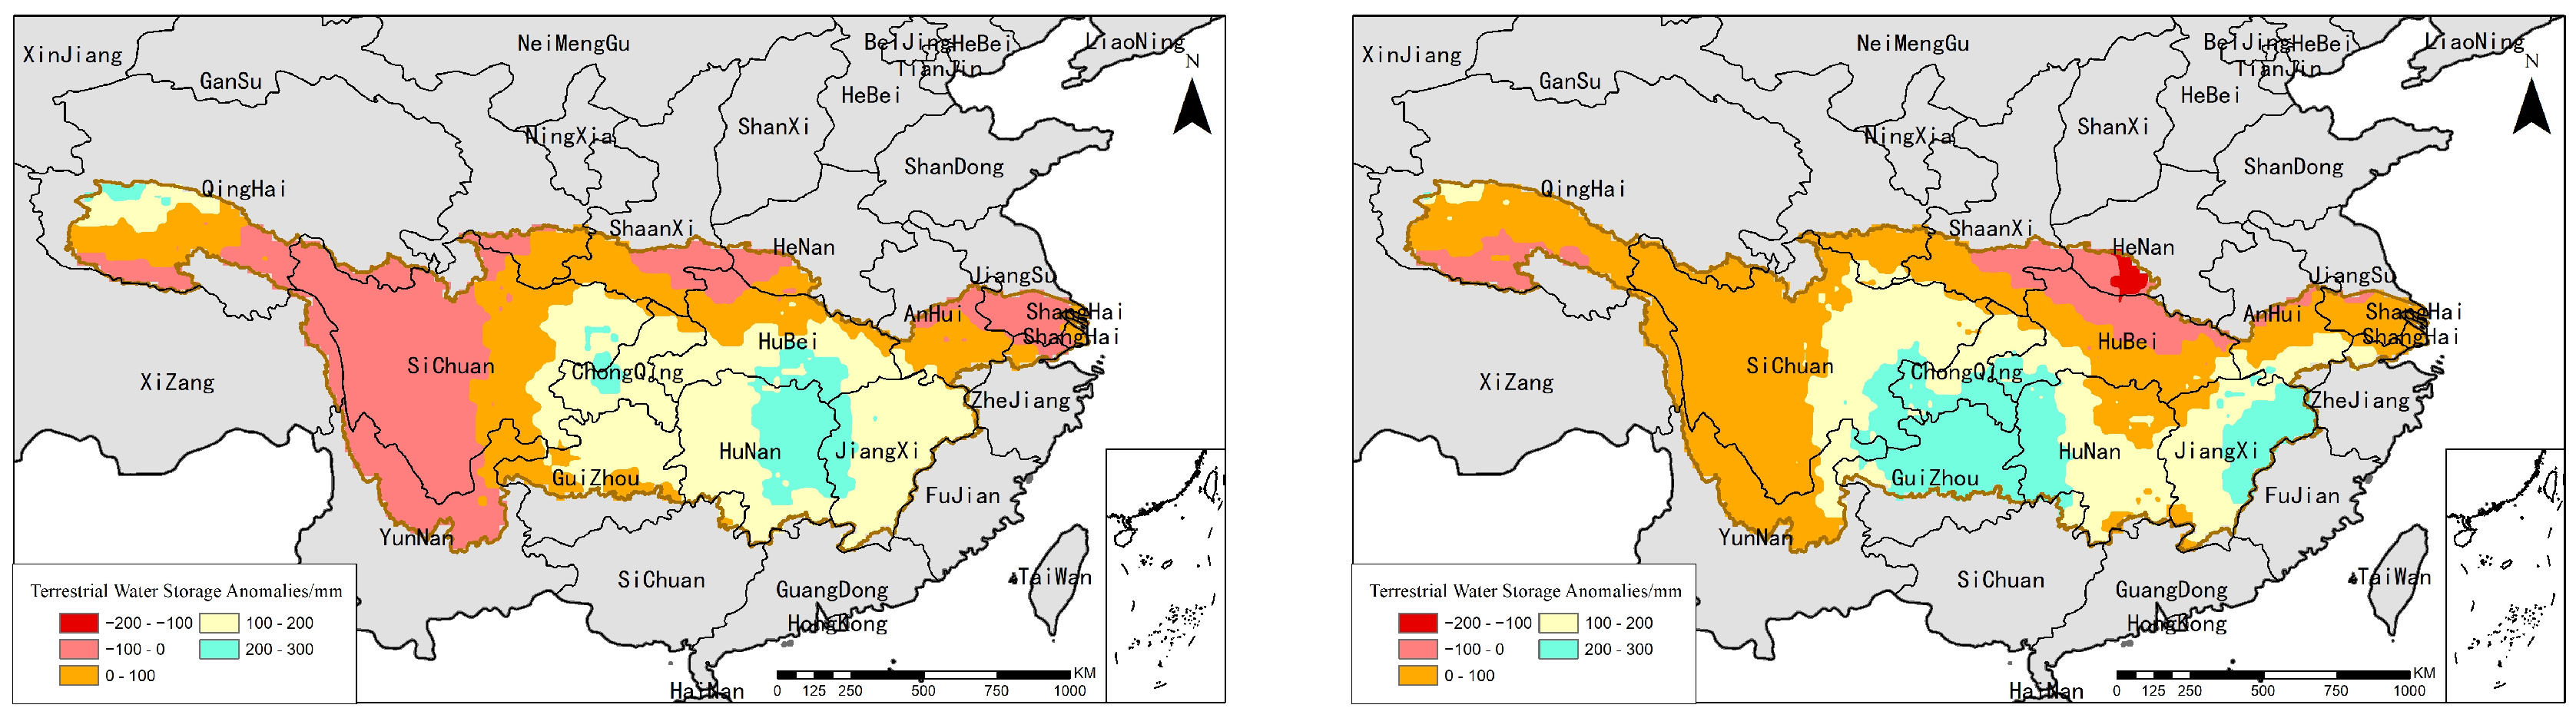
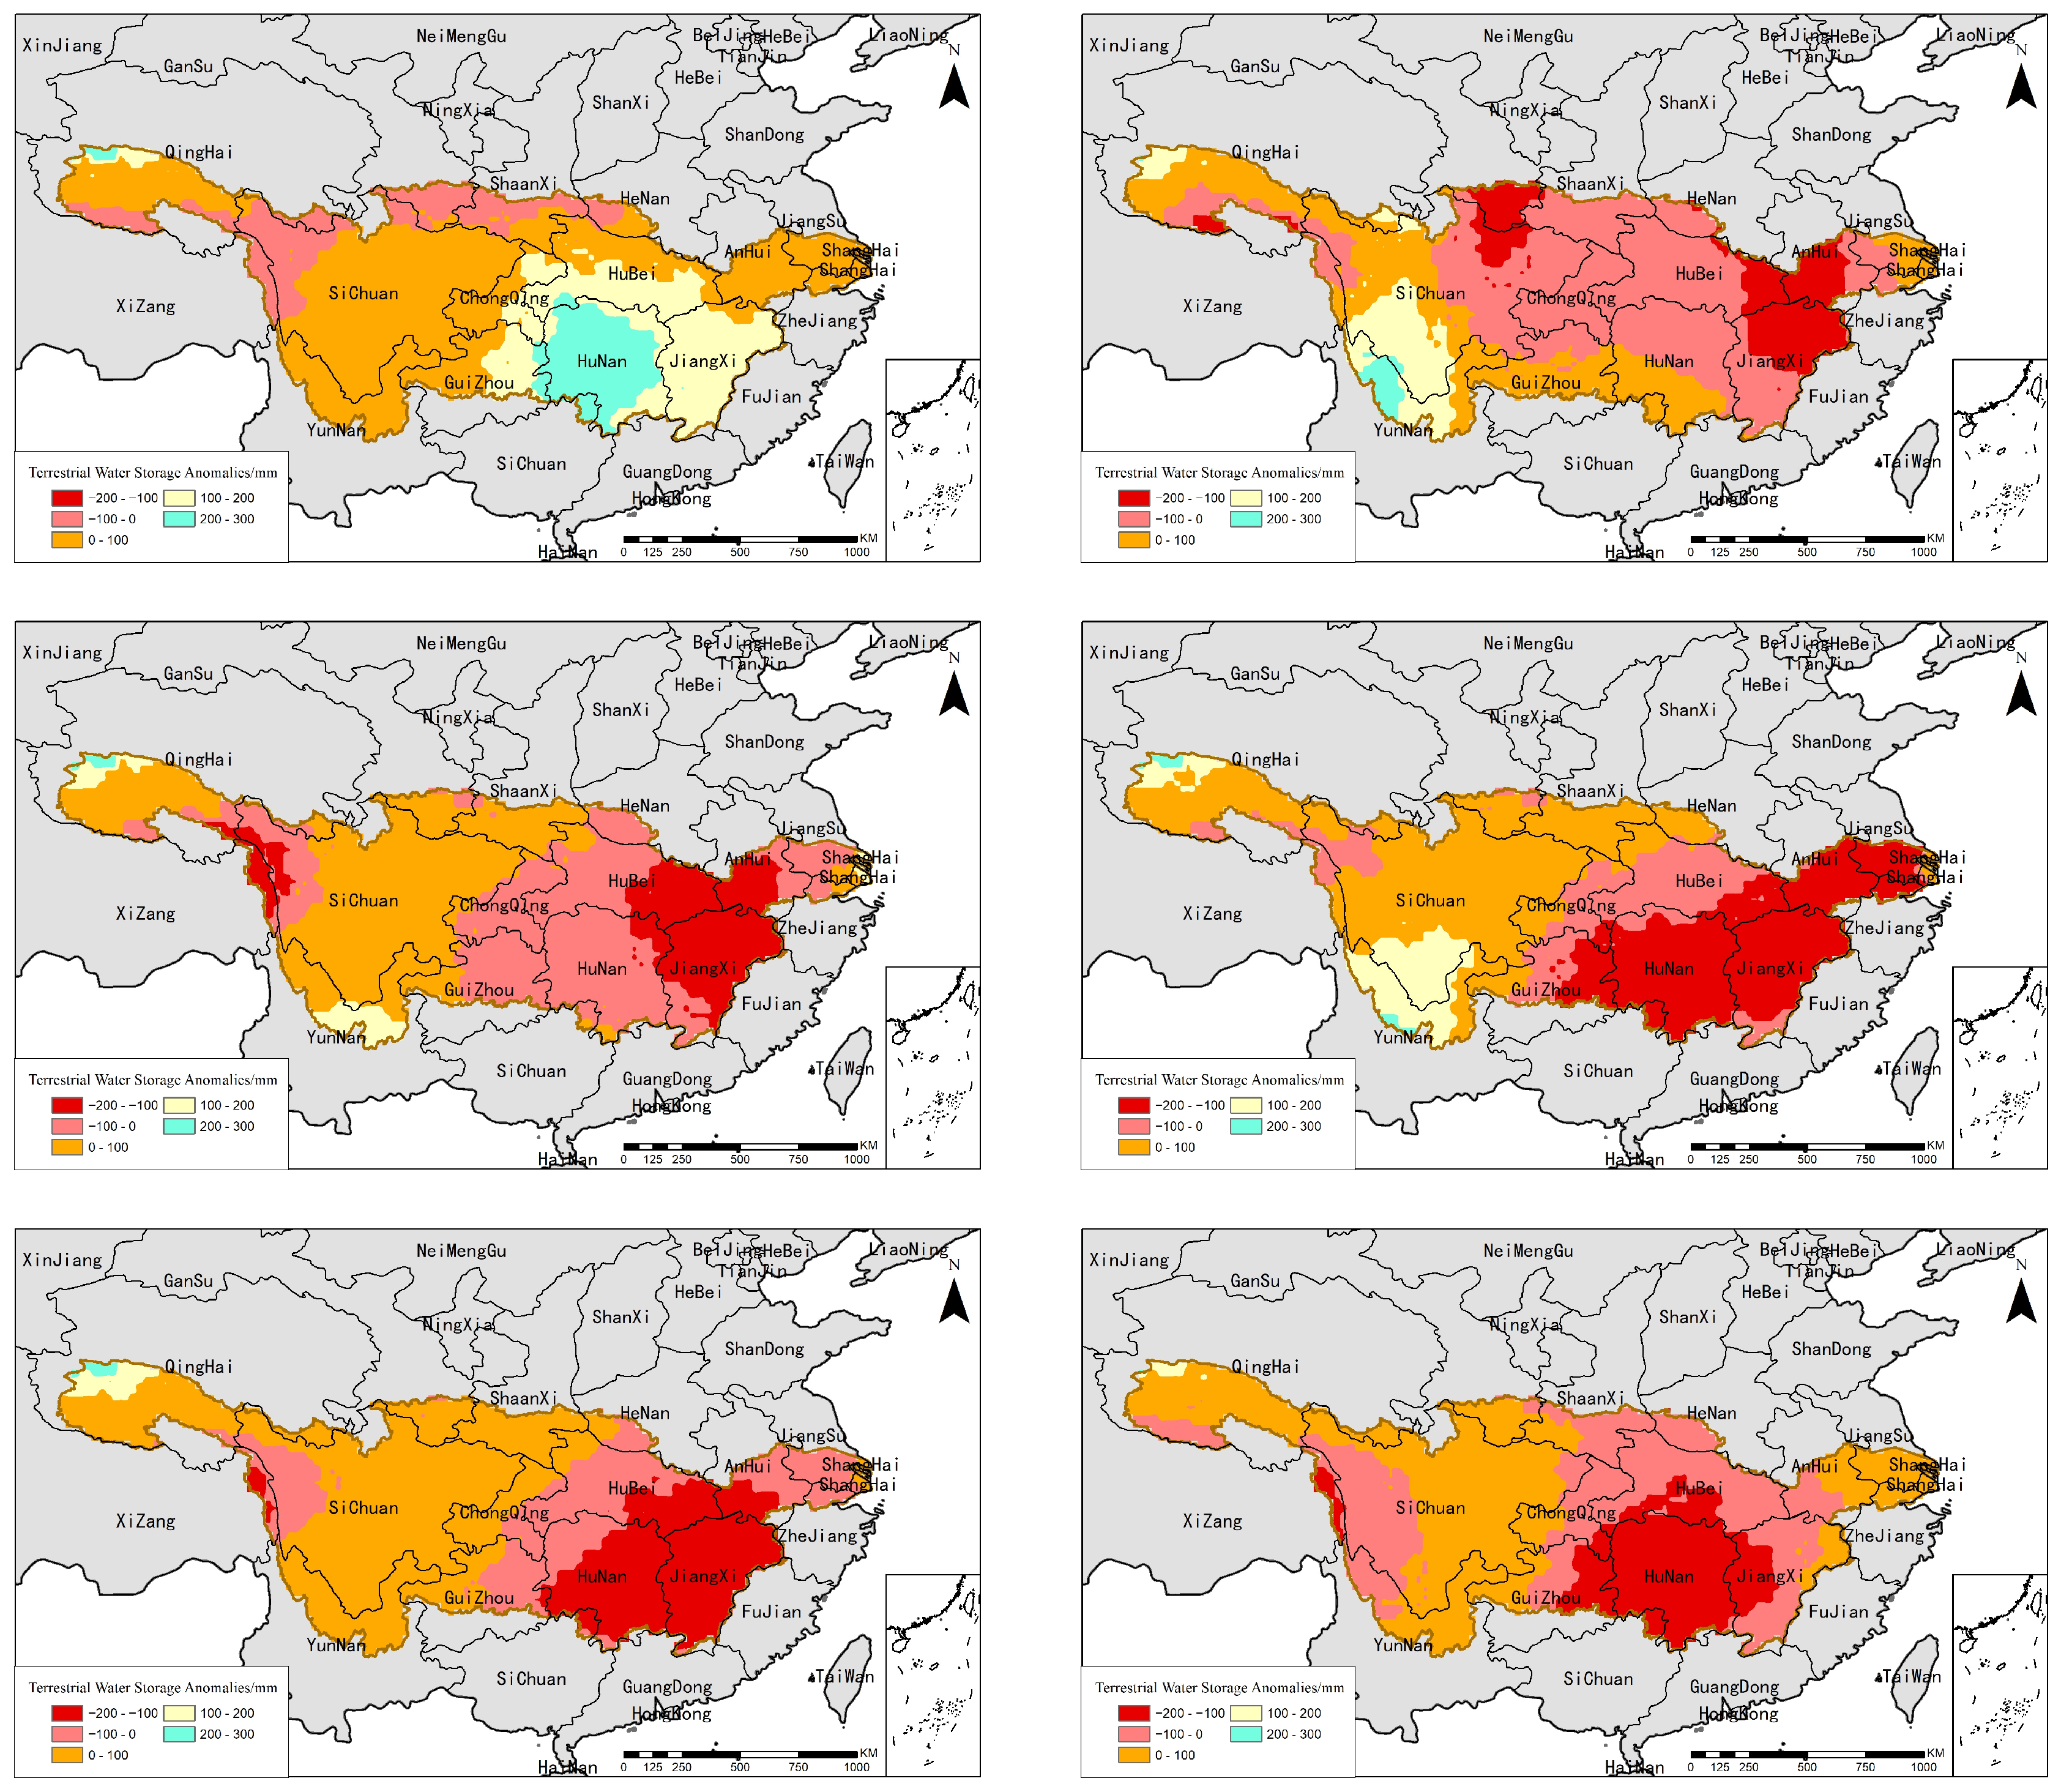
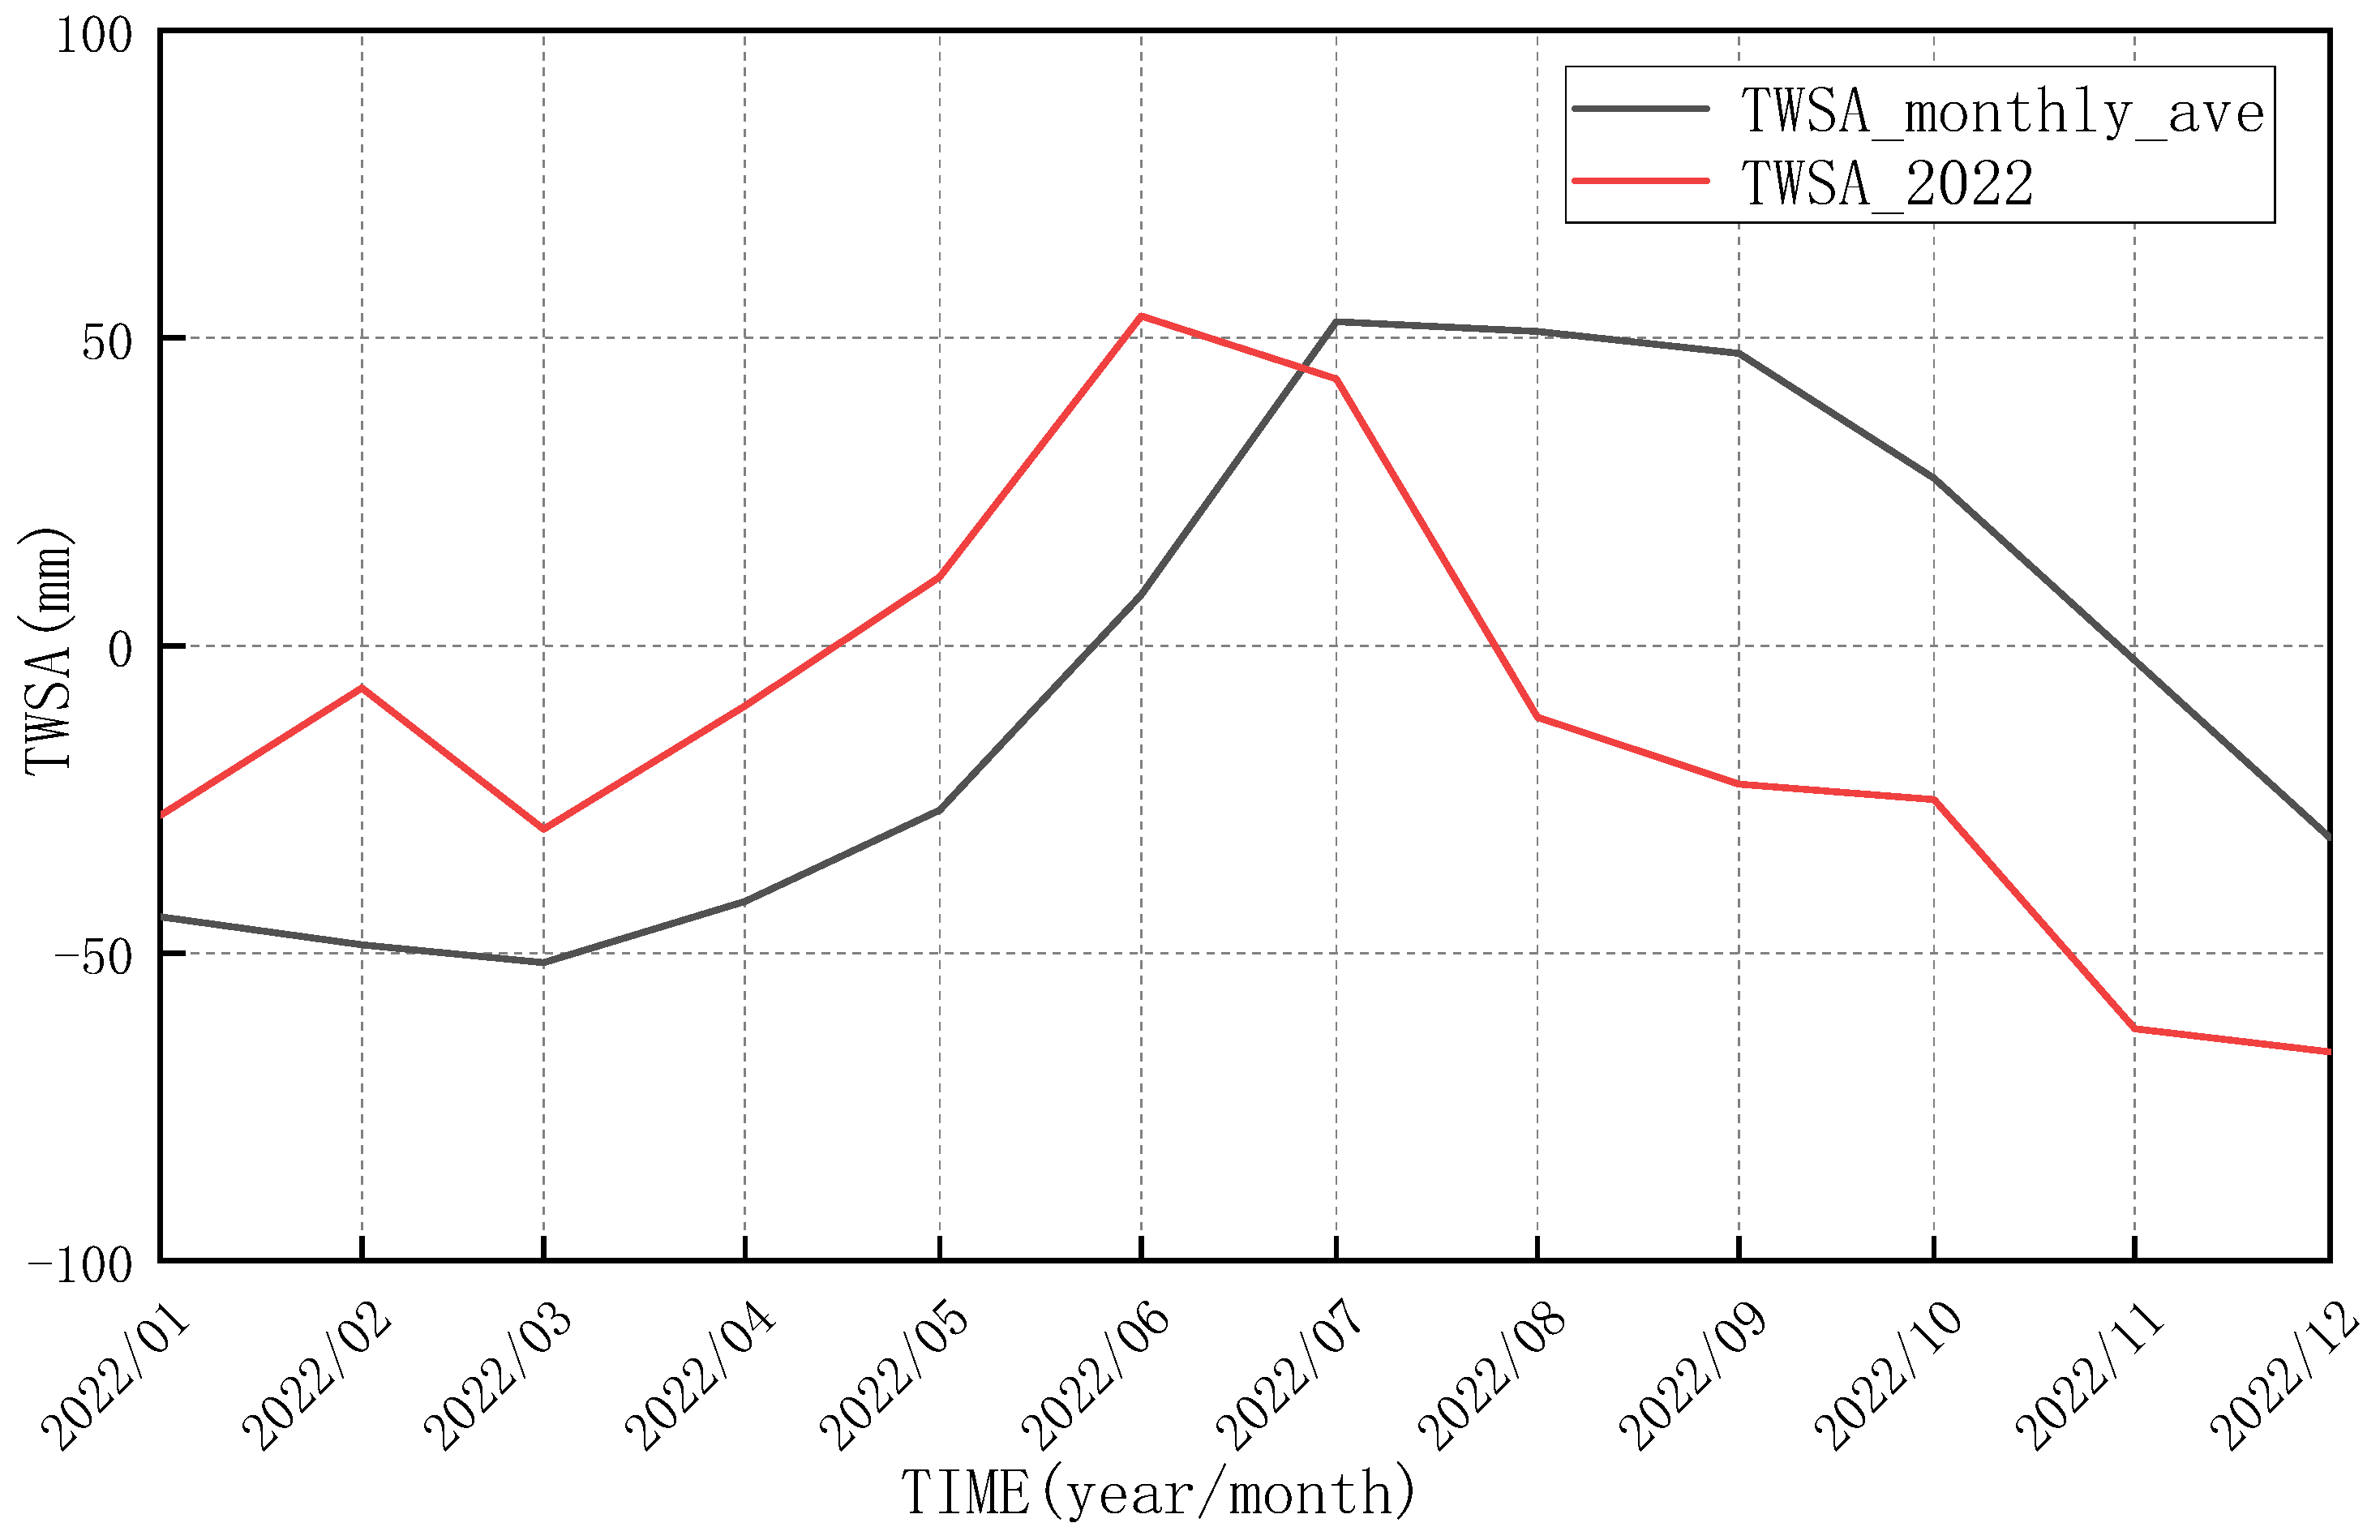
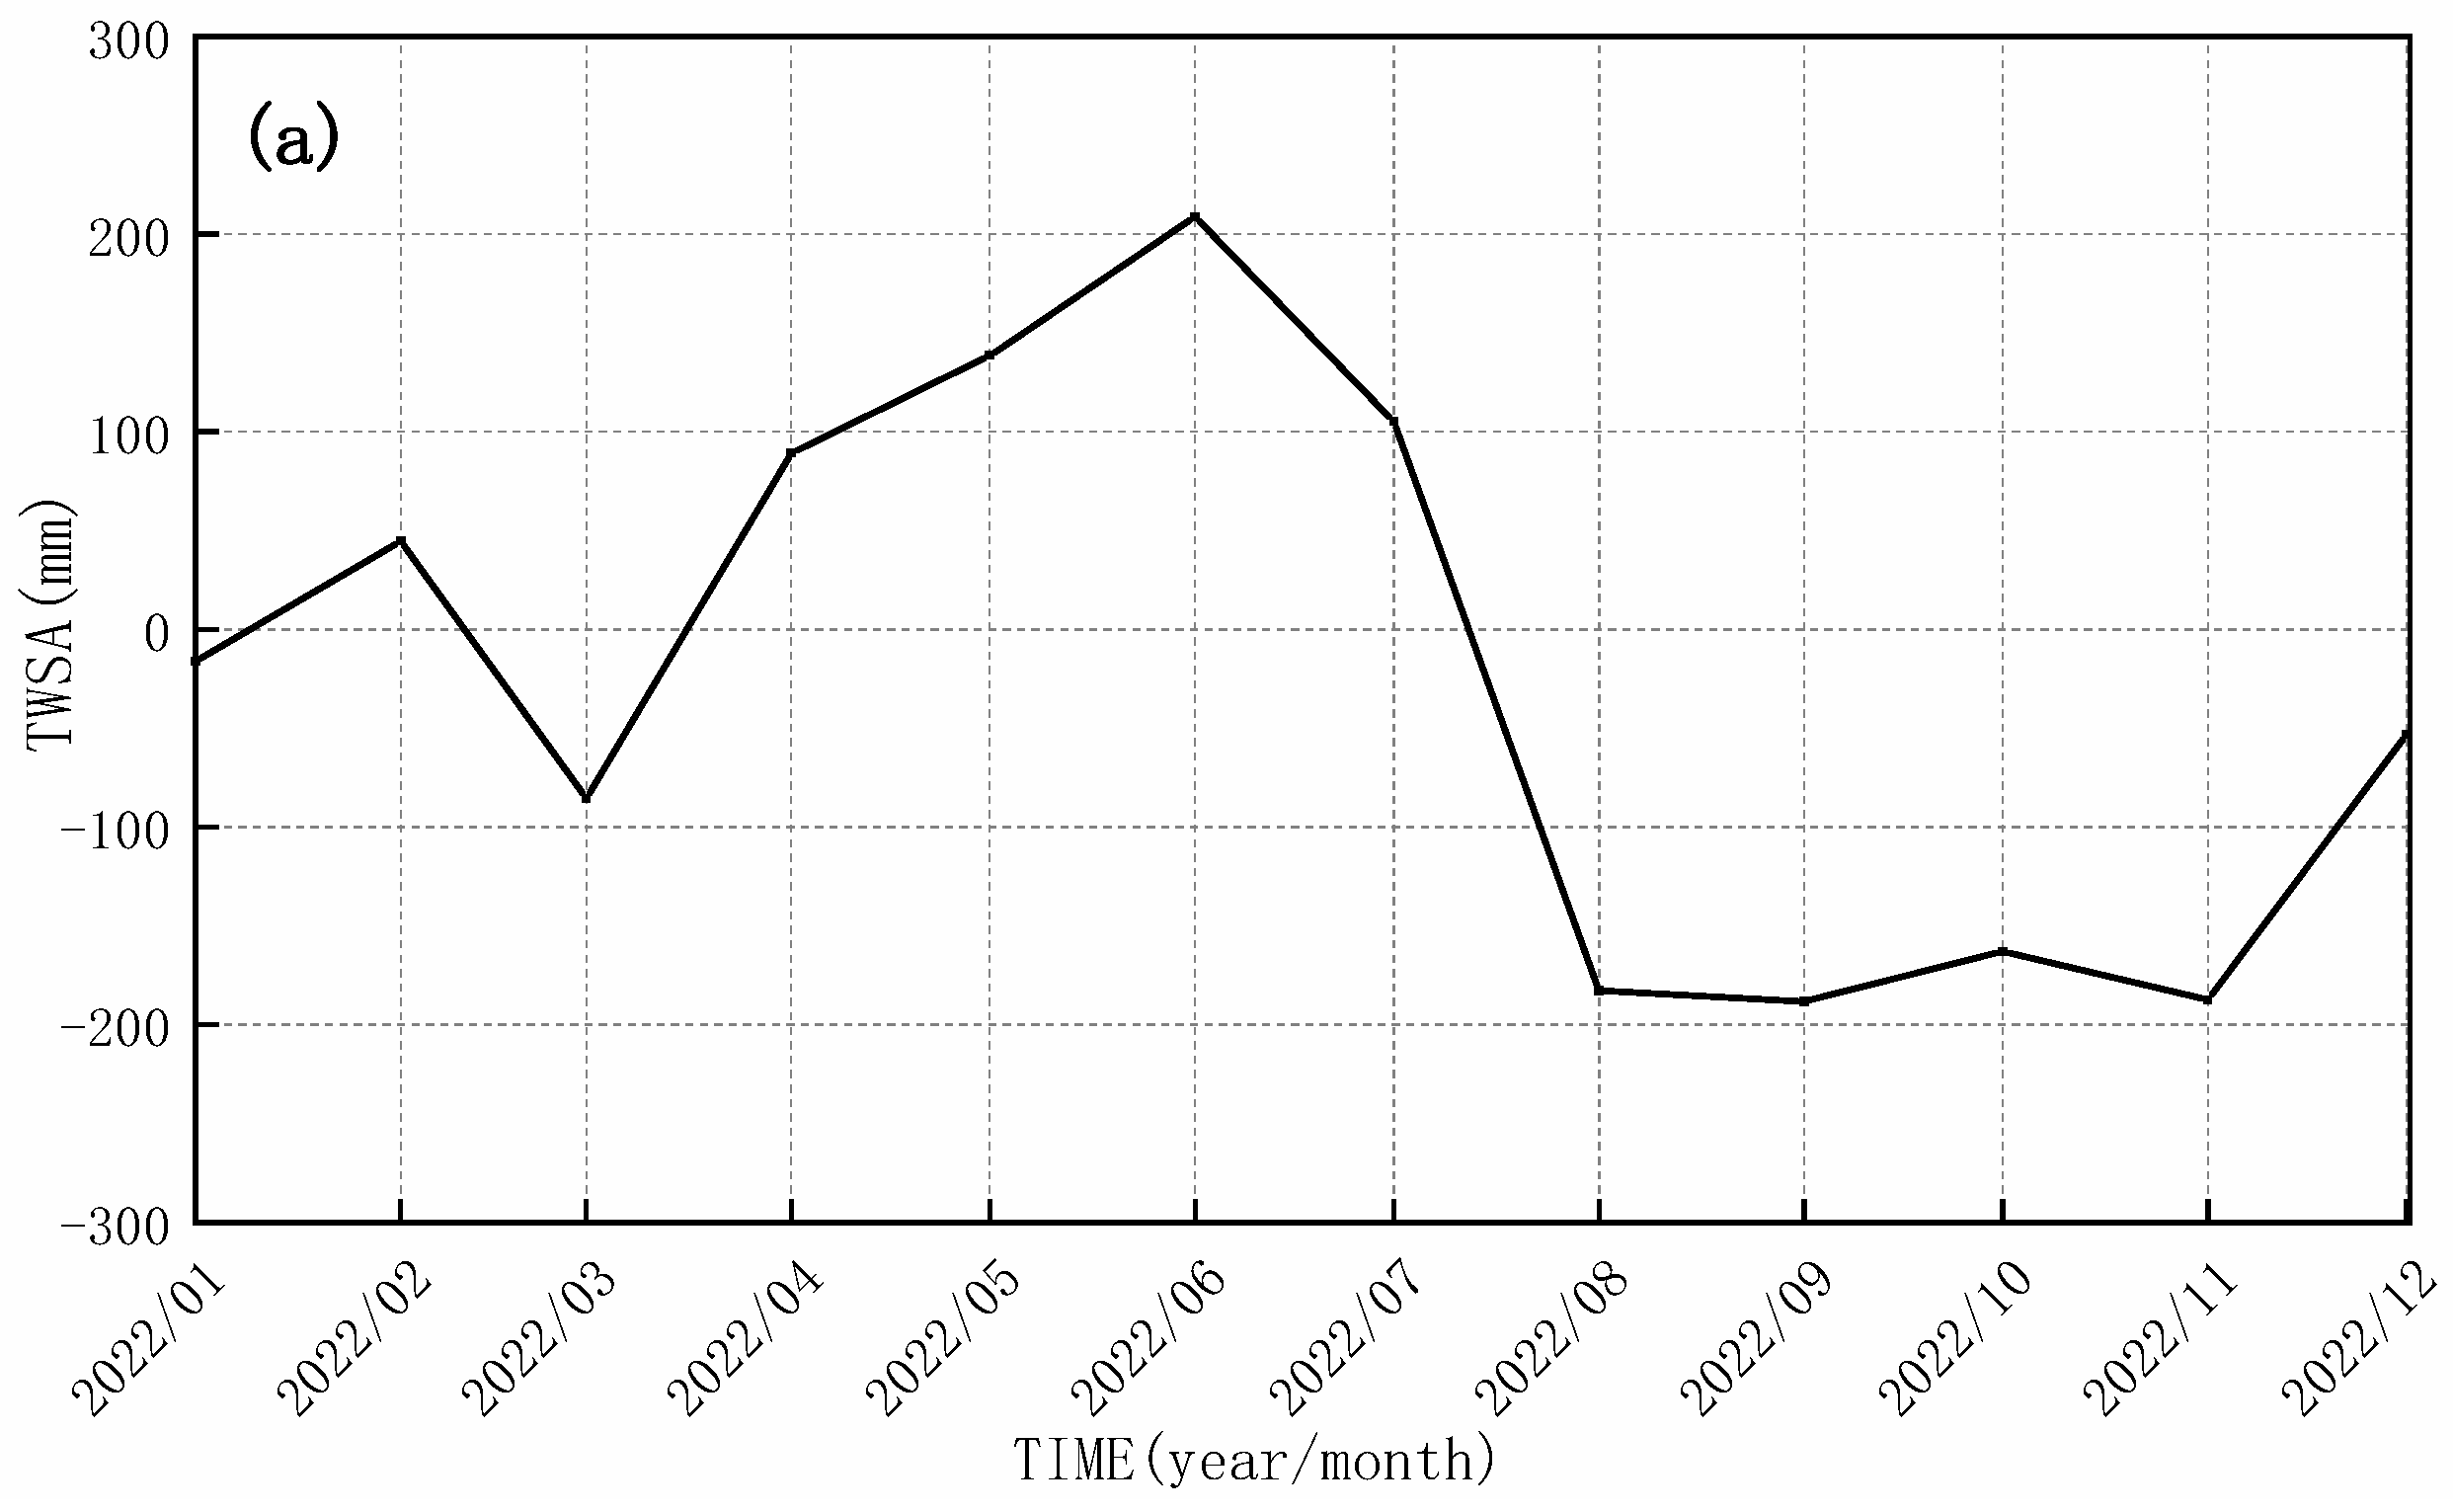
3.1. Analyses Based on Terrestrial Water Storage Anomalies

The spatial distributions of changes in terrestrial water reserves in the Yangtze River basin are shown in Figure 2. Due to the long period of high temperature and low rainfall, a rare drought occurred in the Yangtze River Basin, and the terrestrial water storage negative was unusually sharp in most areas of the basin.
Since May, the Yangtze River Basin shows a more serious deficit of terrestrial water storage in the upstream region, and the middle and lower reaches of the basin show positive changes in terrestrial water storage extending from the center outwards. In June 2022, the deficit of terrestrial water storage in the upstream region of the Yangtze River Basin decreases, and most of the areas in the middle reaches of the basin show positive changes in terrestrial water storage. In July 2022, negative anomalies in terrestrial water storage in the Yangtze River Basin start to spread from the upstream to the middle reaches, and the negative anomalies in terrestrial water storage spread from the upstream to the middle reaches of the basin, and the negative anomalies are more severe. In July 2022, the negative anomalies in land water reserves began to spread from the upstream to the middle reaches, and the positive change in land water reserves began to migrate from the middle reaches to the downstream, and the area of positive change in land water reserves continued to decrease. Since August 2022, the Yangtze River Basin shows a large area of negative terrestrial water storage anomalies, with the most serious negative anomalies in the southern part of Anhui Province and the northern part of Jiangxi Province, and the negative terrestrial water storage anomalies begin to spread to the eastern part of Hunan Province in September, and the negative terrestrial water storage anomalies (−200 – −100 mm) expand to the largest area in October, which accounts for 38.67% of the total area of the Yangtze River Basin. In November and December 2022, the Yangtze River Basin still shows a large area of negative anomalies in terrestrial water storage, with the most serious areas of negative anomalies migrating from Jiangxi and Hunan to the whole of Hunan.
The Central Weather Bureau lifted the meteorological drought warning for the Yangtze River Basin in mid-November 2022, but the hydrological drought continued. Since the main recharge source of terrestrial water storage in the Yangtze River Basin is precipitation, it is expected that the terrestrial water storage in the Yangtze River Basin would return to the normal level under the abundant precipitation in the rainy season of 2023 and the hydrological drought is expected to be lifted within this period.
This study compared the time series of terrestrial water storage change in the Yangtze River Basin in 2022 (TWSA_2022) with the mean value of perennial terrestrial water storage change (TWSA_monthly_ave), as shown in Figure 3, Figure 4 and Figure 5. From the figure, we can ascertain that in 2022, the overall terrestrial water storage change in the Yangtze River Basin is higher than the perennial terrestrial water storage change from January, and the average is higher than the mean value of 33.47 mm from January to June; however, the change in terrestrial water storage in the Yangtze River Basin began to show a decreasing trend from June 2022, and the decrease was the largest in July; terrestrial water storage and the average is lower than the mean value of 48.17 mm from July to December. The point at which changes in terrestrial water storage began to fall below the normal year average coincided with the onset of a drought event, suggesting that changes in terrestrial water storage allow for immediate monitoring of drought events.
Changes in terrestrial water storage of large lakes in the Yangtze River Basin in 2022 are shown in Figure 4; from left to right are Poyang Lake, Dongting Lake, and Taihu Lake, respectively. Due to the long time high temperature and low rainfall, the water level of most rivers and lakes in the Yangtze River Basin continues to shrink. For Poyang Lake and Dongting Lake located in the inland area, the trend of the change in the terrestrial water storage is similar; the change in the terrestrial water storage from January to March is small, and the change in the terrestrial water storage from April to July shows positive change in the terrestrial water storage, due to the rare long period of high temperature and low rainfall in the Yangtze River Basin. The terrestrial water storage shows a negative anomaly, with a negative anomaly value of around −100 mm. On the contrary, Taihu Lake showed positive changes in terrestrial water storage in most months due to its coastal location, and negative anomalies in terrestrial water storage occurred only in October and November due to the dry climate.

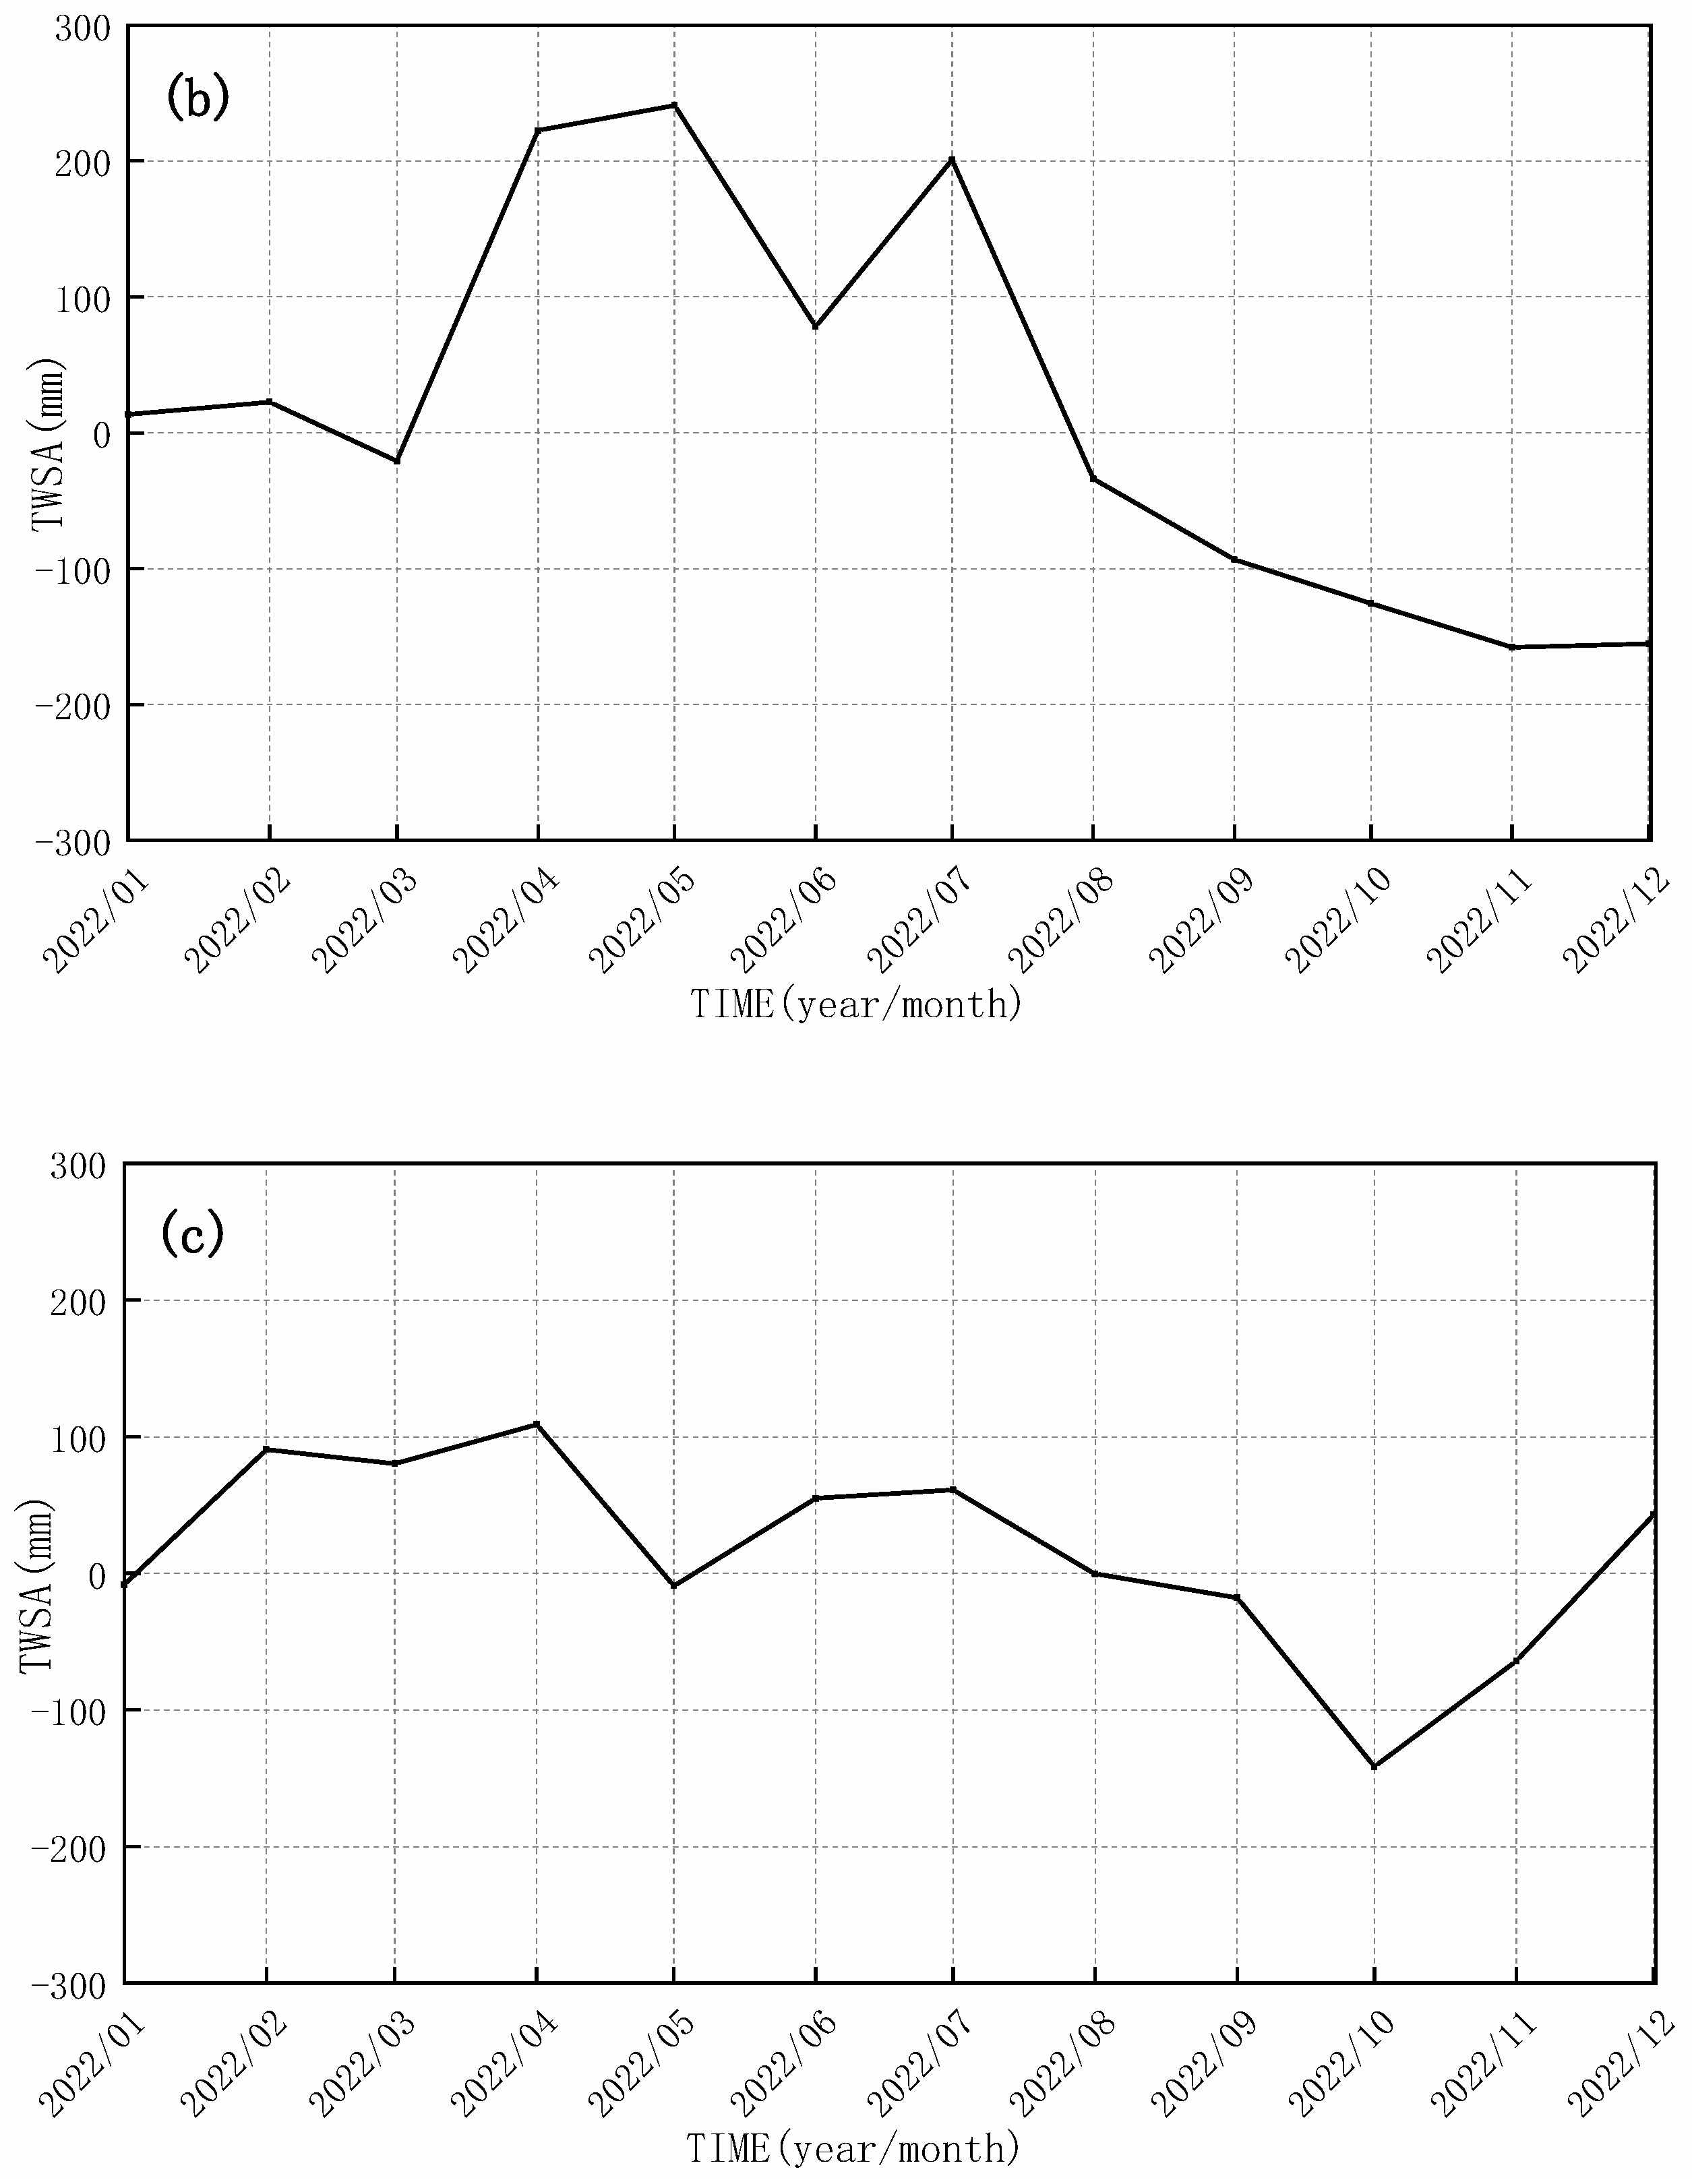
3.2. Analyses Based on Changes in Abnormal Soil Moisture

The spatial distribution of abnormal soil moisture in the Yangtze River basin is shown in Figure 5. Due to the persistent high temperature and low precipitation in the Yangtze River Basin in 2022, the soil water content showed an overall low trend, and different regions in the Yangtze River Basin showed different degrees of negative anomalies.
In May, June, and July 2022, except for the southern Sichuan and northern Yunnan regions in May, the soil water content of the entire Yangtze River Basin showed a positive trend, and from August onwards, a large area of negative anomalies began to appear in the Yangtze River Basin, and the negative anomalies were especially obvious in the middle and lower Yangtze River Basin. In August, the negative soil water content in the Yangtze River basin began to show a large area of negative anomalies, and the negative anomalies in the middle and lower reaches of the Yangtze River basin were especially obvious; with the passage of time, the negative soil water content in the middle and lower reaches of the Yangtze River basin worsened, and the negative anomalies in the area continued to expand, and reached the maximum of negative anomalies in October, with the negative anomalies in the area accounting for 15.33% of the total area. The area of the maximum of negative anomalies in the middle and lower reaches of the Yangtze River basin was in the middle and lower reaches of the Yangtze River. In November and December, although the negative anomaly of soil water content was reduced, it still showed a large area of negative anomaly in the middle and lower reaches of the Yangtze River, and most of the areas were between −200 and 50 mm.
The above analysis leads to the conclusion that the most severely affected region in the Yangtze River basin due to soil water content changes in 2022 is Jiangxi Province. The long-term negative anomalous soil water content has a great impact on the agricultural production in the middle and lower reaches of the Yangtze River plain.

3.3. Relative Soil Moisture Analysis

The study used the relative soil moisture (0–20 cm) product provided by the CLDAS to classify the Yangtze River Basin drought class in 2022 based on the relative soil moisture drought class classification table. The study divided the Yangtze River basin drought class every 10 days, and the spatial distribution of the Yangtze River basin drought class in 2022 is shown in Figure 6. As the upper Yangtze River region is affected by the temperature, the water content is low in winter and the relative humidity of the soil is low, thus showing the extreme drought. The extreme drought phenomenon in the Yangtze River Basin mainly started in late August, when the middle and lower reaches of the region began to show a large area of different degrees of drought. Due to the long period of high temperature and low rainfall, the drought reached its most extreme situation in middle and late September, and the regions such as Jiangxi and Hunan showed a situation of extreme drought. As can be seen from the figure, the relative humidity of the soil in the entire Yangtze River basin was at a high level from late November onwards, and the drought conditions slowed down.

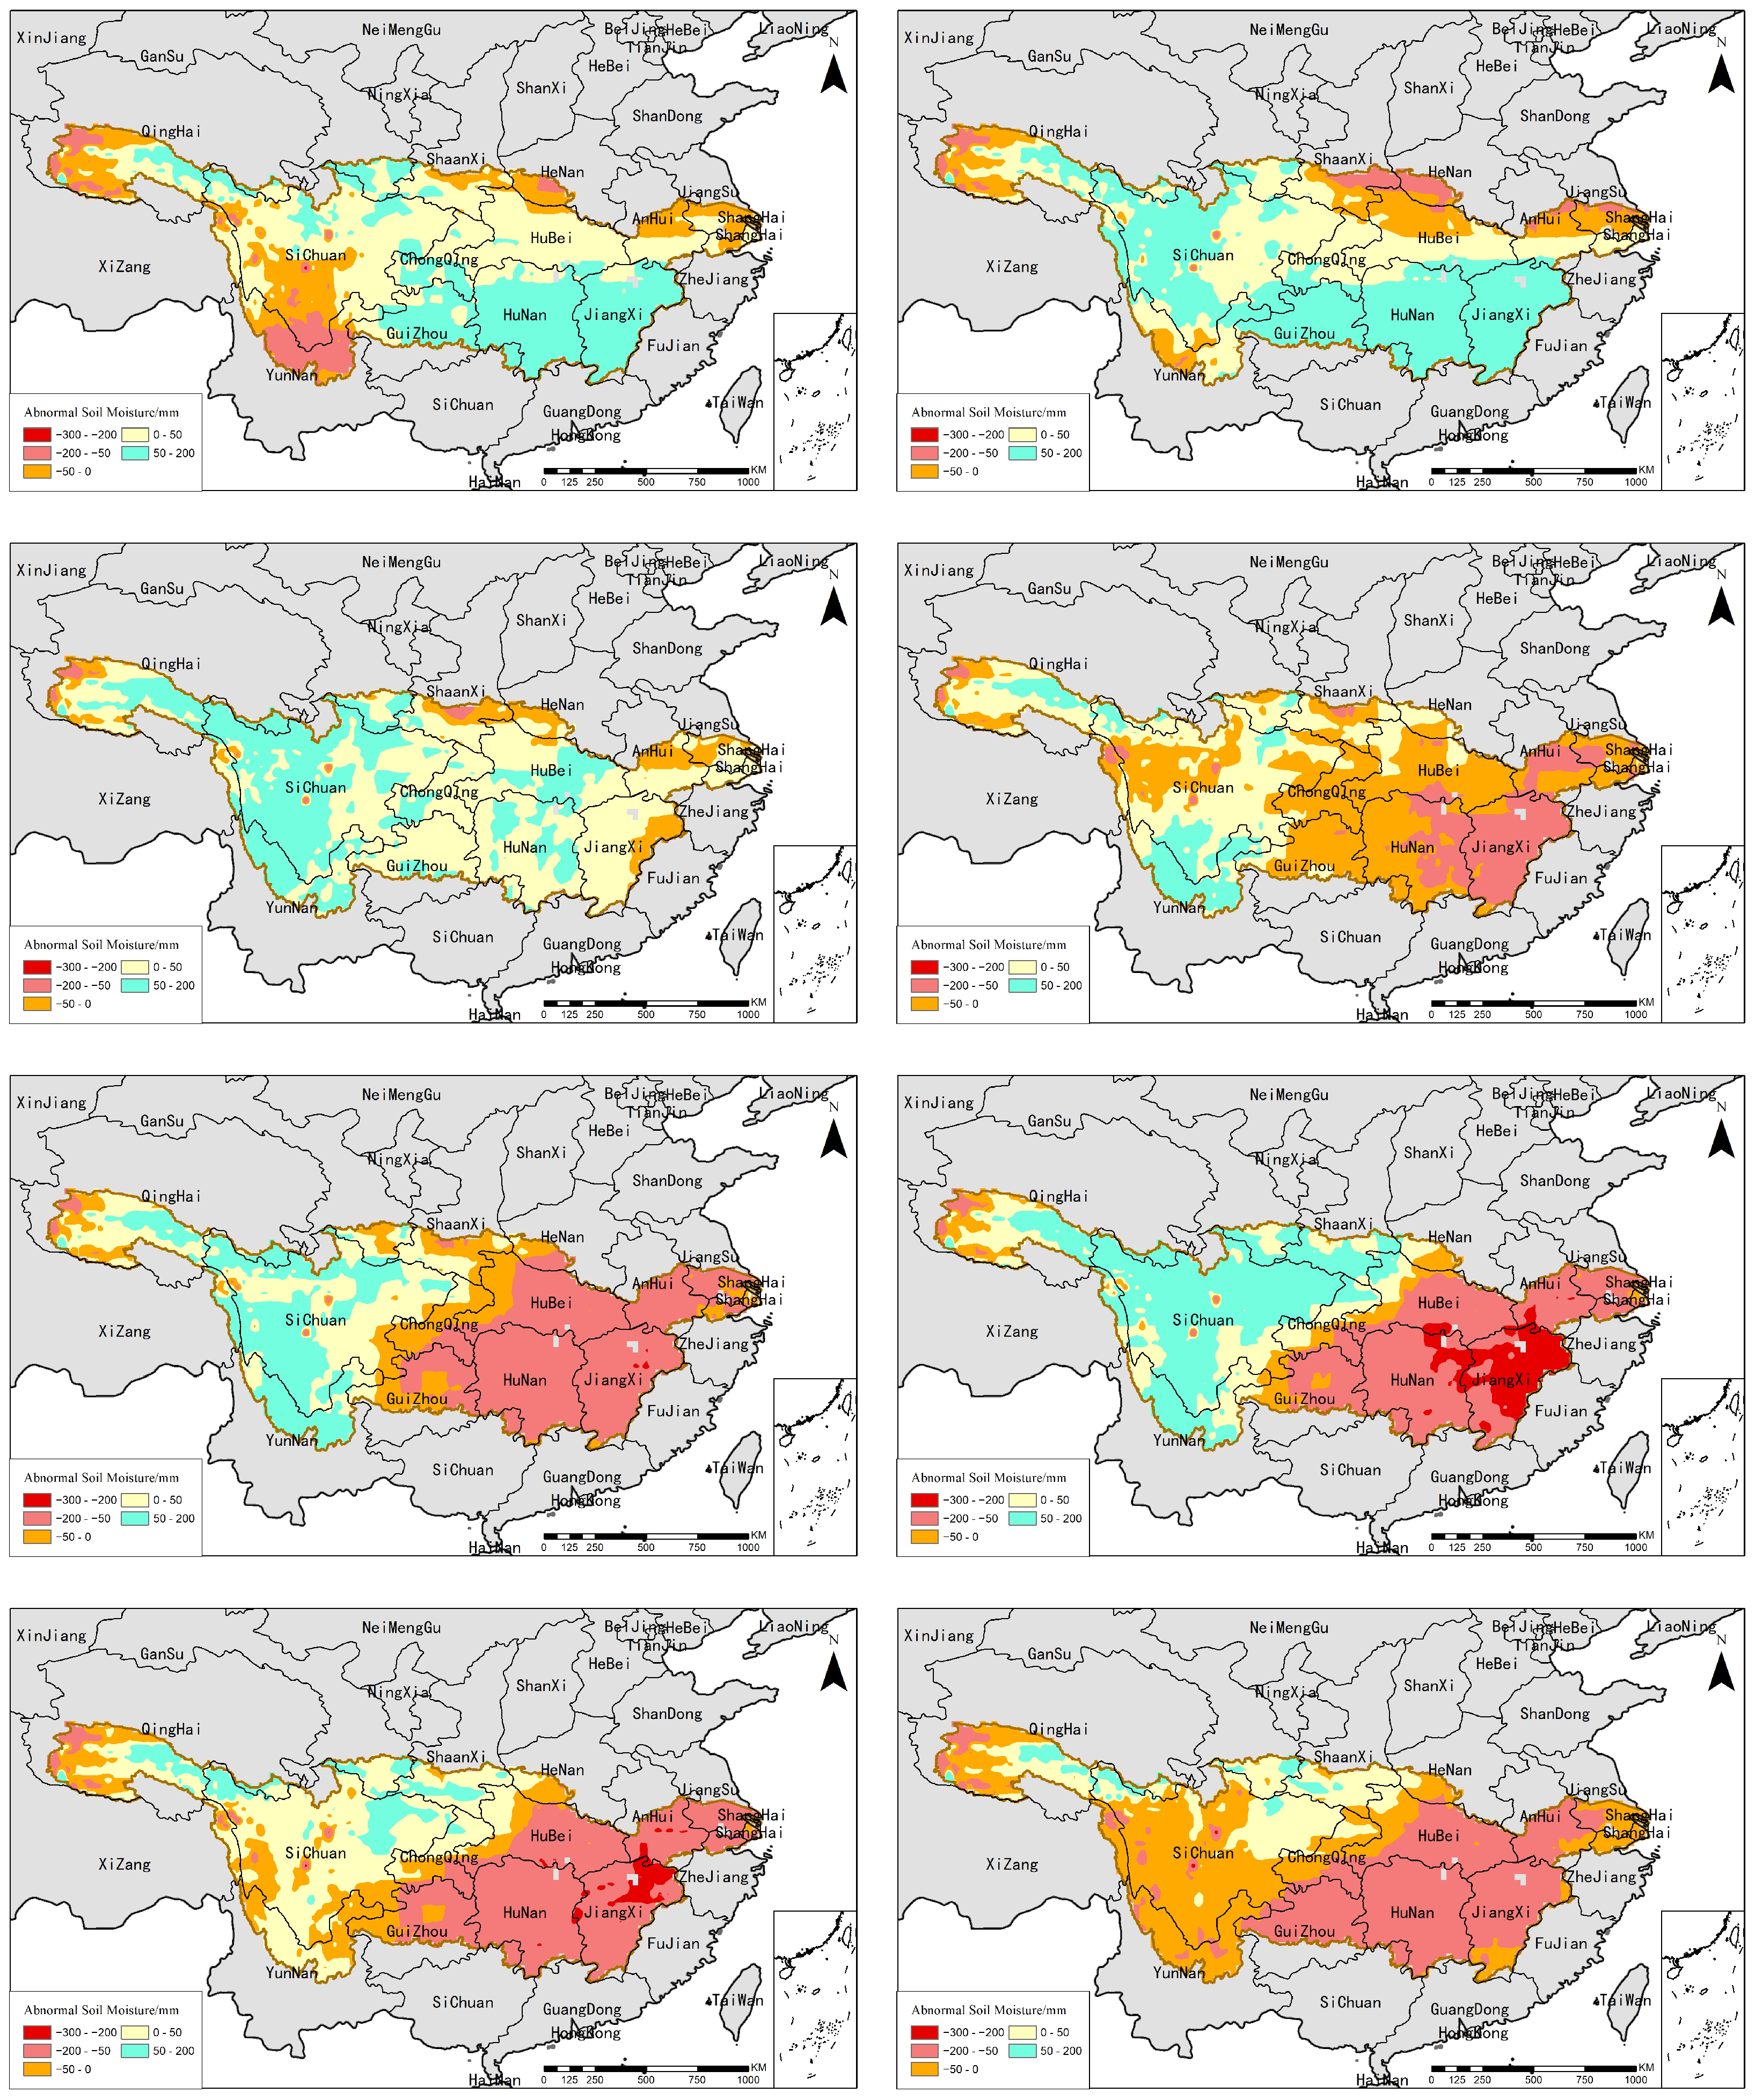
3.4. Analysis Based on Drought Indices

In this study, the GRACE Drought Intensity Index (GRACE-DSI) was calculated based on the terrestrial water storage change data provided by GRACE, as shown in Figure 7. During the pre-drought event (5–7) months, the GRACE-DSI shows slight drought in the west and no drought in the east due to the monsoon climate along the eastern coast, while the west resides inland and receives less precipitation. From August onwards, due to the persistent high temperature and low rainfall in the east and the precipitation in the west from September onwards, the Yangtze River Basin began to show a sharp increase in drought climate in the east and no drought in the west. As can be seen from the figure, Jiangxi Province is the most serious drought event in the region, from the mild drought in August gradually evolving into the province’s moderate, severe, and even extreme drought. In October, due to the rainfall factor, the Yangtze River Basin in the eastern part of the drought situation was alleviated, but with the depth of time, the drought situation is still not to be underestimated, and the area of serious drought is gradually migrating from Jiangxi Province to Hunan Province; moreover, the degree of drought is only increasing. The severity of the drought is gradually migrating from Jiangxi Province to Hunan Province, and the degree of drought is only increasing.
Figure 8 shows the time series comparison of the change in the area share of different degrees of drought in the Yangtze River Basin from May to December 2022, with the anomalies of terrestrial water storage in the same period. From the figure, it can be seen that the drought starts to expand widely from July, and the area share of extreme drought is the largest in September, which is about 85.69 km2. At the same time, the change curve of terrestrial water storage anomaly declined precipitously in July and was at a low level in the time that followed, which was consistent with the change in drought area. Over time, most of the Yangtze River Basin is still in drought, but the drought degree eased, while the change in terrestrial water storage is still in decline, probably because the drought condition eased due to the perceived interference and the weather, while the terrestrial water did not become sufficiently replenished.
To verify the ability of the GRACE-DSI over other drought indices to monitor drought conditions, this study compared the GRACE-DSI, SPI, and SPEI03 for the two most severe months of drought conditions in this drought event, as shown in Figure 9. As can be seen from the figure, both the GRACE-DSI and SPEI03 showed lower drought indicators in the middle and lower reaches in September and October, while the SPI showed lower drought indicators for the whole basin, indicating that the GRACE-DSI and SPEI03 are more consistent in their ability to monitor drought. This is mainly due to the fact that the calculation of the SPI only uses precipitation data, while the calculation of the SPEI has more evapotranspiration data, and at the same time, the GRACE data include both precipitation and evapotranspiration factors. This divergence underscores the heightened sensitivity of the extreme 2022 drought in the Yangtze River Basin to short-term precipitation and evapotranspiration.
Table 2 shows the correlation analysis of the GRACE-DSI with meteorological drought indices for May–December 2022 for different time spans. As shown in the table, the correlation between the GRACE-DSI and meteorological drought indices with different time spans shows different strengths, and the GRACE-DSI has the best correlation with the SPEI6, and the correlation with other meteorological drought indices is above 0.75, which may be due to the fact that the SPEI is based on the calculation of potential evapotranspiration and precipitation data, whereas changes in the terrestrial water storage not only include potential evapotranspiration and precipitation data involvement, but also runoff, infiltration, and other influencing factors. In terms of the overall presentation of the degree of drought and the beginning and end of drought events, both the GRACE-DSI and SPEI with different time spans can be better described on the surface.
Figure 10 shows the time series changes of the GRACE-DSI and SPEI with different time spans, from which it can be seen that the GRACE drought intensity index has consistent changes with the different SPEIs, which can better describe the beginning of drought occurrence. The indices began to decline from June, and all indices were below 0 in August, which was consistent with the point in time when widespread drought appeared in the Yangtze River Basin. As time advances, the GRACE-DSI reached its lowest value in September, and the other drought indices showed a fluctuating trend, which shows that the GRACE-DSI is better able to monitor the severity of the drought event.
Figure 11 shows the time series of terrestrial water storage changes in secondary basins of the Yangtze River Basin from May to December 2022 with the GRACE-DSI. From the figure, it can be seen that from May to December 2022, some secondary basins in the upper and middle reaches of the Yangtze River Basin show a more gently declining trend in the change in terrestrial water storage, including the Jinsha River Basin and MinTuo River Basin, while the middle and lower reaches generally show a trend of a sharp decline in the change in terrestrial water storage, including the Wujiang River Basin, Poyang Lake System, Dongting Lake System, and the main streams below the Hukou. Meanwhile, the GRACE-DSI is consistent with the trend of terrestrial water storage change. Among them, the secondary basin with the largest negative change in terrestrial water reserves is the Poyang Lake Basin, with a change value of −139.22 mm.

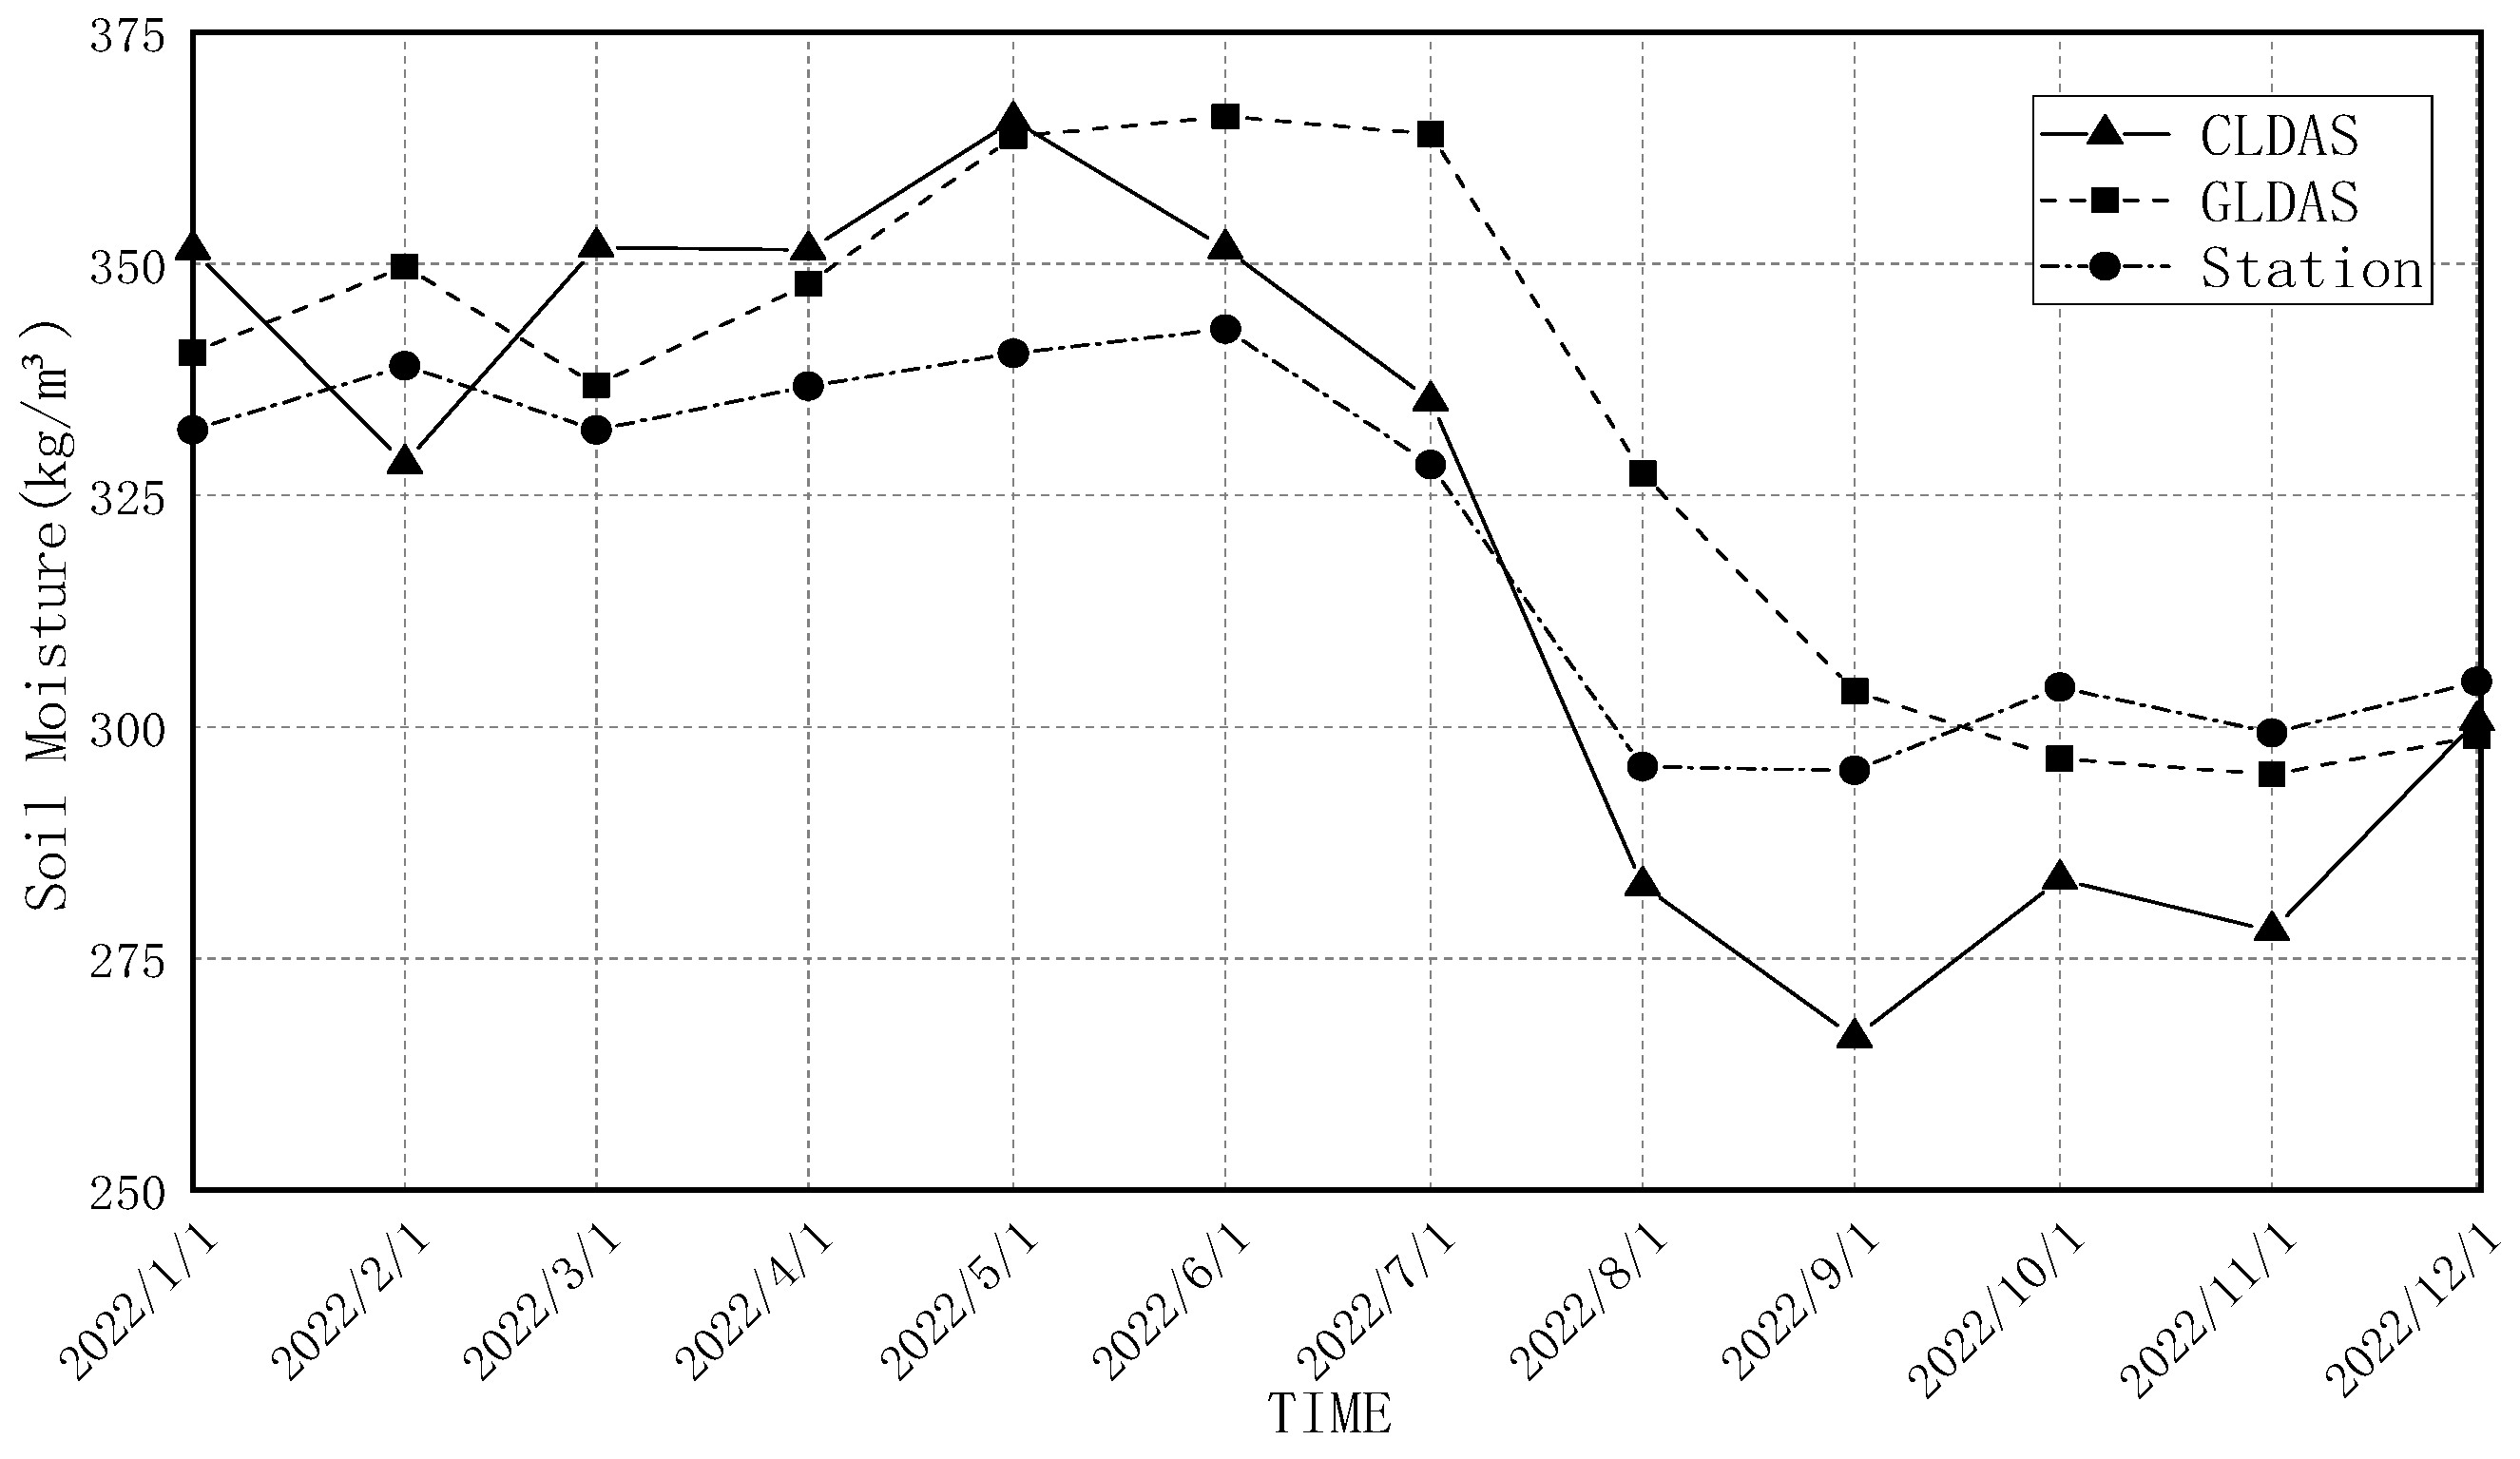
3.5. Comparative Analysis of Soil Moisture Products and Validation of Measured Site Data

Figure 12 shows the monthly average changes in the GLDAS and CLDAS soil moisture products in the Yangtze River Basin from May to December 2022. The GLDAS soil moisture is generally higher than that of the CLDAS soil moisture because of the different ways of measuring and calculating between the products. From May to July, the monthly average changes in soil moisture are relatively smooth, but it starts to show a decreasing trend in August, and the decrease becomes larger. The GLDAS soil moisture product starts to show a steady decrease in August, while the CLDAS product shows a downward, then upward, then downward and upward fluctuating trend due to the precipitation factor that occurred in October. Comparison of the GLDAS and CLDAS soil moisture shows that the drought event occurred in July.
Figure 13 shows the daily average change in volumetric water content (SVWC) in the measured site data within the Yangtze River Basin in 2022, and the monthly average change in the CLDAS and GLDAS soil water content data at the same site. From the figure, it was determined that the trend in volumetric water content in January–June 2022 is relatively smooth, about 270 mm. At the beginning of the month, the volumetric water content began to fall off a cliff and reached its lowest value of 208.12 mm in late August. In early September, the volumetric water content had a more moderate recovery, but was still at a low level. It is forecast to return to normal levels in the first half of 2023. This is in line with the trend in soil moisture content in the GLDAS and CLDAS described above.

4. Discussion

4.1. Difference between Meteorological and Hydrological Drought

The GRACE-DSI, as a drought index calculated based on gravity satellite data, has better correlation with the standardized precipitation index SPI and standardized precipitation evapotranspiration index SPEI, with correlation coefficients above 0.75, of which the highest correlation with the SPEI3 dataset is 0.93, which reflects the ability of the GRACE gravity satellite to describe extreme drought events more accurately.

4.2. Hydrological Variables’ Response to the Drought

Changes in total water consumption are strongly influenced by drought. Generally, during a drought event, precipitation decreases, while agricultural, industrial, and domestic water demands tend to remain constant or increase, resulting in a decrease in total water consumption. The hydrologic cycle is a very complex process that plays a critical role in drought events and includes multiple components (e.g., precipitation, evapotranspiration, infiltration, and runoff). During the 2022 drought event, the soil moisture (SM) decreased from July onwards across the Yangtze River Basin (Figure 9), which is consistent with the changes in the TWSA. Meanwhile, the study selected the relative soil moisture (RSM) variable in the CLDAS dataset to understand the spatial distribution of this drought situation on a decadal scale (Figure 5), and found that the RSM of the Yangtze River Basin showed a trend of drought from the second half of August, which was in line with the time of drought occurrence.

4.3. Assumptions and Limitations of Using GRACE in Different Parts of Yangtze Basin

In this study, the data selected are the CSR Mascon dataset, which has a spatial resolution of 0.25° × 0.25°. When sub-basin analyses are conducted for the Yangtze River Basin, the sub-basin area is large enough that it does not lead to a significant bias in the elaboration of the results. For more detailed watershed analyses, a downscaling approach is needed to improve the effectiveness of drought monitoring.

4.4. Possible Future Direction

In this study, only CSR Mascon data products were selected for drought monitoring, while there are many other GRACE-based terrestrial water storage anomaly products, and the ability of other data products to monitor drought hazards will be investigated through comparative studies in the future; meanwhile, only the GRACE-DSI was used as a drought monitoring index in the study, and more drought indices will be calculated in the future for comparative analyses.

5. Conclusions

In this study, based on the GRACE gravity satellite’s terrestrial water storage anomalies and its evolved GRACE-DSI and WSDI, combined with the soil water data provided by the GLDAS and two commonly used meteorological drought data indices, the SPI and SPEI, the most severe drought disaster in the Yangtze River Basin in the year 2022 was investigated, and the results of the study are as follows:
(1)
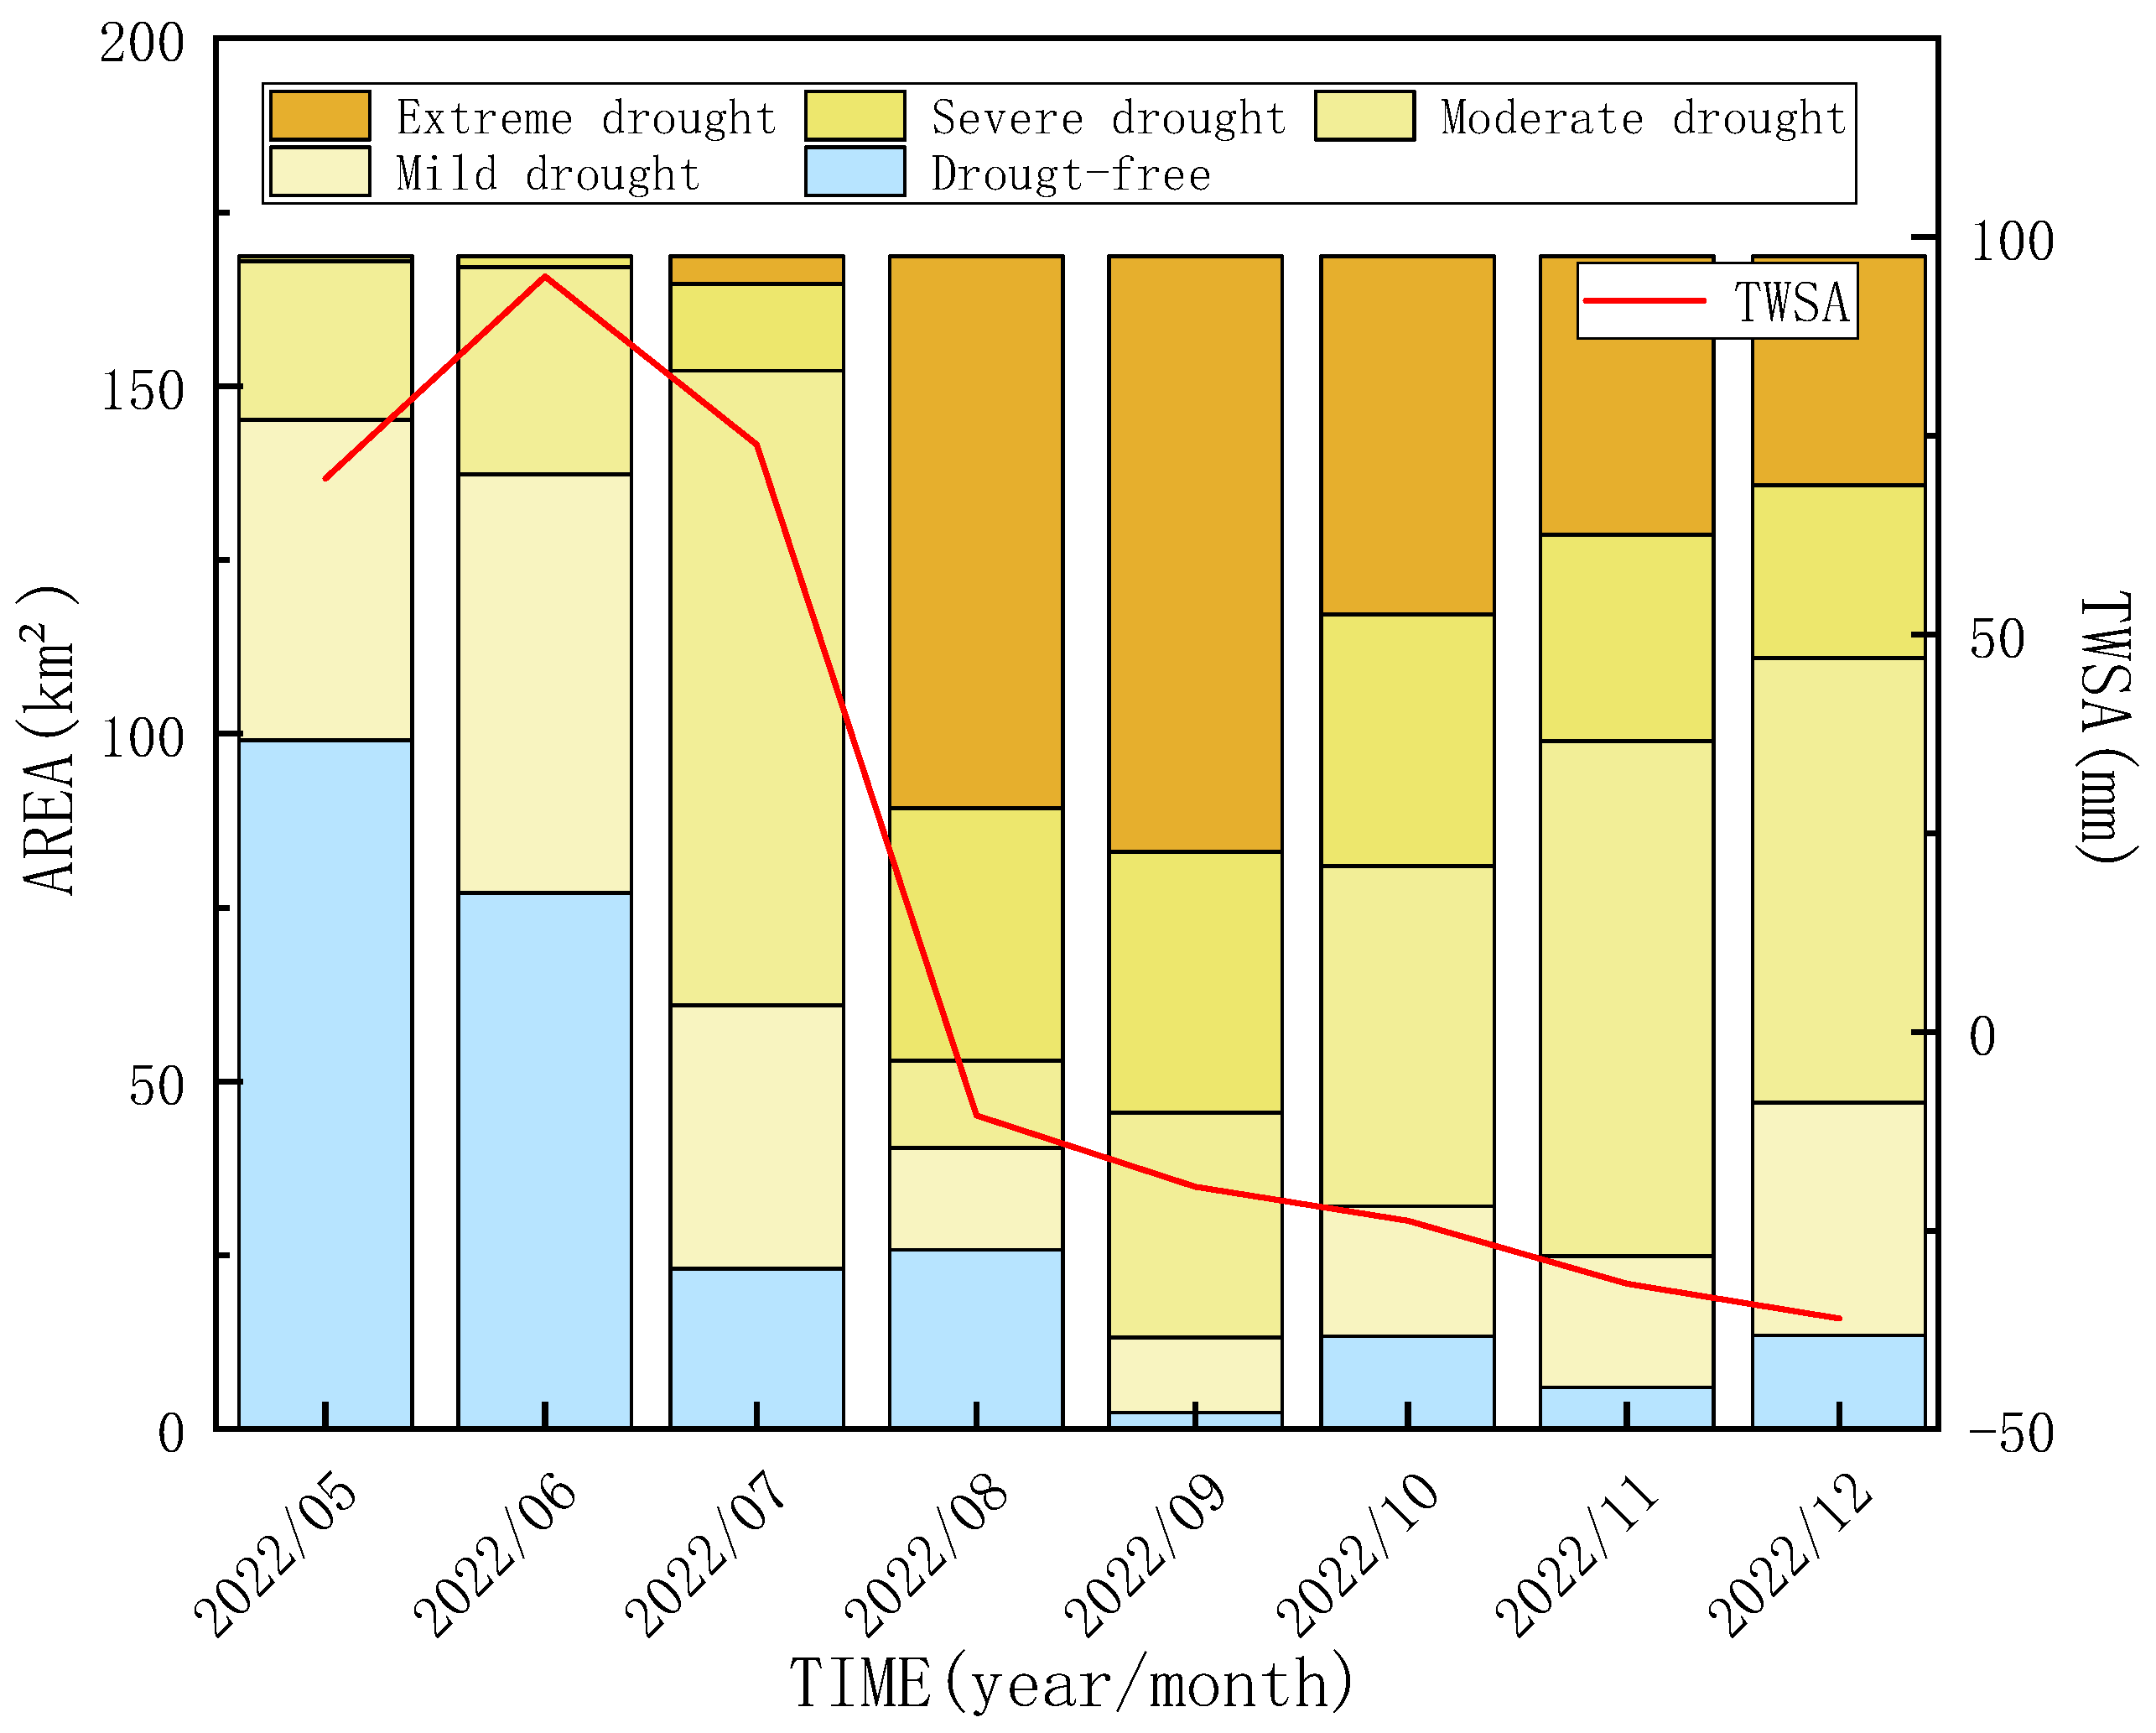
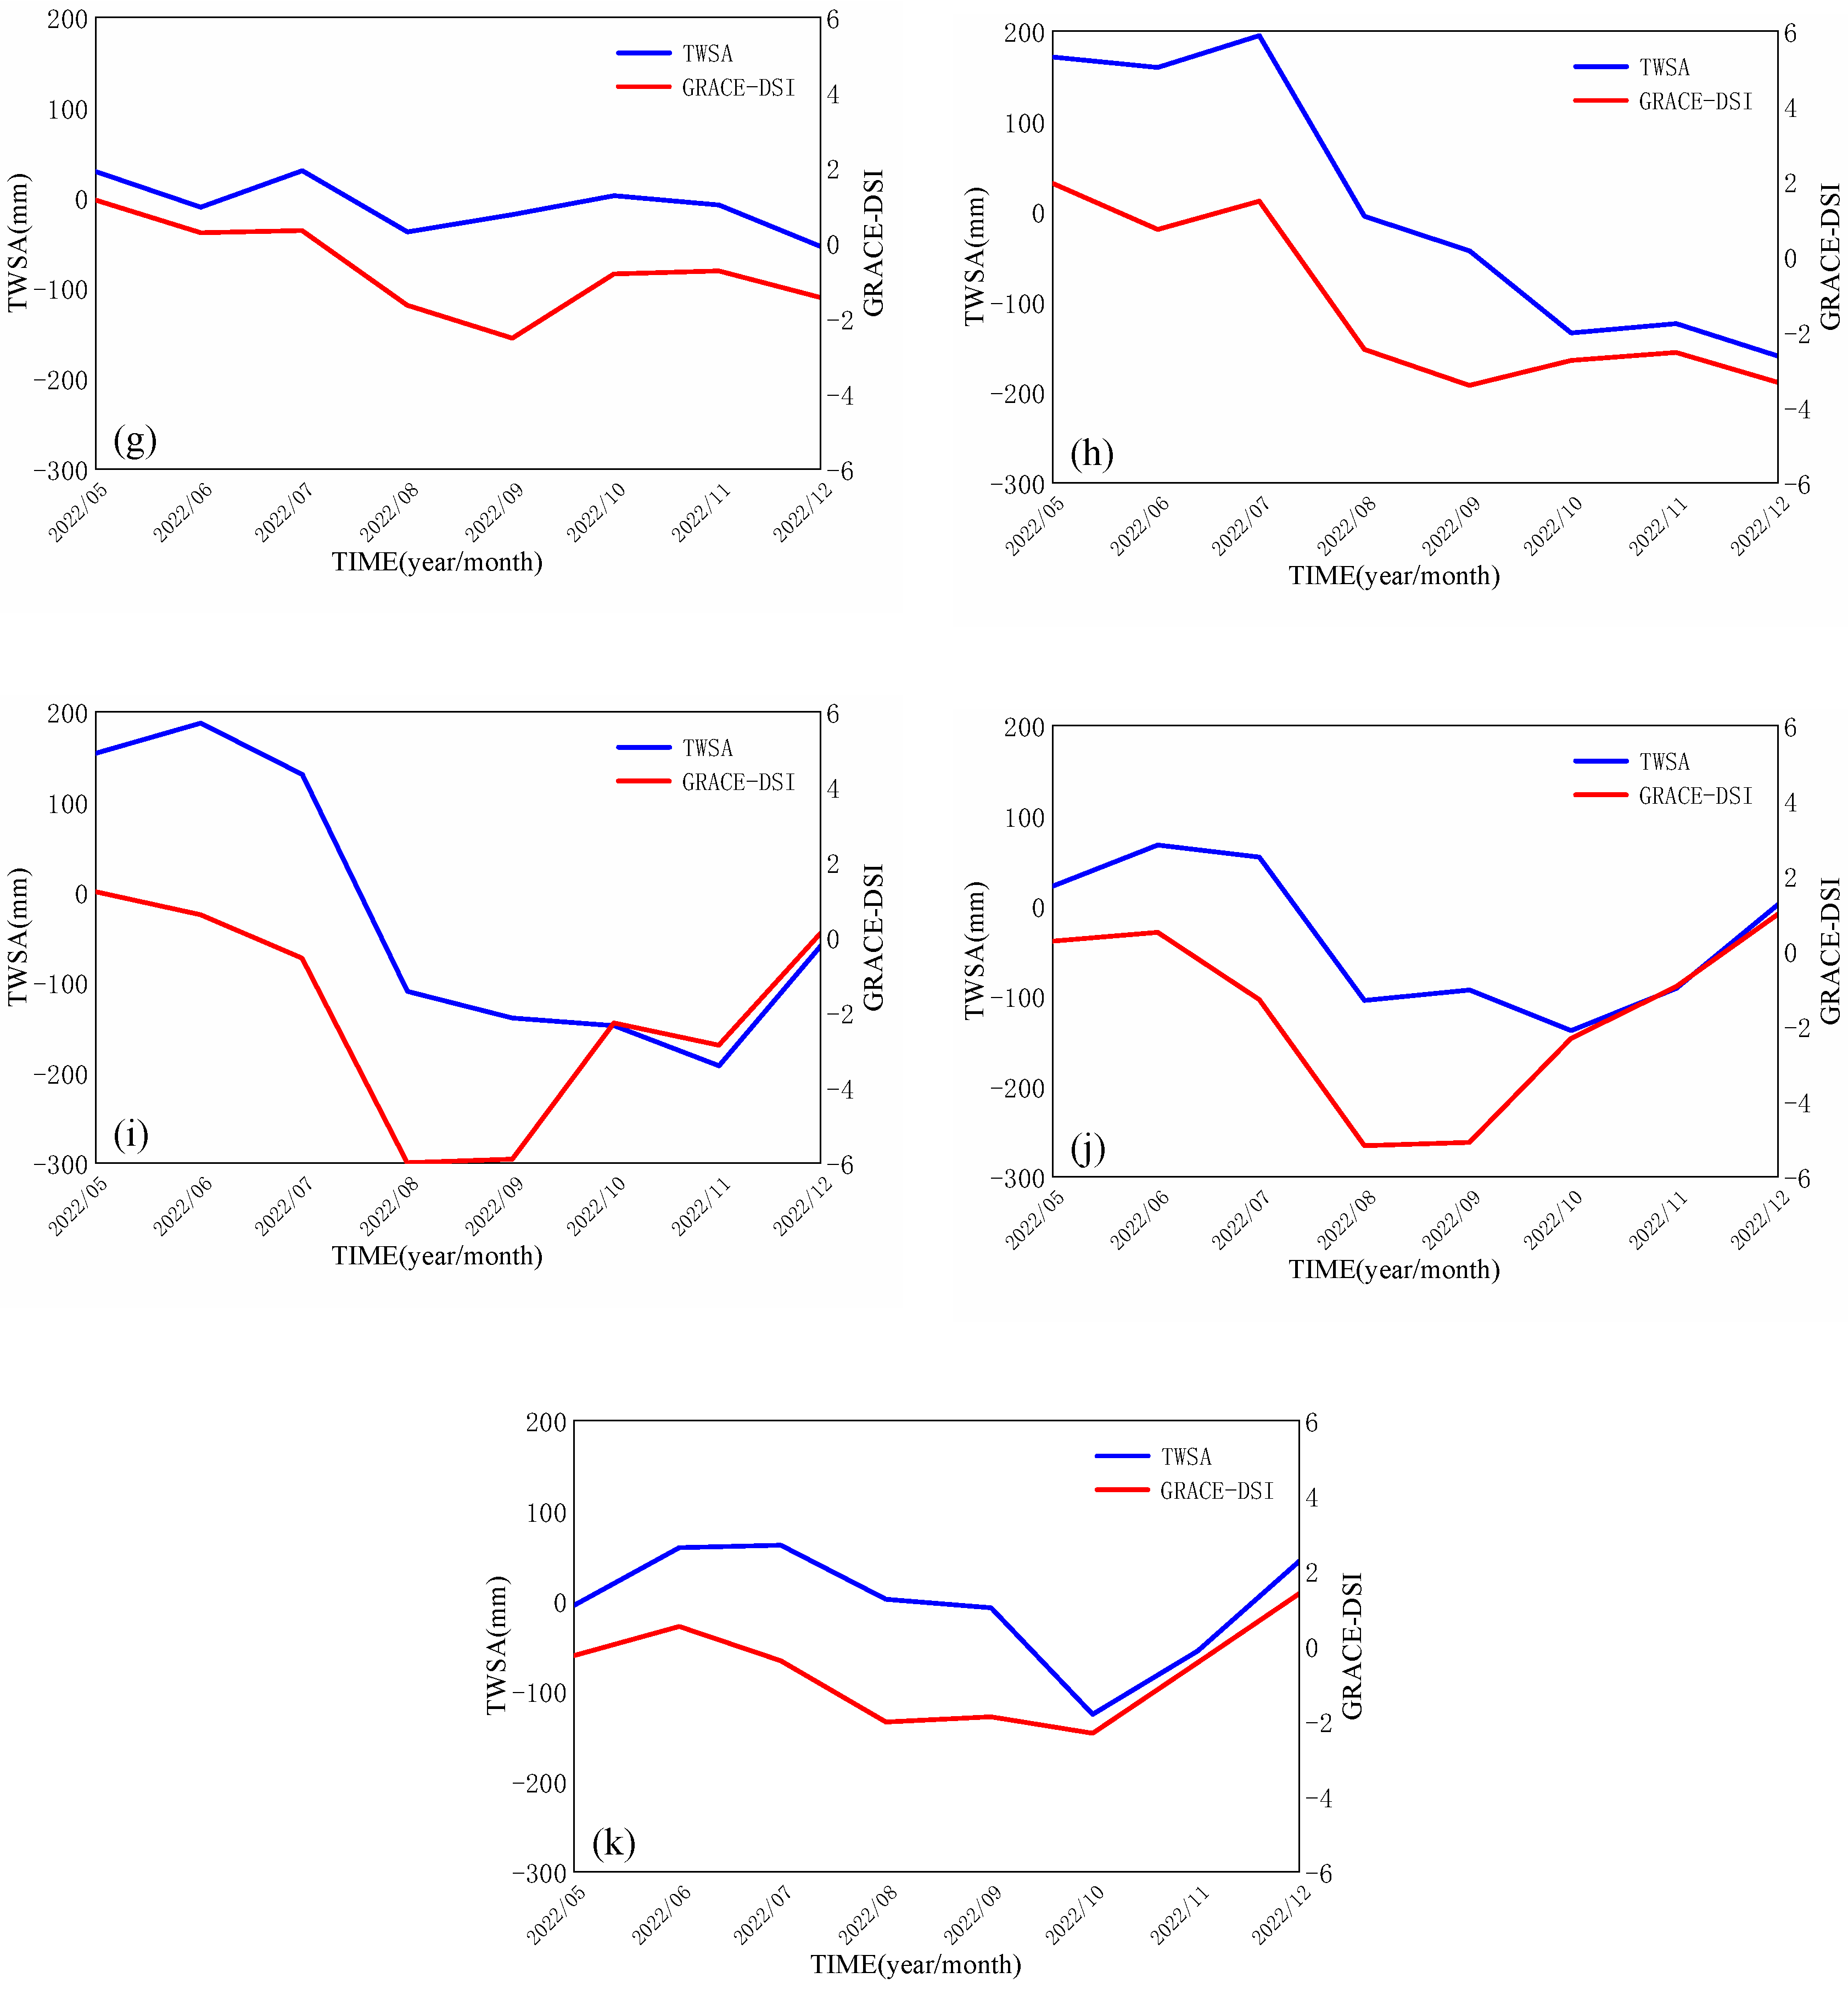
The terrestrial water storage change can well reflect the water storage change in the Yangtze River Basin. The overall trend of terrestrial water storage change in the middle and upper reaches of the Yangtze River Basin is smaller than the negative anomaly, while the negative anomaly in the middle and lower reaches of the Yangtze River Basin is larger, and the negative anomaly is larger in most areas of the Yangtze River Basin with the passage of time. The average change in terrestrial water storage in the Yangtze River Basin for the whole year was above the mean value of 33.47 mm in January–June and below the mean value of 48.17 mm in July–December.
(2)
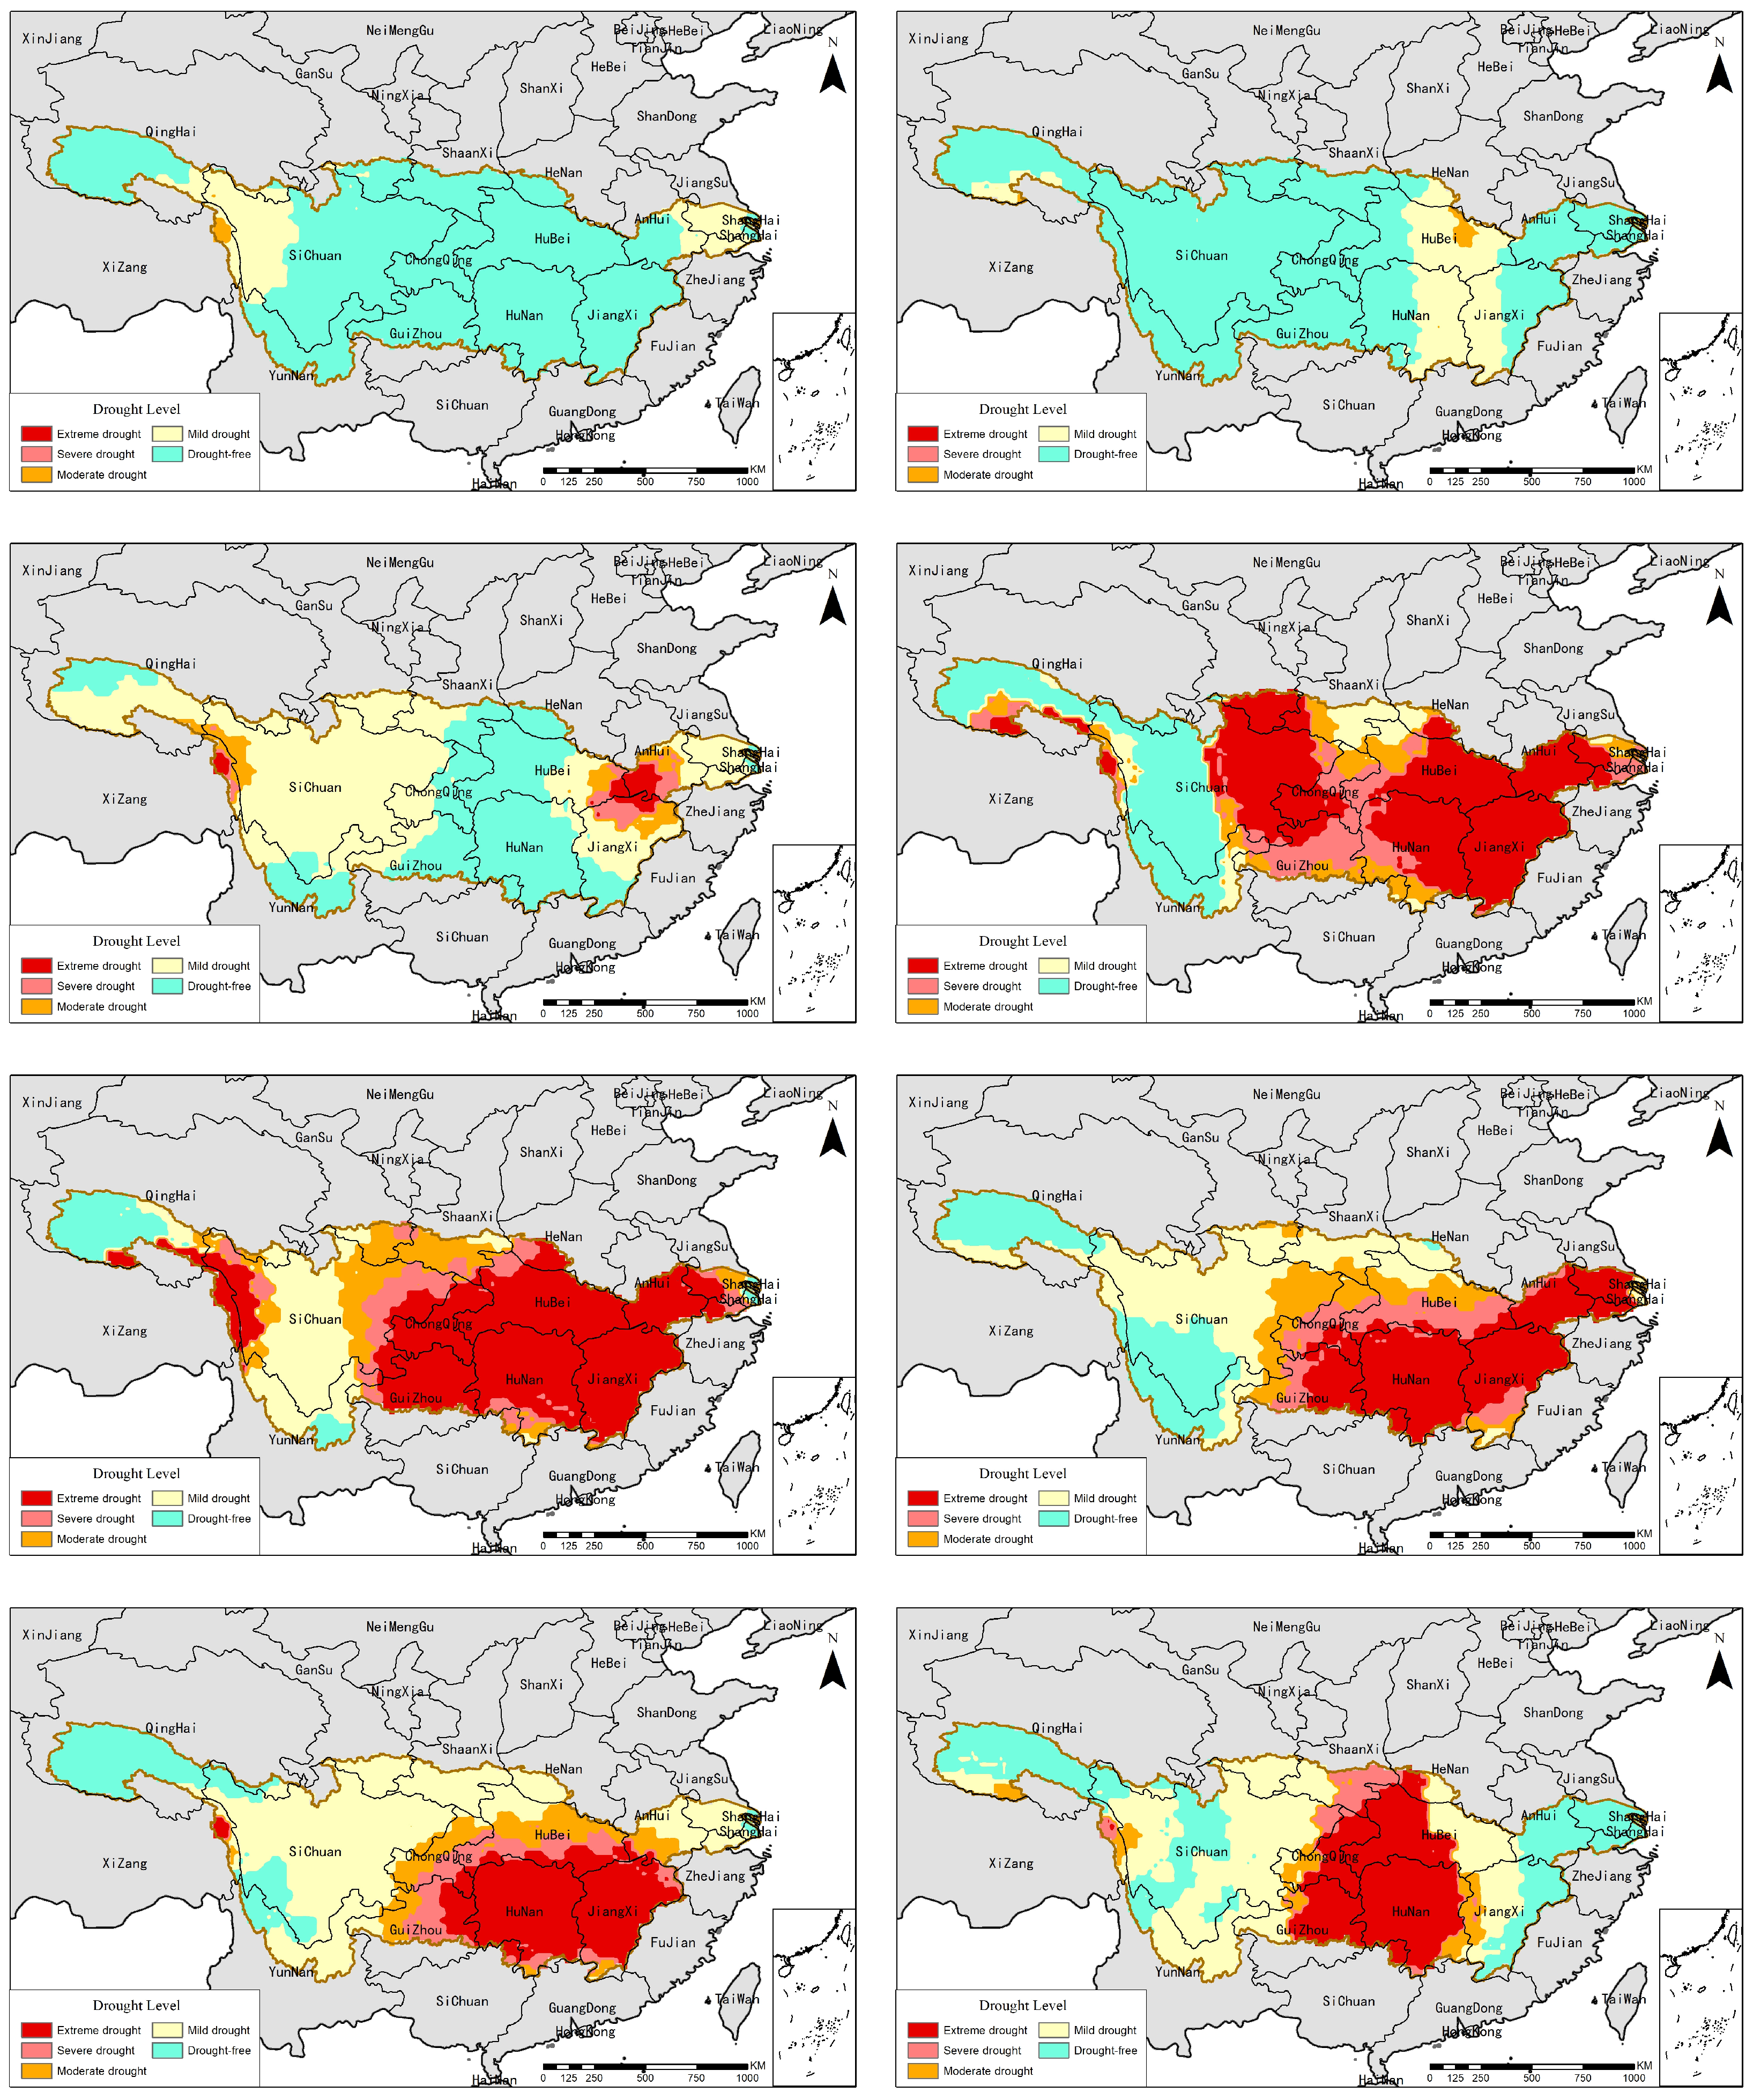
The GRACE-DSI well reflects the beginning and end of the 2022 mega-drought in the Yangtze River Basin, with the drought event gradually expanding from the northern part of Jiangxi Province in August, and the drought area expanding over time with increasing drought severity, and finally shifting to Hubei Province. The area of extreme drought of different levels in the Yangtze River Basin showed a trend of increasing and then decreasing, with the largest extreme drought area of 85.69 km2 in September.
(3)
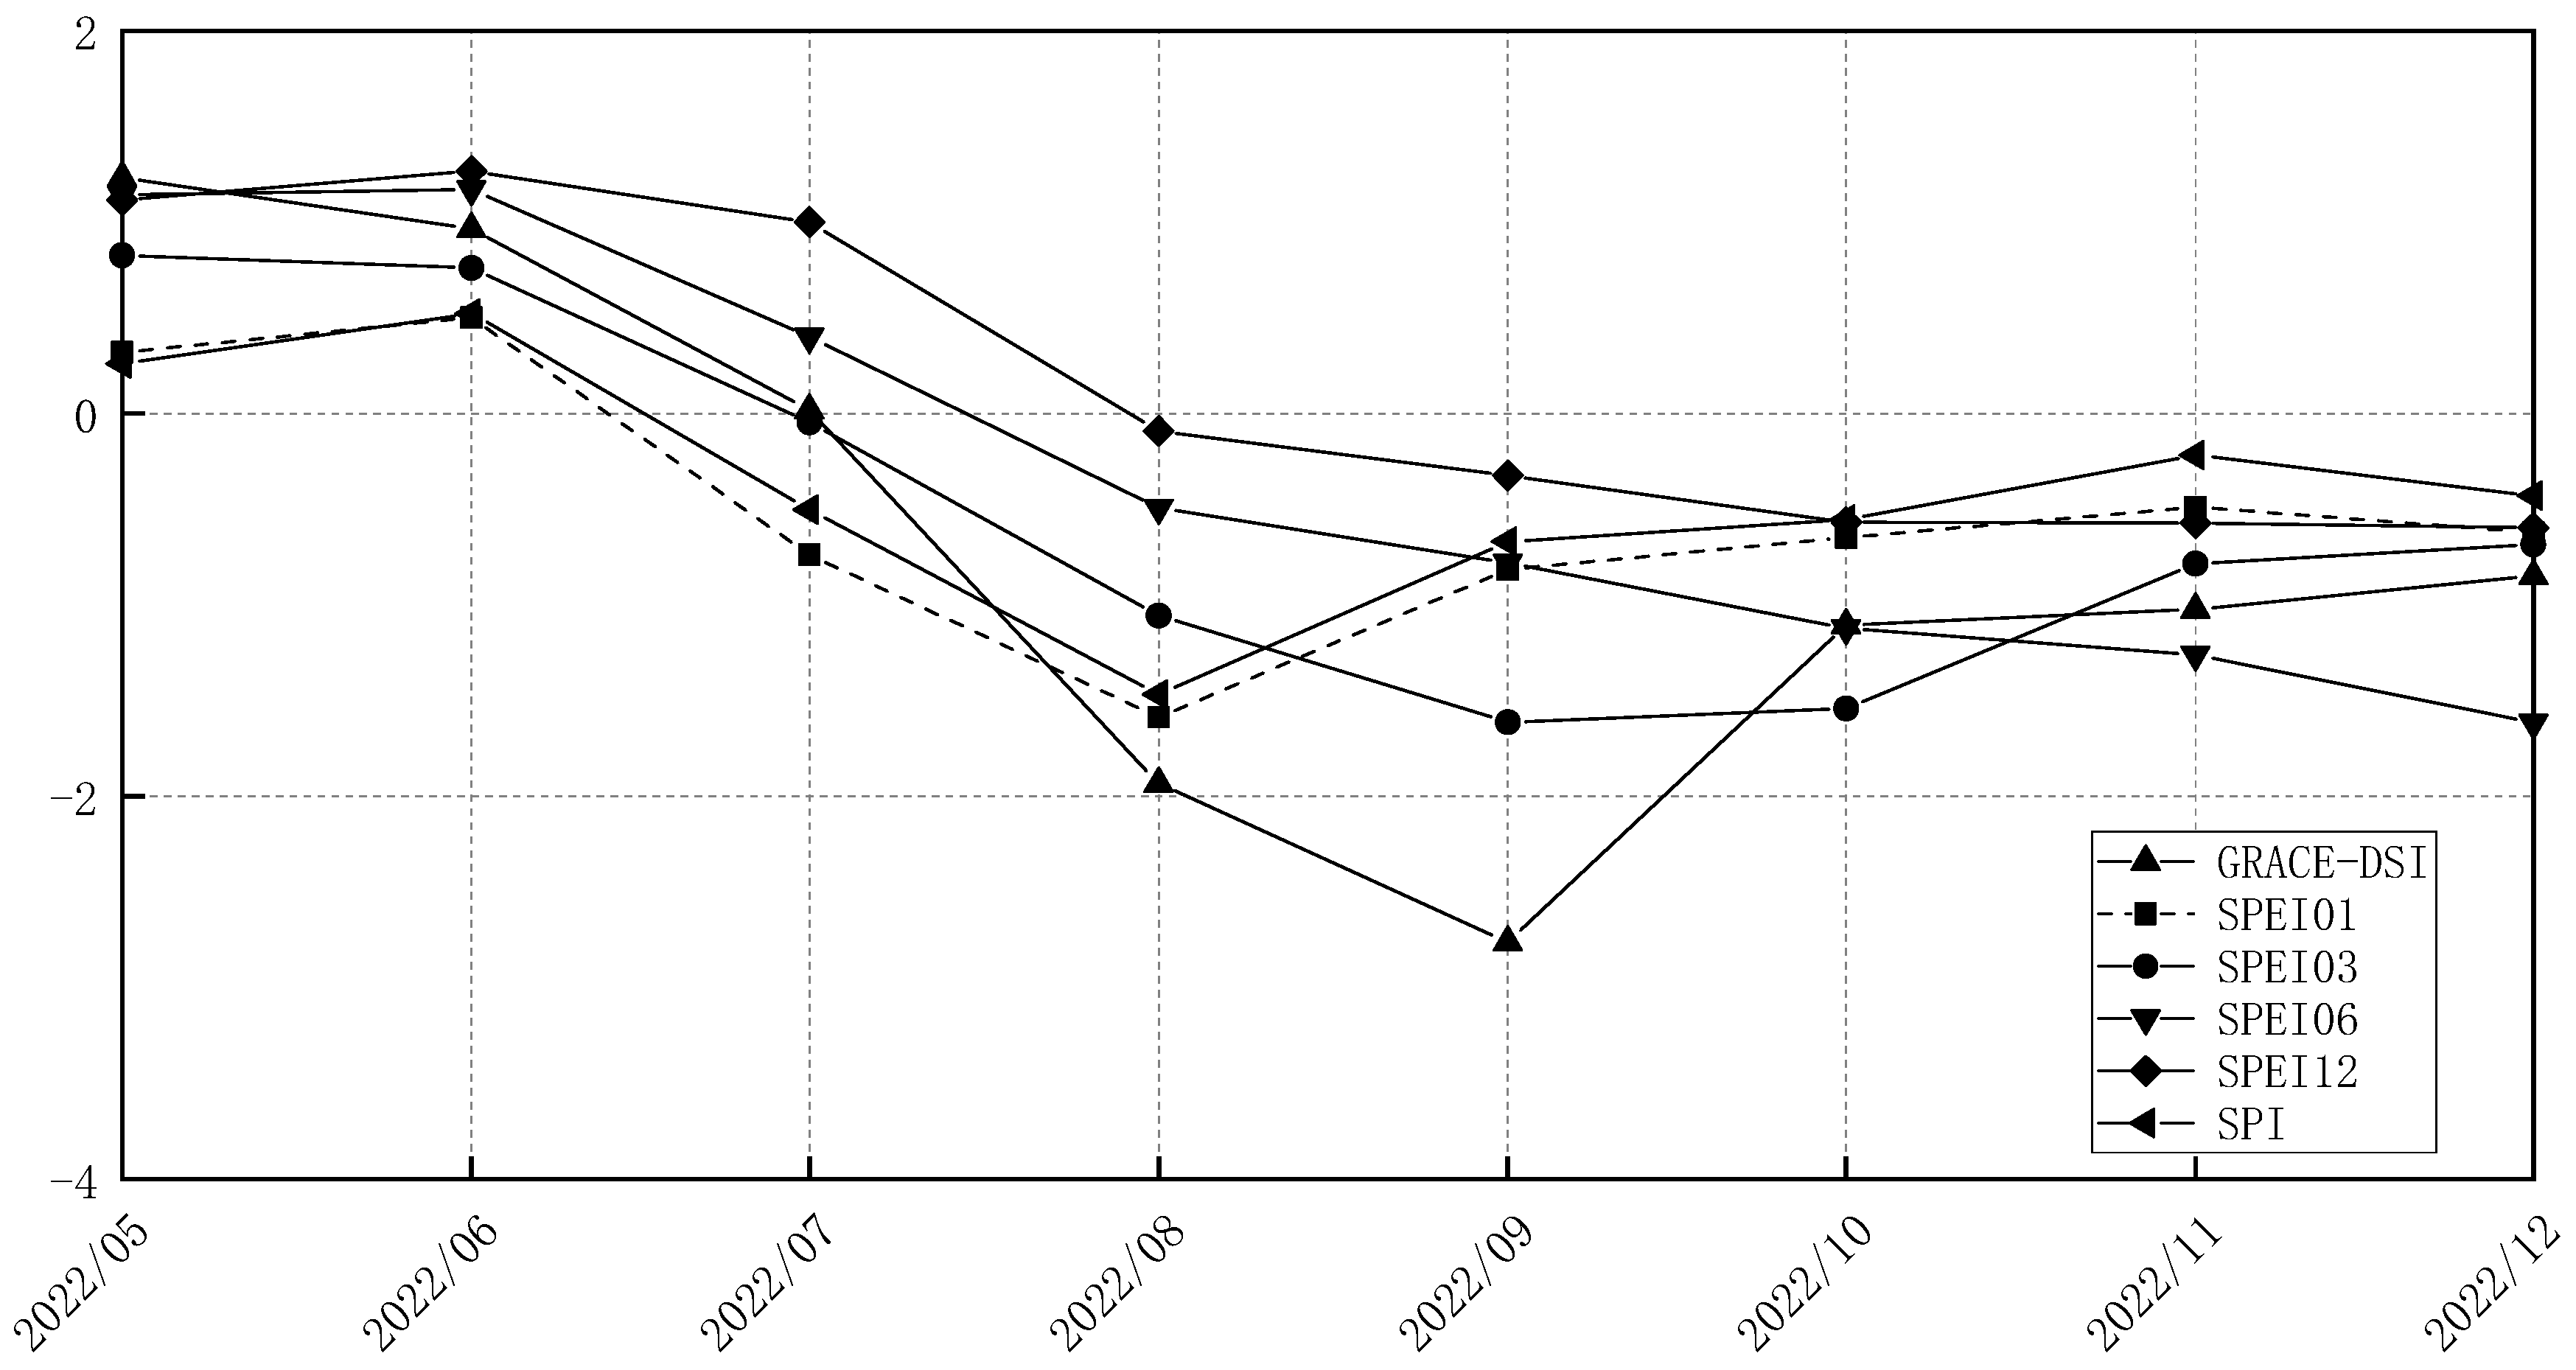
The GRACE-DSI, as a drought index calculated based on gravity satellite data, correlates well with the standardized precipitation index SPI and the standardized precipitation evapotranspiration index SPEI, with correlation coefficients above 0.75, of which the highest correlation with the SPEI3 dataset is 0.93, which reflects the ability of the GRACE gravity satellites to provide more accurate descriptions of extreme drought events.
(4)
By comparing the soil moisture products of the GLDAS and CLDAS, and adding the validation of measured site data, it was verified that after the drought in August, there was a trend of sudden decrease in soil moisture content in the Yangtze River Basin, and the soil moisture content was at a lower level after that; it was expected to recover in the first half of 2023.
It was found that the GRACE drought index based on GRACE satellite data and its calculation, in collaboration with other multi-source satellite data, is effective for drought monitoring in large watersheds, and that the methodology can be migrated to other watersheds, such as the Pearl River Basin, in subsequent studies, in order to understand the occurrence of drought events in large watersheds.
Since the study only selected data for 2022, it does not provide insight into the timing of the end of this drought event, which is an indispensable component for understanding the progression and propagation of the drought. Also, for drought events, observations over a long period of time will allow for a more complete description of the drought. In addition, droughts are often caused by compounding impacts, including reduced precipitation, increased evapotranspiration, land use change, increased human water use, and climate change. Drought events can be explored through these components in subsequent studies to reveal the complex mechanisms arising from the compounding effects of various climatic factors.

Author Contributions

Methodology, M.Y. and Q.H.; validation, M.Y.; formal analysis, M.Y.; data curation, M.Y. and Q.H.; writing—original draft, M.Y.; writing—review and editing, Q.H.; supervision, R.J., S.M., R.W. and L.K.; project administration, Q.H.; funding acquisition, Q.H. All authors have read and agreed to the published version of the manuscript.

Funding

This study was supported by the National Key R&D Program of China (grant no. 2021YFB3900601) and the Hydraulic Science & Technology Project of Jiangxi Province (grant no. 202426ZDKT18).

Data Availability Statement

The datasets generated and analyzed during the current study are available from the corresponding author upon reasonable request.

Acknowledgments

The authors would like to thank the reviewers and editors for their valuable comments and suggestions.

Conflicts of Interest

The authors declare no conflicts of interest.

References

  1. Ault, T.R. On the essentials of drought in a changing climate. Science 2020, 368, 256–260. [Google Scholar] [CrossRef] [PubMed]
  2. Lu, H.; Zhang, X.Y.; Liu, S.D. Risk assessment to China’s agricultural drought disaster in county unit. Nat. Hazards 2012, 61, 785–801. [Google Scholar] [CrossRef]
  3. Yang, Q.; Li, M.X.; Zheng, Z.Y.; Ma, Z. Regional applicability of seven meteorological drought indices in China. Sci. China Earth Sci. 2017, 47, 337–353. (In Chinese) [Google Scholar] [CrossRef]
  4. Van Dijk, A.I.J.M.; Beck, H.E.; Crosbie, R.S.; De Jeu, R.A.; Liu, Y.Y.; Podger, G.M.; Timbal, B.; Viney, N.R. The Millennium Drought in southeast Australia (2001−2009): Natural and human causes and implications for water resources, ecosystems, economy, and society. Water Resour. Res. 2013, 49, 1040–1057. [Google Scholar] [CrossRef]
  5. Van Loon, A.F.; Gleeson, T.; Clark, J.; Van Dijk, A.I.; Stahl, K.; Hannaford, J.; Di Baldassarre, G.; Teuling, A.J.; Tallaksen, L.M.; Uijlenhoet, R.; et al. Drought in the Anthropocene. Nat. Geosci. 2016, 9, 89–91. [Google Scholar] [CrossRef]
  6. Hasan, E.; Tarhule, A.; Hong, Y.; Moore, B., III. Assessment of physical water scarcity in Africa using GRACE and TRMM satellite data. Remote Sens. 2019, 11, 904. [Google Scholar] [CrossRef]
  7. Feng, W.; Zhong, M.; Lemoine, J.M.; Biancale, R.; Hsu, H.T.; Xia, J. Evaluation of groundwater depletion in North China using the Gravity Recovery and Climate Experiment(GRACE) data and ground-based measurements. Water Resour. Res. 2013, 49, 2110–2118. [Google Scholar] [CrossRef]
  8. Joodaki, G.; Wahr, J.; Swenson, S. Estimating the human contribution to groundwater depletion in the Middle East, from GRACE data, land surface models, and well observations. Water Resour. Res. 2014, 50, 2679–2692. [Google Scholar] [CrossRef]
  9. Sun, Z.; Zhu, X.; Pan, Y.; Zhang, J.; Liu, X. Drought evaluation using the GRACE terrestrial water storage deficit over the Yangtze River Basin, China. Sci. Total Environ. 2018, 634, 727–738. [Google Scholar] [CrossRef]
  10. Chen, J.L.; Wilson, C.R.; Tapley, B.D.; Yang, Z.L.; Niu, G.Y. 2005 drought event in the Amazon River basin as measured by GRACE and estimated by climate models. J. Geophys. Res. Solid Earth 2009, 114, B05404. [Google Scholar] [CrossRef]
  11. Feng, W.; Lemoine, J.M.; Zhong, M.; Hsu, T.T. Terrestrial water storage changes in the Amazon basin measured by GRACE during 2002—2010. Chin. J. Geophys. 2012, 55, 814–821. [Google Scholar] [CrossRef]
  12. Chen, J.L.; Wilson, C.R.; Tapley, B.D.; Longuevergne, L.; Yang, Z.L.; Scanlon, B.R. Recent La Plata basin drought conditions observed by satellite gravimetry. J. Geophys. Res. Atmos. 2010, 115, D22108. [Google Scholar] [CrossRef]
  13. Long, D.; Shen, Y.; Sun, A.; Hong, Y.; Longuevergne, L.; Yang, Y.; Li, B.; Chen, L. Drought and flood monitoring for a large karst plateau in Southwest China using extended GRACE data. Remote Sens. Environ. 2014, 155, 145–160. [Google Scholar] [CrossRef]
  14. Yirdaw, S.Z.; Snelgrove, K.R.; Agboma, C.O. GRACE satellite observations of terrestrial moisture changes for drought characterization in the Canadian Prairie. J. Hydrol. 2008, 356, 84–92. [Google Scholar] [CrossRef]
  15. Yi, H.; Wen, L. Satellite gravity measurement monitoring terrestrial water storage change and drought in the continental United States. Sci. Rep. 2016, 6, 19909. [Google Scholar] [CrossRef] [PubMed]
  16. Zhao, M.; Geruo, A.; Velicogna, I.; Kimball, J.S. A global gridded dataset of GRACE drought severity index for 2002–14: Comparison with PDSI and SPEI and a case study of the Australia millennium drought. J. Hydrometeorol. 2017, 18, 2117–2129. [Google Scholar] [CrossRef]
  17. Liu, X.; Feng, X.; Ciais, P.; Fu, B.; Hu, B.; Sun, Z. GRACE satellite-based drought index indicating increased impact of drought over major basins in China during 2002–2017. Agric. For. Meteorol. 2020, 291, 108057. [Google Scholar] [CrossRef]
  18. Wang, F.; Wang, Z.; Yang, H.; Di, D.; Zhao, Y.; Liang, Q. Utilizing GRACE-based groundwater drought index for drought characterization and teleconnection factors analysis in the North China Plain. J. Hydrol. 2020, 585, 124849. [Google Scholar] [CrossRef]
  19. Han, Z.; Huang, S.; Huang, Q.; Leng, G.; Liu, Y.; Bai, Q.; He, P.; Liang, H.; Shi, W. GRACE-based high-resolution propagation threshold from meteorological to groundwater drought. Agric. For. Meteorol. 2021, 307, 108476. [Google Scholar] [CrossRef]
  20. Cui, A.; Li, J.; Zhou, Q.; Zhu, R.; Liu, H.; Wu, G.; Li, Q. Use of a multiscalar GRACE-based standardized terrestrial water storage index for assessing global hydrological droughts. J. Hydrol. 2021, 603, 126871. [Google Scholar] [CrossRef]
  21. Rawat, S.; Ganapathy, A.; Agarwal, A. Drought characterization over Indian sub-continent using GRACE-based indices. Sci. Rep. 2022, 12, 15432. [Google Scholar] [CrossRef] [PubMed]
  22. Foroumandi, E.; Nourani, V.; Huang, J.J.; Moradkhani, H. Drought monitoring by downscaling GRACE-derived terrestrial water storage anomalies: A deep learning approach. J. Hydrol. 2023, 616, 128838. [Google Scholar] [CrossRef]
  23. Han, Z.; Huang, S.; Peng, J.; Li, J.; Leng, G.; Huang, Q.; Zhao, J.; Yang, F.; He, P.; Meng, X.; et al. GRACE-based dynamic assessment of hydrological drought trigger thresholds induced by meteorological drought and possible driving mechanisms. Remote Sens. Environ. 2023, 298, 113831. [Google Scholar] [CrossRef]
  24. Zhong, Y.; Hu, E.; Wu, Y.; An, Q.; Wang, C.; Bai, H.; Gao, W. Reconstructing a long-term water storage-based drought index in the Yangtze River Basin. Sci. Total Environ. 2023, 883, 163403. [Google Scholar] [CrossRef] [PubMed]
  25. Shi, M.Q.; Yuan, Z.; Shi, X.L.; Li, Y.; Chen, F. Spatial and Temporal Variation Characteristics of Blue and Green Water Resources in the Yangtze River Basin Based on GLDAS-NOAH. J. Yangtze River Sci. Res. Inst. 2022, 39, 38. [Google Scholar] [CrossRef]
  26. Liu, J.; Yuan, Z.; Xu, J.; Liu, Y.Y.; Cheng, W.S.; Tian, C.W.; Miao, H.L. Meteorological drought evolution characteristics and future trends in the Yangtze river basin. J. Yangtze River Sci. Res. Inst. 2020, 37, 28. [Google Scholar] [CrossRef]
  27. Ding, H.; Shi, X.L.; Wu, M.Y. Terrestrial water storage anomaly in the Yellow River Basin based on GRACE gravity satellite data. Water Resour. Water Eng. J. 2021, 32, 109–115. [Google Scholar]
  28. Li, X.; Zhong, B.; Li, J.; Liu, R. Analysis of terrestrial water storage changes in the Shaan-Gan-Ning Region using GPS and GRACE/GFO. Geod. Geodyn. 2022, 13, 179–188. [Google Scholar] [CrossRef]
  29. Scanlon, B.R.; Zhang, Z.; Save, H.; Wiese, D.N.; Landerer, F.W.; Long, D.; Longuevergne, L.; Chen, J. Global evaluation of new GRACE mascon products for hydrologic applications. Water Resour. Res. 2016, 52, 9412–9429. [Google Scholar] [CrossRef]
  30. Palmer, W.C. Meteorological Drought Research; Paper No. 45; US Weather Bureau: Washington, DC, USA, 1965.
  31. Dai, A. Characteristics and trends in various forms of the Palmer Drought Severity Index during 1900–2008. J. Geophys. Res. Atmos. 2011, 116, D12115. [Google Scholar] [CrossRef]
  32. McKee, T.B.; Doesken, N.J.; Kleist, J. The Relationship of Drought Frequency and Duration to Time Scales. In Proceedings of the 8th Conference on Applied Climatology, Anaheim, CA, USA, 17–22 January 1993; Volume 17, pp. 179–183. [Google Scholar]
  33. Ni, N.Q.; Xie, J.X.; Liu, X.M.; Wang, K.W.; Tian, W. Multi-source data quality assessment based on the index of runoff sensitivity to climate change. Acta Geogr. Sin. 2022, 77, 2280–2291. [Google Scholar] [CrossRef]
Figure 1. Geographic locations and distribution of measuring stations in the Yangtze River Basin.
Water 16 01502 g001
Figure 2. Spatial distributions of changes in terrestrial water storage in the Yangtze River Basin from May to December 2022.
Water 16 01502 g002aWater 16 01502 g002b
Figure 3. Time series of changes in terrestrial water storage in the Yangtze River Basin and changes in perennial terrestrial water storage in 2022. The x-label time is in YYYY/MM form.
Water 16 01502 g003
Figure 4. Changes in terrestrial water storage of large lakes in the Yangtze River Basin in 2022 ((a) for Poyang Lake, (b) for Dongting Lake, and (c) for Taihu Lake). The x-label time is in YYYY/MM form.
Water 16 01502 g004aWater 16 01502 g004b
Figure 5. Spatial distributions of abnormal soil moisture in the Yangtze River Basin from May to December 2022.
Water 16 01502 g005
Figure 6. Spatial distributions of drought classes based on relative soil moisture in the Yangtze River Basin in 2022. The x-label time is in YYYY/MM/DD form.
Water 16 01502 g006
Figure 7. Spatial distributions of the GRACE-DSI in the Yangtze River Basin from May to December 2022.
Water 16 01502 g007
Figure 8. Changes in the percentage of area with different degrees of drought versus TWSA. The x-label time is in YYYY/MM form.
Water 16 01502 g008
Figure 9. Spatial distributions of the GRACE-DSI, SPI, and SPEI in the Yangtze River Basin from May to December 2022.
Water 16 01502 g009
Figure 10. Time series variations in the GRACE-DSI with meteorological drought indices. The x-label time is in YYYY/MM form.
Water 16 01502 g010
Figure 11. Changes in terrestrial water storage in secondary basins of the Yangtze River Basin from May to December 2022 with GRACE-DSI time series ((a) for Jinsha River basin, (b) for Mintuo river basin, (c) for Jialing river basin, (d) for Yibin-Yichang Basin, (e) for Yichang-Hukou Basin, (f) for Wujiang river basin, (g) for Hanjiang river basin, (h) for Dongting Lake system, (i) for Poyang Lake system, (j) for mainstream below Hukou, and (k) for Taihu Lake system). The x-label time is in YYYY/MM form.
Water 16 01502 g011aWater 16 01502 g011b
Figure 12. Time series of soil moisture (0–200 cm) in Yangtze River Basin. The x-label time is in YYYY/MM/DD form.
Water 16 01502 g012
Figure 13. Time series of volumetric water content at measuring stations in the Yangtze River Basin. The x-label time is in YYYY/MM/DD form.
Water 16 01502 g013
Table 1. GRACE-DSI, WSDI, SPI, and SPEI drought severity level classifications.
Degree of AridityGRACE-DSISPISPEIRSM
Drought-free>0>−0.5>−0.5>60%
Mild drought−1 to 0−1 to −0.5−1 to −0.550% to 60%
Moderate drought−1.5 to −1−1.5 to −1−1.5 to −140% to 50%
Severe drought−2 to −1.5−2 to −1.5−2 to −1.530% to 40%
Extreme drought≤−2≤−2≤−20% to 30%
Table 2. Correlation analysis of the GRACE-DSI with the SPEI and SPI.
RGRACE-DSI
SPI0.79696
SPEI10.81519
SPEI30.93768
SPEI60.74823
SPEI120.78984
Disclaimer/Publisher’s Note: The statements, opinions and data contained in all publications are solely those of the individual author(s) and contributor(s) and not of MDPI and/or the editor(s). MDPI and/or the editor(s) disclaim responsibility for any injury to people or property resulting from any ideas, methods, instructions or products referred to in the content.

