
Microwave-Assisted Extraction of Polyphenols from Eucalyptus Bark—A First Step for a Green Production of Tannin-Based Coagulants

 ,
,  , and
, and 
Abstract
1. Introduction
2. Materials and Methods
2.1. Eucalyptus Globulus Bark
2.2. Comparison of Extraction Techniques
2.3. Analytical Methods
2.4. Optimization of Microwave-Assisted Extraction
2.4.1. Experimental Design
2.4.2. Extractions
2.4.3. Data Analysis
3. Results and Discussion
3.1. Comparison of Extraction Techniques
3.2. Microwave-Assisted Extraction
3.2.1. Modeling of MAE Responses
3.2.2. Validation of the Models
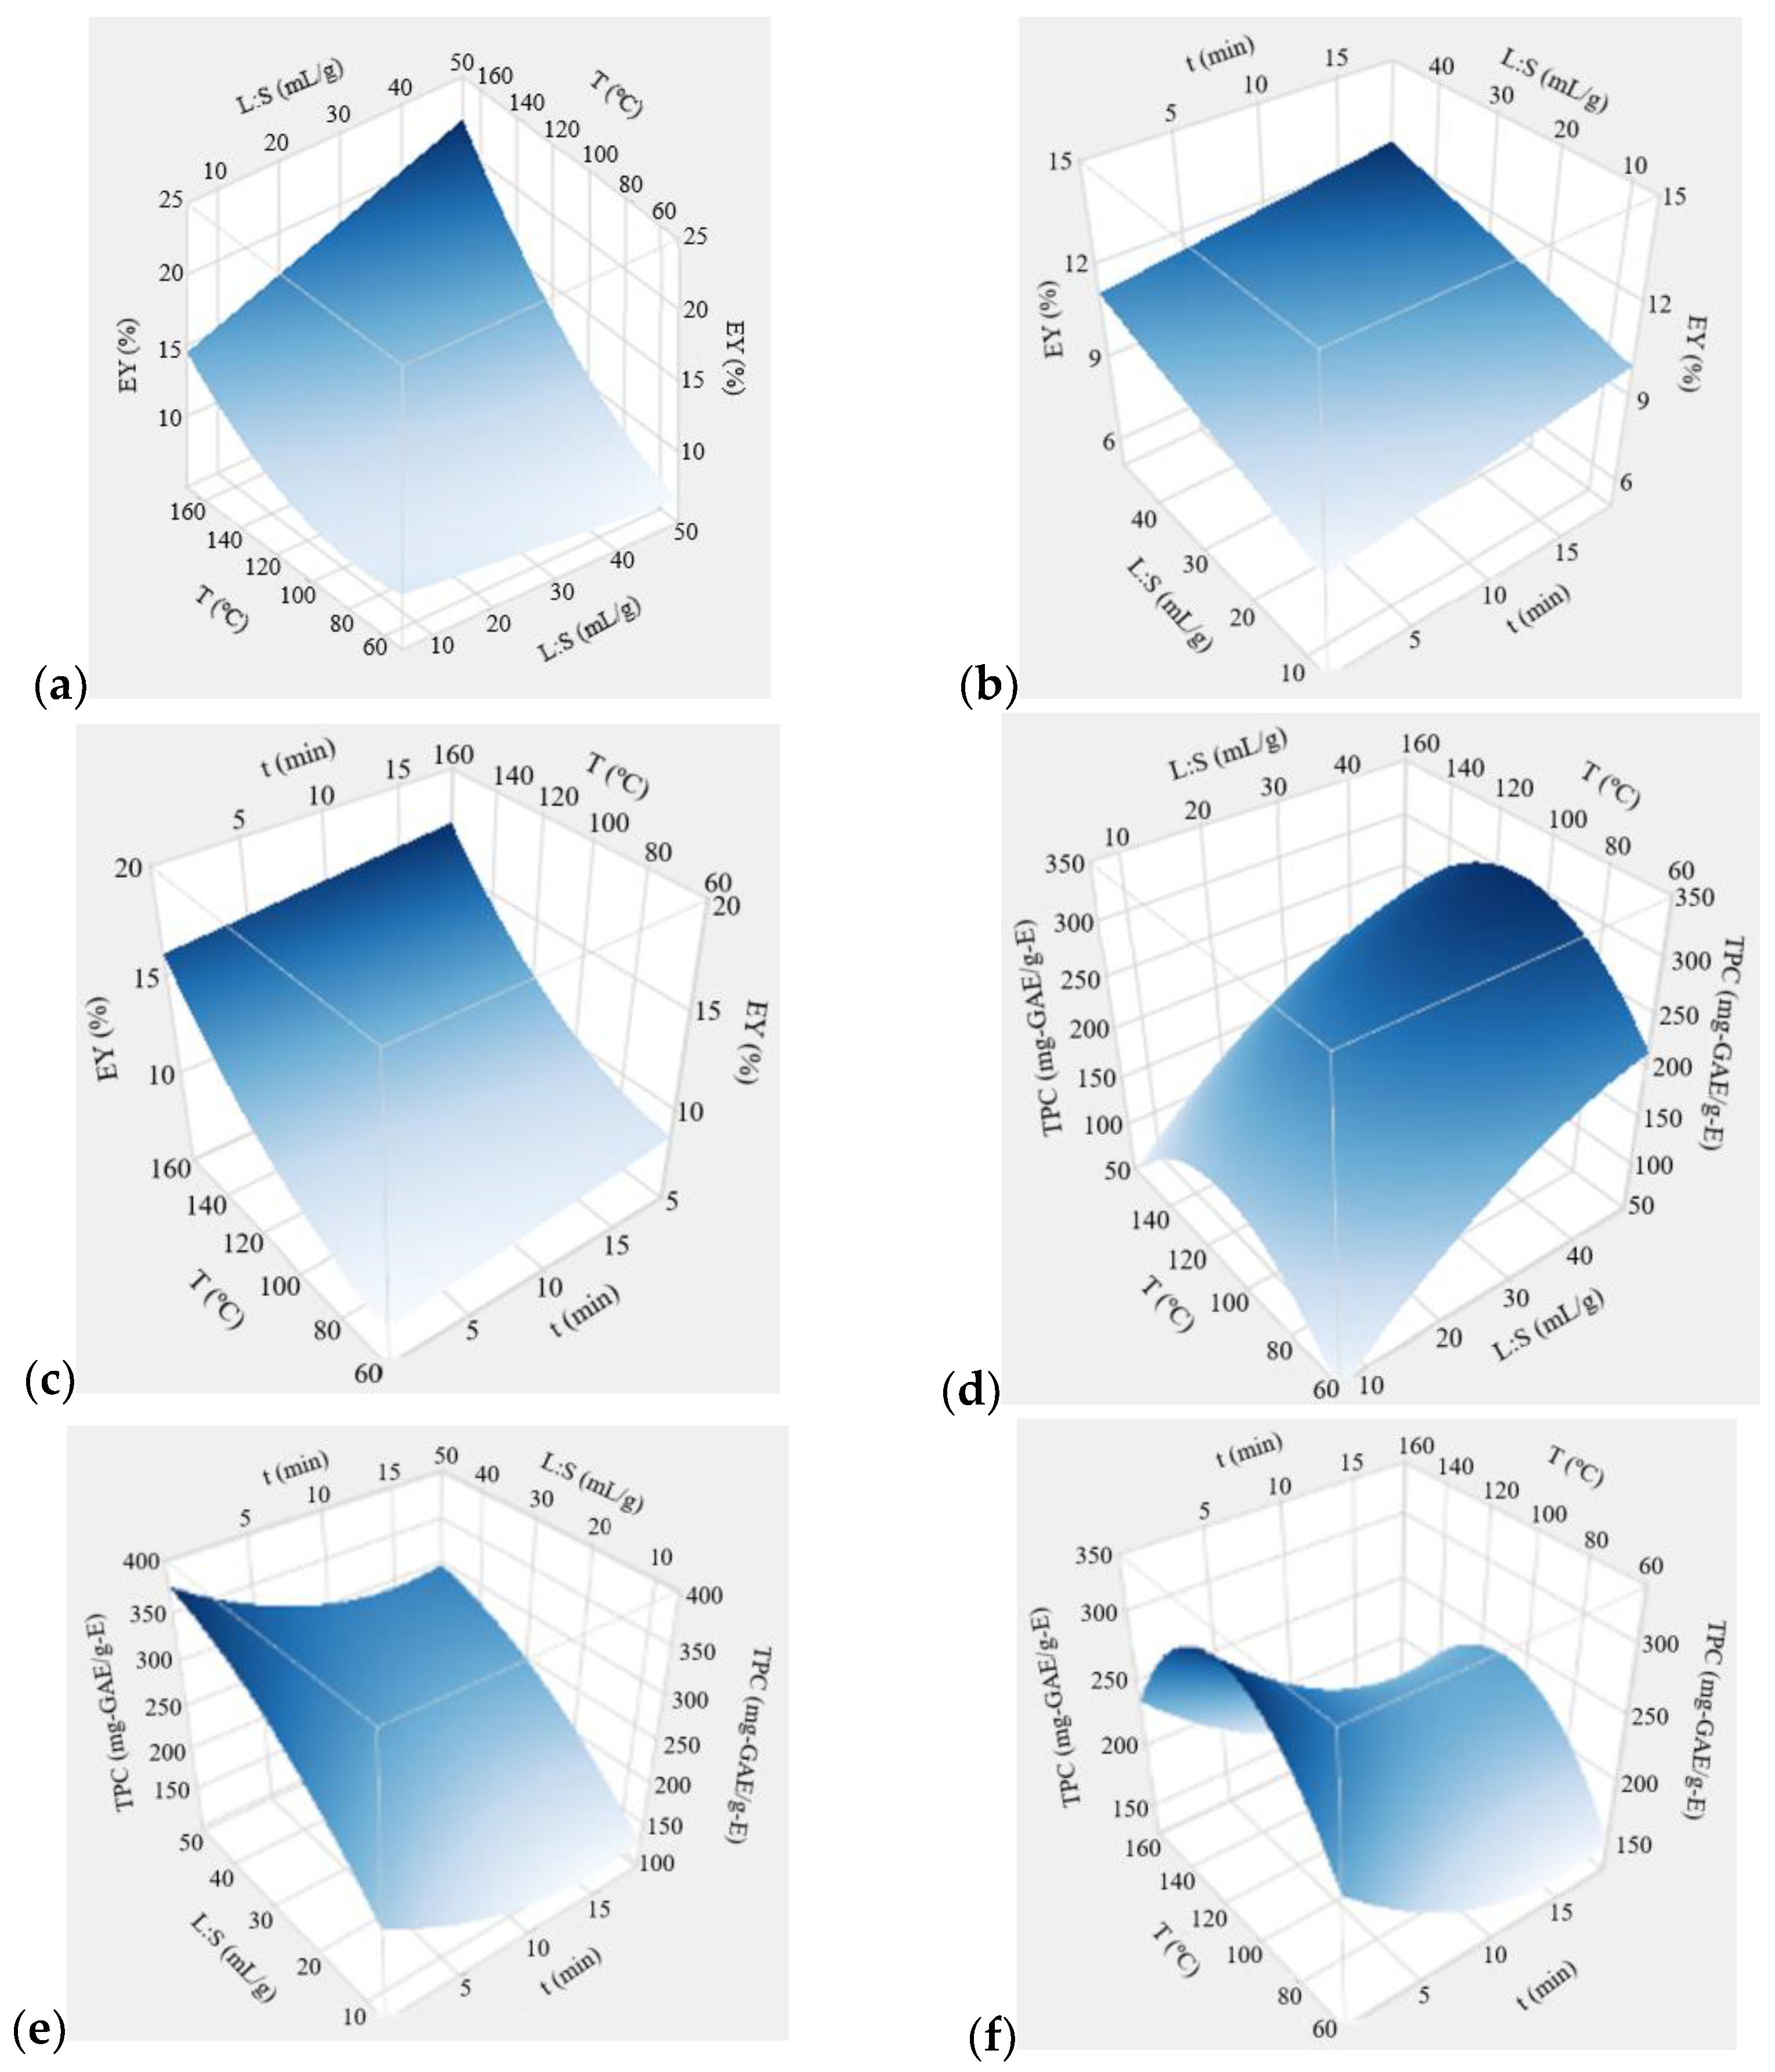
3.2.3. Effect of Extraction Conditions
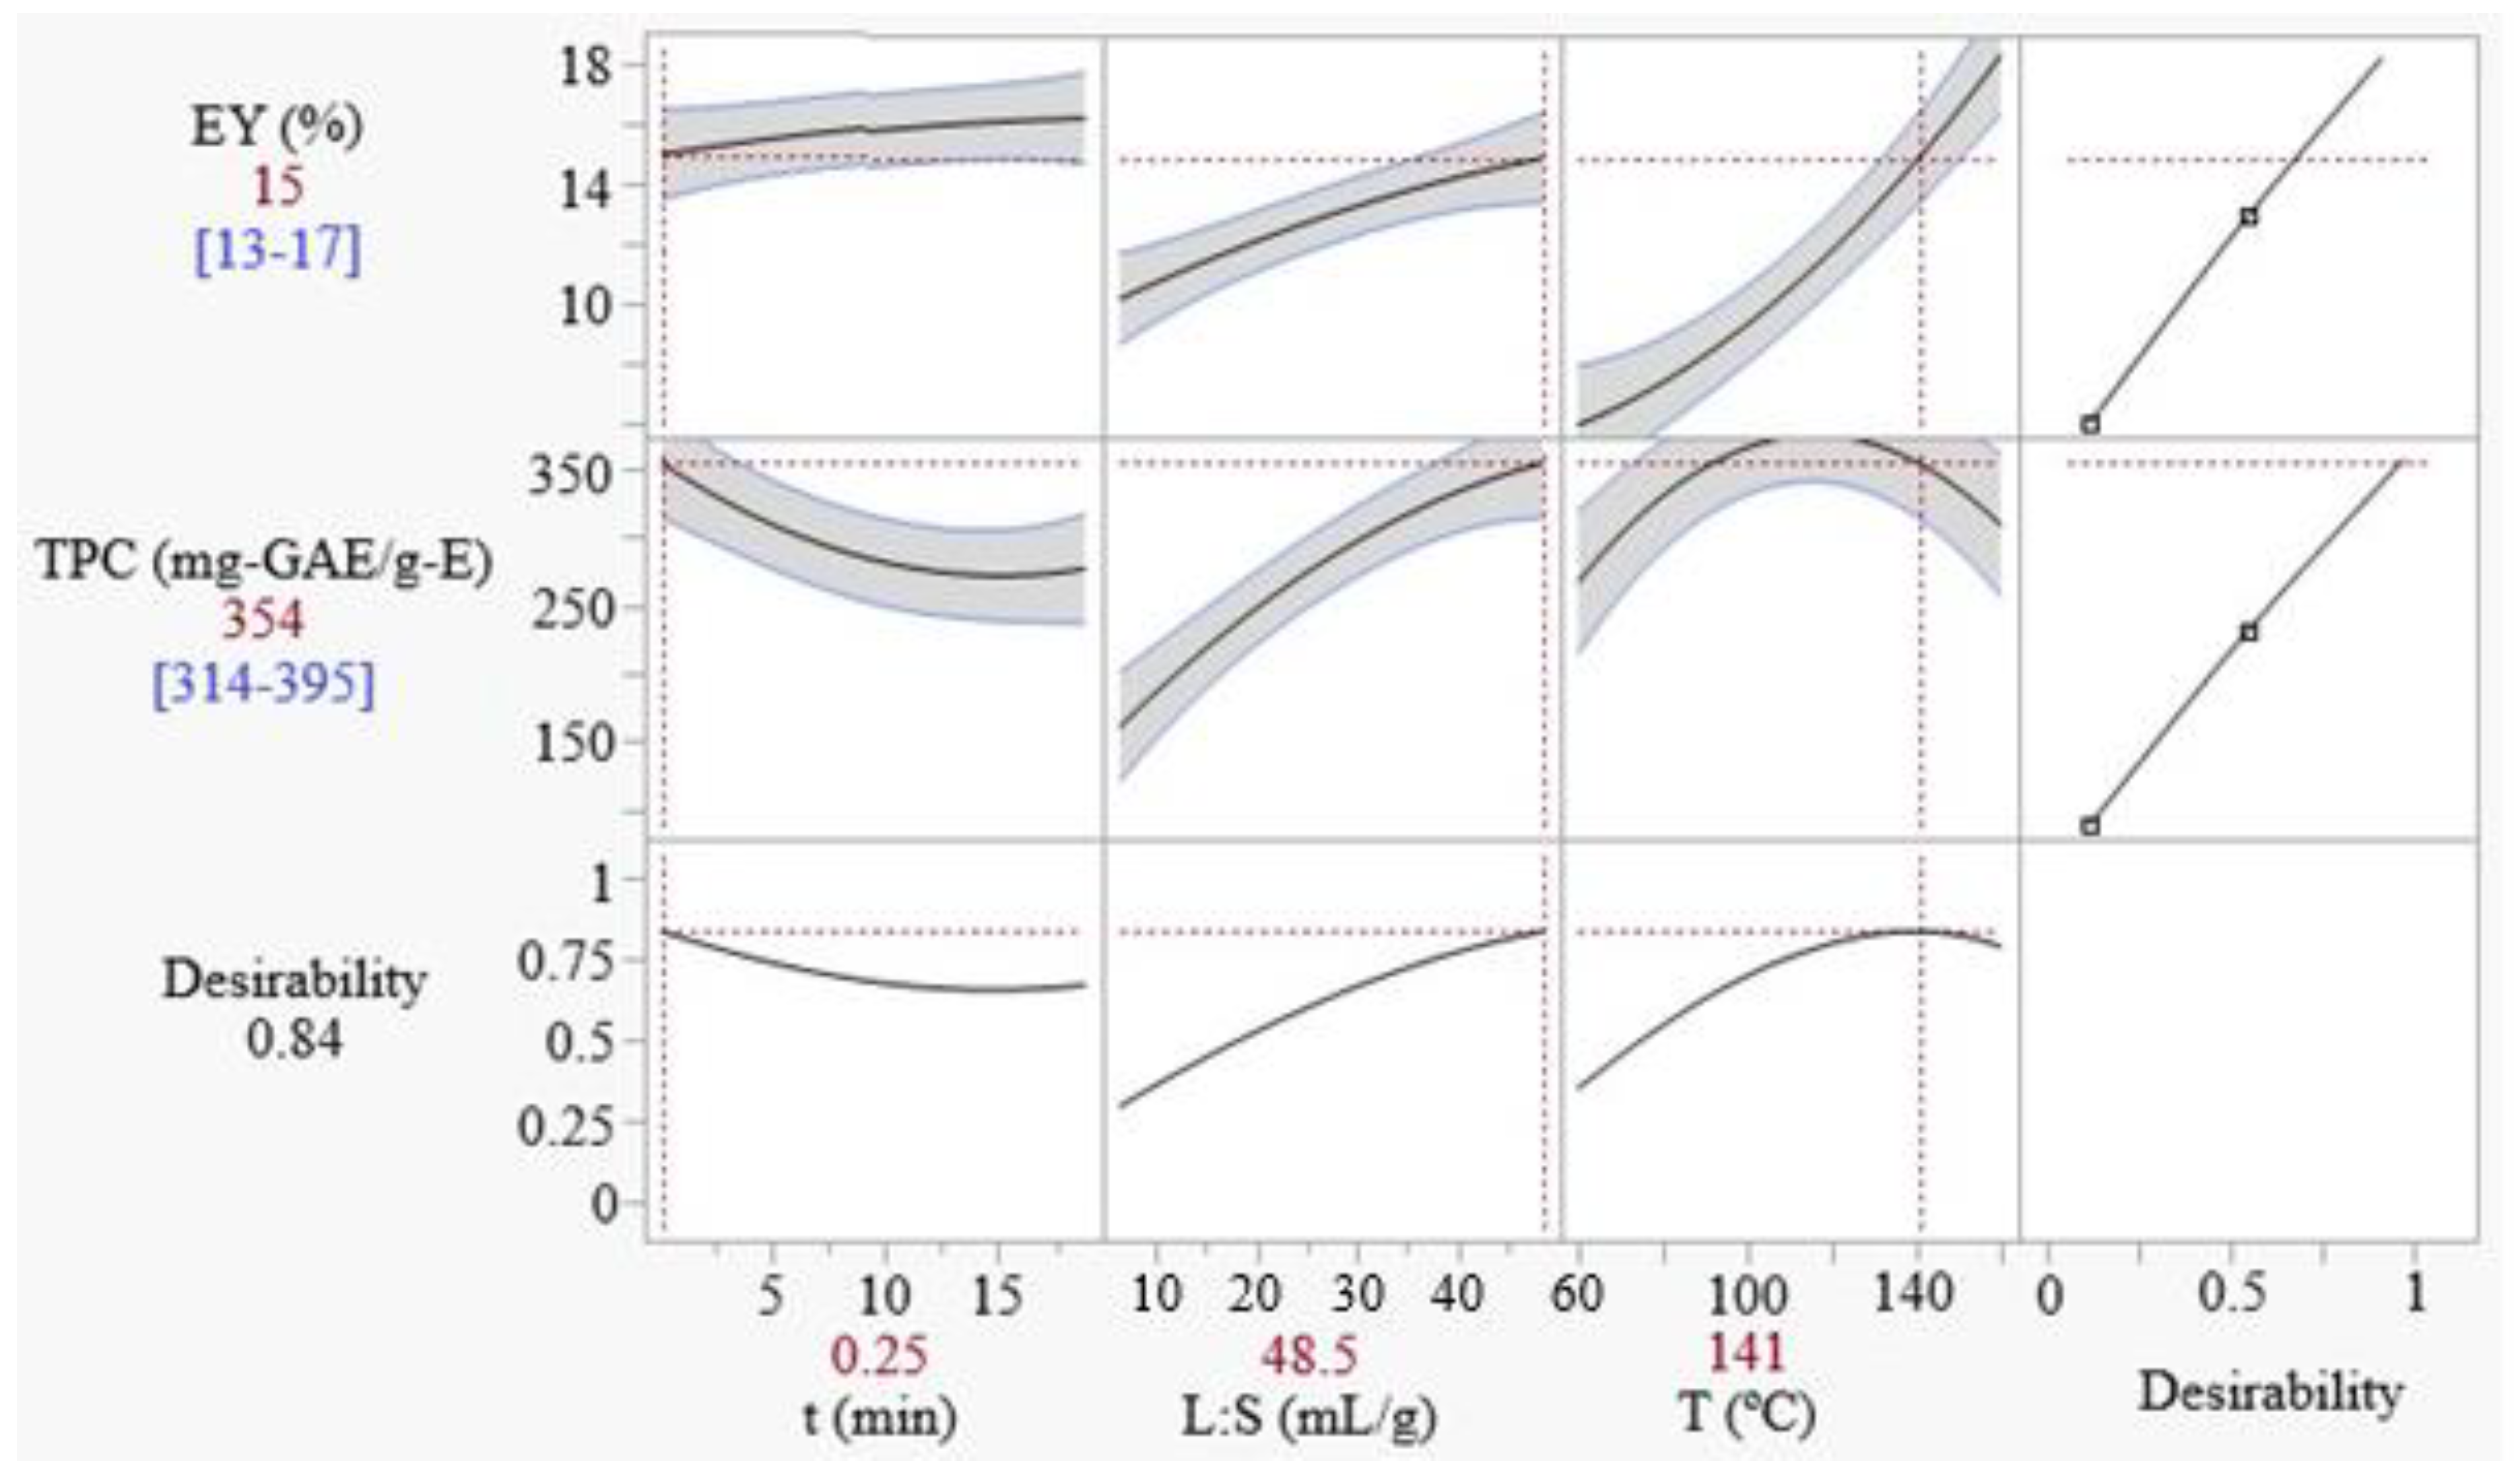
3.2.4. Extraction Optimization
3.2.5. Comparison to Literature
4. Conclusions
Author Contributions
Funding
Conflicts of Interest
References
- Tomasi, I.T.; Machado, C.A.; Boaventura, R.A.; Botelho, C.M.; Santos, S.C. Tannin-based coagulants: Current development and prospects on synthesis and uses. Sci. Total Environ. 2022, 822, 154005. [Google Scholar] [CrossRef]
- Blainski, A.; Lopes, G.C.; De Mello, J.C.P. Application and Analysis of the Folin Ciocalteu Method for the Determination of the Total Phenolic Content from Limonium brasiliense L. Molecules 2013, 18, 6852–6865. [Google Scholar] [CrossRef] [PubMed]
- Agbor, G.A.; Vinson, J.A.; Donnelly, P.E. Folin-Ciocalteau Reagent for Polyphenolic Assay. Int. J. Food Sci. Nutr. Diet. 2014, 3, 147–156. [Google Scholar] [CrossRef]
- Broadhurst, R.B.; Jones, W.T. Analysis of condensed tannins using acidified vanillin. J. Sci. Food Agric. 1978, 29, 788–794. [Google Scholar] [CrossRef]
- Muanda, F.N.; Soulimani, R.; Diop, B.; Dicko, A. Study on chemical composition and biological activities of essential oil and extracts from Stevia rebaudiana Bertoni leaves. LWT-Food Sci. Technol. 2011, 44, 1865–1872. [Google Scholar] [CrossRef]
- Kovačević, D.B.; Barba, F.J.; Granato, D.; Galanakis, C.M.; Herceg, Z.; Dragović-Uzelac, V.; Putnik, P. Pressurized hot water extraction (PHWE) for the green recovery of bioactive compounds and steviol glycosides from Stevia rebaudiana Bertoni leaves. Food Chem. 2018, 254, 150–157. [Google Scholar] [CrossRef]
- de Hoyos Martinez, P.L.; Merle, J.; Labidi, J.; Charrier-El Bouhtoury, F. Tannins extraction: A key point for their valorization and cleaner production. J. Clean. Prod. 2019, 206, 1138–1155. [Google Scholar] [CrossRef]
- NIST/SEMATECH e-Handbook of Statistical Methods. Available online: http://www.itl.nist.gov/div898/handbook/ (accessed on 10 December 2022).
- Obermiller, D.J. “Multiple Response Optimization using JMP”. The Dow Chemical Company. Available online: https://support.sas.com/resources/papers/proceedings/proceedings/sugi22/INFOVIS/PAPER178.PDF (accessed on 14 April 2022).
- Vázquez, G.; González-Alvarez, J.; Santos, J.; Freire, M.S.; Antorrena, G. Evaluation of potential applications for chestnut (Castanea sativa) shell and eucalyptus (Eucalyptus globulus) bark extracts. Ind. Crops Prod. 2009, 29, 364–370. [Google Scholar] [CrossRef]
- Vázquez, G.; Antorrena, G.; González, J.; Alvarez, J.C. Tannin-Based Adhesives for Bonding High-Moisture Eucalyptus Veneers: Influence of Tannin Extraction and Press Conditions; Springer: Berlin/Heidelberg, Germany, 1996; pp. 93–97. [Google Scholar]
- Pinto, P.C.R.; Sousa, G.; Crispim, F.; Silvestre, A.J.D.; Neto, C.P. Eucalyptus globulus Bark as Source of Tannin Extracts for Application in Leather industry. ACS Sustain. Chem. Eng. 2013, 1, 950–955. [Google Scholar] [CrossRef]
- Vázquez, G.; Santos, J.; Freire, M.S.; Antorrena, G.; González-Álvarez, J. Extraction of antioxidants from eucalyptus (Eucalyptus globulus) bark. Wood Sci. Technol. 2012, 46, 443–457. [Google Scholar] [CrossRef]
- Bacelo, H.; Santos, S.C.R.; Botelho, C.M.S. Removal of arsenic from water by an iron-loaded resin prepared from Pinus pinaster bark tannins. Euro-Mediterr. J. Environ. Integr. 2020, 5, 47. [Google Scholar] [CrossRef]
- Arismendi, W.A.; Ortiz-Ardila, A.E.; Delgado, C.V.; Lugo, L.; Sequeda-Castañeda, L.G.; Celis-Zambrano, C.A. Modified tannins and their application in wastewater treatment. Water Sci. Technol. 2018, 78, 1115–1128. [Google Scholar] [CrossRef]
- Noordin, M.; Venkatesh, V.; Sharif, S.; Elting, S.; Abdullah, A. Application of response surface methodology in describing the performance of coated carbide tools when turning AISI 1045 steel. J. Mater. Process. Technol. 2004, 145, 46–58. [Google Scholar] [CrossRef]
- Mazzara, E.; Carletti, R.; Petrelli, R.; Mustafa, A.M.; Caprioli, G.; Fiorini, D.; Scortichini, S.; Dall’Acqua, S.; Sut, S.; Nuñez, S.; et al. Green extraction of hemp (Cannabis sativa L.) using microwave method for recovery of three valuable fractions (essential oil, phenolic compounds and cannabinoids): A central composite design optimization study. J. Sci. Food Agric. 2022, 102, 6220–6235. [Google Scholar] [CrossRef]
- Dahmoune, F.; Nayak, B.; Moussi, K.; Remini, H.; Madani, K. Optimization of microwave-assisted extraction of polyphenols from Myrtus communis L. leaves. Food Chem. 2015, 166, 585–595. [Google Scholar] [CrossRef]
- Ibrahim, A.; Yaser, A.Z.; Lamaming, J. Synthesising tannin-based coagulants for water and wastewater application: A review. J. Environ. Chem. Eng. 2020, 9, 105007. [Google Scholar] [CrossRef]
- Bener, M.; Şen, F.B.; Önem, A.N.; Bekdeşer, B.; Çelik, S.E.; Lalikoglu, M.; Aşçı, Y.S.; Capanoglu, E.; Apak, R. Microwave-assisted extraction of antioxidant compounds from by-products of Turkish hazelnut (Corylus avellana L.) using natural deep eutectic solvents: Modeling, optimization and phenolic characterization. Food Chem. 2022, 385, 132633. [Google Scholar] [CrossRef]
- Huma, Z.; Jayasena, V.; Nasar-Abbas, S.M.; Imran, M.; Khan, M.K. Process optimization of polyphenol extraction from carob (Ceratonia siliqua) kibbles using microwave-assisted technique. J. Food Process. Preserv. 2017, 42, e13450. [Google Scholar] [CrossRef]
- Bhuyan, D.J.; Van Vuong, Q.; Chalmers, A.C.; van Altena, I.A.; Bowyer, M.C.; Scarlett, C.J. Microwave-assisted extraction of Eucalyptus robusta leaf for the optimal yield of total phenolic compounds. Ind. Crops Prod. 2015, 69, 290–299. [Google Scholar] [CrossRef]
- Darvishzadeh, P.; Orsat, V. Microwave-assisted extraction of antioxidant compounds from Russian olive leaves and flowers: Optimization, HPLC characterization and comparison with other methods. J. Appl. Res. Med. Aromat. Plants 2022, 27, 100368. [Google Scholar] [CrossRef]
- Liazid, A.; Palma, M.; Brigui, J.; Barroso, C.G. Investigation on phenolic compounds stability during microwave-assisted extraction. J. Chromatogr. A 2007, 1140, 29–34. [Google Scholar] [CrossRef]
- Dahmoune, F.; Spigno, G.; Moussi, K.; Remini, H.; Cherbal, A.; Madani, K. Pistacia lentiscus leaves as a source of phenolic compounds: Microwave-assisted extraction optimized and compared with ultrasound-assisted and conventional solvent extraction. Ind. Crops Prod. 2014, 61, 31–40. [Google Scholar] [CrossRef]
- Zhao, C.-N.; Zhang, J.-J.; Li, Y.; Meng, X.; Li, H.-B. Microwave-Assisted Extraction of Phenolic Compounds from Melastoma sanguineum Fruit: Optimization and Identification. Molecules 2018, 23, 2498. [Google Scholar] [CrossRef] [PubMed]
- Santos, J.; Antorrena, G.; Freire, M.S.; Pizzi, A.; González-Álvarez, J. Environmentally friendly wood adhesives based on chestnut (Castanea sativa) shell tannins. Eur. J. Wood Wood Prod. 2016, 75, 89–100. [Google Scholar] [CrossRef]
- Said, Z.; Slimani, S.; Remini, H.; Idir-Himed, H.; Mazauric, J.; Madani, K.; Boulekbache-Makhlouf, L. Phytochemical analysis and antioxidant activity of Eucalyptus globulus: A comparative study between fruits and leaves extracts. SDRP J. Chem. Eng. Bioanal. Chem. 2016, 1, 1–10. [Google Scholar]
- Santos, S.A.; Villaverde, J.J.; Silva, C.M.; Neto, C.P.; Silvestre, A.J. Supercritical fluid extraction of phenolic compounds from Eucalyptus globulus Labill bark. J. Supercrit. Fluids 2012, 71, 71–79. [Google Scholar] [CrossRef]
- Gullón, B.; Gullón, P.; Lú-Chau, T.A.; Moreira, M.T.; Lema, J.M.; Eibes, G. Optimization of solvent extraction of antioxidants from Eucalyptus globulus leaves by response surface methodology: Characterization and assessment of their bioactive properties. Ind. Crops Prod. 2017, 108, 649–659. [Google Scholar] [CrossRef]
- Fernández-Agulló, A.; Freire, M.S.; González-Álvarez, J. Effect of the extraction technique on the recovery of bioactive compounds from eucalyptus (Eucalyptus globulus) wood industrial wastes. Ind. Crops Prod. 2015, 64, 105–113. [Google Scholar] [CrossRef]
- Gullón, B.; Muñiz-Mouro, A.; Lú-Chau, T.A.; Moreira, M.T.; Lema, J.M.; Eibes, G. Green approaches for the extraction of antioxidants from eucalyptus leaves. Ind. Crops Prod. 2019, 138, 111473. [Google Scholar] [CrossRef]


| Coded Levels | Actual Levels | ||
|---|---|---|---|
| t (min) | L:S (mL.g−1) | T (°C) | |
| −α | 0.25 | 6.5 | 60 |
| −1 | 4.0 | 15.0 | 80 |
| 0 | 9.5 | 27.5 | 110 |
| +1 | 15.0 | 40.0 | 140 |
| +α | 18.8 | 48.5 | 160 |
| Method | T (°C) | Solvent | t (min) | EY (%) | TPC (mg-GAE/g-E) |
|---|---|---|---|---|---|
| SLE | 90 | H2O | 5 | 9.1 ± 0.1 | 159 ± 2 |
| 90 | H2O | 15 | 8.9 ± 0.2 | 158 ± 8 | |
| 90 | H2O | 60 | 9 ± 1 | 113 ± 9 | |
| 90 | 2.5% NaOH | 60 | 17.4 ± 0.4 | 140 ± 7 | |
| 90 | 5.0% NaOH | 60 | 20.5 ± 0.4 | 152 ± 19 | |
| 90 | 7.5% NaOH | 60 | 27 ± 1 | 146 ± 13 | |
| PLE a | 120 | H2O | 5 | 8.5 ± 0.2 | 120 ± 28 |
| 120 | H2O | 15 | 7.4 ± 0.3 | 141 ± 10 | |
| 120 | H2O | 60 | 9.1 ± 0.4 | 91 ± 10 | |
| 120 | 2.5% NaOH | 5 | 14.0 ± 0.1 | 189 ± 2 | |
| 120 | 2.5% NaOH | 15 | 16 ± 1 | 172 ± 9 | |
| 120 | 2.5% NaOH | 60 | 16.9 ± 0.2 | 179 ± 10 | |
| UAE b | 30 | H2O | 5 | 5.3 ± 0.1 | 34 ± 11 |
| MAE | 90 | H2O | 0.05 | 8.0 ± 0.3 | 254 ± 10 |
| 90 | H2O | 5 | 9.1 ± 0.3 | 206 ± 23 | |
| 90 | H2O | 15 | 10.1 ± 0.7 | 169 ± 20 |
| Run | X1 | X2 | X3 | EY (%) | EYpred (%) | TPC (mg-GAE/g-E) | TPCpred (mg-GAE/g-E) |
|---|---|---|---|---|---|---|---|
| 1a | −1 | −1 | −1 | 9.3 ± 0.1 | 8.0 | 212 | 187 |
| 1b | −1 | −1 | −1 | 8.6 ± 0.1 | 8.0 | 221 | 187 |
| 2a | +1 | −1 | −1 | 9.1 ± 0.1 | 8.8 | 163 | 141 |
| 2b | +1 | −1 | −1 | 8.8 ± 0.1 | 8.8 | 168 | 141 |
| 3a | −1 | +1 | −1 | 8.8±0.2 | 8.2 | 299 | 288 |
| 3b | −1 | +1 | −1 | 9.0 ± 0.2 | 8.2 | 247 | 288 |
| 4a | +1 | +1 | −1 | 8.5 ± 0.1 | 9.0 | 232 | 242 |
| 4b | +1 | +1 | −1 | 9.0 ± 0.1 | 9.0 | 234 | 242 |
| 5a | −1 | −1 | +1 | 12.2 ± 0.1 | 11.9 | 172 | 190 |
| 5b | −1 | −1 | +1 | 11.3 ± 0.1 | 11.9 | 200 | 190 |
| 6a | +1 | −1 | +1 | 13.0 ± 0.1 | 12.7 | 147 | 144 |
| 6b | +1 | −1 | +1 | 13.5 ± 0.1 | 12.7 | 142 | 144 |
| 7a | −1 | +1 | +1 | 15.1 ± 0.2 | 14.8 | 256 | 291 |
| 7b | −1 | +1 | +1 | 15.7 ± 0.2 | 14.8 | 284 | 291 |
| 8a | +1 | +1 | +1 | 14.3 ± 0.2 | 15.6 | 226 | 245 |
| 8b | +1 | +1 | +1 | 15.1 ± 0.2 | 15.6 | 249 | 245 |
| 9a | −α | 0 | 0 | 8.7 ± 0.1 | 9.8 | 308 | 313 |
| 9b | −α | 0 | 0 | 8.5 ± 0.1 | 9.8 | 337 | 313 |
| 10a | α | 0 | 0 | 11.0 ± 0.1 | 11.2 | 249 | 236 |
| 10b | α | 0 | 0 | 11.9 ± 0.1 | 11.2 | 217 | 236 |
| 11a | 0 | −α | 0 | 8.51 ± 0.03 | 9.2 | 99 | 136 |
| 11b | 0 | −α | 0 | 7.96 ± 0.03 | 9.2 | 103 | 136 |
| 12a | 0 | α | 0 | 12.3 ± 0.2 | 11.8 | 316 | 306 |
| 12b | 0 | α | 0 | 10.4 ± 0.2 | 11.8 | 353 | 306 |
| 13a | 0 | 0 | −α | 6.8 ± 0.1 | 7.8 | 145 | 155 |
| 13b | 0 | 0 | −α | 7.4 ± 0.1 | 7.8 | 131 | 155 |
| 14a | 0 | 0 | α | 18.2 ± 0.1 | 16.7 | 168 | 160 |
| 14b | 0 | 0 | α | 15.5 ± 0.1 | 16.7 | 191 | 160 |
| 15a | 0 | 0 | 0 | 10.3 ± 0.1 | 10.5 | 253 | 245 |
| 15b | 0 | 0 | 0 | 11.0 ± 0.1 | 10.5 | 264 | 245 |
| 16a | 0 | 0 | 0 | 9.8 ± 0.1 | 10.5 | 238 | 245 |
| 16b | 0 | 0 | 0 | 10.8 ± 0.1 | 10.5 | 238 | 245 |
| 17a | 0 | 0 | 0 | 11.4 ± 0.1 | 10.5 | 239 | 245 |
| 17b | 0 | 0 | 0 | 10.8 ± 0.1 | 10.5 | 255 | 245 |
| 18a | 0 | 0 | 0 | 10.1 ± 0.1 | 10.5 | 236 | 245 |
| 18b | 0 | 0 | 0 | 10.8 ± 0.1 | 10.5 | 237 | 245 |
| 19a | 0 | 0 | 0 | 11.3 ± 0.1 | 10.5 | 247 | 245 |
| 19b | 0 | 0 | 0 | 10.7 ± 0.1 | 10.5 | 238 | 245 |
| 20a | 0 | 0 | 0 | 11.1 ± 0.1 | 10.5 | 234 | 245 |
| 20b | 0 | 0 | 0 | 10.5 ± 0.1 | 10.5 | 266 | 245 |
| Coefficients | EY | TPC | ||||||
|---|---|---|---|---|---|---|---|---|
| Value | t-Ratio | IC (95%) | Prob > |t| | Value | t-Ratio | IC (95%) | Prob > |t| | |
| β0 | 10.49 | 62.4 | 0.34 | <0.0001 | 245.4 | 39.3 | 12.7 | <0.0001 |
| β1 | 0.39 | 2.46 | 0.32 | 0.019 | −22.9 | −5.59 | 8.32 | <0.0001 |
| β2 | 0.73 | 4.63 | 0.32 | <0.0001 | 50.5 | 12.3 | 8.35 | <0.0001 |
| β3 | 2.63 | 16.5 | 0.32 | <0.0001 | 1.41 | 0.34 | 8.46 | 0.736 |
| β12 | - | - | - | - | - | - | ||
| β13 | - | - | - | - | - | - | ||
| β23 | 0.68 | 3.26 | 0.42 | 0.003 | - | - | - | |
| β12 | - | - | - | 10.2 | 2.63 | 7.87 | 0.013 | |
| β22 | - | - | - | -8.67 | -2.23 | 7.92 | 0.033 | |
| β32 | 0.62 | 4.01 | 0.31 | 0.0003 | -31.2 | -7.51 | 8.43 | <0.0001 |
| Response | R2 | RMS | Source | DF | SS | MS | F-Ratio | Fcrit | Prob > F |
|---|---|---|---|---|---|---|---|---|---|
| EY | 0.907 | 0.83 | Model | 5 | 227 | 45.36 | 65.98 | 2.49 | <0.0001 |
| Error | 34 | 23.4 | 0.69 | ||||||
| C. Total | 39 | 250 | |||||||
| TPC | 0.887 | 21.6 | Model | 6 | 1.21∙105 | 2.01∙104 | 43.01 | 2.39 | <0.0001 |
| Error | 33 | 1.55∙104 | 468 | ||||||
| C. Total | 39 | 1.36∙105 |
| Optimization Goal | t (min) | L:S (mL/g) | T (°C) | EYpred (%) | TPCpred | EYexp (%) | TPCexp | CT |
|---|---|---|---|---|---|---|---|---|
| Maximum EY | 18.8 | 48.5 | 160 | 20 ± 2 | 210 ± 12 | 20.6 ±0.2 | 169 ± 33 | 538 ± 69 |
| Maximum TPC | 0.25 | 48.5 | 111 | 11.2 ± 0.3 | 374 ± 36 | 10.4 ± 0.8 | 351 ± 30 | 473 ± 68 |
| Maximum D | 0.25 | 48.5 | 141 | 15 ± 2 | 354 ± 40 | 15.3 ± 0.3 | 330 ± 64 | 645 ± 68 |
| Plant Part/Method | Solvent/Conditions | L:S (mL/g) | t (min) | T (°C) | EY (%) | TPC (mg-GAE/g-E) | Ref. |
|---|---|---|---|---|---|---|---|
| Bark/SLE | H2O | 8 | 180 | 140 | 14 | - | [12] |
| Bark/SLE | H2O | 15 | 60 | 90 | 6.8 | 180.9 | [10] |
| Bark/SLE | 2.5% NaOH | 15 | 60 | 90 | 10.8 | 87.7 | |
| Bark/SLE | 1.5% Na2SO3 + 0.75% NaOH | 15 | 60 | 90 | 7.1 | - | [27] |
| Fruits/SLE | 70% acetone + 0.5% AcOH | 100 | 1 wk | - | - | 464.71 | [28] |
| Leaves/SLE | 70% acetone + 0.5% AcOH | 100 | 1 wk | - | - | 432.63 | |
| Bark/SLE | 50% EtOH | 100 | 24 h | RT | 9.74 | 159.57 | [29] |
| Bark/SLE | 50% MeOH | 100 | 24 h | RT | 9.28 | 407.41 | |
| Bark/SFE | 10 g CO2/min, 20% EtOH, 300 bar | - | - | 70 | 0.48 | 61.20 | |
| Bark/SLE | 1.5% Na2SO3 | 15 | 60 | 100 | 7.1 | 228 | [13] |
| Bark/SLE | 1.5% Na2SO3 + 3% NaOH | 15 | 60 | 100 | 21.9 | 118 | |
| Leaves/SLE | 56% EtOH | 20 | 225 | 50 | 32.7 | 92.9 * | [30] |
| Wood trimmings/MAE | EtOH | 8.8 | 10 | 65 | 2.3 | 650.3 | [31] |
| Leaves/MAE | 56% EtOH | 10 | 7 | - | - | 79.4 * | [32] |
| Leaves/UAE | 56% EtOH | 10 | 90 | 50 | - | 84.0 * | |
| Bark/MAE | H2O | 48.5 | 0.25 | 149 | 15.3 | 330 | here |
Disclaimer/Publisher’s Note: The statements, opinions and data contained in all publications are solely those of the individual author(s) and contributor(s) and not of MDPI and/or the editor(s). MDPI and/or the editor(s) disclaim responsibility for any injury to people or property resulting from any ideas, methods, instructions or products referred to in the content. |
© 2023 by the authors. Licensee MDPI, Basel, Switzerland. This article is an open access article distributed under the terms and conditions of the Creative Commons Attribution (CC BY) license (https://creativecommons.org/licenses/by/4.0/).
Share and Cite
Tomasi, I.T.; Santos, S.C.R.; Boaventura, R.A.R.; Botelho, C.M.S. Microwave-Assisted Extraction of Polyphenols from Eucalyptus Bark—A First Step for a Green Production of Tannin-Based Coagulants. Water 2023, 15, 317. https://doi.org/10.3390/w15020317
Tomasi IT, Santos SCR, Boaventura RAR, Botelho CMS. Microwave-Assisted Extraction of Polyphenols from Eucalyptus Bark—A First Step for a Green Production of Tannin-Based Coagulants. Water. 2023; 15(2):317. https://doi.org/10.3390/w15020317
Chicago/Turabian StyleTomasi, Isabella T., Sílvia C. R. Santos, Rui A. R. Boaventura, and Cidália M. S. Botelho. 2023. "Microwave-Assisted Extraction of Polyphenols from Eucalyptus Bark—A First Step for a Green Production of Tannin-Based Coagulants" Water 15, no. 2: 317. https://doi.org/10.3390/w15020317
APA StyleTomasi, I. T., Santos, S. C. R., Boaventura, R. A. R., & Botelho, C. M. S. (2023). Microwave-Assisted Extraction of Polyphenols from Eucalyptus Bark—A First Step for a Green Production of Tannin-Based Coagulants. Water, 15(2), 317. https://doi.org/10.3390/w15020317