A Multi-Objective Decision Model for Water Pollution Load Allocation under Uncertainty
Abstract
:1. Introduction
2. Materials and Methods
2.1. Environmental Gini Coefficient
2.2. Determination of Environmental Gini Coefficient Evaluation Indicators
2.3. The Environmental Gini Coefficient Controls the Determination of the Weight of the Indicator
- Calculate the unit pollutant loads for different indicators in each sub-zone:where rij represents the unit pollutant load of the jth indicator of the ith region; xi indicates the existing sewage discharge in the ith zone; zij is the indicator value corresponding to the jth indicator in the ith subregion (i = 1, 2, …, n; j = 1, 2, …, m); n is the number of subregions (where, n = 16); m represents the number of indicators (here, m = 5).
- Calculate the proportion of regional indicator values for the overall region under different indicators:
- Calculate the information entropy of the unit pollutant load for each indicator:where 0 ≤ θj ≤ 1.
- Combined with the above calculation results, the weight value of each indicator can be expressed as:
2.4. Contribution Factor
2.5. Optimal Allocation Model of Water Pollution Load Based on Multi-Objective Decision Making under Uncertain Conditions
2.5.1. Fairness Goals
2.5.2. Economic Goals
2.5.3. Conditions of Constraint
- Total pollutant discharge constraint. The reduction of pollutants during the planning period determined by the relevant government planning documents is a target that must be achieved, so the model developed in this study sets it as the primary constraint. That is, the sum of pollutant emissions in each sub-region is not greater than the control target after reduction. The details are as follows:where E represents the upper limit of the total regional pollutant discharge after water pollution load allocation.
- Gini coefficient constraint. To make sure the comprehensive Gini coefficient is not larger than the current value after model optimization, the fairness after optimization will not be reduced. Model constraints should satisfy Gini(Comprehensive) ≤ Gini0 (Comprehensive). “Rigid” constraint makes the allocation scheme inflexible, and in order to increase the feasible domain, the maximum possible optimal value of the objective function is sought. Under the premise of ensuring the global optimum, the Gini coefficient of 0.4 is used as the warning value. Appropriate relaxation is given to the index constraint that the Gini coefficient is less than the warning value; that is, the current Gini coefficient in the fairness constraint ranges. For the index constraint where the Gini coefficient is greater than the warning value, there is no need to give looseness. When Gini0j ≤ 0.4, Ginij ≤ Gini0j±. When Gini0j > 0.4, Ginij ≤ Gini0j. The relaxation of the constraint here is the fuzzy interval of the constraint. The specific constraint formula is determined based on the Gini coefficient of the base year of the study area.
- Pollution load reduction rate constraint. For the overall target reduction given in the planning document, each sub-area should be tasked. Therefore, this model needs to set limits on the pollutant reduction rate of each sub-region (that is, the upper and lower limits of pollution load allocation) based on the given regional pollutant reduction rate, combined with the economic development level and actual emission reduction capacity of each sub-region. Due to different subjective and objective reasons, the data information often has certain deviations or statistical inaccuracies—that is, it is ambiguous. In order to better reflect the inaccuracy and incompleteness of statistical information, and also to improve the flexibility of decision-making schemes, it is necessary to consider setting an elastic constraint.where and represent the upper and lower limits of pollution load allocation for each study subregion, respectively, and are expressed as intervals.
2.5.4. The Solution of the Model
- (1)
- Characterization of the number of intervals. Aiming at the uncertainty parameters in the model, the model is intervalized, and the maximum and minimum values of the interval are obtained by taking a certain amount of expansion. The specific values vary within the interval. For this feature, let X± = [X−, X+] = {x∈X±∣X− ≤ x ≤ X+}, which is a uniformly distributed number of intervals with known upper and lower bounds. X− and X+ are the upper and lower bounds of the interval number X±, respectively; when X− = X+, the X± becomes a definite value. For the number of intervals [X−, X+] that follow a uniform distribution, a random simulation is performed using the rand function provided by MATLAB to generate random numbers that follow a uniform distribution. For this purpose, a sampling function for the number of intervals is constructed as follows:where rand (∙) is 0~1 distributed uniform random number; K is the number of random simulations; can be expressed as a random analog value for the kth time. These simulated random numbers are real numbers that follow their distribution, which we consider to be “deterministic numbers”. Later, Monte Carlo simulation was introduced, and as the number of simulations increased, the calculation accuracy gradually improved.
- (2)
- Solving the multi-objective decision model. The weighted objective programming method is adopted to solve the above nonlinear multi-objective optimization problem, a. The multi-objective function is firstly dimensionless processed, and then converted with weights into a single objective function to facilitate the optimization and screening of subsequent solutions. For the fairness goal and efficiency target, the equal weight coefficient method is used to construct the evaluation function. At the same time, consider that if each objective function order of magnitude is not in the same order of magnitude, there will be a phenomenon of large numbers eating small numbers. In order to prevent this situation, the function is also normalized by orders of magnitude. Due to the introduction of a genetic algorithm to solve the problem, the total target value is first converted into a minimization function, and the multi-objective evaluation function after preprocessing is as follows:where λ1 and λ2 are multi-objective weight coefficients and 0 < λ1, λ2 <1, λ1 + λ2 = 1; α, β are regularization factors.
2.6. Case Study
2.6.1. Overview of the Study Area
2.6.2. Status of Sewage Discharge in the Base Year of Anhui Province
3. Results and Discussions
3.1. Rationality Evaluation of the Current Situation of Pollutants
3.1.1. Study of the Regional Environmental Gini Coefficient
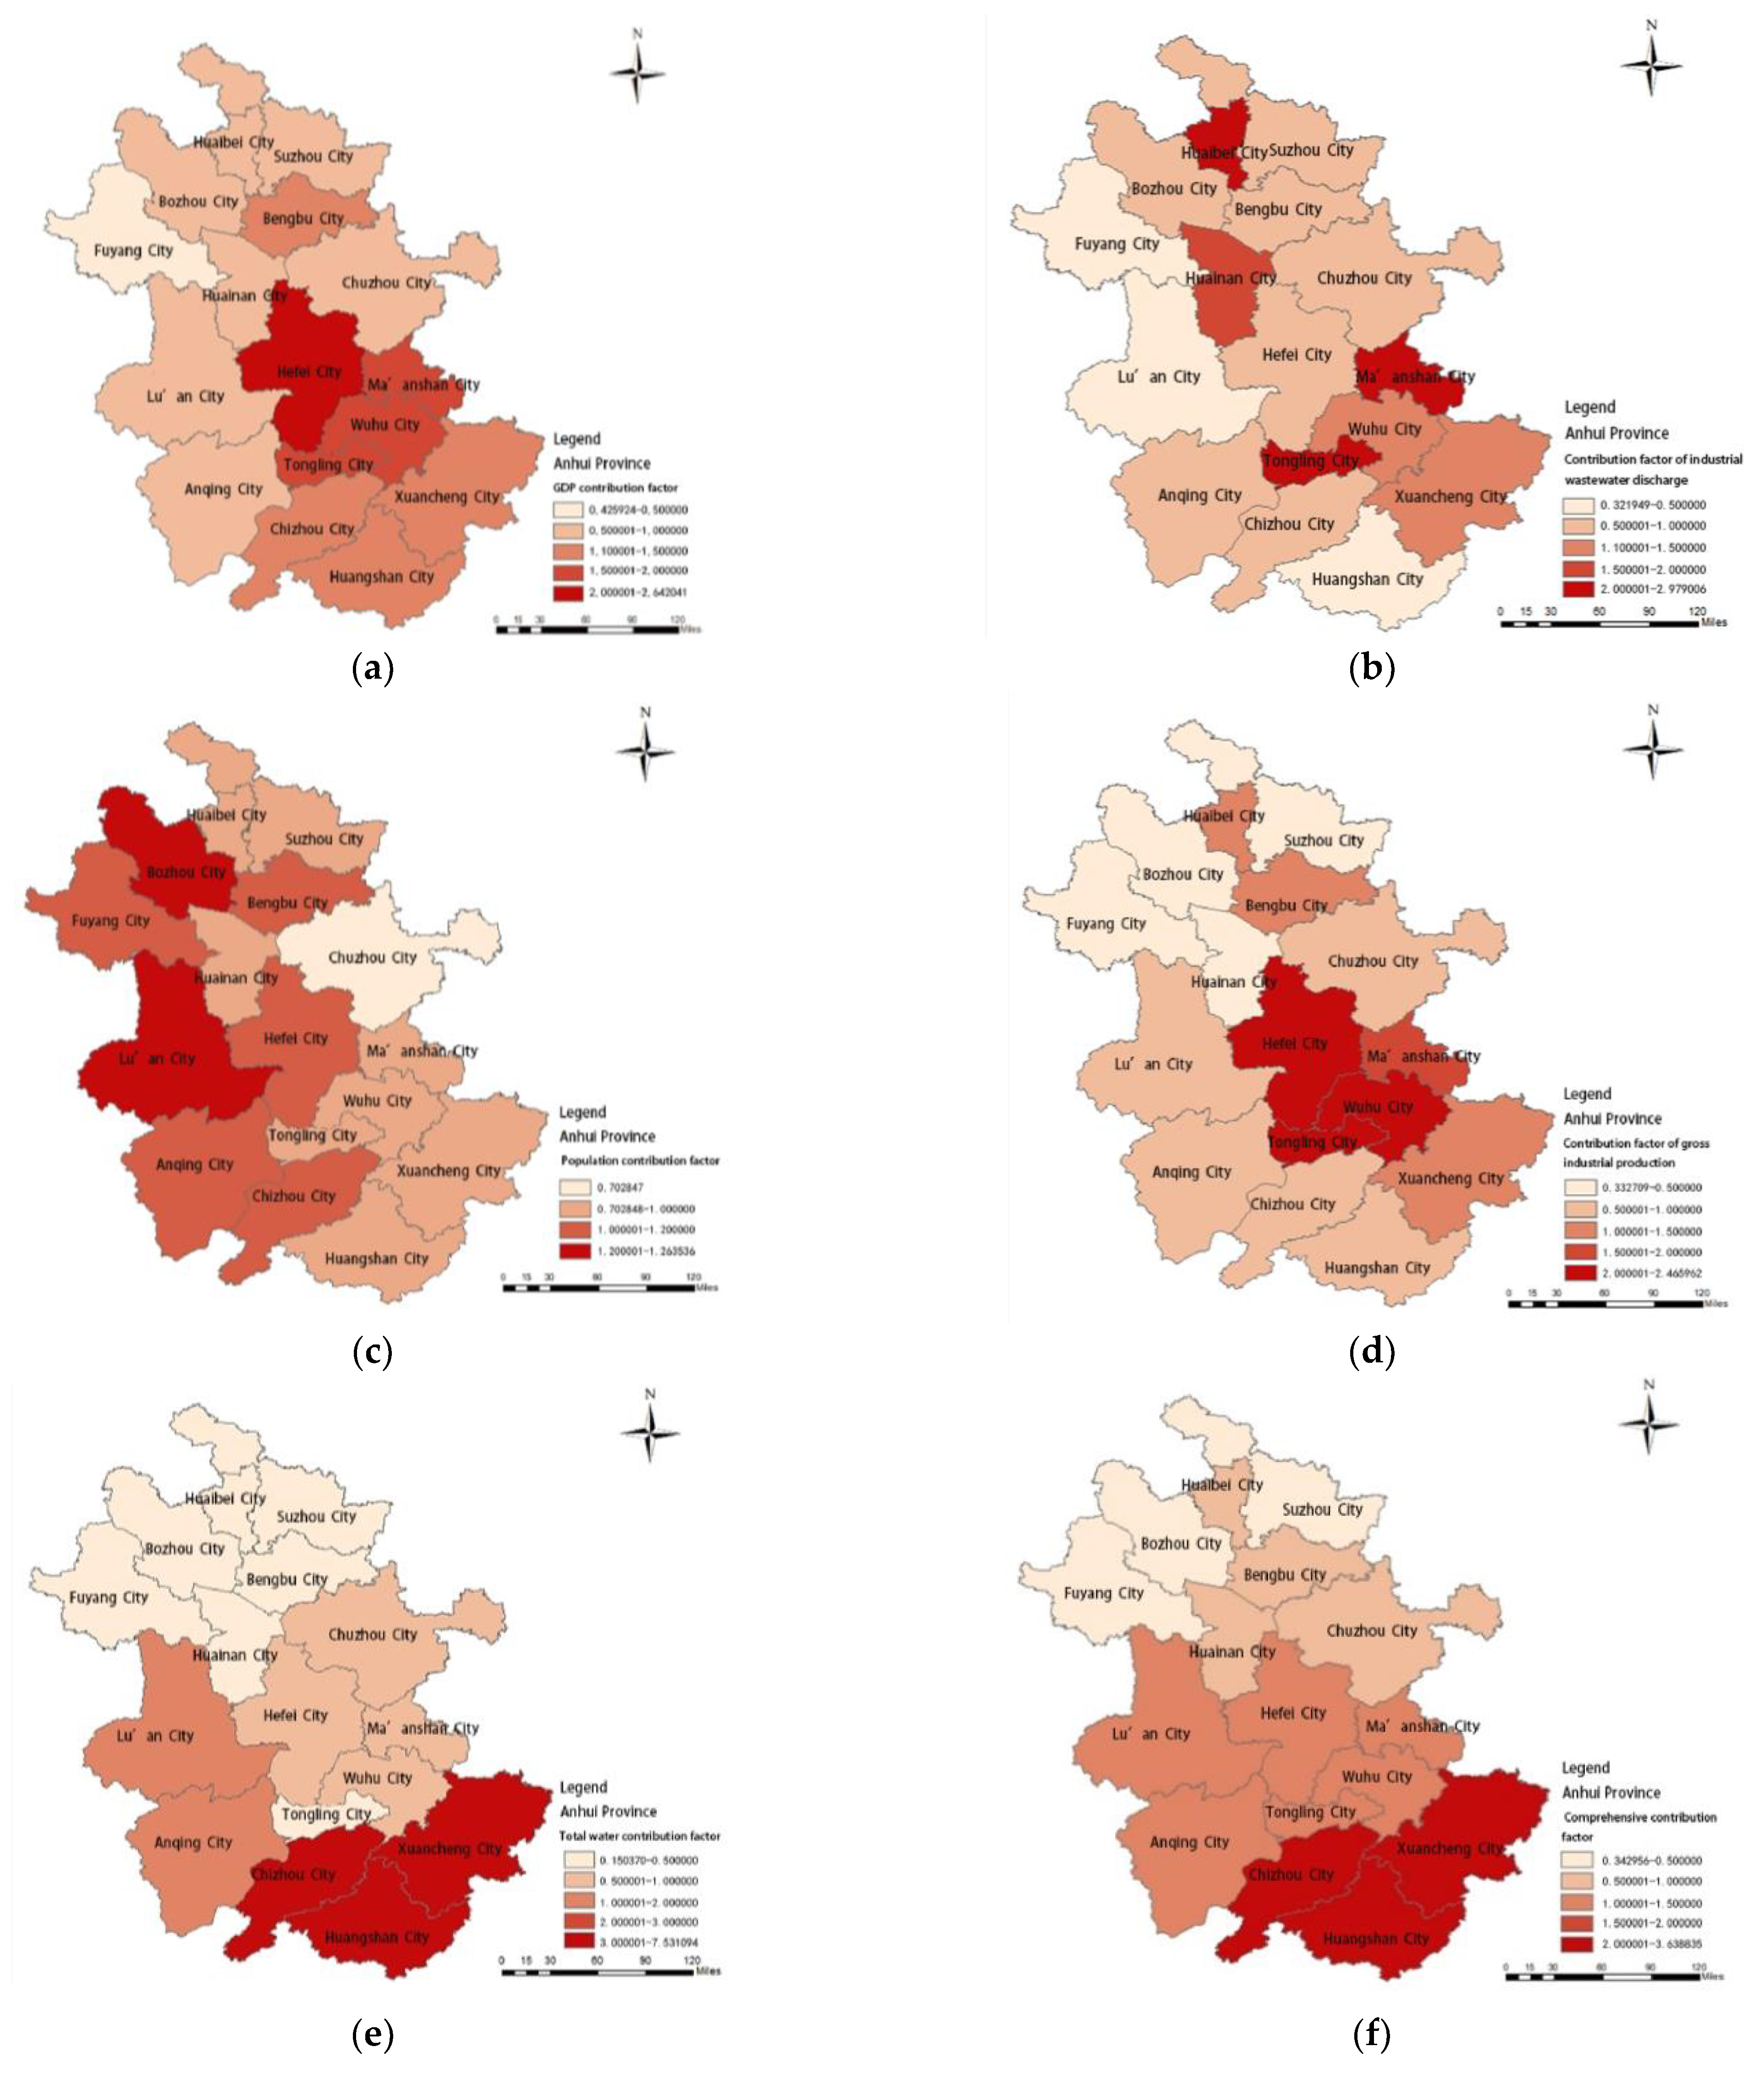
3.1.2. Study of the Environmental Contribution Factor of the Region
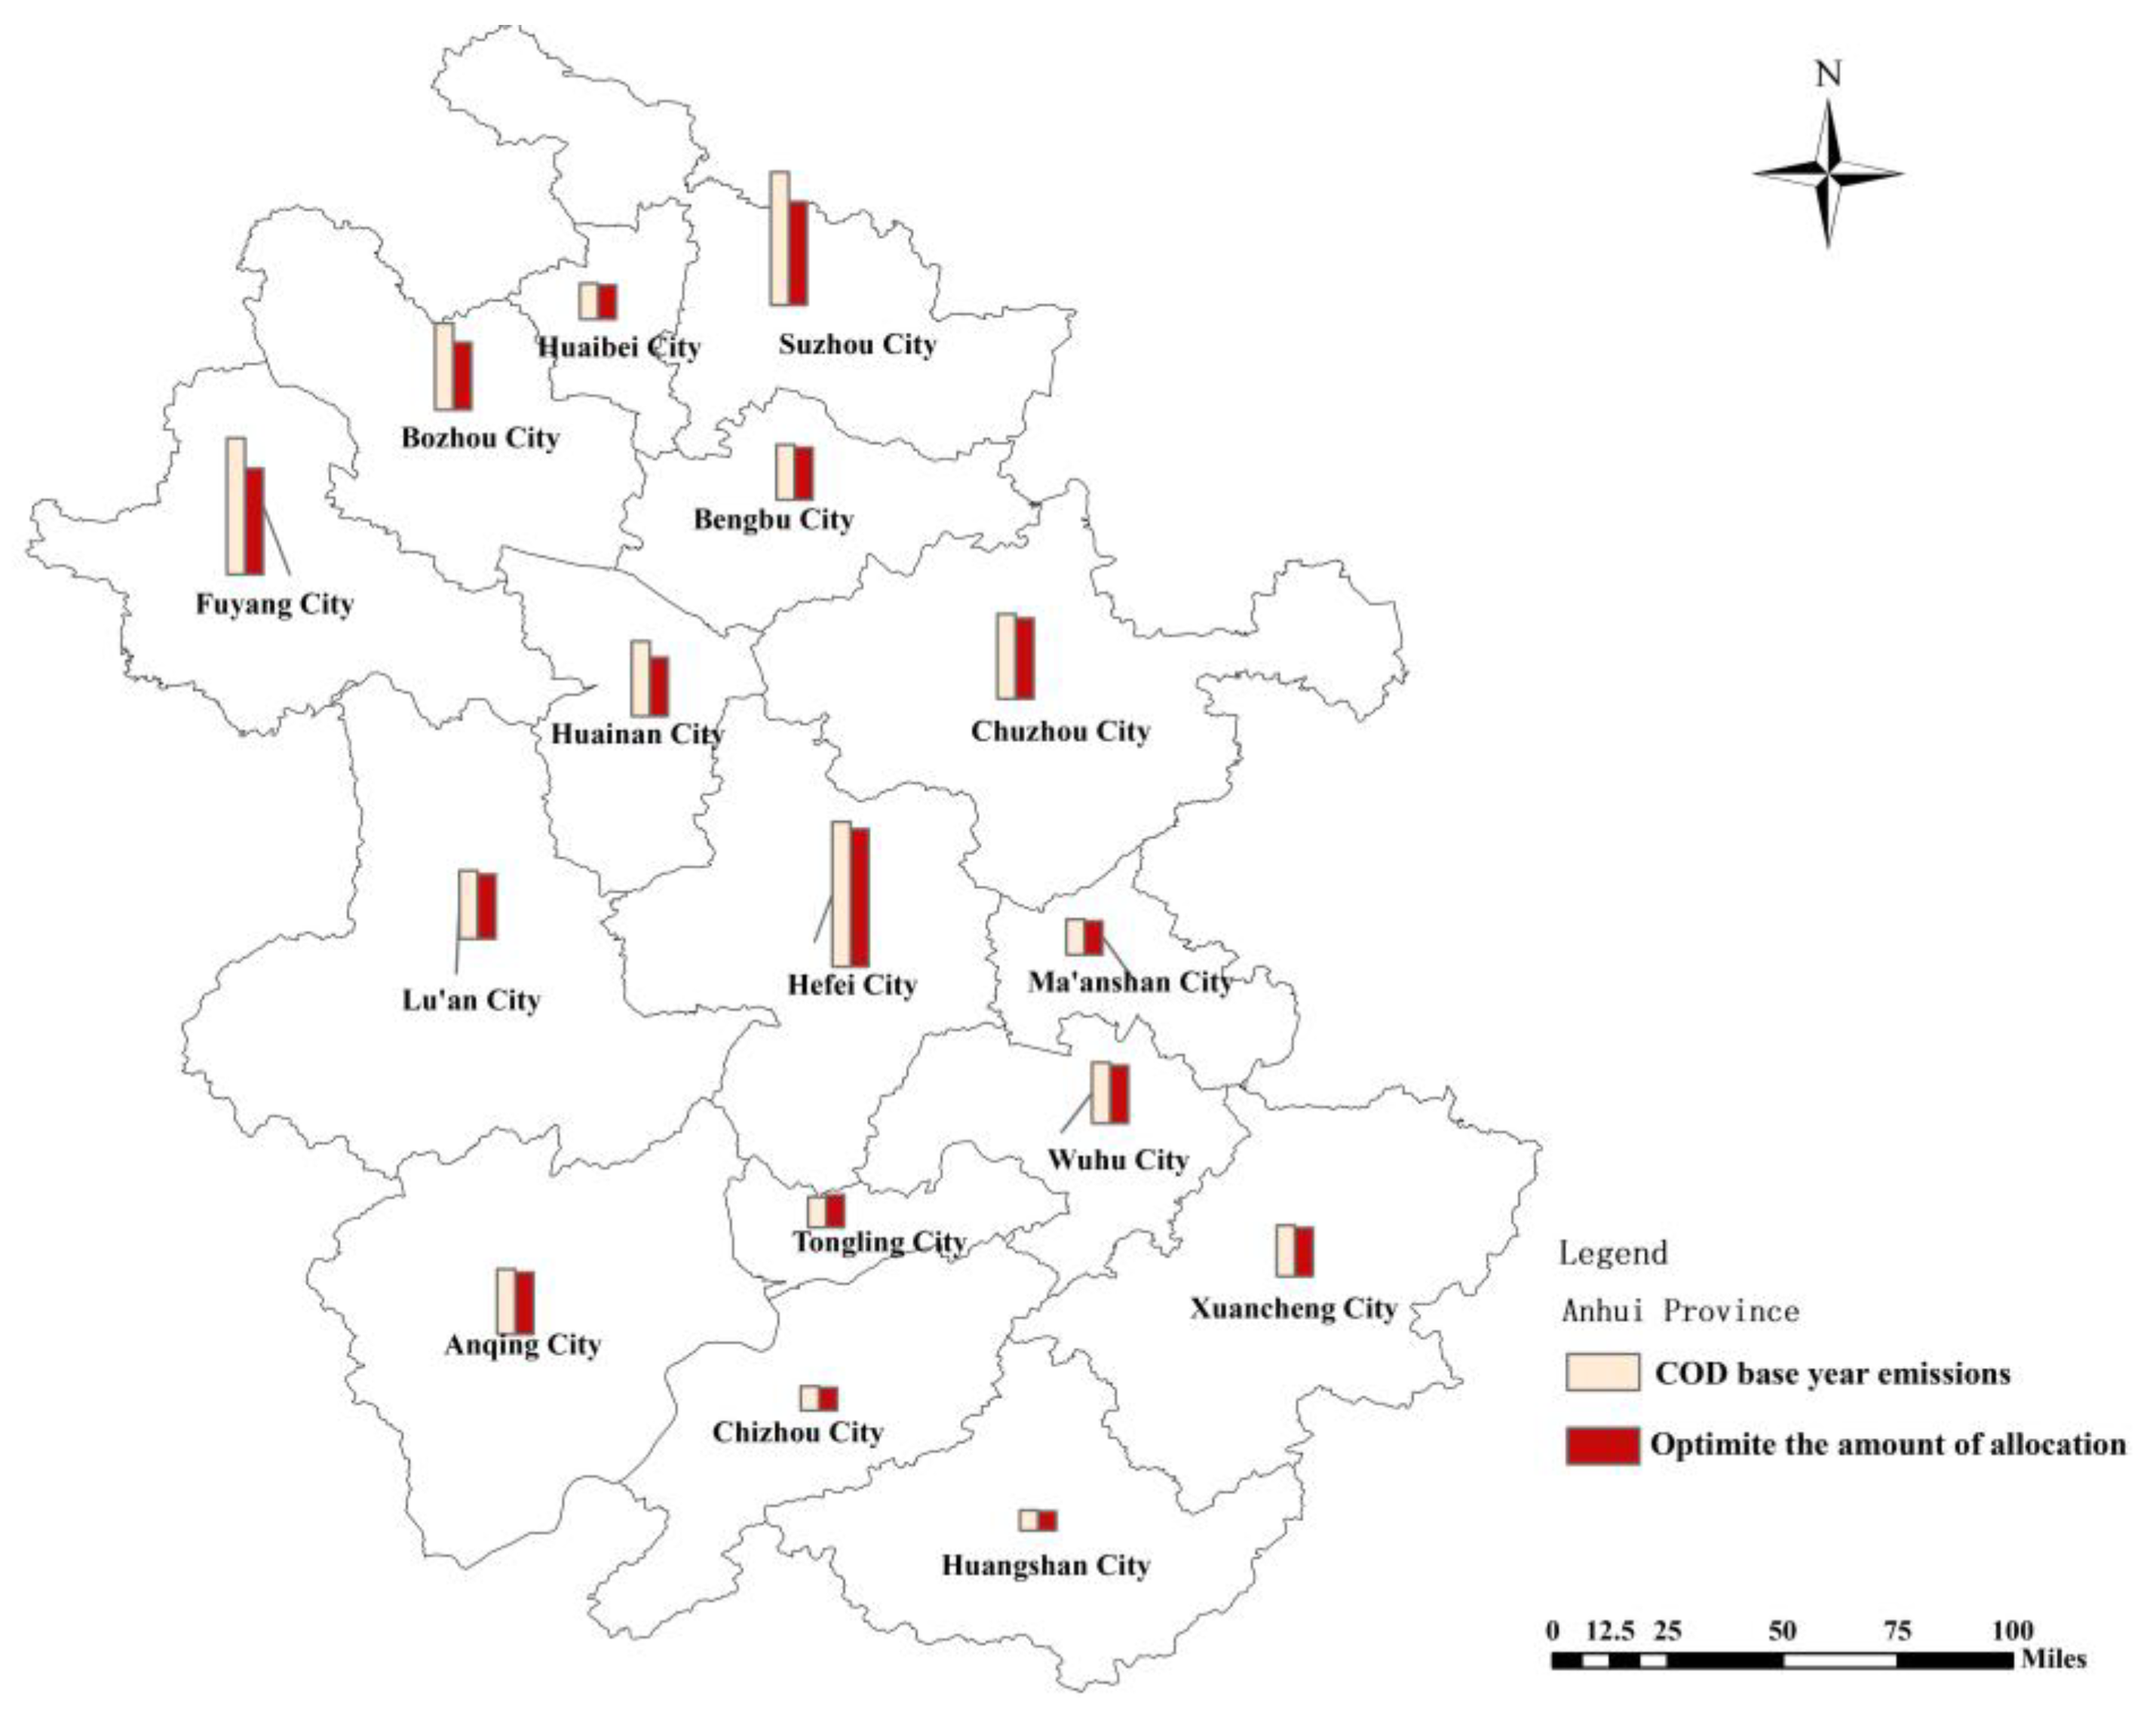
3.2. Optimal Allocation Results of Pollution Load in Anhui Province
3.3. Discussions
4. Conclusions
- (1)
- Under the principles of sustainable development of the water environment, economic and social fairness, and efficiency, this paper proposes a comprehensive management model of multi-objective and uncertain optimization of the total amount of regional water pollution discharge and constructs a multi-objective decision-making optimization model of water pollution load (COD and NH3-N) allocation that takes into account economic optimum and fairness.
- (2)
- A solution method for the uncertain multi-objective allocation model is designed in this study, and the practicability and feasibility of the model solution method are verified by a case study. The results of multiple simulation–optimization can generate a series of decision schemes under uncertain objective functions and constraints and provide a more reasonable decision range for decision makers.
- (3)
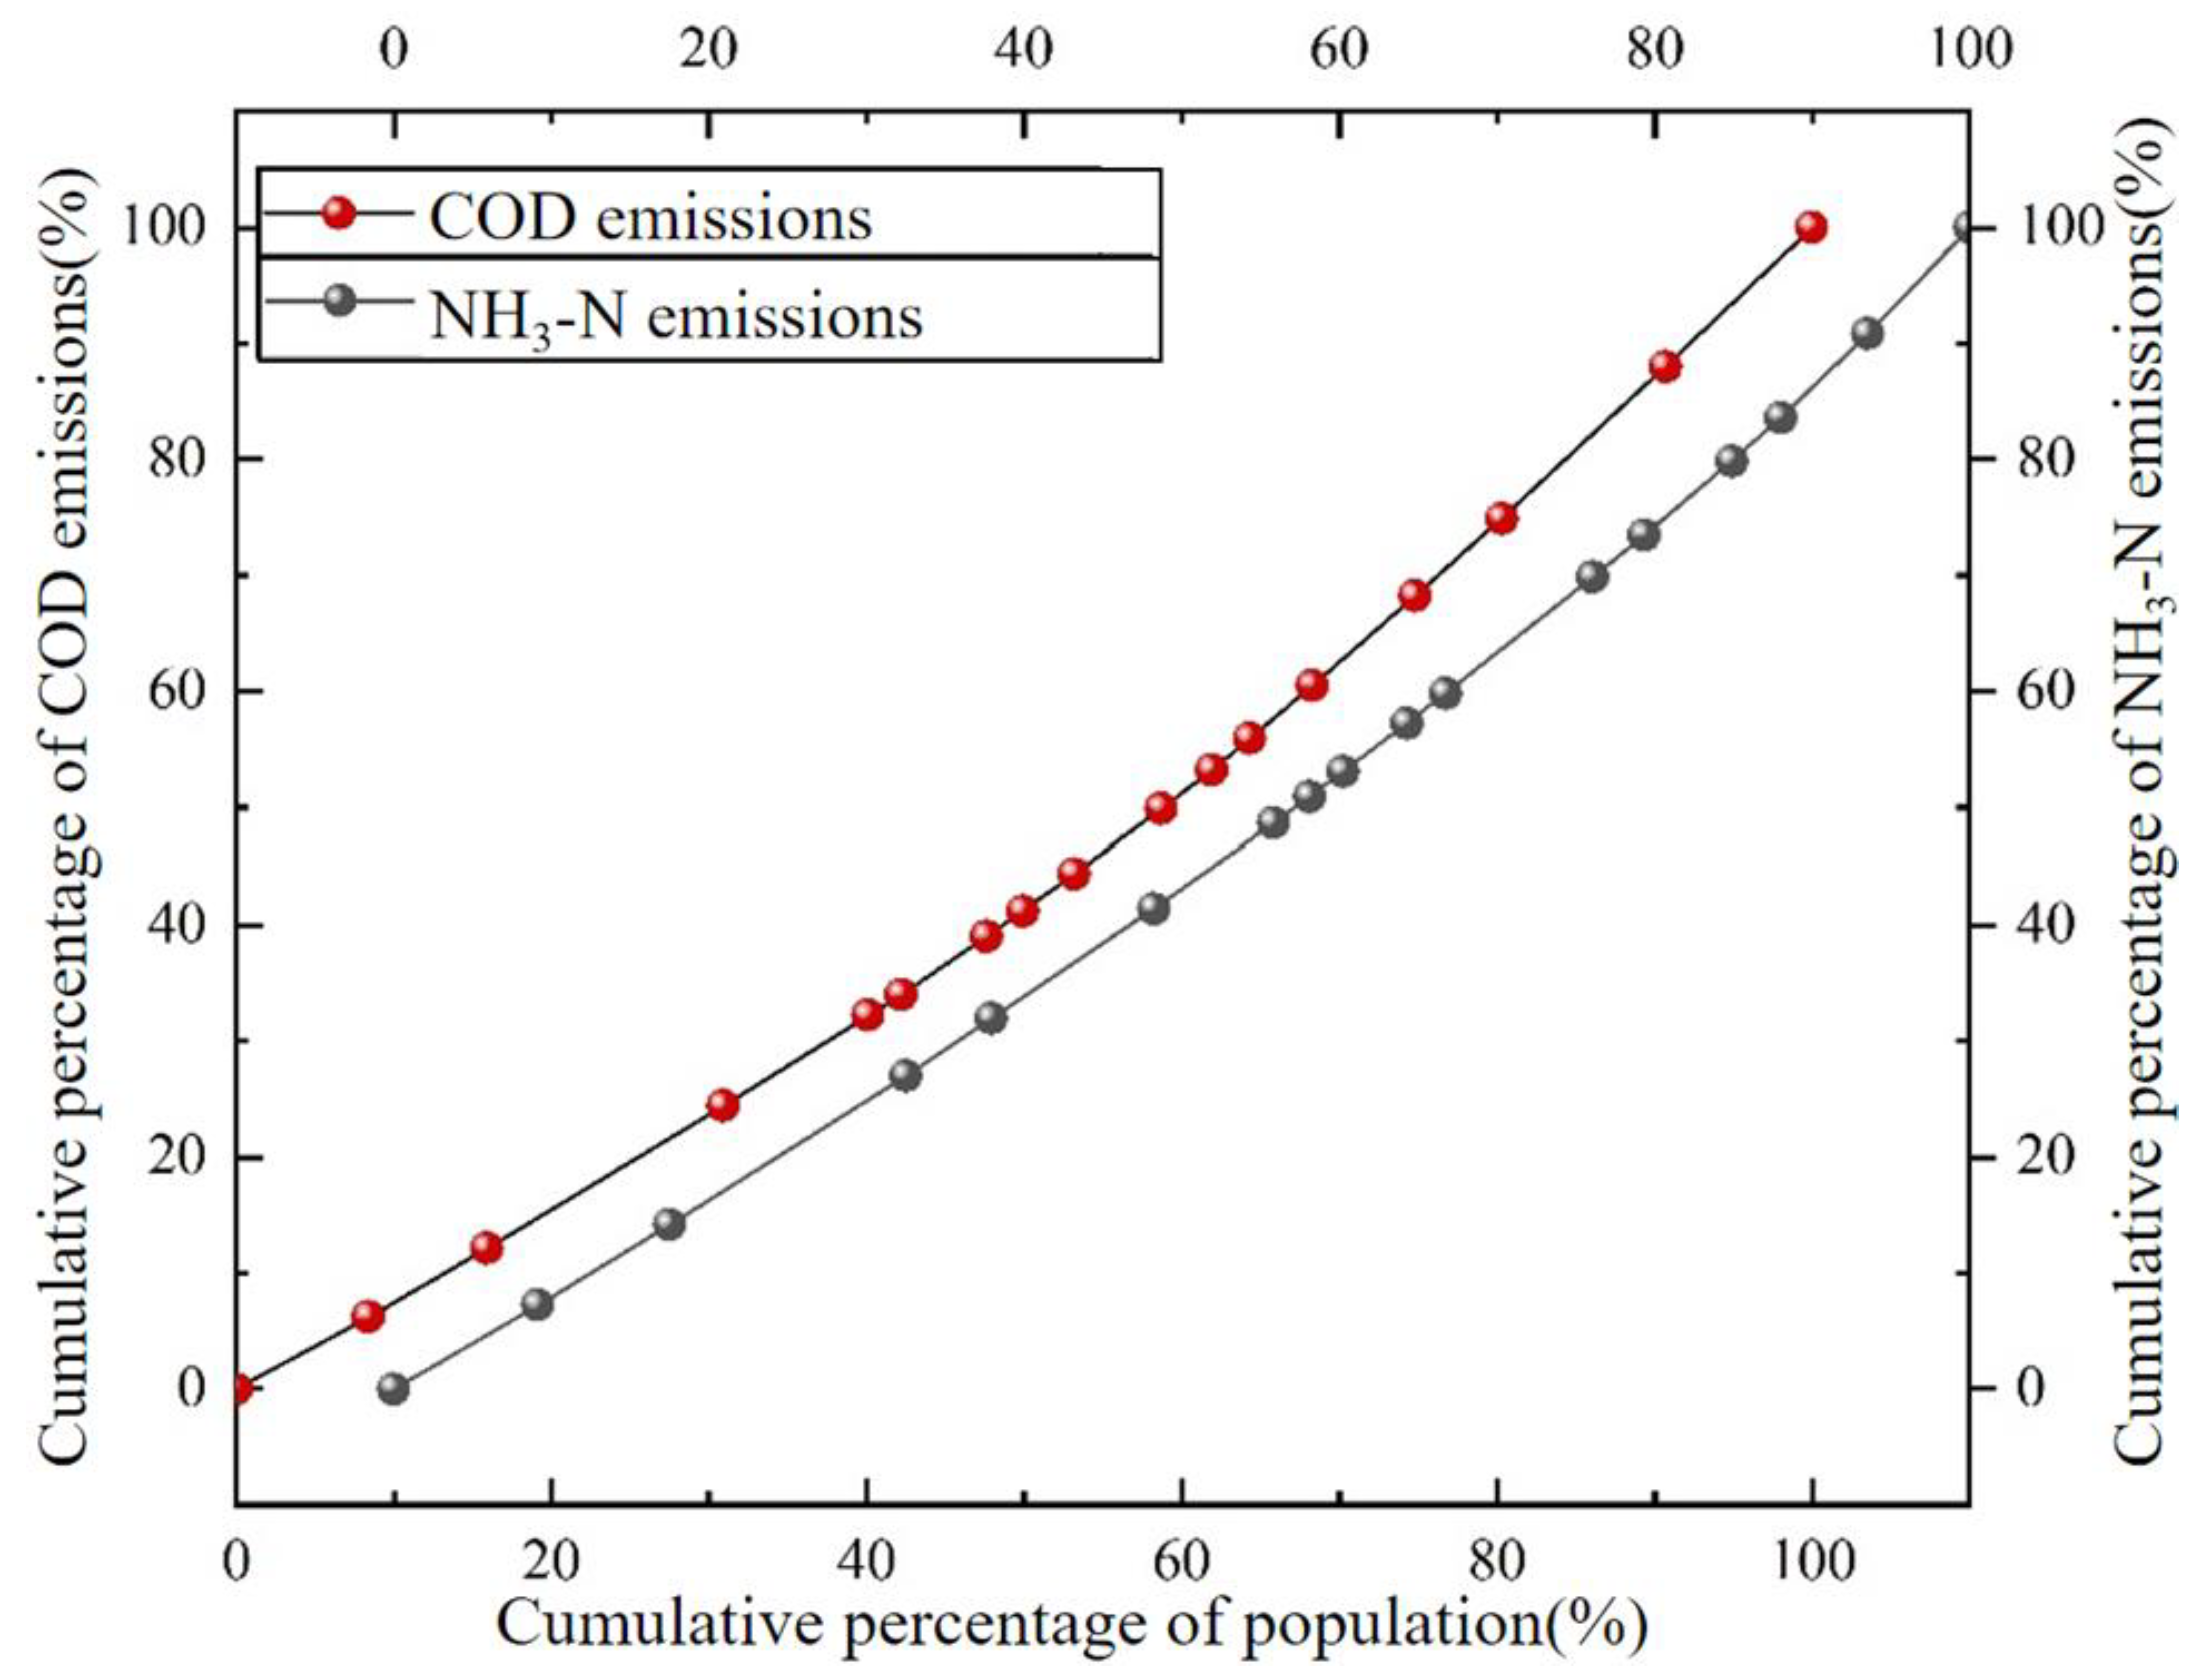
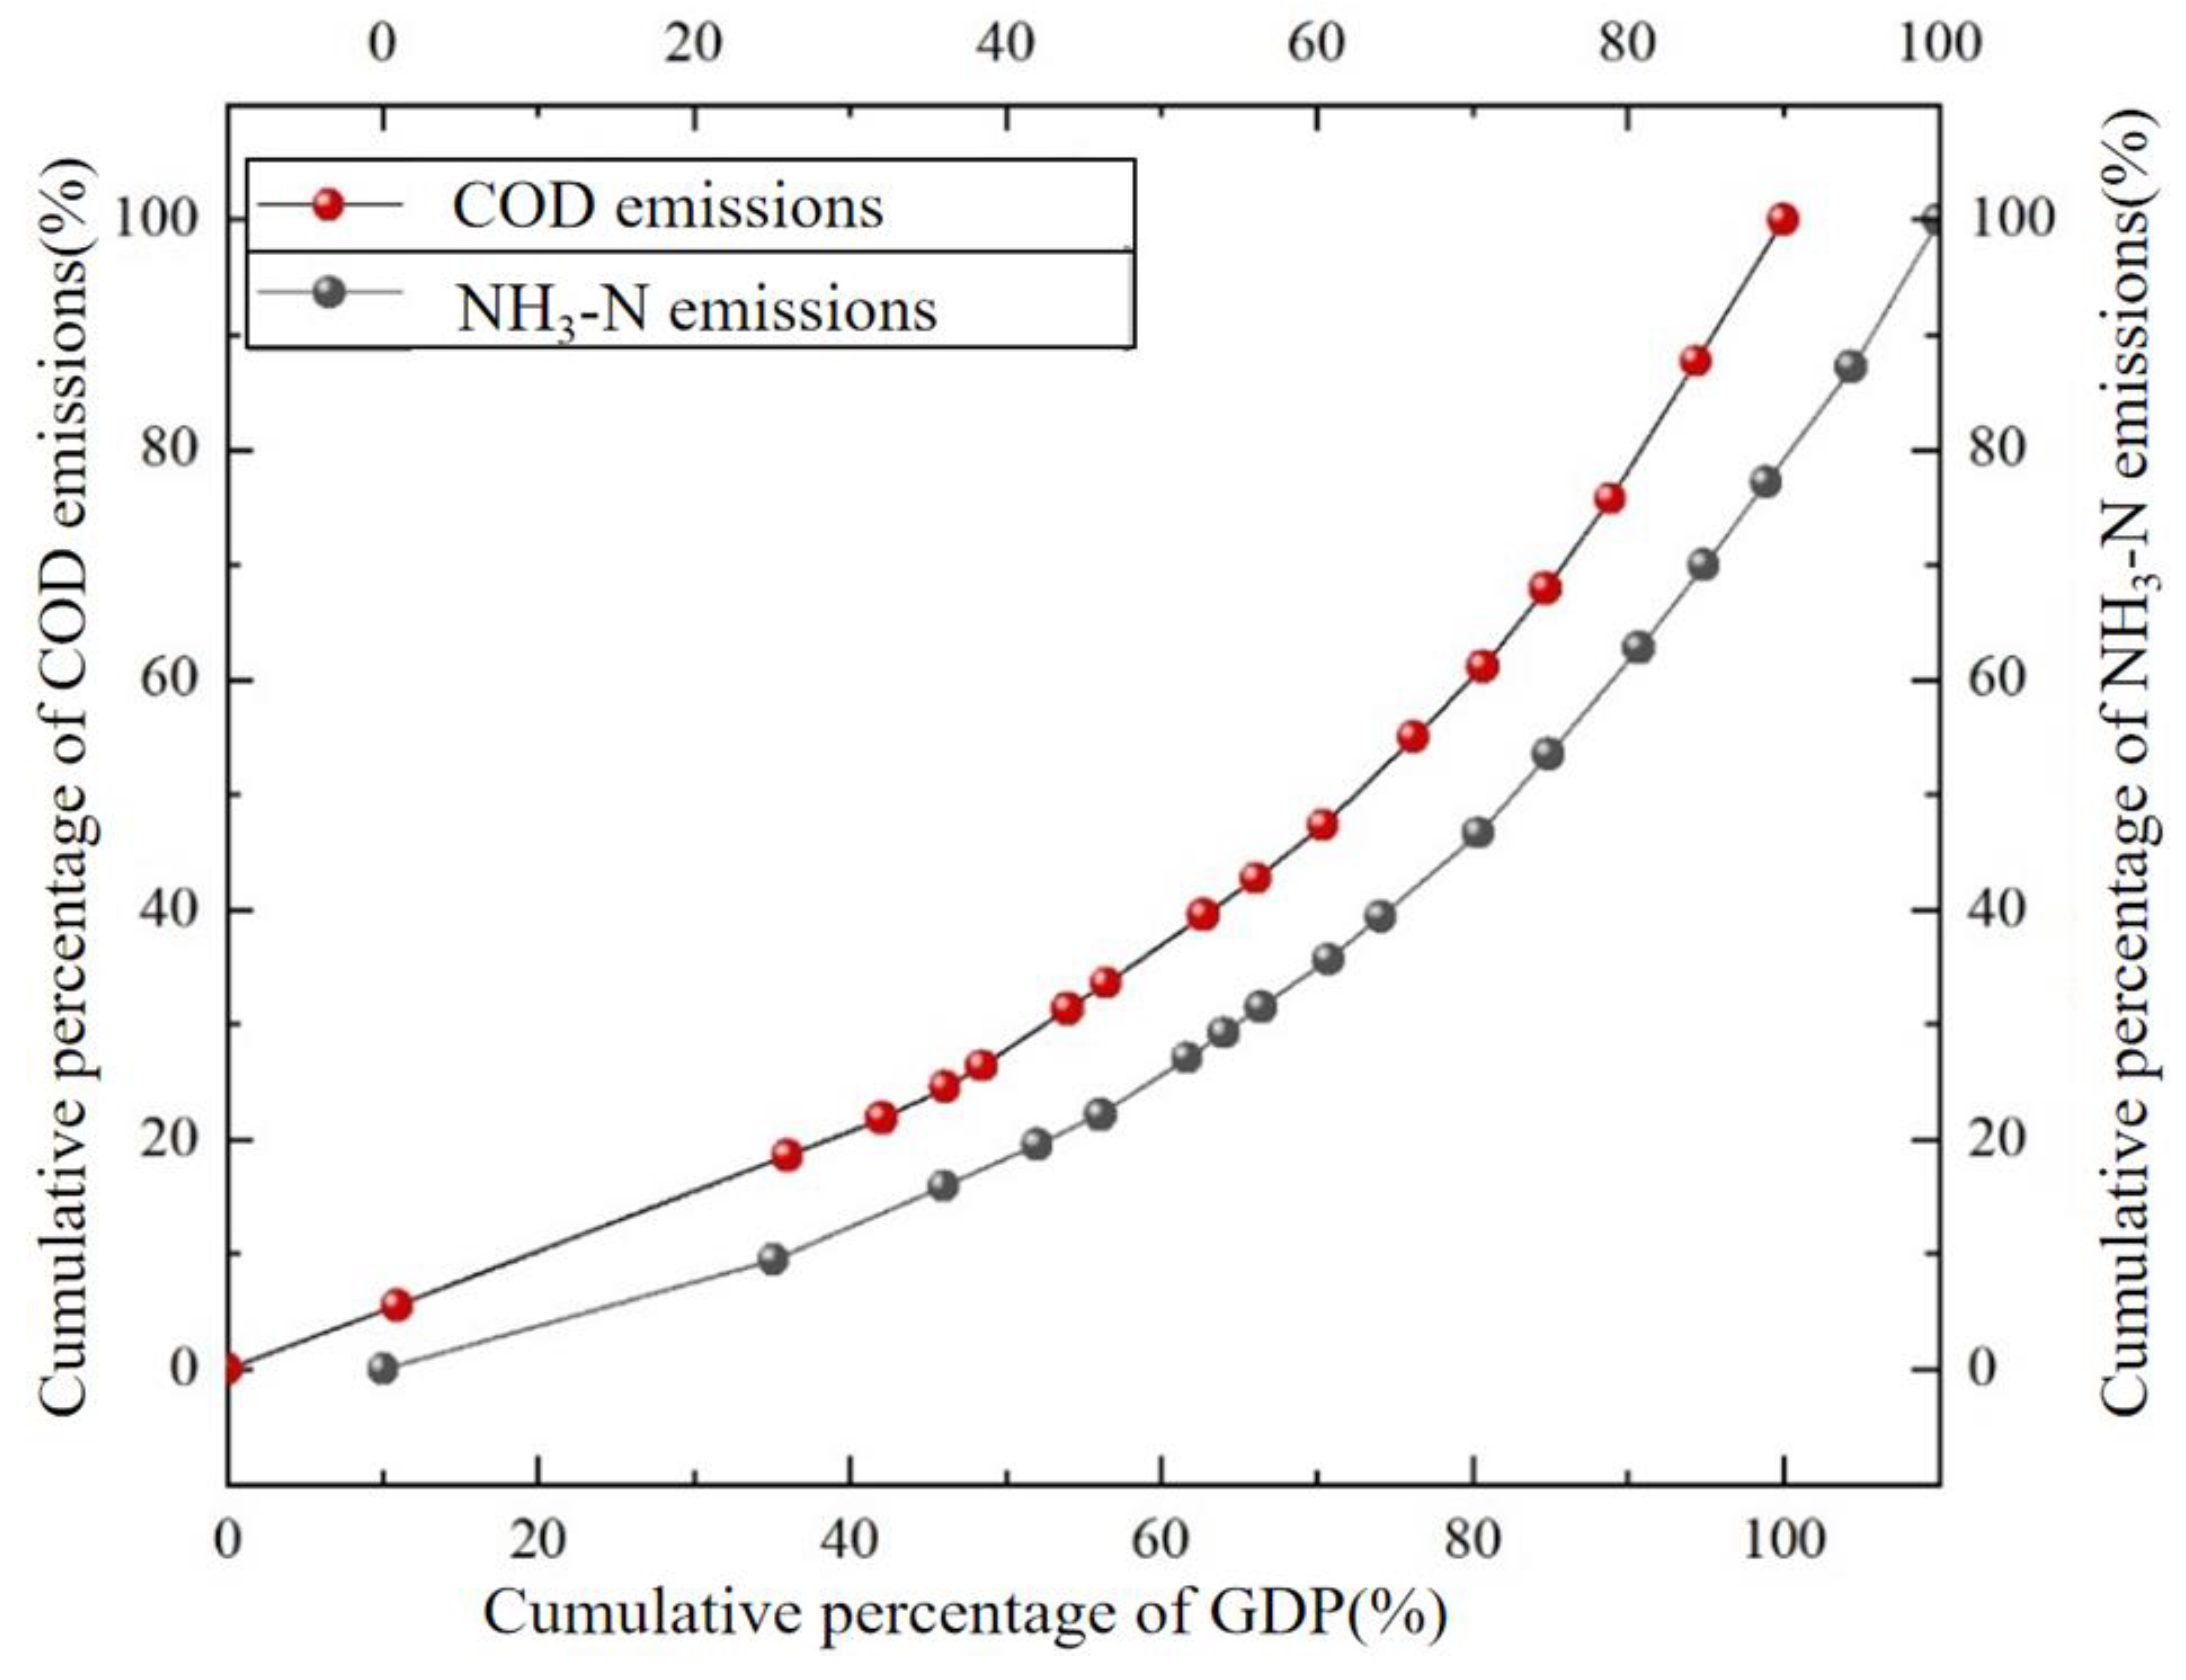
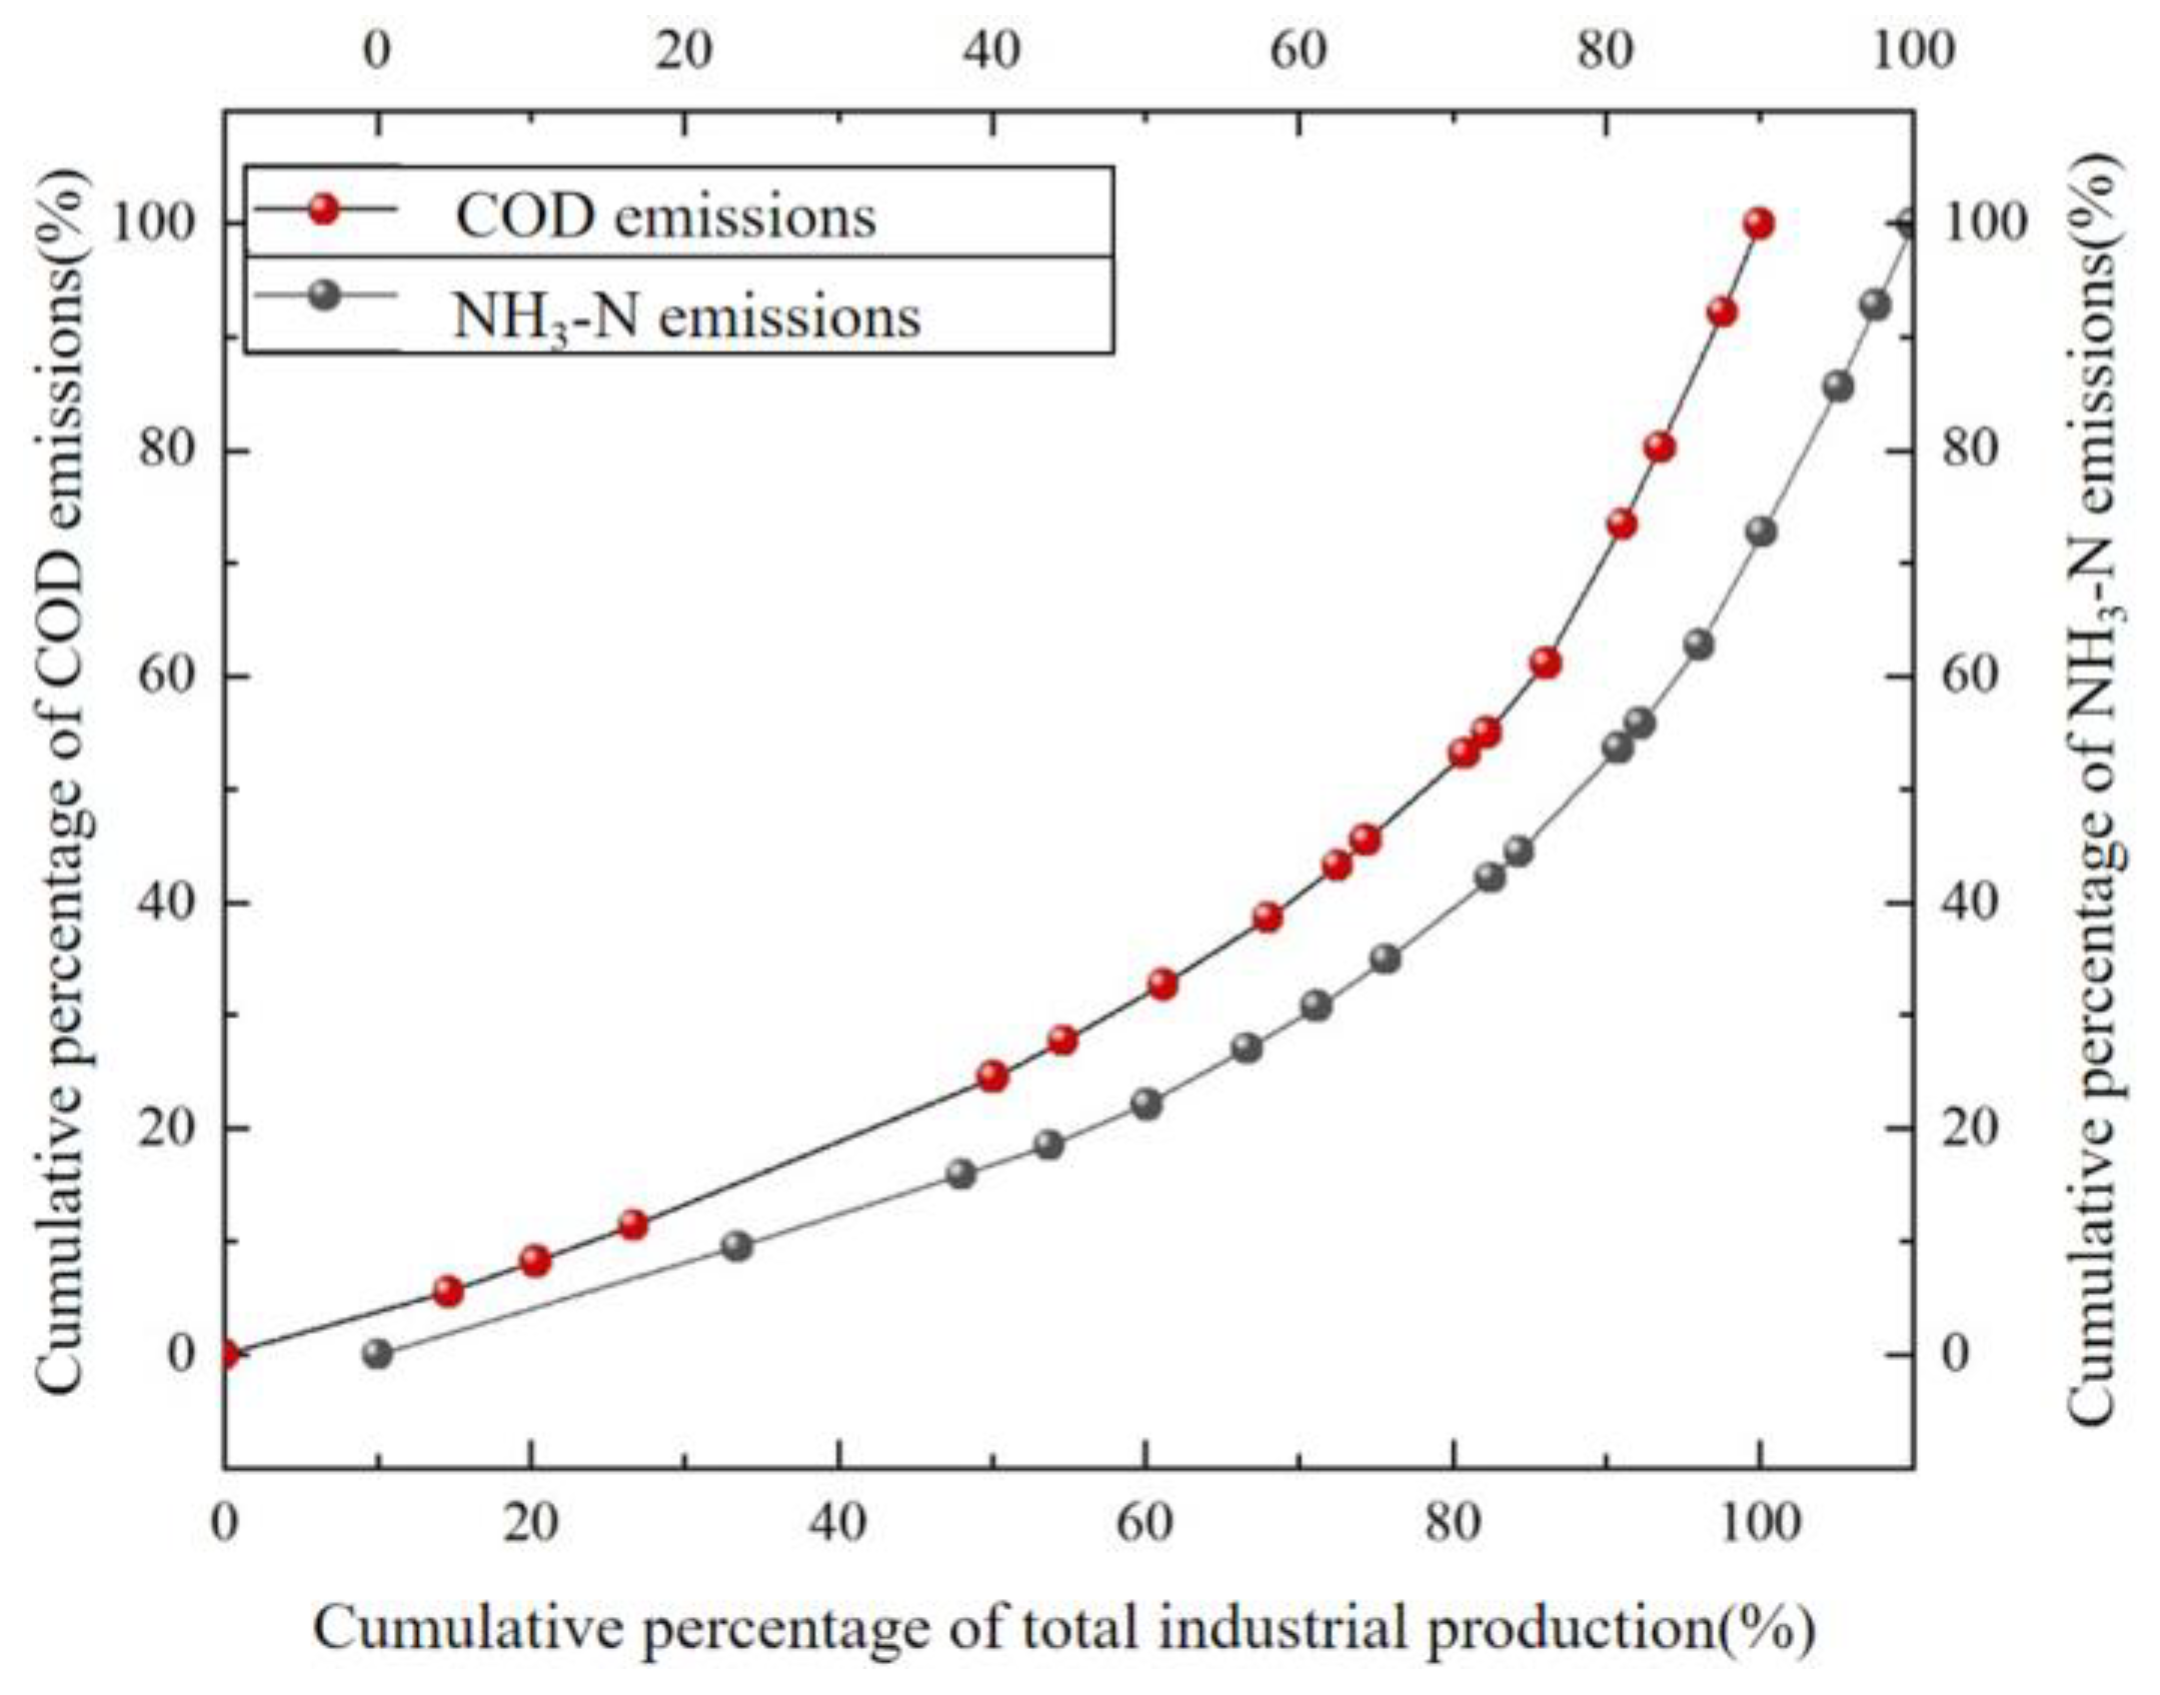
- The model was applied to the allocation of total pollutant reduction in Anhui Province’s 13th Five-Year Plan for Environmental protection. Based on the environmental Gini coefficient, the rationality of the total pollutant distribution system in Anhui Province was evaluated, and the comprehensive Gini coefficients of COD and NH3-N were calculated to be 0.43152 and 0.42952, respectively. The Gini coefficients based on the total water resources were 0.59 and 0.57, which exceeded the warning value and were the main inequity factors.
- (4)
- After the optimization of water pollution load distribution, the comprehensive Gini coefficients of COD and NH3-N are reduced in different ranges. The comprehensive Gini coefficient decreases by 2.4~4.6% after COD optimization and 25.1~32.5% after NH3-N optimization. The control of total pollutant discharge is a long-term and continuous task, and the fairness of distribution is also gradually optimized and adjusted, which is the direction of further research.
Author Contributions
Funding
Data Availability Statement
Acknowledgments
Conflicts of Interest
References
- Wang, Z.; Ye, A.; Liu, K.; Tan, L. Optimal Model of Desalination Planning Under Uncertainties in a Water Supply System. Water Resour. Manag. 2021, 35, 3277–3295. [Google Scholar] [CrossRef]
- Cui, Y.; Ning, S.; Jin, J.; Jiang, S.; Zhou, Y.; Wu, C. Quantitative Lasting Effects of Drought Stress at a Growth Stage on Soybean Evapotranspiration and Aboveground BIOMASS. Water 2021, 13, 18. [Google Scholar] [CrossRef]
- Pan, Z.; Jin, J.; Li, C.; Ning, S.; Zhou, R. A Connection Entropy Approach to Water Resources Vulnerability Analysis in a Changing Environment. Entropy 2017, 19, 591. [Google Scholar] [CrossRef] [Green Version]
- Zhang, M.; Wang, J.; Zhou, R. Attribution Analysis of Hydrological Drought Risk Under Climate Change and Human Activities: A Case Study on Kuye River Basin in China. Water 2019, 11, 1958. [Google Scholar] [CrossRef] [Green Version]
- Zhang, M.; Zhou, J.; Zhou, R. Interval Multi-Attribute Decision of Watershed Ecological Compensation Schemes Based on Projection Pursuit Cluster. Water 2018, 10, 1280. [Google Scholar] [CrossRef] [Green Version]
- Xiang, X.; Wu, X.; Chen, X.; Song, Q.; Xue, X. Integrating Topography and Soil Properties for Spatial Soil Moisture Storage Modeling. Water 2017, 9, 647. [Google Scholar] [CrossRef] [Green Version]
- Deng, Y.; Zheng, S.; Li, Z.; Hao, C.; Zheng, B. The innovation and future development of total pollutant control system. Res. Environ. Sci. 2021, 34, 382–388. [Google Scholar]
- Chen, L.; Han, L.; Tan, J.; Zhang, F.; Lin, Y. Optimization distribution model of point-point source pollution load in river network based on multi-section water quality standard. Water Resour. Prot. 2021, 37, 128–134+141. [Google Scholar]
- Yang, Y.; Zhao, Q.; Han, C.; Xing, C.; Song, L.; Hu, Z. Research on total amount allocation of sea and watershed water pollutants based on fairness principle. Mar. Environ. Sci. 2019, 38, 796–803. [Google Scholar]
- Zhang, X.; Wang, P.; He, Y.; Du, Z.; Luo, J.; Xie, J. Study of two-layer multi-objective optimization model for water pollution load distribution in rivers. J. Xi’an Univ. Technol. 2020, 36, 475–485. [Google Scholar]
- Li, R.; Shu, K. Model for wastewater load allocation based on multi-objective decision making. Acta Sci. Circumst. 2011, 31, 2814–2821. [Google Scholar]
- Wang, X.; Pang, M.; Zhao, M. Pollution Load Capacity Calculation Study Based on Multi-objective System in Trans-boundary Area, Plain River Network. Bull. Environ. Contam. Tox. 2021, 106, 600–607. [Google Scholar] [CrossRef] [PubMed]
- Liu, Q.; Li, Z.; Yao, G. Research on equity of total water pollutant distribution based on Gini coefficient. China Water Wastewater 2016, 32, 90–94. [Google Scholar]
- Wu, F.; Cao, Q.; Zhang, D.; Sun, F.; Shen, J. Allocation of flood drainage rights of Sunan Canal based on environmental Gini coefficient. J. Hohai Univ. (Nat. Sci.) 2020, 48, 314–319. [Google Scholar]
- Kolluru, M.; Semenenko, T. Income Inequalities in EU Countries: Gini Indicator Analysis. ECONOMICS-Innov. Econ. Res. 2021, 9, 125–142. [Google Scholar] [CrossRef]
- Zaeimi, M.B.; Rassafi, A.A. Designing an integrated municipal solid waste management system using a fuzzy chance-constrained programming model considering economic and environmental aspects under uncertainty. Waste Manag. 2021, 125, 268–279. [Google Scholar] [CrossRef]
- Liu, Q.; Jiang, J.; Jing, C.; Liu, Z.; Qi, J. A New Water Environmental Load and Allocation Modeling Framework at the Medium—Large Basin Scale. Water 2019, 11, 2398. [Google Scholar] [CrossRef]
- Wang, M.; Gong, H. Imbalanced Development and Economic Burden for Urban and Rural Wastewater Treatment in China—Discharge Limit Legislation. Sustainability 2018, 10, 2597. [Google Scholar] [CrossRef] [Green Version]
- Chen, W.; Zhang, M.; Zhao, W. Study on multi-objective optimal allocation of water resources system under uncertainties. J. Hydro. Eng. 2021, 40, 12–24. [Google Scholar]
- Xie, Y.; Zhou, X. Income inequality in today’s China. Proc. Natl. Acad. Sci. USA 2014, 111, 6928–6933. [Google Scholar] [CrossRef] [Green Version]
- Zhang, F. Study on the Total Pollution Distribution in the Middle Reaches of Fenhe Based on Information Entropy and Gini Coefficient Method. Master’s Thesis, Xi’an University of Technology, Xi’an, China, 2021. [Google Scholar]
- Shu, H.; Xiong, P. Construction of Gini Coefficient of a mixed environment and its Application in the evaluation of industrial economy and ecological spatial equilibrium. Math. Pract. Theory 2018, 48, 9–17. [Google Scholar]
- Steinberger, J.K.; Krausmann, F.; Eisenmenger, N. Global patterns of materials use: A socioeconomic and geophysical analysis. Ecol. Econ. 2010, 69, 1148–1158. [Google Scholar] [CrossRef]
- Cheng, Y.; Li, Y.; Zhu, X.; Shi, Y.; Zhu, Y.; Pan, H.; Xu, Y.; Cheng, Y. Total pollutant load allocation in plain river network based on the entropy-environmental Gini coefficient method. J. Lake Sci. 2020, 32, 619–628. [Google Scholar]
- Shu, K. Model and Method of Water Waste Loads Allocation in a Region-Case of Chaohu Lake Basin. Master’s Thesis, Hefei University of Technology, Hefei, China, 2010. [Google Scholar]
- Yu, S.; Lu, H. Integrated watershed management through multi-level and stepwise optimization for allocation of total load of water pollutants at large scales. Environ. Earth Sci. 2018, 77, 373. [Google Scholar] [CrossRef]
- Wu, W.; Jiang, H.; Duan, Y.; Liu, N.; Lu, Y.; Zhang, W.; Yu, S. Application of total water pollutant load distribution in control-unit based on the environmental Gini coefficient. China Popul. Resour. Environ. 2017, 27, 8–16. [Google Scholar]
- Marler, R.T.; Arora, J.S. The weighted sum method for multi-objective optimization: New insights. Struct. Multidiscip. Optim. 2010, 41, 853–862. [Google Scholar] [CrossRef]
- Jin, J.; Ding, J. Genetic Algorithm and Its Application in Water Science; Sichuan University Press: Chengdu, China, 2000. [Google Scholar]
- Li, C.; Chen, J.; Wang, R.; Huang, J.; Qian, Z.; Xu, Y. Multi-indices analysis of heavy precipitation changes in Anhui Province, China. Meteorol. Atmos. Phys. 2021, 133, 1317–1325. [Google Scholar] [CrossRef]
- Tan, W.; Zhang, C.; Liu, X. Research on the compilation of the Atlas of the First National Census of Geographical Conditions in Anhui Province. Intell. City 2020, 6, 52–53. [Google Scholar]
- Anhui Provincial Department of Environmental Protection. 13th Five-Year Plan for Environmental Protection of Anhui Province; Anhui Provincial People’s Government: Hefei, China, 2017.
- Anhui Provincial Bureau of Statistics. Anhui Statistical Yearbook-2016; China Statistics Press: Beijing, China, 2016. [Google Scholar]
- Qin, D.; Wei, A.; Lu, S.; Luo, Y.; Liao, Y.; Yi, M.; Song, B. Total water pollutant load allocation in Dongting Lake area based on the environmental Gini coefficient method. Res. Environ. Sci. 2013, 26, 8–15. [Google Scholar]





| Region | Pollutant Discharge | Indicators of Evaluation | |||||
|---|---|---|---|---|---|---|---|
| COD (10,000 tons) | NH3-N (10,000 tons) | Population (10,000 People) | GDP (CNY 100 million) | Water Volume (100 million m3) | Industrial Output Value (CNY 100 million) | Wastewater Discharge (10,000 tons) | |
| Hefei | 11.4 | 0.92 | 717.72 | 5660.27 | 48.63 | 9345.59 | 5334.98 |
| HuaiBei | 2.8 | 0.36 | 216.5 | 760.39 | 5.99 | 1814.6 | 5377.67 |
| Bozhou | 6.81 | 0.7 | 634.95 | 942.61 | 22.25 | 959.39 | 3501.66 |
| Suzhou | 10.43 | 0.97 | 649.51 | 1235.83 | 22.39 | 1,623.25 | 6126.77 |
| Bengbu | 4.33 | 0.48 | 376.35 | 1253.05 | 20.82 | 2,596.82 | 2474.02 |
| Fuyang | 10.73 | 1.24 | 1042.65 | 1267.45 | 30.28 | 1989.69 | 2946.11 |
| Huainan | 5.9 | 0.7 | 383.39 | 901.08 | 9.94 | 970.42 | 9112.06 |
| Chuzhou | 6.67 | 0.89 | 449.06 | 1305.7 | 54.83 | 2567.11 | 5859.72 |
| Lu’an | 5.36 | 0.67 | 580.53 | 1016.49 | 123.57 | 1542.1 | 2443.29 |
| Ma’anshan | 2.79 | 0.35 | 228.5 | 1365.3 | 22.15 | 2540.75 | 7694.53 |
| Wuhu | 4.8 | 0.62 | 384.79 | 2457.32 | 41.34 | 5829.01 | 4933.27 |
| Xuancheng | 4.02 | 0.4 | 279.95 | 971.46 | 126.68 | 1796.38 | 3664.98 |
| Tongling | 2.38 | 0.25 | 170.43 | 911.6 | 9.25 | 2269.01 | 5338.25 |
| Chizhou | 1.92 | 0.22 | 161.61 | 544.74 | 103.13 | 740.43 | 1422.11 |
| Anqing | 5.15 | 0.7 | 525.48 | 1417.43 | 123.52 | 2723.16 | 4469.63 |
| Huangshan | 1.6 | 0.21 | 147.69 | 530.9 | 149.35 | 567.95 | 736.62 |
| Total | 87.09 | 9.68 | 6949.11 | 22,541.6 | 914.12 | 39,875.7 | 71,435.7 |
| Evaluation Indicators | Population | GDP | Total Water Resources | Gross Industrial Output | Industrial Wastewater Discharge |
|---|---|---|---|---|---|
| COD | 0.11 | 0.30 | 0.59 | 0.33 | 0.34 |
| NH3-N | 0.10 | 0.32 | 0.57 | 0.39 | 0.32 |
| Pollutants | Population | GDP | Total Water Resources | Gross Industrial Output | Industrial Wastewater Discharge |
|---|---|---|---|---|---|
| COD | 0.022 | 0.130 | 0.417 | 0.247 | 0.184 |
| NH3-N | 0.021 | 0.126 | 0.430 | 0.232 | 0.191 |
| Pollutants | Region | Benchmark Annual Emissions (×104t) | Distributed Emissions (×104t) | Amount of Reduction (×104t) | Rate of Reduction/% | Reduction of Quotas/% |
|---|---|---|---|---|---|---|
| COD | Hefei | 11.4 | [10.69, 10.83] | [0.57, 0.71] | [5.0, 6.2] | 6.5 |
| HuaiBei | 2.8 | [2.51, 2.66] | [0.14, 0.29] | [5.0, 10.4] | 2.1 | |
| Bozhou | 6.81 | [5.11, 5.60] | [1.21, 1.70] | [17.8, 24.9] | 14.6 | |
| Suzhou | 10.43 | [7.82, 8.52] | [1.91, 2.61] | [18.3, 25.0] | 22.9 | |
| Bengbu | 4.33 | [3.97, 4.11] | [0.22, 0.36] | [5.1, 8.3] | 2.9 | |
| Fuyang | 10.73 | [8.05, 8.68] | [2.05, 2.68] | [19.1, 25.0] | 24 | |
| Huainan | 5.09 | [4.43, 4.83] | [0.26, 0.66] | [5.1, 13.0] | 4.4 | |
| Chuzhou | 6.67 | [6.11, 6.34] | [0.33, 0.56] | [5.0, 8.4] | 4.4 | |
| Lu’an | 5.36 | [4.76, 5.09] | [0.27, 0.60] | [5.0, 11.2] | 4.2 | |
| Ma’anshan | 2.79 | [2.56, 2.65] | [0.14, 0.23] | [5.0, 8.2] | 1.8 | |
| Wuhu | 4.80 | [4.47, 4.56] | [0.24, 0.33] | [5.0, 6.9] | 2.9 | |
| Xuancheng | 4.02 | [3.75, 3.82] | [0.20, 0.27] | [5.0, 6.7] | 2.4 | |
| Tongling | 2.38 | [2.16, 2.26] | [0.12, 0.22] | [5.0, 9.0] | 1.6 | |
| Chizhou | 1.92 | [1.72, 1.82] | [0.10, 0.20] | [5.0, 10.4] | 1.5 | |
| Anqing | 5.15 | [4.76, 4.89] | [0.26, 0.39] | [5.0, 7.6] | 3.2 | |
| Huangshan | 1.60 | [1.46, 1.52] | [0.08, 0.14] | [5.0, 8.8] | 1.0 | |
| Total | 87.09 | [74.33, 78.28] | [8.00, 11.95] | [9.2, 13.7] | 100 | |
| NH3-N | Hefei | 0.92 | [0.68, 0.828] | [0.09, 0.24] | [10, 26.1] | 8.4 |
| HuaiBei | 0.36 | [0.25, 0.32] | [0.04, 0.11] | [11, 30.6] | 3.8 | |
| Bozhou | 0.7 | [0.49, 0.63] | [0.07, 0.21] | [10, 30] | 7.1 | |
| Suzhou | 0.97 | [0.68, 0.84] | [0.13, 0.29] | [13.4, 29.9] | 10.6 | |
| Bengbu | 0.48 | [0.34, 0.43] | [0.05, 0.14] | [10.4, 29.2] | 4.8 | |
| Fuyang | 1.24 | [0.87, 1.03] | [0.21, 0.37] | [16.9, 29.8] | 14.7 | |
| Huainan | 0.7 | [0.49, 0.63] | [0.07, 0.21] | [10, 30.0] | 7.1 | |
| Chuzhou | 0.89 | [0.62, 0.80] | [0.09, 0.27] | [10.1, 30.3] | 9.1 | |
| Lu’an | 0.67 | [0.48, 0.60] | [0.07, 0.19] | [10.4, 28.4] | 6.6 | |
| Ma’anshan | 0.35 | [0.25, 0.31] | [0.04, 0.10] | [11.4, 28.6] | 3.5 | |
| Wuhu | 0.62 | [0.44, 0.55] | [0.07, 0.18] | [11.3, 29.0] | 6.3 | |
| Xuancheng | 0.4 | [0.29, 0.36] | [0.04, 0.11] | [10, 27.5] | 3.8 | |
| Tongling | 0.25 | [0.18, 0.22] | [0.03, 0.07] | [12.0, 28] | 2.5 | |
| Chizhou | 0.22 | [0.16, 0.19] | [0.03, 0.06] | [13.6, 27.3] | 2.3 | |
| Anqing | 0.7 | [0.49, 0.63] | [0.07, 0.21] | [10.0, 30] | 7.1 | |
| Huangshan | 0.21 | [0.15, 0.18] | [0.03, 0.06] | [14.2, 28.6] | 2.3 | |
| Total | 9.68 | [6.86, 8.60] | [1.13, 2.82] | [11.7, 29.1] | 100 |
| Pollutants | Benchmark Year | After Optimization | Range of Reduction |
|---|---|---|---|
| COD | 0.4315 | [0.4117, 0.4210] | [−4.6%, −2.4%] |
| NH3-N | 0.4295 | [0.2901, 0.3216] | [−32.5%, −25.1%] |
Disclaimer/Publisher’s Note: The statements, opinions and data contained in all publications are solely those of the individual author(s) and contributor(s) and not of MDPI and/or the editor(s). MDPI and/or the editor(s) disclaim responsibility for any injury to people or property resulting from any ideas, methods, instructions or products referred to in the content. |
© 2023 by the authors. Licensee MDPI, Basel, Switzerland. This article is an open access article distributed under the terms and conditions of the Creative Commons Attribution (CC BY) license (https://creativecommons.org/licenses/by/4.0/).
Share and Cite
Zhou, R.; Sun, Y.; Chen, W.; Zhang, K.; Shao, S.; Zhang, M. A Multi-Objective Decision Model for Water Pollution Load Allocation under Uncertainty. Water 2023, 15, 309. https://doi.org/10.3390/w15020309
Zhou R, Sun Y, Chen W, Zhang K, Shao S, Zhang M. A Multi-Objective Decision Model for Water Pollution Load Allocation under Uncertainty. Water. 2023; 15(2):309. https://doi.org/10.3390/w15020309
Chicago/Turabian StyleZhou, Runjuan, Yingke Sun, Wenyuan Chen, Kuo Zhang, Shuai Shao, and Ming Zhang. 2023. "A Multi-Objective Decision Model for Water Pollution Load Allocation under Uncertainty" Water 15, no. 2: 309. https://doi.org/10.3390/w15020309


