

Groundwater Quality and Suitability Assessment for Irrigation Using Hydrogeochemical Characteristics and Pollution Indices: A Case Study of North Al-Quwayiyah Governorate, Central Saudi Arabia


Abstract
:1. Introduction
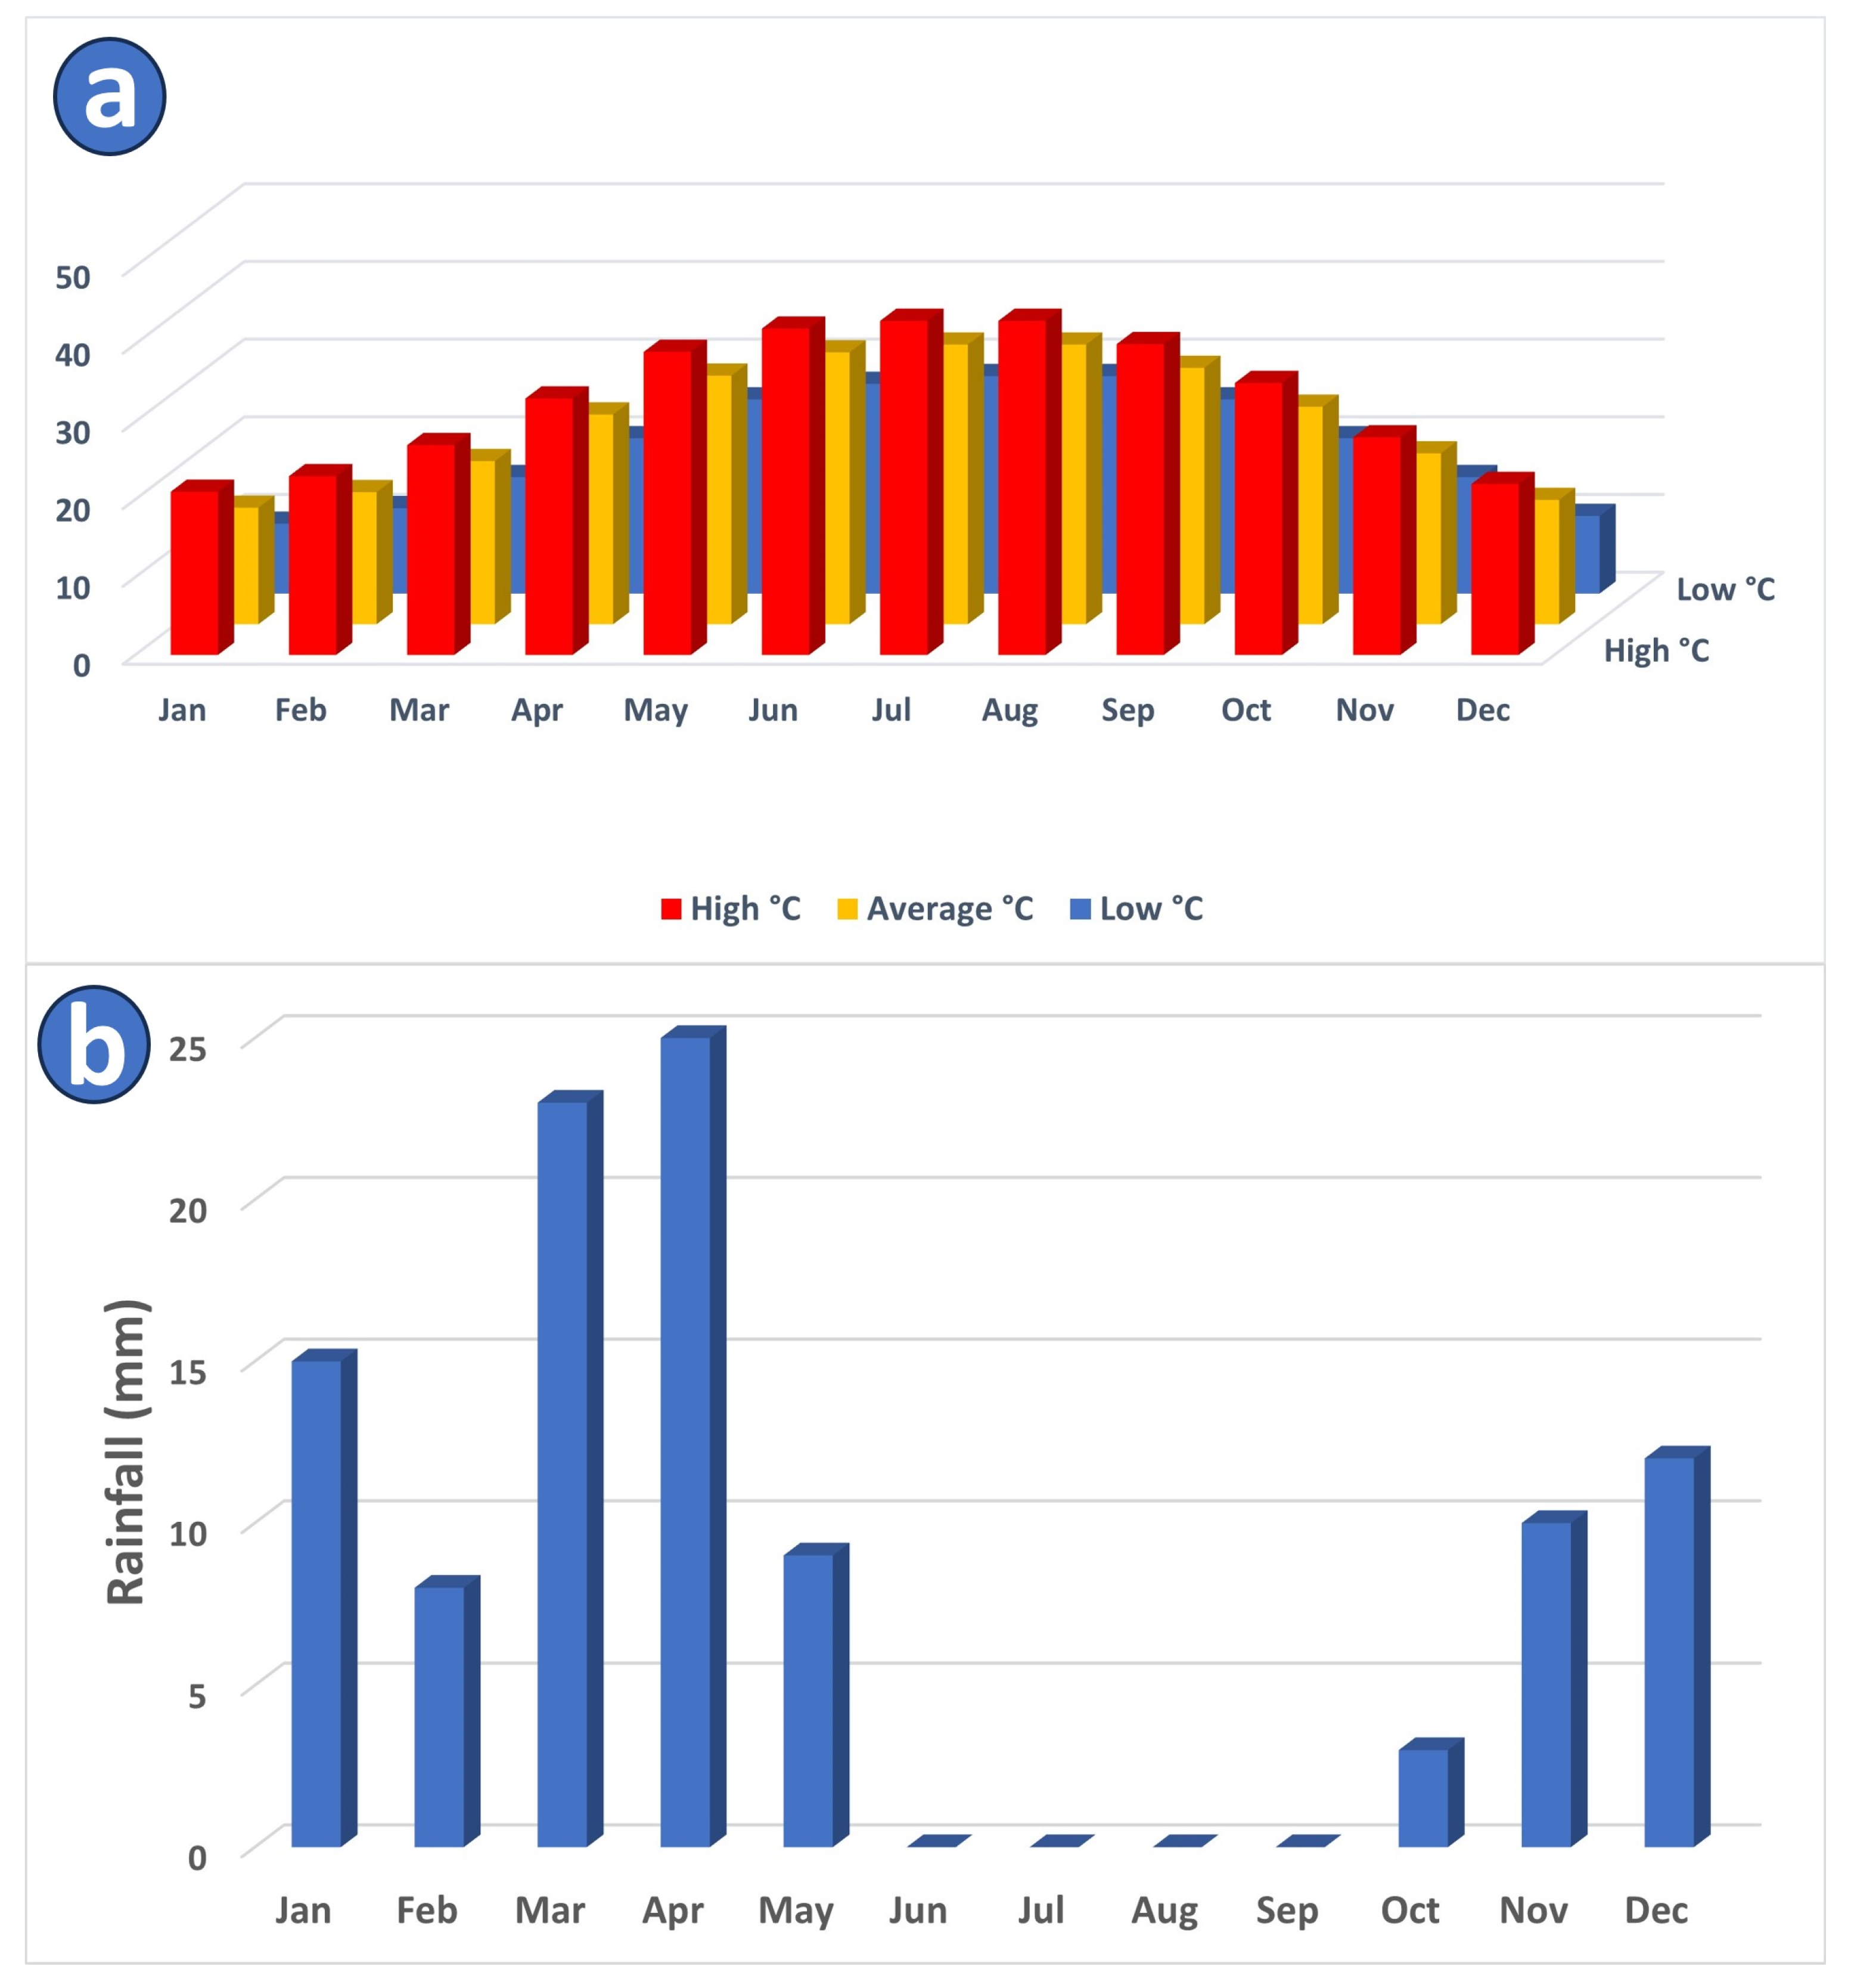
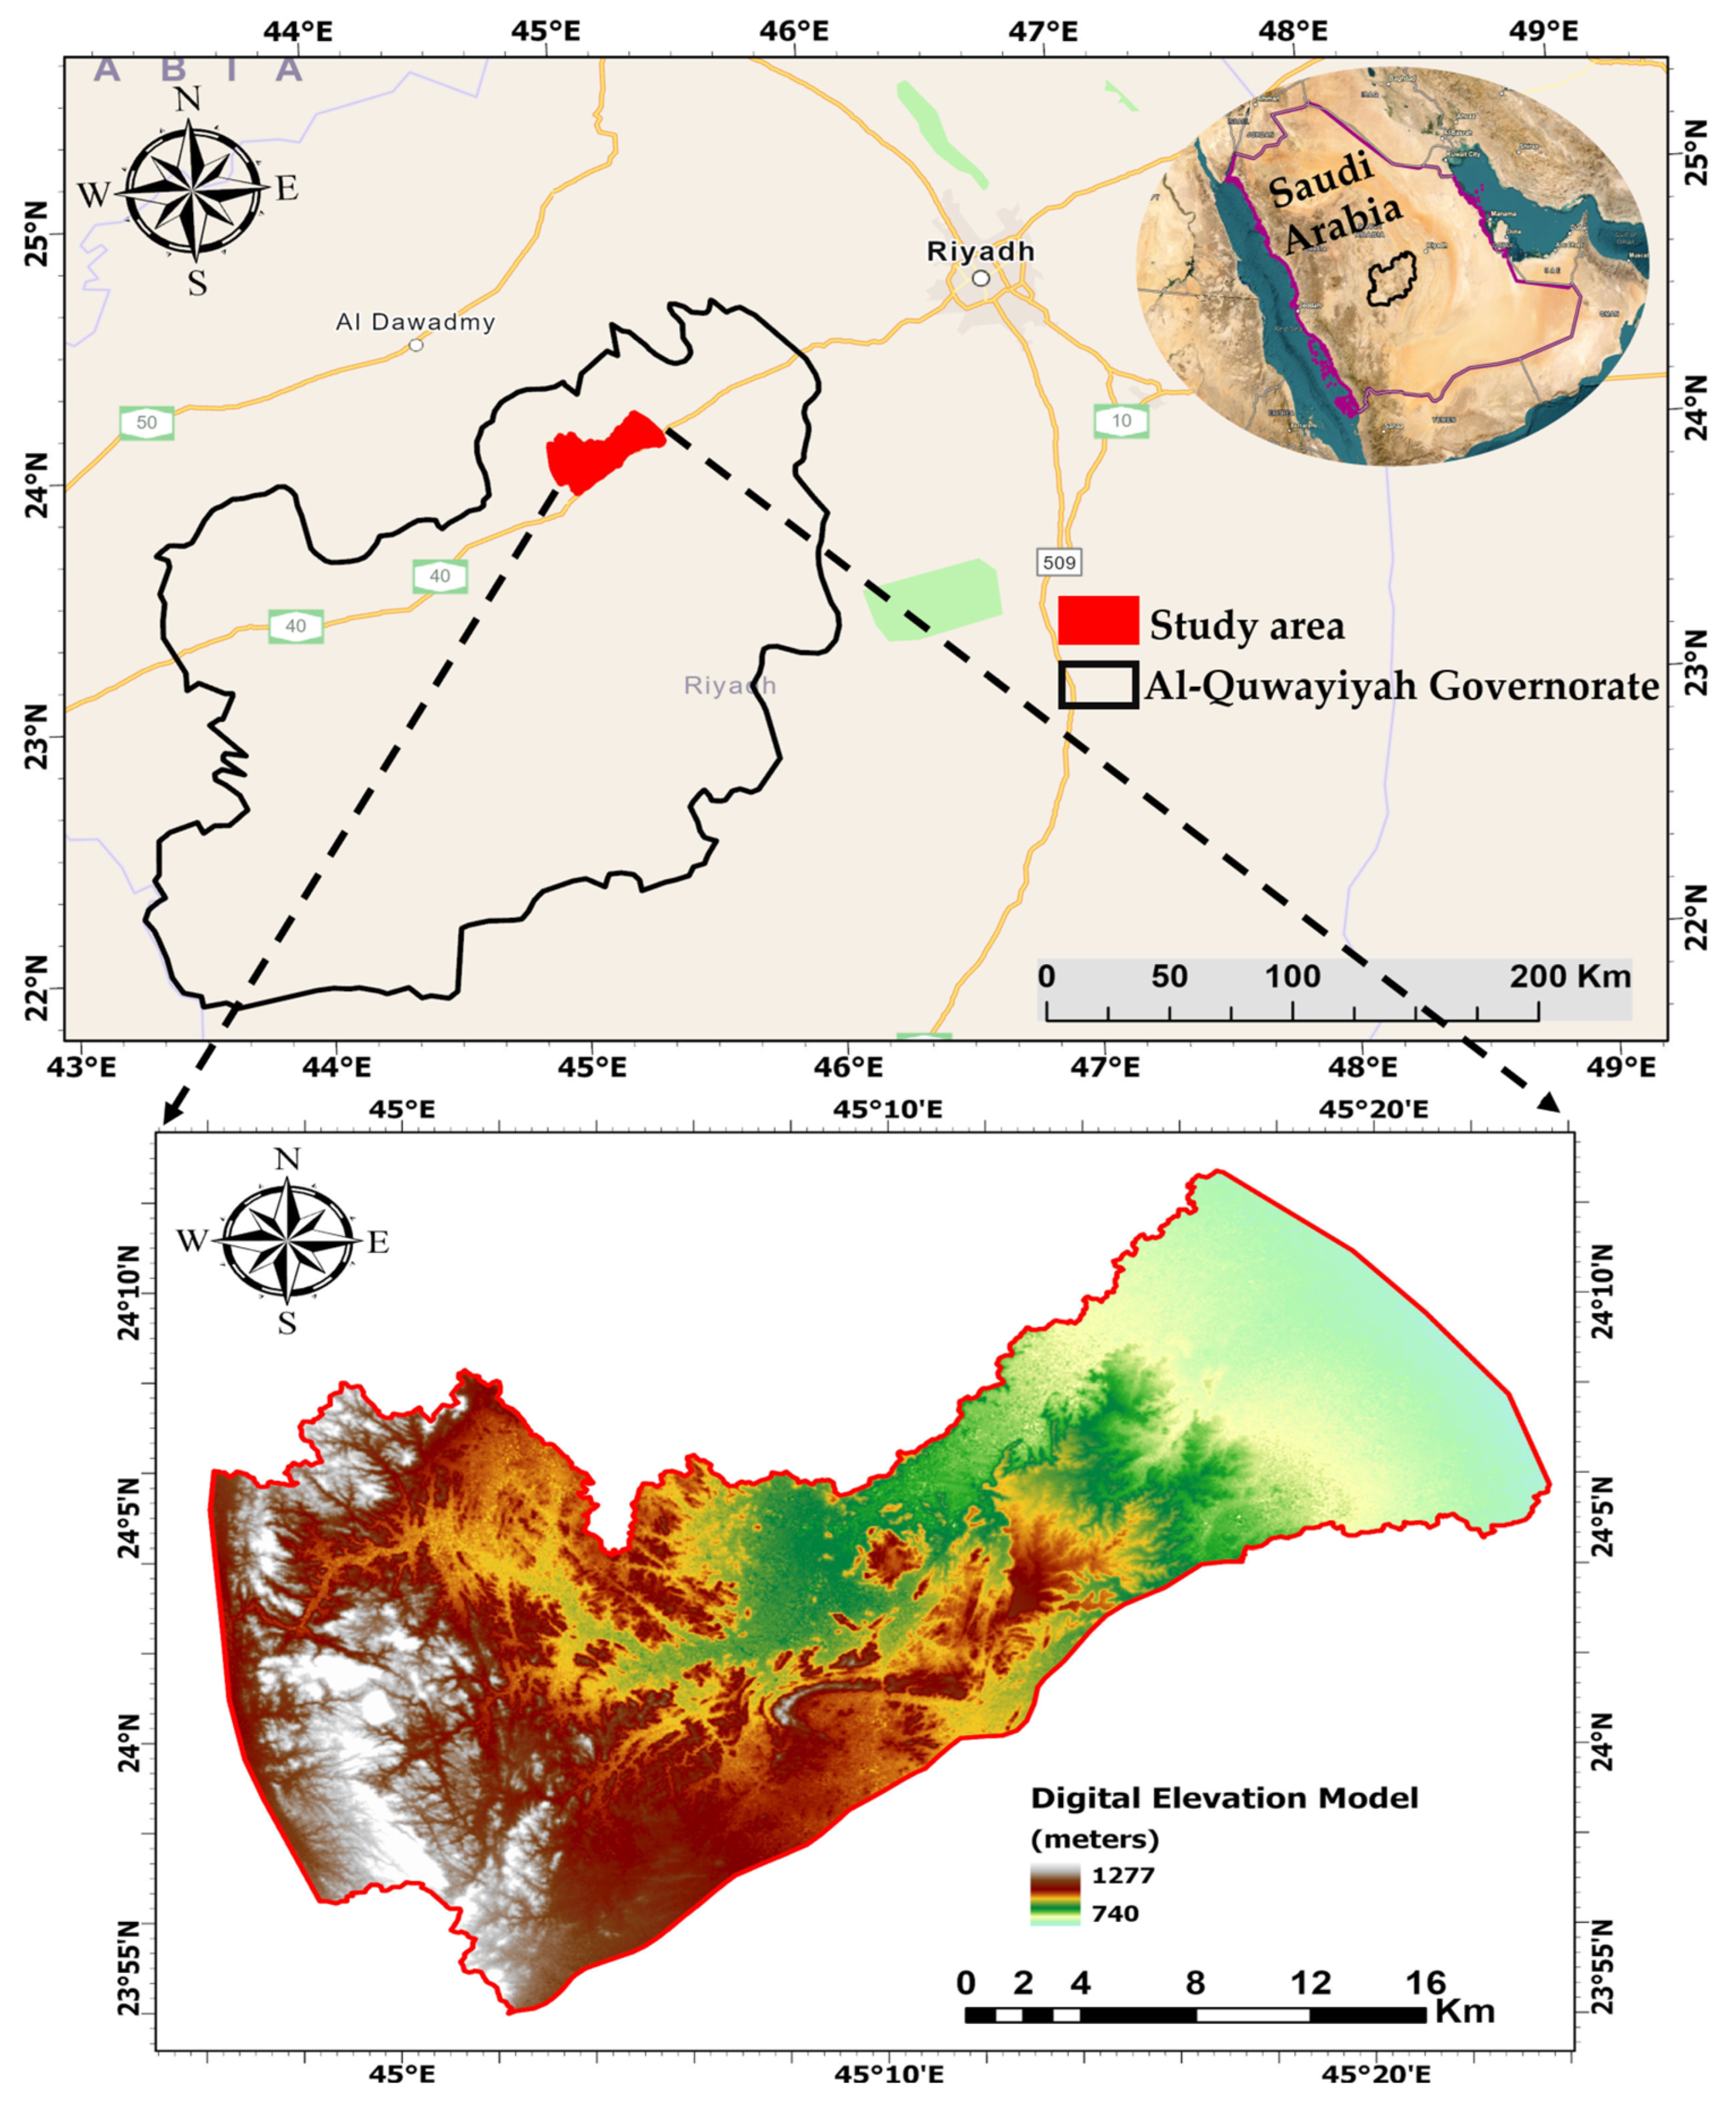
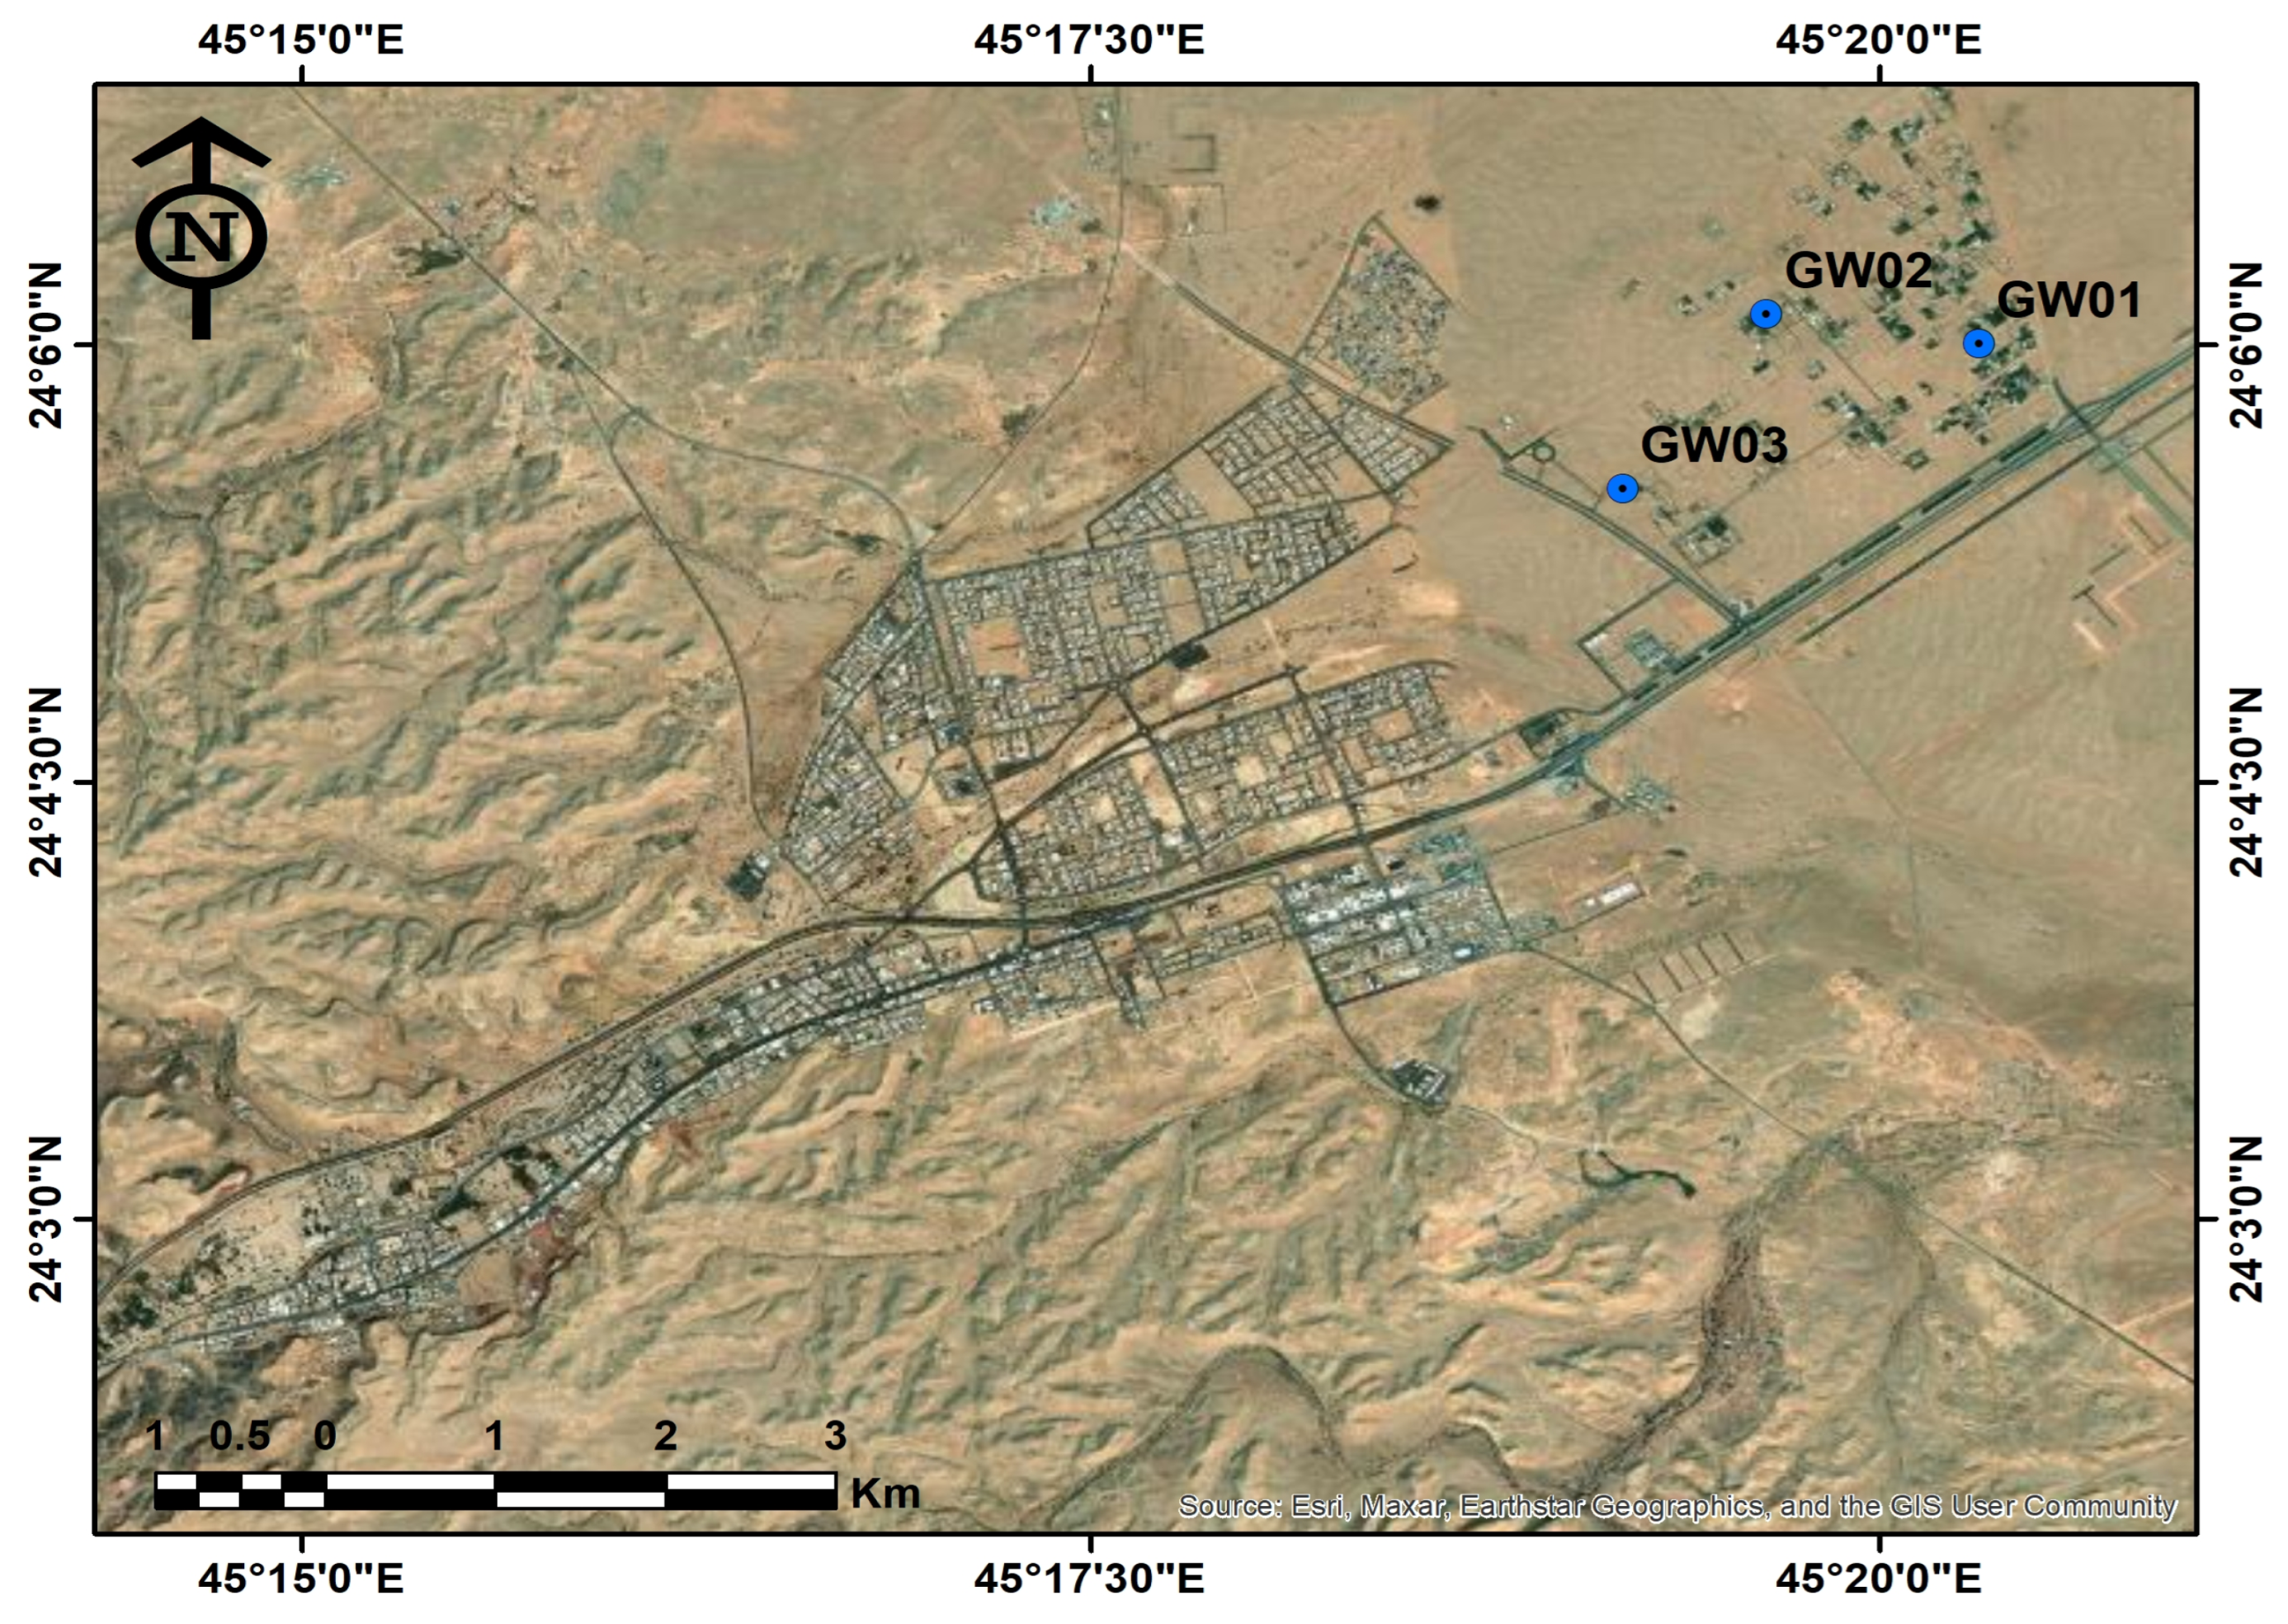
2. The Study Area
Geological and Hydrogeological Setting
- Surficial, aeolian, alluvial, and colluvial rocks. Quaternary sediments constitute an unconfined aquifer in the western region and a confined aquifer in the eastern region.
- The Permian Khuff Formation’s Ash Shiqqah is composed of huge conglomerates and shale. Marl, dolomite, sandstone, and gypsum with fossils are all found in the top section. The Khuff Formation is a discontinuous aquifer of lesser significance.
- Saq Sandstone, which dates from the Ordovician to the Cambrian. It represents a regional aquifer system (Figure 3b). The Saq Sandstone often dips to the east and is above.
- The Arabian shield complex from the Precambrian basement.
3. Methodology
3.1. Groundwater Sampling and Analysis
3.2. Groundwater Quality Indices
3.2.1. Sodium Adsorption Ratio (SAR)
3.2.2. Sodium Percentage (Na%)
3.2.3. Residual Sodium Carbonate (RSC)
3.2.4. Kelly’s Ratio (KR)
3.2.5. Magnesium Hazard (MH)
3.2.6. Permeability Index (PI)
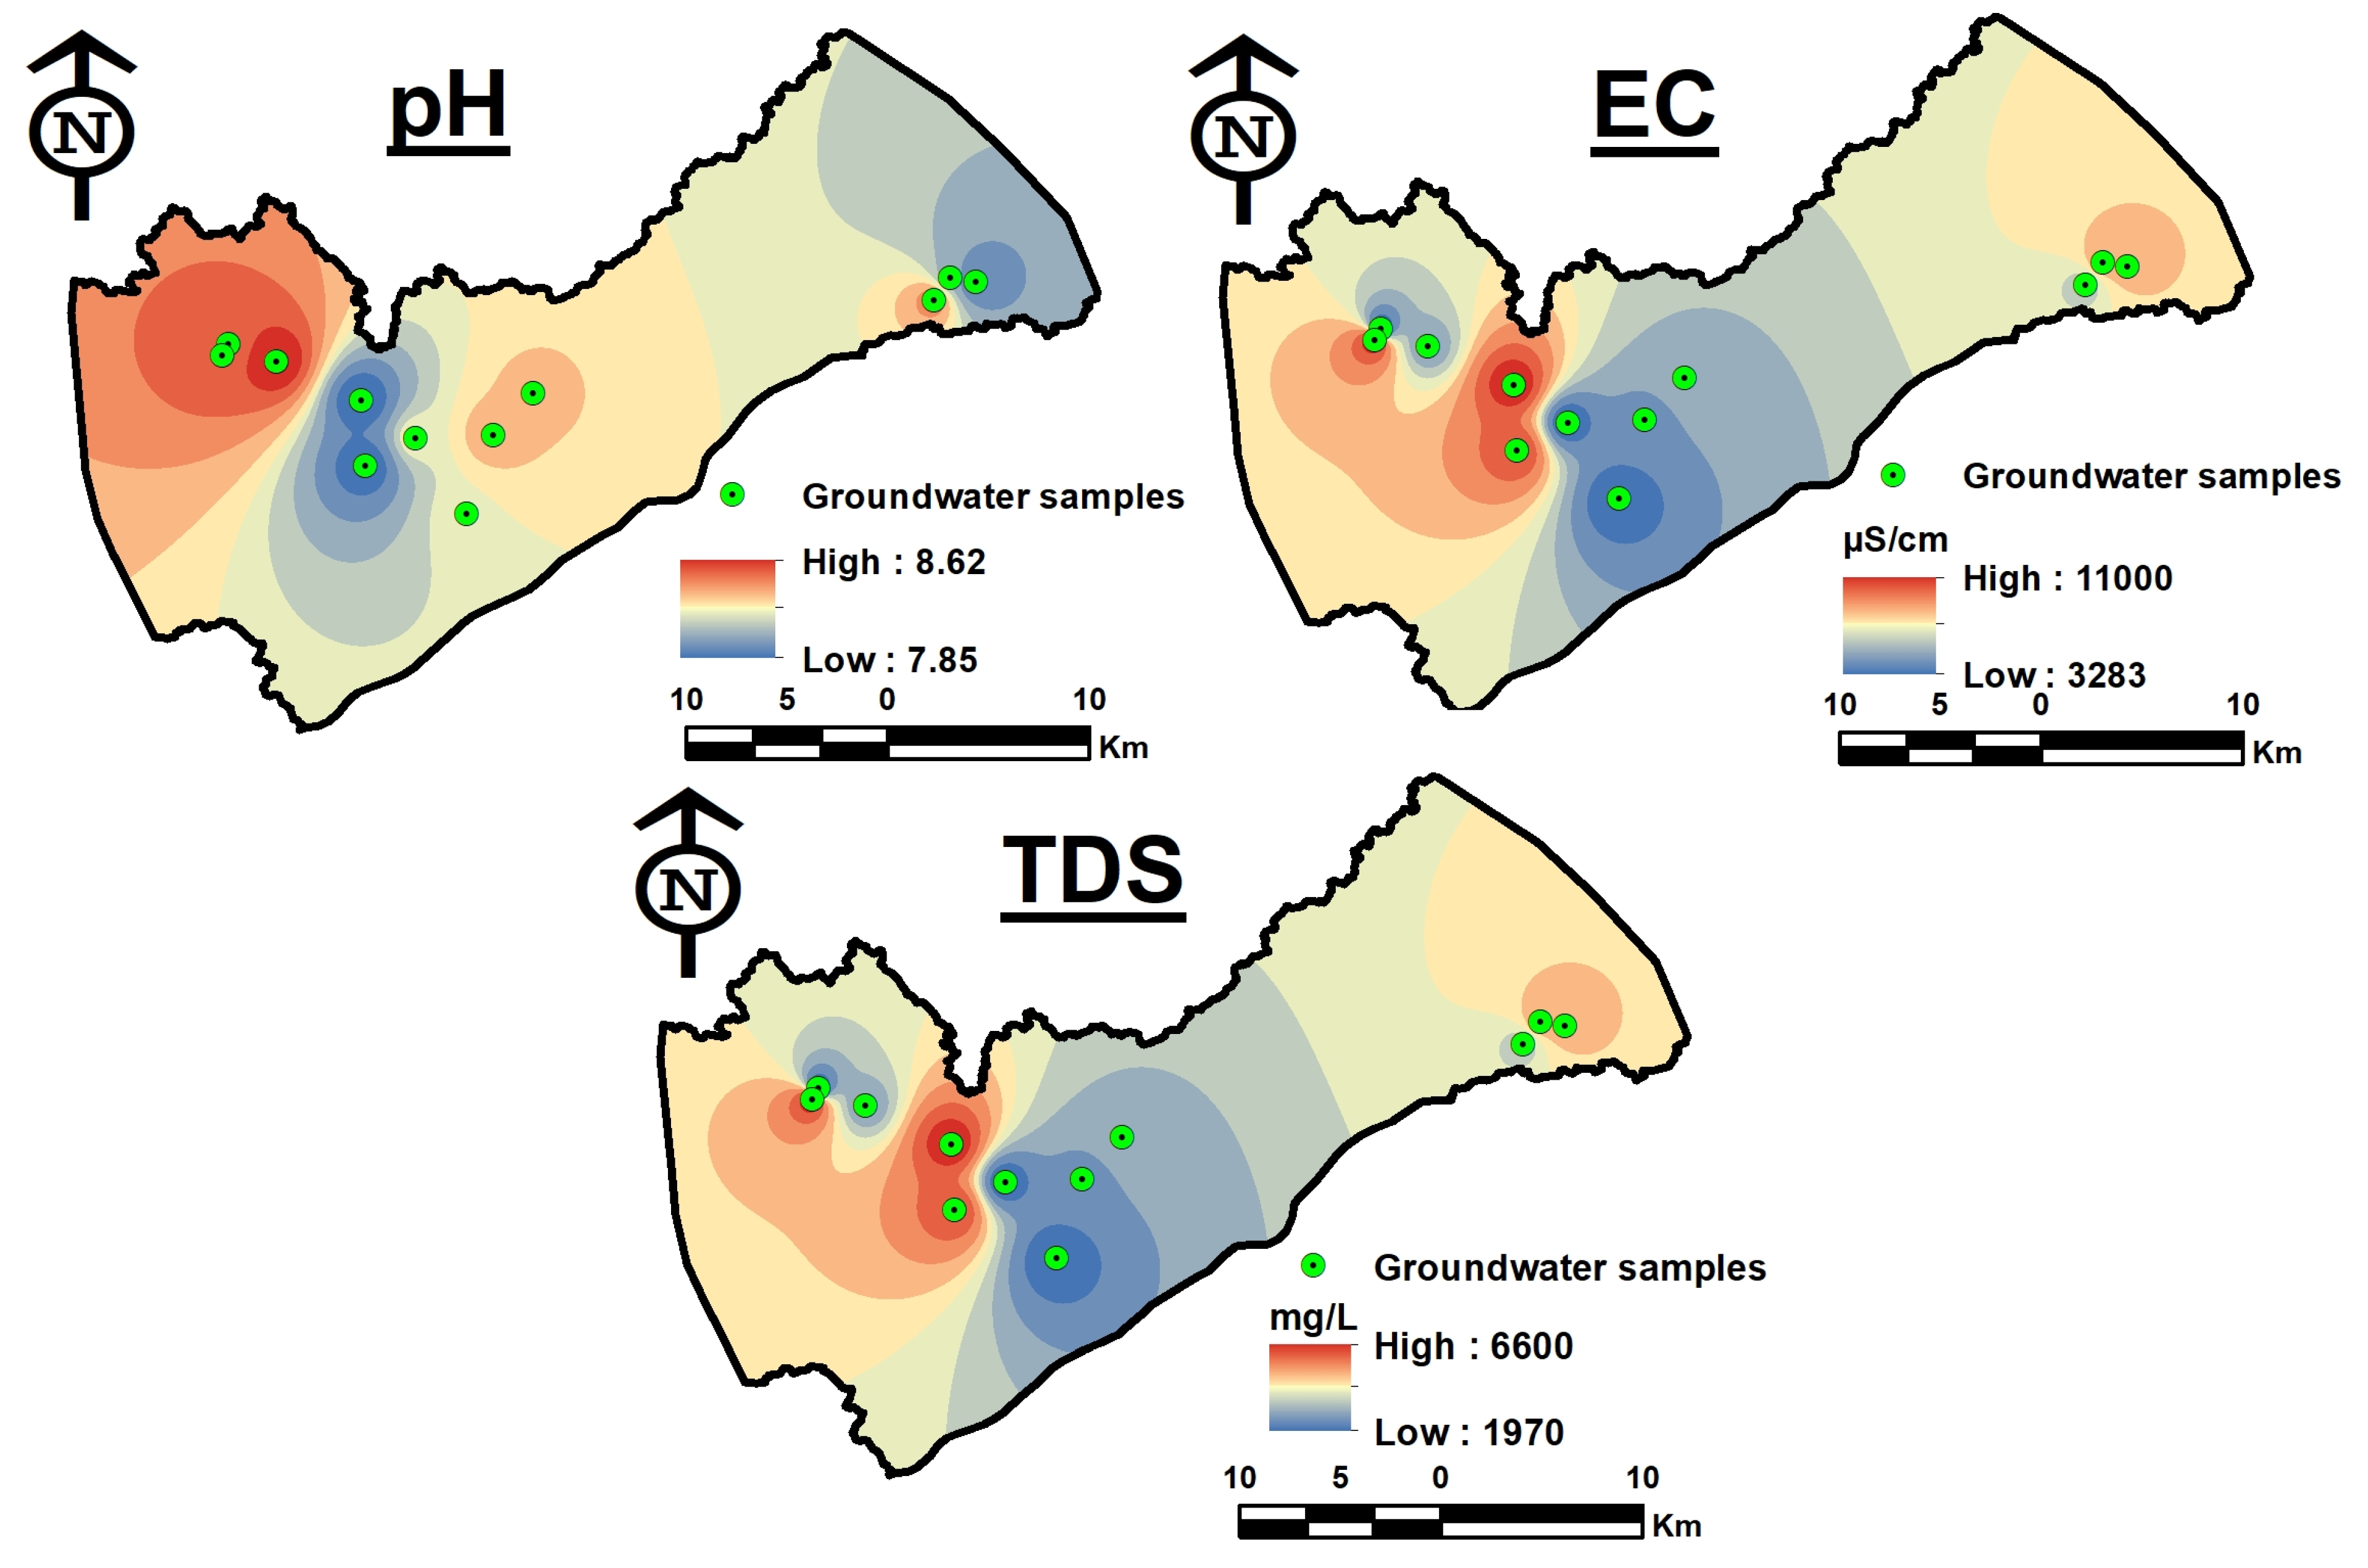
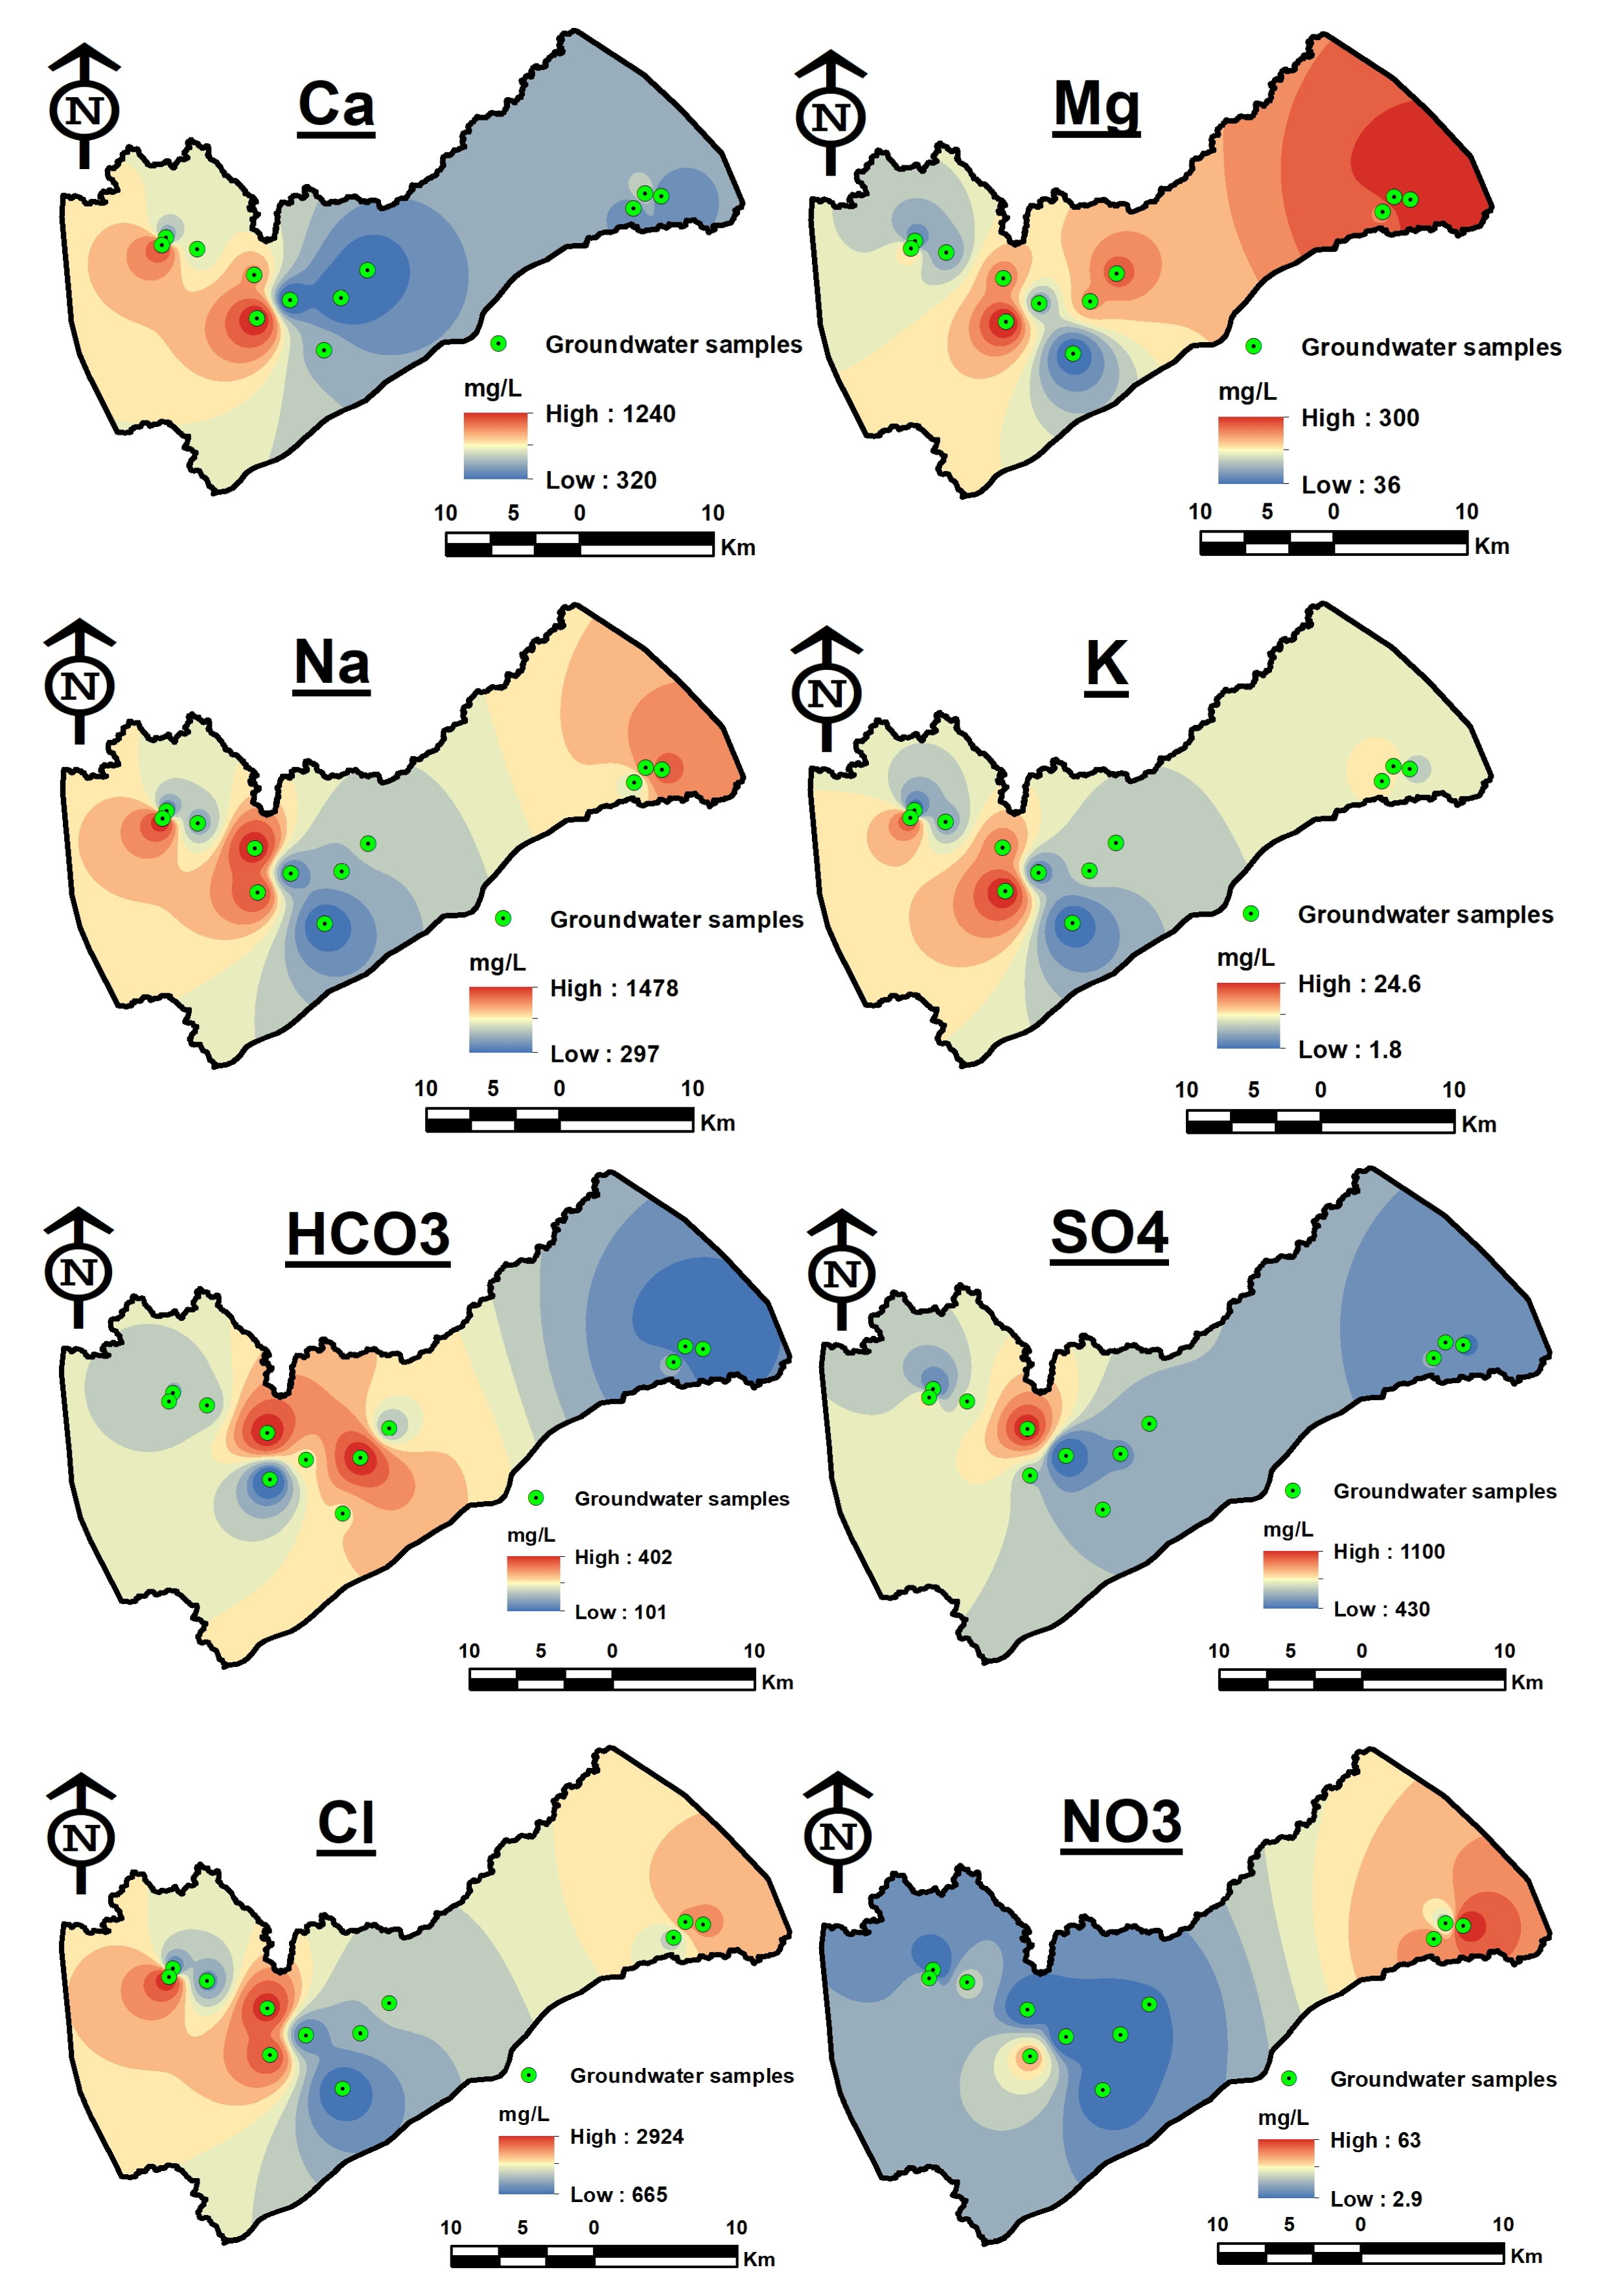
3.3. Spatial Distribution Maps
3.4. Statistical Approaches
4. Results and Discussion
4.1. Major Ion Distribution
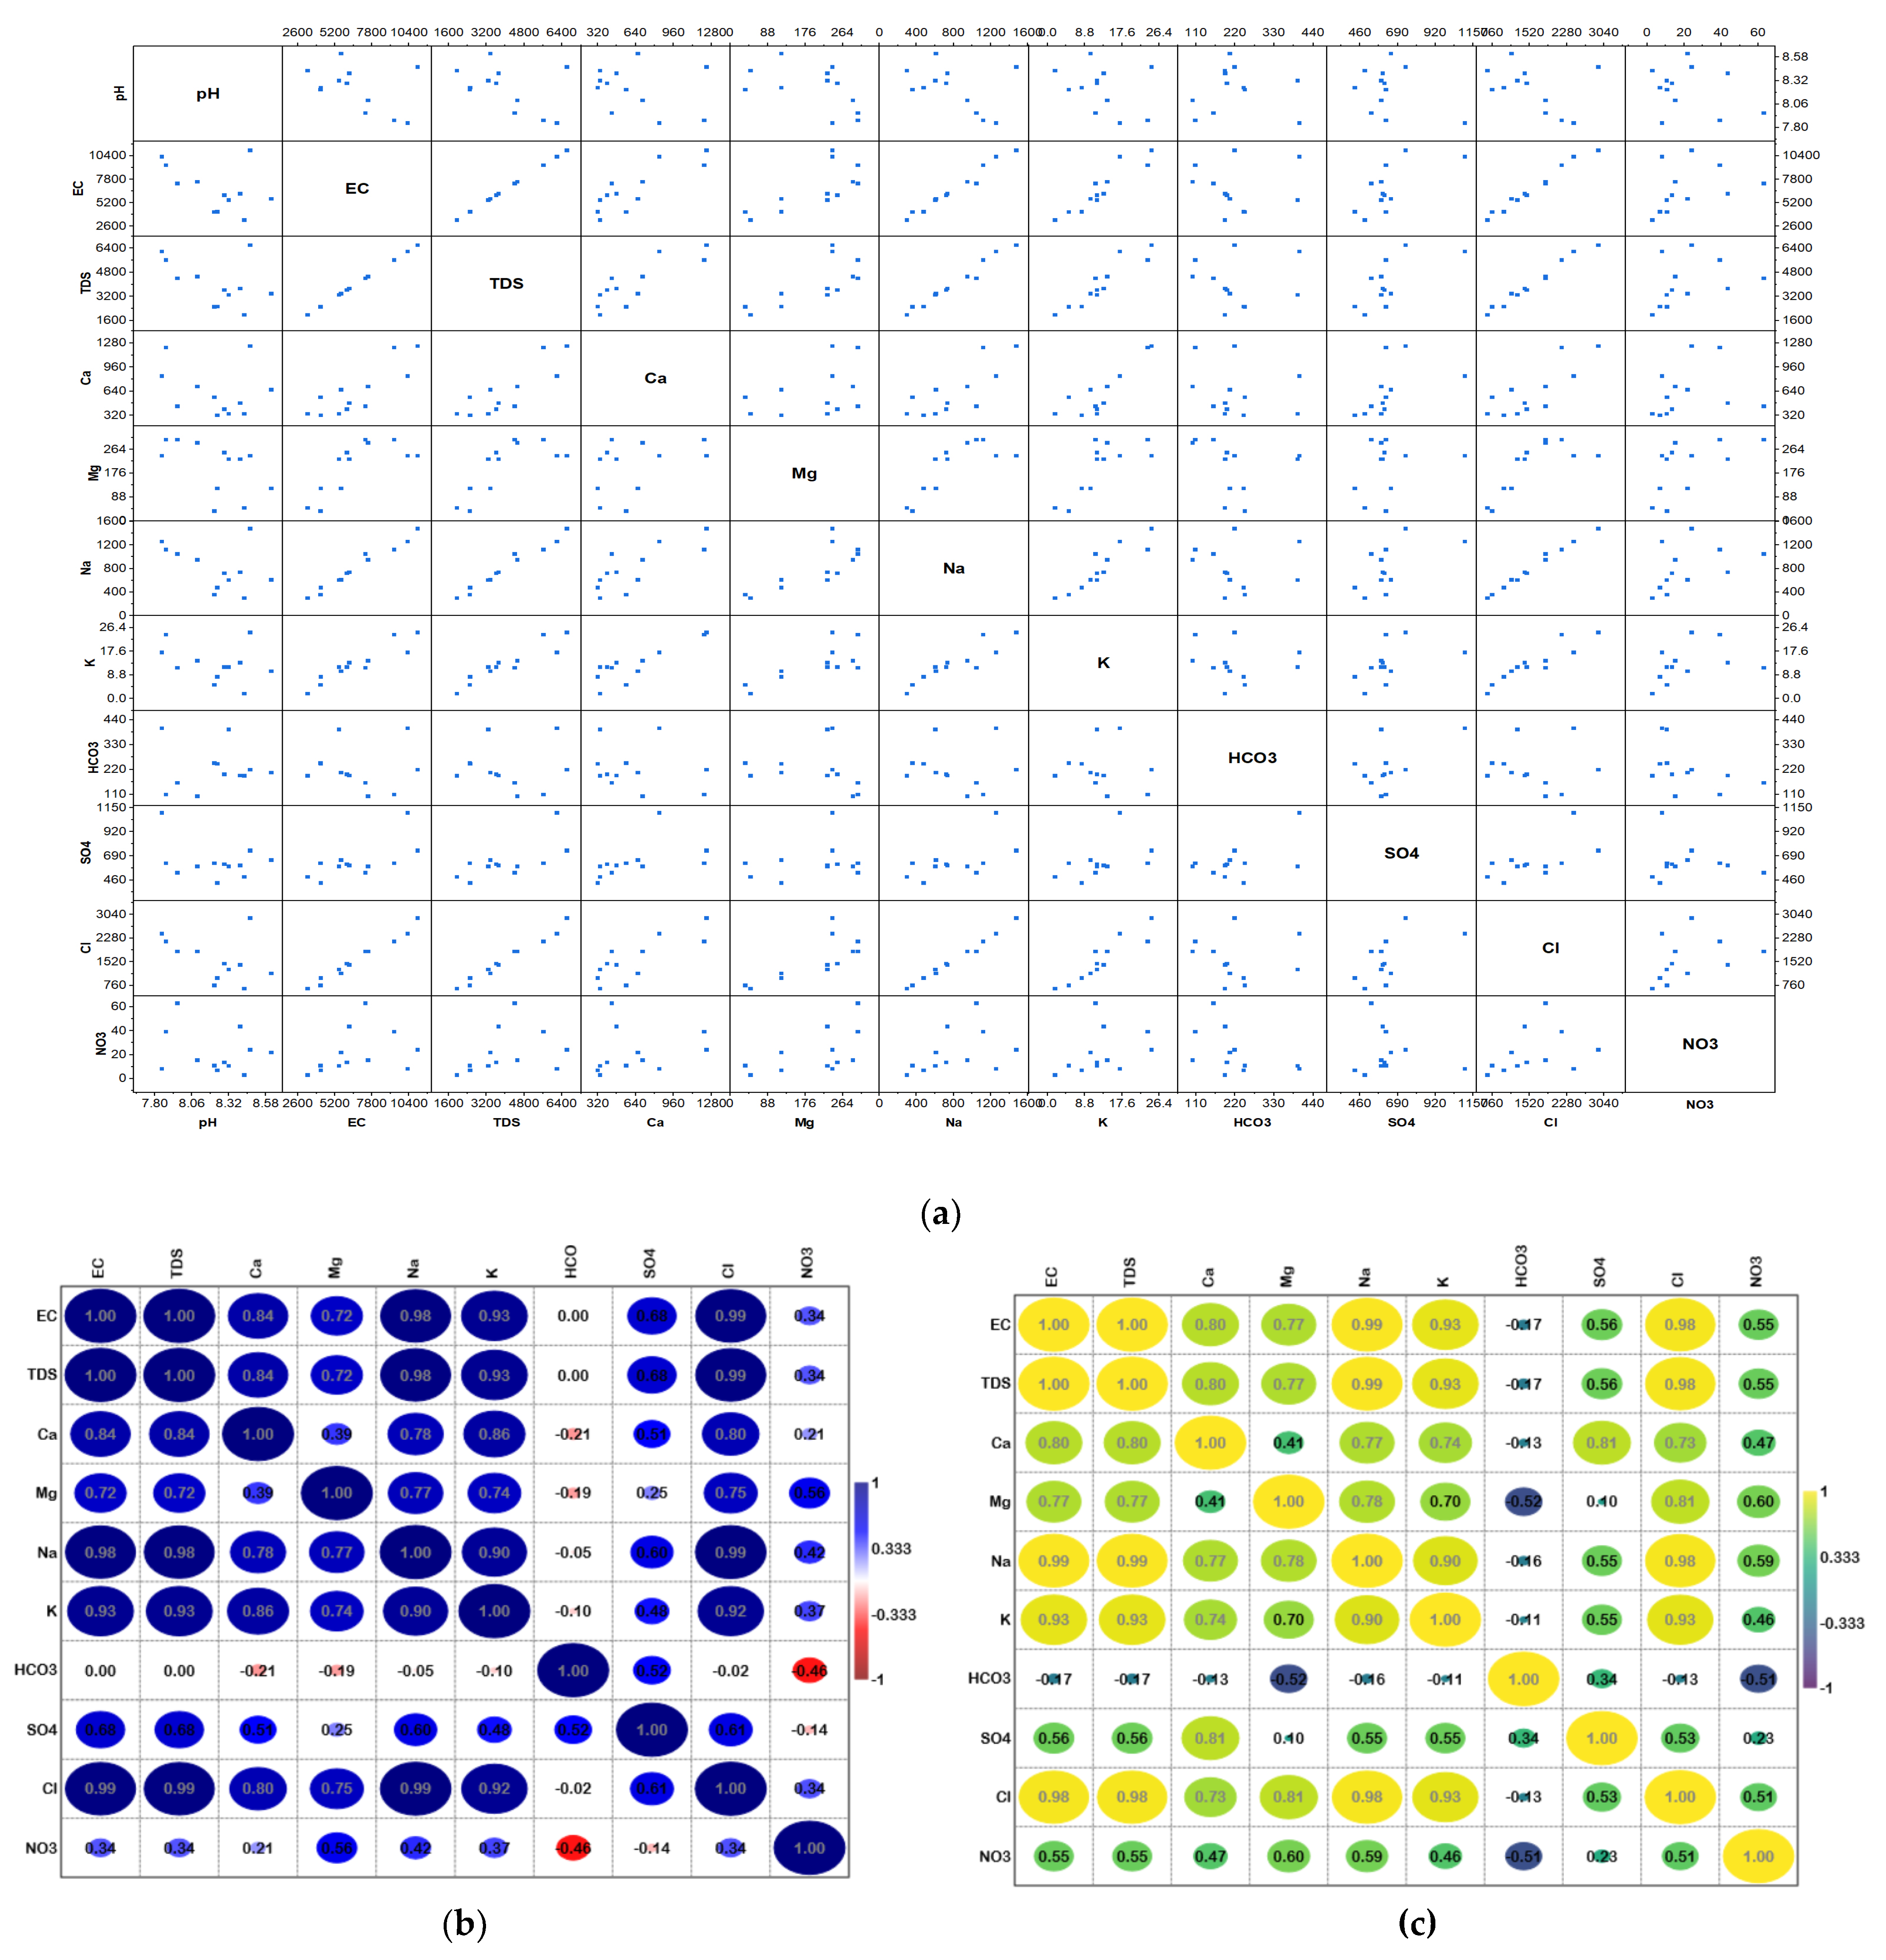
4.2. Scatter Matrix Plot and Correlation Analysis
4.3. Water Type
4.4. Hydrochemical Process
4.5. Compatibility for Irrigation
4.5.1. Sodium Adsorption Ratio (SAR)
4.5.2. Sodium Percentage (Na%)
4.5.3. Residual Sodium Carbonate (RSC)
4.5.4. Kelley’s Ratio (KR)
4.5.5. Magnesium Hazard (MH)
4.5.6. Permeability Index (PI)
5. Conclusions
Author Contributions
Funding
Data Availability Statement
Conflicts of Interest
References
- Aly, A.A.; Al-Omran, A.M.; Alharby, M.M. The Water Quality Index and Hydrochemical Characterization of Groundwater Resources in Hafar Albatin, Saudi Arabia. Arab. J. Geosci. 2015, 8, 4177–4190. [Google Scholar] [CrossRef]
- Gamal, G.; Hassan, T.M.; Gaber, A.; Abdelfattah, M. Groundwater Quality Assessment along the West of New Damietta Coastal City of Egypt Using an Integrated Geophysical and Hydrochemical Approaches. Environ. Earth Sci. 2023, 82, 107. [Google Scholar] [CrossRef]
- Abdelfattah, M.; Abu-Bakr, H.A.-A.; Mewafy, F.M.; Hassan, T.M.; Geriesh, M.H.; Saber, M.; Gaber, A. Hydrogeophysical and Hydrochemical Assessment of the Northeastern Coastal Aquifer of Egypt for Desalination Suitability. Water 2023, 15, 423. [Google Scholar] [CrossRef]
- Alharbi, T.G. Identification of Hydrogeochemical Processes and Their Influence on Groundwater Quality for Drinking and Agricultural Usage in Wadi Nisah, Central Saudi Arabia. Arab. J. Geosci. 2018, 11, 359. [Google Scholar] [CrossRef]
- Alshehri, F.; Almadani, S.; El-Sorogy, A.S.; Alwaqdani, E.; Alfaifi, H.J.; Alharbi, T. Influence of Seawater Intrusion and Heavy Metals Contamination on Groundwater Quality, Red Sea Coast, Saudi Arabia. Mar. Pollut. Bull. 2021, 165, 112094. [Google Scholar] [CrossRef] [PubMed]
- Al-Omran, A.M.; Aly, A.A.; Al-Wabel, M.I.; Sallam, A.S.; Al-Shayaa, M.S. Hydrochemical Characterization of Groundwater under Agricultural Land in Arid Environment: A Case Study of Al-Kharj, Saudi Arabia. Arab. J. Geosci. 2016, 9, 68. [Google Scholar] [CrossRef]
- Alghamdi, A.G.; Aly, A.A.; Aldhumri, S.A.; Al-Barakaha, F.N. Hydrochemical and Quality Assessment of Groundwater Resources in Al-Madinah City, Western Saudi Arabia. Sustainability 2020, 12, 3106. [Google Scholar] [CrossRef]
- Saud, A.G.; Abdullah, S.A. Water Resources and Reuse in Al-Madinah. In Proceedings of the International Conference on Water Conservation in Arid Regions (ICWCAR’09), Water Research Center-King Abdulaziz University, Jeddah, Saudi Arabia, 12–14 October 2009; pp. 12–14. [Google Scholar]
- Ali, I.; Hasan, M.A.; Alharbi, O.M.L. Toxic Metal Ions Contamination in the Groundwater, Kingdom of Saudi Arabia. J. Taibah Univ. Sci. 2020, 14, 1571–1579. [Google Scholar] [CrossRef]
- Subyani, A.M. Hydrochemical Identification and Salinity Problem of Ground-Water in Wadi Yalamlam Basin, Western Saudi Arabia. J. Arid Environ. 2005, 60, 53–66. [Google Scholar] [CrossRef]
- Hejazi, R.F. Investigation of Leachate from a Sanitary Landfill in Saudi Arabia. Ph.D Thesis, King Fahd University of Petroleum and Minerals, Dhahran, Saudi Arabia, 1989. [Google Scholar]
- Al-Arifi, S.N.; Al-Agha, R.M.; El-Nahhal, Z.Y. Environmental Impact of Landfill on Groundwater, South East of Riyadh, Saudi Arabia. J. Nat. Sci. Res. 2013, 3, 222–242. [Google Scholar]
- Rehman, F.; Cheema, T. Effects of Sewage Waste Disposal on the Groundwater Quality and Agricultural Potential of a Floodplain near Jeddah, Saudi Arabia. Arab. J. Geosci. 2016, 9, 307. [Google Scholar] [CrossRef]
- Alyamani, M.S. Effects of Cesspool Systems on Groundwater Quality of Shallow Bedrock Aquifer in the Recharge Area of Wadi Fatimah, Western Arabian Shield, Saudi Arabia. J. Environ. Hydrol. 2007, 15, 1. [Google Scholar]
- Al-Shaibani, A.M. Hydrogeology and Hydrochemistry of a Shallow Alluvial Aquifer, Western Saudi Arabia. Hydrogeol. J. 2008, 16, 155–165. [Google Scholar] [CrossRef]
- Alabdula’aly, A.I.; Al-Rehaili, A.M.; Al-Zarah, A.I.; Khan, M.A. Assessment of Nitrate Concentration in Groundwater in Saudi Arabia. Environ. Monit. Assess. 2010, 161, 1–9. [Google Scholar] [CrossRef] [PubMed]
- Rehman, F.; Cheema, T. Boron Contamination in Groundwater at a Sewage Waste Disposal Facility near Jeddah, Saudi Arabia. Environ. Earth Sci. 2017, 76, 218. [Google Scholar] [CrossRef]
- Al-Oud, S.S. Impact of Municipal and Industrial Waste on the Distribution and Accumulation of Some Heavy Metals in Sandy Soils of Al-Qassim Region at Central of Saudi Arabia. J. Environ. Sci. Technol. 2008, 1, 135–142. [Google Scholar] [CrossRef]
- Bamousa, A.O.; El Maghraby, M. Groundwater Characterization and Quality Assessment, and Sources of Pollution in Madinah, Saudi Arabia. Arab. J. Geosci. 2016, 9, 536. [Google Scholar] [CrossRef]
- Fallatah, O.A. Groundwater Quality Patterns and Spatiotemporal Change in Depletion in the Regions of the Arabian Shield and Arabian Shelf. Arab. J. Sci. Eng. 2020, 45, 341–350. [Google Scholar] [CrossRef]
- Abderrahman, W.A.; Rasheeduddin, M.; Al-Harazin, I.M.; Esuflebbe, M.; Eqnaibi, B.S. Impacts of Management Practices on Groundwater Conditions in the Eastern Province, Saudi Arabia. Hydrogeol. J. 1995, 3, 32–41. [Google Scholar] [CrossRef]
- Al-Ibrahim, A.A. Excessive Use of Groundwater Resources in Saudi Arabia: Impacts and Policy Options. Ambio 1991, 20, 34–37. [Google Scholar]
- Ben Brahim, F.; Khanfir, H.; Bouri, S. Groundwater Vulnerability and Risk Mapping of the Northern Sfax Aquifer, Tunisia. Arab. J. Sci. Eng. 2012, 37, 1405–1421. [Google Scholar] [CrossRef]
- Alkolibi, F.M. Possible Effects of Global Warming on Agriculture and Water Resources in Saudi Arabia: Impacts and Responses. Clim. Chang. 2002, 54, 225–245. [Google Scholar] [CrossRef]
- Corteel, C.; Dini, A.; Deyhle, A. Element and Isotope Mobility during Water–Rock Interaction Processes. Phys. Chem. Earth Parts A/B/C 2005, 30, 993–996. [Google Scholar] [CrossRef]
- Reghunath, R.; Murthy, T.R.S.; Raghavan, B.R. The Utility of Multivariate Statistical Techniques in Hydrogeochemical Studies: An Example from Karnataka, India. Water Res. 2002, 36, 2437–2442. [Google Scholar] [CrossRef] [PubMed]
- Singh, C.K.; Rina, K.; Singh, R.P.; Shashtri, S.; Kamal, V.; Mukherjee, S. Geochemical Modeling of High Fluoride Concentration in Groundwater of Pokhran Area of Rajasthan, India. Bull. Environ. Contam. Toxicol. 2011, 86, 152–158. [Google Scholar] [CrossRef] [PubMed]
- Al-Bassam, A.M. Evaluation of Ground Water Quality in Al-Qassim Area, Saudi Arabia, Using Cluster and Factor Analyses. Kuwait J. Sci. Eng. 2006, 33, 101. [Google Scholar]
- Haider, H.; Al-Salamah, I.S.; Ghumman, A.R. Development of Groundwater Quality Index Using Fuzzy-Based Multicriteria Analysis for Buraydah, Qassim, Saudi Arabia. Arab. J. Sci. Eng. 2017, 42, 4033–4051. [Google Scholar] [CrossRef]
- Alfaifi, H.; El-Sorogy, A.S.; Qaysi, S.; Kahal, A.; Almadani, S.; Alshehri, F.; Zaidi, F.K. Evaluation of Heavy Metal Contamination and Groundwater Quality along the Red Sea Coast, Southern Saudi Arabia. Mar. Pollut. Bull. 2021, 163, 111975. [Google Scholar] [CrossRef]
- Mallick, J. Hydrogeochemical Characteristics and Assessment of Water Quality in the Al-Saad Lake, Abha Saudi Arabia. Appl. Water Sci. 2017, 7, 2869–2882. [Google Scholar] [CrossRef]
- Al-Omran, A.M.; Aly, A.A.; Al-Wabel, M.I.; Al-Shayaa, M.S.; Sallam, A.S.; Nadeem, M.E. Geostatistical Methods in Evaluating Spatial Variability of Groundwater Quality in Al-Kharj Region, Saudi Arabia. Appl. Water Sci. 2017, 7, 4013–4023. [Google Scholar] [CrossRef]
- Mallick, J.; Singh, C.K.; AlMesfer, M.K.; Kumar, A.; Khan, R.A.; Islam, S.; Rahman, A. Hydro-Geochemical Assessment of Groundwater Quality in Aseer Region, Saudi Arabia. Water 2018, 10, 1847. [Google Scholar] [CrossRef]
- Dixon, B. Groundwater Vulnerability Mapping: A GIS and Fuzzy Rule Based Integrated Tool. Appl. Geogr. 2005, 25, 327–347. [Google Scholar] [CrossRef]
- Marko, K.; Al-Amri, N.S.; Elfeki, A.M.M. Geostatistical Analysis Using GIS for Mapping Groundwater Quality: Case Study in the Recharge Area of Wadi Usfan, Western Saudi Arabia. Arab. J. Geosci. 2014, 7, 5239–5252. [Google Scholar] [CrossRef]
- Dhanasekarapandian, M.; Chandran, S.; Devi, D.S.; Kumar, V. Spatial and Temporal Variation of Groundwater Quality and Its Suitability for Irrigation and Drinking Purpose Using GIS and WQI in an Urban Fringe. J. Afr. Earth Sci. 2016, 124, 270–288. [Google Scholar] [CrossRef]
- Elumalai, V.; Brindha, K.; Sithole, B.; Lakshmanan, E. Spatial Interpolation Methods and Geostatistics for Mapping Groundwater Contamination in a Coastal Area. Environ. Sci. Pollut. Res. 2017, 24, 11601–11617. [Google Scholar] [CrossRef]
- Manoj, S.; Thirumurugan, M.; Elango, L. An Integrated Approach for Assessment of Groundwater Quality in and around Uranium Mineralized Zone, Gogi Region, Karnataka, India. Arab. J. Geosci. 2017, 10, 1–17. [Google Scholar] [CrossRef]
- Goovaerts, P. Geostatistics for Natural Resources Evaluation; Applied Geostatistics; Oxford University Press: New York, NY, USA, 1997; ISBN 0195115384. [Google Scholar]
- Mirzaei, R.; Sakizadeh, M. Comparison of Interpolation Methods for the Estimation of Groundwater Contamination in Andimeshk-Shush Plain, Southwest of Iran. Environ. Sci. Pollut. Res. 2016, 23, 2758–2769. [Google Scholar] [CrossRef]
- Masoud, M.H.Z.; Basahi, J.M.; Rajmohan, N. Impact of Flash Flood Recharge on Groundwater Quality and Its Suitability in the Wadi Baysh Basin, Western Saudi Arabia: An Integrated Approach. Environ. Earth Sci. 2018, 77, 395. [Google Scholar] [CrossRef]
- Yihdego, Y.; Drury, L. Mine Water Supply Assessment and Evaluation of the System Response to the Designed Demand in a Desert Region, Central Saudi Arabia. Environ. Monit. Assess. 2016, 188, 1–21. [Google Scholar] [CrossRef]
- Riyadh, Saudi Arabia: Annual Weather Averages. Available online: https://www.holiday-weather.com/riyadh/averages/#chart-head-temperature (accessed on 10 July 2023).
- Al Saud, M.; Rausch, R. Integrated Groundwater Management in the Kingdom of Saudi Arabia. Proc. Hydrogeol. Arid Environ. 2012, 1–6. [Google Scholar]
- Abderrahman, W.A. Saudi Arabia Aquifers. In Non-Renewable Groundwater Resources: A Guidebook on Socially-Sustainable Management for Water-Policy Makers; UNESCO: Paris, France, 2006; pp. 63–67. [Google Scholar]
- Association, A.P.H. APHA Standard Methods for the Examination of Water and Wastewater. In Standard Methods for the Examination of Water and Wastewater; American Public Health Association: Washington, DC, USA, 2005. [Google Scholar]
- Piper, A.M. A Graphic Procedure in the Geochemical Interpretation of Water-analyses. Eos Trans. Am. Geophys. Union 1944, 25, 914–928. [Google Scholar] [CrossRef]
- Chadha, D.K. A Proposed New Diagram for Geochemical Classification of Natural Waters and Interpretation of Chemical Data. Hydrogeol. J. 1999, 7, 431–439. [Google Scholar] [CrossRef]
- Gibbs, R.J. Mechanisms Controlling World Water Chemistry. Science 1970, 170, 1088–1090. [Google Scholar] [CrossRef] [PubMed]
- Verma, A.; Shetty, B.K.; Guddattu, V.; Chourasia, M.K.; Pundir, P. High Prevalence of Dental Fluorosis among Adolescents Is a Growing Concern: A School Based Cross-Sectional Study from Southern India. Environ. Health Prev. Med. 2017, 22, 17. [Google Scholar] [CrossRef]
- Keesari, T.; Ramakumar, K.L.; Chidambaram, S.; Pethperumal, S.; Thilagavathi, R. Understanding the Hydrochemical Behavior of Groundwater and Its Suitability for Drinking and Agricultural Purposes in Pondicherry Area, South India–a Step towards Sustainable Development. Groundw. Sustain. Dev. 2016, 2, 143–153. [Google Scholar] [CrossRef]
- Kopittke, P.M.; So, H.B.; Menzies, N.W. Effect of Ionic Strength and Clay Mineralogy on Na–Ca Exchange and the SAR–ESP Relationship. Eur. J. Soil Sci. 2006, 57, 626–633. [Google Scholar] [CrossRef]
- Gupta, S.K.; Gupta, I.C. Management of Saline Soils and Waters; Oxford & IBH Publishing Co.: New Delhi, India, 1987; ISBN 0120402068. [Google Scholar]
- Hao, C.; Huang, Y.; Ma, D.; Fan, X. Hydro-Geochemistry Evolution in Ordovician Limestone Water Induced by Mountainous Coal Mining: A Case Study from North China. J. Mt. Sci. 2020, 17, 614–623. [Google Scholar] [CrossRef]
- Abdulhussein, F.M. Hydrochemical Assessment of Groundwater of Dibdibba Aquifer in Al-Zubair Area, Basra, South of Iraq and Its Suitability for IrrigationPurposes. Iraqi J. Sci. 2018, 59, 135–143. [Google Scholar]
- Falowo, O.O.; Akindureni, Y.; Ojo, O. Irrigation and Drinking Water Quality Index Determination for Groundwater Quality Evaluation in Akoko Northwest and Northeast Areas of Ondo State, Southwestern Nigeria. Am. J. Water Sci. Eng. 2017, 3, 50–60. [Google Scholar] [CrossRef]
- Tiwari, K.; Goyal, R.; Sarkar, A. GIS-Based Spatial Distribution of Groundwater Quality and Regional Suitability Evaluation for Drinking Water. Environ. Process. 2017, 4, 645–662. [Google Scholar] [CrossRef]
- Zolekar, R.B.; Bhagat, V.S. Multi-Criteria Land Suitability Analysis for Agriculture in Hilly Zone: Remote Sensing and GIS Approach. Comput. Electron. Agric. 2015, 118, 300–321. [Google Scholar]
- Duarte, L.B.; Pereira, J.A. Open Source GIS Tools: Two Environmental Applications. GIS-Overv. Appl. 2018, 1, 102–123. [Google Scholar]
- Freeze, R.; Cherry, J.A. Groundwater; Prentice-Hall: Englewood Cliffs, NJ, USA, 1979. [Google Scholar]
- Trojan, M.D.; Maloney, J.S.; Stockinger, J.M.; Eid, E.P.; Lahtinen, M.J. Effects of Land Use on Ground Water Quality in the Anoka Sand Plain Aquifer of Minnesota. Groundwater 2003, 41, 482–492. [Google Scholar] [CrossRef] [PubMed]
- White, P.; Ruble, C.L.; Lane, M.E. The Effect of Changes in Land Use on Nitrate Concentration in Water Supply Wells in Southern Chester County, Pennsylvania. Environ. Monit. Assess. 2013, 185, 643–651. [Google Scholar] [CrossRef]
- Gold, A.J.; DeRagon, W.R.; Sullivan, W.M.; Lemunyon, J.L. Nitrate-Nitrogen Losses to Groundwater from Rural and Suburban Land Uses. J. Soil Water Conserv. 1990, 45, 305–310. [Google Scholar]
- Alshehri, F.; El-Sorogy, A.S.; Almadani, S.; Aldossari, M. Groundwater Quality Assessment in Western Saudi Arabia Using GIS and Multivariate Analysis. J. King Saud Univ. 2023, 35, 102586. [Google Scholar] [CrossRef]
- Alrowais, R.; Abdel Daiem, M.M.; Li, R.; Maklad, M.A.; Helmi, A.M.; Nasef, B.M.; Said, N. Groundwater Quality Assessment for Drinking and Irrigation Purposes at Al-Jouf Area in KSA Using Artificial Neural Network, GIS, and Multivariate Statistical Techniques. Water 2023, 15, 2982. [Google Scholar] [CrossRef]
- Fallatah, O.; Khattab, M.R. Evaluation of Groundwater Quality and Suitability for Irrigation Purposes and Human Consumption in Saudi Arabia. Water 2023, 15, 2352. [Google Scholar] [CrossRef]
- Ismail, E.; Snousy, M.G.; Alexakis, D.E.; Gamvroula, D.E.; Howard, G.; El Sayed, E.; Ahmed, M.S.; Ali, A.; Abdelhalim, A. Multivariate Statistical Analysis and Geospatial Mapping for Assessing Groundwater Quality in West El Minia District, Egypt. Water 2023, 15, 2909. [Google Scholar] [CrossRef]
- Gad, M.; Saleh, A.H.; Hussein, H.; Elsayed, S.; Farouk, M. Water Quality Evaluation and Prediction Using Irrigation Indices, Artificial Neural Networks, and Partial Least Square Regression Models for the Nile River, Egypt. Water 2023, 15, 2244. [Google Scholar] [CrossRef]
- Rawat, K.S.; Singh, S.K.; Gautam, S.K. Assessment of Groundwater Quality for Irrigation Use: A Peninsular Case Study. Appl. Water Sci. 2018, 8, 233. [Google Scholar] [CrossRef]
- Amrani, S.; Hinaje, S.; El Fartati, M.; Gharmane, Y.; Yaagoub, D. Assessment of Groundwater Quality for Drinking and Irrigation in the Timahdite–Almis Guigou Area (Middle Atlas, Morocco). Appl. Water Sci. 2022, 12, 82. [Google Scholar] [CrossRef]
- Ali, Z.I.; Gharbi, A.; Zairi, M. Evaluation of Groundwater Quality in Intensive Irrigated Zone of Northeastern Tunisia. Groundw. Sustain. Dev. 2020, 11, 100482. [Google Scholar]
- Subba Rao, N. Geochemistry of Groundwater in Parts of Guntur District, Andhra Pradesh, India. Environ. Geol. 2002, 41, 552–562. [Google Scholar] [CrossRef]
- Srinivasamoorthy, K.; Chidambaram, S.; Prasanna, M.V.; Vasanthavihar, M.; Peter, J.; Anandhan, P. Identification of Major Sources Controlling Groundwater Chemistry from a Hard Rock Terrain—A Case Study from Mettur Taluk, Salem District, Tamil Nadu, India. J. Earth Syst. Sci. 2008, 117, 49–58. [Google Scholar] [CrossRef]
- Rao, N.S.; Rao, P.S.; Reddy, G.V.; Nagamani, M.; Vidyasagar, G.; Satyanarayana, N. Chemical Characteristics of Groundwater and Assessment of Groundwater Quality in Varaha River Basin, Visakhapatnam District, Andhra Pradesh, India. Environ. Monit. Assess. 2012, 184, 5189–5214. [Google Scholar] [CrossRef]
- Sarin, M.M.; Krishnaswami, S.; Dilli, K.; Somayajulu, B.L.K.; Moore, W.S. Major Ion Chemistry of the Ganga-Brahmaputra River System: Weathering Processes and Fluxes to the Bay of Bengal. Geochim. Cosmochim. Acta 1989, 53, 997–1009. [Google Scholar] [CrossRef]
- Datta, P.S.; Bhattacharya, S.K.; Tyagi, S.K. 18O Studies on Recharge of Phreatic Aquifers and Groundwater Flow-Paths of Mixing in the Delhi Area. J. Hydrol. 1996, 176, 25–36. [Google Scholar] [CrossRef]
- Umar, R.; Ahmed, I. Hydrochemical Characteristics of Groundwater in Parts of Krishni-Yamuna Basin, Muzaffarnagar District, UP. Geol. Soc. India 2007, 69, 989–995. [Google Scholar]
- Umar, R.; Ahmed, I.; Alam, F.; Khan, M.M. Hydrochemical Characteristics and Seasonal Variations in Groundwater Quality of an Alluvial Aquifer in Parts of Central Ganga Plain, Western Uttar Pradesh, India. Environ. Geol. 2009, 58, 1295–1300. [Google Scholar] [CrossRef]
- Richards, L.A. Diagnosis and Improvement of Saline and Alkali Soils; US Government Printing Office: Washington, DC, USA, 1954.
- Wilcox, L. Classification and Use of Irrigation Waters; US Department of Agriculture: Washington, DC, USA, 1955.
- Todd, D.K.; Mays, L.W. Groundwater Hydrology; John Wiley & Sons: Hoboken, NJ, USA, 2004; ISBN 0471059374. [Google Scholar]
- Sadashivaiah, C.; Ramakrishnaiah, C.R.; Ranganna, G. Hydrochemical Analysis and Evaluation of Groundwater Quality in Tumkur Taluk, Karnataka State, India. Int. J. Environ. Res. Public Health 2008, 5, 158–164. [Google Scholar] [CrossRef] [PubMed]
- WHO. Guidelines for Drinkingwater Quality, 4th ed.; WHO Press: Geneva, Switzerland, 2011. [Google Scholar]
- FAO. Water for Sustainable Food and Agriculture: A Report Produced for the G20 Presidency of Germany; FAO: Rome, Italy, 2017. [Google Scholar]
- Chidambaram, S.; Anandhan, P.; Prasanna, M.V.; Thivya, C.; Thilagavathi, R.; Sarathidasan, J. Hydrochemistry of Groundwater in a Coastal Region and Its Repercussion on Quality, a Case Study—Thoothukudi District, Tamil Nadu, India. Arab. J. Geosci. 2014, 7, 939–950. [Google Scholar]
- Eaton, F.M. Significant of Carbonate in Irrigation Waters. Soil Sci. 1950, 59, 123–133. [Google Scholar] [CrossRef]
- Subba Rao, N.; Marghade, D.; Dinakar, A.; Chandana, I.; Sunitha, B.; Ravindra, B.; Balaji, T. Geochemical Characteristics and Controlling Factors of Chemical Composition of Groundwater in a Part of Guntur District, Andhra Pradesh, India. Environ. Earth Sci. 2017, 76, 747. [Google Scholar] [CrossRef]
- Chitsazan, M.; Aghazadeh, N.; Mirzaee, Y.; Golestan, Y.; Mosavi, S. Hydrochemical Characteristics and Quality Assessment of Urban Groundwater in Urmia City, NW Iran. Water Sci. Technol. Water Supply 2017, 17, 1410–1425. [Google Scholar] [CrossRef]
- Obiefuna, G.I.; Sheriff, A. Assessment of Shallow Ground Water Quality of Pindiga Gombe Area, Yola Area, NE, Nigeria for Irrigation and Domestic Purposes. Res. J. Environ. Earth Sci. 2011, 3, 131–141. [Google Scholar]
- Kelley, W.P.; Brown, S.M.; Liebig, G.F., Jr. Chemical Effects of Saline Irrigation Water on Soils. Soil Sci. 1940, 49, 95–108. [Google Scholar] [CrossRef]
- Ravikumar, P.; Venkatesharaju, K.; Prakash, K.L.; Somashekar, R.K. Geochemistry of Groundwater and Groundwater Prospects Evaluation, Anekal Taluk, Bangalore Urban District, Karnataka, India. Environ. Monit. Assess. 2011, 179, 93–112. [Google Scholar] [CrossRef] [PubMed]
- Doneen, L.D. Notes on Water Quality in Agriculture, Water Science and Engineering Paper 4001; Department of Water Science and Engineering, University of California: Davis, CA, USA, 1964. [Google Scholar]


| Sample No. | Lat | Long | pH | EC | TDS | Ca | Mg | Na | K | HCO3 | SO4 | Cl | NO3 |
|---|---|---|---|---|---|---|---|---|---|---|---|---|---|
| µS/cm | mg/L | ||||||||||||
| GW01 | 24.100086° | 45.338602° | 7.96 | 7342 | 4405 | 440 | 300 | 1048 | 11.4 | 160 | 530 | 1849 | 63 |
| GW02 | 24.101754° | 45.327399° | 8.1 | 7517 | 4510 | 700 | 288 | 948 | 14.1 | 101 | 590 | 1849 | 15.3 |
| GW03 | 24.091780° | 45.319818° | 8.4 | 6200 | 3720 | 480 | 228 | 735 | 13.3 | 193 | 600 | 1425 | 43.5 |
| GW04 | 24.050294° | 45.140728° | 8.29 | 6033 | 3620 | 400 | 252 | 721 | 11.7 | 198 | 610 | 1462 | 13.5 |
| GW05 | 24.031685° | 45.122868° | 8.32 | 5483 | 3290 | 340 | 228 | 604 | 11.7 | 397 | 590 | 1275 | 10.6 |
| GW06 | 23.996423° | 45.111401° | 8.22 | 4183 | 2510 | 560 | 36 | 358 | 5.1 | 248 | 620 | 760 | 10.8 |
| GW07 | 24.030336° | 45.088349° | 8.24 | 4200 | 2520 | 320 | 120 | 477 | 8.1 | 245 | 430 | 1000 | 7 |
| GW08 | 24.017747° | 45.065921° | 7.88 | 9350 | 5610 | 1220 | 300 | 1121 | 23.7 | 109 | 620 | 2174 | 39.2 |
| GW09 | 24.047257° | 45.064205° | 7.85 | 10,300 | 6180 | 840 | 240 | 1260 | 17.1 | 402 | 1100 | 2424 | 8.1 |
| GW10 | 24.064384° | 45.026008° | 8.62 | 5617 | 3370 | 660 | 120 | 609 | 10.2 | 206 | 650 | 1150 | 21.9 |
| GW11 | 24.072325° | 45.004732° | 8.43 | 3283 | 1970 | 340 | 48 | 297 | 1.8 | 192 | 490 | 665 | 2.9 |
| GW12 | 24.067186° | 45.002026° | 8.47 | 11,000 | 6600 | 1240 | 240 | 1478 | 24.6 | 219 | 740 | 2924 | 24.1 |
| Min | 7.85 | 3283 | 1970 | 320 | 36 | 297 | 1.8 | 101 | 430 | 665 | 2.9 | ||
| Max | 8.62 | 11,000 | 6600 | 1240 | 300 | 1478 | 24.6 | 402 | 1100 | 2924 | 63 | ||
| Avg | 8.23 | 6709.00 | 4025.42 | 628.33 | 200 | 804.67 | 12.73 | 222.50 | 630.83 | 1579.75 | 21.66 | ||
| P.L. | 8.5 | 1500 | 1500 | 200 | 100 | 200 | 12 | 600 | 250 | 250 | 45 | ||
| Sample No. | SAR | Na% | RSC | KR | MH | PI |
|---|---|---|---|---|---|---|
| GW01 | 9.40 | 49.38 | −44.38 | 0.97 | 53.19 | 50.97 |
| GW02 | 7.59 | 41.34 | −57.34 | 0.70 | 40.68 | 42.41 |
| GW03 | 6.89 | 42.89 | −39.84 | 0.74 | 44.19 | 45.01 |
| GW04 | 6.92 | 43.56 | −37.75 | 0.76 | 51.22 | 45.82 |
| GW05 | 6.19 | 42.46 | −29.49 | 0.73 | 52.78 | 46.28 |
| GW06 | 3.95 | 33.61 | −26.93 | 0.50 | 9.68 | 37.76 |
| GW07 | 5.75 | 44.62 | −21.98 | 0.80 | 38.46 | 48.66 |
| GW08 | 7.43 | 36.46 | −84.21 | 0.57 | 29.07 | 37.17 |
| GW09 | 9.84 | 47.11 | −55.41 | 0.88 | 32.26 | 49.11 |
| GW10 | 5.71 | 38.34 | −39.62 | 0.62 | 23.26 | 40.76 |
| GW11 | 3.99 | 38.16 | −17.85 | 0.61 | 19.05 | 43.31 |
| GW12 | 10.04 | 44.18 | −78.41 | 0.78 | 24.39 | 45.23 |
| Min | 3.95 | 33.61 | −84.21 | 0.50 | 9.68 | 37.17 |
| Max | 10.04 | 49.38 | −17.85 | 0.97 | 53.19 | 50.97 |
| Avg | 6.98 | 41.84 | −44.44 | 0.72 | 34.85 | 44.37 |
| SAR | Groundwater Category | No. of Samples | Percentage (%) |
|---|---|---|---|
| <10 | Excellent | 11 | 91.6 |
| 10–18 | Good | 1 | 8.4 |
| 18–26 | Doubtful | - | |
| >26 | Unsuitable | - |
| Na% | Groundwater Category | No. of Samples | Percentage (%) |
|---|---|---|---|
| <20 | Excellent | - | |
| 20–40 | Good | 4 | 33.3 |
| 40–60 | Permissible | 8 | 66.7 |
| 60–80 | Doubtful | - | |
| >80 | Unsuitable | - |
| RSC | Groundwater Category | No. of Samples | Percentage (%) |
|---|---|---|---|
| <1.25 | Excellent | 12 | 100 |
| 1.25–2.5 | Doubtful | - | |
| >2.5 | Unsuitable | - |
| KR | Groundwater Category | No. of Samples | Percentage (%) |
|---|---|---|---|
| <1 | Excellent | 12 | 100 |
| >1 | Unsuitable | - |
| MH | Groundwater Category | No. of Samples | Percentage (%) |
|---|---|---|---|
| <50 | Excellent | 9 | 75 |
| >50 | Unsuitable | 3 | 25 |
| PI | Groundwater Category | No. of Samples | Percentage (%) |
|---|---|---|---|
| >75 | Excellent | - | |
| 25–75 | Good | 12 | 100 |
| <25 | Unsuitable | - |
Disclaimer/Publisher’s Note: The statements, opinions and data contained in all publications are solely those of the individual author(s) and contributor(s) and not of MDPI and/or the editor(s). MDPI and/or the editor(s) disclaim responsibility for any injury to people or property resulting from any ideas, methods, instructions or products referred to in the content. |
© 2023 by the authors. Licensee MDPI, Basel, Switzerland. This article is an open access article distributed under the terms and conditions of the Creative Commons Attribution (CC BY) license (https://creativecommons.org/licenses/by/4.0/).
Share and Cite
Alogayell, H.M.; EL-Bana, E.M.M.; Abdelfattah, M. Groundwater Quality and Suitability Assessment for Irrigation Using Hydrogeochemical Characteristics and Pollution Indices: A Case Study of North Al-Quwayiyah Governorate, Central Saudi Arabia. Water 2023, 15, 3321. https://doi.org/10.3390/w15183321
Alogayell HM, EL-Bana EMM, Abdelfattah M. Groundwater Quality and Suitability Assessment for Irrigation Using Hydrogeochemical Characteristics and Pollution Indices: A Case Study of North Al-Quwayiyah Governorate, Central Saudi Arabia. Water. 2023; 15(18):3321. https://doi.org/10.3390/w15183321
Chicago/Turabian StyleAlogayell, Haya M., Eman Mohamed M. EL-Bana, and Mohamed Abdelfattah. 2023. "Groundwater Quality and Suitability Assessment for Irrigation Using Hydrogeochemical Characteristics and Pollution Indices: A Case Study of North Al-Quwayiyah Governorate, Central Saudi Arabia" Water 15, no. 18: 3321. https://doi.org/10.3390/w15183321
APA StyleAlogayell, H. M., EL-Bana, E. M. M., & Abdelfattah, M. (2023). Groundwater Quality and Suitability Assessment for Irrigation Using Hydrogeochemical Characteristics and Pollution Indices: A Case Study of North Al-Quwayiyah Governorate, Central Saudi Arabia. Water, 15(18), 3321. https://doi.org/10.3390/w15183321