Article

In2O3/NIO/MOS2 Composite as a Novel Photocatalytic towards Imatinib and 5-Fluorouracil Degradation

by
Nasirodin Khashi
1 and
Mohammad Hossein Sayadi
1,2,*
1
Department of Environmental Engineering, Faculty of Natural Resources and Environment, University of Birjand, Birjand 9717434765, Iran
2
Faculty of Natural Resources and Environment, Shahid Bahonar University of Kerman, Kerman 7616913439, Iran
*
Author to whom correspondence should be addressed.
Water 2023, 15(18), 3263; https://doi.org/10.3390/w15183263
Submission received: 18 August 2023 / Revised: 6 September 2023 / Accepted: 9 September 2023 / Published: 14 September 2023
(This article belongs to the Special Issue Water, Geohazards, and Artificial Intelligence)

Abstract

:
Photocatalysts with high efficiency in water and wastewater treatment have gained increasing attention in recent years. This study synthesized an In2O3/NiO/MoS2 composite using the hydrothermal method and characterized its crystal structure, particle size, morphology, elemental purity, and optical properties. This nanocomposite exhibits high photocatalytic activity under visible light radiation. It achieved efficiencies of 91.57% and 88.23% in decomposing Imatinib and 5-fluorouracil, respectively. The formation of heterogeneity between MoS2 and NiO enhances the photocatalytic activity, which facilitates the separation and transfer efficiency of photo-generated electron-hole pairs, increases the catalytic active sites, and inhibits the rate of electron-hole recombination. The photocatalytic mechanism shows that both O2− and H+ are reactive species for the degradation of the studied pollutant. The stability and reusability tests deposited that the In2O3/NiO/MoS2 composite photocatalyst has superior stability during four reuse cycles. The results of the study show that a unique photocatalyst system can provide a new perspective and create new opportunities for the design of efficient composite photocatalysts.

1. Introduction

A wide range of drugs has been detected in surface waters and groundwater under the influence of various sewage effluents [1]. The main sources of these pollutants are related to hospitals, medical centers, and pharmaceutical industries. Pharmaceutical compounds are biologically active in small amounts and retain their behavior after discharge into aquatic environments. This phenomenon has increased concern about possible risks to the environment and human health [2]. Because of the hydrophilicity and inherent resistance of many drugs to biodegradation, this means that several groups of drugs can remain intact from conventional water treatment methods [3]. An important group of pharmaceutical compounds is cytostatic drugs, which are characterized by genotoxicity, high cytotoxicity, and mutagenicity. Many cytostatic and anticancer drugs have been found in wastewater effluents and the environment [4]. 5-fluorouracil (FU-5) is part of a collection of chemotherapy drugs referred to as anti-metabolites. The molecule of FU-5 is among the oldest chemotherapy drugs developed worldwide and is usually used. The presence of FU-5 in the environment has been investigated due to its stability and similar structure to one of the main components of DNA, Uracil. The environmental toxicity assessment of 5-fluorouracil shows several effects that depend on its concentration and the type of organism under investigation. However, the experimental data about the actual concentration of 5-fluorouracil in the environment is still limited [5]. Booker et al. reported 5-fluorouracil presence in rivers, urban centers, and hospitals in concentrations of 280 ng/L, 5–160 ng/L, and 46–1500 ng/L, respectively [6]. Imatinib (IMA) is a type of cancer growth blocker referred to as a tyrosine kinase inhibitor. Tyrosine kinases (as chemical messengers) are proteins that cells use to signal to every different cell to grow. There are a number of exceptional tyrosine kinases and blockading them stops the cancer cells from developing. The use of IMA as an innovative anticancer drug for the treatment of chronic leukemia and chronic myeloid has continuously increased in recent years, increasing the concentration of imatinib in the environment. The environmental concentration of IMA was estimated at the level of about 5 ng/L [7]. Imatinib can affect organisms at very low concentrations by interfering with growth or damaging DNA [8]. The effects that FU-5 and IMA can have on the environment are alarming, and a way must be found to remove them from wastewater.
Advanced oxidation processes (AOPs) have significantly increased due to their widespread applications among the multitude of advanced processes for the removal of emerging pollutants. AOPs are usually based on the production of reactive oxygen species for the complete degradation of alysmic substances (i.e., OH, O2−, etc.) Heterogeneous photocatalysis is a type of AOPs. Photocatalysis based on semiconductor materials has created superior conditions for the removal of pollution due to its superior detoxification, low cost, suitable operating conditions, high surface area, chemical stability, and size-dependent properties [9]. Among semiconductor nanomaterials, TiO2 has attracted much attention as an efficient, environmentally friendly, and photochemically stable photocatalyst for the degradation of organic pollutants. However, in recent years, ZnO, WO3, CeO2, In2O3, Nb2O5, Ta2O5, MOSx, WSx, CdS, and ZnS photocatalysts have also been used [10].
Indium oxide (In2O3) is an important n-type semiconductor and has three phases: hexagonal, cubic, and hexagonal corundum. Recently, In2O3 has been widely used in solar cells, sensor modules, and transparent electrode materials for electrochromic cells and for liquid crystal display devices, thin film transistors, light-emitting diodes, and flat panel displays. The main advantages of In2O3 for use in photocatalysis include environmental stability, high photosensitivity, and an efficient sensitizer to expand the absorption spectrum of metal oxide-based semiconductor photocatalysts from the UV to the visible spectrum. Its weakness is the quick recombination of electrons and holes caused by being photo-induced [11]. The coupling of In2O3 with NiO leads to the facilitation of charge separation via electron trapping by Ni3+ ions. NiO is a relatively low-cost material, with low toxicity and high chemical and thermal stability applied in various fields, including photocatalysts, magnetic materials, lithium-ion batteries, adsorbents, gas sensors, and electrochromic devices. The photocatalytic attributes of NiO are used to degrade organic contaminations such as Rhodamine B (RhB) and methylene blue (MB) [12]. These studies were carried out under UV irradiation because the vast band gap of NiO (4–3.6 eV) prevents photocatalytic activity under visible light. In addition, the quick recombination of electron-hole pairs is another impediment reported to limit the efficiency of NiO [13]. Molybdenum disulfide (MoS2), a type of two-dimensional layered transition metal dichalcogenide, has inimitable advantages in photocatalysis in terms of inimitable chemical, physical, and electrical attributes and a tunable band structure. MoS2 is a well-known material with a layered structure similar to graphene, which has distinct physical and chemical properties [14]. Due to its narrow band gap (1.7 eV), nanoscale MoS2 is recognized as a potential photocatalyst that has excellent properties, such as superior conductivity, photostability, and catalytic activity [15]. The incorporation of MoS2 into metal oxide nanoparticles can be effective in order to create electron-hole pair transfer, enhancing light emission, and, at the same time, reducing the band gap [14]. Therefore, MoS2 plays a role similar to noble metals because MoS2 nanoparticles can act as electron collectors and are still effective in electron-hole pair separation [16].
The hydrothermal method is one of the most powerful and widely used bottom-up methods for producing nanostructures, and it has received a lot of attention due to its simplicity and cost-effectiveness. The hydrothermal method allows for the production of advanced materials such as bulk single crystals, fine particles, or nanoparticles. Hydrothermal is an advanced and practical technology for a wide range of chemical industries.
In the present study, an easy and cost-effective method for the synthesis of In2O3/NiO/MoS2 hybrid photocatalysts in hydrothermal conditions is prepared. The efficiency of this nanocomposite is investigated in the photocatalytic degradation of FU-5 and IMA drugs from aqueous solutions in a batch system under UV light irritation. Considering the remarkable photocatalytic performance and high stability of In2O3/NiO/MoS2 nanocomposite, it can provide a new perspective and create opportunities for designing efficient composite catalysts.

2. Materials and Methods

2.1. Synthesis Step of Hybrid Photocatalyst

2.1.1. Materials

In this study, Na2MoO4, NH2CSNH2, In (OH)3, Ni(OH)2, and NiCl2, with purities of 98%, 99%, 99.9%, 98%, and 98%, respectively, were produced by Sigma-Aldrich. Furthermore, a pH meter (Istek, 915PDC, Korea), an air pump (Hailea, ACO-5504, China), a shaker (Eyela, MMS-210, Japan), an ultrasonic device (Parsonic 7500 S, 220 VAC, Iran), an oven (Shimaz Electric, Iran), centrifuges (Centurion Ltd., K2042, England), a hotplate (MS-300HS, Korea), a digital scale (Kern, ABJ220-4M, Japan), and a spectrophotometer (Biospec-1601, Shimadzu, Japan) were used.

2.1.2. Synthesis of MoS2 Nanoparticles

In the first step, pure MoS2 nanoparticles were synthesized using the hydrothermal method. Then, 0.21 g of molybdenum precursor (sodium molybdate, Na2MoO4) was dissolved in 60 mL of deionized water. Then, 0.38 g of sulfur precursor (thiourea, H2CSNH2) was added to the solution under a magnetic stirrer. The obtained solution was put in a 100-mL autoclave and an oven at a temperature of 200 degrees Celsius for 12 h. The obtained black sediments were washed several times with deionized water and ethanol and finally dried for 12 h at 80 °C [17].

2.1.3. Synthesis of Nanoparticles In2O3/NiO

In(OH)3 and Ni(OH)2 nanoparticles are prepared through a hydrothermal process. A portion of Cl3 was first dissolved in 100 mL of distilled water under vigorous stirring at room temperature. Then, sodium dodecylbenzene sulfonate (SDBS) medium was added to the solution. In the next step, the mixture was kept in an autoclave at 120 °C for 24 h. After autoclaving and cooling the solution at room temperature, the resulting white precipitate (In(OH)3) was filtered and washed several times with distilled water.
For Ni(OH)2, NiCl2 is first dissolved as a solid in 160 mL of distilled water and then urea is added to the solution under vigorous stirring. The resulting mixture was relocated to a stainless steel autoclave. In this step, a green precipitate (Ni(OH)2) was obtained and, in the next step, the Ni(OH)2/In(OH)3 compound was prepared in a stainless steel autoclave. The prepared (OH)3 was added to the saturated NiCl2 solution and then the hydrothermal reaction was kept at 120 °C for 5 h. Then, the obtained laurel green compound Ni(OH)2/In(OH)3 was filtered and washed with water. Finally, the Ni(OH)2/In(OH)3 composites were placed in a metal crucible and subjected to heat treatment at 300 °C for one hour to produce yellow-green solid In2O3/NiO products [18].

2.1.4. Synthesis of In2O3/NiO/MoS2

MoS2 and NiO/In2O3 nanoparticles with an equal mass ratio were dispersed in 80 mL of absolute ethanol and sonicated at 25–30 °C for 2 h; the resulting mixture was vigorously stirred on a stirrer for 24 h. Then, the mixed sample was kept in an autoclave for 4 h at 130 °C. The obtained product was filtered and dried at 70 °C in a vacuum oven to obtain In2O3/NiO/MoS2 nanocomposite [19].

2.2. Characterization of Synthesized Nanoparticles

Samples with a crystalline structure were determined using Rigaku MiniFlex 600 X-ray diffraction (XRD) using Cu Ka radiation (MiniFlex 600, Rigaku, Japan). The morphology and structure of the resulting nanoparticles were explained using a FESEM electron microscope (FESEM-FEI Nanosem 450, Hillsboro, USA). Elemental analysis was determined using EDS combined with FESEM. A Fourier transform infrared spectrometer (Shimadzo, FT_IR1650, Kyoto, Japan) with KBr plates was used to show the chemical nature of the prepared composites in the range of 400–4000 (cm−1). Particle size distribution was recorded using dynamic light scattering (DLS) using a Zetasizer 3000HS (Malvern, Worcs, UK). The Brunauer-Emmett-Teller (BET) surface area of the samples was calculated through nitrogen (N2) absorption using a micrometer (Microtrac BEL Corp, Osaka, Japan). Thermographic analysis (TGA) was measured and determined using PerkinElmer (TGA8000, Waltham, MA, USA) at temperatures from 50 to 800 °C in atomic nitrogen.

2.3. Assessment of Photocatalytic Performance

Photodegradation tests of FU-5 and IMA drugs were performed in a reaction reactor with a volume of 100 mL. The photolysis and photocatalyst tests were performed in a batch photoreactor. In order to irradiate the desired solution, the photo reactor had a UV/A lamp with an intensity of 6 watts, which was placed in a quartz chamber. The aqueous solution containing FU-5 and IMA drugs with a certain amount of catalyst was placed in the cylindrical glass tank of the reactor, and a cover was used to cool the lamp. An air pump was used for aeration and oxygen flow in the reactor. In a typical photocatalytic experiment, a certain amount of photocatalyst (0.1 g/L of In2O3/NiO/MoS2 nanoparticles) is prepared in 50 mL of an aqueous solution containing a pharmaceutical agent with a pH of 7. Before starting the irradiation, the suspension was magnetically stirred for 30 min in complete darkness to establish the balance of adsorption and desorption between photocatalyst and drugs. The samples were taken at specified time intervals. The final concentration of each filtered sample was determined using a spectrophotometer at 266 and 302 nm for FU-5 and IMA, respectively. To optimize the method, the parameters of the initial drug concentration (10–50 mg/L), catalyst dose (0.05–1.5 g/L), pH (3–11), and different irradiation times (10–120 min) were investigated. The degradation efficiency was determined in the photocatalytic reaction following Equation (1) [2].
R % = C 0 C e C 0 × 100
where in:
  • R = Degradation efficiency (%)
  • C0 = Initial concentrations of the drug in the solution (mg/L)
  • Ce = The final concentration of the drug in the solution after the decomposition process (mg/L).

3. Results and Discussion

3.1. Characterization of Synthesized In2O3/NiO/MoS2 Nanoparticles

3.1.1. XRD Studies

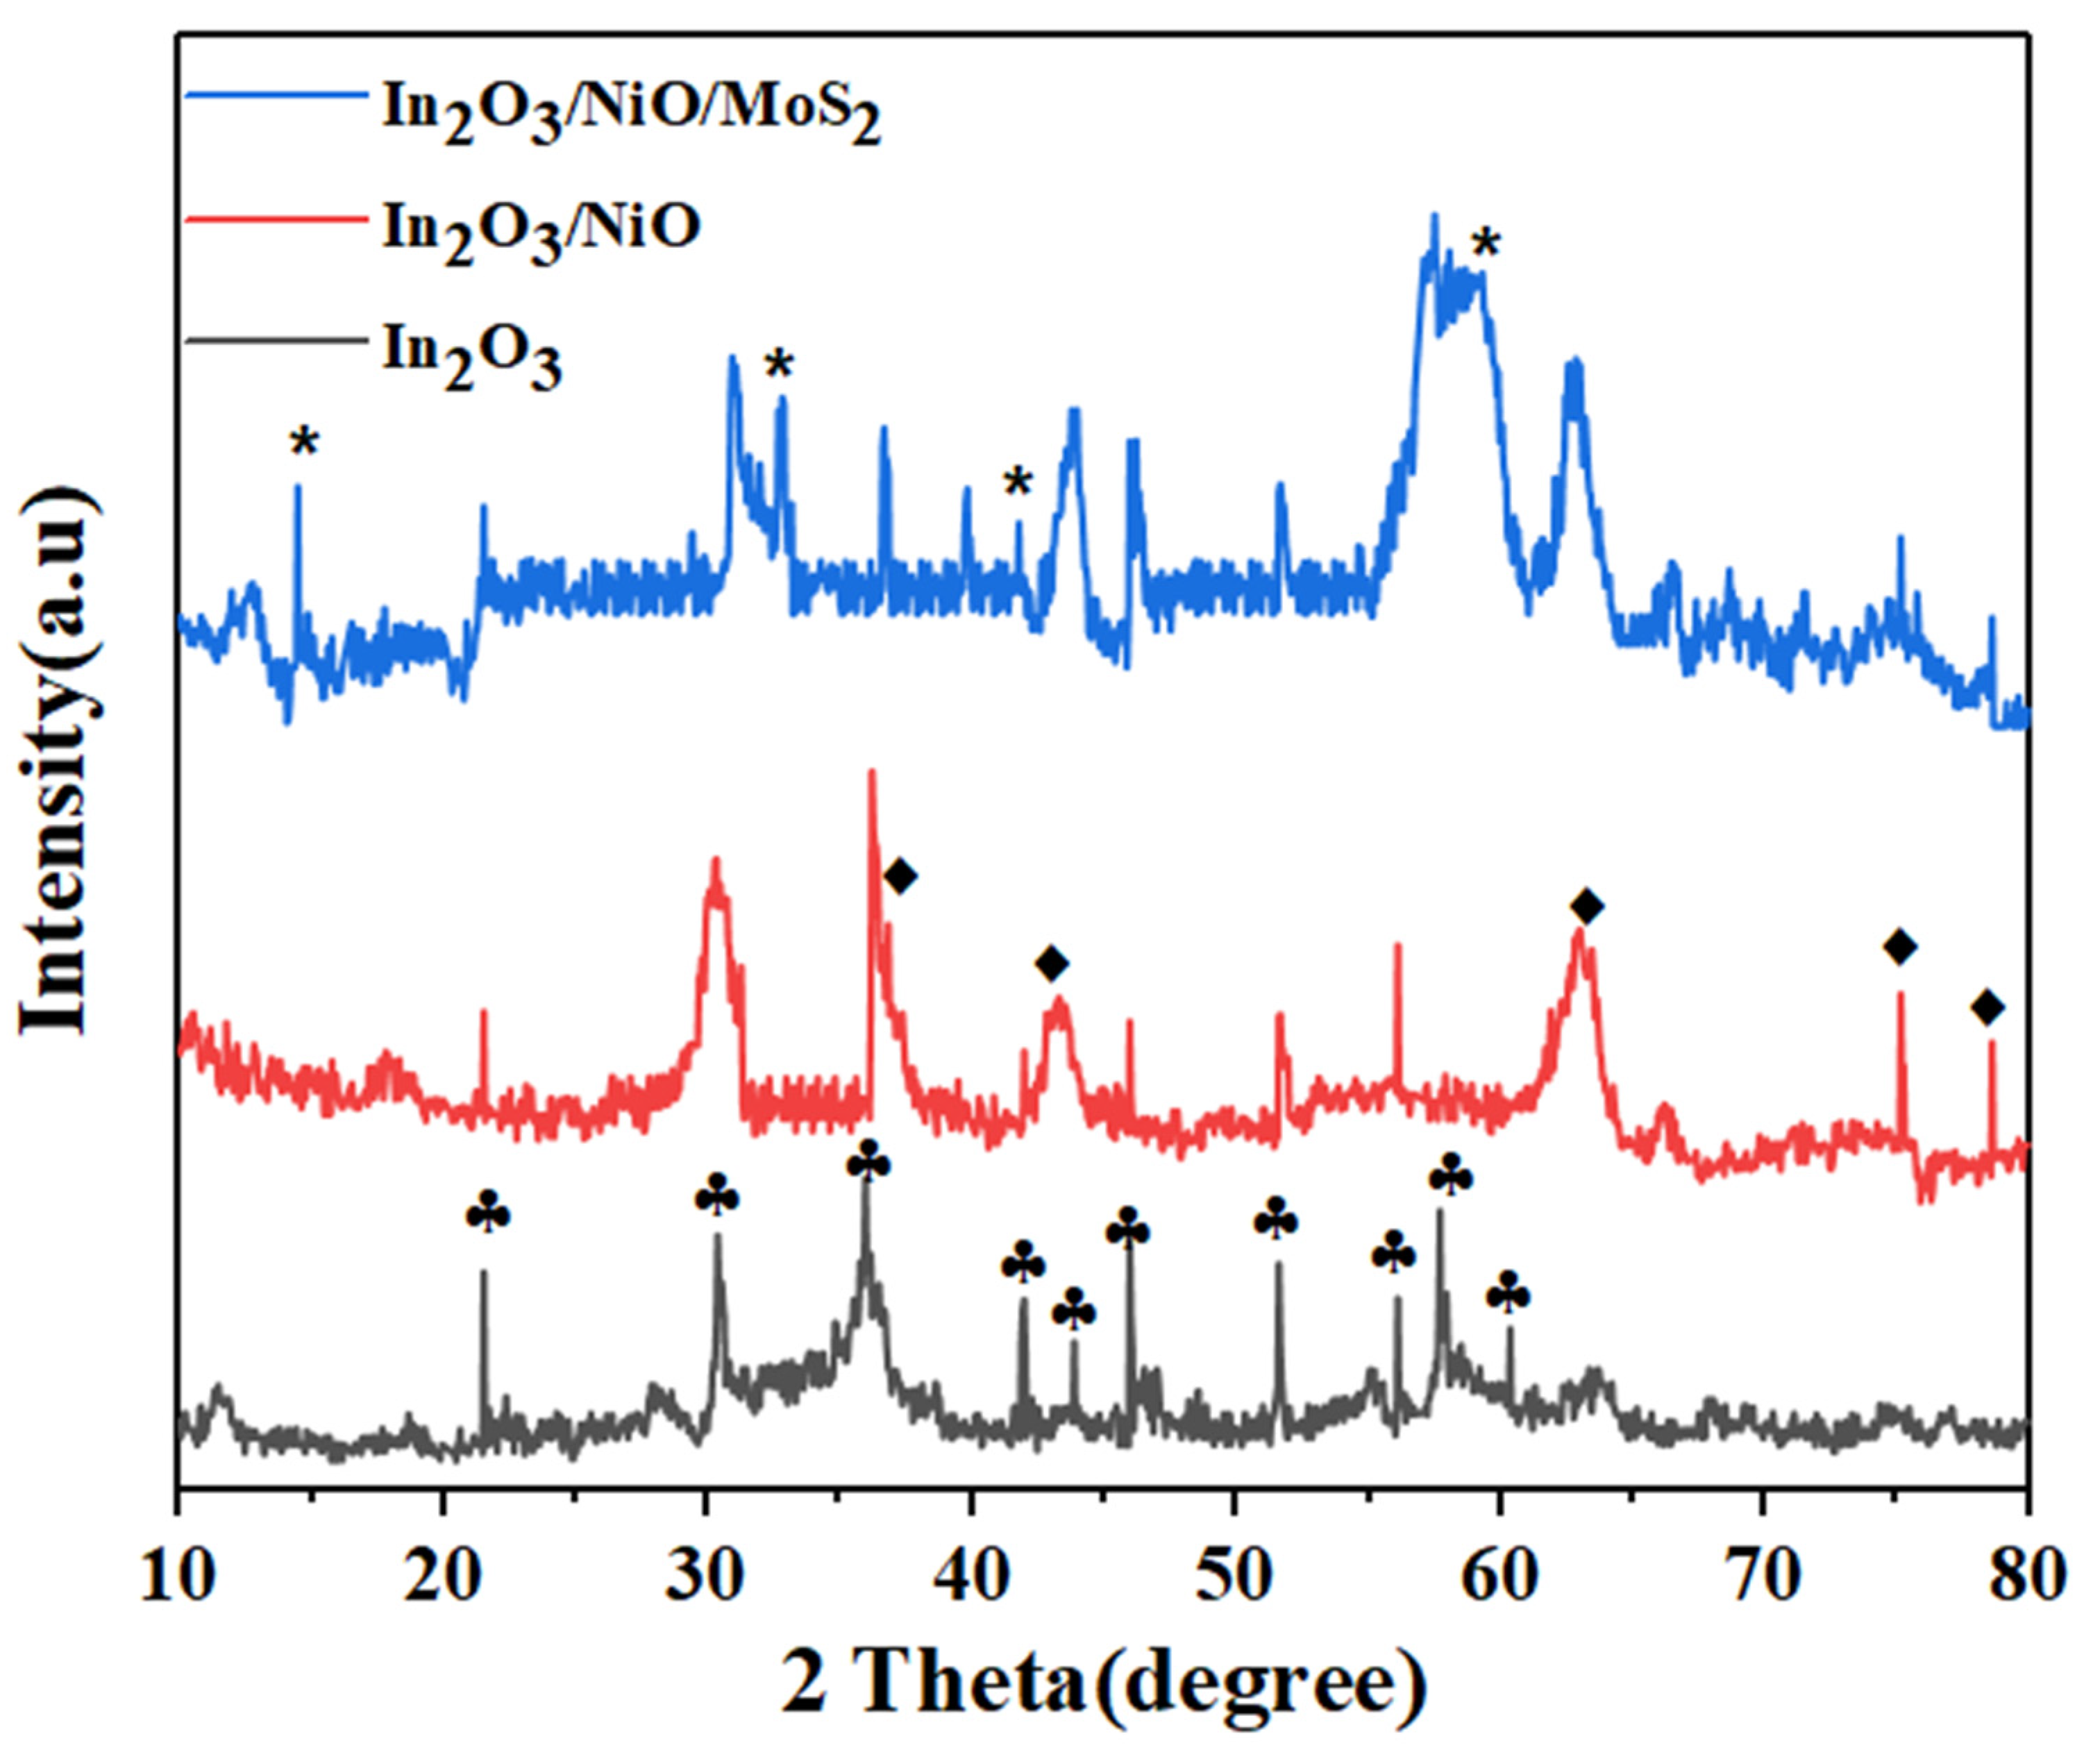
The XRD pattern of In2O3/NiO/MoS2 nanoparticles is shown in Figure 1. As can be observed, prominent peaks at 21.64, 30.58, 35.55, 41.95, 43.84, 45.95, 51.07, 56.12, 57, 55, and 60.30 correspond to (211), (222), (400), (332), (422), (431), (440), (611), (620), and (541) showing planes in In2O3 cubic phase, respectively (JCPDS 06-0416) [20]. After coating with NiO, the diffraction peaks at 37.04°, 43.13°, 62.72°, 75.13°, and 78.60° correspond to the (111), (200), (220), (311), and (222) diffraction planes in NiO, respectively (JCPDS 01-073-1523) [21]. Furthermore, after loading MoS2, there are diffraction peaks at 14.5°, 32.12°, 39.72°, and 58.5° for MoS2, which correspond to plates (002), (100), (103), and (110), respectively, which indicate the presence of MoS2 confirmed in composite nanoparticles In2O3/NiO (JCPDS 73-1508) [14,22].

3.1.2. SEM, EDS, and DLS Analyses

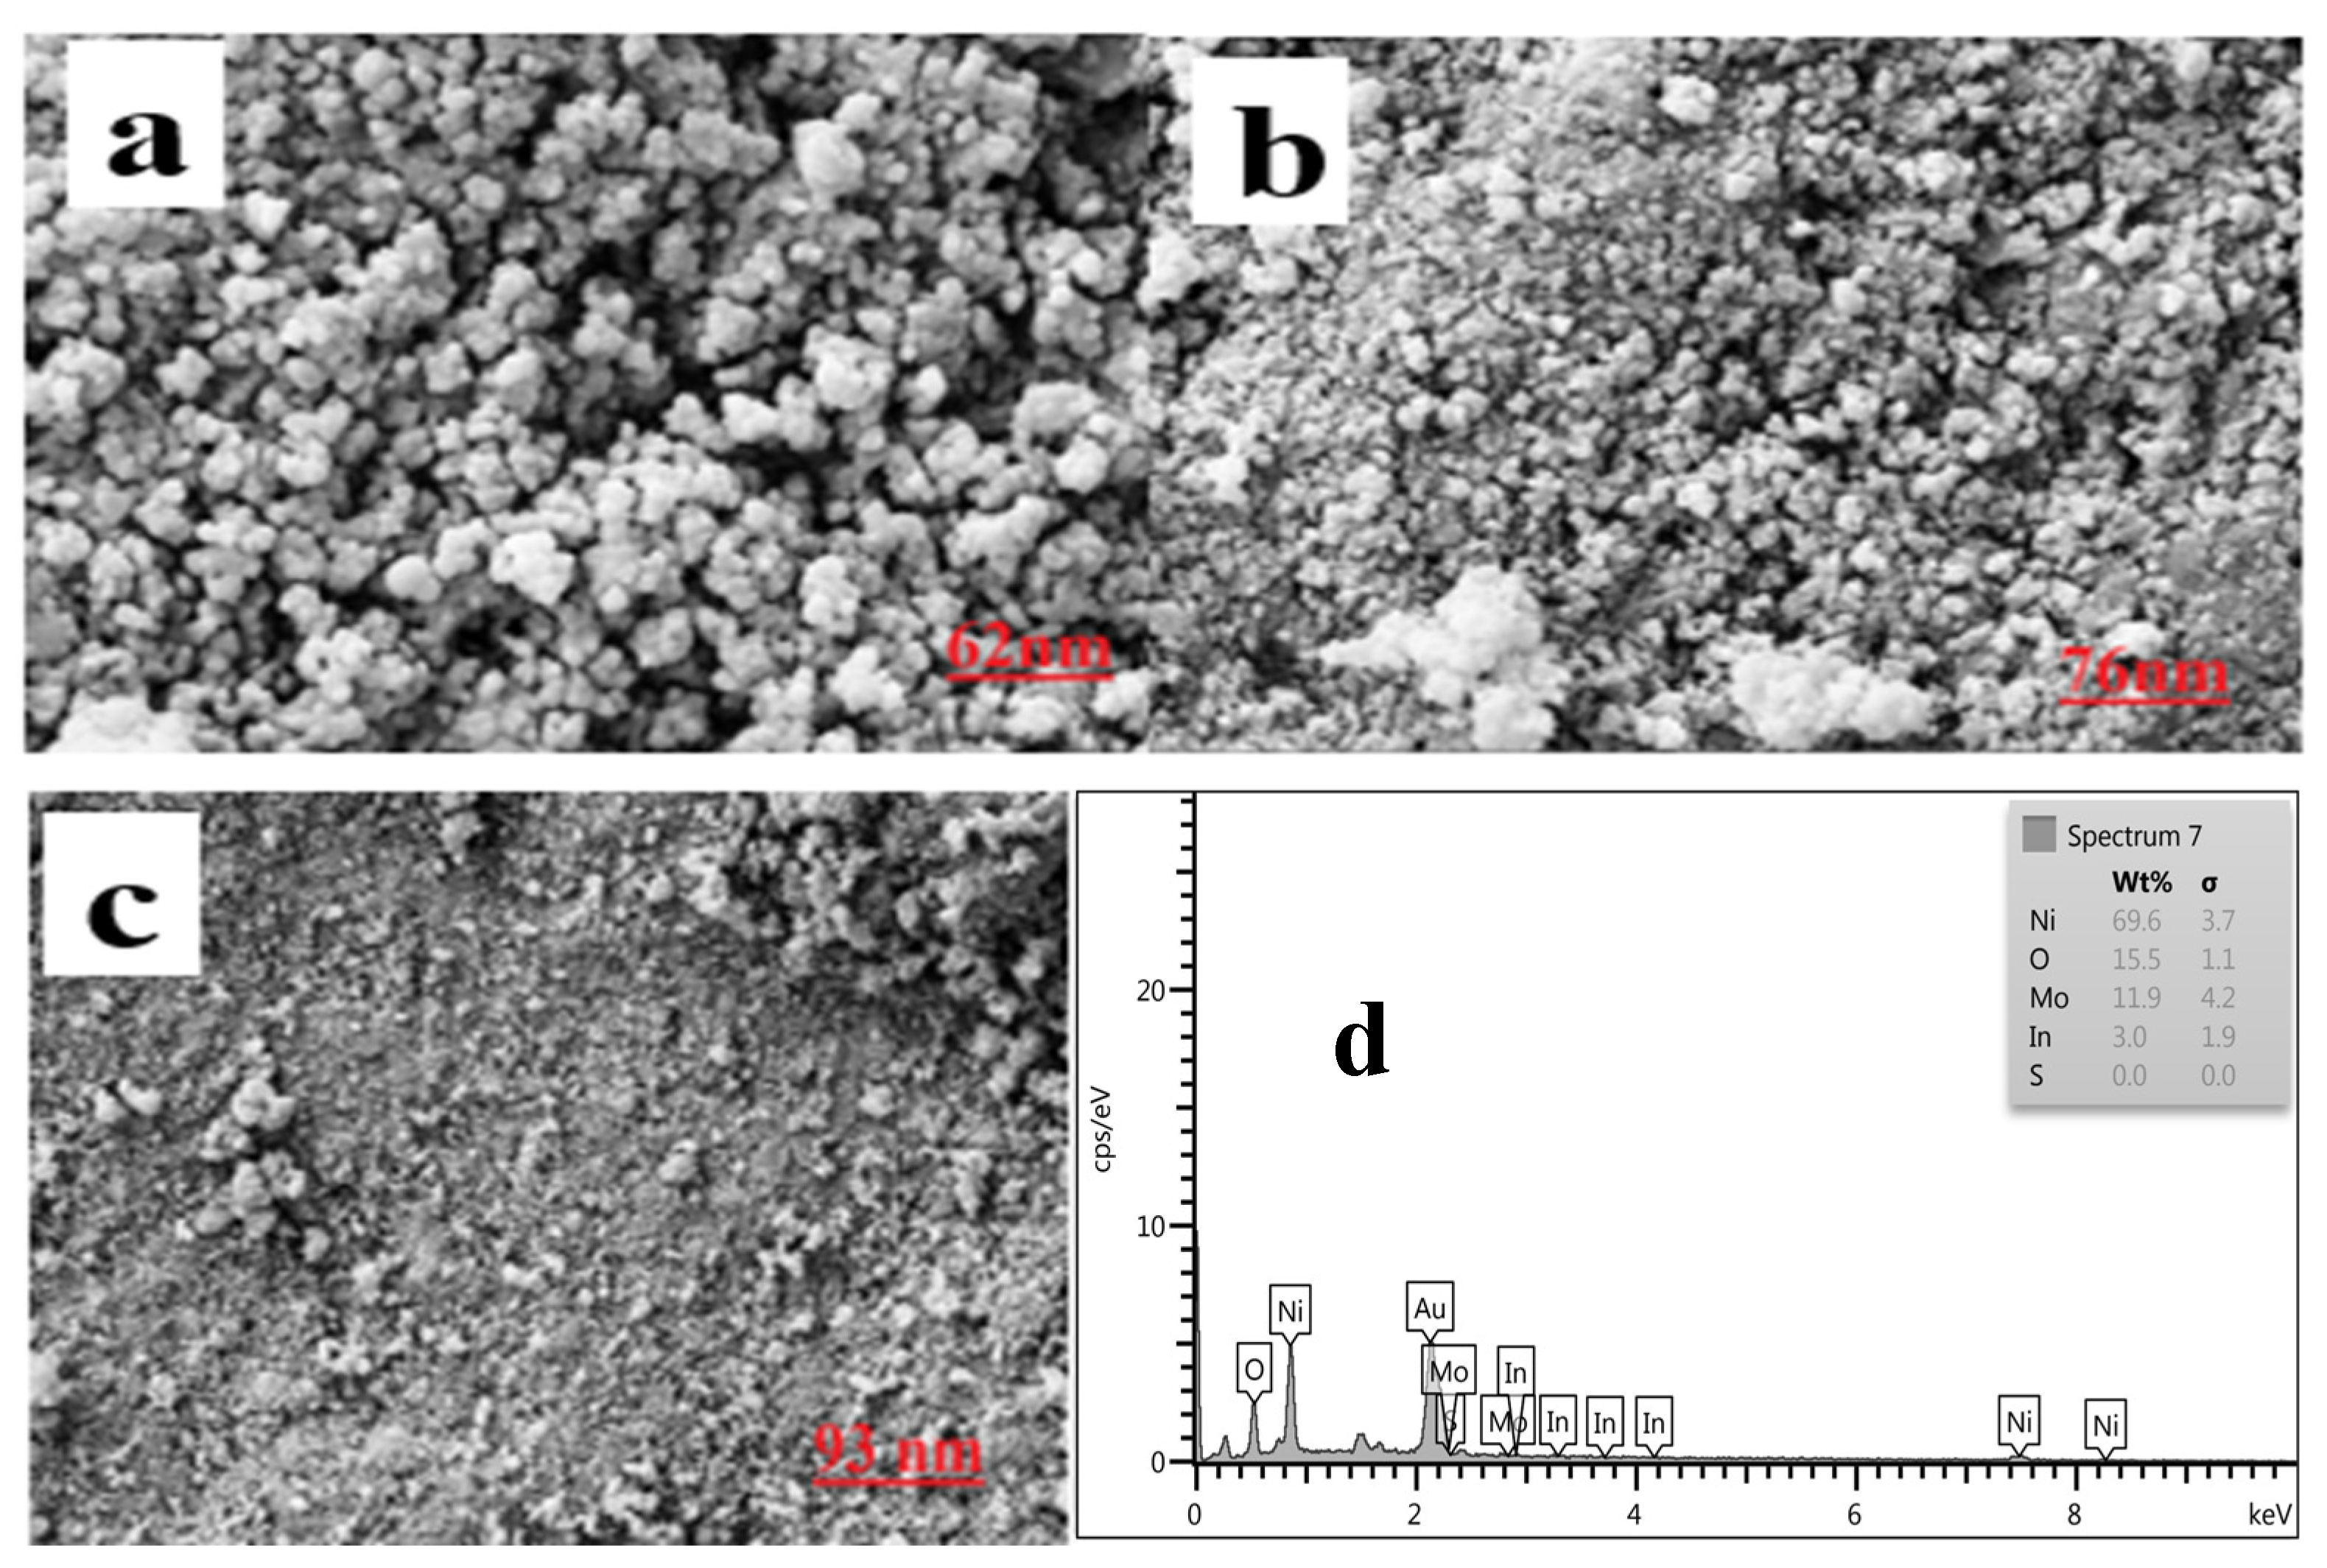
Figure 2 shows SEM images of In2O3/NiO/MoS2 nanoparticles. As shown in Figure 2a, the In2O3 nanoparticles have a cubic structure with a relatively uniform surface. In Figure 2b, after coating the In2O3 nanoparticles with NiO nanoparticles, NiO a petal structure, which shows good dispersion, surrounds the cubic nanoparticles. Figure 2c,d indicates that In2O3/NiO nanoparticles diffuse around MoS2 nanoparticles. Moreover, after coating with In2O3/NiO, its diameter increased, but no clear change was observed in the surface structure of In2O3/NiO/MoS2. The chemical composition of the resulting nanoparticles was evaluated using an energy-dispersive X-ray spectrometer (EDS). Figure 2d, the EDX spectrum, showed the presence of Ni, In, Mo, S, and Or elements, which confirmed the successful integration of In2O3/NiO/MoS2 particles.
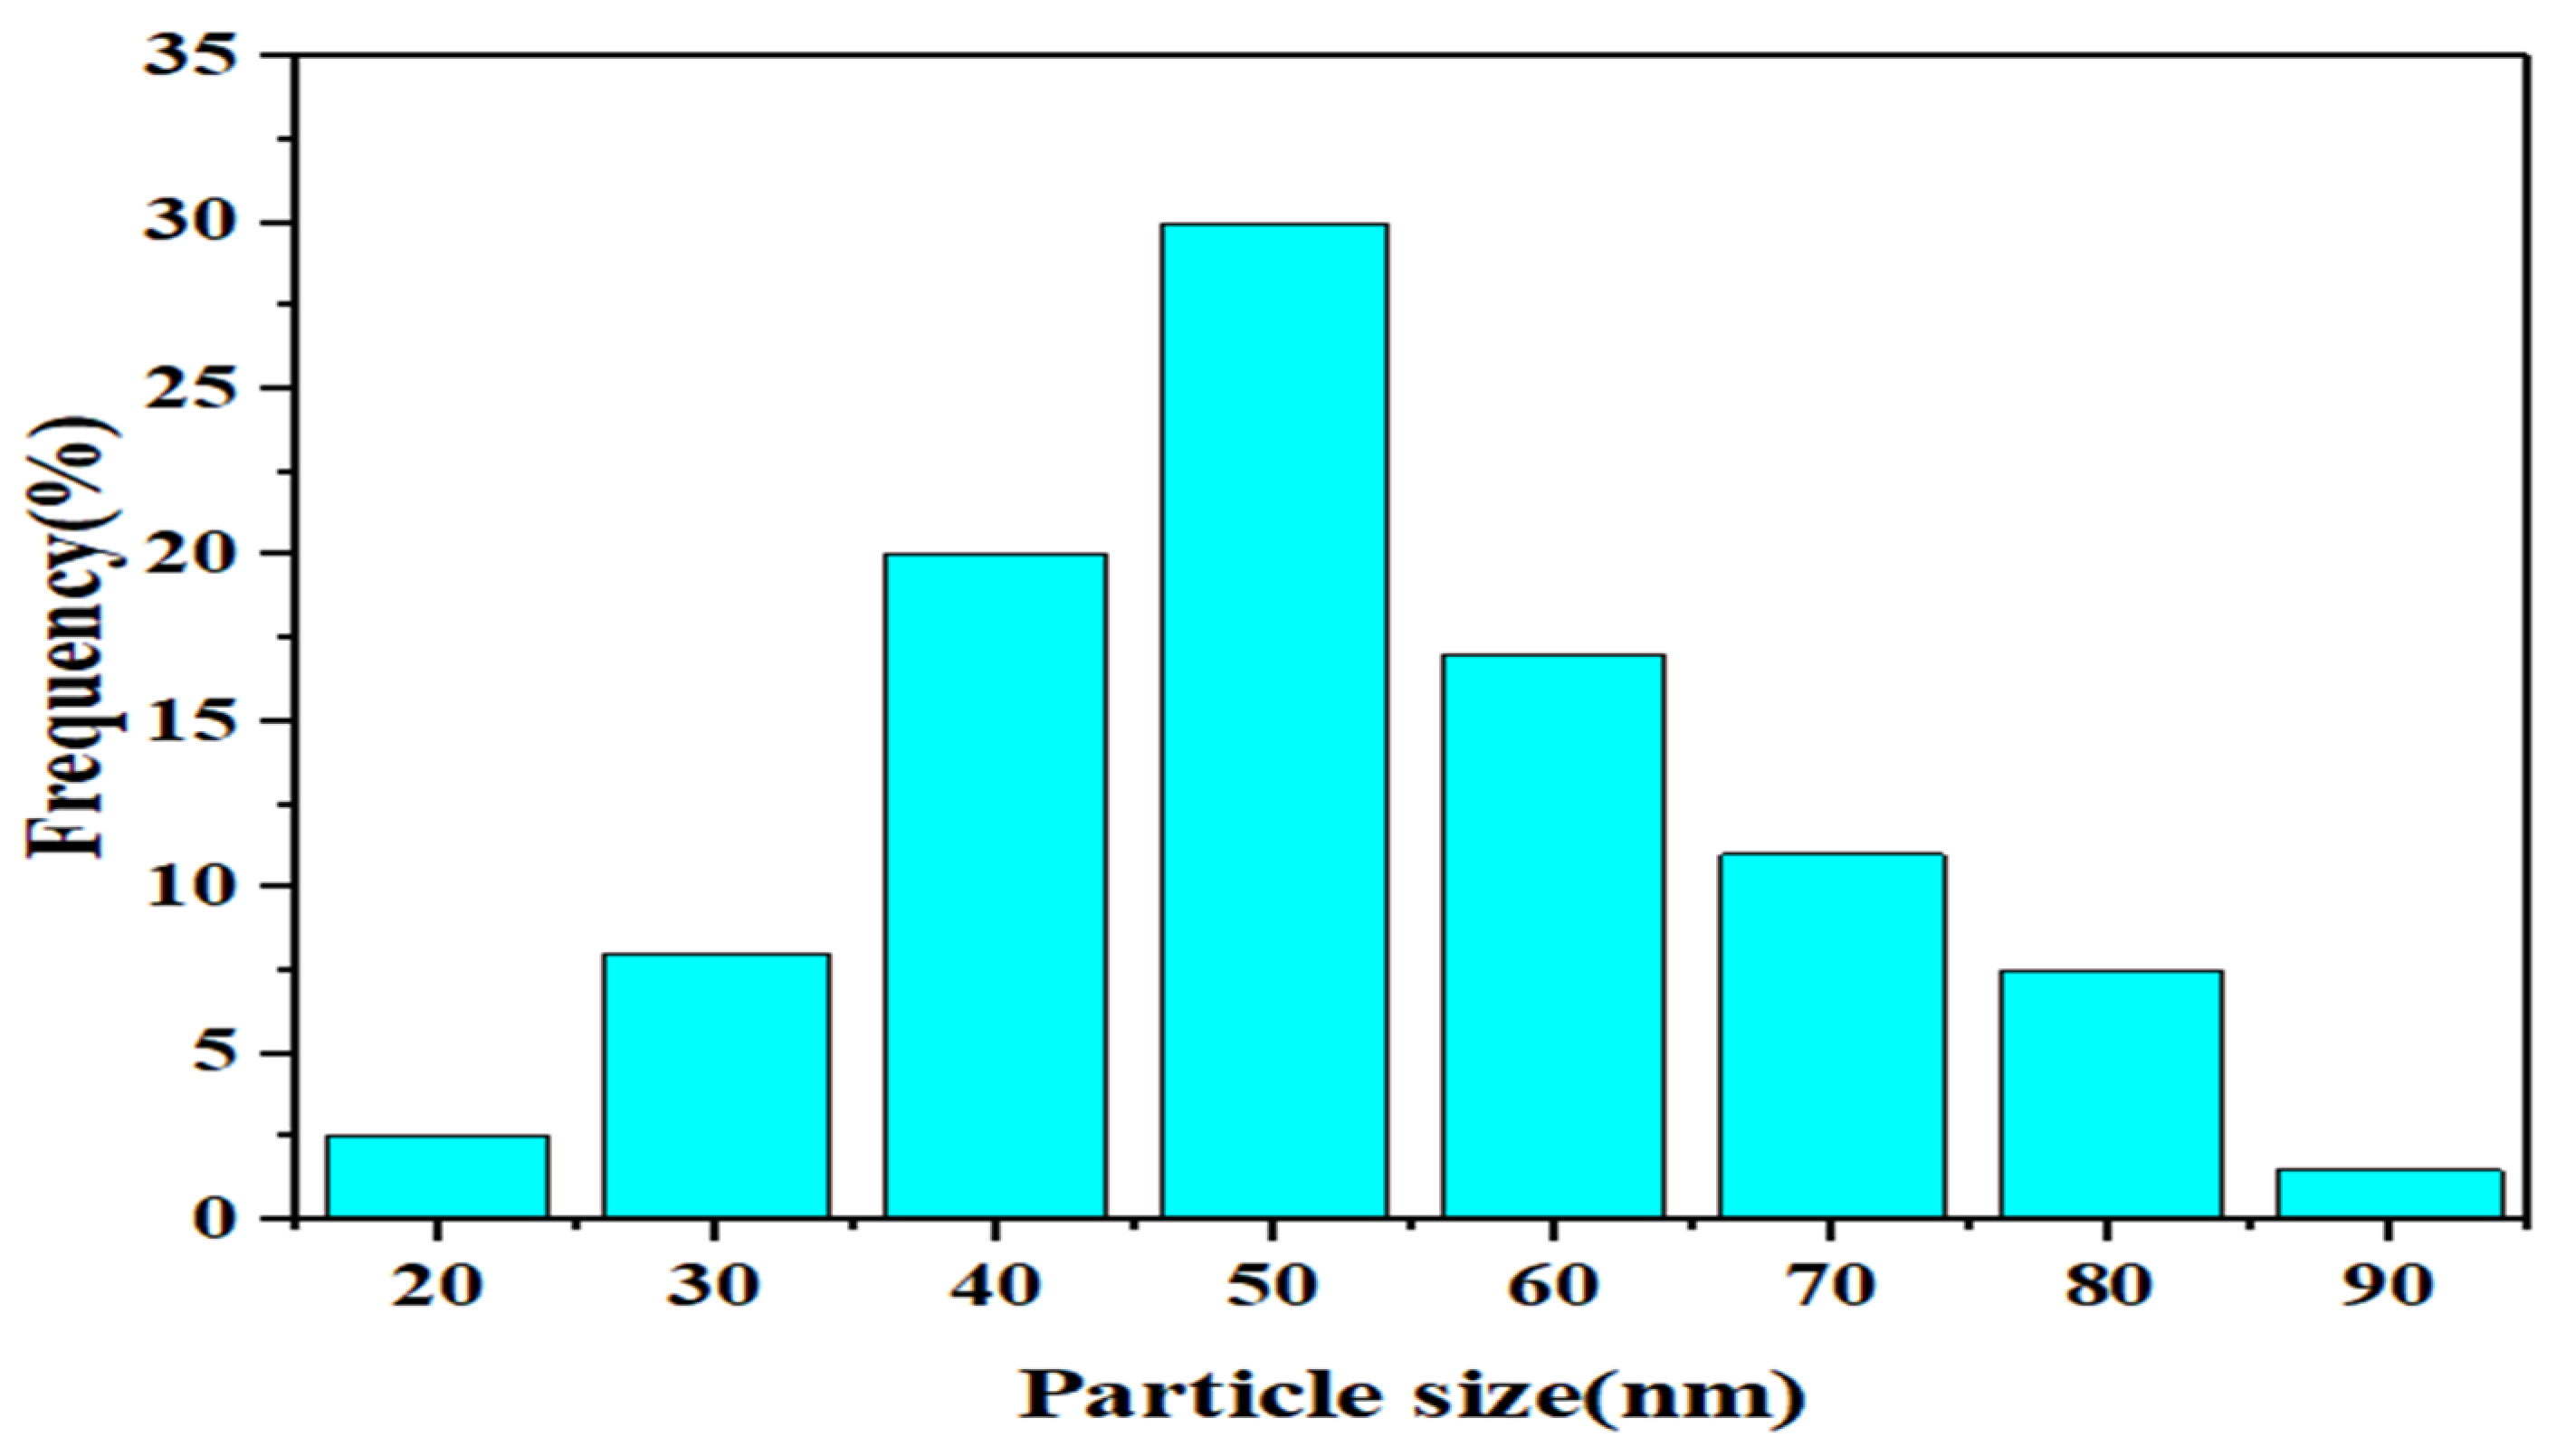
As shown in Figure 3, the particle size distribution of In2O3/NiO/MoS2 was measured using DLS. As can be seen, the range of particle size distribution was in the range of 20–90 nm.

3.1.3. Fourier Transform Infrared Spectroscopy (FTIR)

The FTIR spectrum of In2O3/NiO/MoS2 hybrid nanoparticles is shown in Figure 4. The strong peak at 543 cm−1 is attributed to the presence of In-O bending vibration. The absorption peak at 1640 cm−1 is assigned to H-O-H bending vibrational strains. The peak at 3461 cm−1 belongs to the vibrational stretching of hydroxyl groups, which is due to the presence of water on the surface of nanoparticles [19]. The band at 2700 indicates the C-H group in the sample. After coating with NiO nanoparticles, the peak at 991 cm−1 is attributed to the vibrational stretching of Ni-O. In addition, the absorption bands at 1818, 3271, 3146, and 3685 are attributed to the vibrational stretching of C=O, C-H, O-H, and O-H, respectively, in the sample. The absorption peak at 1362 cm−1 is assigned to H-O-H bending vibrational strains at the nanoparticle surface. Peak 368 indicates the presence of In2O3/NiO/MoS2 nanoparticles [20,21]. The absorption peak at 484 cm−1 is due to the S bond and in S-S [23]. In addition, the peak in the range of 2914 cm−1 is related to the C-H stretching mode on the surface of the sample. Therefore, the FTIR spectrum confirms the composition of In2O3/NiO/MoS2.

3.1.4. DRS Analyses

The optical characteristics of In2O3, In2O3/NiO, and In2O3/NiO/MoS2 nanoparticles are depicted in Figure 5. The optical absorption curve of In2O3 indicated a peak in the range of 250–600 nm. By modifying NiO in In2O3, the optical absorption of modified nanoparticle In2O3/NiO significantly increased. The optical absorption spectrum for In2O3/NiO/MoS2 demonstrated the highest absorption compared to In2O3 and In2O3/NiO. The optical absorption studies indicated significant improvement in modified nanoparticles compared to In2O3 alone [24]. As can be seen, the modification of nanoparticles narrowed the band gap in In2O3/NiO/MoS2 compared to In2O3. The band gap calculated for In2O3, In2O3/NiO, and In2O3/NiO/MoS2 samples was 2.27 eV, 1.91 eV, and 1.82 eV, respectively.

3.1.5. N2 Adsorption-Desorption

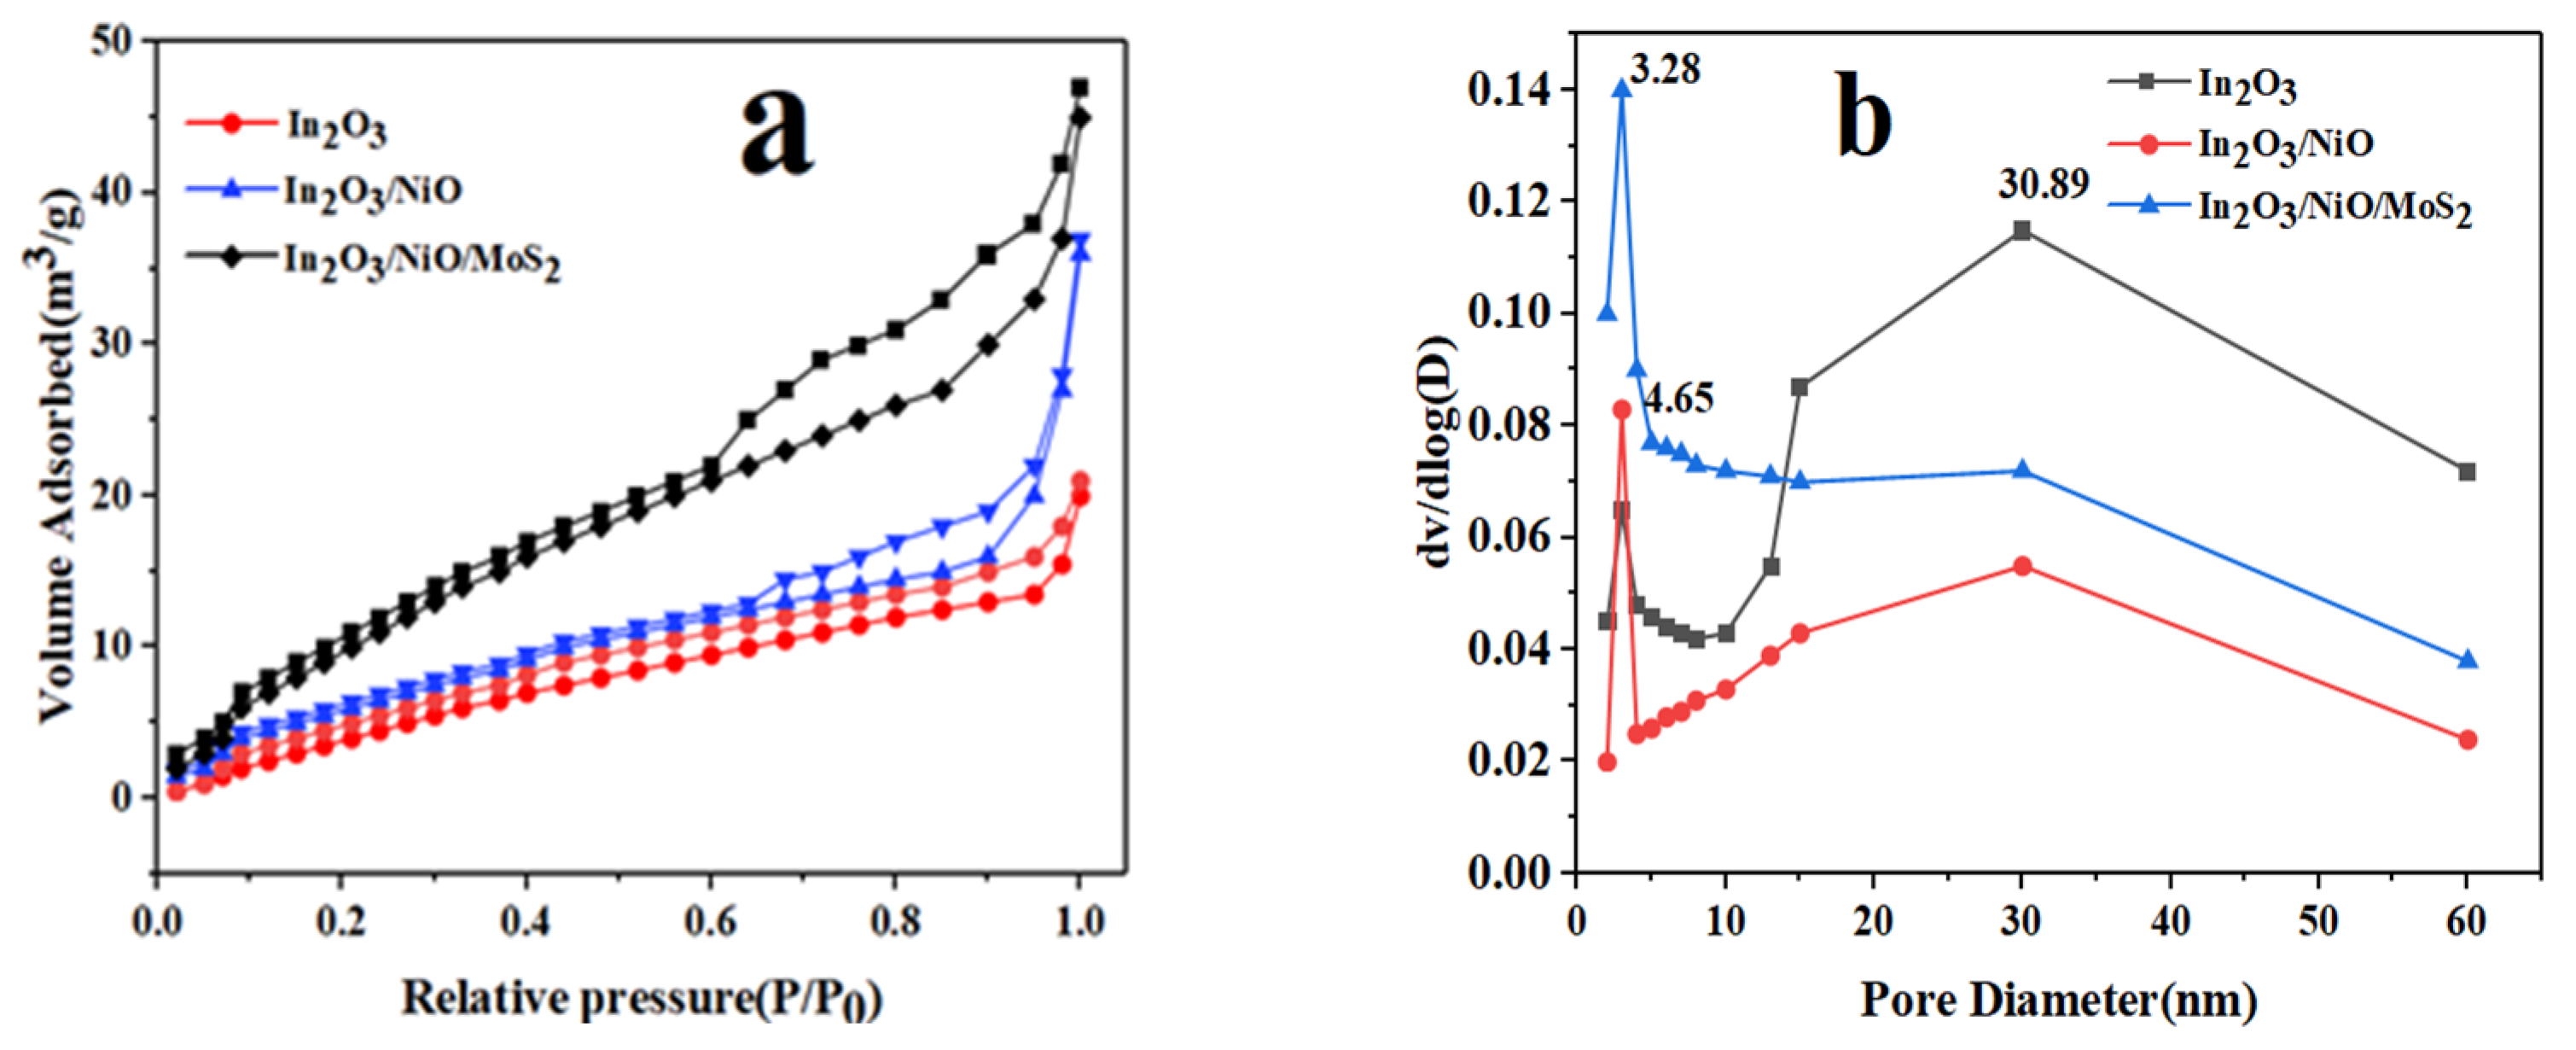
In this study, N2 adsorption-desorption isotherm curves and pore size distribution plots were investigated to investigate the structural characteristics of the In2O3/NiO/MoS2 surface. Figure 6 indicates the BET surface area of the In2O3, In2O3/NiO, and In2O3/NiO/MoS2 nanoparticles, which were obtained as 11.63, 14.96, and 27.36 m2g−1, respectively. The experimental results displayed that the surface area of In2O3/NiO/MoS2 was superior to that of the In2O3/NiO/MoS2 due to the uniform dispersion of In2O3, NiO, and MoS2 nanoparticles. These tiny pores can be due to the presence of In2O3 nanoparticles, NiO, which obstruct pores in In2O3 nanoparticles. The presence of these nanoparticles and mesoporous In2O3 nanoparticles in nanocomposites can act as channels for absorption and provide access to the active sites for the desired photocatalyst with the absorbed pollutant [22].

3.1.6. TGA Analyses

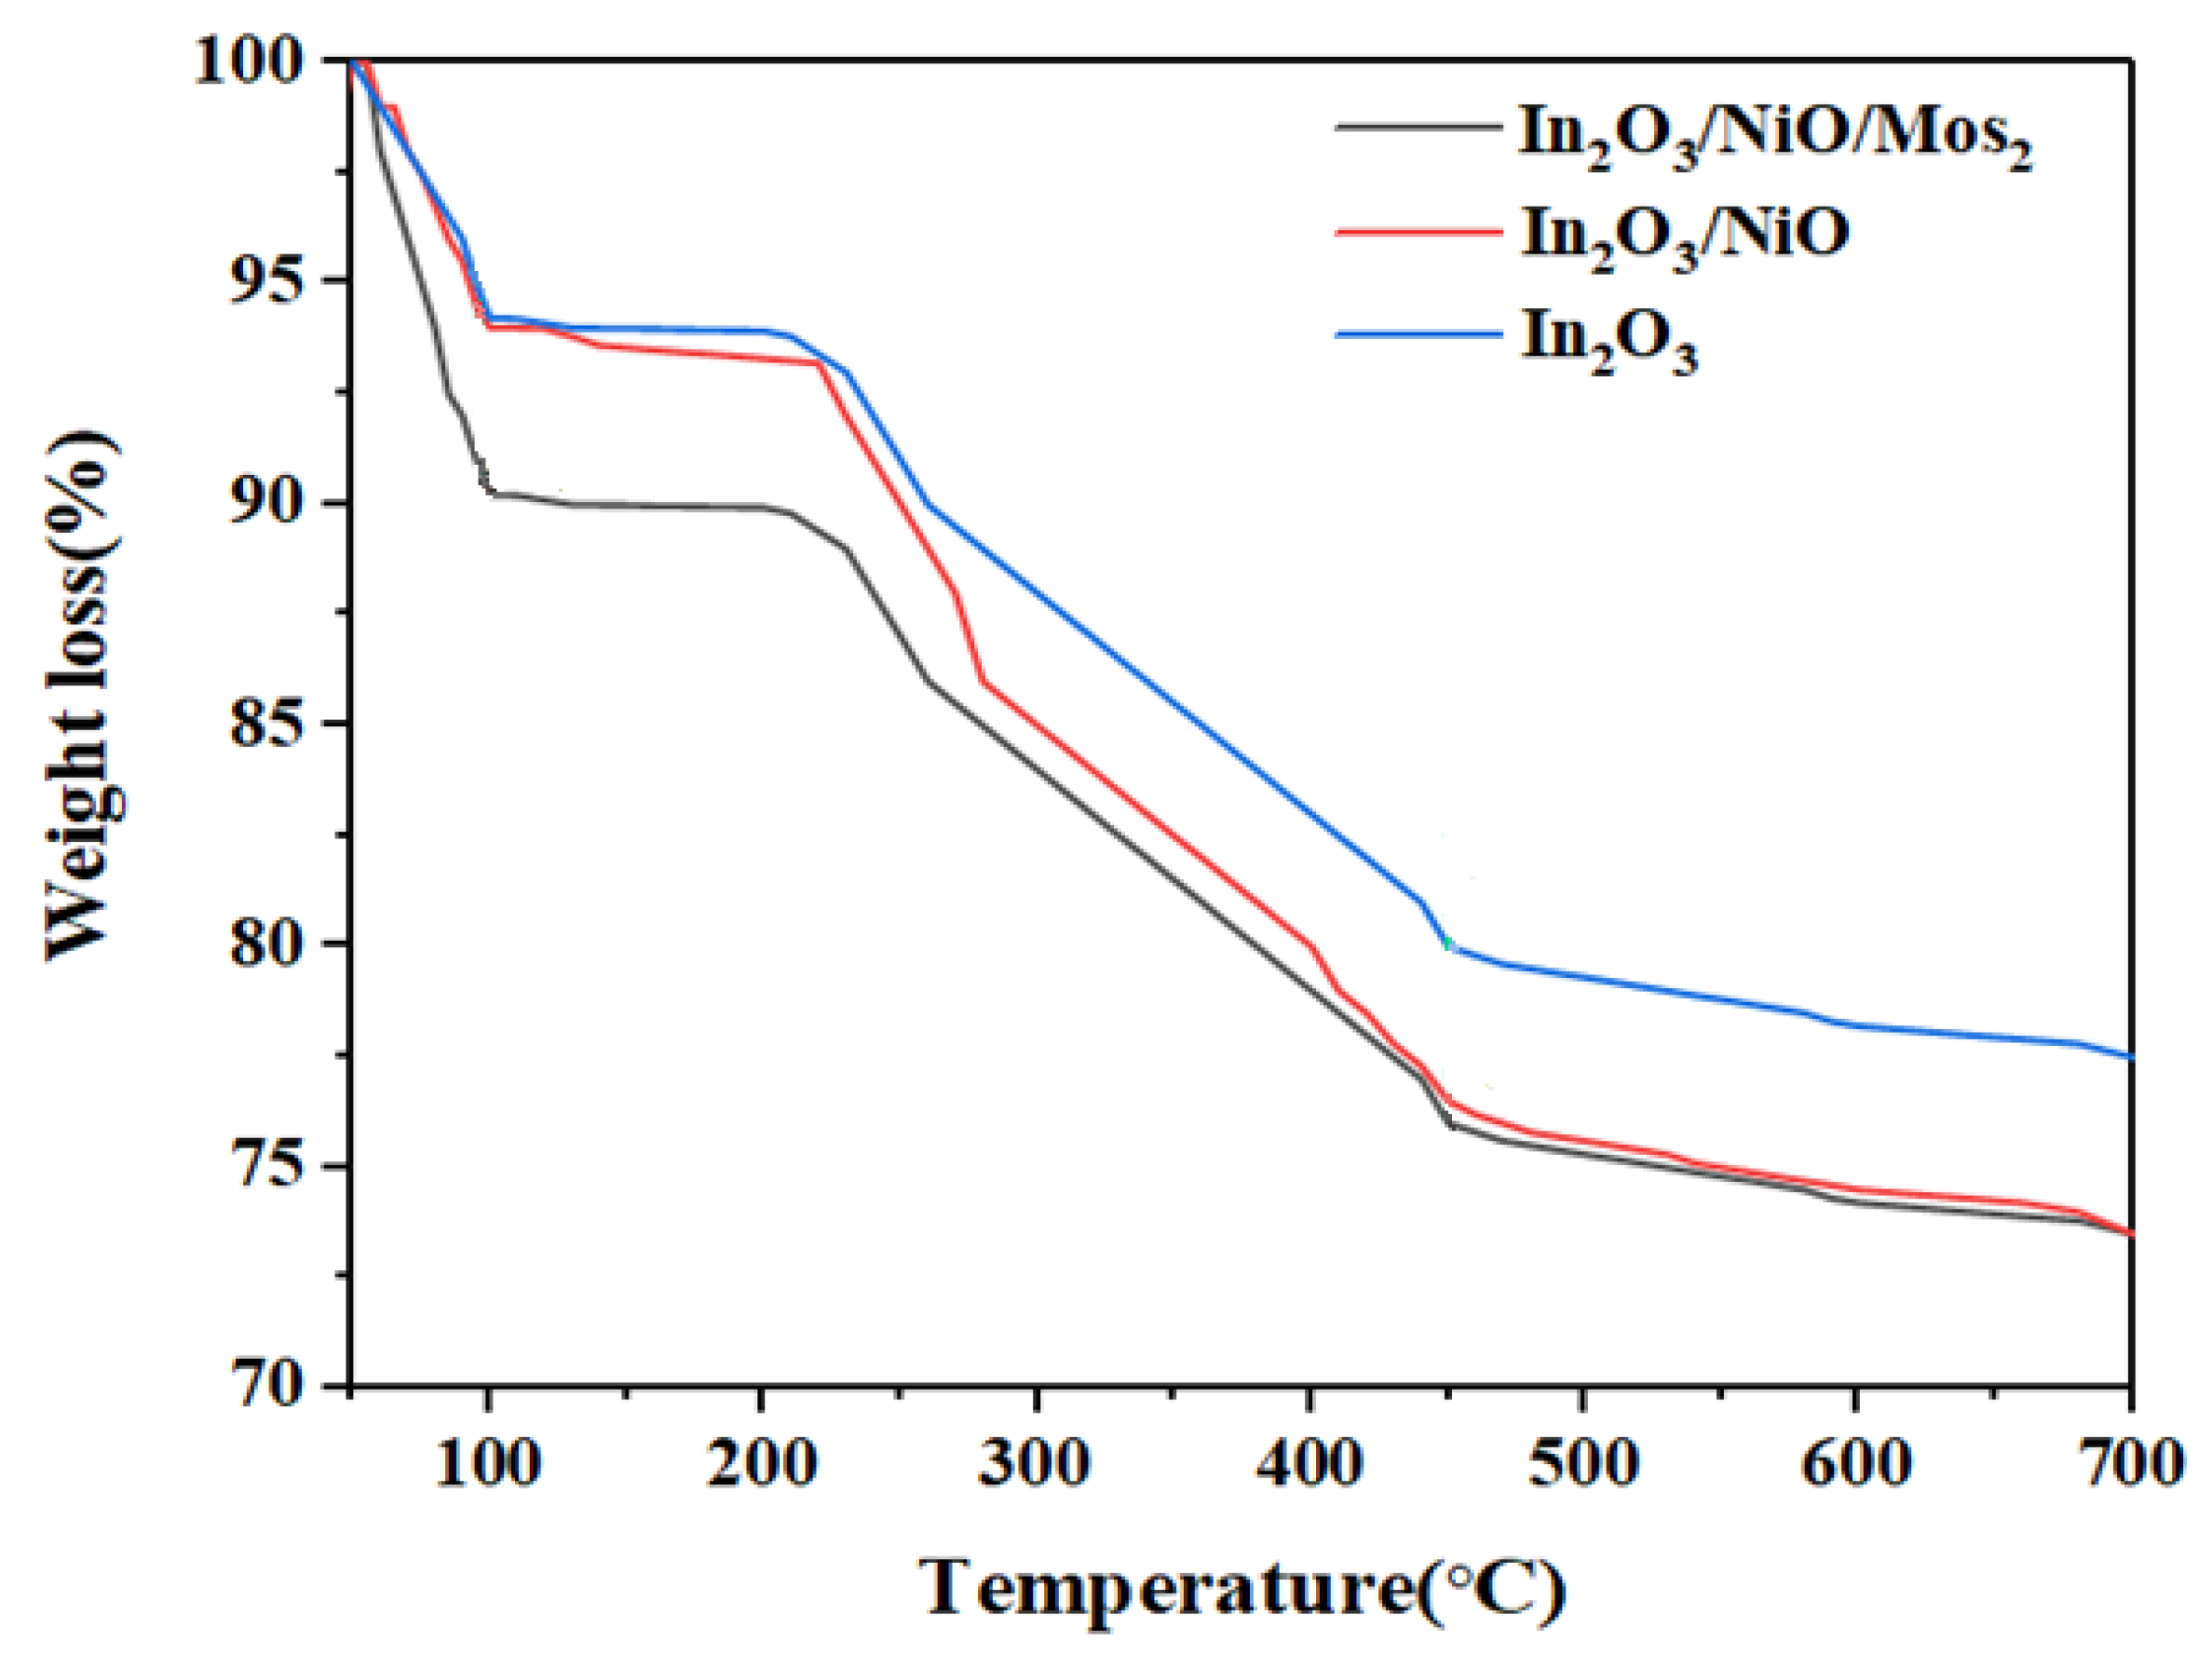
The stability of the composite nanoparticles of In2O3, In2O3/NiO, and In2O3/NiO/MoS2 is shown in Figure 7. As can be observed, each TGA curve depicted three stages of decomposition. This evaluation indicated that the initial weight loss for In2O3/NiO and In2O3/NiO/MoS2 samples occurred at a temperature of 100 °C, which is attributed to the evaporation of the physically absorbed water of the samples. In particular, the weight of In2O3/NiO/MoS2 was significantly decreased compared to other samples, which was probably attributed to the incomplete drying of the synthesized nanoparticles. Furthermore, these results showed that there was a weight loss in the range of 100–200 °C and it was due to the thermal decomposition of organic surface groups [25]. In the last stage, it was at a temperature of 200 to 450 °C with maximum weight loss, which was caused by the combustion of the sample. The weight loss of the In2O3, In2O3/NiO, and In2O3/NiO/MoS2 samples was obtained as (81.59), (76.18), and (76.14), respectively. These results indicate that the thermal stability of the composite is significantly higher than that of the pure In2O3 sample and is therefore suitable for many high-temperature interconnected applications [26].

3.2. Photocatalytic Performance

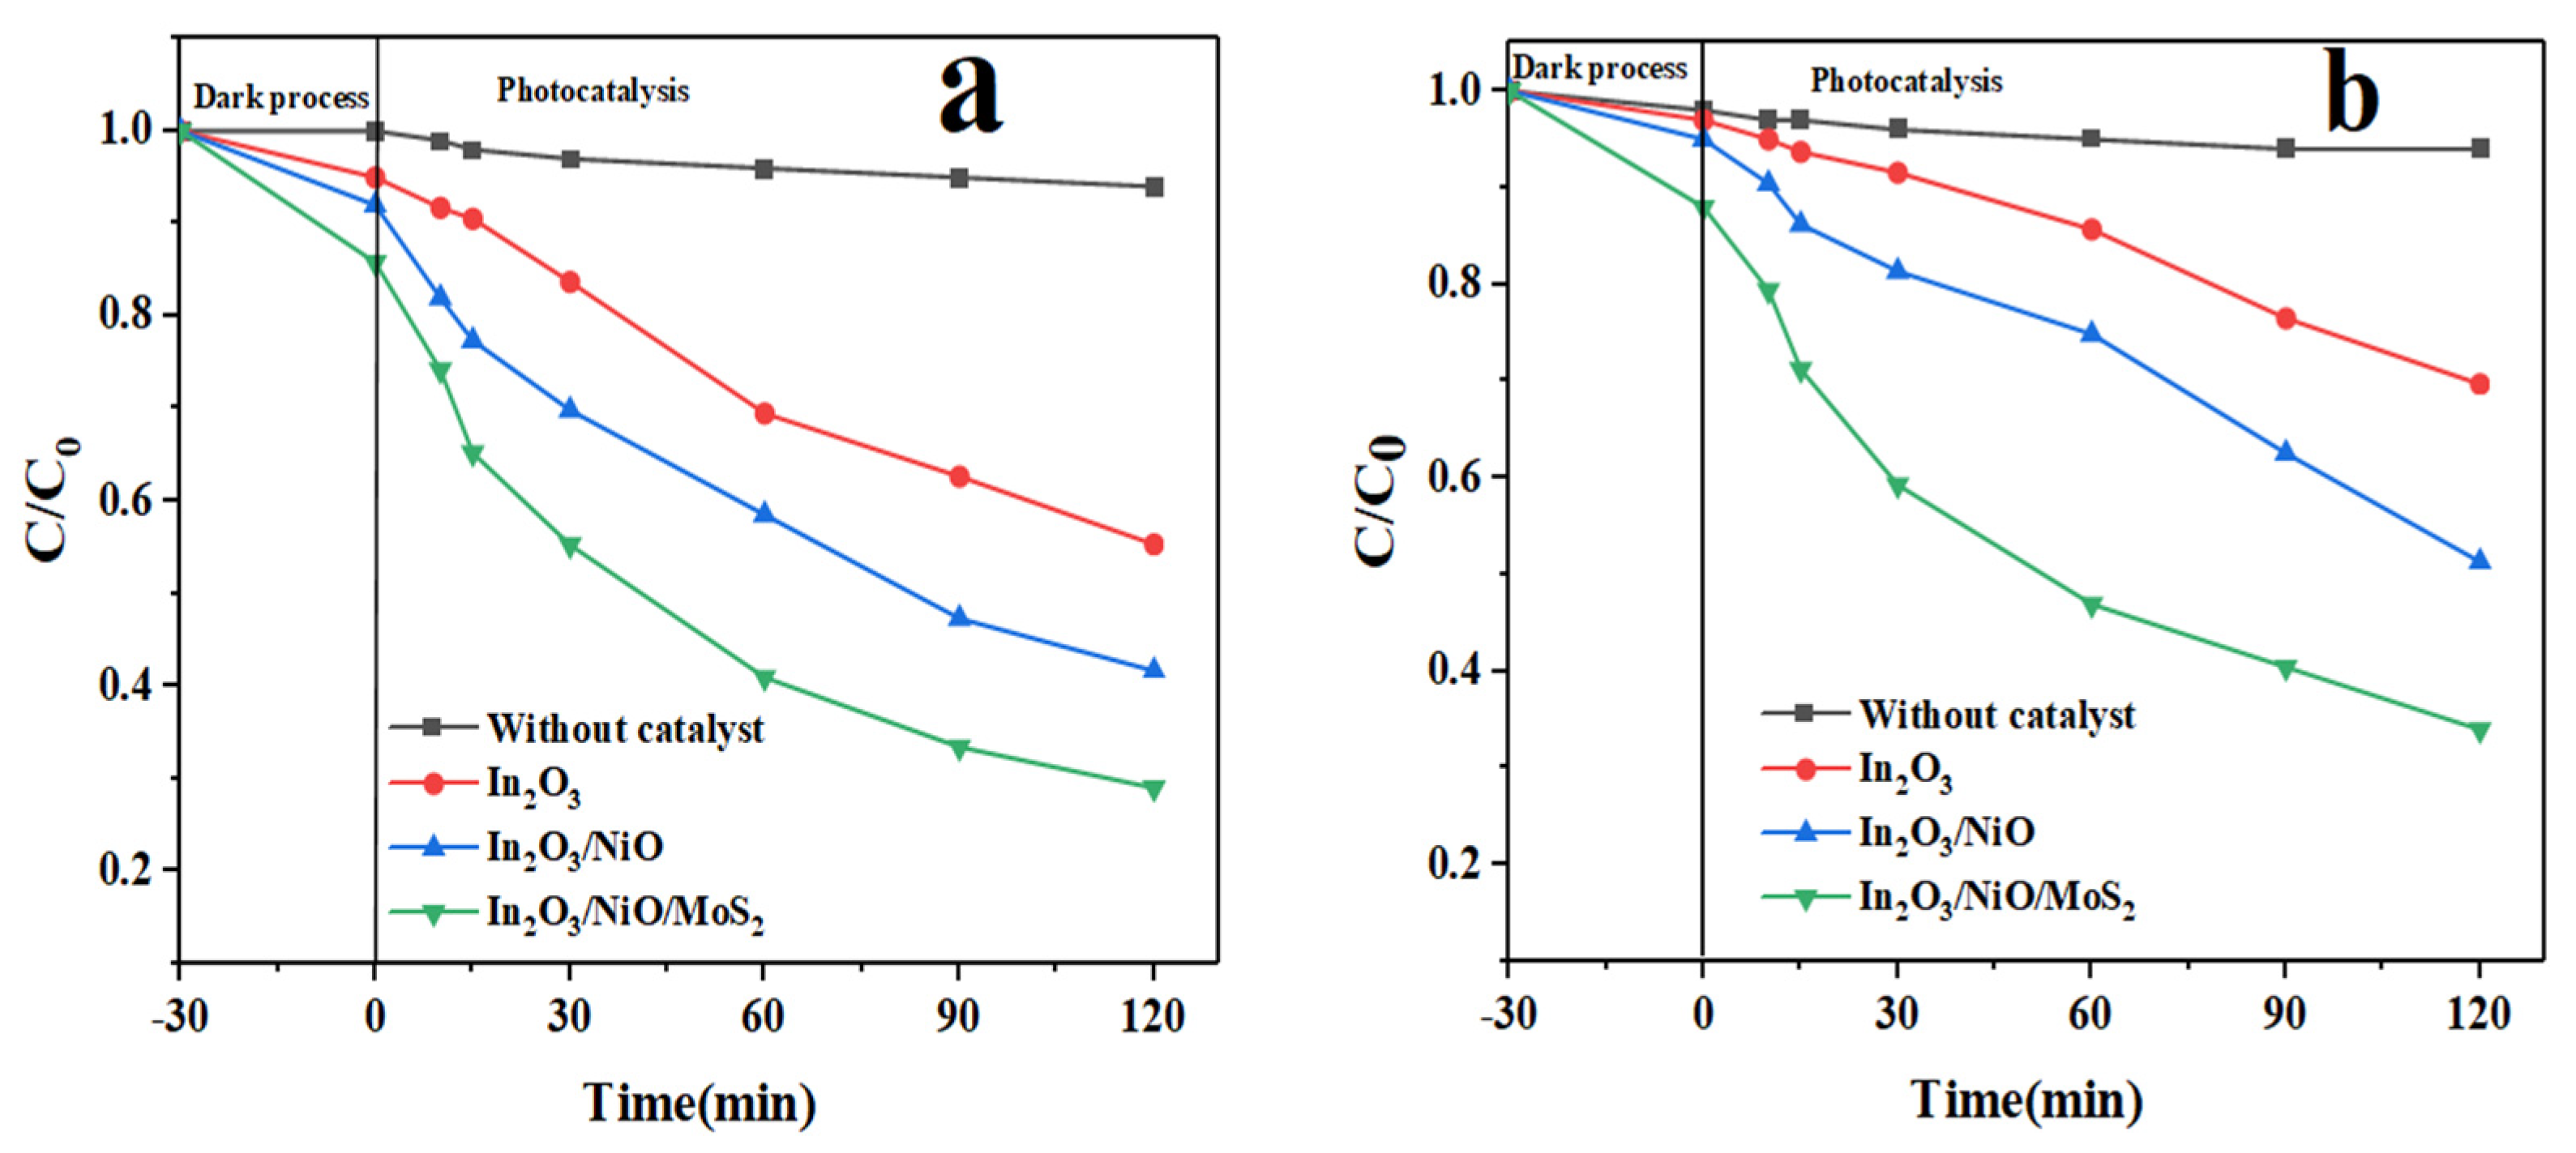
The photocatalytic activity of drug solution samples was analyzed and evaluated under visible light. The change curves (Ct/C0) are shown in Figure 8, and it can be observed that C0 and Ct are the initial and residual concentrations of the medicinal pollutant in time interval t, respectively. In this study, the drugs IMA and FU-5 were chosen as model pollutants because they are very resistant to photodegradation; photolysis experiments have shown a negligible removal of photodegradation. In addition, only 15.77 and 13.91% of IMA and FU-5 drugs were removed after 30 min irradiation by In2O3 alone, while the greater degradation of these two pollutants was practically achieved after 30 min of irradiation by In2O3/NiO/MoS2. It is clear that pure In2O3, when used as a photocatalyst, exhibits a fast electron-hole recombination rate. Therefore, the process of coating and hybridizing In2O3 nanoparticles with NiO and MoS2 can dominate this defect and improve photocatalytic activity [27].
The results demonstrated that coating In2O3 with NiO and MoS2 effectively increased the photocatalytic activity. Among the composites, In2O3/NiO/MoS2 showed the best photocatalytic performance and, after exposure to UV/A light, 87.18 and 90.68% removal occurred in FU-5 (Figure 8a) and IMA (Figure 8b), respectively. All of the photocatalytic experiments were performed in the dark for 30 min to establish an equilibrium between the adsorption-desorption of the pollutant and the photocatalyst, so it was observed that the highest yield only occurred due to the photocatalytic degradation.
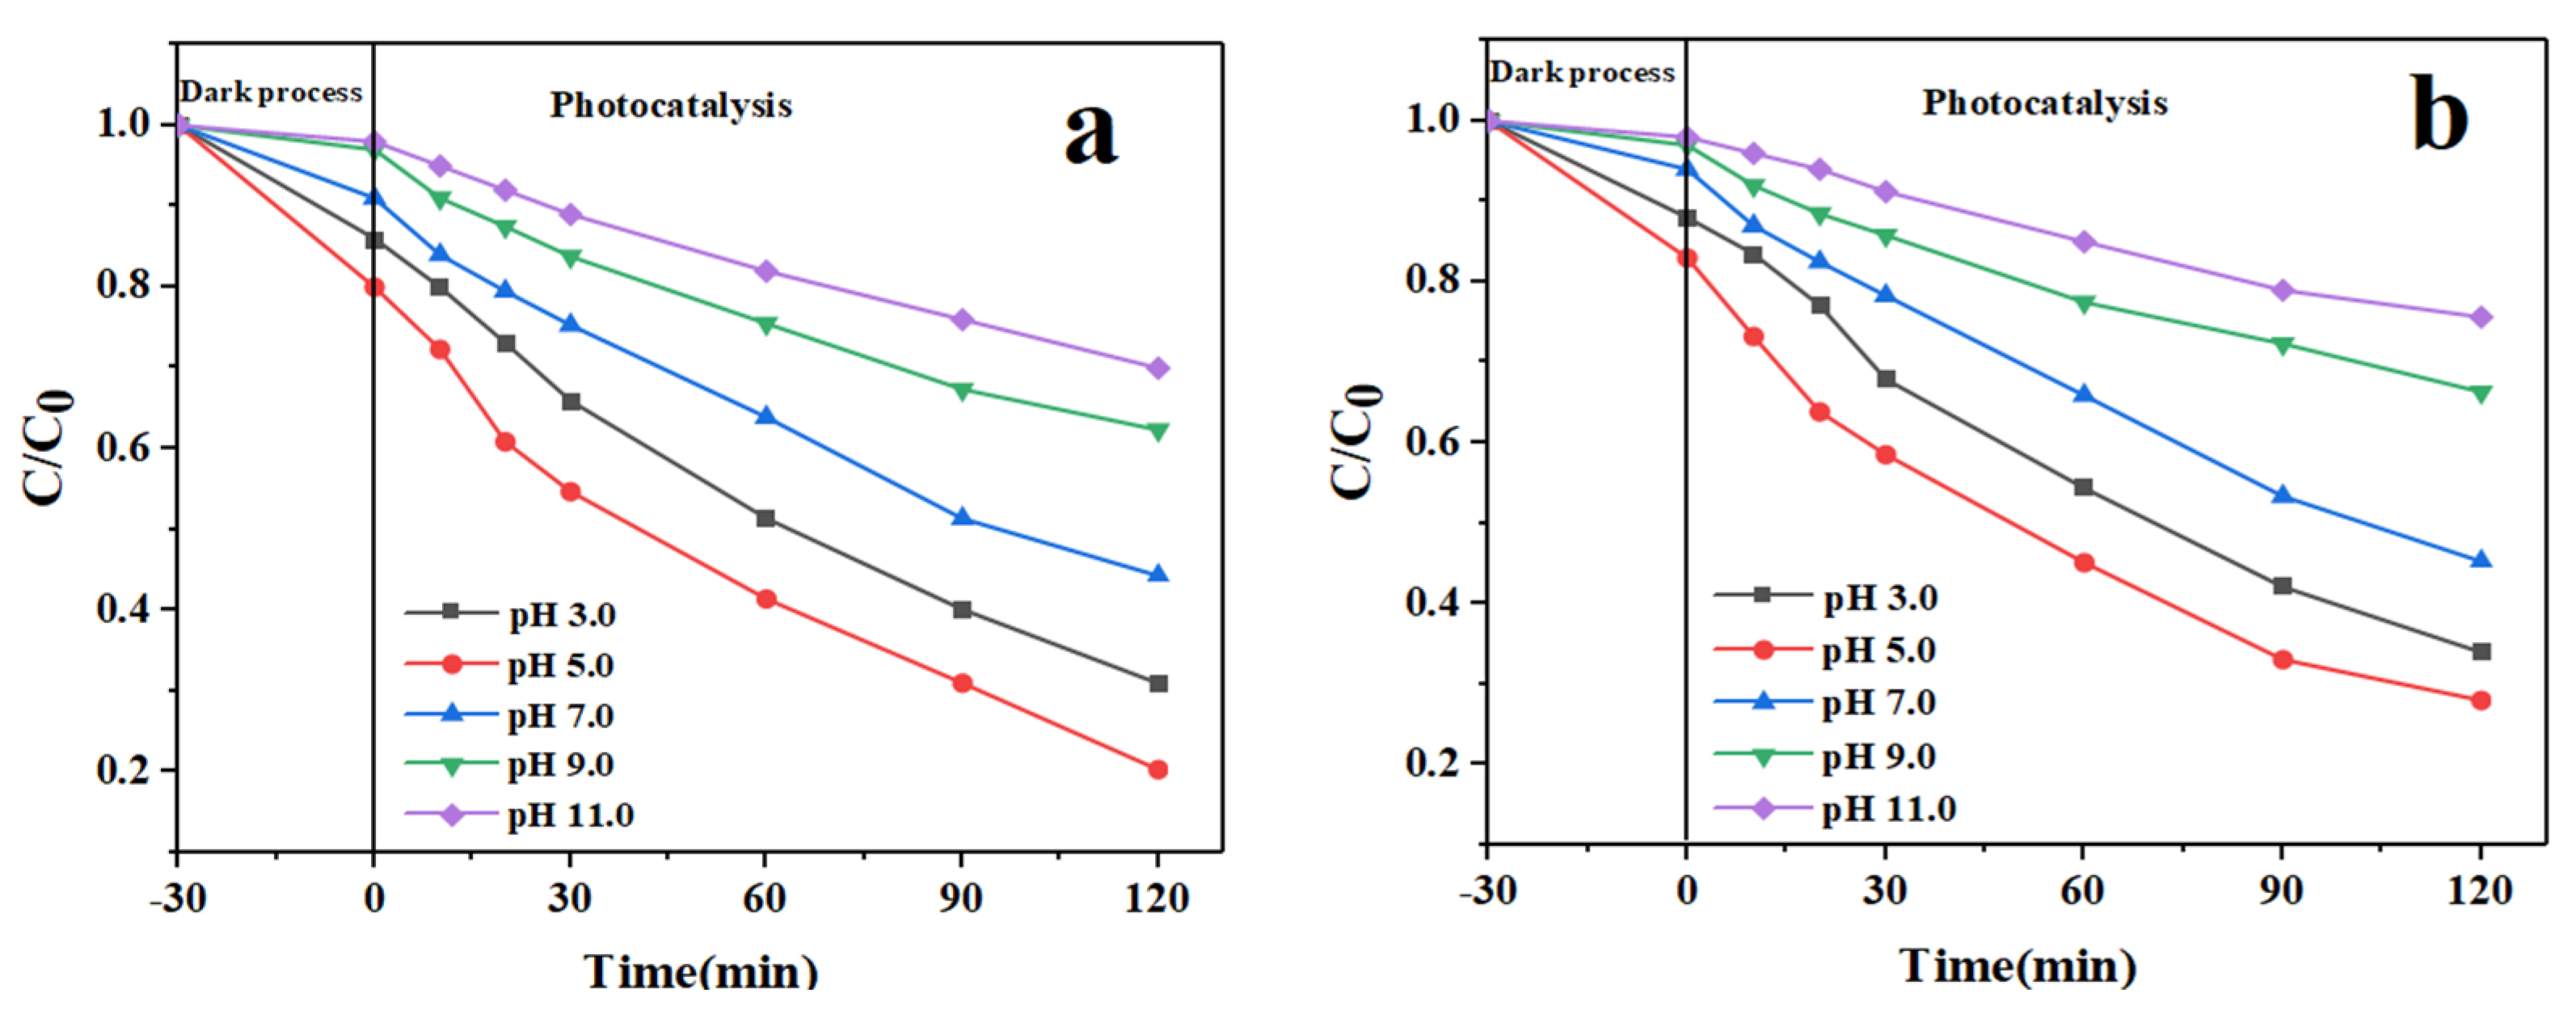
pH is one of the parameters that actively affects photocatalytic activities. The effects of pH on the removal of pollutants related to the pH of the solution and the functional groups are present in the nanocomposite, which affects its surface charge [28]. The effect of pH has been investigated using an initial drug concentration of 10 mg/L and a catalyst dose of 0.05 g/L. In this study, the highest removal was obtained at pH 5 with 90.41 and 88.63 for IMA (Figure 9a) and FU-5 (Figure 9b), respectively. As can be seen in the figures, the removal efficiency increases as the pH of the solution decreases. At higher pH, the efficiency rapidly decreases. The pH of the solution is one of the important factors in the adsorbent surface and ionization of pollutants [29]. The reason for the photocatalytic degradation of IMA and FU-5 drugs in acidic pH is due to the instability of the drug with the presence of In2O3/NiO/MoS2 nanoparticles at pH and the presence of H+ on the nanoparticle, which leads to better reduction of the pollutant. The drugs IMA and FU-5 remain in the protonated form under acidic conditions; however, as the pH increases, the deionized and anionic forms of these drugs predominate. Therefore, the efficiency increases in acidic conditions due to the electrostatic attraction between the negatively charged functional groups in the anionic dye and the positively charged In2O3/NiO/MoS2 surface.
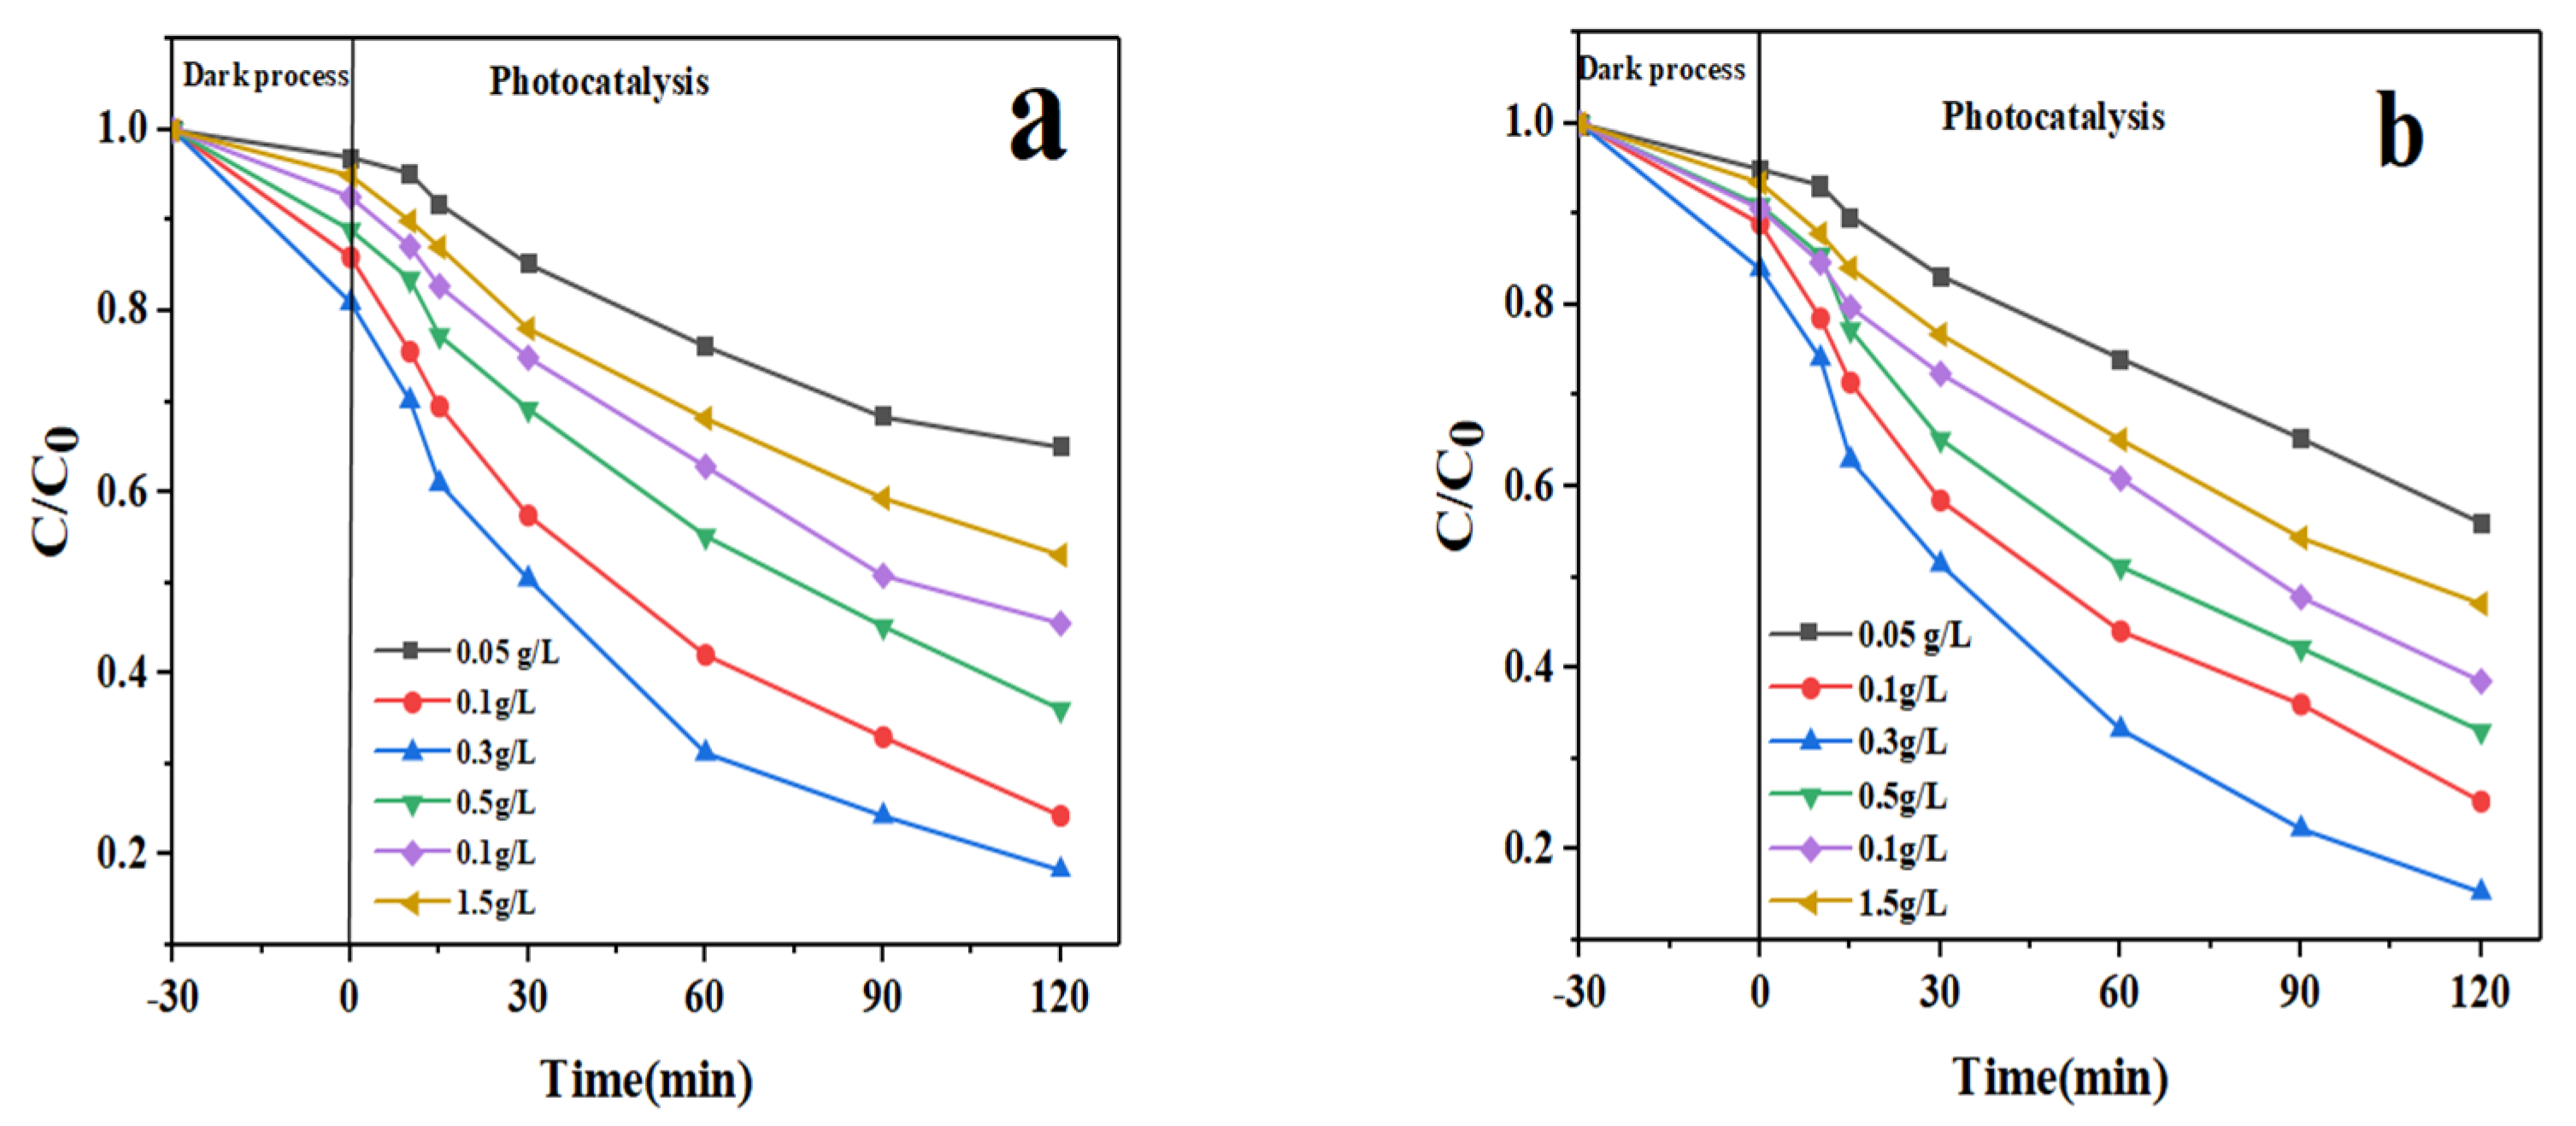
To investigate the effect of photocatalytic nanoparticles on the removal of pharmaceutical contaminants, other parameters, such as initial pH, the initial concentration of IMA, and FU-5 drugs kept constant at 10 mg/L and pH 5, respectively, and the content of the catalyst varied in the range of 0.05–1.5 g/L. As shown in Figure 10. The results showed that the maximum drug removal for IMA (Figure 10a) and FU-5 (Figure 10b) drugs was 88.55% and 90.04%, respectively. As can be seen, with the increase in photocatalysts, the removal rate increased to the optimum level, and the removal efficiency did not change with a further increase. Increasing the amount of catalyst increases the degradation efficiency due to the increase in the photocatalytic absorber surface and more access to absorption sites. With the increasing photocatalytic active level, the drug removal rate also increases. With increasing catalyst concentration, the turbidity of the solution increases. Therefore, with the enhancement of turbidity and the scattering of light, the light-path length of the photon is shortened. As a result, photons cannot penetrate the suspension. Therefore, it prevents the activation of the entire surface of the photocatalyst, which ultimately leads to the production of active radicals and, as a result, reduces the efficiency of photodegradation [30].
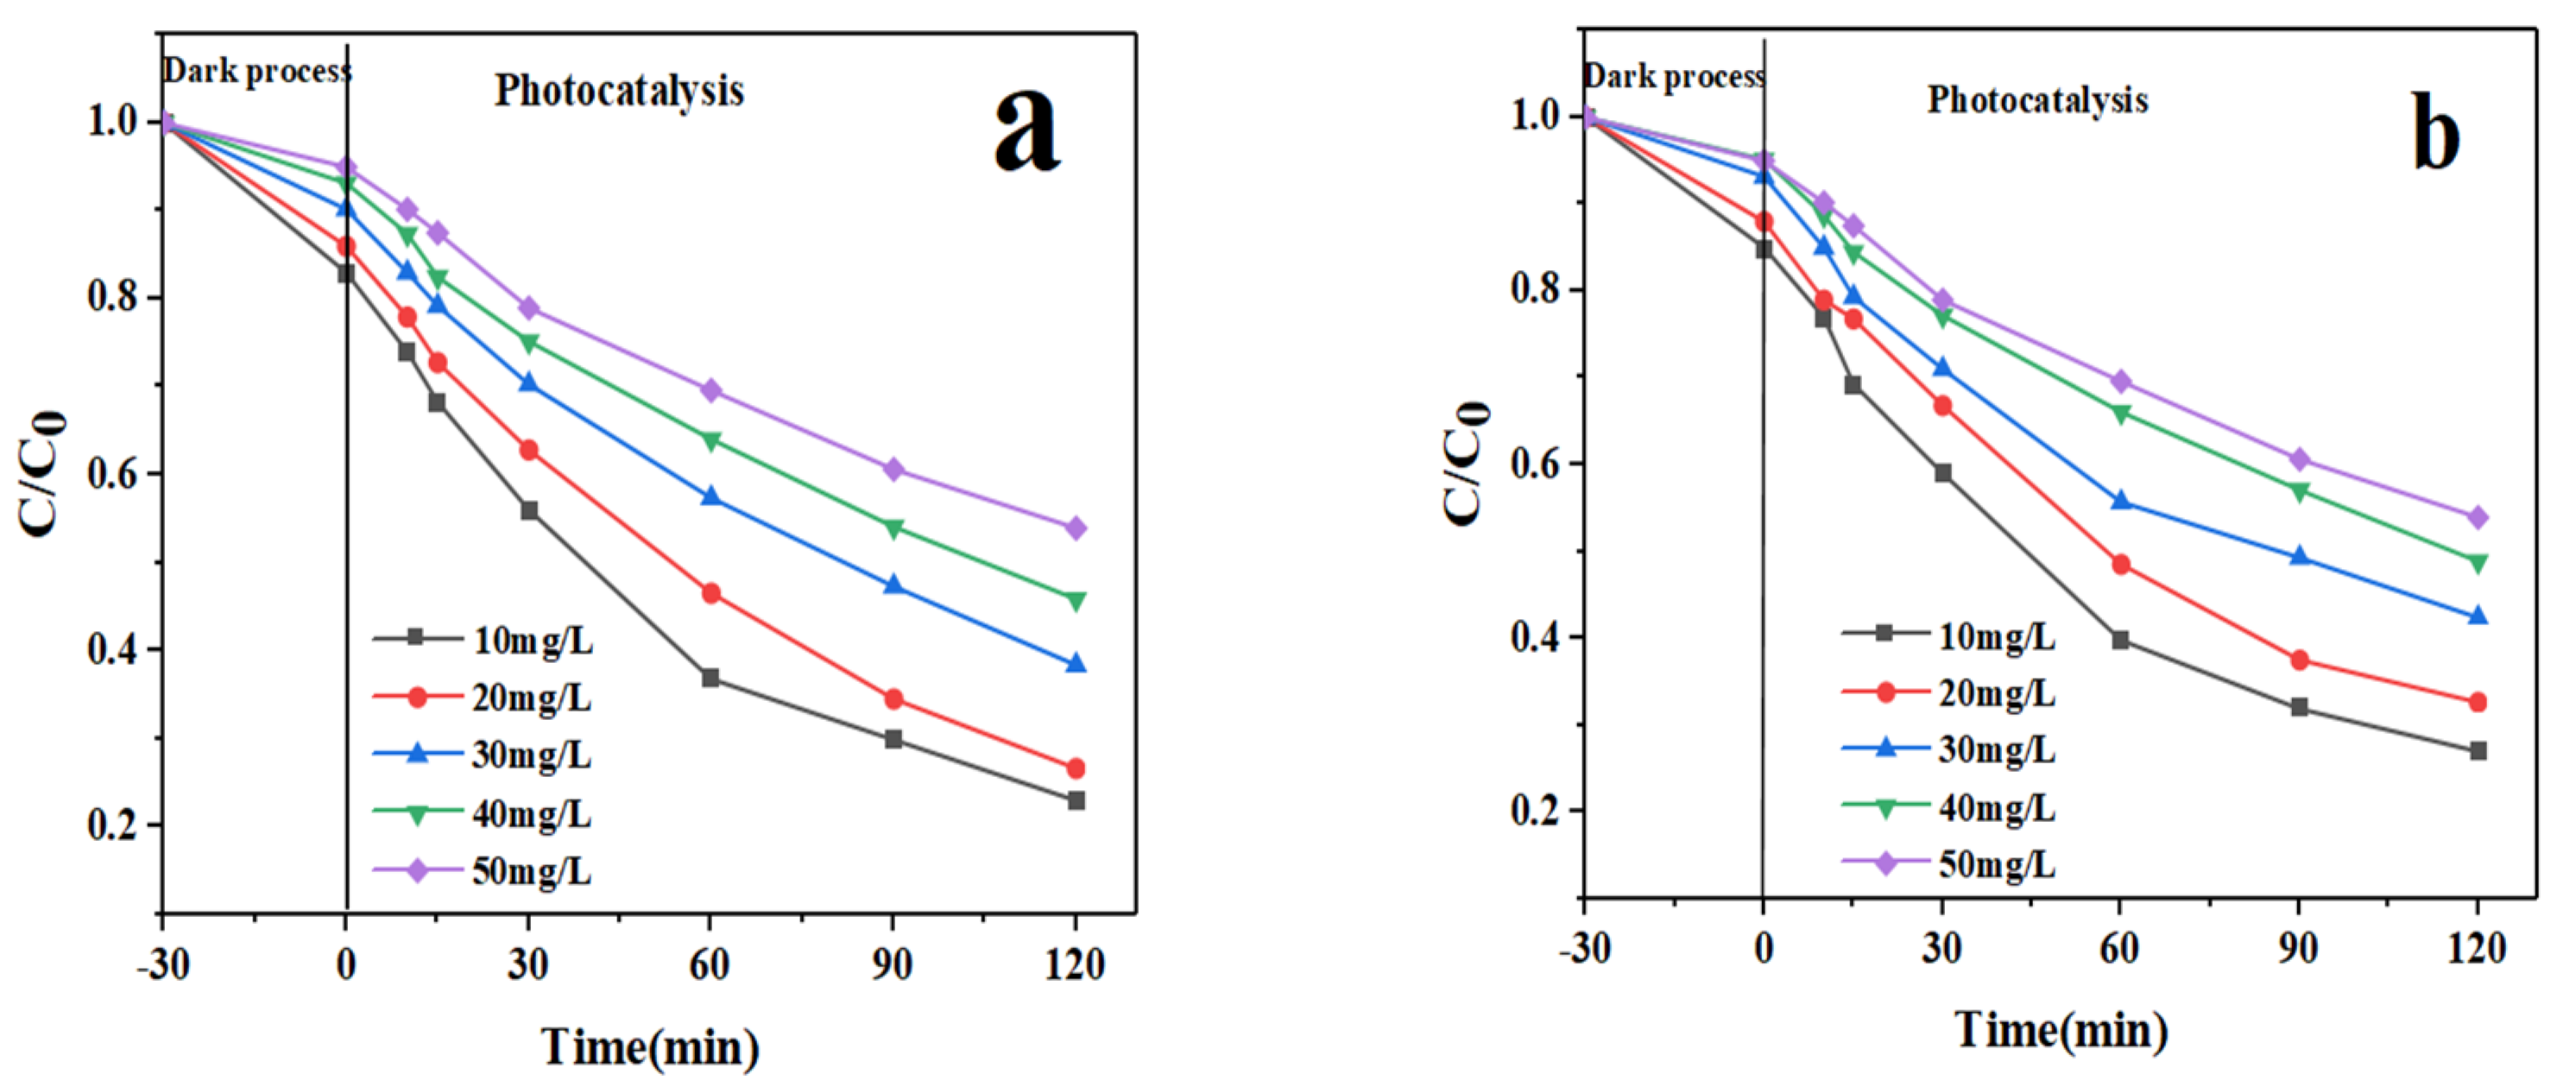
This indicates that there is a high correlation between the rate of photocatalytic degradation and the initial concentration of the pollutant. For this purpose, the optimum pH value is fixed at 5 and the amount of catalyst is 0.3 g/L. Photolysis was performed using an initial drug concentration of 10–50 mg/L and an optimal dose of In2O3/NiO/MoS2 catalyst. As can be seen in Figure 11, the photocatalytic degradation of the drugs first increased with the initial concentration of drugs, reached the highest level at 10 mg/L, and then decreased. The effect of the amount of drug removed from the solution is related to the concentration of the initial drug contaminant and the number of active sites on the surface of the photocatalytic absorber. As can be observed, the removal efficiency declined with the rise in the initial concentration of the drug for this purpose; by increasing the amount of photocatalyst, the number of free sites for pollutant adsorption increased until the molecules of active adsorption sites completely occupied the catalyst surface. When the photocatalyst rate is constant, drug concentration increases lead to the formation of intermediaries. Drugs and intermediaries are decomposed onto the photocatalyst surface, and the competition created reduces the degradation of the original composition. Despite the intermediate generation at lower drug concentrations, an adequate photocatalyst surface is provided for degradation. Furthermore, with increasing contaminant concentrations, more molecules are positioned on the catalyst surface. The reduced degradation can be attributed to low-photon absorption by the photocatalyst and an increasing rate of NPX molecules, which inhibits the generation of OH radicals and reduces the degradation performance [3,31]. Another reason for the decrease in efficiency at higher concentrations is that, as the concentration of the drug increases, the power of photons to penetrate the solution decreases. Which leads to a decrease in the efficiency of photolysis. Reducing the removal efficiency at a concentration higher than the optimal value, an additional amount of photocatalysts is required, which, in this case, leads to an increase in the turbidity of the solution. In addition, with the increase in drug concentration, more active sites on the photocatalyst surface are occupied by drug species, which finally remove the surface, adsorbed hydroxide ions, and oxygen molecules from the active sites. Therefore, the generation of active radicals by the photocatalyst fails, which leads to a reduction in the photodegradation efficiency [32].

3.3. Photocatalyst Reusability

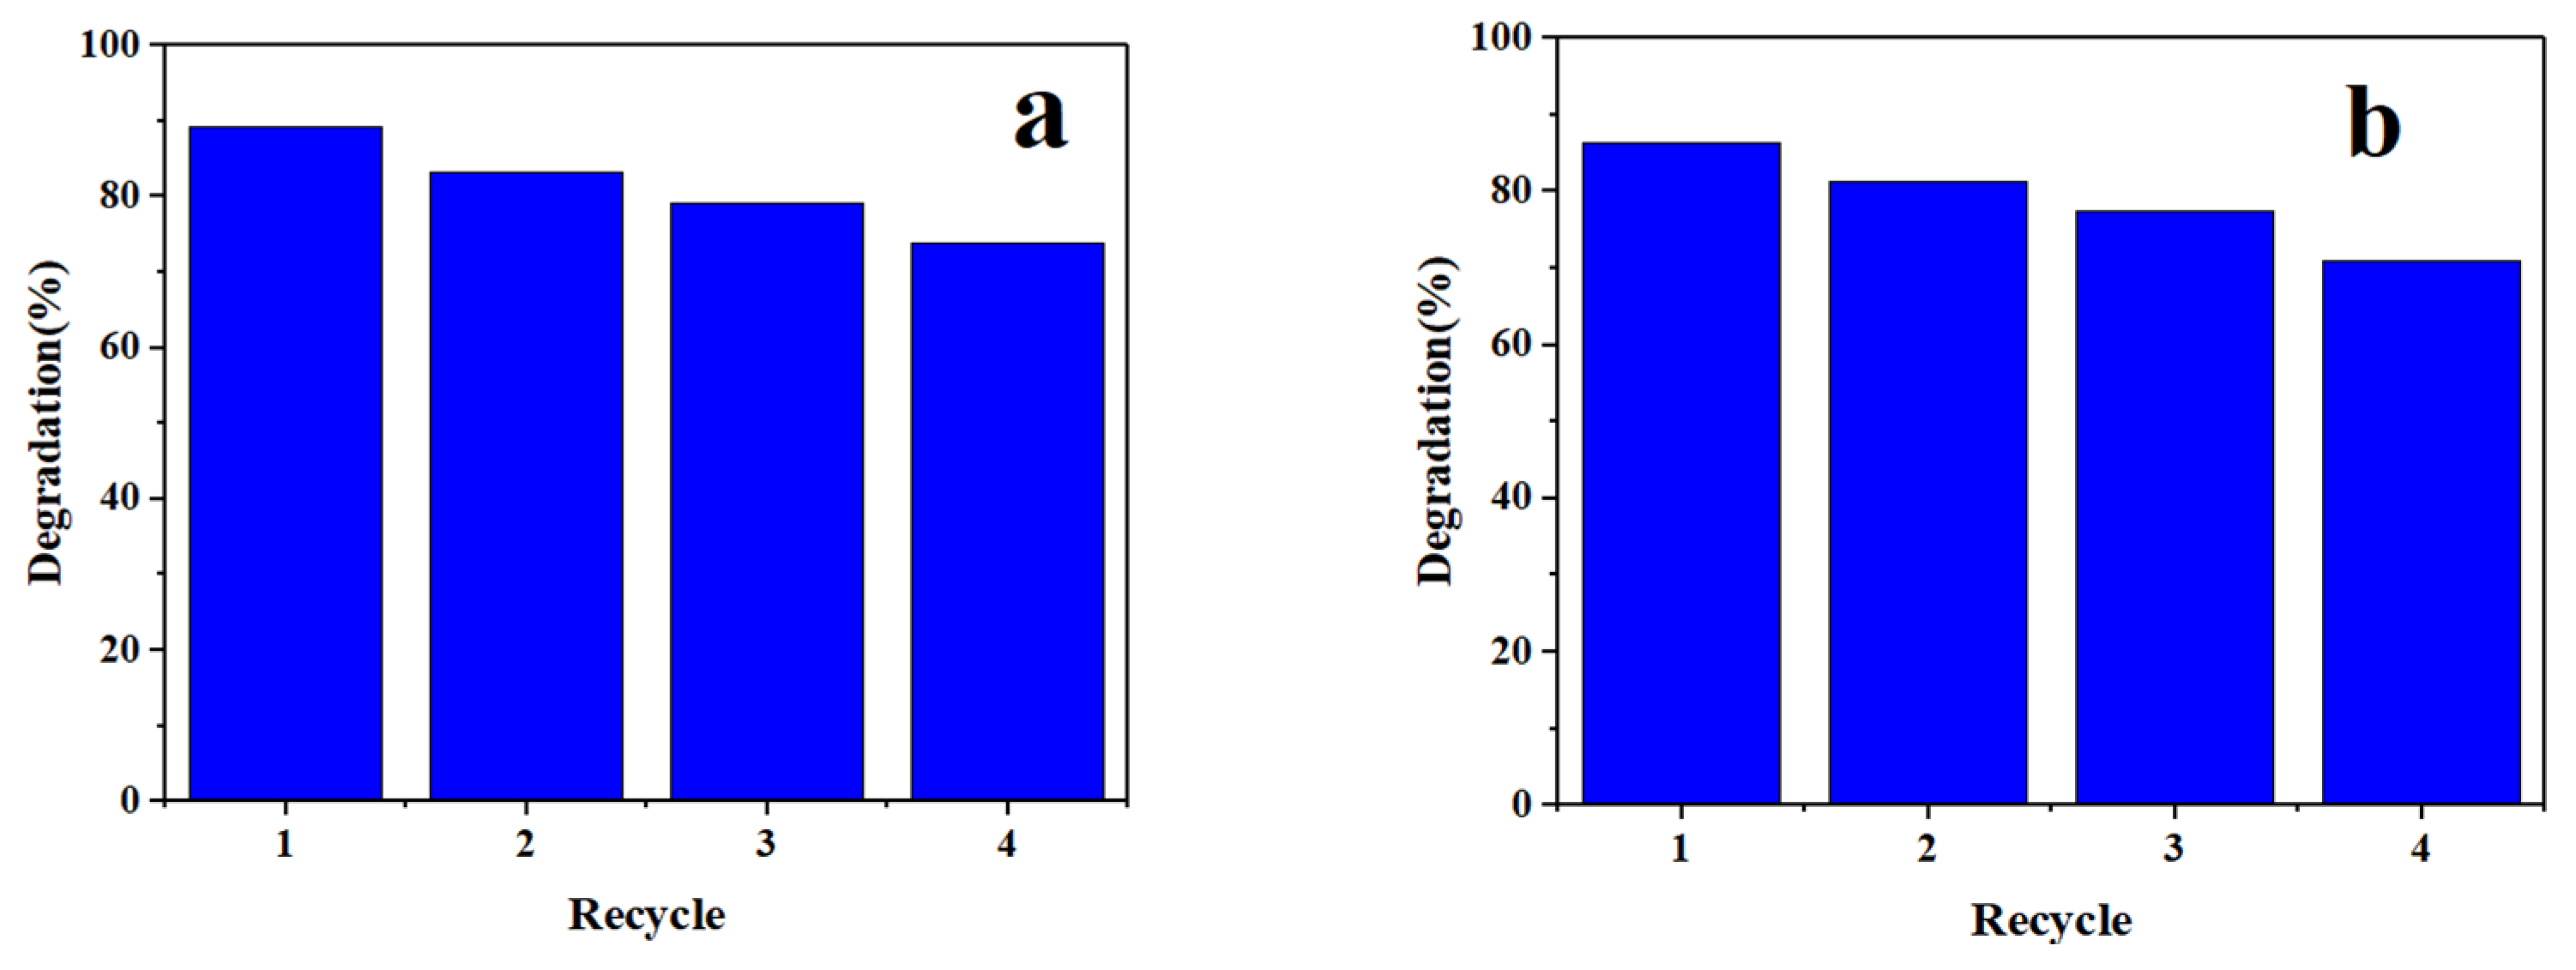
In order to consider the practical application, proper evaluation of the stability, lifetime, and efficiency of a reusable photocatalyst synthesized in this research was carried out under visible light irradiation. Therefore, after the complete photocatalytic process of the degradation of pharmaceutical pollutants, the photocatalyst obtained from the isolated solution was washed with deionized water and then dried in a porch at 70 °C to test its reusability. As shown in Figure 12, the photocatalytic degradation rate of IMA (Figure 12a) and FU-5 (Figure 12b) drugs exceeded 70% after four consecutive cycles using optimal conditions. The slight decrease in the degradation efficiency obtained by the photocatalyst in this period can be attributed to the high stability of the photocatalytic nanoparticles. In addition, by using a centrifuge, this catalyst can be easily separated from the environment for reuse, which is very important in practical applications, such as industrial wastewater treatment.

3.4. Kinetic of Photocatalytic Degradation

Kinetic of the photocatalytic degradation of drugs study using pseudo-first order kinetics (Equation (2)):
l n C 0 C t = k t
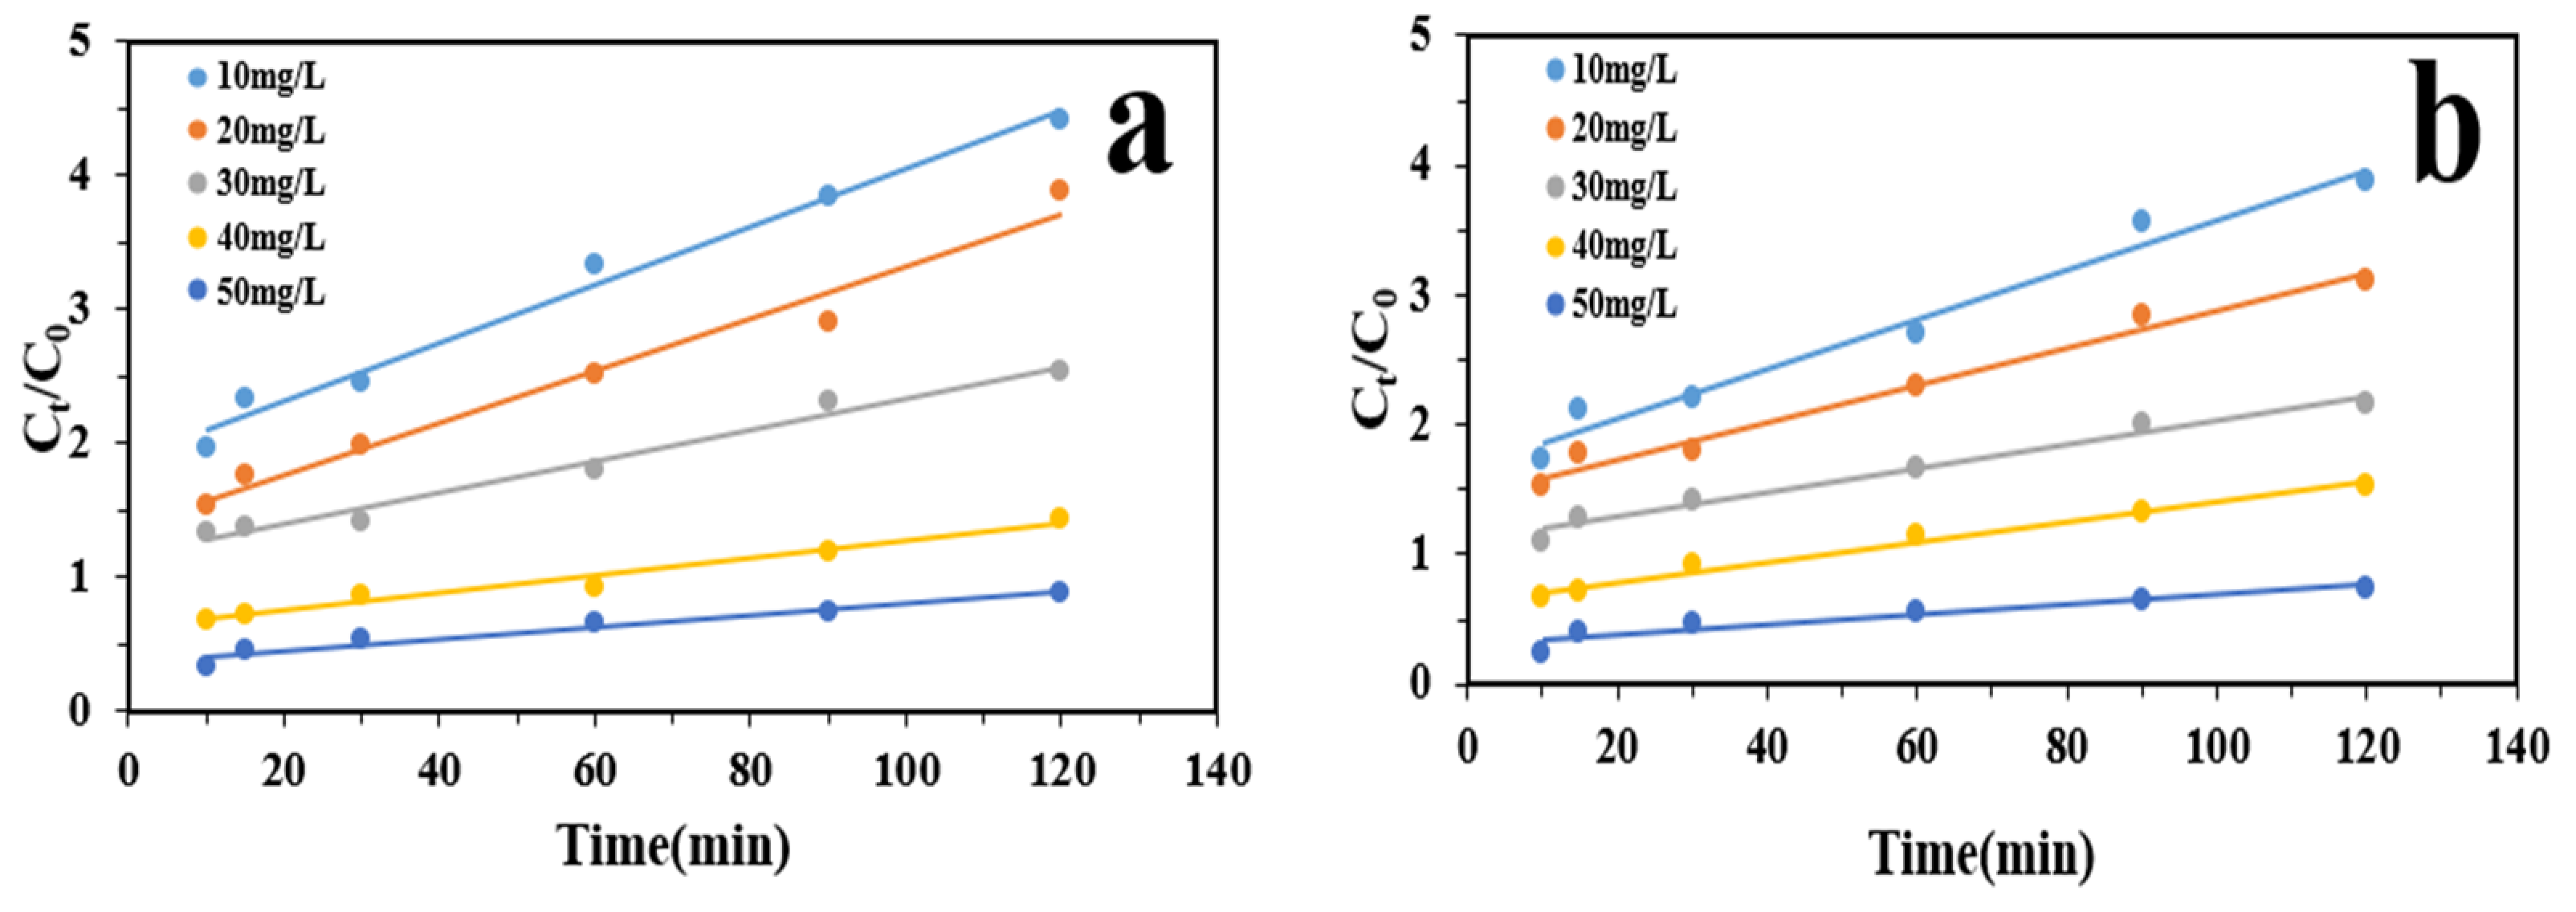
where (k) is the reaction rate constant, (Ct) and (C0) are the concentration of the pollutant (mg/L) after the exposure time (min) and the initial concentration of the pollutant (mg/L), respectively. In this research, the photocatalytic degradation kinetics of IMA (Figure 13a) and FU-5 (Figure 13b) drugs were performed under optimal operating conditions (pH = 5, drug concentration 10 mg/L, nanocomposite dose 0.3 g/L). The calculated results of the pseudo-first kinetics are shown in Table 1, and the pseudo-first-order degradation curves are shown in Figure 13. The plot of ln (C0/Ct) shows a linear relationship with irradiation time, where the slope is equal to the constant velocity (k = 0.0274) and R2 = 0.8972. The results show that pseudo-first kinetics is a suitable model to describe the rate of pharmaceutical photocatalytic reaction [33,34].

3.5. Photocatalytic Mechanism

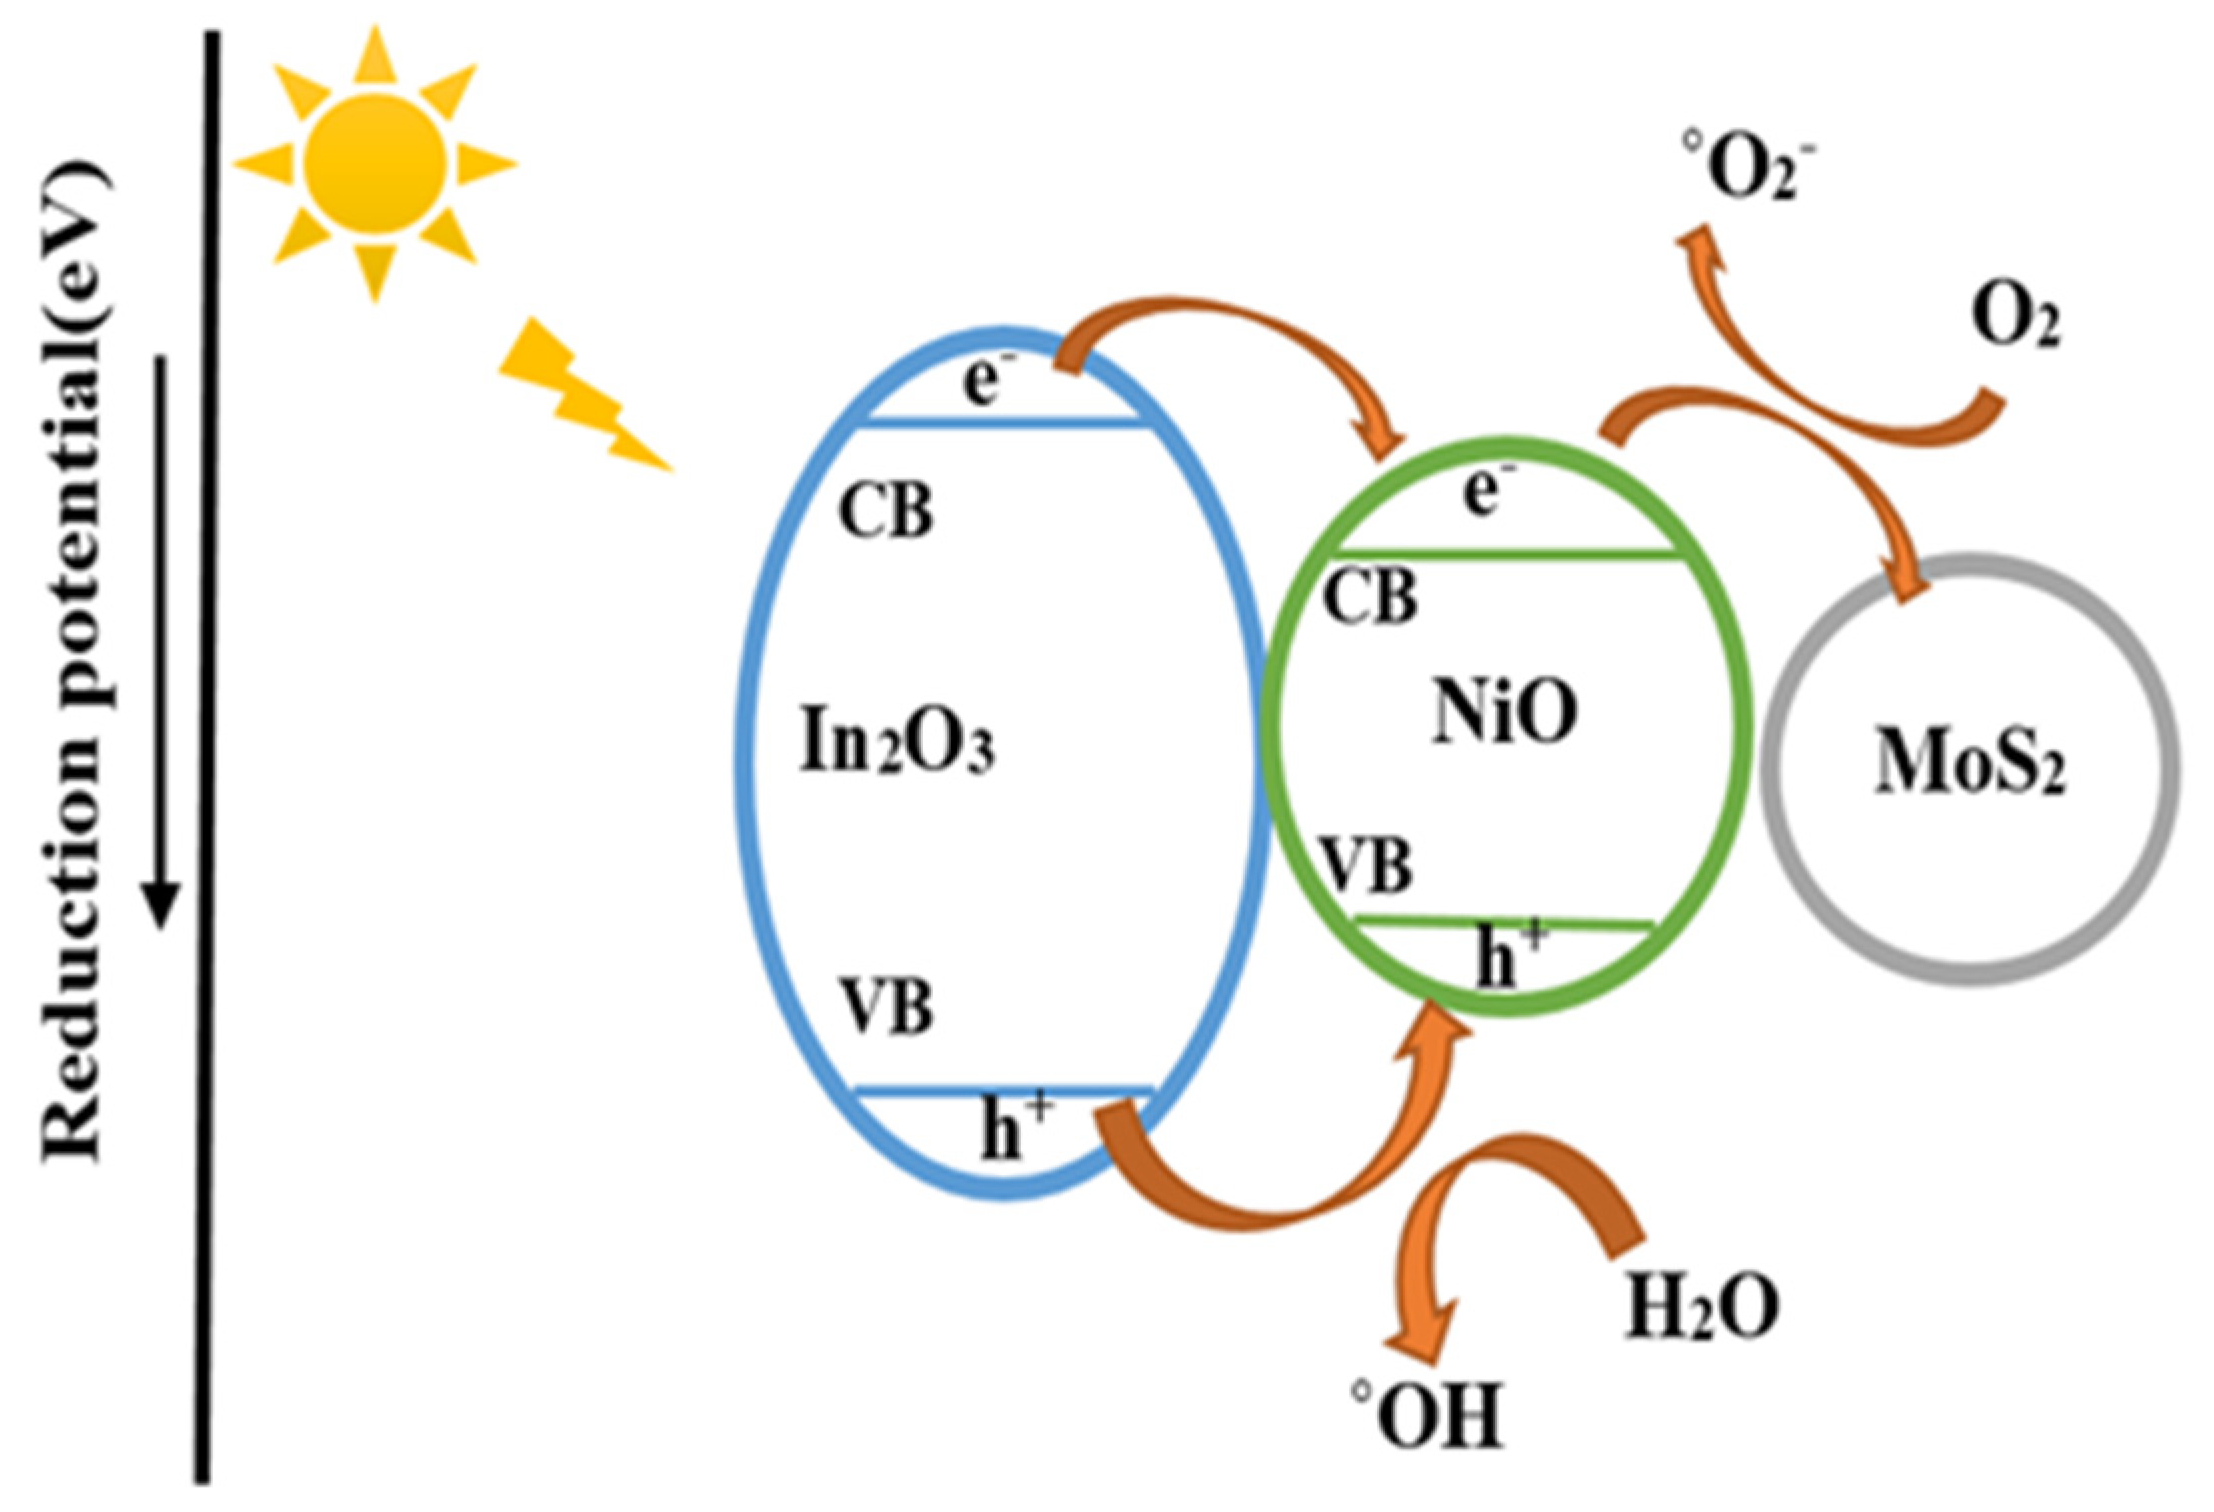
The photocatalytic mechanism that may be proposed for a better understanding of the photocatalytic reactions in the presence of In2O3/NiO/MoS2 under visible light irradiation. In the first step, the degradable products are quickly absorbed on the catalyst due to the high surface area and active adsorption sites in In2O3/NiO/MoS2. Meanwhile, the In2O3/NiO/MoS2 composites are photo-excitable and generate electron-hole pairs. Second, electrons directly produced by photo can be trapped with O2 and form ˚O2/˚OH. Therefore, it can react with oxygen molecules, and this reaction causes its transformation into superoxide radical. Likewise, photo-generated holes can directly react with the pollutant [3]. In addition, e- and h+ of hydrogen peroxide can react to produce additional hydroxyl radicals according to Equations (1)–(8). Consequently, reactive ˚OH/h+/˚O2 species have been used for the photodegradation of IMA and 5-FU drugs through a photocatalytic process (Figure 14).
Equations (3)–(10).
Catalyst Catalyst e + h +
H + + H 2 O HO ° + H +
H + + H O HO °
e + O 2 O 2 °
O 2 ° + H 2 O HO 2 ° + HO
2 HO 2 ° H 2 O 2 + O 2
e + H 2 O 2 HO + HO °
h + + H 2 O 2 2 HO °

4. Conclusions

The aim of this study was to evaluate the photocatalytic activity of In2O3/NiO/MoS2 nanoparticles for photocatalytic degradation under visible light of pharmaceutical pollutants IMA and 5-FU from aqueous solutions and the mutual effects exerted by effective process parameters, including pH. The catalyst dose’s initial pollutant concentration was checked. The experimental results clearly indicated the successful attachment of MoS2 and NiO nanoparticles onto In2O3 nanoparticles. The resulting nanocomposite demonstrated very good performance for water purification. Therefore, the highest degradation was obtained in time (60 min), pH (5), catalyst dose (0.3 g/L), and initial pollutant concentration (10 mg/L). The effect of pH was low in alkaline conditions, while the degradation effect of pollutants significantly reduced in acidic pH. Both cytostatic drugs alone and without catalyst had negligible removal in visible light direct photolysis, this fact indicated that the photodegradation of IMA and 5-FU drugs mainly occurred by photo-oxidation. In addition, the pseudo-first-order kinetic model fitted the experimental data well with the experimental kinetics. In addition, hydroxyl radicals (OH) and photo-holes (e-) showed strong abilities to degrade pharmaceutical pollutants under a visible light system. The reusability and stability results of the In2O3/NiO/MoS2 hybrid photocatalyst showed that this catalyst could be used in the photodegradation of pharmaceutical pollutants for up to four consecutive cycles of photocatalysis without significant reduction in their performance.

Author Contributions

N.K.: Writing-original draft preparation, Data curation; Software, Validation, Data curation; M.H.S.: Supervision, project administration, Methodology, Visualization, Conceptualization, Investigation and Editing, Reviewing and Editing. All authors have read and agreed to the published version of the manuscript.

Funding

This research received no external funding.

Data Availability Statement

The data that support the findings of this study are available upon request.

Acknowledgments

This article is taken from the master’s thesis. The authors would like to acknowledge and thank the officials of the Faculty of Natural Resources and Environmental Sciences of University of Birjand for providing the necessary facilities to carry out this study.

Conflicts of Interest

The authors declare no conflict of interest.

References

  1. Sayadi, M.; Trivedy, R.K.; Pathak, R.K. Pollution of pharmaceuticals in environment. J. Ind. Pollut. Control. 2010, 26, 89–94. [Google Scholar]
  2. Gworek, B.; Kijeńska, M.; Wrzosek, J.; Graniewska, M. Pharmaceuticals in the soil and plant environment: A review. Water Air Soil Pollut. 2021, 232, 145. [Google Scholar] [CrossRef]
  3. Ahmadpour, N.; Sayadi, M.H.; Sobhani, S.; Hajiani, M. A potential natural solar light active photocatalyst using magnetic ZnFe2O4@TiO2/Cu nanocomposite as a high performance and recyclable platform for degradation of naproxen from aqueous solution. J. Clean. Prod. 2020, 268, 122023. [Google Scholar] [CrossRef]
  4. Santana-Viera, S.; Hernández-Arencibia, P.; Sosa-Ferrera, Z.; Santana-Rodríguez, J.J. Simultaneous and systematic analysis of cytostatic drugs in wastewater samples by ultra-high performance liquid chromatography tandem mass spectrometry. J. Chromatogr. B 2019, 1110, 124–132. [Google Scholar] [CrossRef]
  5. Straub, J.O. Combined environmental risk assessment for 5-fluorouracil and capecitabine in Europe. Integr. Environ. Asses. Manag. 2010, 6, 540–566. [Google Scholar] [CrossRef]
  6. Booker, V.; Halsall, C.; Llewellyn, N.; Johnson, A.; Williams, R. Prioritising anticancer drugs for environmental monitoring and risk assessment purposes. Sci. Total Environ. 2014, 473, 159–170. [Google Scholar] [CrossRef]
  7. Santos, M.S.; Franquet-Griell, H.; Lacorte, S.; Madeira, L.M.; Alves, A. Anticancer drugs in Portuguese surface waters–estimation of concentrations and identification of potentially priority drugs. Chemosphere 2017, 184, 1250–1260. [Google Scholar] [CrossRef]
  8. Besse, J.P.; Latour, J.F.; Garric, J. Anticancer drugs in surface waters: What can we say about the occurrence and environmental significance of cytotoxic, cytostatic and endocrine therapy drugs? Environ. Int. 2012, 39, 73–86. [Google Scholar] [CrossRef]
  9. Sun, X.; Shi, Y.; Lu, J.; Shi, W.; Guo, F. Template-free self-assembly of three-dimensional porous graphitic carbon nitride nanovesicles with size-dependent photocatalytic activity for hydrogen evolution. Appl. Surf. Sci. 2022, 606, 154841. [Google Scholar] [CrossRef]
  10. Sayadi, M.H.; Ahmadpour, N.; Homaeigohar, S. Photocatalytic and Antibacterial Properties of Ag-CuFe2O4@ WO3 Magnetic Nanocomposite. Nanomaterials 2021, 11, 298. [Google Scholar] [CrossRef]
  11. Xuemei, H.; Yukun, S.; Bo, B. Fabrication of cubic pn heterojunction-like NiO/In2O3 composite microparticles and their enhanced gas sensing characteristics. J. Nanomater. 2016, 2016, 7589028. [Google Scholar] [CrossRef]
  12. Wang, Y.; Zhang, F.; Wei, L.; Li, G.; Zhang, W. Facet-dependent photocatalytic performance of NiO oriented thin films prepared by pulsed laser deposition. Phys. B Condens. Matter. 2015, 457, 194–197. [Google Scholar] [CrossRef]
  13. Lin, Z.; Du, C.; Yan, B.; Wang, C.; Yang, G. Two-dimensional amorphous NiO as a plasmonic photocatalyst for solar H2 evolution. Nat. Commun. 2018, 9, 4036. [Google Scholar] [CrossRef]
  14. Sharma, A.K.; Kaur, B. Simulation and analysis of 2D material (MoS2/MoSe2) based plasmonic sensor for measurement of organic compounds in infrared. Optik 2018, 157, 161–169. [Google Scholar] [CrossRef]
  15. Ali, S.A.; Ahmad, T. Enhanced hydrogen generation via overall water splitting using novel MoS2-BN nanoflowers assembled TiO2 ternary heterostructures. Int. J. Hydrog. Energy 2023, 48, 22044–22059. [Google Scholar] [CrossRef]
  16. Kumar, A.; Choudhary, P.; Kumar, A.; Camargo, P.H.; Krishnan, V. Recent advances in plasmonic photocatalysis based on TiO2 and noble metal nanoparticles for energy conversion, environmental remediation, and organic synthesis. Small 2022, 18, 2101638. [Google Scholar] [CrossRef] [PubMed]
  17. Zheng, L.; Zhang, R.; Chang, F.; Liu, M.; Deng, J.; Hu, J.; He, J.; Feng, D.; Gao, J.; Chen, C.; et al. Ultrathin 1T/2H mixed phase MoS2 decorated TiO2 nanorod arrays for effective photocatalytic hydrogen evolution. CrystEngComm. 2021, 23, 3710–3716. [Google Scholar] [CrossRef]
  18. Amarnath, M.; Gurunathan, K. Highly selective CO2 gas sensor using stabilized NiO-In2O3 nanospheres coated reduced graphene oxide sensing electrodes at room temperature. J. Alloys Compd. 2021, 857, 157584. [Google Scholar] [CrossRef]
  19. Ikram, M.; Liu, Y.; Lv, H.; Liu, L.; Rehman, A.U.; Kan, K.; Shi, K. 3D-multilayer MoS2 nanosheets vertically grown on highly mesoporous cubic In2O3 for high-performance gas sensing at room temperature. Appl. Surf. Sci. 2019, 466, 1–11. [Google Scholar] [CrossRef]
  20. Raha, S.; Ahmaruzzaman, M. Novel magnetically retrievable In2O3/MoS2/Fe3O4 nanocomposite materials for enhanced photocatalytic performance. Sci. Rep. 2021, 11, 6379. [Google Scholar] [CrossRef]
  21. Jabeen, S.; Iqbal, J.; Arshad, A.; Williams, J.; Samarin, S.; Rani, M. Heterojunction formation in In2O3–NiO nanocomposites: Towards high specific capacitance. J. Alloys Compd. 2020, 842, 155840. [Google Scholar] [CrossRef]
  22. Mu, D.; Chen, Z.; Shi, H.; Tan, N. Construction of flower-like MoS2/Fe3O4/rGO composite with enhanced photo-Fenton like catalyst performance. RSC Adv. 2018, 8, 36625–36631. [Google Scholar] [CrossRef] [PubMed]
  23. Pua, F.L.; Chia, C.H.; Zakari, S.; Liew, T.K.; Yarmo, M.A.; Huang, N.M. Preparation of transition metal sulfide nanoparticles via hydrothermal route. Sains Malays. 2010, 39, 243–248. [Google Scholar]
  24. Ikram, M.; Raza, A.; Ahmad, S.O.A.; Ashfaq, A.; Akbar, M.U.; Imran, M.; Maqbool, M. Solar-Triggered Engineered 2D-Materials for Environmental Remediation: Status and Future Insights. Adv. Mater. Interfaces 2023, 10, 2202172. [Google Scholar] [CrossRef]
  25. Yu, X.Y.; Hu, H.; Wang, Y.; Chen, H.; Lou, X.W. Ultrathin MoS2 nanosheets supported on N-doped carbon nanoboxes with enhanced lithium storage and electrocatalytic properties. Angew. Chem. 2015, 127, 7503–7506. [Google Scholar] [CrossRef]
  26. Jo, W.K.; Selvam, N.C.S. Fabrication of photostable ternary CdS/MoS2/MWCNTs hybrid photocatalysts with enhanced H2 generation activity. Appl. Catal. A Gen. 2016, 525, 9–22. [Google Scholar] [CrossRef]
  27. Santos, R.K.; Martins, T.A.; Silva, G.N.; Conceição, M.V.; Nogueira, I.C.; Longo, E.; Botelho, G. Ag3PO4/NiO composites with enhanced photocatalytic activity under visible light. ACS Omega 2020, 5, 21651–21661. [Google Scholar] [CrossRef]
  28. El-Khawaga, A.M.; Tantawy, H.; Elsayed, M.A.; Abd El-Mageed, A.I. Synthesis and applicability of reduced graphene oxide/porphyrin nanocomposite as photocatalyst for waste water treatment and medical applications. Sci. Rep. 2022, 12, 17075. [Google Scholar] [CrossRef]
  29. Wang, J.C.; Jia, Z.; Liang, S.X.; Qin, P.; Zhang, W.C.; Wang, W.M.; Sercombbe, T.B.; Zhang, L.C. Fe73.5Si13.5B9Cu1Nb3 metallic glass: Rapid activation of peroxymonosulfate towards ultrafast Eosin Y degradation. Mater. Des. 2018, 140, 73–84. [Google Scholar] [CrossRef]
  30. Aguirre, A.R.; Reina, A.C.; Pérez, J.P.; Colon, G.; Malato, S. Catalysts and Photoreactors for Photocatalytic Solar Hydrogen Production: Fundamentals and Recent Developments at Pilot Scale. Photocatalytic Hydrog. Prod. Sustain. Energy 2023, 275–303. [Google Scholar]
  31. Kargar, F.; Bemani, A.; Sayadi, M.H.; Ahmadpour, N. Synthesis of modified beta bismuth oxide by titanium oxide and highly efficient solar photocatalytic properties on hydroxychloroquine degradation and pathways. J. Photochem. Photobiol. A Chem. 2021, 419, 113453. [Google Scholar] [CrossRef] [PubMed]
  32. Sayadi, M.H.; Ghollasimood, S.; Ahmadpour, N.; Homaeigohar, S. Biosynthesis of the ZnO/SnO2 nanoparticles and characterization of their photocatalytic potential for removal of organic water pollutants. J. Photochem. Photobiol. A Chem. 2022, 425, 113662. [Google Scholar] [CrossRef]
  33. Tolić Čop, K.; Mutavdžić Pavlović, D.; Gazivoda Kraljević, T. Photocatalytic activity of TiO2 for the degradation of anticancer drugs. Nanomaterials 2022, 12, 3532. [Google Scholar] [CrossRef] [PubMed]
  34. Sayadi, M.H.; Homaeigohar, S.; Rezaei, A.; Shekari, H. Bi/SnO2/TiO2-graphene nanocomposite photocatalyst for solar visible light–induced photodegradation of pentachlorophenol. Environ. Sci. Pollut. Res. 2021, 28, 15236–15247. [Google Scholar] [CrossRef] [PubMed]
Figure 1. XRD patterns of nanoparticles. (* peaks for MoS2; ⬪ peaks for NiO; Water 15 03263 i001 peaks for In2O3).
Water 15 03263 g001
Figure 2. SEM images of (a) In2O3, (b) In2O3/NiO, (c) In2O3/NiO/MoS2, and (d) EDS spectrum of In2O3/NiO/MoS2.
Water 15 03263 g002
Figure 3. Particle size distribution of In2O3/NiO/MoS2.
Water 15 03263 g003
Figure 4. FT-IR spectrum of In2O3/NiO/MoS2 nanoparticles.
Water 15 03263 g004
Figure 5. UV-vis spectrum of nanoparticles.
Water 15 03263 g005
Figure 6. (a) Pore size distribution plots of N2 adsorption-desorption isotherm and (b) BJH of In2O3, In2O3/NiO, and In2O3/NiO/MoS2 nanocomposites.
Water 15 03263 g006
Figure 7. TGA curves of samples.
Water 15 03263 g007
Figure 8. Photocatalytic degradation of drugs using In2O3, In2O3/NiO, and In2O3/NiO/MoS2 nanoparticles ((a) for IMA and (b) for FU-5).
Water 15 03263 g008
Figure 9. The effect of pH on the photocatalytic degradation of the drug, (a) for IMA and (b) for FU-5.
Water 15 03263 g009
Figure 10. Effects of nanoparticles on the photocatalytic degradation of drugs; (a) for IMA and (b) for FU-5.
Water 15 03263 g010
Figure 11. Effects of the initial pollutant concentration on the photocatalytic degradation of the drug (a): IMA and (b): FU-5.
Water 15 03263 g011
Figure 12. Photocatalyst reusability ((a) for IMA and (b) for FU-5).
Water 15 03263 g012
Figure 13. Effect of photocatalytic degradation kinetics ((a) for IMA and (b) for FU-5).
Water 15 03263 g013
Figure 14. Mechanism of photocatalytic degradation of the drugs.
Water 15 03263 g014
Table 1. Kinetic parameters of photocatalytic degradation.
Con. IMA (mg/L)R2K (min−1)Equation
100.98580.0217Y = 0.0217x + 1.8863
200.97640.0195Y = 0.0195x + 1.3779
300.97720.0118Y = 0.0118x + 1.1633
400.9730.0065Y = 0.0065x + 0.62
500.96580.0045Y = 0.0045x + 0.3585
Con. FU-5 (mg/L)R2K (min−1)Equation
100.97340.0192Y = 0.0192x + 1.66
200.98190.0143Y = 0.0143x + 1.4476
300.98110.0093Y = 0.0093x + 1.1024
400.98330.0077Y = 0.0077x + 0.6302
500.91790.0039Y = 0.0039x + 0.292
Disclaimer/Publisher’s Note: The statements, opinions and data contained in all publications are solely those of the individual author(s) and contributor(s) and not of MDPI and/or the editor(s). MDPI and/or the editor(s) disclaim responsibility for any injury to people or property resulting from any ideas, methods, instructions or products referred to in the content.