
In2O3/NIO/MOS2 Composite as a Novel Photocatalytic towards Imatinib and 5-Fluorouracil Degradation


Abstract
:1. Introduction
2. Materials and Methods
2.1. Synthesis Step of Hybrid Photocatalyst
2.1.1. Materials
2.1.2. Synthesis of MoS2 Nanoparticles
2.1.3. Synthesis of Nanoparticles In2O3/NiO
2.1.4. Synthesis of In2O3/NiO/MoS2
2.2. Characterization of Synthesized Nanoparticles
2.3. Assessment of Photocatalytic Performance
- R = Degradation efficiency (%)
- C0 = Initial concentrations of the drug in the solution (mg/L)
- Ce = The final concentration of the drug in the solution after the decomposition process (mg/L).
3. Results and Discussion
3.1. Characterization of Synthesized In2O3/NiO/MoS2 Nanoparticles
3.1.1. XRD Studies
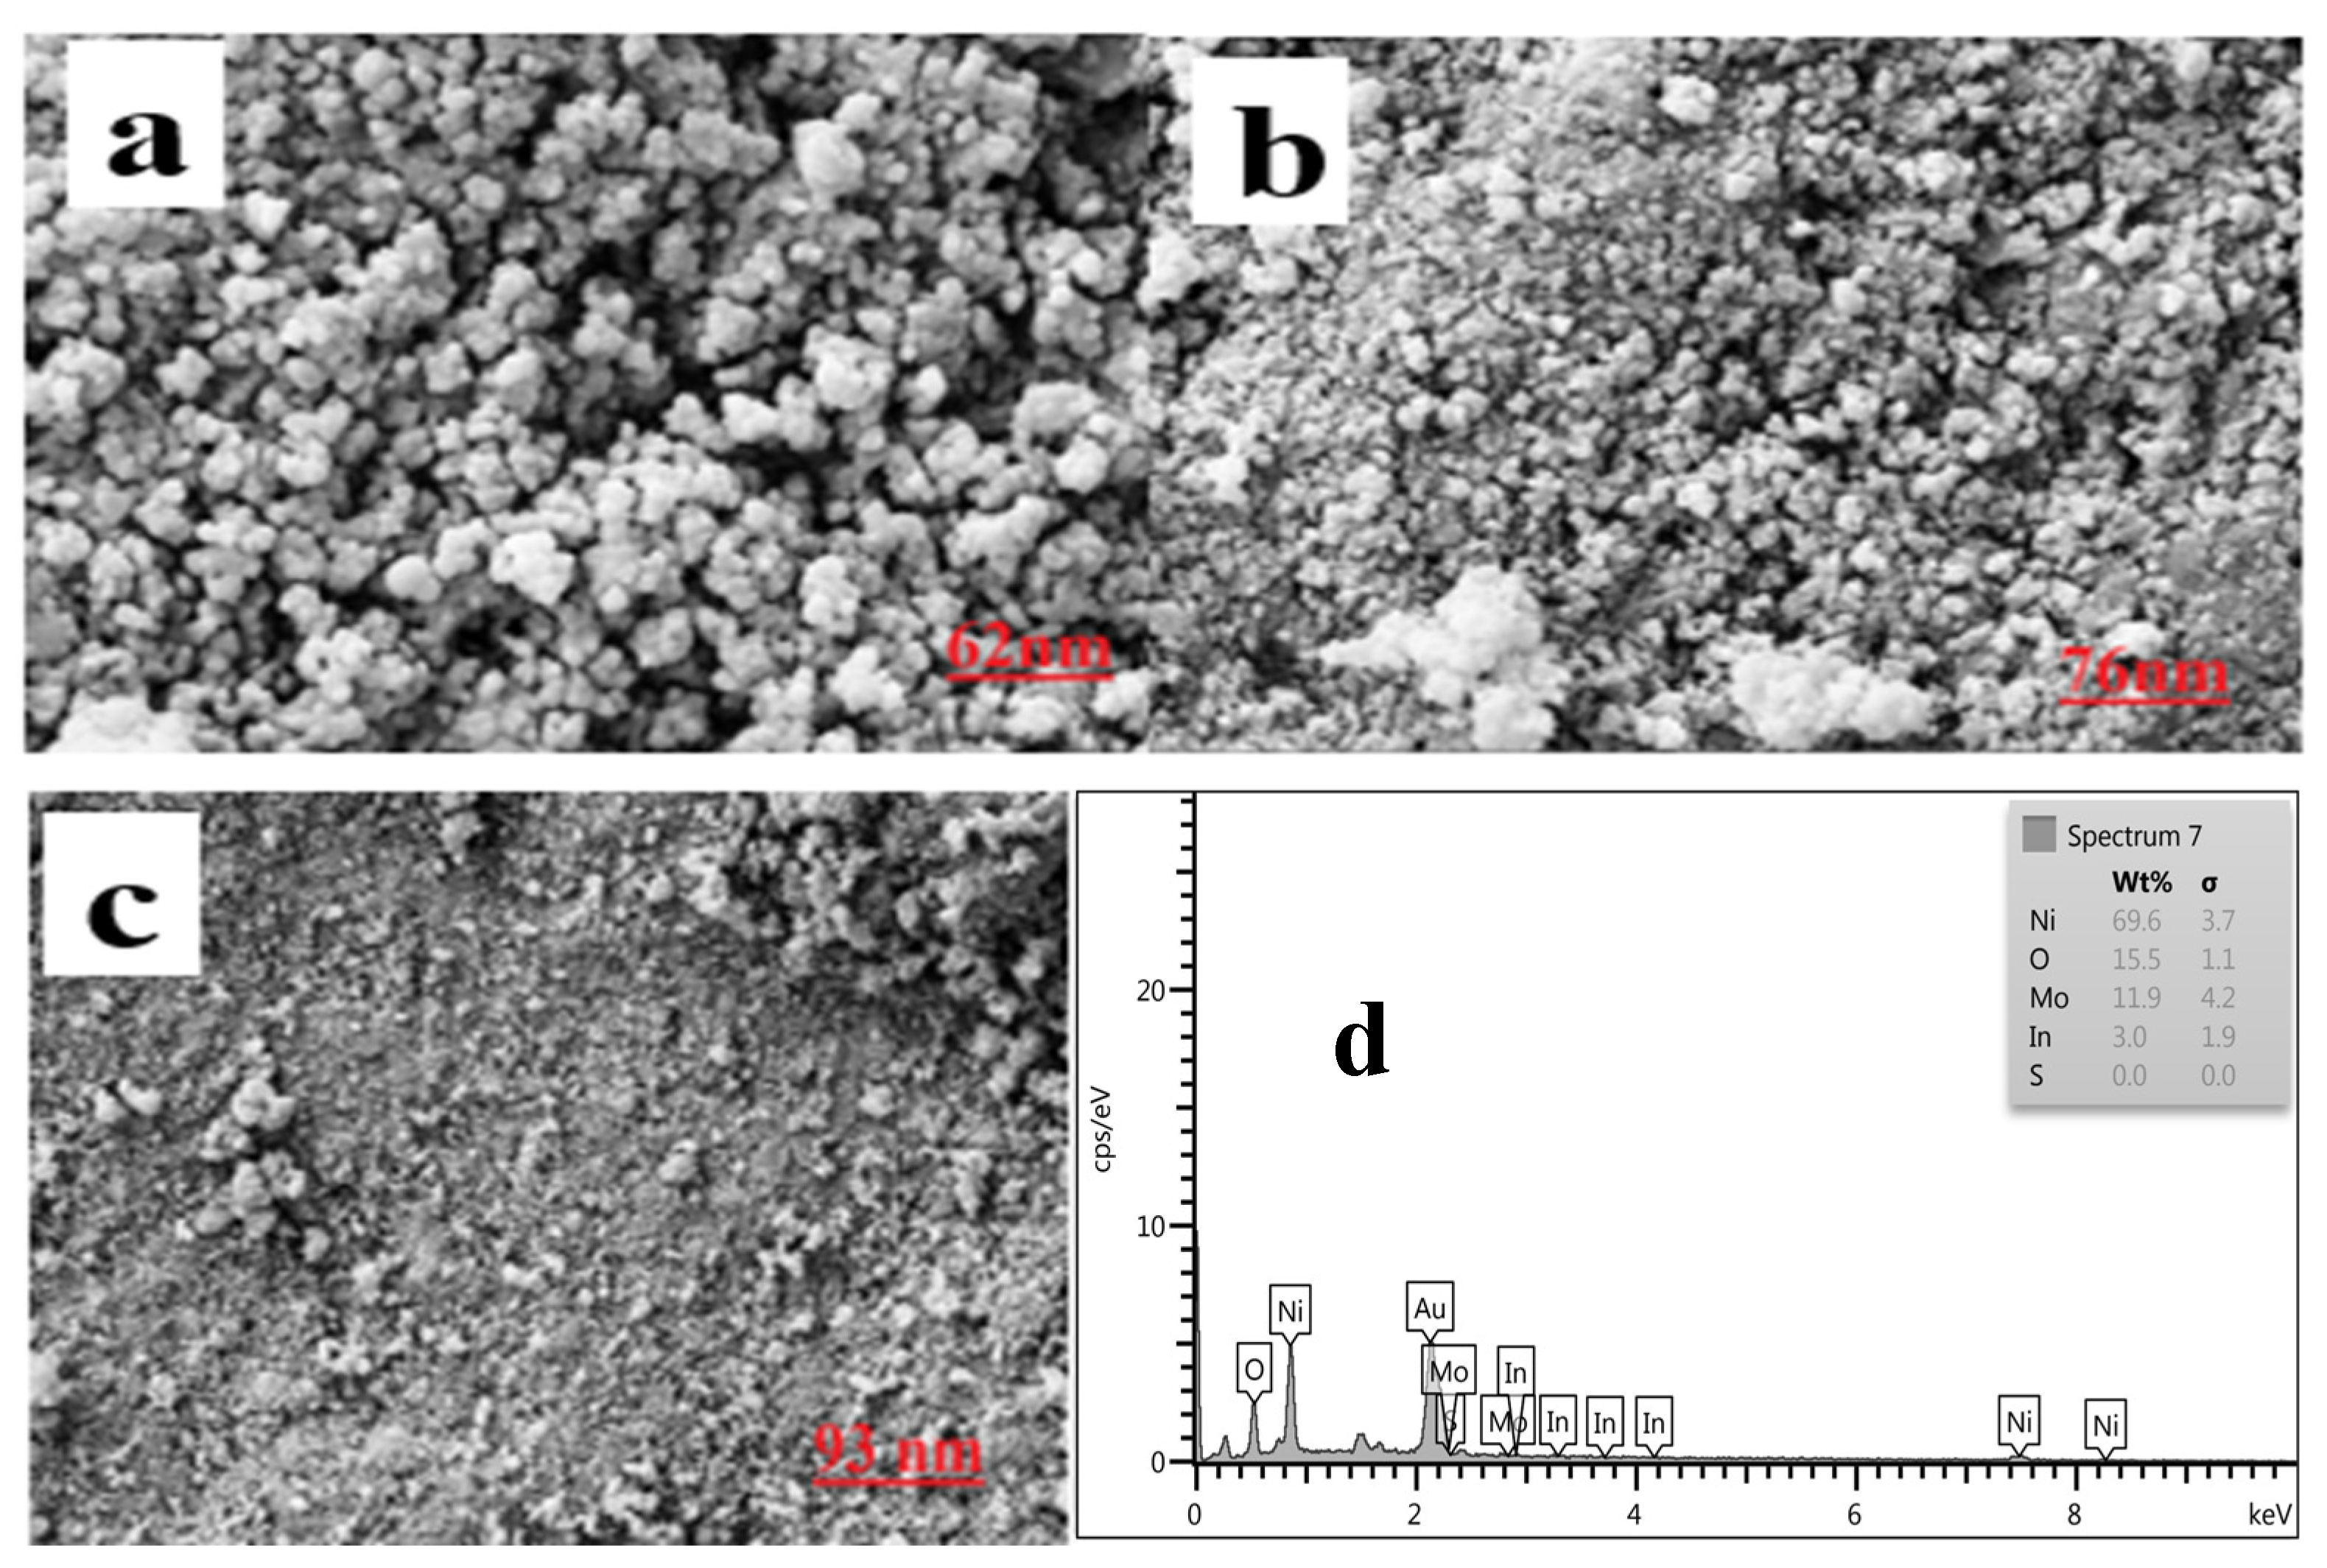
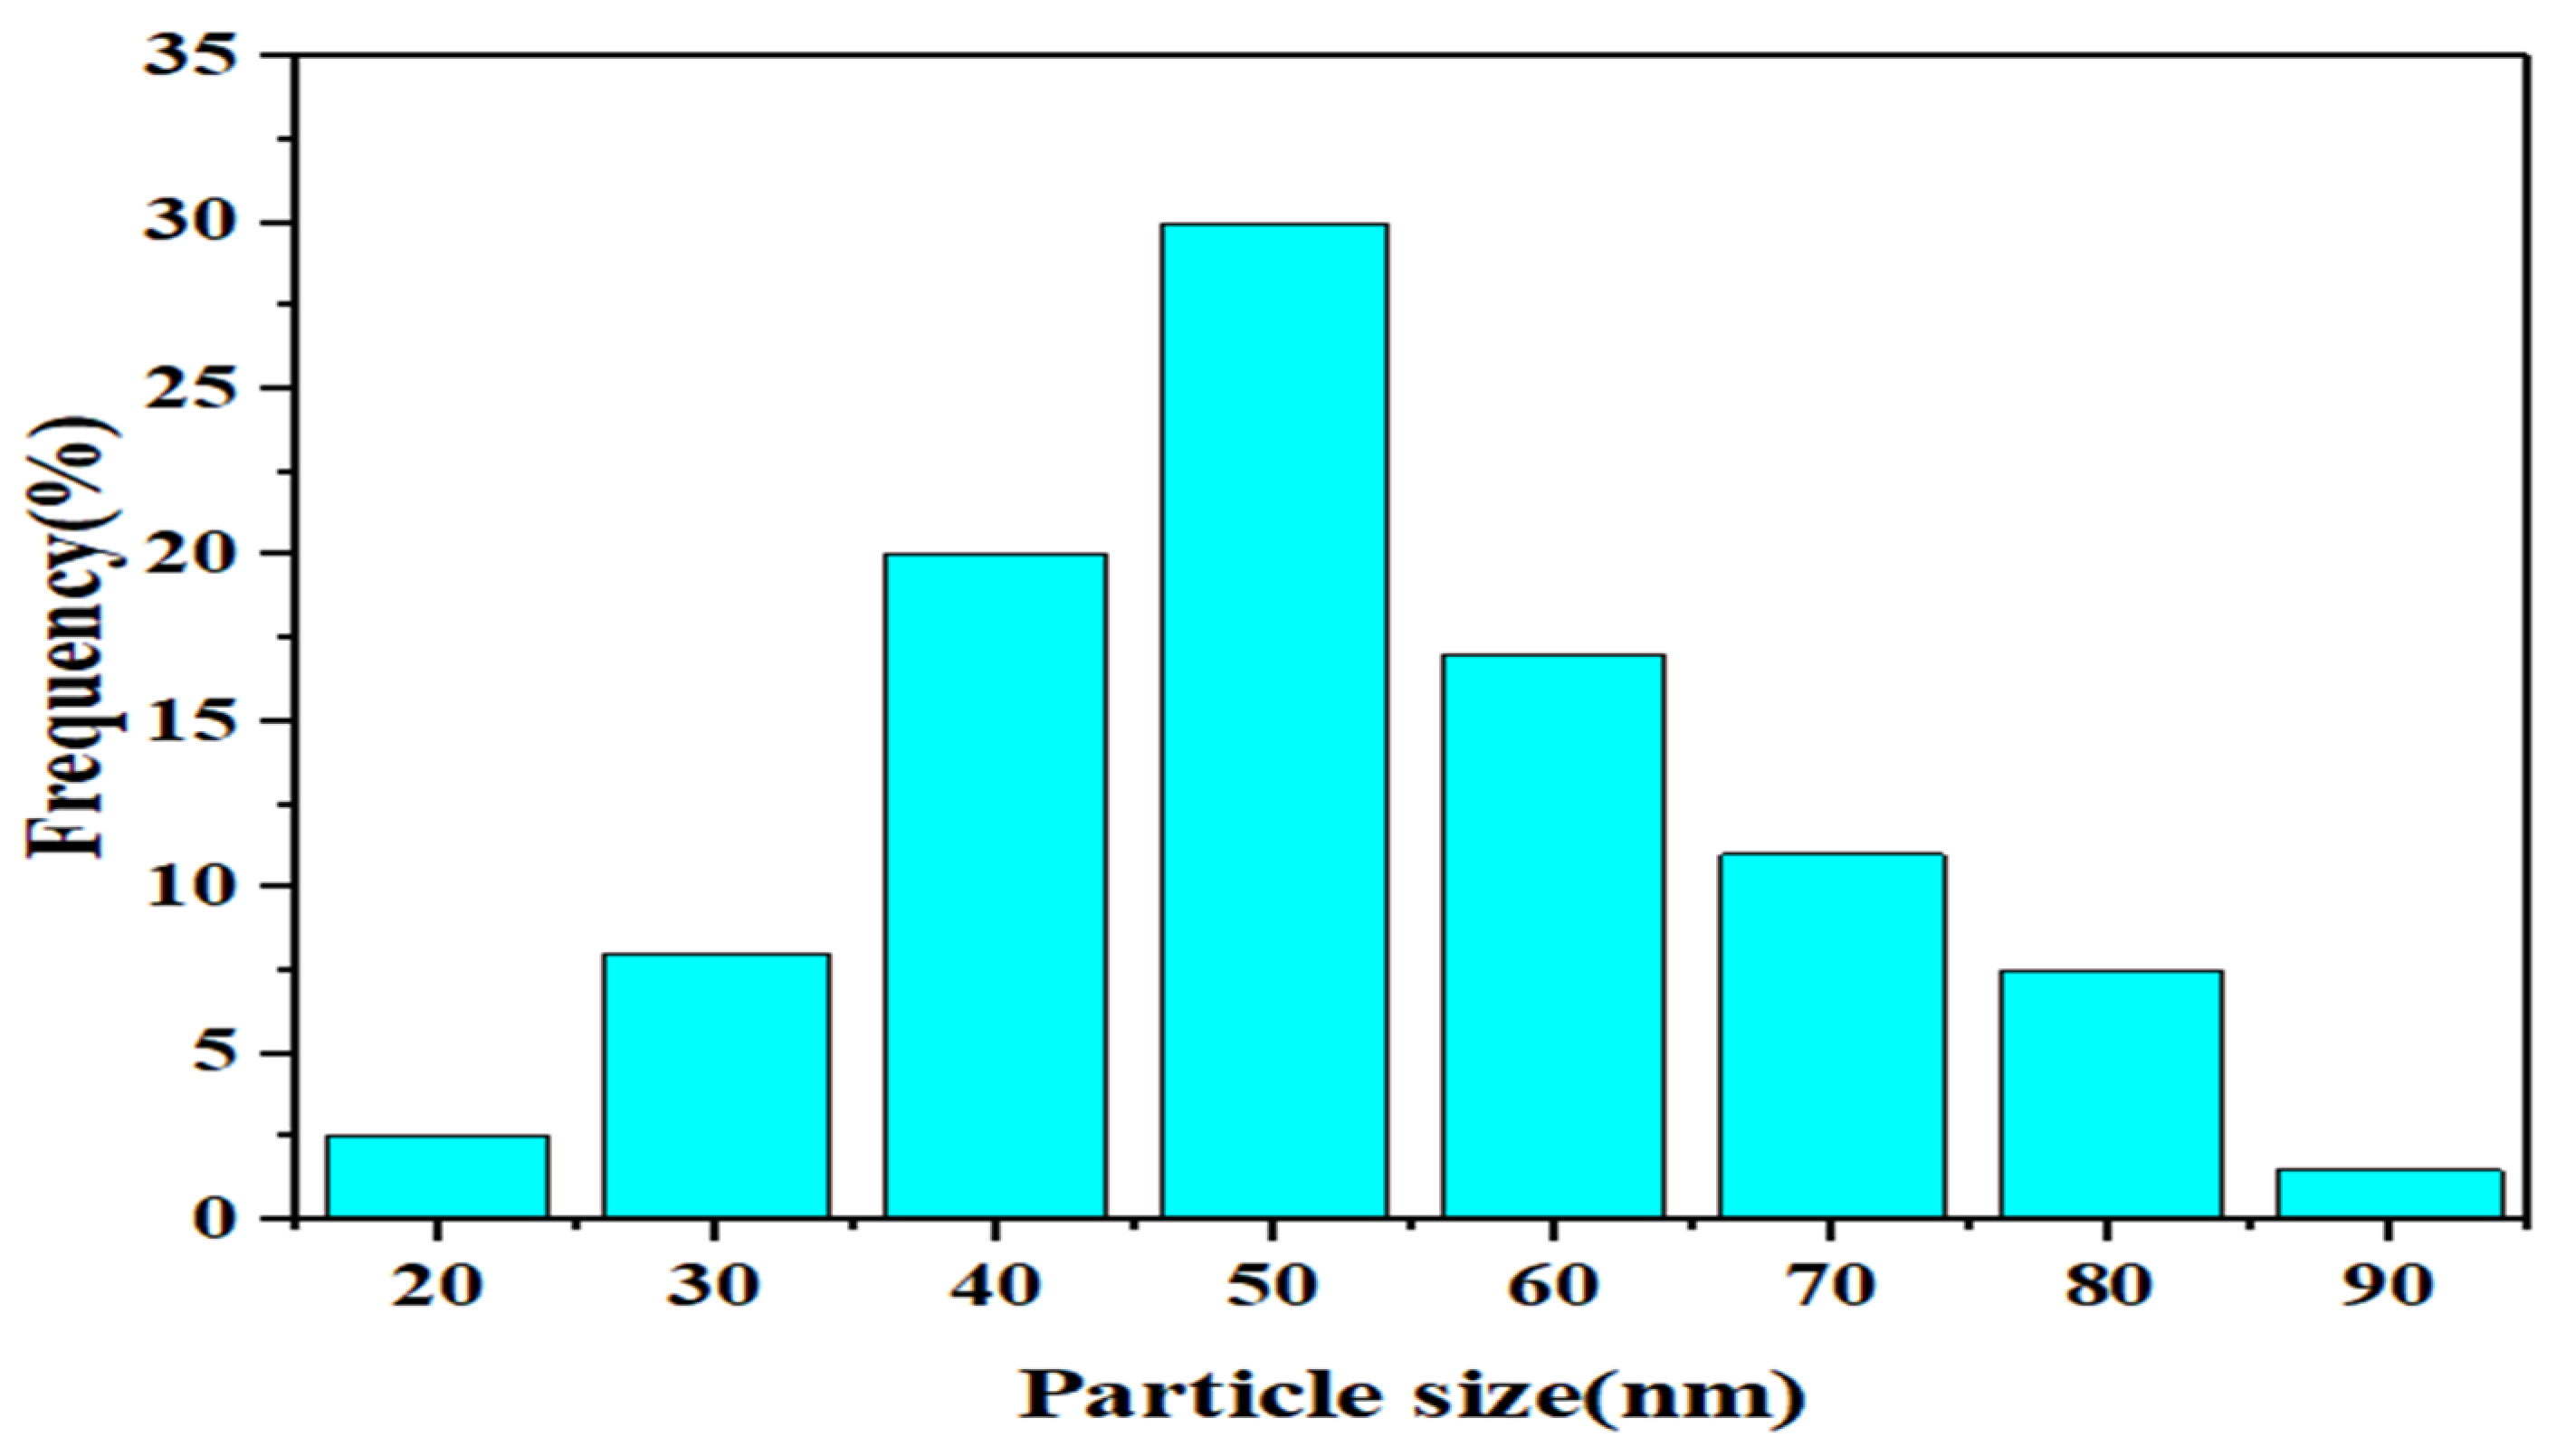
3.1.2. SEM, EDS, and DLS Analyses
3.1.3. Fourier Transform Infrared Spectroscopy (FTIR)
3.1.4. DRS Analyses
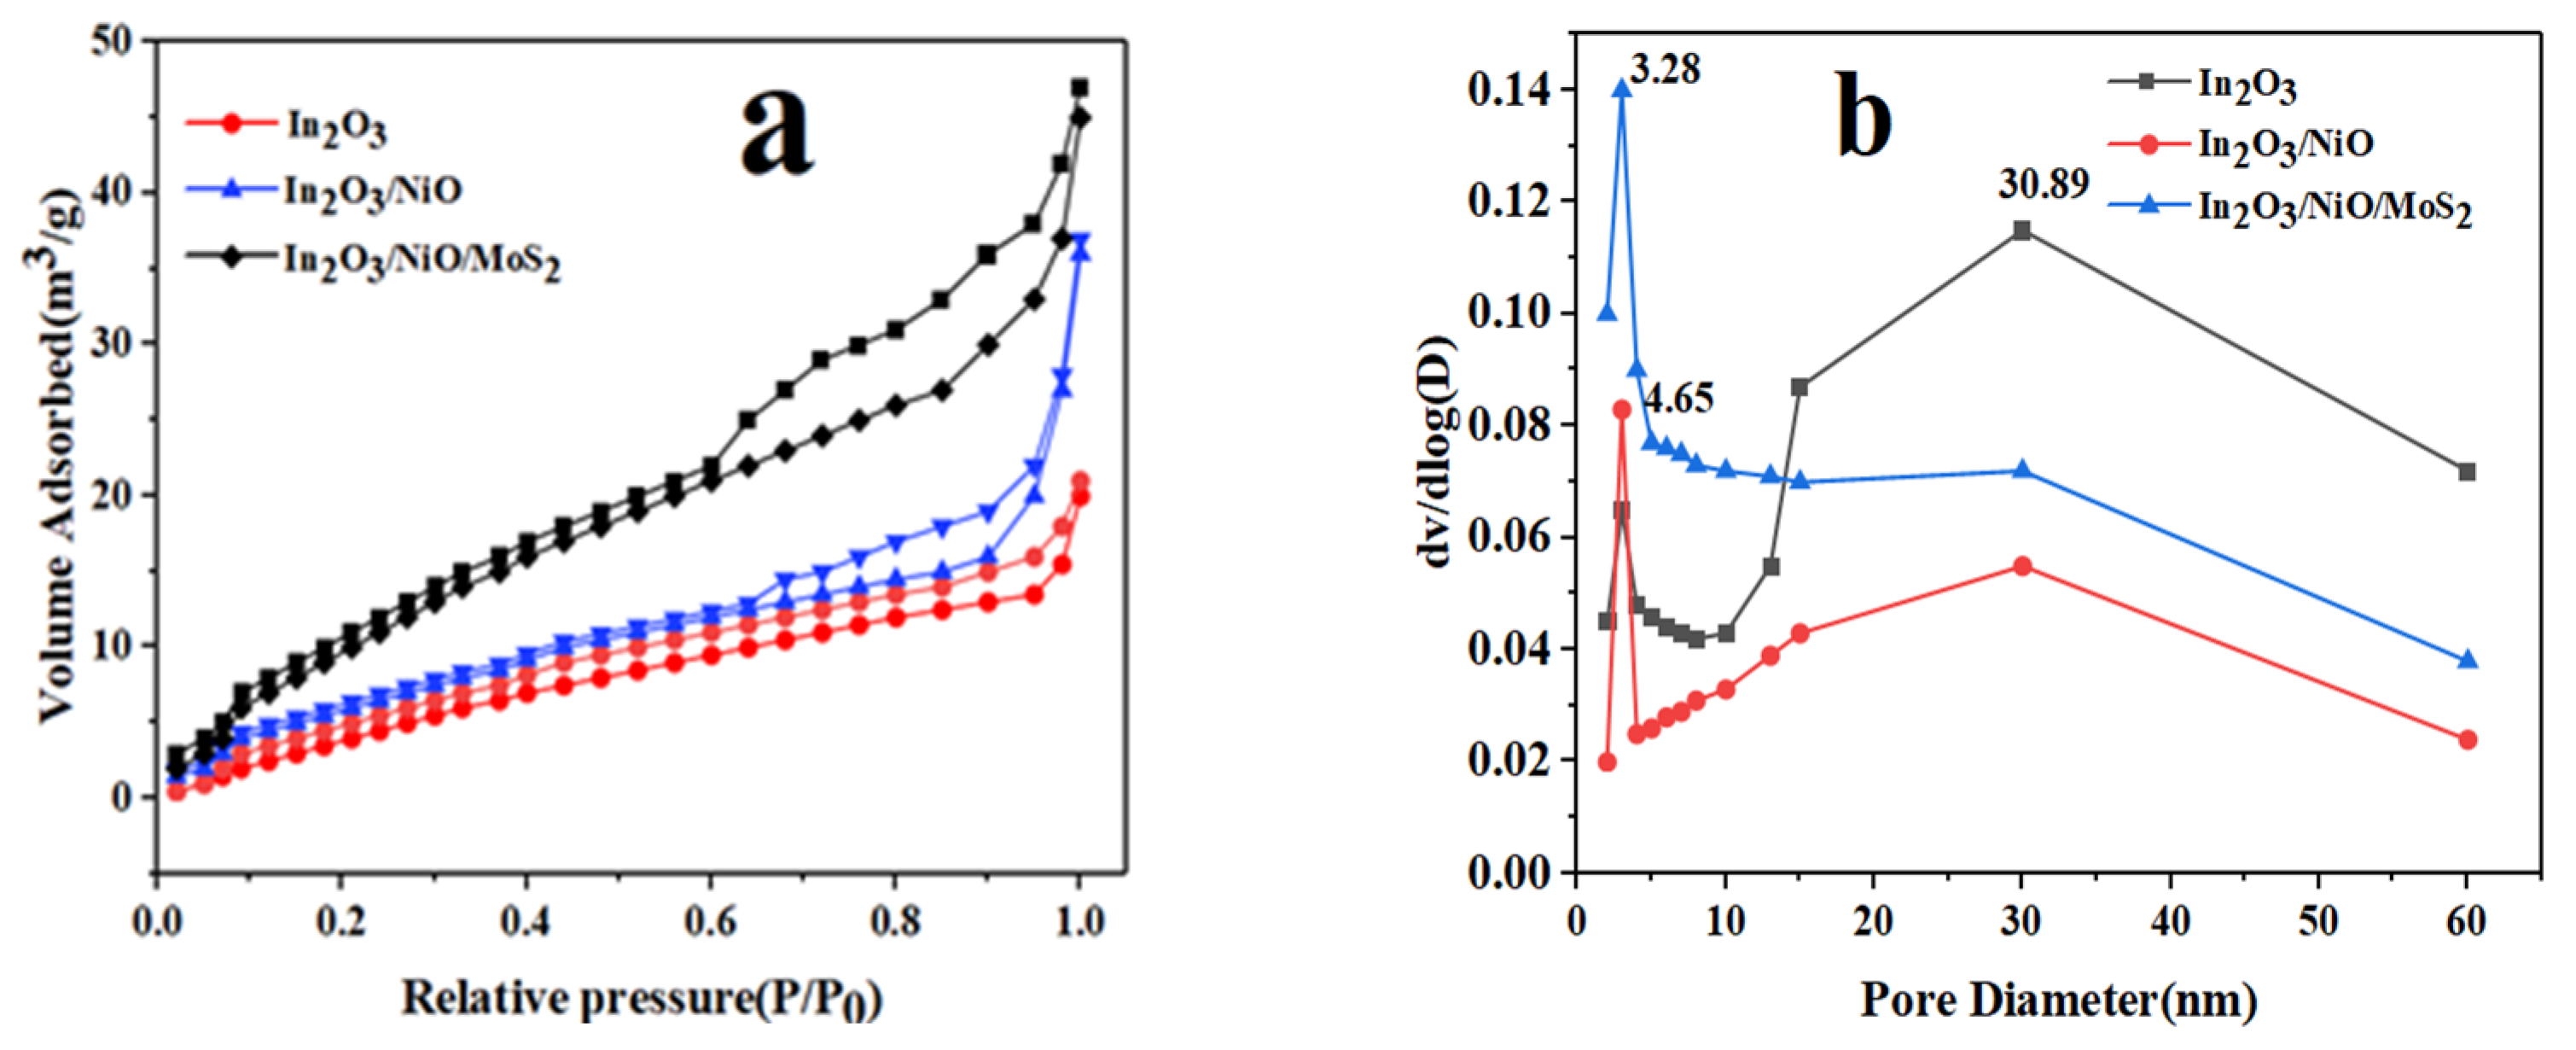
3.1.5. N2 Adsorption-Desorption
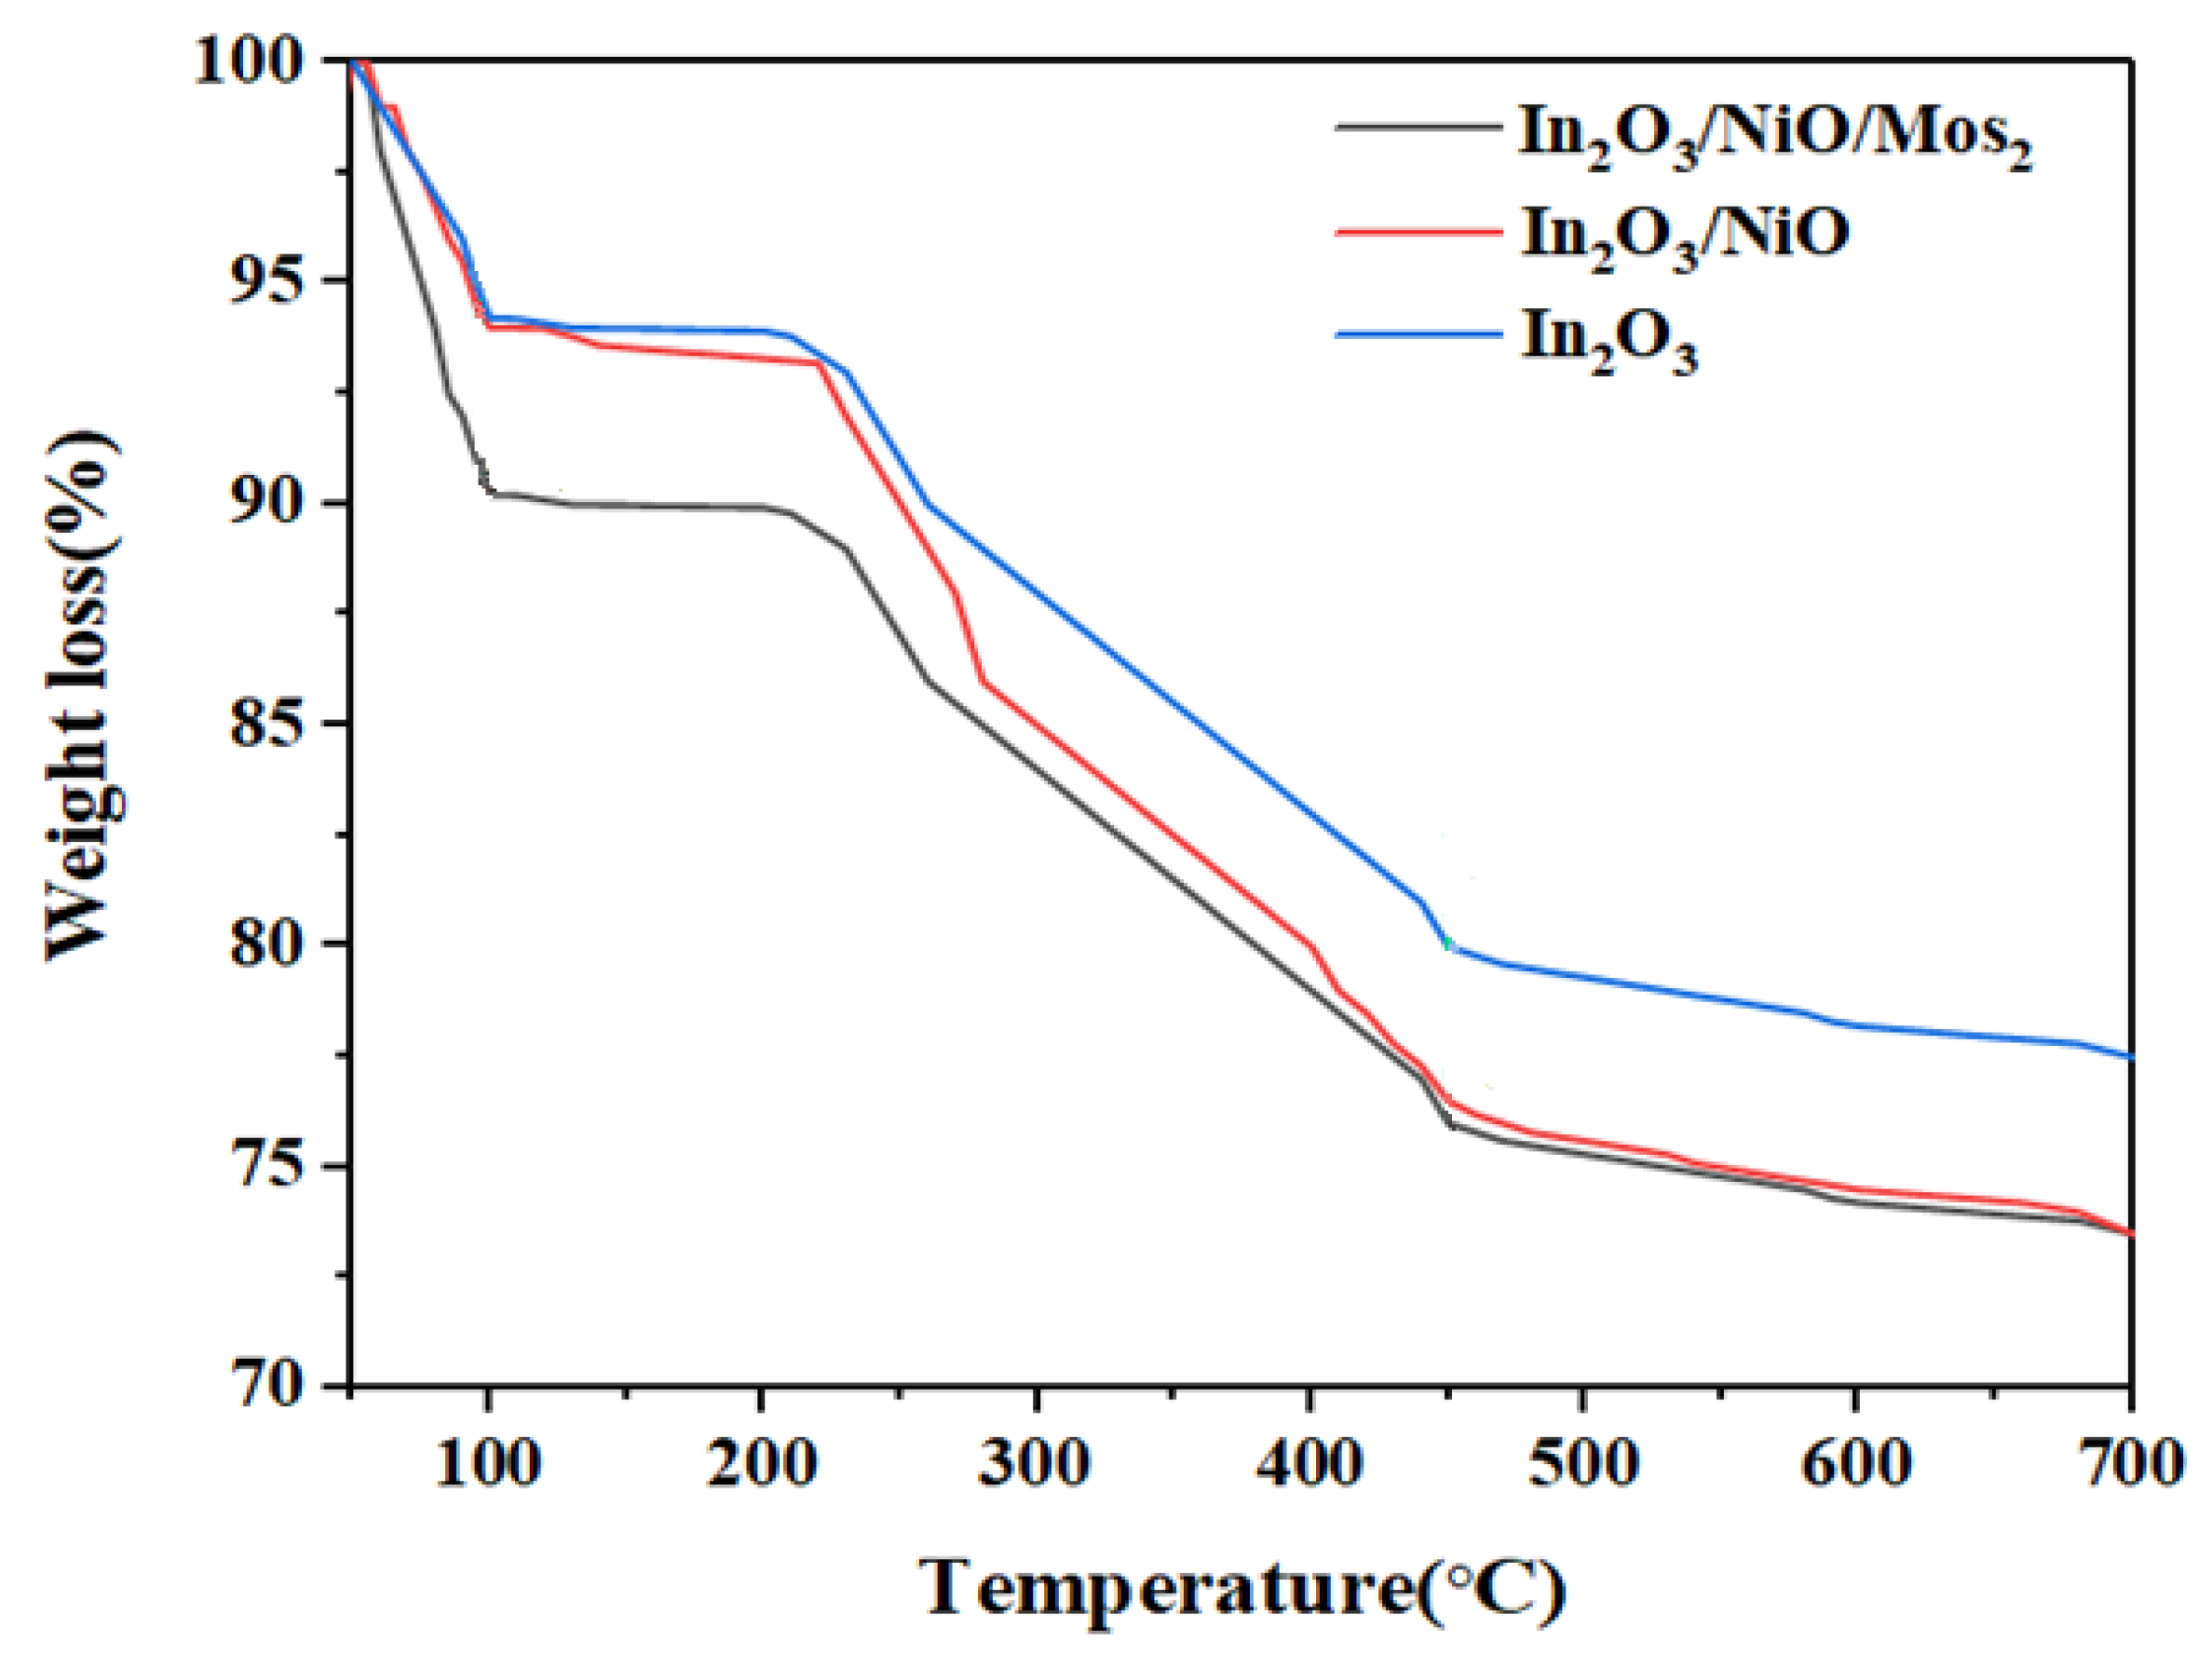
3.1.6. TGA Analyses
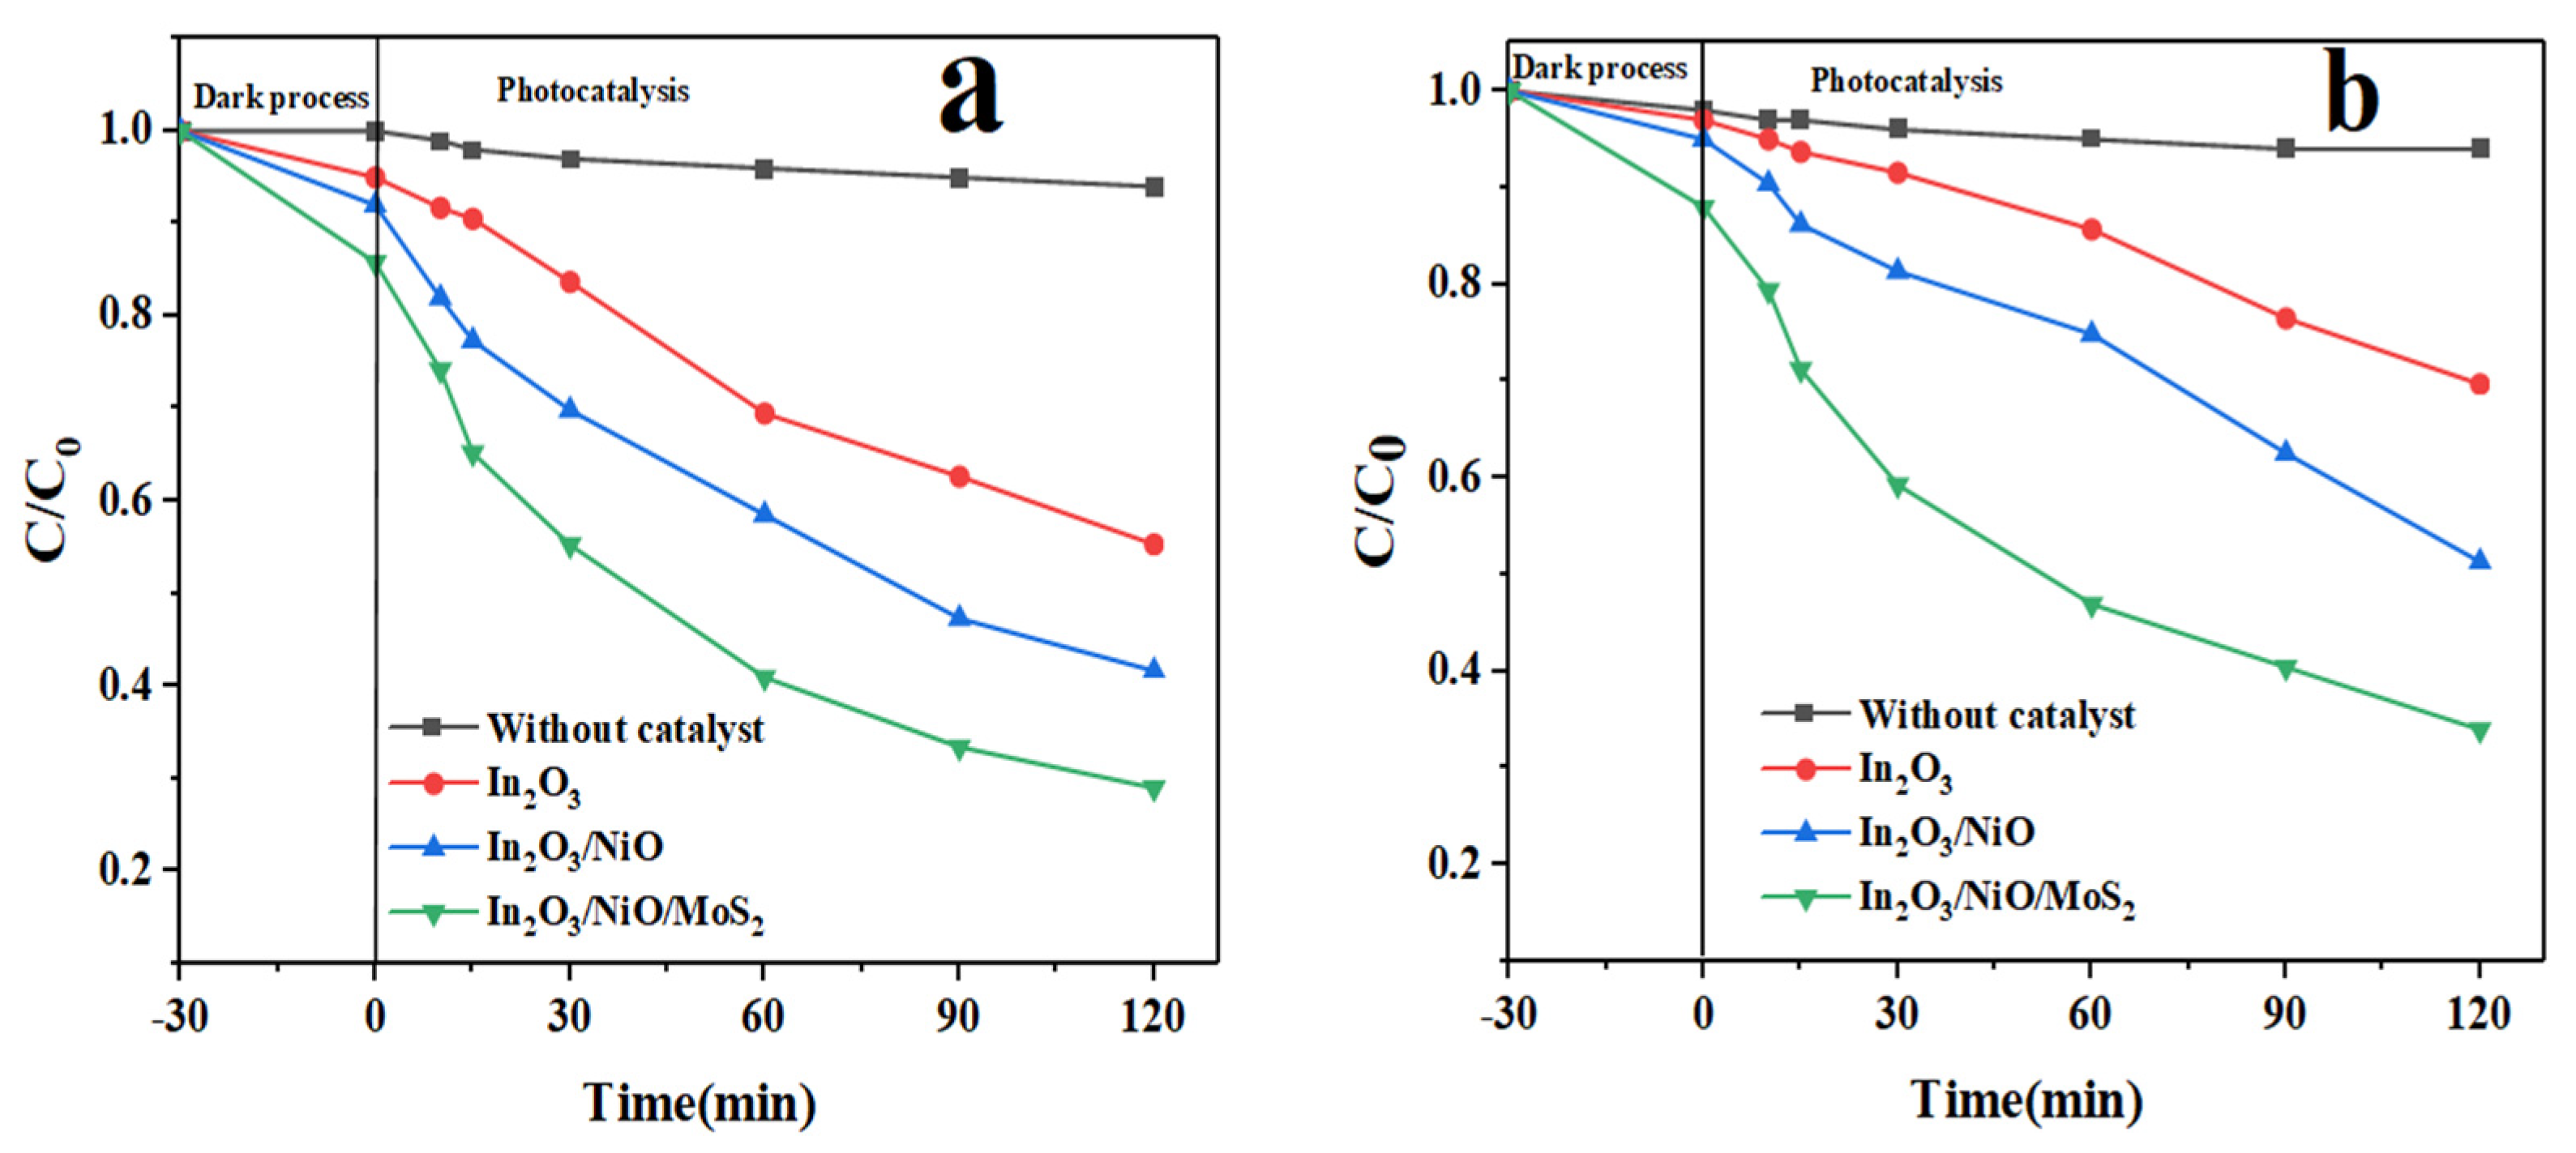
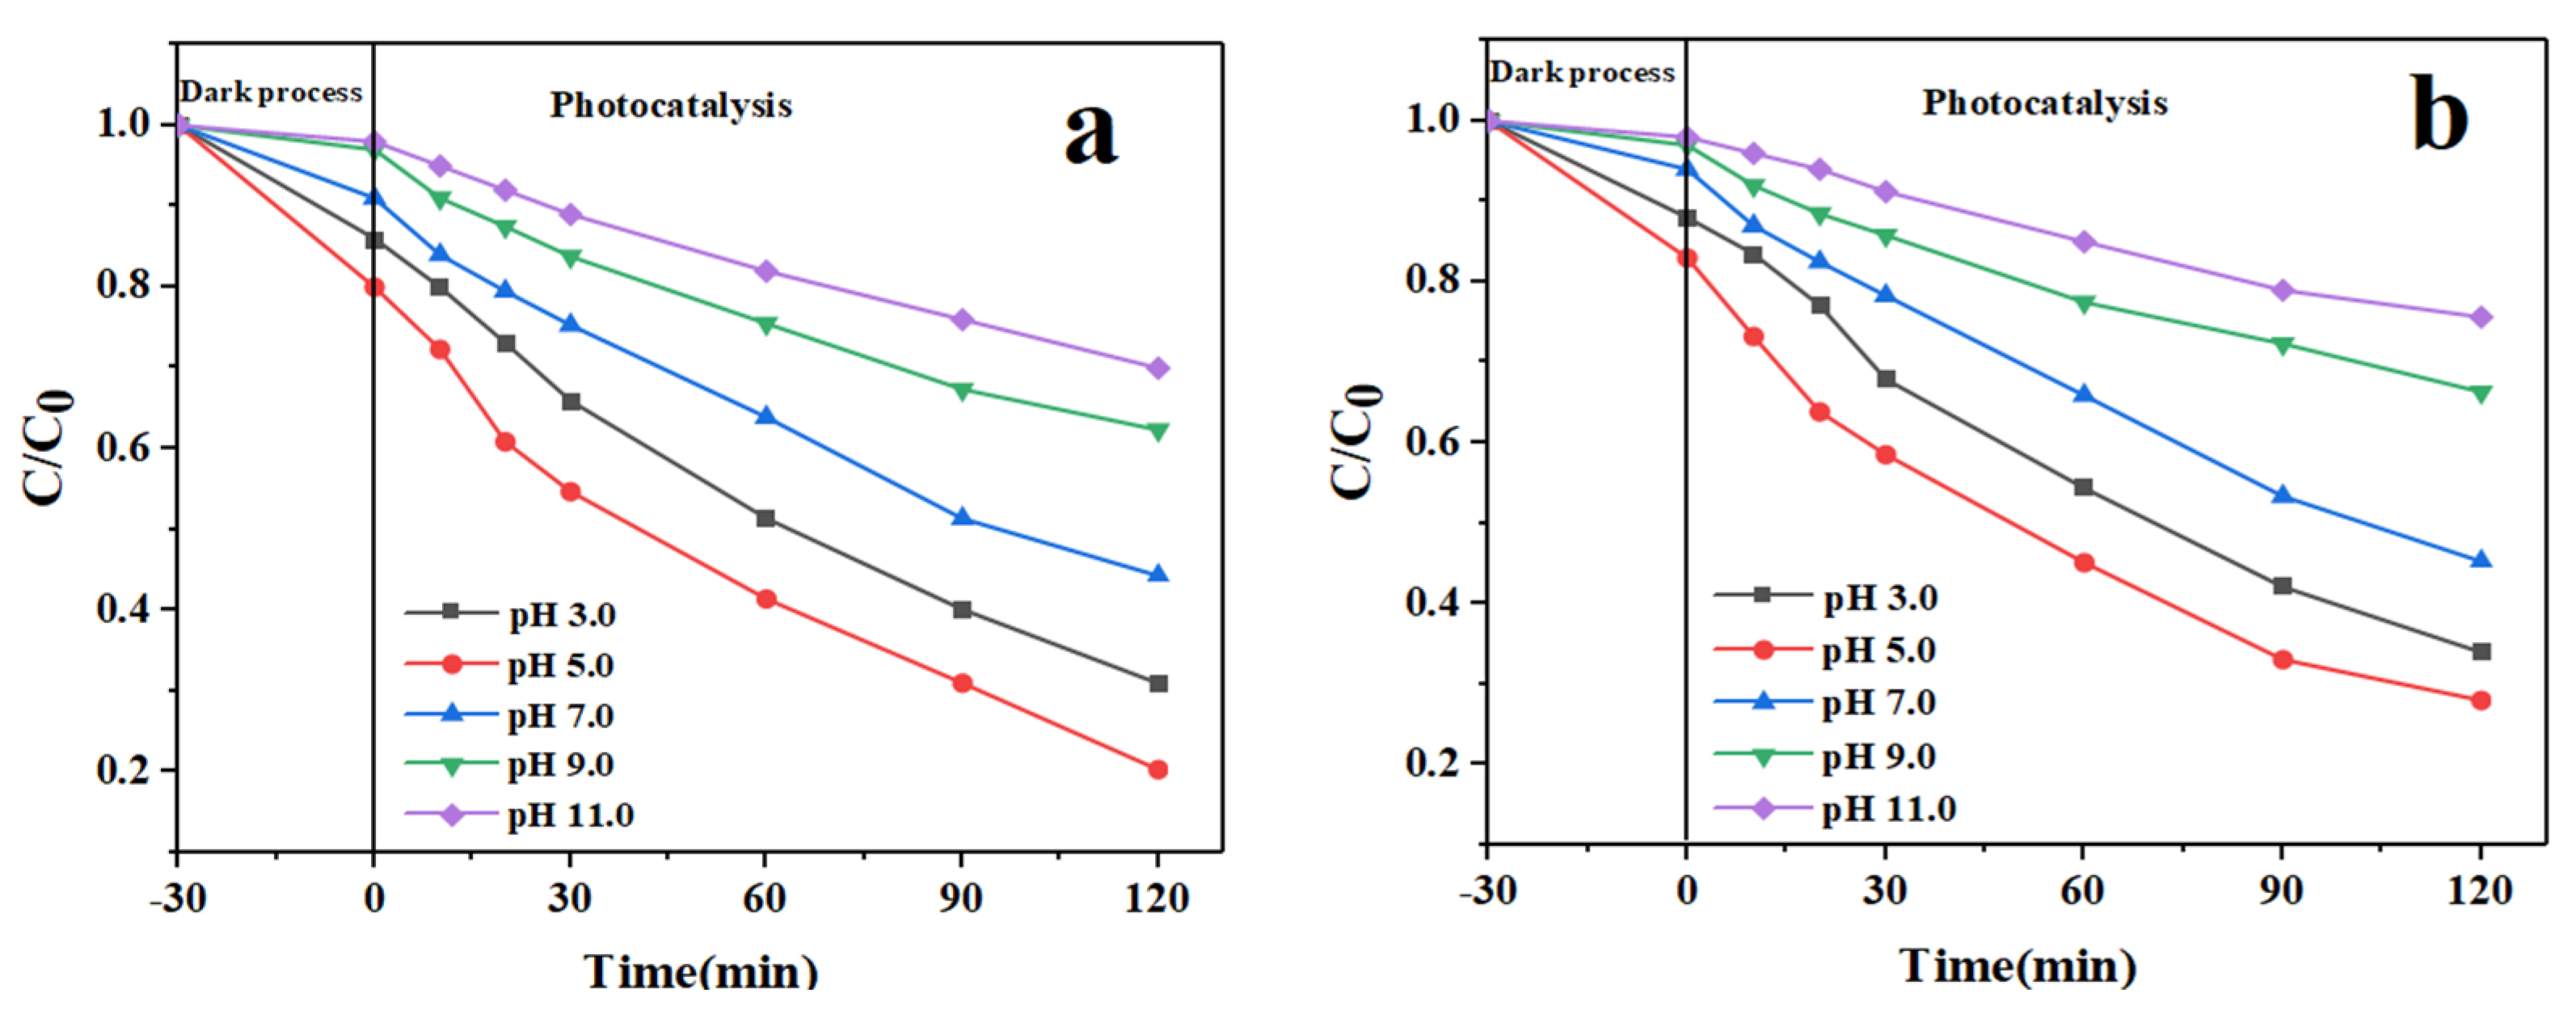
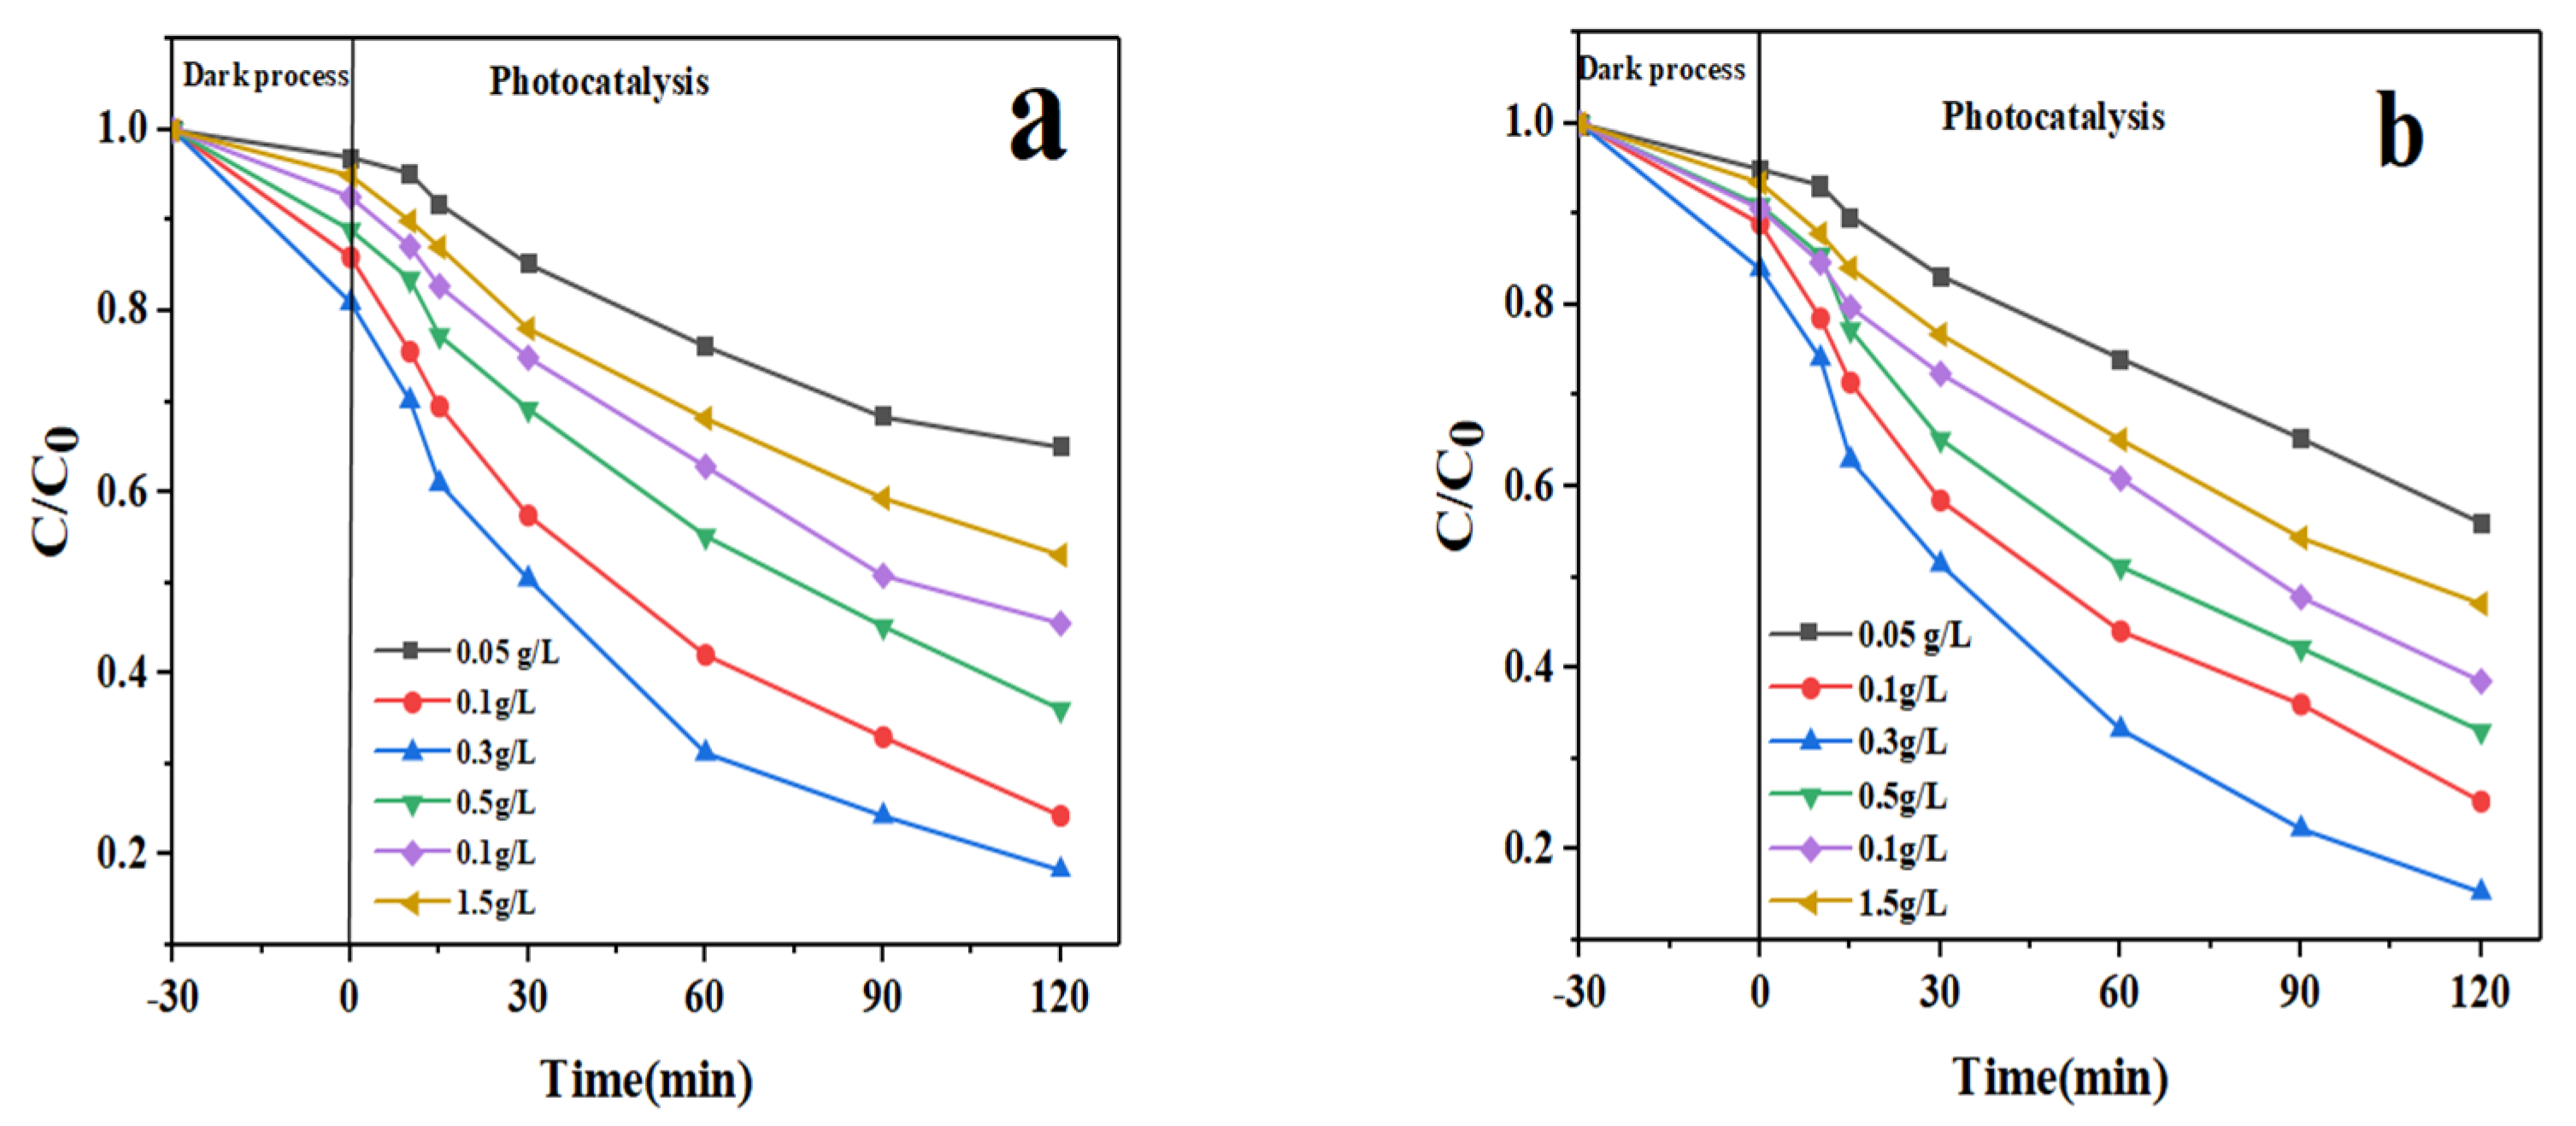
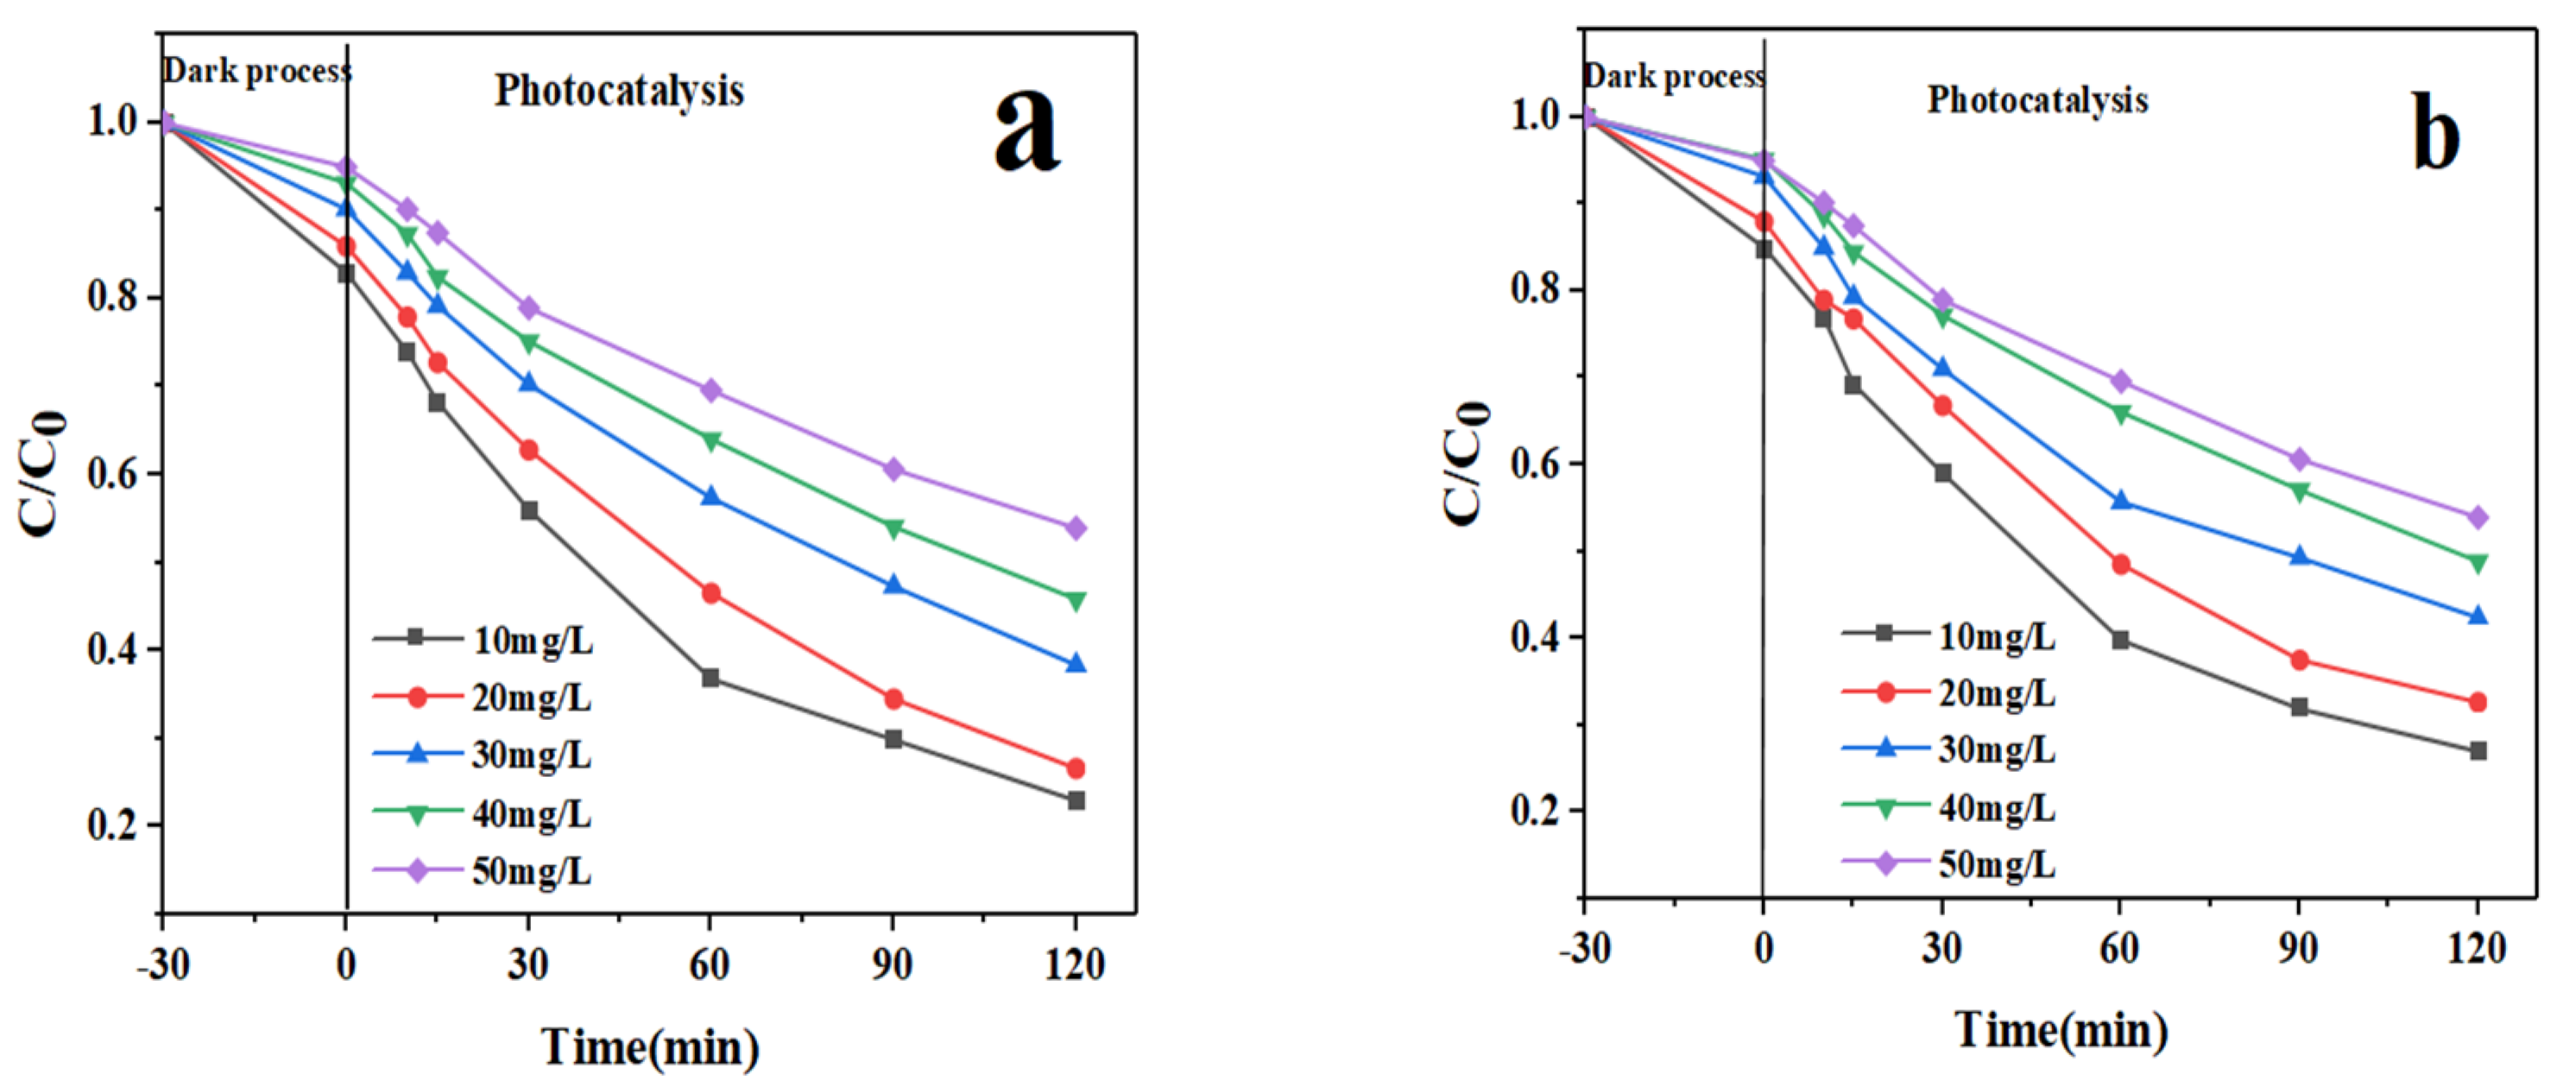
3.2. Photocatalytic Performance
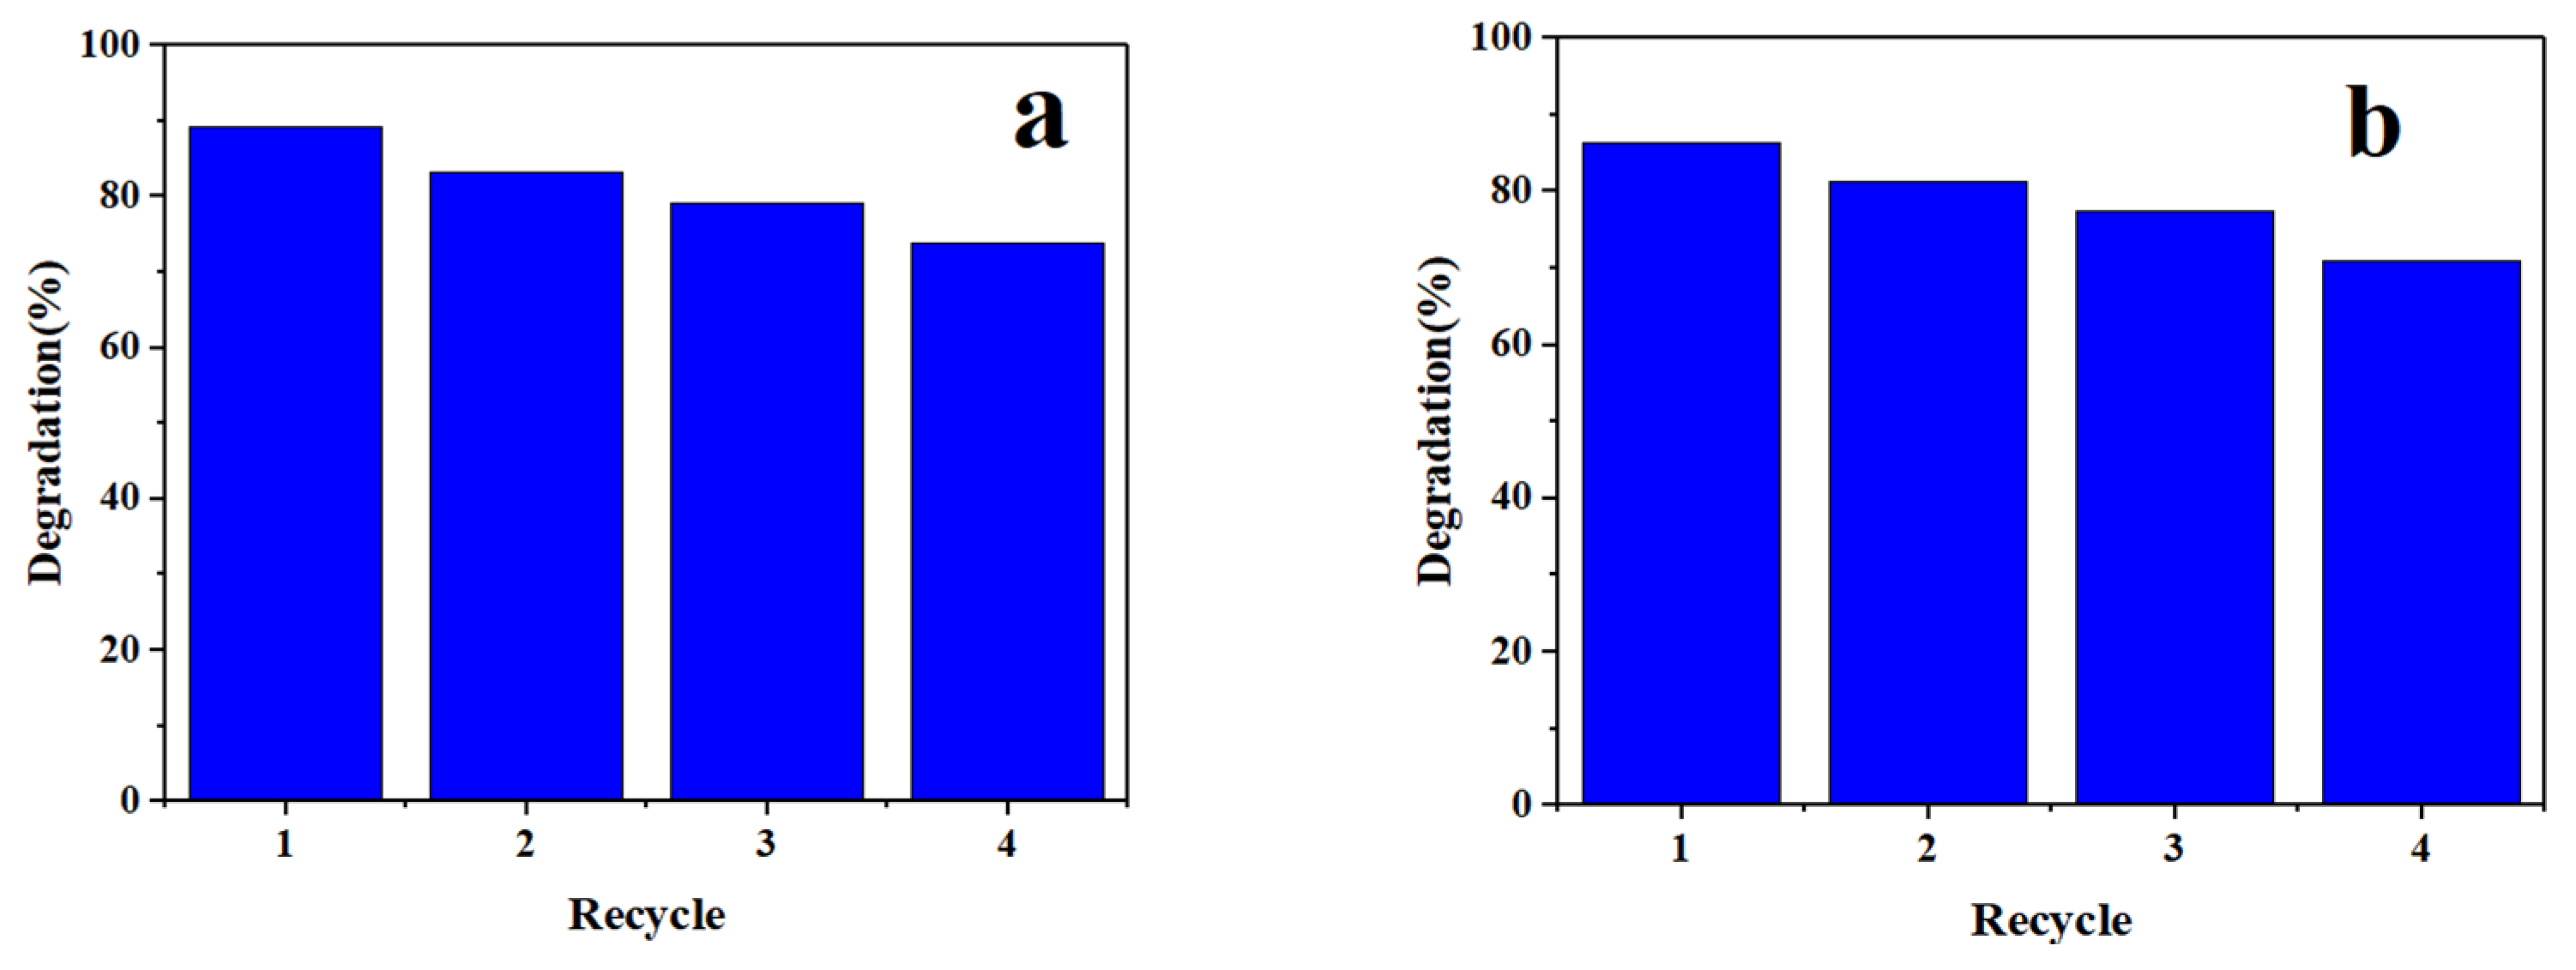
3.3. Photocatalyst Reusability
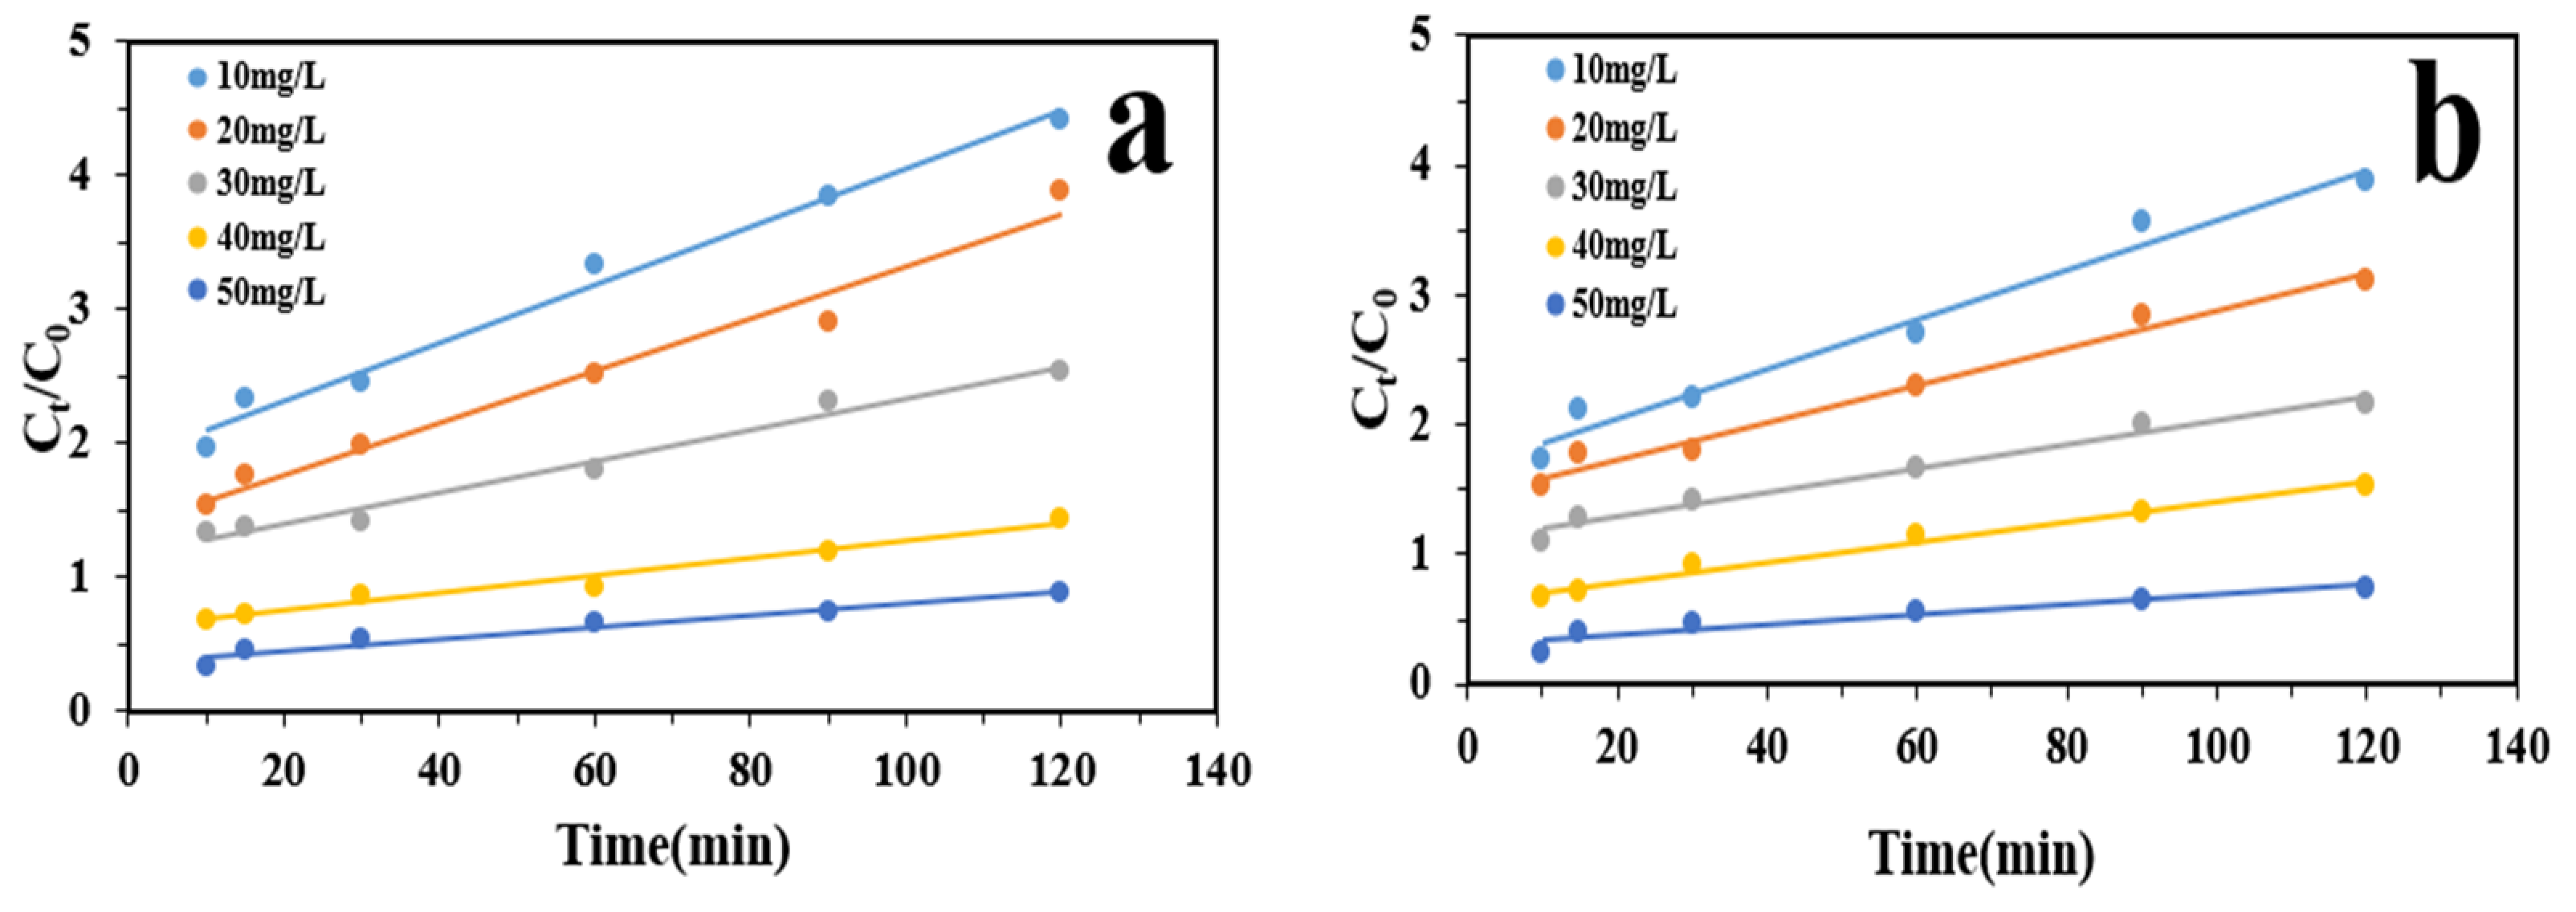
3.4. Kinetic of Photocatalytic Degradation
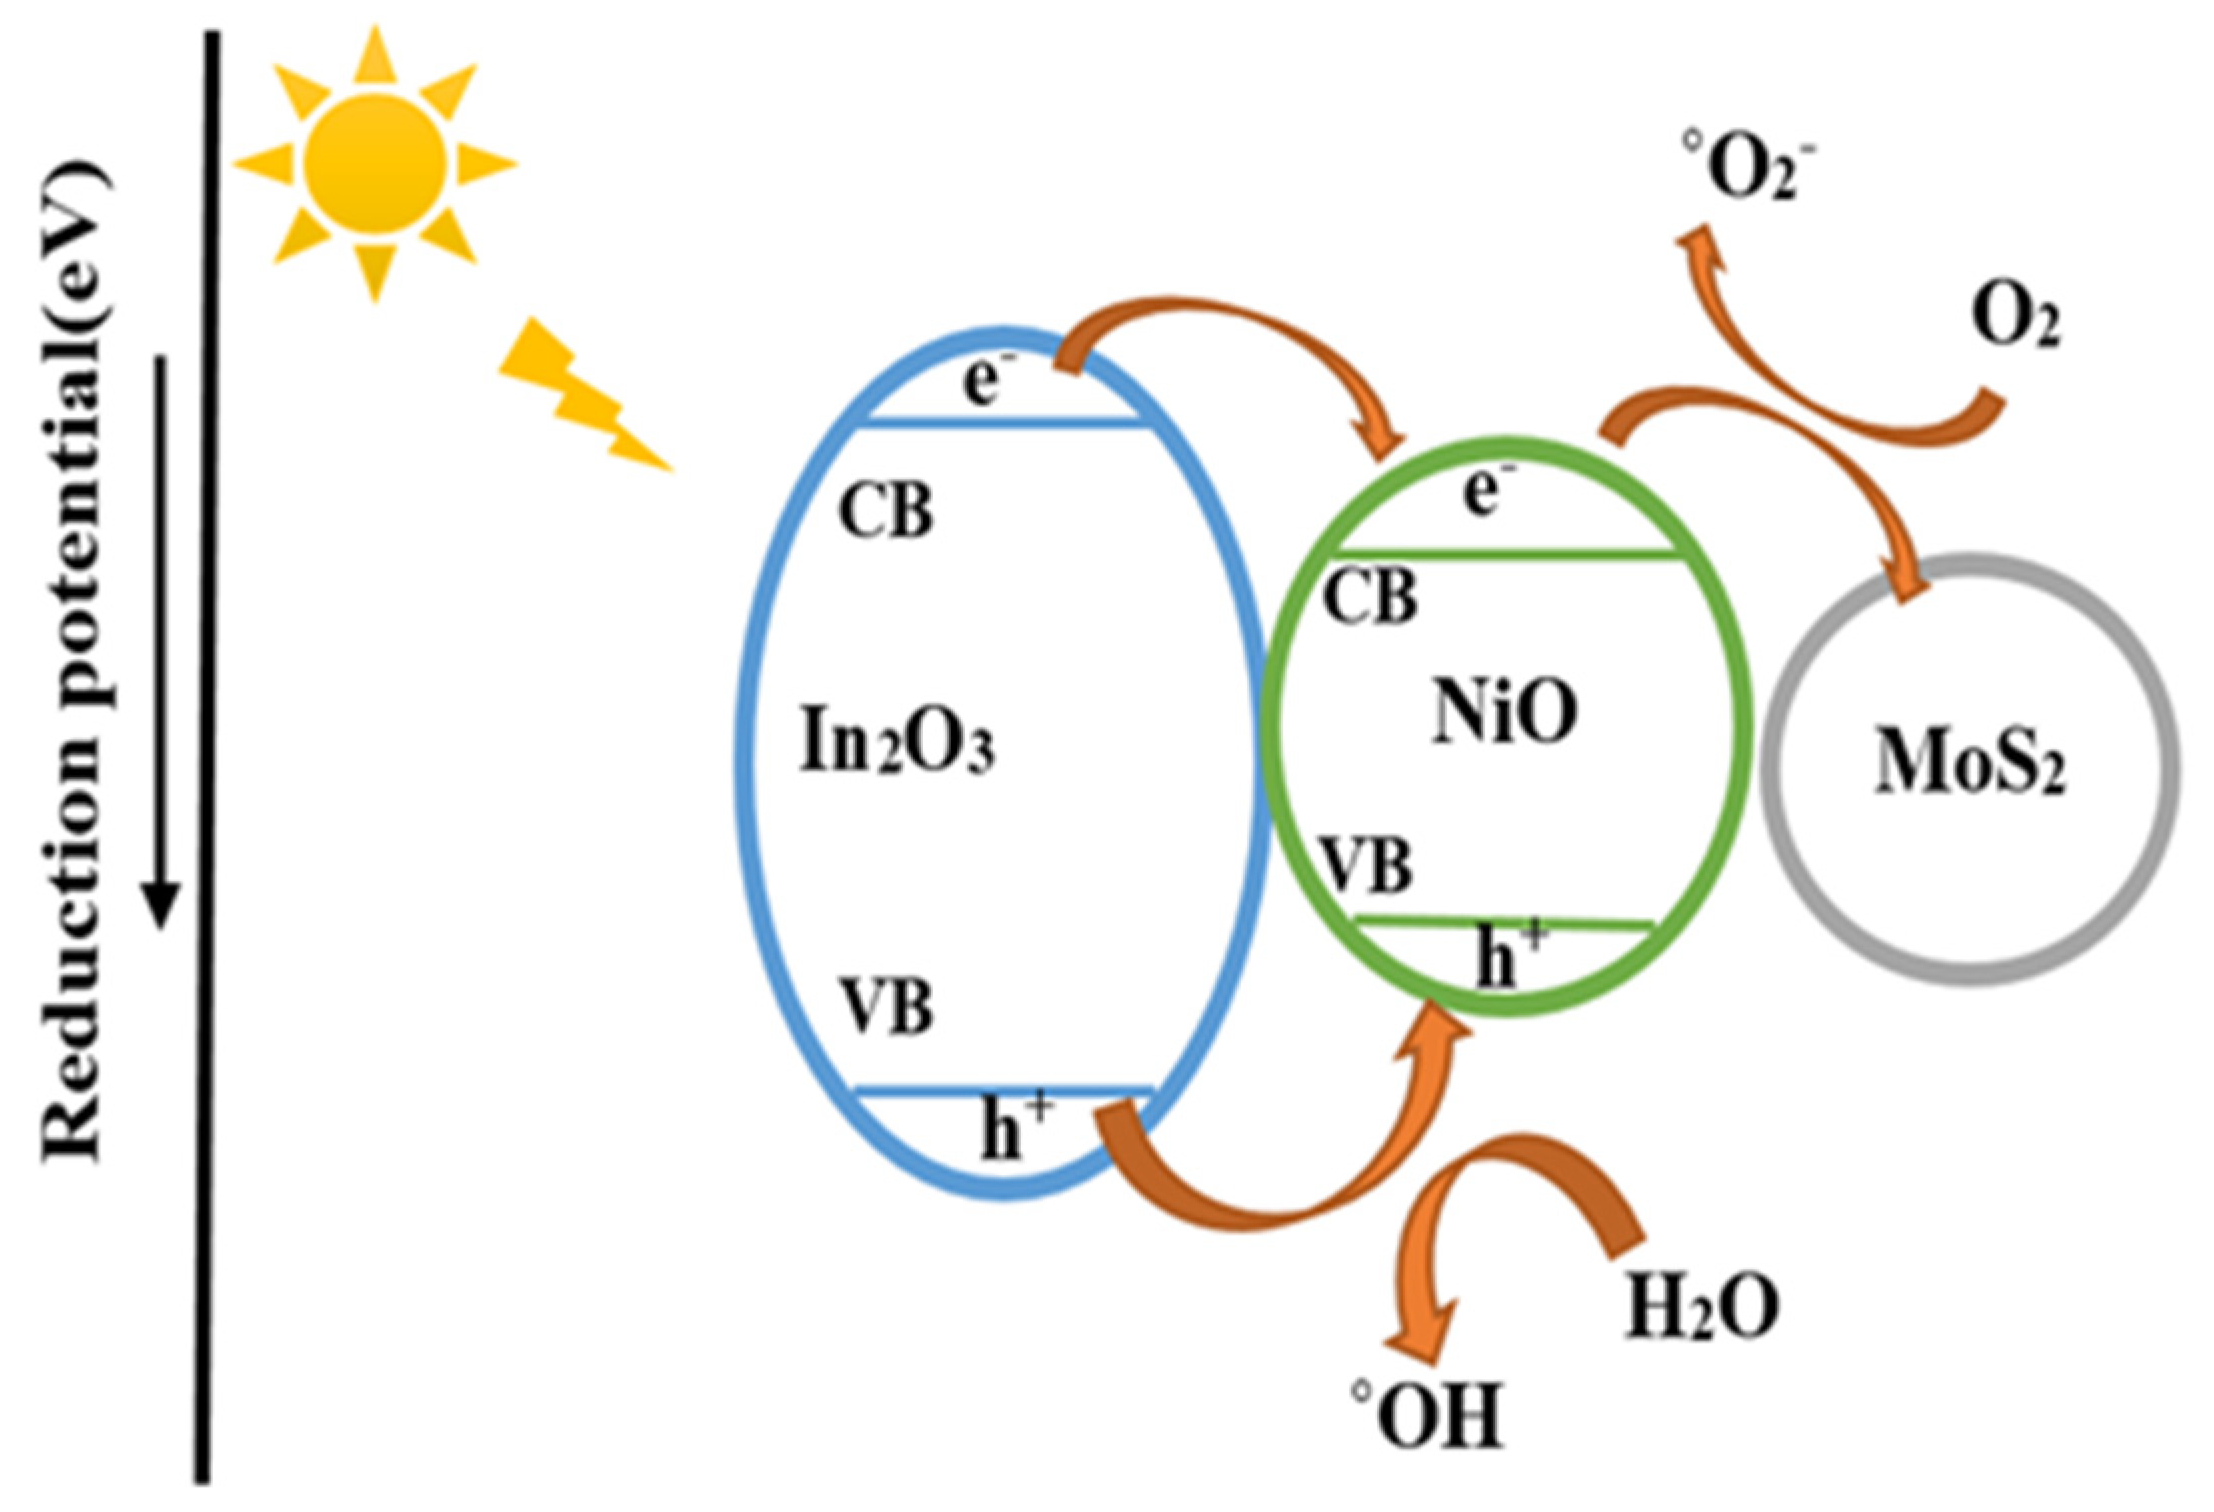
3.5. Photocatalytic Mechanism
4. Conclusions
Author Contributions
Funding
Data Availability Statement
Acknowledgments
Conflicts of Interest
References
- Sayadi, M.; Trivedy, R.K.; Pathak, R.K. Pollution of pharmaceuticals in environment. J. Ind. Pollut. Control. 2010, 26, 89–94. [Google Scholar]
- Gworek, B.; Kijeńska, M.; Wrzosek, J.; Graniewska, M. Pharmaceuticals in the soil and plant environment: A review. Water Air Soil Pollut. 2021, 232, 145. [Google Scholar] [CrossRef]
- Ahmadpour, N.; Sayadi, M.H.; Sobhani, S.; Hajiani, M. A potential natural solar light active photocatalyst using magnetic ZnFe2O4@TiO2/Cu nanocomposite as a high performance and recyclable platform for degradation of naproxen from aqueous solution. J. Clean. Prod. 2020, 268, 122023. [Google Scholar] [CrossRef]
- Santana-Viera, S.; Hernández-Arencibia, P.; Sosa-Ferrera, Z.; Santana-Rodríguez, J.J. Simultaneous and systematic analysis of cytostatic drugs in wastewater samples by ultra-high performance liquid chromatography tandem mass spectrometry. J. Chromatogr. B 2019, 1110, 124–132. [Google Scholar] [CrossRef]
- Straub, J.O. Combined environmental risk assessment for 5-fluorouracil and capecitabine in Europe. Integr. Environ. Asses. Manag. 2010, 6, 540–566. [Google Scholar] [CrossRef]
- Booker, V.; Halsall, C.; Llewellyn, N.; Johnson, A.; Williams, R. Prioritising anticancer drugs for environmental monitoring and risk assessment purposes. Sci. Total Environ. 2014, 473, 159–170. [Google Scholar] [CrossRef]
- Santos, M.S.; Franquet-Griell, H.; Lacorte, S.; Madeira, L.M.; Alves, A. Anticancer drugs in Portuguese surface waters–estimation of concentrations and identification of potentially priority drugs. Chemosphere 2017, 184, 1250–1260. [Google Scholar] [CrossRef]
- Besse, J.P.; Latour, J.F.; Garric, J. Anticancer drugs in surface waters: What can we say about the occurrence and environmental significance of cytotoxic, cytostatic and endocrine therapy drugs? Environ. Int. 2012, 39, 73–86. [Google Scholar] [CrossRef]
- Sun, X.; Shi, Y.; Lu, J.; Shi, W.; Guo, F. Template-free self-assembly of three-dimensional porous graphitic carbon nitride nanovesicles with size-dependent photocatalytic activity for hydrogen evolution. Appl. Surf. Sci. 2022, 606, 154841. [Google Scholar] [CrossRef]
- Sayadi, M.H.; Ahmadpour, N.; Homaeigohar, S. Photocatalytic and Antibacterial Properties of Ag-CuFe2O4@ WO3 Magnetic Nanocomposite. Nanomaterials 2021, 11, 298. [Google Scholar] [CrossRef]
- Xuemei, H.; Yukun, S.; Bo, B. Fabrication of cubic pn heterojunction-like NiO/In2O3 composite microparticles and their enhanced gas sensing characteristics. J. Nanomater. 2016, 2016, 7589028. [Google Scholar] [CrossRef]
- Wang, Y.; Zhang, F.; Wei, L.; Li, G.; Zhang, W. Facet-dependent photocatalytic performance of NiO oriented thin films prepared by pulsed laser deposition. Phys. B Condens. Matter. 2015, 457, 194–197. [Google Scholar] [CrossRef]
- Lin, Z.; Du, C.; Yan, B.; Wang, C.; Yang, G. Two-dimensional amorphous NiO as a plasmonic photocatalyst for solar H2 evolution. Nat. Commun. 2018, 9, 4036. [Google Scholar] [CrossRef]
- Sharma, A.K.; Kaur, B. Simulation and analysis of 2D material (MoS2/MoSe2) based plasmonic sensor for measurement of organic compounds in infrared. Optik 2018, 157, 161–169. [Google Scholar] [CrossRef]
- Ali, S.A.; Ahmad, T. Enhanced hydrogen generation via overall water splitting using novel MoS2-BN nanoflowers assembled TiO2 ternary heterostructures. Int. J. Hydrog. Energy 2023, 48, 22044–22059. [Google Scholar] [CrossRef]
- Kumar, A.; Choudhary, P.; Kumar, A.; Camargo, P.H.; Krishnan, V. Recent advances in plasmonic photocatalysis based on TiO2 and noble metal nanoparticles for energy conversion, environmental remediation, and organic synthesis. Small 2022, 18, 2101638. [Google Scholar] [CrossRef] [PubMed]
- Zheng, L.; Zhang, R.; Chang, F.; Liu, M.; Deng, J.; Hu, J.; He, J.; Feng, D.; Gao, J.; Chen, C.; et al. Ultrathin 1T/2H mixed phase MoS2 decorated TiO2 nanorod arrays for effective photocatalytic hydrogen evolution. CrystEngComm. 2021, 23, 3710–3716. [Google Scholar] [CrossRef]
- Amarnath, M.; Gurunathan, K. Highly selective CO2 gas sensor using stabilized NiO-In2O3 nanospheres coated reduced graphene oxide sensing electrodes at room temperature. J. Alloys Compd. 2021, 857, 157584. [Google Scholar] [CrossRef]
- Ikram, M.; Liu, Y.; Lv, H.; Liu, L.; Rehman, A.U.; Kan, K.; Shi, K. 3D-multilayer MoS2 nanosheets vertically grown on highly mesoporous cubic In2O3 for high-performance gas sensing at room temperature. Appl. Surf. Sci. 2019, 466, 1–11. [Google Scholar] [CrossRef]
- Raha, S.; Ahmaruzzaman, M. Novel magnetically retrievable In2O3/MoS2/Fe3O4 nanocomposite materials for enhanced photocatalytic performance. Sci. Rep. 2021, 11, 6379. [Google Scholar] [CrossRef]
- Jabeen, S.; Iqbal, J.; Arshad, A.; Williams, J.; Samarin, S.; Rani, M. Heterojunction formation in In2O3–NiO nanocomposites: Towards high specific capacitance. J. Alloys Compd. 2020, 842, 155840. [Google Scholar] [CrossRef]
- Mu, D.; Chen, Z.; Shi, H.; Tan, N. Construction of flower-like MoS2/Fe3O4/rGO composite with enhanced photo-Fenton like catalyst performance. RSC Adv. 2018, 8, 36625–36631. [Google Scholar] [CrossRef] [PubMed]
- Pua, F.L.; Chia, C.H.; Zakari, S.; Liew, T.K.; Yarmo, M.A.; Huang, N.M. Preparation of transition metal sulfide nanoparticles via hydrothermal route. Sains Malays. 2010, 39, 243–248. [Google Scholar]
- Ikram, M.; Raza, A.; Ahmad, S.O.A.; Ashfaq, A.; Akbar, M.U.; Imran, M.; Maqbool, M. Solar-Triggered Engineered 2D-Materials for Environmental Remediation: Status and Future Insights. Adv. Mater. Interfaces 2023, 10, 2202172. [Google Scholar] [CrossRef]
- Yu, X.Y.; Hu, H.; Wang, Y.; Chen, H.; Lou, X.W. Ultrathin MoS2 nanosheets supported on N-doped carbon nanoboxes with enhanced lithium storage and electrocatalytic properties. Angew. Chem. 2015, 127, 7503–7506. [Google Scholar] [CrossRef]
- Jo, W.K.; Selvam, N.C.S. Fabrication of photostable ternary CdS/MoS2/MWCNTs hybrid photocatalysts with enhanced H2 generation activity. Appl. Catal. A Gen. 2016, 525, 9–22. [Google Scholar] [CrossRef]
- Santos, R.K.; Martins, T.A.; Silva, G.N.; Conceição, M.V.; Nogueira, I.C.; Longo, E.; Botelho, G. Ag3PO4/NiO composites with enhanced photocatalytic activity under visible light. ACS Omega 2020, 5, 21651–21661. [Google Scholar] [CrossRef]
- El-Khawaga, A.M.; Tantawy, H.; Elsayed, M.A.; Abd El-Mageed, A.I. Synthesis and applicability of reduced graphene oxide/porphyrin nanocomposite as photocatalyst for waste water treatment and medical applications. Sci. Rep. 2022, 12, 17075. [Google Scholar] [CrossRef]
- Wang, J.C.; Jia, Z.; Liang, S.X.; Qin, P.; Zhang, W.C.; Wang, W.M.; Sercombbe, T.B.; Zhang, L.C. Fe73.5Si13.5B9Cu1Nb3 metallic glass: Rapid activation of peroxymonosulfate towards ultrafast Eosin Y degradation. Mater. Des. 2018, 140, 73–84. [Google Scholar] [CrossRef]
- Aguirre, A.R.; Reina, A.C.; Pérez, J.P.; Colon, G.; Malato, S. Catalysts and Photoreactors for Photocatalytic Solar Hydrogen Production: Fundamentals and Recent Developments at Pilot Scale. Photocatalytic Hydrog. Prod. Sustain. Energy 2023, 275–303. [Google Scholar]
- Kargar, F.; Bemani, A.; Sayadi, M.H.; Ahmadpour, N. Synthesis of modified beta bismuth oxide by titanium oxide and highly efficient solar photocatalytic properties on hydroxychloroquine degradation and pathways. J. Photochem. Photobiol. A Chem. 2021, 419, 113453. [Google Scholar] [CrossRef] [PubMed]
- Sayadi, M.H.; Ghollasimood, S.; Ahmadpour, N.; Homaeigohar, S. Biosynthesis of the ZnO/SnO2 nanoparticles and characterization of their photocatalytic potential for removal of organic water pollutants. J. Photochem. Photobiol. A Chem. 2022, 425, 113662. [Google Scholar] [CrossRef]
- Tolić Čop, K.; Mutavdžić Pavlović, D.; Gazivoda Kraljević, T. Photocatalytic activity of TiO2 for the degradation of anticancer drugs. Nanomaterials 2022, 12, 3532. [Google Scholar] [CrossRef] [PubMed]
- Sayadi, M.H.; Homaeigohar, S.; Rezaei, A.; Shekari, H. Bi/SnO2/TiO2-graphene nanocomposite photocatalyst for solar visible light–induced photodegradation of pentachlorophenol. Environ. Sci. Pollut. Res. 2021, 28, 15236–15247. [Google Scholar] [CrossRef] [PubMed]
 peaks for In2O3).
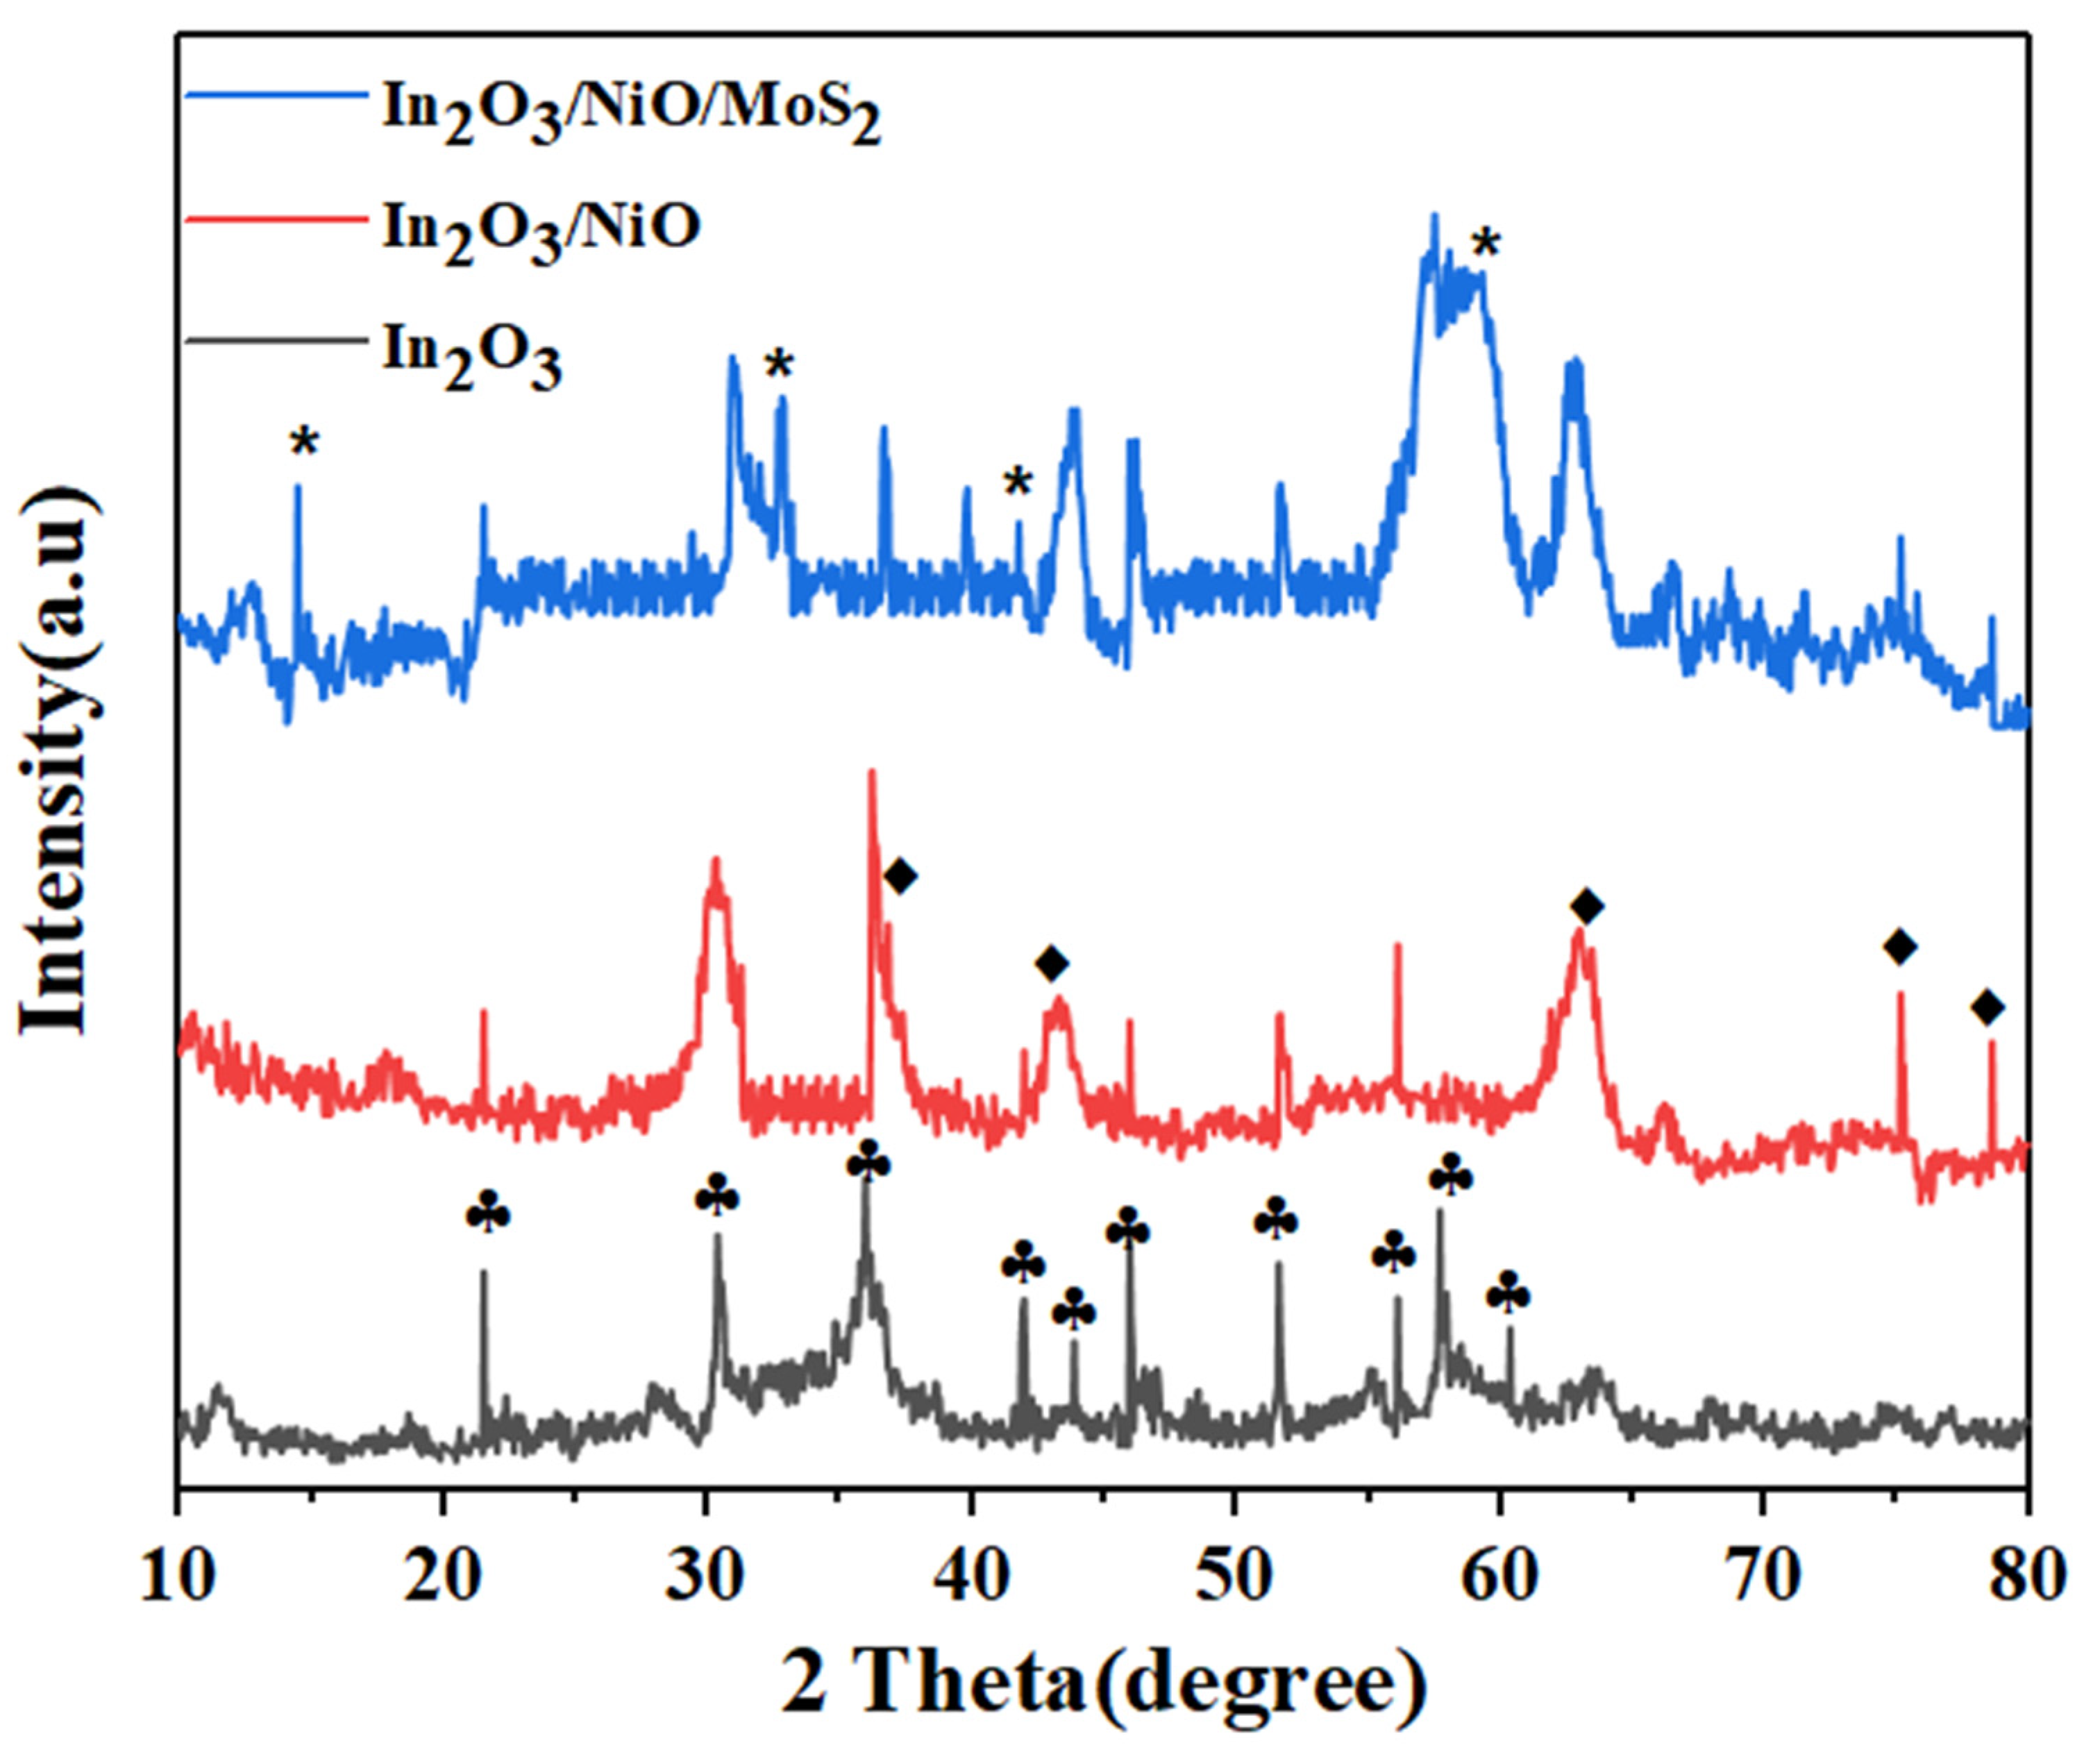


| Con. IMA (mg/L) | R2 | K (min−1) | Equation |
|---|---|---|---|
| 10 | 0.9858 | 0.0217 | Y = 0.0217x + 1.8863 |
| 20 | 0.9764 | 0.0195 | Y = 0.0195x + 1.3779 |
| 30 | 0.9772 | 0.0118 | Y = 0.0118x + 1.1633 |
| 40 | 0.973 | 0.0065 | Y = 0.0065x + 0.62 |
| 50 | 0.9658 | 0.0045 | Y = 0.0045x + 0.3585 |
| Con. FU-5 (mg/L) | R2 | K (min−1) | Equation |
| 10 | 0.9734 | 0.0192 | Y = 0.0192x + 1.66 |
| 20 | 0.9819 | 0.0143 | Y = 0.0143x + 1.4476 |
| 30 | 0.9811 | 0.0093 | Y = 0.0093x + 1.1024 |
| 40 | 0.9833 | 0.0077 | Y = 0.0077x + 0.6302 |
| 50 | 0.9179 | 0.0039 | Y = 0.0039x + 0.292 |
Disclaimer/Publisher’s Note: The statements, opinions and data contained in all publications are solely those of the individual author(s) and contributor(s) and not of MDPI and/or the editor(s). MDPI and/or the editor(s) disclaim responsibility for any injury to people or property resulting from any ideas, methods, instructions or products referred to in the content. |
© 2023 by the authors. Licensee MDPI, Basel, Switzerland. This article is an open access article distributed under the terms and conditions of the Creative Commons Attribution (CC BY) license (https://creativecommons.org/licenses/by/4.0/).
Share and Cite
Khashi, N.; Sayadi, M.H. In2O3/NIO/MOS2 Composite as a Novel Photocatalytic towards Imatinib and 5-Fluorouracil Degradation. Water 2023, 15, 3263. https://doi.org/10.3390/w15183263
Khashi N, Sayadi MH. In2O3/NIO/MOS2 Composite as a Novel Photocatalytic towards Imatinib and 5-Fluorouracil Degradation. Water. 2023; 15(18):3263. https://doi.org/10.3390/w15183263
Chicago/Turabian StyleKhashi, Nasirodin, and Mohammad Hossein Sayadi. 2023. "In2O3/NIO/MOS2 Composite as a Novel Photocatalytic towards Imatinib and 5-Fluorouracil Degradation" Water 15, no. 18: 3263. https://doi.org/10.3390/w15183263
APA StyleKhashi, N., & Sayadi, M. H. (2023). In2O3/NIO/MOS2 Composite as a Novel Photocatalytic towards Imatinib and 5-Fluorouracil Degradation. Water, 15(18), 3263. https://doi.org/10.3390/w15183263