


Balancing Water Ecosystem Services: Assessing Water Yield and Purification in Shanxi

Abstract
:1. Introduction
2. Methodology
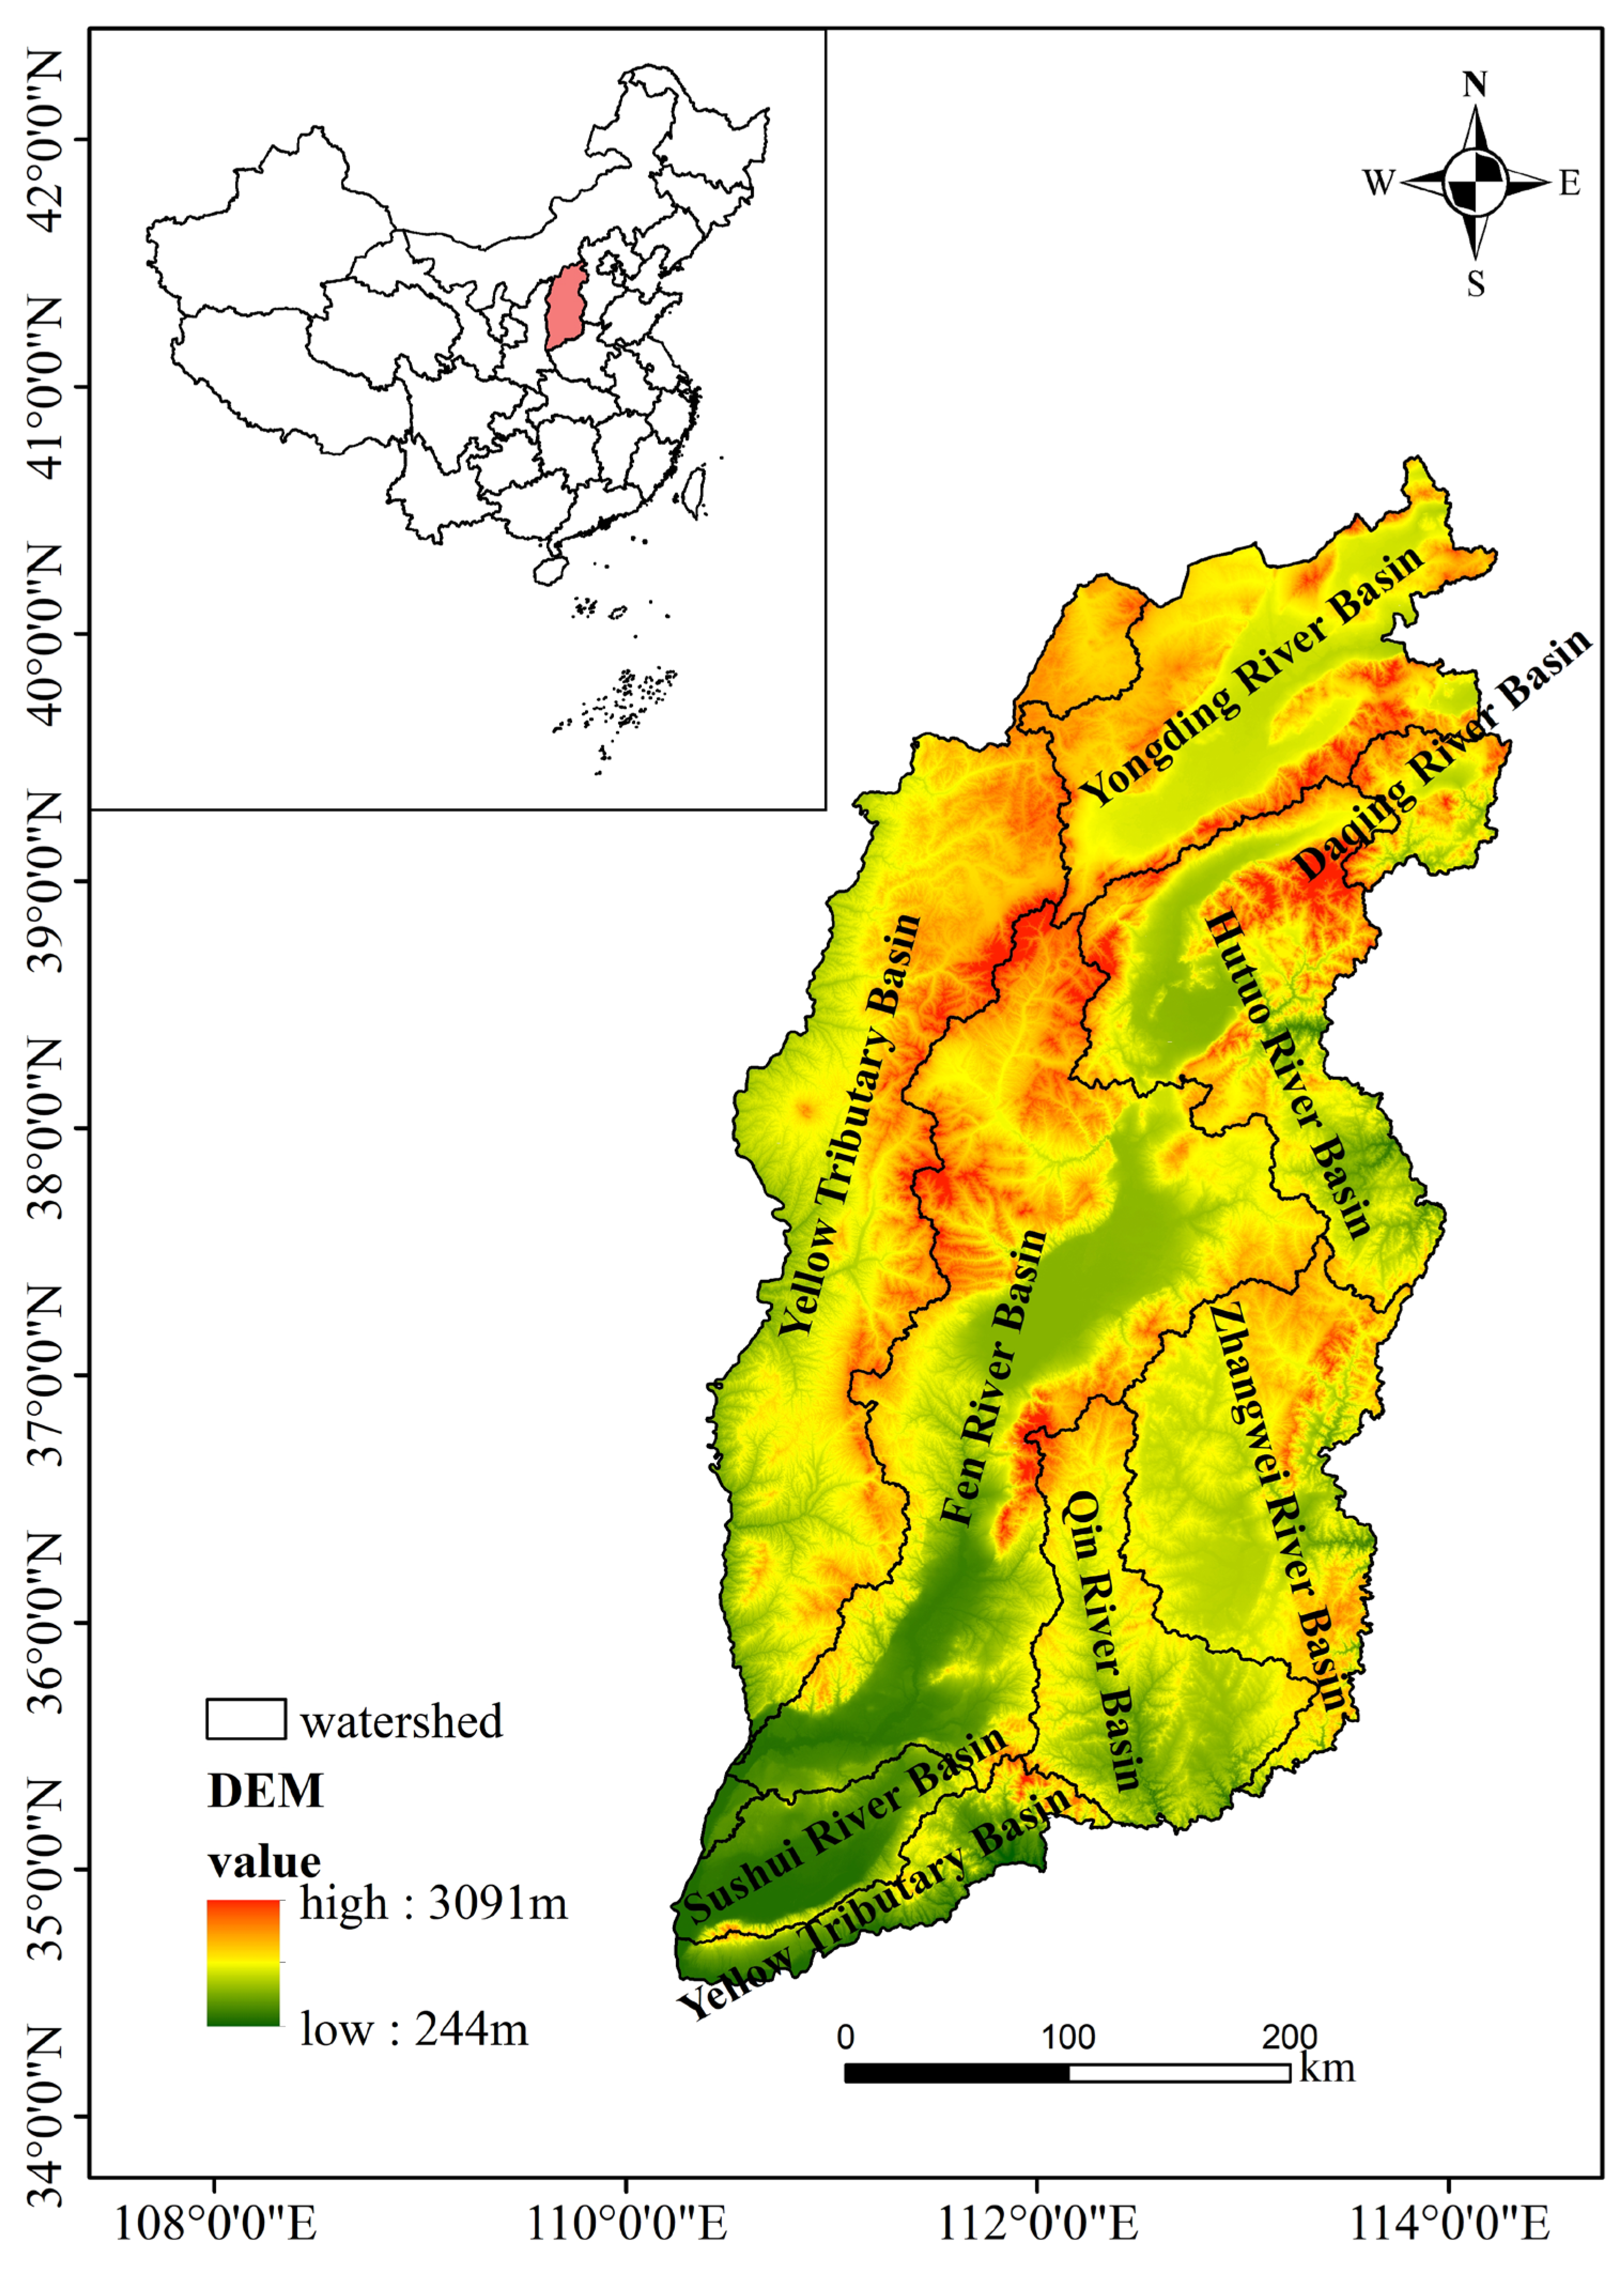
2.1. Study Area
2.2. Data Sources
2.3. Research Methodology
2.3.1. InVEST Model
- (1)
- Water yield module
- (2)
- Water purification module
2.3.2. Bivariate Spatial Correlation Model
2.3.3. PLUS Model
3. Results and Discussion
3.1. Changes in Water Yield in Shanxi Province from 2000 to 2020
3.1.1. Temporal Variations
3.1.2. Spatial Variations
3.2. Spatiotemporal Variation in Water Purification Services in Shanxi Province from 2000 to 2020
3.3. Spatial Matching Analysis of Water Yield and Purification Services
3.4. Characterization of Water Yield and Purification Services under Different Scenarios for 2030
4. Conclusions and Discussion
4.1. Conclusions
- The differences in the average water yield of the different land-use types in Shanxi Province were as follows: unutilized land > constructed land > grassland > cultivated land > woodland > waters. Temporally, the water yield of Shanxi Province from 2000 to 2020 can be characterized by an N shape. Affected by land-use change and climatic change, the lowest water yield (265.27 mm) occurred in 2015, and the highest (375.80 mm) was in 2020, showing a change of 110.53 mm; from 2000 to 2020, the water yield of Shanxi Province changed by 78.8 mm. Spatially, the water yield mainly exhibited characteristics of low spatial differentiation in the middle and northwest and high spatial differentiation in the southeast.
- The water purification capacities of different land-use types were as follows: arable land > construction land > unutilized land > grassland > woodland > waters. Spatially, the areas with lower water purification capacities were mainly distributed in the south-central part of the Yellow River Basin and the northern and southeastern parts of the Haihe River Basin, whereas those with higher water purification capacities were mainly distributed in the southeastern part of the Yellow River Basin as well as in the Lvliangshan Mountain area. Due to the implementation of environmental protection policies and the improvement of the technical level, the nitrogen load was the highest (0.97 kg/hm2) in 2000 because of its large arable land area and high usage rate of pesticide fertilizers. In contrast, the nitrogen load was the lowest in 2015 (0.94 kg/hm2).
- From 2000 to 2020, a significant and expanding trade-off occurred between the water yield and water purification services in Shanxi Province. The Hutuo River Basin, Zhangwei River Basin, southern part of the Yellow Tributary Basin, and Fenhe River Basin were primarily “high-low” agglomeration areas. The “low-high” agglomeration areas were mainly distributed in the south-central part of the Yellow River Basin and the northern part of the Haihe River Basin.
- By 2030, the urban development scenario yielded the most water (380.53 mm), whereas the ecological protection scenario yielded the least (368.22 mm). With urban socioeconomic development and sewage treatment level improvement, the water purification capacity of Shanxi Province in 2030 is expected to be higher than that in 2020 under all three scenarios; however, the ecological protection scenario had the strongest purification capacity, with a nitrogen load of only 0.85 kg/hm2. In contrast, the urban development scenario had the weakest purification capacity (nitrogen load: 0.94 kg/hm2).
4.2. Discussion
- In the context of agricultural production, areas with low water yield in Shanxi Province, such as the Fenhe River Basin and the Sushui River Basin, should promote the popularization of water-saving technologies such as sprinkler and drip irrigation, improve the efficiency of water resource utilization, and optimize water resource management systems. Areas with wide agricultural distribution and low water purification capacity, such as the central and southern regions of the Yellow River Basin, should also reduce the use of synthetic pesticides and chemical fertilizers and support organic agriculture.
- In the context of ecosystem protection, areas with poor soil and water conservation, such as the cities of Jinzhong, Lvliang, and Yuncheng, should protect ecological forest belts (soil and water conservation forests), strengthen wind and sand control forests to reduce soil erosion and maintain soil moisture and nutrients, and protect water sources (wetlands, lakes, and rivers).
- In the context of urban development, areas with a high level of urbanization, such as the cities of Taiyuan, Datong, and Changzhi, should rationally control the scale of urban construction to reduce the discharge of nitrogenous sewage. Sewage treatments should be strengthened, and the scale of use of reclaimed water should be expanded.
Author Contributions
Funding
Data Availability Statement
Acknowledgments
Conflicts of Interest
References
- Liu, J.; Li, J.; Qin, K. Changes in land-uses and ecosystem services under multi-scenarios simulation. Sci. Total Environ. 2017, 586, 522–526. [Google Scholar] [CrossRef]
- Deng, X.; Zhao, C. Identification of Water Scarcity and Providing Solutions for Adapting to Climate Changes in the Heihe River Basin of China. Adv. Meteorol. 2014, 2014, 279173. [Google Scholar] [CrossRef]
- Li, Y.; Mi, W.; Ji, L.; He, Q.; Yang, P.; Xie, S.; Bi, Y. Urbanization and agriculture intensification jointly enlarge the spatial inequality of river water quality. Sci. Total Environ. 2023, 878, 162559. [Google Scholar] [CrossRef] [PubMed]
- Ban, Y.; Liu, X.; Yin, Z.; Li, X.; Yin, L.; Zheng, W. Effect of urbanization on aerosol optical depth over Beijing: Land use and surface temperature analysis. Urban Clim. 2023, 51, 101655. [Google Scholar] [CrossRef]
- Chen, J.C.; Zhao, Z.; Wang, J.Y. Research on the essence and practical significance of the “Two Mountains Theory”. For. Econ. 2020, 42, 3–13. [Google Scholar] [CrossRef]
- Bojie, F.; Guoyi, Z.; Yongfei, B.; Changchun, S.; Jiyuan, L.; Huiyuan, Z.; Yihe, L.; Hua, Z.; Gaodi, X. Functions and ecological security of major terrestrial ecosystems in China. Prog. Earth Sci. 2009, 24, 571–576. [Google Scholar]
- Dai, E.; Wang, X.; Zhu, J. Progress and trend prospect of ecosystem service trade-off/synergy research. Adv. Earth Sci. 2015, 30, 1250–1259. [Google Scholar]
- Costanza, R.; Darge, R.; Groot, R. The value of the world’s ecosystem services and natural capital. Nature 1997, 387, 253–260. [Google Scholar] [CrossRef]
- Zhang, B.; Li, W.H.; Xie, G.D.; Xiao, Y. Water conservation function and measurement method of forest ecosystem. J. Ecol. 2009, 28, 6. [Google Scholar]
- Cheng, X.; Chen, L.; Sun, R. An improved export coefficient model to estimate non-point source phosphorus pollution risks under complex precipitation and terrain conditions. Environ. Sci. Pollut. Res. 2018, 25, 20946–20955. [Google Scholar] [CrossRef]
- Xie, Y.C.; Gong, J.; Qi, S.S. Spatial-temporal differentiation of water supply services in Bailongjiang River Basin based on InVEST model. J. Nat. Resour. 2017, 32, 1337–1347. [Google Scholar] [CrossRef]
- Aryal, S.K.; Ashbolt, S.; Mcintosh, B.S. Assessing and Mitigating the Hydrological Impacts of Urbanisation in Semi-Urban Catchments Using the Storm Water Management Model. Water Resour. Manag. 2016, 30, 5437–5454. [Google Scholar] [CrossRef]
- Nong, X.; Lai, X.; Chen, L.; Shao, D.; Zhang, C.; Liang, J. Prediction modelling framework comparative analysis of dissolved oxygen concentration variations using support vector regression coupled with multiple feature engineering and optimization methods: A case study in China. Ecol. Indic. 2023, 146, 109845. [Google Scholar] [CrossRef]
- Wang, W.; Chen, L.; Shen, Z. Dynamic export coefficient model for evaluating the effects of environmental changes on non-point source pollution-Science Direct. Sci. Total Environ. 2020, 747, 141164. [Google Scholar] [CrossRef]
- Zhang, F.P.; Li, X.J.; Feng, Q. Water conservation in the upper reaches of Heihe River Basin based on InVEST model. Chin. Desert 2018, 38, 9. [Google Scholar]
- Ran, C.; Wang, S.; Bai, X. Trade-Offs and Synergies of Ecosystem Services in Southwestern China. J. Environ. Eng. Sci. 2020, 37, 669–678. [Google Scholar] [CrossRef]
- Gao, J.; Li, F.; Gao, H. The impact of land-use change on water-related ecosystem services: A study of the Guishui River Basin, Beijing, China. J. Clean. Prod. 2015, 163, S148–S155. [Google Scholar] [CrossRef]
- Redhead, J.W.; Stratford, C.; Sharps, K. Empirical validation of the InVEST water yield ecosystem service model at a national scale. Sci. Total Environ. 2016, 569–570, 1418–1426. [Google Scholar] [CrossRef] [PubMed]
- Daneshi, A.; Brouwer, R.; Najafinejad, A. Modelling the impacts of climate and land use change on water security in a semi-arid forested watershed using InVEST. J. Hydrol. 2021, 593, 125621. [Google Scholar] [CrossRef]
- Bejagam, V.; Keesara, V.R.; Sridhar, V. Impacts of climate change on water provisional services in Tungabhadra basin using InVEST Model. River Res. Appl. 2021, 38, 106–194. [Google Scholar] [CrossRef]
- Li, Y.L.; He, Y.; Liu, W.Q.; Jia, L.P.; Zhang, Y.R. Evaluation and Prediction of Water Yield Services in Shaanxi Province, China. Forests 2023, 14, 229. [Google Scholar] [CrossRef]
- Chen, Z.Y.; Yu, P.H.; Chen, Y.Y. Spatial-temporal evolution of water production and water purification services in the Han River Basin under shared socio-economic pathway. Chin. J. Eco-Agric. 2021, 29, 1800–1814. [Google Scholar] [CrossRef]
- Li, Z.B.; Tao, Y.; Ou, W.X. Research on the relationship between supply and demand of aquatic ecological services in Taihu Lake Basin and multi-scenario assessment based on water quantity and water quality. Acta Ecol. Sin. 2023, 5, 2088–2100. [Google Scholar] [CrossRef]
- Pan, H.H.; Wang, J.Q.; Du, Z.Q.; Wu, Z.T.; Zhang, H.; Ma, K.M. Spatiotemporal evolution of ecosystem services and its potential drivers in coalfields of Shanxi Province, China. Ecol. Indic. 2023, 148, 110109. [Google Scholar] [CrossRef]
- Wang, J.; Li, Y.; Wang, S.; Li, Q.; Li, L.; Liu, X. Assessment of Multiple Ecosystem Services and Ecological Security Pattern in Shanxi Province, China. Int. J. Environ. Res. Public Health 2023, 20, 4819. [Google Scholar] [CrossRef] [PubMed]
- Yang, Z.; Zhan, J.; Wang, C. Coupling coordination analysis and spatiotemporal heterogeneity between sustainable development and ecosystem services in Shanxi Province, China. Sci. Total Environ. 2022, 836, 155625. [Google Scholar] [CrossRef]
- Liang, X.; Guan, Q.; Clarke, K.C. Understanding the drivers of sustainable land expansion using a patch-generating land use simulation (PLUS) model: A case study in Wuhan, China. Comput. Environ. Urban. Syst. 2021, 85, 101569. [Google Scholar] [CrossRef]
- Yin, L.; Wang, L.; Li, T.; Lu, S.; Yin, Z.; Liu, X.; Zheng, W. U-Net-STN: A Novel End-to-End Lake Boundary Prediction Model. Land 2023, 12, 1602. [Google Scholar] [CrossRef]
- Ferreira, M.R.; Almeida, A.M.; Quintela-Sabarís, C.; Roque, N.; Fernandez, P.; Ribeiro, M.M. The role of littoral cliffs in the niche delimitation on a microendemic plant facing climate change. PLoS ONE 2021, 16, e0258976. [Google Scholar] [CrossRef] [PubMed]
- Gao, L.N.; Tao, F.; Liu, R.R. Multi-scenario simulation and ecological risk analysis of land use based on the PLUS model: A case study of Nanjing. Sustain. Cities Soc. 2022, 85, 104055. [Google Scholar] [CrossRef]
- Li, J.; Yang, D.H.; Wu, F.Z. Dynamic simulation of land use change and carbon storage assessment in Kunming City based on PLUS and InVEST models. Bull. Soil. Water Conserv. 2023, 43, 378–387. [Google Scholar] [CrossRef]
- Yang, Y.; Liu, L.; Zhang, P.; Wu, F.; Wang, Y.; Xu, C.; Kuzyakov, Y. Large-scale ecosystem carbon stocks and their driving factors across Loess Plateau. Carbon Neutrality 2023, 2, 5. [Google Scholar] [CrossRef]
- Zhu, G.; Liu, Y.; Shi, P.; Jia, W.; Zhou, J.; Liu, Y.; Zhao, K. Stable water isotope monitoring network of different water bodies in Shiyang River basin, a typical arid river in China. Earth Syst. Sci. Data 2023, 14, 3773–3789. [Google Scholar] [CrossRef]
- Wang, X.Z.; Wu, J.Z.; Wu, P.X. Spatial-temporal distribution and trade-off/synergy of water conservation, soil conservation and NPP services in Loess Plateau ecosystems, 2000–2015. J. Soil Water Conserv. 2021, 35, 114–121,+128. [Google Scholar] [CrossRef]
- Su, C.H.; Wang, Y.L. Changes and driving factors of ecosystem services in the upper reaches of the Fenhe River Basin. Acta Ecol. Sin. 2018, 38, 7886–7898. [Google Scholar]
- Wu, B.; Quan, Q.; Yang, S.; Dong, Y. A social-ecological coupling model for evaluating the human-water relationship in basins within the Budyko framework. J. Hydrol. 2023, 619, 129361. [Google Scholar] [CrossRef]
- Budyko, M.I. Climate and Life; Academic Press: New York, NY, USA, 1974. [Google Scholar] [CrossRef]
- Zhang, L.; Dawes, W.R.; Walker, G.R. Response of mean annual evapotranspiration to vegetation changes at catchment scale. Water Resour. Res. 2001, 37, 701–708. [Google Scholar] [CrossRef]
- Li, W.; Zhao, Z.L.; Lv, S.S. Spatial and temporal differentiation of water purification function based on InVEST model. J. Irrig. Drain. 2022, 41, 105–113. [Google Scholar] [CrossRef]
- Ou, Y.X.; Zhu, X.; He, Q.Y. Spatial interaction between urbanization and ecosystem services: A case study of Changzhutan urban agglomeration. Acta Ecol. Sin. 2019, 39, 12. [Google Scholar] [CrossRef]
- Ren, Z.Z.; Chen, W.J.; Kang, H.T.; Li, X.; Zhang, X.; Wang, K. Research on threshold measurement method of influencing factors of safety vulnerability in traffic-intensive waters based on SD model. Saf. Environ. Eng. 2023, 30, 9–17. [Google Scholar] [CrossRef]
- Zhang, F.; Zhan, J.; Zhang, Q. Impacts of land use/cover change on terrestrial carbon stocks in Uganda. Phys. Chem. Earth Parts A/B/C 2017, 101, 195–203. [Google Scholar] [CrossRef]
- Zhang, M.F.; Liu, W.X.; Wang, J.N. Scenario simulation of ecosystem service value change in Dongguan section of Shima River Basin based on Clue-S model. Bull. Soil. Water Conserv. 2021, 41, 152–160. [Google Scholar] [CrossRef]
- Yang, J.; Xie, B.P.; Zhang, D.G. Spatial-temporal variation of carbon storage in the Yellow River Basin based on InVEST and CA-Markov models. Chin. J. Eco-Agric. 2021, 29, 1018–1029. [Google Scholar] [CrossRef]
- Ji, Q.Q.; Pan, Q.Q.; Wu, S.R. The spatial reconstruction of “three lives” and the impact of precipitation changes on water production services in the Yellow River Basin of Shanxi Province. Arid. Zone Res. 2023, 40, 132–142. [Google Scholar] [CrossRef]
- Peng, Y.Y.; Liu, Y.; Gao, Q.Q. Change characteristics of clouds in China in the summer of El Niño and their relationship with precipitation. Acta Meteorol. Sin. 2022, 80, 701–720. [Google Scholar] [CrossRef]
- Yin, Z.; Liu, Z.; Liu, X.; Zheng, W.; Yin, L. Urban heat islands and their effects on thermal comfort in the US: New York and New Jersey. Ecol. Indic. 2023, 154, 110765. [Google Scholar] [CrossRef]
- Shang, M.; Luo, J. The Tapio Decoupling Principle and Key Strategies for Changing Factors of Chinese Urban Carbon Footprint Based on Cloud Computing. Int. J. Environ. Res. Public. Health 2021, 18, 2101. [Google Scholar] [CrossRef]
- Zhang, C.L.; Zhao, J.B.; Niu, J.J. Study on Warming and Drying Climate of Shanxi Loess Plateau in Recent 50 Years. J. Arid. Land. Resour. Environ. 2008, 22, 70–74. [Google Scholar] [CrossRef]
- Yao, Y.B.; Wang, Y.R.; Li, Y.H. Climate warming and drying of the Loess Plateau in China and its impact on the ecological environment. Resour. Sci. 2005, 27, 146–152. [Google Scholar] [CrossRef]


| Categorization | Data Type | Data Sources and Processing |
|---|---|---|
| Meteorological elements | Measured quantity of rain | Data Center for Resource and Environmental Sciences, Chinese Academy of Sciences (http://www.resdc.cn) |
| Temperatures | ||
| Potential evapotranspiration | National Meteorological Information Center-China Meteorological Data Network (http://www.cma.cn) | |
| Natural environment | DEM | Geospatial Data Cloud (http://www.gscloud.cn) |
| Slope | Calculated from DEM data in ArcGIS to get | |
| Soil features | Soil data | Chinese soil information in the World Soil Database (HWSD) |
| Socioeconomic | GDP | Data Center for Resource and Environmental Sciences, Chinese Academy of Sciences (http://www.resdc.cn) |
| Demographic | ||
| Land use | Land-use type | |
| Road information | Distance to the first level of road | National Geographic Information Resources Catalog Service System (http://www.servicetianditu.gov.cn) |
| Distance to secondary roads | ||
| Distance to tertiary roads | ||
| Distance to highway | ||
| Distance to railroad | ||
| Distance to Government |
| Land-Use Type | Actual Evapotranspiration Assignment | Depth of Root System (mm) | Plant Evapotranspiration Coefficient | Nitrogen Load Factor | Nitrogen Interception Efficiency |
|---|---|---|---|---|---|
| Arable land | 1 | 350 | 0.75 | 18.23 | 0.4 |
| Woodland | 1 | 2500 | 0.93 | 3.45 | 0.75 |
| Grassland | 1 | 750 | 0.63 | 8.02 | 0.5 |
| Waters | 0 | 1 | 1 | 0.01 | 0.05 |
| Construction land | 0 | 1 | 0.25 | 11.03 | 0.05 |
| Unused land | 1 | 20 | 0.4 | 9.83 | 0.05 |
| Scenario Setting | Land-Use Type | Arable Land | Woodland | Grassland | Waters | Construction Land | Unused Land |
|---|---|---|---|---|---|---|---|
| Natural Development cenario | Arable land | + | − | + | + | − | + |
| Woodland | − | + | + | − | − | + | |
| Grassland | + | + | + | + | − | + | |
| Waters | − | − | + | + | − | + | |
| Construction Land | + | − | + | − | + | + | |
| Unused land | + | + | + | + | − | + | |
| Urban Development Scenario | Arable land | + | + | + | − | − | + |
| Woodland | − | + | − | + | + | + | |
| Grassland | − | − | + | + | + | + | |
| Waters | − | − | − | + | − | + | |
| Construction Land | + | + | + | + | + | + | |
| Unused land | + | + | − | − | − | + | |
| Ecological Protection Scenario | Arable land | + | − | − | − | − | + |
| Woodland | + | + | + | − | − | + | |
| Grassland | + | − | + | − | − | + | |
| Waters | + | − | + | + | − | + | |
| Construction Land | + | − | − | − | + | + | |
| Unused land | + | − | − | − | − | + |
| Watershed | Year | 2000 | 2005 | 2010 | 2015 | 2020 |
|---|---|---|---|---|---|---|
| Yellow River Basin | Fen River Basin | 278.9 | 291.27 | 268.68 | 245.49 | 385.57 |
| Yellow Tributary Basin | 281.75 | 300.44 | 315.34 | 298.05 | 362.45 | |
| Sushui River Basin | 281.44 | 319.17 | 321.27 | 327.17 | 335.06 | |
| Qin River Basin | 370.53 | 406.94 | 304.93 | 289.52 | 403.08 | |
| Sea River Basin | Yongding River Basin | 213 | 233.73 | 283.2 | 250.43 | 267.09 |
| Hutuo River Basin | 333.32 | 287.5 | 310.45 | 284.99 | 427.41 | |
| Zhangwei River Basin | 441.03 | 404 | 314.29 | 276.73 | 435.6 | |
| Daqing River Basin | 300.44 | 326.42 | 341.76 | 320.76 | 401.76 |
| Norm | 2000 | 2005 | 2010 | 2015 | 2020 |
|---|---|---|---|---|---|
| Moran’s I | −0.201 | −0.204 | −0.273 | −0.216 | −0.335 |
| p-value | 0.002 | 0.003 | 0.005 | 0.004 | 0.003 |
| Ecosystems/Year | 2000 | 2005 | 2010 | 2015 | 2020 | Natural Development | Urban Development | Ecological Protection |
|---|---|---|---|---|---|---|---|---|
| Water yield (mm) | 297.01 | 299.39 | 294.06 | 265.27 | 375.81 | 372.19 | 380.53 | 368.22 |
| Nitrogen loading (kg/hm2) | 0.97 | 0.96 | 0.95 | 0.94 | 0.95 | 0.91 | 0.94 | 0.85 |
Disclaimer/Publisher’s Note: The statements, opinions and data contained in all publications are solely those of the individual author(s) and contributor(s) and not of MDPI and/or the editor(s). MDPI and/or the editor(s) disclaim responsibility for any injury to people or property resulting from any ideas, methods, instructions or products referred to in the content. |
© 2023 by the authors. Licensee MDPI, Basel, Switzerland. This article is an open access article distributed under the terms and conditions of the Creative Commons Attribution (CC BY) license (https://creativecommons.org/licenses/by/4.0/).
Share and Cite
Li, M.; Li, S.; Liu, H.; Zhang, J. Balancing Water Ecosystem Services: Assessing Water Yield and Purification in Shanxi. Water 2023, 15, 3261. https://doi.org/10.3390/w15183261
Li M, Li S, Liu H, Zhang J. Balancing Water Ecosystem Services: Assessing Water Yield and Purification in Shanxi. Water. 2023; 15(18):3261. https://doi.org/10.3390/w15183261
Chicago/Turabian StyleLi, Man, Shanshan Li, Huancai Liu, and Junjie Zhang. 2023. "Balancing Water Ecosystem Services: Assessing Water Yield and Purification in Shanxi" Water 15, no. 18: 3261. https://doi.org/10.3390/w15183261
APA StyleLi, M., Li, S., Liu, H., & Zhang, J. (2023). Balancing Water Ecosystem Services: Assessing Water Yield and Purification in Shanxi. Water, 15(18), 3261. https://doi.org/10.3390/w15183261