Article

Water Mass Transport Changes through the Venice Lagoon Inlets from Projected Sea-Level Changes under a Climate Warming Scenario

1
Alfred Wegener Institute, Helmholtz Centre for Polar and Marine Research, 27570 Bremerhaven, Germany
2
Alfred Wegener Institute, Helmholtz Centre for Polar and Marine Research, 25992 List/Sylt, Germany
3
Department of Environmental Sciences, Informatics and Statistics, Ca’ Foscari University of Venice, 30172 Mestre, Italy
*
Author to whom correspondence should be addressed.
Water 2023, 15(18), 3221; https://doi.org/10.3390/w15183221
Submission received: 27 July 2023 / Revised: 28 August 2023 / Accepted: 5 September 2023 / Published: 10 September 2023
(This article belongs to the Section Water and Climate Change)

Abstract

:
In this study, an ensemble of numerical simulations with a state-of-the-art hydrodynamic model for coastal applications is used to characterize, for the first time, the expected mid-21st-century changes in circulation and associated sea-level height inside the Venice lagoon induced by projected Mediterranean sea level rise and atmospheric circulation changes over the Adriatic Sea under the RCP8.5 emission scenario. Our results show that water transports through the three inlets connecting the Venice lagoon to the open sea are expected to change significantly, with consequent significant persistent alterations of the circulation and sea-level height inside the lagoon. The projected water mass redistributions motivate further studies on the implications of climate change for the lagoon environment.

1. Introduction

Venice is one of the most famous cities in the world, included in the UNESCO World Heritage list since 1987. It is built on piles in the middle of a large lagoon along the Adriatic Sea’s northern coast. Hazardous climate and weather events cause wide-ranging impacts across the lagoonal ecosystem and landscapes [1]. Venice’s historical center constitutes a unique cultural heritage, which is particularly exposed to changes in the local relative sea level. In fact, its lowest parts (e.g., the famous St. Mark Square) lie about a few tens of centimeters above the sea surface; consequently, flooding episodes in these areas are extremely frequent during the year. Moreover, when adverse meteorological conditions combine with the tidal flood, a wider portion of the city center is flooded, especially during the fall season [2,3,4]. To prevent extreme flooding in that area, mobile barriers (the Modulo Sperimentale Elettromeccanico, MoSE, system) have been built at the lagoon’s three inlets [5,6]. In this way, seawater inflows into the lagoon are limited during extreme surge events [2,3,4].
A significant increase in the frequency and severity of floods has been recorded in the course of the past 150 years, driven mainly by subsidence and mean sea-level rise [2,3]. Current projections of relative sea-level rise are expected to cause a further worsening of flooding statistics in the course of the 21st century [2,7] requiring longer closures of the inlets [6]. However, such projections do not explicitly consider projected changes in atmospheric forcing, which is just accounted for in terms of uncertainty affecting projected relative sea-level changes [7].
Moreover, sea level rise alters the water transport through the lagoon’s inlets, thereby affecting circulation inside the lagoon and generating spatial heterogeneity in sea-surface height (SSH) as well as inducing modifications in biogeochemical and sedimentary processes [8,9,10]. However, these critical aspects of the lagoon ecosystem functioning have not been addressed in the context of projected changes within a comprehensive modeling framework including projected atmospheric and hydrodynamical variations. For this type of study, numerical models specifically designed to solve the dynamic processes in coastal areas, like tides and wetting-drying mechanisms, fueled by well-constrained atmospheric and oceanic boundary forcing are required.
Research in this regard is motivated by the fact that whereas the historical mean sea-level rise is rather homogeneous in the Adriatic Sea, smaller values are observed in its northern portion [11] and a strong variability in sea circulation is observed in the proximity of the Venice lagoon [12]. In addition, projections indicate, for the next decades, a weakening of dominant winds over the Adriatic Sea, especially those associated with intense storm surges and flooding in Venice [13]. The impacts on lagoonal hydrodynamics of this expected future dampening of atmospheric forcing concurrently with a rise in the Mediterranean mean sea level remains unexplored. Here, we use for the first time an ensemble of numerical simulations with the state-of-the-art FESOM-C hydrodynamic model for coastal applications to explore the impacts on the Venice Lagoon circulation of mid-21st-century projected Mediterranean mean sea-level rise and regional atmospheric circulation changes.
The paper is organized as follows: In Section 2, the study site is described. In Section 3, the numerical experiments and the model setup, including the surface and open boundary conditions applied, are described. The results are reported and discussed in Section 4, and summarised in Section 5.

2. Study Site

The city of Venice is situated inside the homonymous lagoon on the northwestern edge of the Adriatic Sea, a semi-enclosed basin in the Eastern Mediterranean Sea, about 780 km long and 120–200 km wide [14] (Figure 1a). The water depth is shallow in the Northern Adriatic, while it reaches 1200 m in the southern portion of the basin.
The lagoon exchanges sea water with the Adriatic Sea through three inlets: Lido, Malamocco, and Chioggia. They are 500 to 1000 m wide and up to 25 m deep. The average depth in the lagoon is about 1.5 m, but in some areas, it can be lower than 0.8 m; deep tidal channels cross the shallow regions (Figure 1b). Marshes cover about 15% of the total area. The historical city center is formed by more than 100 small islands with an average elevation of less than 1 m above the mean sea level and about 160 channels with depths of about 1–5 m. The Grand Canal is the main watercourse.
The tidal regime is coherent with tidal fluctuations in the Mediterranean Sea, forced through the Strait of Otranto and amplified along the longitudinal direction of the Adriatic Sea. The length of the basin and the average speed of barotropic shallow-water waves combine so that the periods of free oscillations are close to those of the diurnal and semidiurnal tides. As a consequence, the basin is close to resonant conditions which cause the astronomical tidal range in the Northern Adriatic to be about 1 m at its coast, which is relevant for Venice flooding [14,15,16].
Table 1. Simulated amplitudes and phases for each considered site along the Adriatic coast (see Figure 1a) and vectorial difference d between them and the corresponding observed values reported by Tsimplis et al. [17]. In the last row, the RMS values are reported. S.A.I. is the acronym for Sant’Andrea Island.
SiteLATLONM2S2K1O1
Ao
(cm)
As (cm)θo (°)θs (°)d
(cm)
Ao
(cm)
As (cm)θo (°)θs (°)d
(cm)
Ao
(cm)
As (cm)θo (°)θs (°)d
(cm)
Ao
(cm)
As (cm)θo (°)θs (°)d
(cm)
Venice45°25′12°20′23.421.12592643.014.114.42652680.817.917.861416.25.64.450222.7
Bakar45°18′14°32′10.69.42082071.25.56.12.22050.913.814.948226.54.13.83842.3
Ancona43°37′13°30′6.65.03022921.93.62.73153081.01312.872426.74.23.361222.6
Split43°30′16°26′88.0100802.85.66.1100782.38.88.941124.42.72.5343561.7
S.A.I.43°02′15°46′6.86.593732.34.45.095721.96.88.454224.52.52.34241.6
Ortona42°21′14°24′6.46.164551.04.54.776581.59.78.973395.53.42.553182.0
Vieste41°53′16°11′7.98.161590.25.15.883622.14.25.065461.71.51.752250.7
Bar42°04′19°06′9.28.676612.45.65.980611.94.85.342162.31.41.7193590.6
Brindisi40°38′17°56′8.77.973651.45.25.381671.34.65.054341.71.51.643120.8
Otranto40°09′18°30′76.474651.243.982661.12.33.164361.51.01.244130.6
Lefkas38°50′20°42′44.679542.02.22.785521.51.42.11960.80.60.952540.3
Katakolo37°38′21°19′3.33.462530.51.62.065480.61.31.7610.40.50.73533470.2
Taranto40°28′17°13′6.55.271591.83.73.073591.11.82.342220.90.81.03450.5
RMS (cm) 1.31.02.81.1
Within the lagoon of Venice, the tidal wave propagates mainly along the deep channels (with an average depth of about 10 m) with a speed of about 10 m/s and expands into the shallower areas. The current speed is in general moderate, with average maximum values of up to 25 cm/s through the tidal cycle [14]. The city center elevation is very low with respect to the mean sea level. This fact has become more dramatic in the course of the past decades, due to the superposing effects of subsidence phenomena and global mean sea-level rise determining a rise in the local relative sea level (about 35 cm since 1872 [2,3,4]). This is why the lowest parts of the city center (e.g., St. Mark Square) are often flooded during the spring tide even without any noticeable meteorological contribution to the sea-surface height.
It is known that only seven tidal constituents, four semidiurnal (M2, S2, N2 and K2) and three diurnal (K1, O1 and P1), contribute significantly to the evolution of the sea surface elevation in the Northern Adriatic Sea [14]. The fact that the incoming tidal wave is amplified in the lagoon indicates that the driving and reflecting tides are close to the resonance condition [12].

3. Numerical Experiments and Model Setup

This study aims to picture changes in the sea circulation in the Venice lagoon under a future climate change scenario and account for both, sea-level rise and atmospheric circulation changes. We implemented a setup specifically designed to focus on the dynamics in the Venice lagoon area. The model we used is FESOM-C: it is the coastal sub-unit of the global Finite-volumE Sea ice Ocean Model [18]. It solves three-dimensional primitive equations in the Boussinesq, hydrostatic and traditional approximations for the momentum, continuity and density constituents. FESOM-C has already been applied in numerous idealized and realistic experiments. It is known to reliably simulate dynamics in coastal areas where the complex topology originates non-linear processes driven by the strong tidal forcing, with applications in various settings including, e.g., the North Sea [19,20], Indiga Bay [21] and Antarctic fjords [22]. The hybrid mesh capability, the terrain following vertical coordinates, the time splitting for internal/external modes and the modules specifically designed to resolve coastal processes, like the wetting-drying mechanism, make this coastal model suitable for our research.
In this study, we run the model in barotropic mode. We limited the domain to the Adriatic Sea basin to provide scenarios of sea-level rise in the Venice area by prescribing SSH changes at the open boundary located south of the Otranto Strait (see Figure 1a) and exploiting available atmospheric forcing data over the domain from historical and scenario simulations with regional downscaling.

3.1. Mesh and Bathymetry

We construct an unstructured hybrid mesh encompassing the whole Adriatic Sea and part of the Ionian Sea (Figure 1c), using the Blossom–Quad method [23] and the Gmsh mesh generator [24]. The mesh spatial resolution varies between 4 and 50 m within the Venice lagoon and around the lagoon inlets and 2000–3500 m in the open Adriatic. The mesh consists of 106,067 vertices and 103,052 elements. Bathymetry data have been retrieved from the EMODnet Bathymetry portal [25], with a resolution of about 230 m and combined with local data for the Venice lagoon [26]. Coastline data were derived from the GSHHG dataset [27].
We ran the simulations in the 2D mode. A constant coefficient of Cd = 0.003 was used for the bottom friction parameterization [18].

3.2. Experimental Design

Two ensembles with tidal, lateral-ocean and atmospheric forcing have been performed to assess the impact of Mediterranean Sea level rise combined with the modified wind field according to the RCP8.5 scenario. The simulations cover the autumn season to describe the changes in the sea circulation in the lagoon in the most dynamic period of the year.
The first ensemble (hereafter HI) includes historical simulations covering the October-December trimester for 11 years, from 2000 to 2010. The second one (SC) consists of 11 scenario simulations for the October–December period of years between 2040 and 2050. SC simulations use atmospheric forcing and ocean boundary conditions accounting for projected climate changes under the RCP8.5 emission scenario corresponding to a “business as usual” socio-economic future development. Since projections of relevant boundary conditions under different emission scenarios only start to significantly diverge in the second half of the 21st century [2,7], additional scenarios are not considered.
The experiments apply the same astronomical forcing in paired HI and SC simulations. For both atmospheric and oceanic forcing, input data for the historical simulations are used as a baseline to generate forcing input data for the scenario simulations. Hence, the same meteorological events are included in the HI and SC simulations, but they have different intensities.

3.3. Boundary Forcing

3.3.1. Atmospheric Forcing

In the HIsimulations, 10 m zonal and meridional wind components at hourly temporal resolution are obtained from hourly ERA5 reanalysis data [28,29], corrected to match in-situ measurements (hereafter, ERA5-corrected; [13]). Sea-level pressure data from the ERA5 reanalysis dataset were adapted to the post-processed winds by considering geostrophic balance. Atmospheric forcing data have the same resolution as the ERA5 original dataset, i.e., 0.25° lon × 0.25° lat.
Atmospheric forcing was scaled in the SC simulations with respect to the HI ones according to distributional changes in the wind velocity simulated by the regional climate model COSMO-CLM [30] under the IPCC RCP8.5 concentration scenario [13].

3.3.2. Open Ocean Boundary

Tidal elevation at the open boundary referring to the seven main constituents (M2, S2, N2, K2, K1, O1 and P1) were obtained from the TPXO 9 atlas [31,32,33]. TPXO 9 is a fully global model of ocean tides that best fits, in a least-squares sense, the Laplace tidal equations and altimetry data. It combines the 1/6° base global solution and the 1/30° resolution local solutions for all coastal areas, including our domain of interest. The Doodson correction of the obtained amplitudes and phases is based on the T_TIDE package [34].
In both HI and SC simulations, besides the tidal contribution, SSH at the open boundary includes storm-surge residuals obtained from the Copernicus water level change time series for the European coast dataset [35] interpolated on the grid points of the open boundary. SSH at the open boundary thus considers the contribution of atmospheric forcing outside the considered domain, which plays a crucial role during storm surge events [36]. In addition, to parametrize the inverse barometer effect (IBE) contribution, SSH changes due to the pressure systems over the domain were added at the open boundary using the expression S S H I B E = Δ P / ρ g , where the ΔP is the pressure anomaly (in mbar) with respect to the reference atmospheric pressure, ρ is a reference seawater density and g is the gravitational acceleration.
In the SC simulations, the historical oceanic lateral boundary conditions were modified to include a constant average sea-level rise of +17 cm in the 2040–2050 run with respect to the 1981–2010 climatology. The sea-level rise estimate is based on the projected sea level for the Northern Adriatic coast provided by Zanchettin et al. [2]. To avoid generating spurious effects like shockwaves, a progressive sea level rise was imposed at the open boundary at the beginning of each simulation at a 3 cm/day rate until the desired level of +17 cm was reached.

4. Results and Discussion

4.1. Model Performance and Biases

The model was validated by comparing the amplitude and phase of the four major tidal components derived from the simulation with the values retrieved from observations and reported in the literature [17]. For this purpose, a 6-month run (October 2009–March 2010) with tidal forcing alone at the open boundary was performed. The agreement between the observed and simulated values is given by the vectorial difference [37]:
d = ( A s c o s θ s A o c o s θ o   ) 2   + ( A s s i n θ s A o s i n θ o   ) 2  
where the subscripts s and o refer to simulated and observed values, respectively, A is the amplitude and θ the phase of the tidal components. The simulated values of amplitude and phase of the four major tidal components are reported in Table 1, together with the resulting values of the difference d. The observed values derive from tide gauge measurements and are provided by Tsimplis et al. [17]. For each tidal constituent j (j = 1,…,4), the root-mean-square deviation of amplitude (RMS) is defined as follows:
R M S j = 1 2 N i = 1 N d i , j 2
where the subscript i identifies each considered site reported in the table.
As can be observed in Table 1, the mean error associated with the tide components is about 1 cm for the semidiurnal M2 and S2 and the diurnal O1. On the contrary, larger differences are obtained for the diurnal K1, especially in the northern part of the basin: This bias derives mostly from the phase estimate and it could also be due to the uncertainties associated with the phase estimate in measured time series [17]. In this analysis, the Trieste datum has not been considered because of the low spatial resolution of the mesh in the proximity of its tide gauge.
The setup is specifically designed to simulate, as realistically as possible, the sea-level variability in the proximity and inside the Venice lagoon. The Centro Previsioni e Segnalazioni Maree of the city of Venice [38] provides SSH measurements for the last decades at six sites in the Venice area (Figure 1b). Among them, the Punta della Salute site in the city center (point A in Figure 1b) is well known for the historical tidal time series collected there covering the last 150 years, the longest of the entire Mediterranean Sea. The site in the open sea (point B) corresponds to the Piattaforma Acqua Alta (CNR-ISMAR), which provides meteorological and oceanographic measurements outside the Venice lagoon. The other points are located in the proximity of Burano Island (point C), the Chioggia (D) and Lido (E) inlets and Chioggia city (F). Even if data are available from further sites in the lagoon, they were not included in this study because of the large amount of missing data during the analyzed periods.
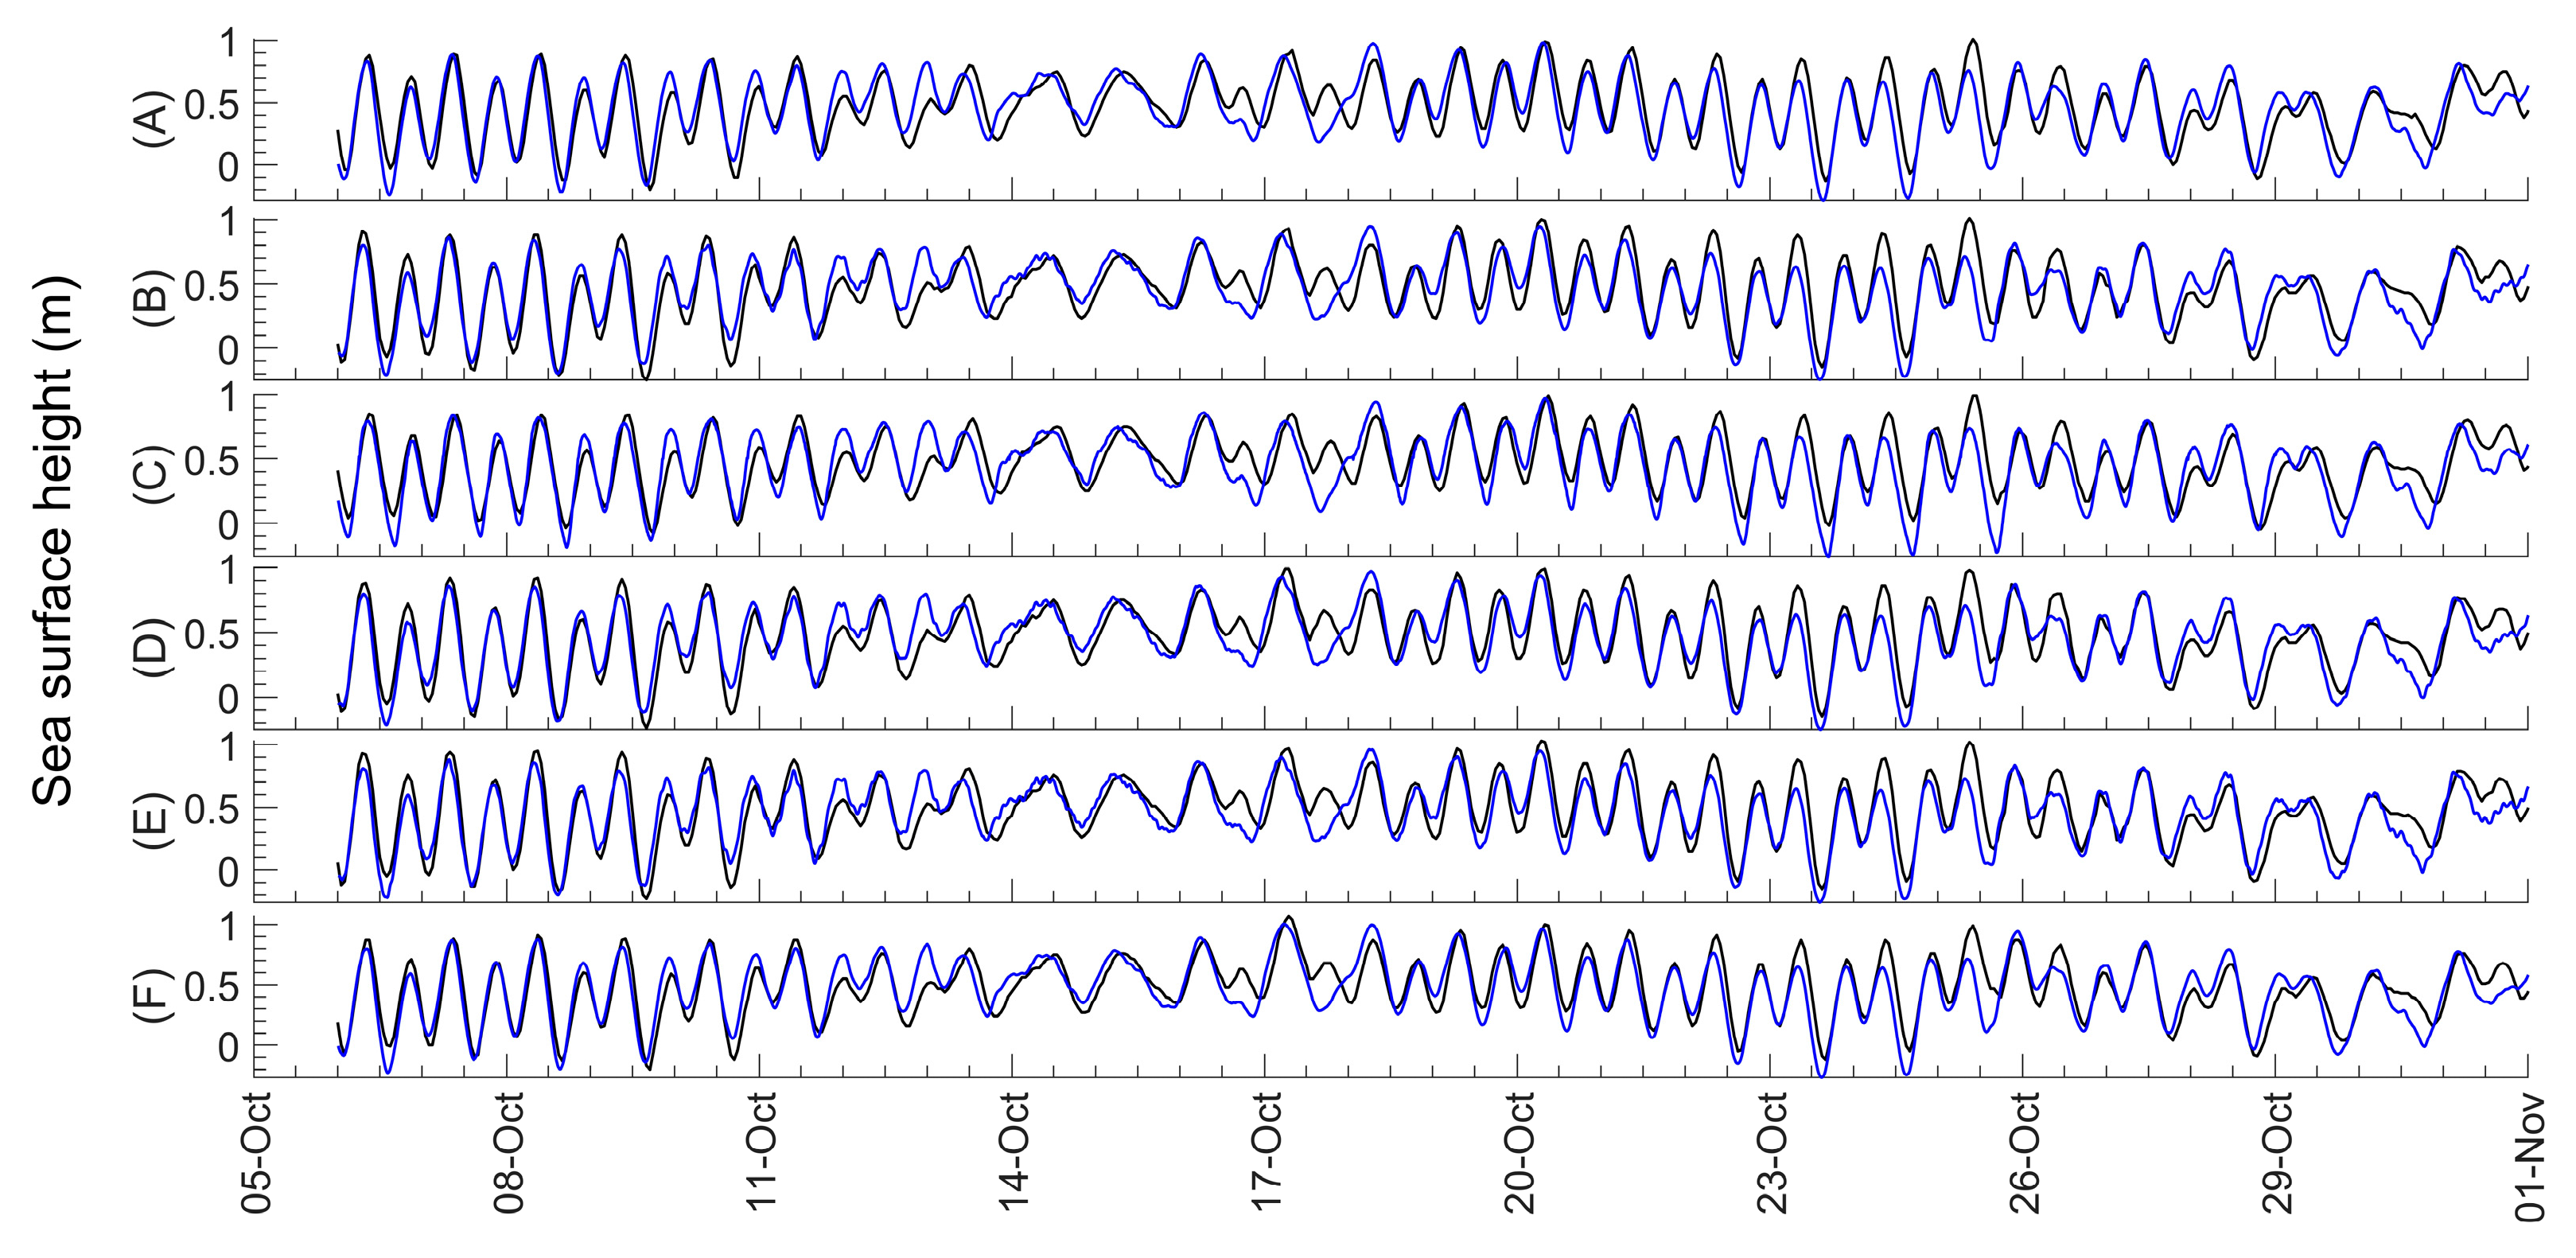
Unavoidably, the simulations are affected by biases (Figure 2), which are revealed by root-mean-square errors (RMSE) between observed and simulated sea level values, up to about 20 cm for all the cases (Table 2). The primary source of bias is the limitations of the available wind-forcing data. As mentioned in the literature, a significant underestimation of the wind over the Adriatic basin is always encountered [13,39] and, unavoidably, it characterizes the reanalysis dataset used in this study. Nevertheless, it must be taken into account that the meteorological events accounted for in both the HI and SC simulations are the same and, therefore, they are affected by the same biases.

4.2. Sea Level Rise in the Adriatic Sea and inside the Venice Lagoon

As expected for a system in a near-geostrophic equilibrium, the imposed constant sea level rise (+17 cm) at the open boundary causes an increase in the average SSH over the entire domain, which is minimal in the coastal areas of the North-Western Adriatic Sea (Figure 3a). Focusing on the Venice area (Figure 3b), the imposed changes in the SSH cause an average difference of about 1 cm between its northern and southern parts. The sea-level increase would directly imply changes in the operability of the MoSE system. As already analyzed in detail by Umgiesser et al. [6], a higher mean sea level would return more frequent and longer closures of the mobile barriers, depending on the considered scenario. They obtained that with an increase of 30 cm with respect to the reference period (2000–2002), the number of hours with SSH higher than 110 cm (which is the threshold level for critical floods in the city center, it is referred to the local zero of the SSH used in the city of Venice [6]) would be between 3 and 30 (while a maximum of 6 h over the threshold is recorded in the reference period). According to our result, using the 2000–2010 reference period, 35 h with SSH over the threshold is expected per year (limited to the October–December trimester) compared to the 4 h on average which are obtained from the HI ensemble.
Figure 3c,d illustrates distributional differences of lagoonal SSH in the HI and SC simulations: more specifically, the differences between the edges (95th and 5th percentiles, respectively) of the SSH distributions are shown. Results indicate that within the lagoon, the low waters will rise more compared to high waters, resulting in a narrowing of the 5–95 percentile range of about 1 cm. So, beyond the effect of the shift in the average, SSH extreme events are less intense in the scenario compared to the historical conditions and this result could be partly attributed to a weakening of the wind in future projections [13].

4.3. Water Mass Exchanges between the Lagoon and the Open Sea

The Venice lagoon exchanges water with the open sea through three inlets, namely, from North to South, Lido, Malamocco, and Chioggia. Tides primarily dominate the flow regime, but also the atmosphere plays a crucial role, especially during surge events. The average difference between SSH anomalies (Figure 3b) demonstrates that changes in the sea circulation inside the lagoon could be one of the consequences of sea level rise.
To highlight the changes occurring in the water flows through the inlets, we compute the volume transports across the three inlets using the expression:
Q ( t ) = D t     i = 1 n U T ( n ) d x n
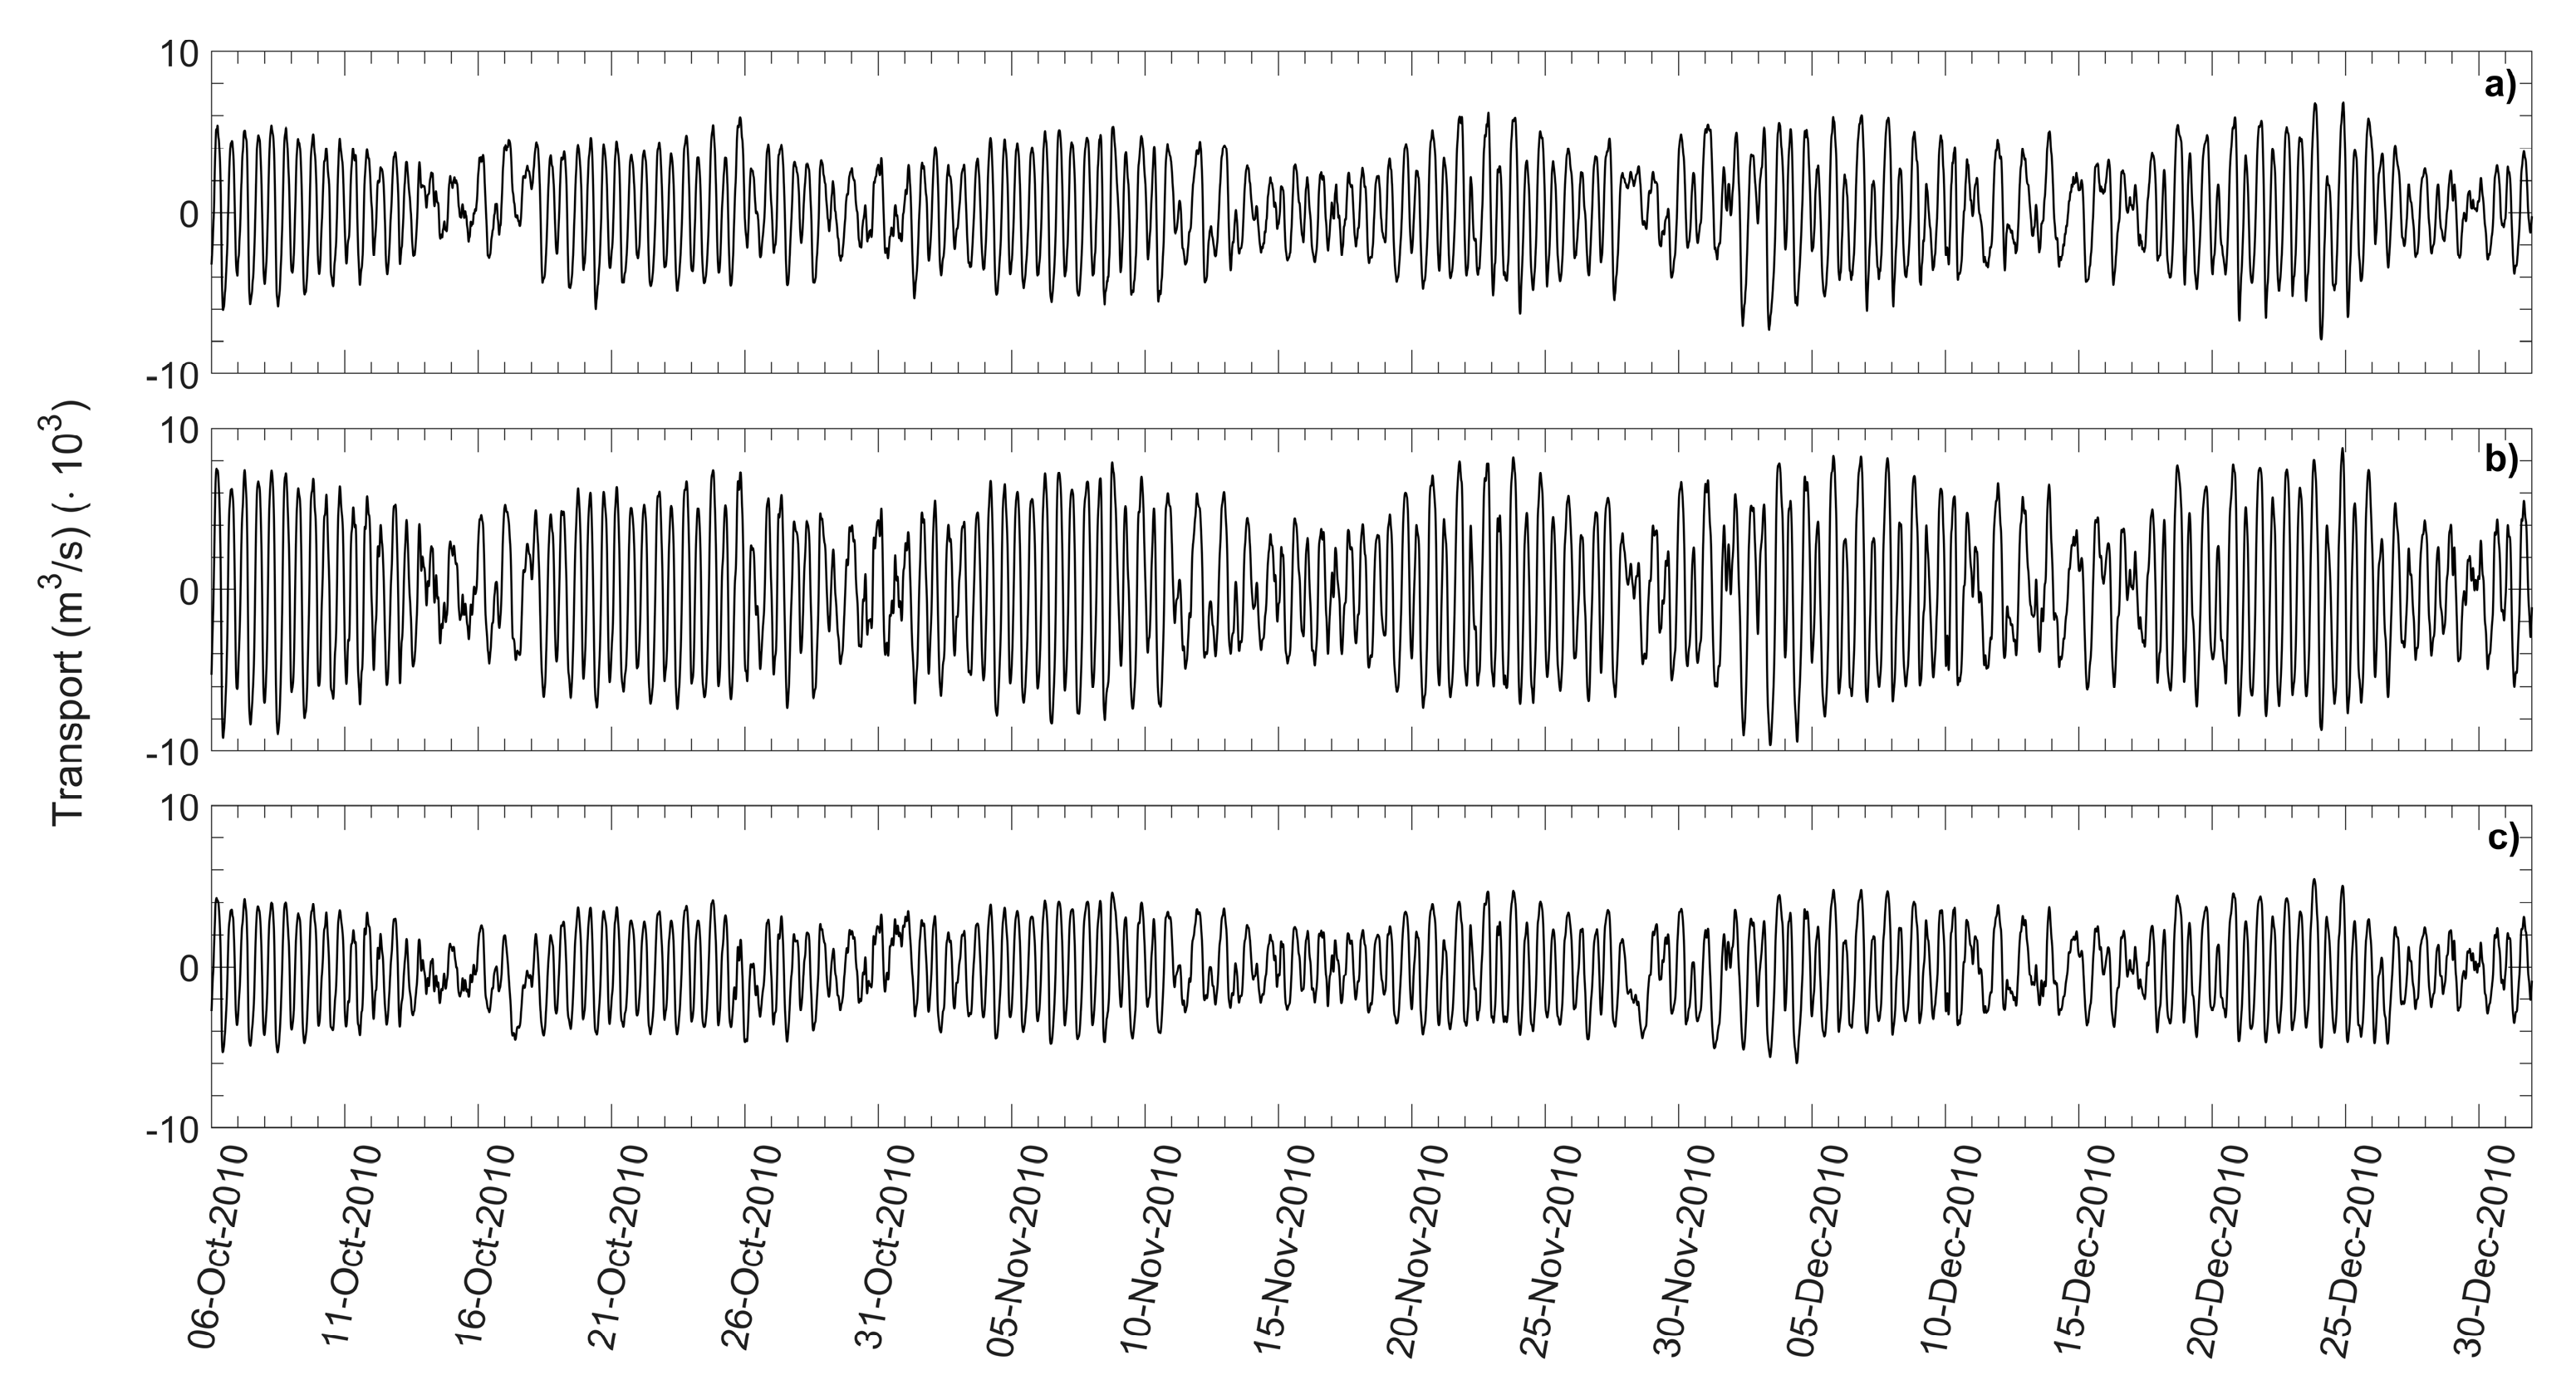
where Q(t) is the volume transport at the time t, Dt is the total height of the water column (depth + SSH), UT is the normal component of the water velocity through the cell n of the transect and dxn the cell size of the n-element of the transect, respectively. The results are shown for the 2010 case in Figure 4. The three panels show the water flow through the inlets (positive flux inside the lagoon) over the entire period of the simulation. The total volume transport across all the inlets averaged over the period is around 9000 m3/s, compatible with previous measurements over shorter periods [40].
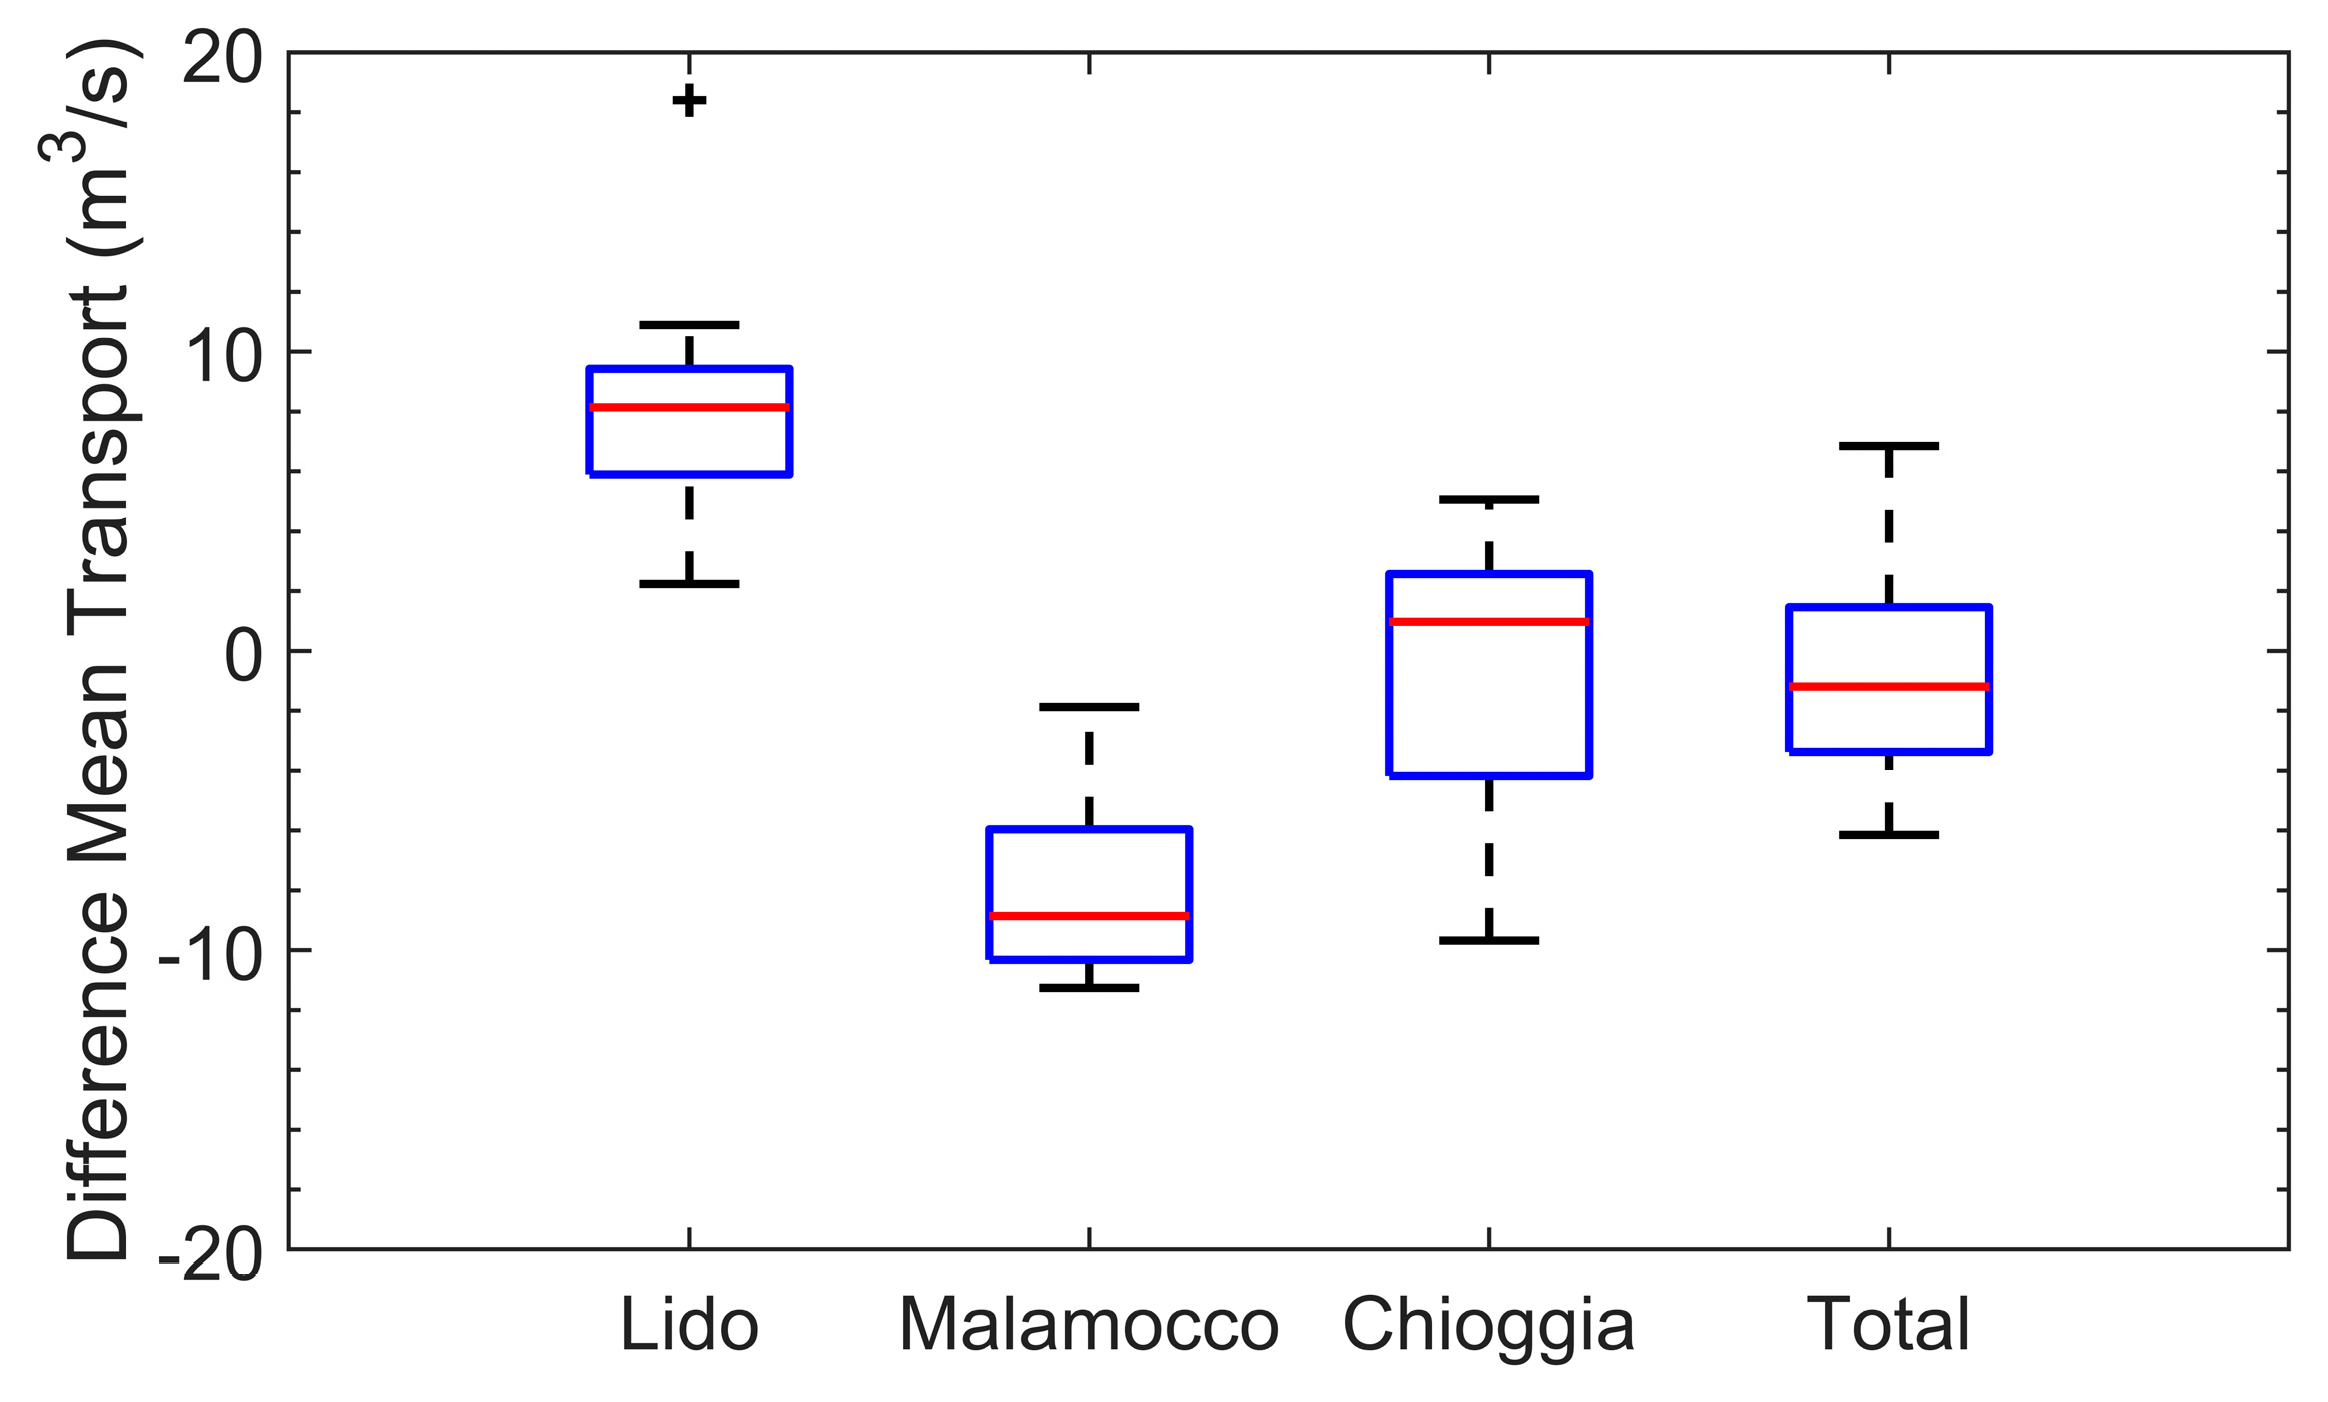
Sea-level rise prescribed at the open boundary and local wind changes result in changes in the flux through the inlets both in terms of volume, and consequently of water speed, and circulation patterns. The changes in the inflow and outflow across the three inlets are shown in Figure 5. On average, the most important changes in the circulation involve the water exchanges at the Lido inlet, with a strengthening of the inflow and consequent positive difference between the mean transport between the SC and HI ensembles; this enhanced inflow results also in an average sea level increase in the northernmost part of the lagoon (Figure 3b). On the contrary, a larger amount of water is expected to leave the basin through the Malamocco inlet (Figure 5). The southern inlet close to Chioggia city is expected to be the least affected by future changes, and, hence, plays a minor role in maintaining the balance between incoming and outgoing flow across all inlets.
This water mass balance is the result of changes in the circulation through the inlets. Figure 6 shows the difference between the average water speed for the SC and HI simulations. While in the open Adriatic Sea changes in the circulation patterns are almost negligible since the water speed anomaly is close to zero, a significant increase in the water velocity across the Lido inlet is obtained of about 10 cm/s. This results in a residual northward flux causing the average increase of the water level in the northernmost part of the lagoon (Figure 4b) and, also an enhancement of the southward currents which transport the water outside the area through the other two inlets.

5. Conclusions

In this study, an ensemble of numerical simulations with a state-of-the-art hydrodynamic model for coastal applications was used to provide, for the first time, a picture of the changes in the sea circulation induced in the Venice lagoon by projected changes in boundary forcing, including Mediterranean sea-level rise and atmospheric circulation changes over the Adriatic Sea. By our approach, the same meteorological events are considered in the historical and scenario simulations, with different intensities reflecting probabilistic changes in projected atmospheric forcing; therefore, changes in the frequency of extreme events are neglected. Still, our results provide the currently most comprehensive assessment of mid-21st-century projected climate change impacts on hydrodynamics in the Venice Lagoon under a “business as usual” scenario.
Our results indicate that, in contrast to negligible circulation changes in the Adriatic Sea, dynamics in the proximity and inside the Venice lagoon significantly change under the scenario with respect to historical conditions. Our results confirm the current understanding that sea level rise will be the dominant driver of the expected worsening statistics of Venice flooding. However, our simulations also add details on projected sea-level rise in the Venice lagoon and reveal previously unknown variability in lagoonal hydrodynamics. In particular, stronger water transport entering the lagoon is expected through the Lido inlet leading to an accumulation of water masses in the northeastern part of the Venetian lagoon. Mass continuity is achieved by a stronger expected outflow through the Malamocco inlet, while, on average, the total flux across the Chioggia inlet is not expected to change significantly. These transport changes through the inlets will force the establishment of a ~1 cm mean sea-level gradient between the northern and southern portions of the lagoon and complex persistent anomalous circulation patterns around the historical center of Venice as well as throughout the lagoon.
Further factors may contribute to shaping the future circulation in the area: for instance, subsidence and sedimentary processes could play a major role in sea level changes inside the lagoon, and better constraints to their future evolution could greatly improve projections of climate change impacts on the Venice lagoon.

Author Contributions

Conceptualization, S.R., D.Z. and A.R.; methodology, I.K., V.F., A.A. and S.R.; validation, S.R., I.K., V.F. and A.A.; formal analysis, S.R. and M.G.; investigation, S.R., D.Z. and A.R.; resources, I.K., V.F. and A.A.; writing—original draft preparation, S.R., D.Z., A.R.; project administration, D.Z. and A.R.; Revision, S.R., D.Z. and A.R. All authors have read and agreed to the published version of the manuscript.

Funding

The research was funded by the Research Programme Venezia2021, coordinated by CORILA, with the contribution of the Provveditorato for the Public Works of Veneto, Trentino Alto Adige and Friuli Venezia Giulia.

Data Availability Statement

Not applicable.

Acknowledgments

I.K. acknowledges support by the DAIS-IRIDE project HYGA: HYdrodynamics of the Gulf of Gabes (Tunisia, North Africa).

Conflicts of Interest

The authors declare no conflict of interest.

References

  1. Pham, H.V.; Dal Barco, M.K.; Cadau, M.; Harris, R.; Furlan, E.; Torresan, S.; Rubinetti, S.; Zanchettin, D.; Rubino, A.; Kuznetsov, I.; et al. Multi-Model Chain for Climate Change Scenario Analysis to Support Coastal Erosion and Water Quality Risk Management for the Metropolitan City of Venice. Sci. Total Environ. 2023, 904, 166310. [Google Scholar] [CrossRef]
  2. Zanchettin, D.; Bruni, S.; Raicich, F.; Lionello, P.; Adloff, F.; Androsov, A.; Antonioli, F.; Artale, V.; Carminati, E.; Ferrarin, C.; et al. Sea-Level Rise in Venice: Historic and Future Trends (Review Article). Nat. Hazards Earth Syst. Sci. 2021, 21, 2643–2678. [Google Scholar] [CrossRef]
  3. Rubinetti, S.; Taricco, C.; Zanchettin, D.; Arnone, E.; Bizzarri, I.; Rubino, A. Interannual-to-Multidecadal Sea-Level Changes in the Venice Lagoon and Their Impact on Flood Frequency. Clim. Chang. 2022, 174, 26. [Google Scholar] [CrossRef]
  4. Zanchettin, D.; Rubinetti, S.; Rubino, A. Is the Atlantic a Source for Decadal Predictability of Sea-Level Rise in Venice? Earth Space Sci. 2022, 9, e2022EA002494. [Google Scholar] [CrossRef]
  5. MOSE Venezia Project MOSE Venezia|Project 2022. Available online: https://www.mosevenezia.eu/project/?lang=en (accessed on 9 September 2023).
  6. Umgiesser, G. The Impact of Operating the Mobile Barriers in Venice (MOSE) under Climate Change. J. Nat. Conserv. 2020, 54, 125783. [Google Scholar] [CrossRef]
  7. Lionello, P.; Nicholls, R.J.; Umgiesser, G.; Zanchettin, D. Venice Flooding and Sea Level: Past Evolution, Present Issues, and Future Projections (Introduction to the Special Issue). Nat. Hazards Earth Syst. Sci. 2021, 21, 2633–2641. [Google Scholar] [CrossRef]
  8. Tognin, D.; D’Alpaos, A.; Marani, M.; Carniello, L. Marsh Resilience to Sea-Level Rise Reduced by Storm-Surge Barriers in the Venice Lagoon. Nat. Geosci. 2021, 14, 906–911. [Google Scholar] [CrossRef]
  9. Scarpa, G.M.; Braga, F.; Manfè, G.; Lorenzetti, G.; Zaggia, L. Towards an Integrated Observational System to Investigate Sediment Transport in the Tidal Inlets of the Lagoon of Venice. Remote Sens. 2022, 14, 3371. [Google Scholar] [CrossRef]
  10. Anelli Monti, M.; Brigolin, D.; Franzoi, P.; Libralato, S.; Pastres, R.; Solidoro, C.; Zucchetta, M.; Pranovi, F. Ecosystem Functioning and Ecological Status in the Venice Lagoon, Which Relationships? Ecol. Indic. 2021, 133, 108461. [Google Scholar] [CrossRef]
  11. Tsimplis, M.N.; Marcos, M.; Somot, S. 21st Century Mediterranean Sea Level Rise: Steric and Atmospheric Pressure Contributions from a Regional Model. Glob. Planet. Chang. 2008, 63, 105–111. [Google Scholar] [CrossRef]
  12. Ferrarin, C.; Tomasin, A.; Bajo, M.; Petrizzo, A.; Umgiesser, G. Tidal Changes in a Heavily Modified Coastal Wetland. Cont. Shelf Res. 2015, 101, 22–33. [Google Scholar] [CrossRef]
  13. Benetazzo, A.; Davison, S.; Barbariol, F.; Mercogliano, P.; Favaretto, C.; Sclavo, M. Correction of ERA5 Wind for Regional Climate Projections of Sea Waves. Water 2022, 14, 1590. [Google Scholar] [CrossRef]
  14. Umgiesser, G.; Bajo, M.; Ferrarin, C.; Cucco, A.; Lionello, P.; Zanchettin, D.; Papa, A.; Tosoni, A.; Ferla, M.; Coraci, E.; et al. The Prediction of Floods in Venice: Methods, Models and Uncertainty (Review Article). Nat. Hazards Earth Syst. Sci. 2021, 21, 2679–2704. [Google Scholar] [CrossRef]
  15. Cavaleri, L.; Bajo, M.; Barbariol, F.; Bastianini, M.; Benetazzo, A.; Bertotti, L.; Chiggiato, J.; Davolio, S.; Ferrarin, C.; Magnusson, L.; et al. The October 29, 2018 Storm in Northern Italy—An Exceptional Event and Its Modeling. Prog. Oceanogr. 2019, 178, 102178. [Google Scholar] [CrossRef]
  16. Vilibić, I.; Šepić, J.; Pasarić, M.; Orlić, M. The Adriatic Sea: A Long-Standing Laboratory for Sea Level Studies. Pure Appl. Geophys. 2017, 174, 3765–3811. [Google Scholar] [CrossRef]
  17. Tsimplis, M.N.; Proctor, R.; Flather, R.A. A Two-Dimensional Tidal Model for the Mediterranean Sea. J. Geophys. Res. Oceans 1995, 100, 16223–16239. [Google Scholar] [CrossRef]
  18. Androsov, A.; Fofonova, V.; Kuznetsov, I.; Danilov, S.; Rakowsky, N.; Harig, S.; Brix, H.; Wiltshire, K.H. FESOM-C v.2: Coastal Dynamics on Hybrid Unstructured Meshes. Geosci. Model Dev. 2019, 12, 1009–1028. [Google Scholar] [CrossRef]
  19. Fofonova, V.; Androsov, A.; Sander, L.; Kuznetsov, I.; Amorim, F.; Hass, H.C.; Wiltshire, K.H. Non-Linear Aspects of the Tidal Dynamics in the Sylt-Rømø Bight, South-Eastern North Sea. Ocean Sci. 2019, 15, 1761–1782. [Google Scholar] [CrossRef]
  20. Kuznetsov, I.; Androsov, A.; Fofonova, V.; Danilov, S.; Rakowsky, N.; Harig, S.; Wiltshire, K.H. Evaluation and Application of Newly Designed Finite Volume Coastal Model FESOM-C, Effect of Variable Resolution in the Southeastern North Sea. Water 2020, 12, 1412. [Google Scholar] [CrossRef]
  21. Debolskaya, E.I.; Kuznetsov, I.S.; Androsov, A.A. Numerical Simulation of Hydrodynamic Processes in Indiga Bay. Power Technol. Eng. 2023, 56, 691–697. [Google Scholar] [CrossRef]
  22. Neder, C.; Fofonova, V.; Androsov, A.; Kuznetsov, I.; Abele, D.; Falk, U.; Schloss, I.R.; Sahade, R.; Jerosch, K. Modelling Suspended Particulate Matter Dynamics at an Antarctic Fjord Impacted by Glacier Melt. J. Mar. Syst. 2022, 231, 103734. [Google Scholar] [CrossRef]
  23. Remacle, J.-F.; Lambrechts, J.; Seny, B.; Marchandise, E.; Johnen, A.; Geuzainet, C. Blossom-Quad: A Non-Uniform Quadrilateral Mesh Generator Using a Minimum-Cost Perfect-Matching Algorithm. Int. J. Numer. Methods Eng. 2012, 89, 1102–1119. [Google Scholar] [CrossRef]
  24. Geuzaine, C.; Remacle, J.-F. Gmsh: A 3-D Finite Element Mesh Generator with Built-in Pre- and Post-Processing Facilities. Int. J. Numer. Methods Eng. 2009, 79, 1309–1331. [Google Scholar] [CrossRef]
  25. EMODnet Bathymetry Consortium EMODnet Digital Bathymetry (DTM). 2020. Available online: https://sextant.ifremer.fr/record/bb6a87dd-e579-4036-abe1-e649cea9881a/ (accessed on 9 September 2023).
  26. Madricardo, F.; Foglini, F.; Trincardi, F. Processed High-Resolution ASCII:ESRI Gridded Bathymetry Data (EM2040 and EM3002) from the Lagoon of Venice Collected in 2013. Available online: https://www.marine-geo.org/tools/search/Files.php?data_set_uid=23605 (accessed on 9 September 2023).
  27. Wessel, P.; Smith, W.H. A Global, Self-Consistent, Hierarchical, High-Resolution Shoreline Database. J. Geophys. Res. Solid Earth 1996, 101, 8741–8743. [Google Scholar] [CrossRef]
  28. Hersbach, H.; Bell, B.; Berrisford, P.; Hirahara, S.; Horányi, A.; Muñoz-Sabater, J.; Nicolas, J.; Peubey, C.; Radu, R.; Schepers, D.; et al. The ERA5 Global Reanalysis. Q. J. R. Meteorol. Soc. 2020, 146, 1999–2049. [Google Scholar] [CrossRef]
  29. CDS ERA5 Hourly Data on Single Levels from 1959 to Present. Available online: https://cds.climate.copernicus.eu/cdsapp#!/dataset/reanalysis-era5-single-levels?tab=overview (accessed on 9 September 2023).
  30. Rockel, B.; Will, A.; Hense, A. The Regional Climate Model COSMO-CLM (CCLM). Meteorol. Z. 2008, 17, 347–348. [Google Scholar] [CrossRef]
  31. Egbert, G.D.; Erofeeva, S.Y. Efficient Inverse Modeling of Barotropic Ocean Tides. J. Atmos. Ocean. Technol. 2002, 19, 183–204. [Google Scholar] [CrossRef]
  32. Egbert, G.D.; Bennett, A.F.; Foreman, M.G.G. TOPEX/POSEIDON Tides Estimated Using a Global Inverse Model. J. Geophys. Res. Oceans 1994, 99, 24821–24852. [Google Scholar] [CrossRef]
  33. OSU TPXO Tide Models OSU TPXO Tide Models—TPXO9-Atlas. Available online: https://www.tpxo.net/global/tpxo9-atlas (accessed on 31 May 2022).
  34. Pawlowicz, R.; Beardsley, B.; Lentz, S. Classical Tidal Harmonic Analysis Including Error Estimates in MATLAB Using T_TIDE. Comput. Geosci. 2002, 28, 929–937. [Google Scholar] [CrossRef]
  35. Yan, K.; Muis, S.; Irazoqui, M.; Verlaan, M. ‘Water Level Change Time Series for the European Coast from 1977 to 2100 Derived from Climate Projections’. Copernicus Climate Change Service (C3S) Climate Data Store (CDS). 2020. Available online: https://cds.climate.copernicus.eu/cdsapp#!/dataset/sis-water-level-change-timeseries?tab=overview (accessed on 9 September 2023).
  36. Lionello, P.; Barriopedro, D.; Ferrarin, C.; Nicholls, R.J.; Orlić, M.; Raicich, F.; Reale, M.; Umgiesser, G.; Vousdoukas, M.; Zanchettin, D. Extreme Floods of Venice: Characteristics, Dynamics, Past and Future Evolution (Review Article). Nat. Hazards Earth Syst. Sci. 2021, 21, 2705–2731. [Google Scholar] [CrossRef]
  37. Foreman, M.G.G.; Henry, R.F.; Walters, R.A.; Ballantyne, V.A. A Finite Element Model for Tides and Resonance along the North Coast of British Columbia. J. Geophys. Res. Oceans 1993, 98, 2509–2531. [Google Scholar] [CrossRef]
  38. CPSM Centro Previsioni e Segnalazioni Maree Website—The Tide. Available online: https://www.comune.venezia.it/it/content/la-marea (accessed on 16 March 2022).
  39. Cavaleri, L.; Bertotti, L. Accuracy of the Modelled Wind and Wave Fields in Enclosed Seas. Tellus A Dyn. Meteorol. Oceanogr. 2004, 56, 167–175. [Google Scholar] [CrossRef]
  40. Gačić, M.; Kovačević, V.; Mazzoldi, A.; Paduan, J.; Arena, F.; Mosquera, I.M.; Gelsi, G.; Arcari, G. Measuring Water Exchange between the Venetian Lagoon and the Open Sea. Eos Trans. Am. Geophys. Union 2002, 83, 217–222. [Google Scholar] [CrossRef]
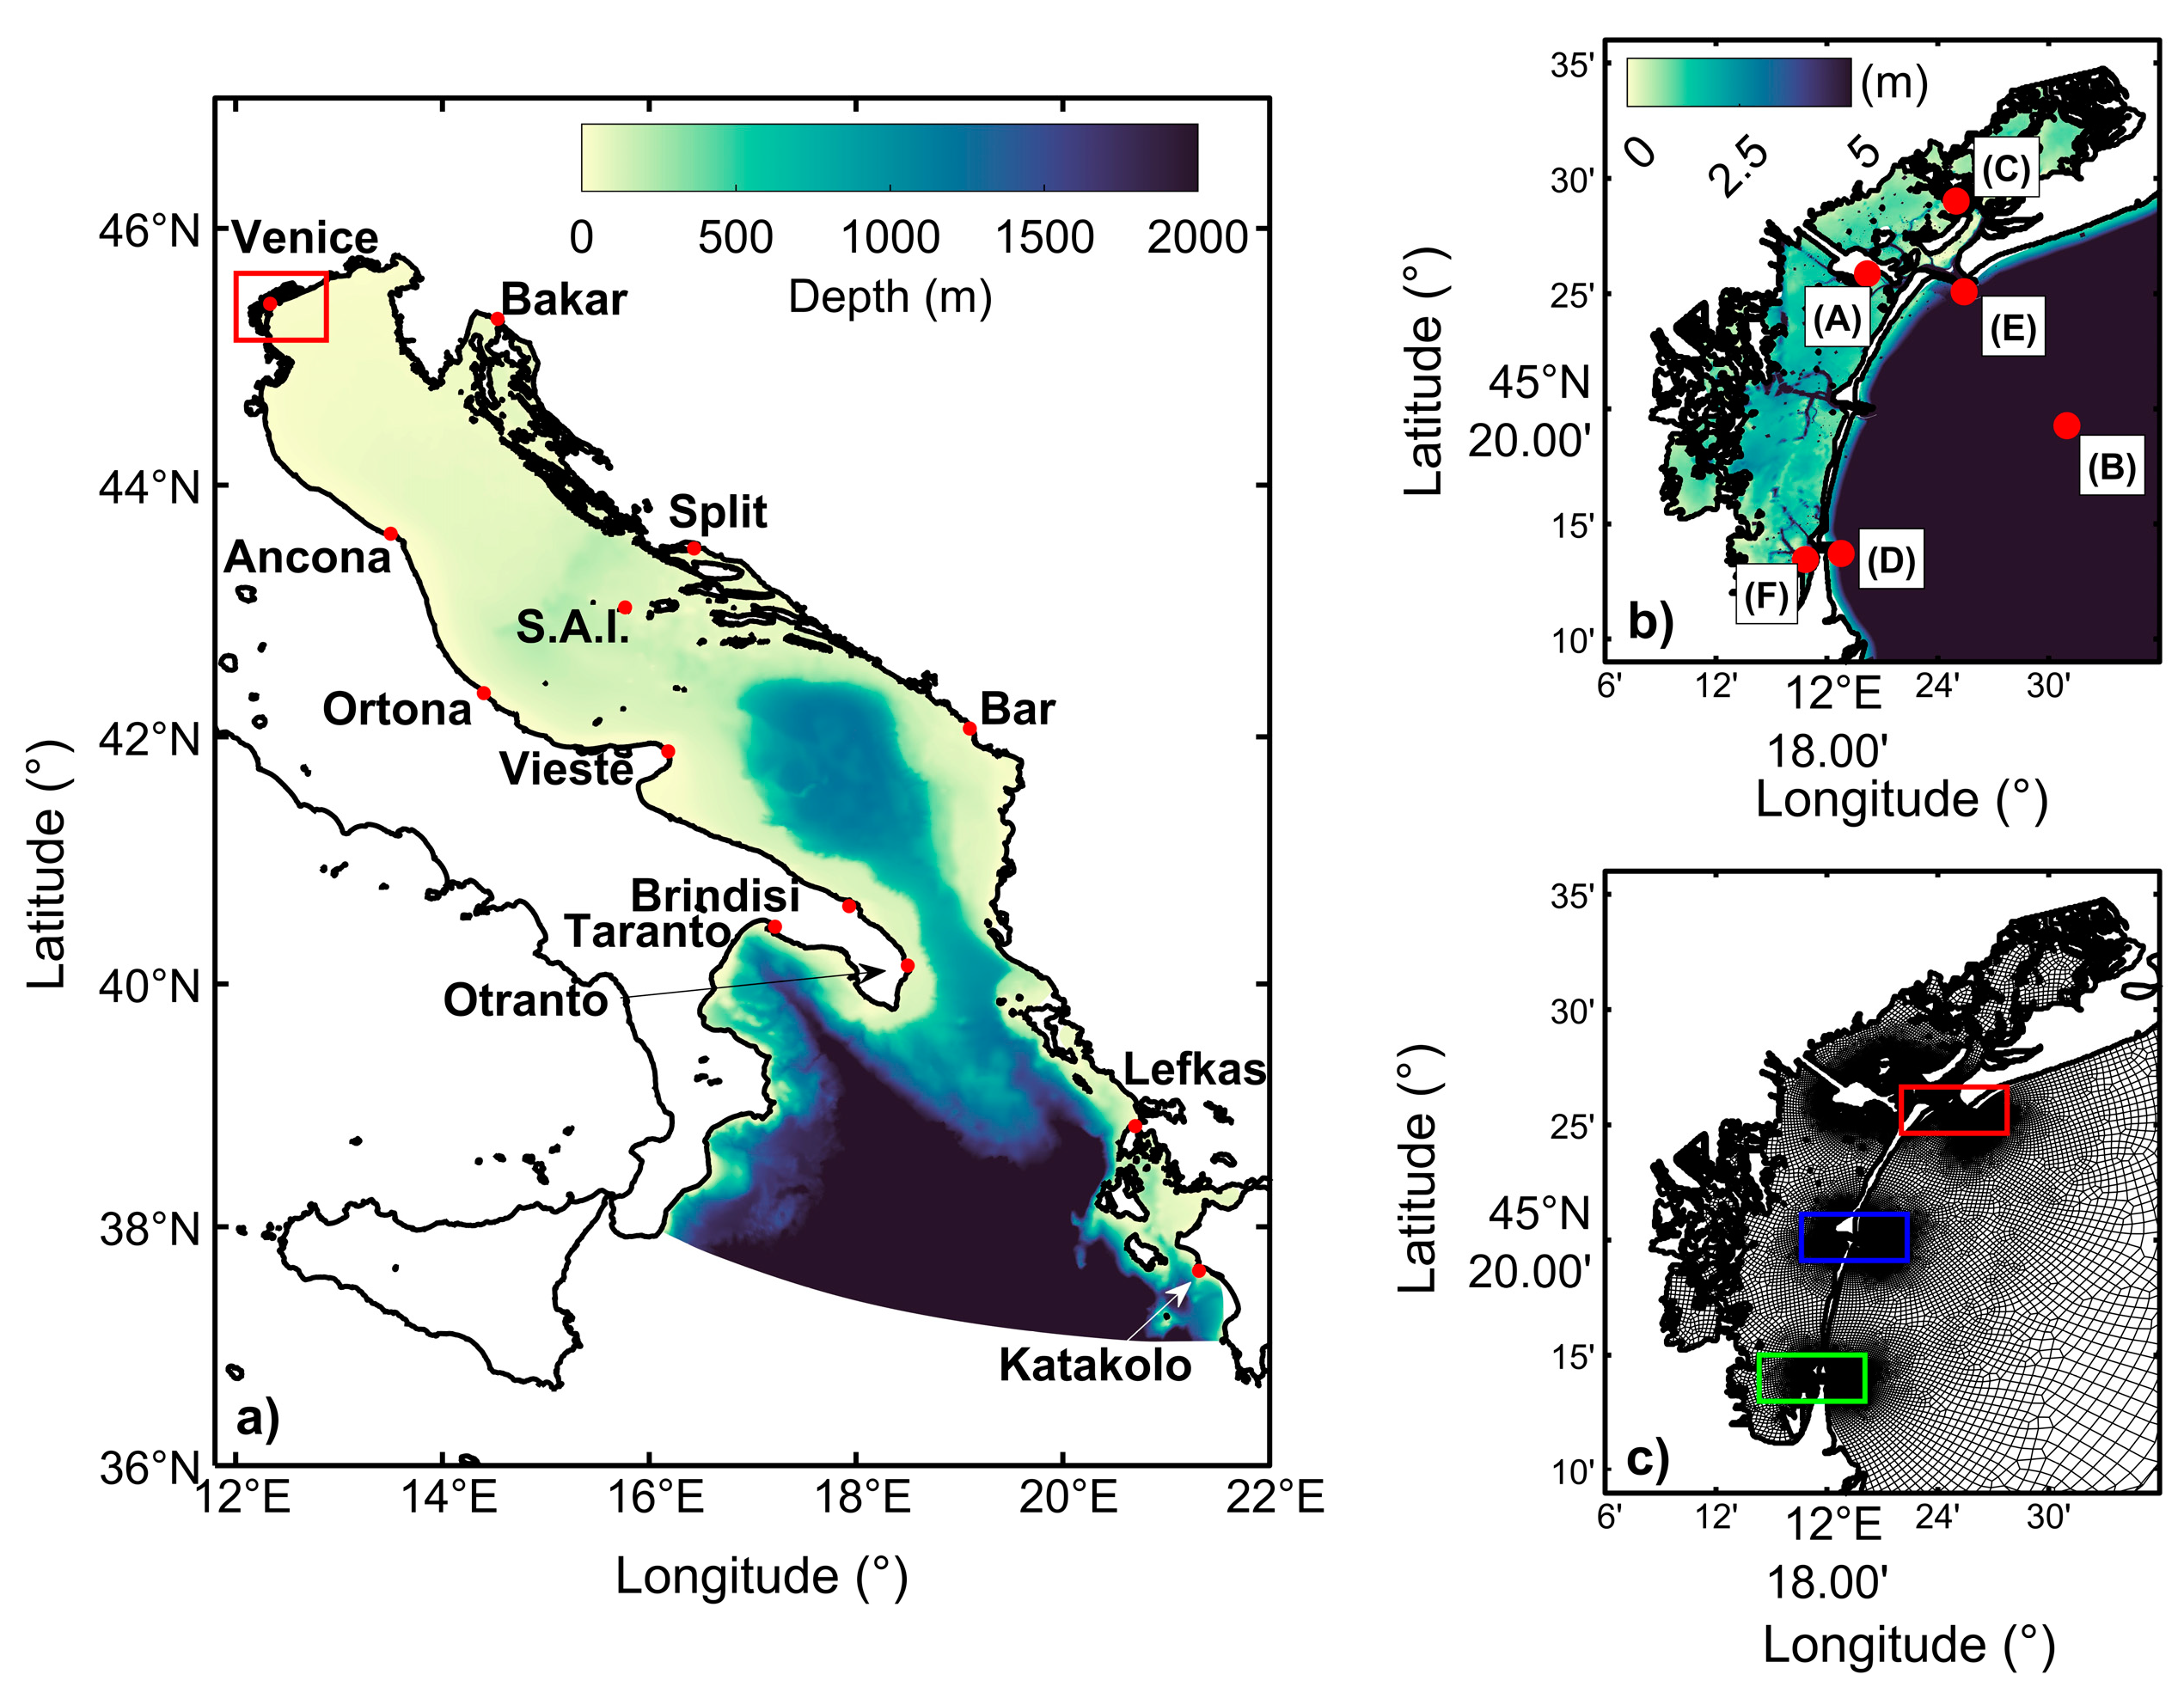
Figure 1. (a) Domain of FESOM-C model covering the Adriatic Sea and part of the Ionian Sea with the position of the Venice lagoon inside the red rectangle. Colormap represents bathymetry. Labeled red dots indicate the sites reported in Table 1. (b) Zoom over the Venice lagoon with the details of the bathymetry in the area. Red dots labeled with capital letters indicate the points used for the model validation. (c) Details of the variable space resolution in the northern portions of the domain, including the Venice lagoon. Colored rectangles highlight the three inlets that connect the lagoon with the open sea, namely Lido (red), Malamocco (blue) and Chioggia (green).
Water 15 03221 g001
Figure 2. Comparison between observed (black curves) and simulated (blue curves) sea level changes at the six sites shown in Figure 1b (labelled as site A, B,…, F) for the 2010 case.
Water 15 03221 g002
Figure 3. (a). SSH anomaly computed as the difference between the SSH averaged over the 11 scenarios and the 11 historical simulations. (b). Zoom of panel A over the Venice lagoon. (c). Difference between the five percentiles of the SSH distribution from the SC and HI ensembles. (d). Same as panel c for the 95 percentile. In all panels, SSH anomaly values are centered on 17 cm for a better comprehension of the results.
Water 15 03221 g003
Figure 4. Water flow time series across the three inlets, namely Lido (panel (a)), Malamocco (panel (b)) and Chioggia (panel (c)). The results refer to the 2010 case study (HI run).
Water 15 03221 g004
Figure 5. Boxplot of the distribution of differences between the mean transport in SC and HI simulations. Each boxplot represents the statistics of an ensemble of 11 simulations where the transports through the three inlets have been averaged over the entire period of the simulations.
Water 15 03221 g005
Figure 6. Water velocity anomaly, computed as the difference between the average water velocity in the SC ensemble and in the HI one. For both scenarios, 11 water velocity maps have been computed by averaging over the 3-month periods of the simulations. Then, the mean values from the two ensembles have been computed and the anomaly is their difference. The shading represents the module of the water velocity, while the streamlines illustrate the residual circulation pattern.
Water 15 03221 g006
Table 2. RMSE values (in cm) between simulated sea level and those observed at the six sites shown in Figure 1b. Measurements at the Burano site (point C) for 2000–2002 are missing.
20002001200220032004200520062007200820092010
A17.622.718.420.617.817.817.118.918.818.519.3
B16.922.517.920.017.317.316.318.817.517.417.9
C---19.419.917.716.419.218.418.018.7
D16.522.517.920.017.317.116.218.218.017.117.8
E17.221.918.220.117.317.316.318.518.117.618.3
F17.319.918.220.517.517.617.019.218.117.918.0
Disclaimer/Publisher’s Note: The statements, opinions and data contained in all publications are solely those of the individual author(s) and contributor(s) and not of MDPI and/or the editor(s). MDPI and/or the editor(s) disclaim responsibility for any injury to people or property resulting from any ideas, methods, instructions or products referred to in the content.