Article

Study on the Hydraulic Response of an Open-Channel Water Transmission Project after Flow Switching

1
Key Laboratory of Water Conservancy and Water Resources of Anhui Province, Water Resources Research Institute of Anhui Province and Huai River Water Resources Commission, Ministry of Water Resources, Bengbu 233000, China
2
College of Civil Engineering, Hefei University of Technology, Hefei 230009, China
3
Institute of Intelligent Machines, Hefei Institutes of Physical Science, Chinese Academy of Sciences, Hefei 230031, China
4
Hefei Institutes of Collabrative Innovation for Intelligent Agriculture, Hefei 231131, China
*
Author to whom correspondence should be addressed.
Water 2023, 15(18), 3201; https://doi.org/10.3390/w15183201
Submission received: 10 May 2023 / Revised: 1 September 2023 / Accepted: 4 September 2023 / Published: 8 September 2023
(This article belongs to the Special Issue Advanced Research on Hydraulic Engineering and Hydrological Modelling)

Abstract

:
For the complex and changing water transfer conditions along the nullah water transfer project, it is of great significance to analyze the hydraulic response characteristics of the channel pool to ensure the safe and efficient operation of the project. In this paper, using the adjustable reservoir capacity of the channel pool, combined with the earliest and latest regulation time, a method is proposed to determine the optimal regulation time of water conservancy engineering structures through the hydraulic response characteristics. In order to validate the method, the hydraulic response characteristics of the channel pool during the whole regulation period were investigated using an actual river diversion project as an example. By using the Sobol global sensitivity analysis method, the sensitivity analysis of three variables (water transfer flow, upstream initial flow, and downstream water level) was conducted, and the results showed that the change of water transfer flow was the most-critical factor affecting the optimal regulation time. In order to quantitatively study the correlation between the water transfer flow and the optimal regulation time, the water transfer flow factor was coupled to the existing prediction model, and the results showed that the coupled model can efficiently predict the optimal regulation time, and the NSE coefficient can reach 0.98. In addition, the coupled model can be efficiently used to serve on-site dispatchers for accurately predicting the optimal regulation time and making the corresponding safety decisions.

1. Introduction

The spatial and temporal distribution of water resources in China is uneven, with more water resources in the south and fewer in the north, and regional water resources’ supply and demand conflicts are prominent. To optimize the allocation of water resources, many large open-channel water diversion projects have been constructed in various regions [1]. However, the open-channel water transfer project has a long water transmission line, involves a wide range, and is difficult to control. During the operation process, various external factors such as weather will affect the normal operation of the project, which further increases the work intensity of dispatchers. Analyzing the hydraulic response characteristics of canals and ponds can provide important technical support for the actual operation of the project; thus, many scholars have conducted in-depth research in this direction by constructing hydrodynamic models. In open-channel water transfer projects, the length of the channel is usually much larger than the width and depth of the water transfer section, so the hydrodynamic simulation model of the whole system can be approximated as a one-dimensional problem [2]. Qi Jiashuo, Li Kangbin [3,4], and others simulated the variation trend of the channel water level under different gating control schemes through a one-dimensional hydrodynamic model and analyzed various hydraulic response characteristics to provide a data reference for managers to control the gating. Schuurmans, Bautista, and Paris [5,6,7] all used the hydraulic response characteristics of the channel to estimate the feedforward control time of the regulating building. Zheng Hezhen and Wahlin [8,9] built a one-dimensional hydrodynamic model to analyze the internal relationship between the water level, flow rate, head, regulation time, and storage capacity between the canals and ponds of each pumping station and optimized the predictive control method of the water delivery system and the pumping station control strategy. Lu Longbin, Li Mengxuan, Liu Zhiyong [10,11,12], and others have all deeply described the evolution of water conditions in separate pumping stations under emergency conditions by analyzing the trend of water level changes before and after the pumping station, which can provide support for engineering emergency treatment. Zhang et al. [13] analyzed the hydraulic control conditions for the operation of the dumping station in the open-channel water transfer project based on the operation case of the dumping station of the pipeline water delivery system and proposed the optimal operation mode of the dumping station in the open channel. Yan et al. [14] constructed a single-canal pond model, assuming that the water level in front of the downstream pumping station was a fixed value, reversed the flow change of each section, and judged the optimal regulation time of the pumping station based on the flow change trend of the downstream pumping station. By coupling a one-dimensional hydrodynamic model with a multi-objective genetic algorithm and taking the gate opening as a decision variable, they generated a cascade gate group adjustment scheme [15]. In other studies, the hydraulic response relationship has been extended to the field of channel control. Among them, the lag time in feedforward control is another manifestation of the hydraulic response relationship, and many scholars [16,17,18] use known perturbations to calculate the feedforward control strategy of the throttle gate based on the lag time. Subsequent unpredictable disturbances within the channel occur from time to time, decreasing the ability to perceive water conditions within the channel. Thus, predictive control models have emerged to solve such problems. The integral delay (ID) model is currently used as a predictive model. The principle of the ID model is to divide the channel into uniform and backwater zones according to the hydraulic response relationship and use the hydraulic response relationship to predict the evolution of the water level change and flow rate in the channel. This control method has been widely used in water transfer and irrigation projects [19,20,21,22]. However, all of the above articles focus on the accurate control of the water level, ignoring the role of its storage capacity in the regulation process. Therefore, this paper adopted the method of interval water level control to give full play to the application of its storage capacity in water transfer projects. Through the fast-fitting equation, the feasible region of the safe control time of the channel pool is calculated quickly.
To make the feasible region calculation results better applicable to practical engineering, it is also necessary to find a simple and quick calculation method. Based on historical data or the calculation results of the mechanism model, the simplified method of fitting the objective function’s fast calculation equation has been widely used in many industries of water conservancy. Wang Jianping [23] deduced the calculation equation of the equilibrium scour depth by analyzing the influencing factors of the scour depth of the open channel under different working conditions using dimensional analysis and regression analysis methods. Xia et al. [24], based on the measured data of hydrology and sediment in the Jiaojiang River Estuary for many years, combined with the comparative relationship between the turbulent action of water flow and the action of sediment gravity, obtained an empirical equation for the sediment-carrying capacity suitable for the study area. By analyzing the relationship between the upstream initial flow and the optimal regulation time interval, Li Guhan et al. [25] used the least-squares method for regression analysis to obtain an empirical equation that can quickly generate the hydraulic regulation scheme of the Shaping secondary power station. The above research analyzes the relationship between the parameters and selects the key influencing factors to formulate the coupling of the independent variables and dependent variables according to the level of correlation, to achieve the rapid calculation of the target values.
Based on the research on the hydraulic response characteristics of conventional canal tanks, this study proposes a quick calculation method for safe regulation intervals using the relationship between regulation volume and hydraulic response. By analyzing the earliest and latest regulating times of each load type within a project case study, we calculate the feasible safe regulating time range for the pumping station and determine the regulation scheme based on the quick regulating formula. This computational method is compared with the traditional method for controlling the water level, with the main differences being as follows. First, the regulating method can provide full play to the buffer function of the channel-water-storage process during scheduling, in line with actual needs, and can meet various scheduling requirements in water diversion projects. Second, the general dispatch method only regulates and controls relatively small water level fluctuations. This approach can result in an excessive frequency of throttle gate adjustments, greatly increasing the workload of the dispatcher. However, by adopting the adjusted interval method proposed in this paper, one can make full use of channel ponds to provide flexible storage, allowing for certain interval fluctuations in the water levels, reducing the frequency of throttling gate adjustments and reducing the workload of scheduling personnel. Third, in actual project calculations, adopting a quick computation formula for adjusting the interval can improve the response efficiency of the diversion canal pool, ensure its operational safety, and provide theoretical guidance and technical support for project construction, management, and operation.

2. Research Methods

During the operation stage of the water diversion project, to meet the goals of downstream water supply, ships passing through the locks, and ecological water replenishment, dispatchers need to adjust the rotation angle of the pumping station, the number of units to be turned on to meet the flow demand. Operation plays a vital role. To prevent the water level at the boundary of the canal and pond from exceeding the upper and lower limits due to the untimely adjustment of the pumping station, the earliest and latest regulation times of the pumping station based on the mechanism model are proposed. Aimed at preventing engineering safety accidents, which may be caused by large changes in the water level at the boundary of the canal and pond due to the increase in upstream water, by constructing a one-dimensional non-constant flow hydrodynamic numerical simulation model of the coupled pump station, the prediction of the water regime of each section can be realized, and it is feasible to combine the safety regulation time. The domain can provide technical guidance for the actual operation of the project.

2.1. Governing Equations and Solutions

Based on the Saint-Venant equations of one-dimensional unsteady flow, a one-dimensional hydrodynamic simulation model is constructed [26], including the continuity equation and the momentum equation [27]. The equations are expressed as follows:
{ B H t + Q x = q Q t + x ( α Q 2 A ) + g A H x + g A S f = 0 ,
where B is the width of the water-passing section, m; H is the water level, m; Q is the flow rate, m3/s; g is the acceleration of gravity, m/s2; x is the space coordinate of the section, m; t is the time coordinate, s; q is the side inflow, m3/s; α is the momentum correction coefficient; A is the water passage area, m2; and Sf is the friction ratio drop, which can be expressed by the following equation:
S f = n c 2 Q | Q | A 2 R 4 3 ,
where nc is the Manning roughness coefficient of the water conveyance channel and R is the hydraulic radius, m.
The above-mentioned Saint-Venant equations belong to the first-order quasi-linear hyperbolic partial differential equations. Generally, the analytical solution cannot be directly obtained, and the approximate solution can only be obtained by the numerical discrete method. After comprehensive comparison, this model uses the Preissmann four-point weighted implicit difference scheme with good stability, high calculation accuracy, and fast convergence speed to discretize the Saint-Venant equations [28] with the chase method [29]. The discrete grid form [30] is shown in Figure 1.

2.2. Model Internal Boundary Conditions’ Generalization

The solution to one-dimensional unsteady flow in an open channel involves the setting of external and internal boundary conditions. The internal boundary refers to the nodes with obvious changes in hydraulic properties or geometric shapes, but the Saint-Venant equations do not apply to such nodes, so the internal boundary needs to be generalized [31]. As one of the important control buildings in the open-channel water diversion project, the pumping station can raise the water resources from the lower ground to a higher place and effectively improve the distribution of water resources [32]. In the pumping station, the combined operation of multiple units is usually used to lift water. The dispatcher adjusts the operating conditions of the pumping station by changing the number of units, the type of units, the rotation angle, and the speed of the unit.
When the pump station is used as the inner boundary, the continuity equation and the flow–head–rotation angle characteristic curve of each pumping device can be used for processing, and the losses in the station can be ignored at the same time. From a macro point of view, multiple units in the same pumping station work in parallel, and they should be treated as a whole in the model. The horizontal addition method can be used to horizontally add the flows under the same head on each performance curve to obtain the lower head. There is information to explain the total flow of the pumping station [33]. When using the model, it is calculated according to different flow–head–rotation angle equations.
The equation of continuity is:
Q k = Q k + 1 ,
where Qk and Qk+1 represent the inlet and outlet flow of the pump (m3/s), respectively.
The relationship between the pump flow and the water level of the canal pool satisfies Equation (4).
H k + 1 H k = a k Q k 2 + b k Q k + c k ,
where Hk+1 is the water level of the outlet pool (m); Hk is the water level of the inlet pool (m); and ak, bk, and ck are the relevant parameters of the unit characteristic curve.
To solve the Saint-Venant equations simultaneously, it is necessary to linearize Equation (4), and the equation can be discretized according to the Preissmann four-point equation mentioned above:
Q k n + 1 + 0 + Q k + 1 n + 1 + 0 = 0 ,
Equation (4) accords with the same method; the continuity equation is expanded by the Taylor series, and only the second-order terms are retained. Assuming that the inlet and outlet flows of the pumping station are equal, the governing equation of the pumping station is as follows:
0 H k n + 1 ( 2 a k Q k + 1 n + b k ) Q k + 1 n + 1 + H k + 1 n + 1 = a k Q k + 1 n 2 + c k ,
Equations (5) and (6) following the four-point Preissmann format on the continuity equation and momentum equations are dispersed into discrete form and Saint–Venant equations. The last parts of Equations (5) and (6) coupled to the channel model, a simultaneous solution, finally realize the solution of the pumping station. The Saint-Venant equations of the discrete process due to the derivation process are relatively complicated. Due to the limited space available, please refer to [34] for details.

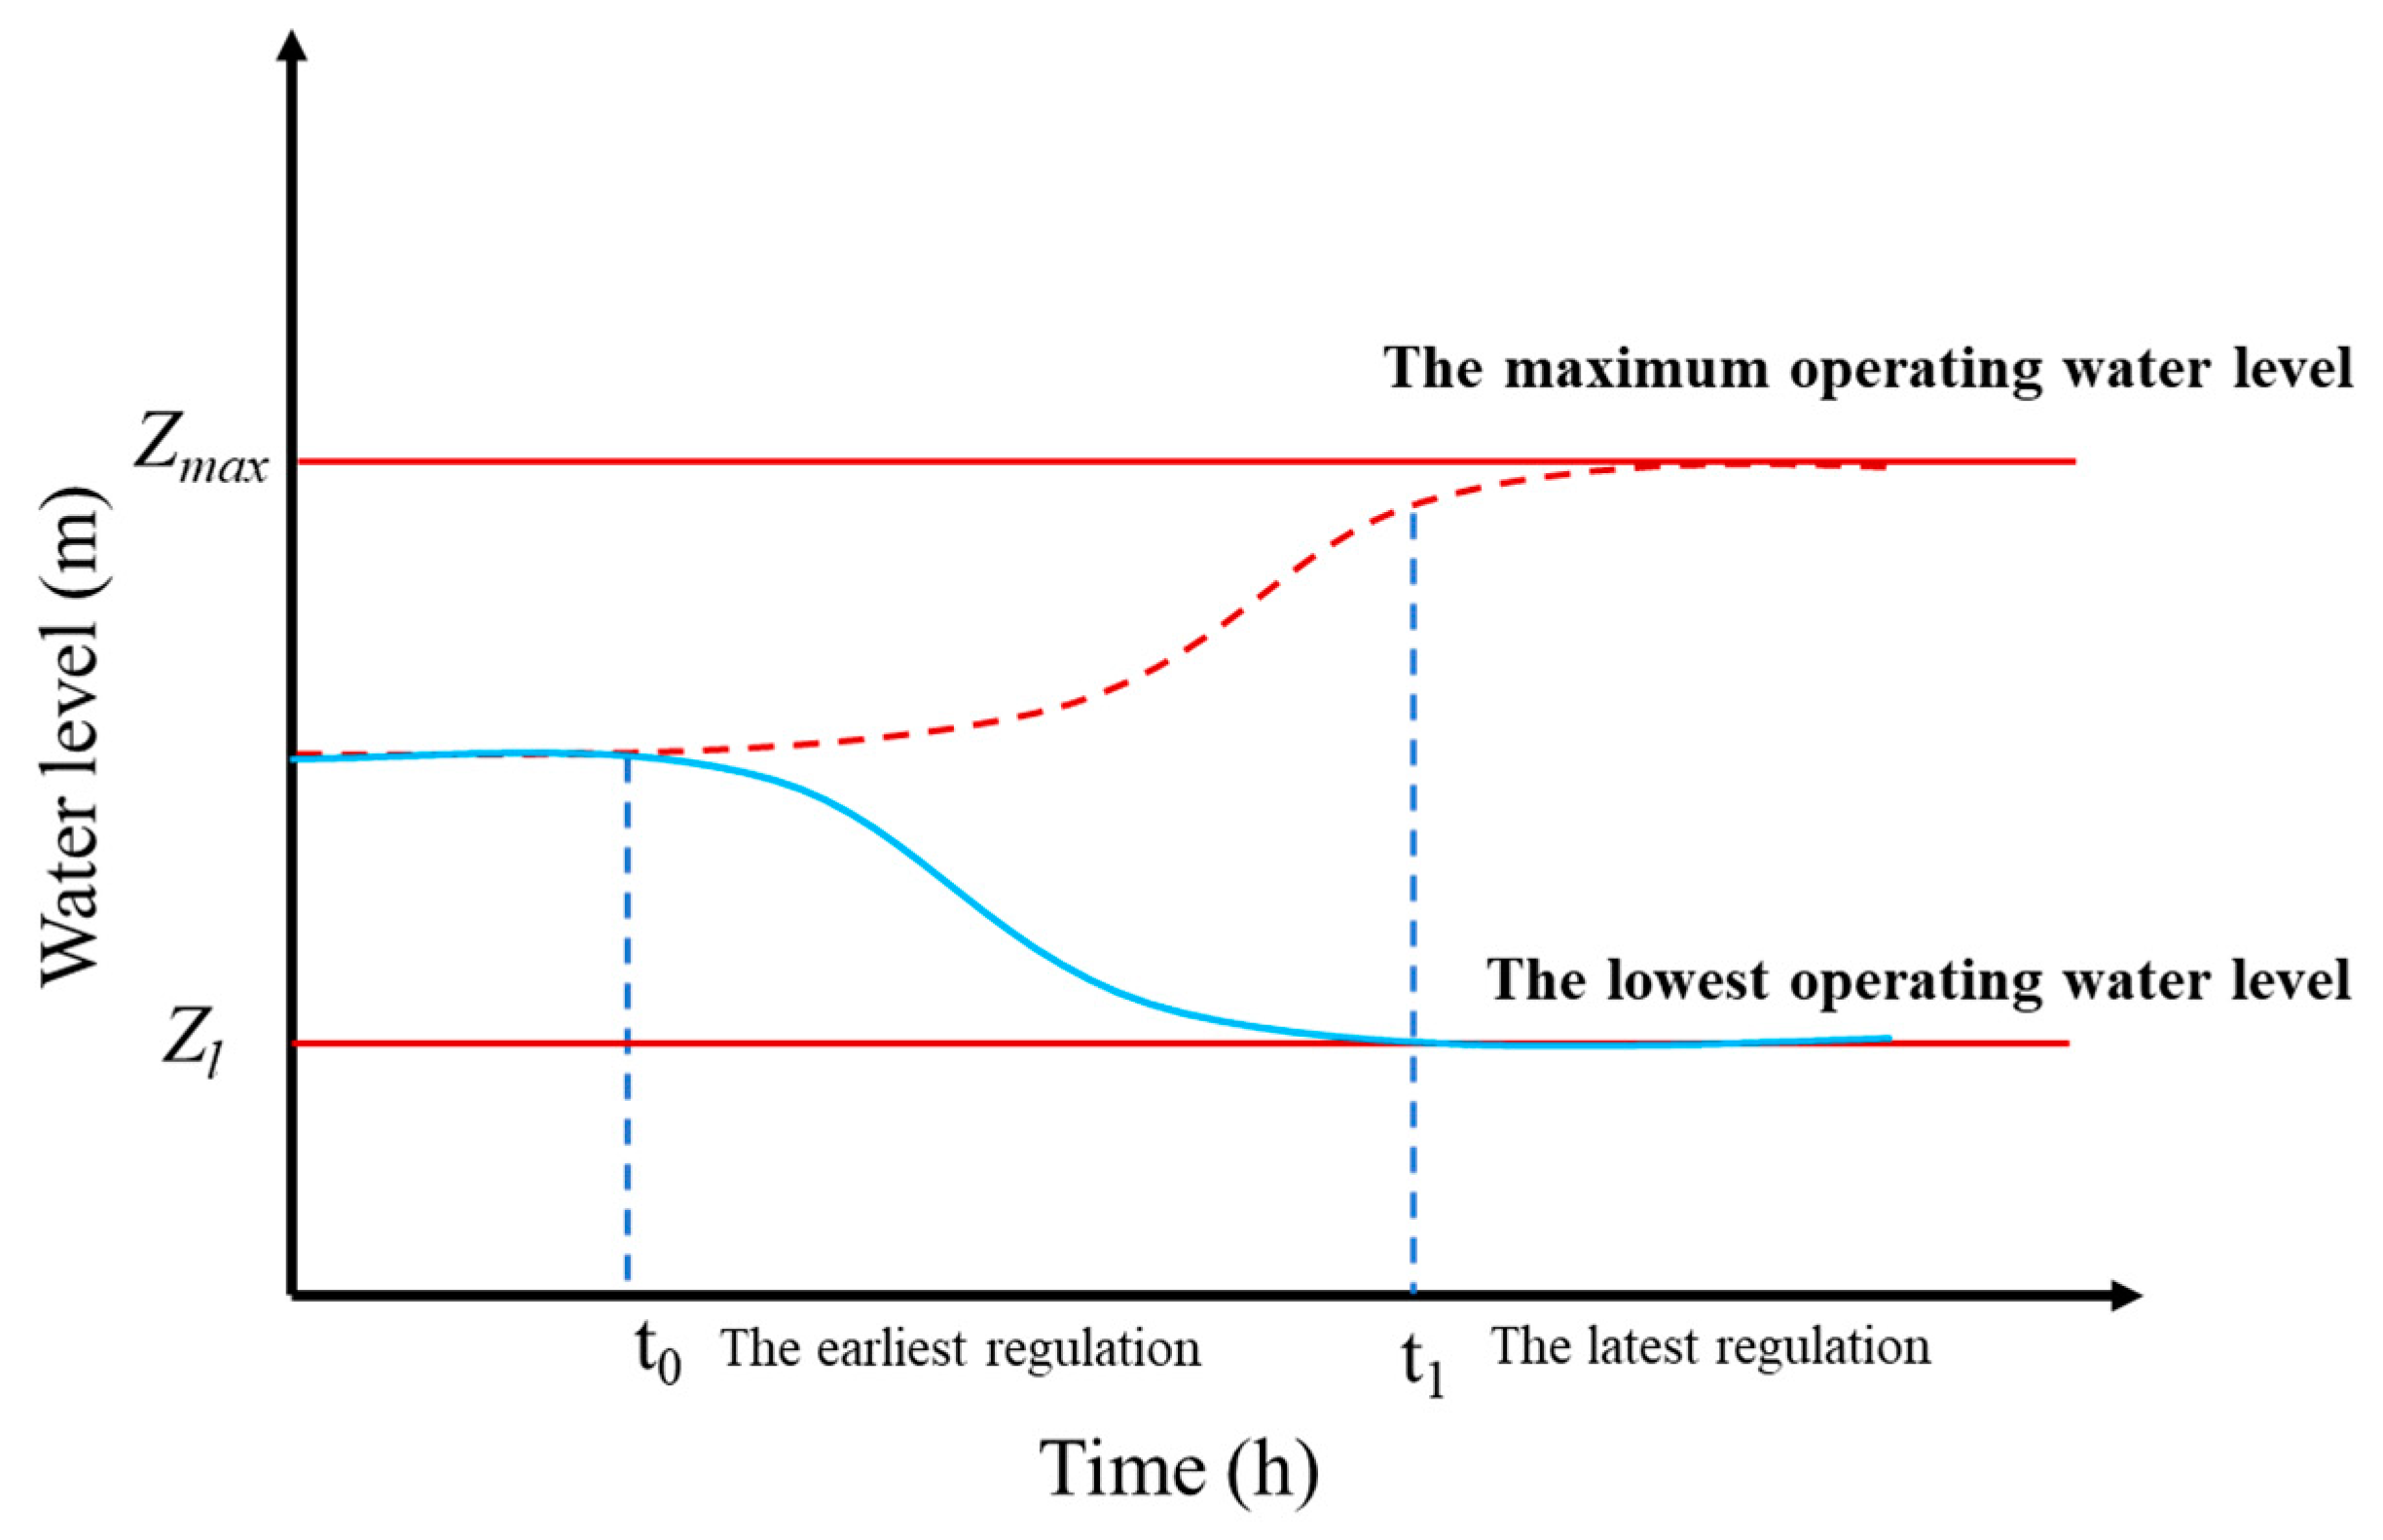
2.3. Safety Regulation Time Frame

In this study, the channel hydrological simulation was carried out through the hydrodynamic model. The minimum and maximum operating water level of the single channel pond boundary composed of upstream control buildings and inner boundary control buildings in the study area were taken as the water level overrun threshold, and the water level overrun time was calculated by the model. When the upstream flow mutation occurs, to maintain the inflow and outflow balance of the canal pool, the downstream buildings must be regulated. Because the drainage pool flow wave transmission has a time lag, when the time is less than the flow downstream structure adjustment wave transmission time, it will inevitably produce buildings near the water level decrease, and the drainage pool is the lowest water level operation, so for the structure of the control time, there must be a minimum regulation time to ensure the water level after regulation or just close to the lowest water level operation. This is the earliest regulation time. When the regulation time of the downstream building is greater than the flow propagation time, the water level near the building must rise, and then, there is the highest operating water level in the channel pool. Therefore, there must be a maximum regulation time for the building to make the regulated water level just at or close to the highest operating water level, which is the latest regulation time. The time difference between the latest and the earliest regulation time is the safe regulation domain value. By calculating the earliest and latest regulation time, the safety regulation time range of the pump station can be obtained, which provides technical support for the actual operation of the project. The earliest and latest regulation times are shown in Figure 2.

2.4. Sobol Global Sensitivity Analysis

The Sobol sensitivity analysis was proposed by Sobol in 1993. This method is centered on decomposing the total variance of the model inputs into the sum of the variance of each parameter and the variance of the parameter interactions. Then, the sensitivity of each parameter is identified by calculating its contribution to the variance of the output parameter.
Suppose the model is Y = f(x) = f(x1, x2,..., xn), X = (x1, x2,..., xn) is the parameter vector, and n is the number of parameters; the variance decomposition equation is expressed as:
V = i = 1 n V i + i < j n V i , j + V 1 , 2 , , n ,
S T = V i V ,
where V represents the total variance of the model; Vi represents the variance for the effect of the i-th parameter; Vi,j represent the variance of the i-th and j-th parameters acting together; V1,2,…,n represents the variance of all parameters acting together; and ST represents the full sensitivity coefficient

2.5. Overview of the Region

The Yangtze River and Huaihe River Diversion Project connects the Yangtze and Huaihe River systems and is one of the 172 major water-saving and water-supply projects designated by the State Council. From south to north, the Yangtze River and Huaihe River Diversion Project (Anhui section) is divided into three major sections: the Yangtze River and the Chaohu Lake Diversion Project, the Chaohu Lake and Huaihe River Diversion Project, and the Huaihe River and Henan Province Diversion Project. A total of 12 pumping stations are being set up during the first phase of the project, including Fenghuangjing pumping station, Zongyang pumping station, Paihekou pumping station, Shushan pumping station, etc. The project covers Anhui and Henan provinces, including Anqing, Wuhu, Ma’anshan, and Hefei in Anhui Province and Zhoukou and Shangqiu in Henan Province, covering a total of 15 cities and 55 counties. After the completion of the project, it will be able to supply water from the Yangtze River to the water-scarce areas in the north, promote the development of navigation in Jianghuai, and improve the water ecological environment of Caizi Lake, Chaohu Lake, Wabu Lake, and Huaihe River. In addition, it will inject new vitality into the social and economic development of Anhui and Henan Provinces.
The water diversion project from the Yangtze River to the Huaihe River has a large water flow, long lines, and a wide range. The Xiaohe branch line controls the intake gate to divert the water from the Yangtze River and Chaohu Lake from the Baishitian River mouth to the Paihekou pumping station. It is the key interval for the whole project to link the past and the future. This section is a newly excavated open channel. Affected by the topography, the hydraulic response of the canal pool is more obvious than in other canals, and this section involves the joint regulation and single-stage regulation of the gate pump group. The normal operation of the project is of great significance. Therefore, this section was selected as the research area in this study, and the control inlet gate of the Xiaohe branch line is used as the upstream control node, while the Shushan pumping station is the downstream control node. An overview of the canal section is shown in Figure 3.
At the same time, the Paihekou pumping station also undertakes the task of controlling the water level of the Paihekou ship lock. When a ship passes through the lock, the pumping station needs to be turned on to raise the water level of the lock chamber to the Paihe water level, which can effectively connect with the Jianghuai shipping industry. The designed water supply flow of the ship lock is 6.5 m3/s.
The design of the flood control level in front of the Xiaohe dividing line control inlet gate is 11.46 m; the designed water diversion level behind the gate is 6.0 m, and the bottom elevation is 0.6 m. The designed water level under the Shushan pumping station is 7.6 m; the lowest operating water level is 5.8 m, and the highest operating water level is 10.7 m. Paihekou pumping station has a single design flow rate of 37.69 m3/s and operates in 8 use modes and 1 standby mode, and the designed water level below the station is 4.1 m. The specific information is shown in Table 1 and Figure 4.

2.6. Hydrodynamic and Parameter Verification

The core of the verification of the hydrodynamic model is to verify the parameters of the hydrodynamic model. The parameters of the hydrodynamic model are mainly divided into fixed parameters and variable parameters, and the fixed parameters are mainly the parameters of the hydraulic components related to the line. The variable parameters mainly include hydrodynamic initial conditions, boundary conditions, calculation time, calculation step, pump station angle, river roughness, etc. This paper mainly verifies the variable parameters of the hydrodynamic model.
In order to test the simulation effect of the hydrodynamic model, a hydraulic model of the Shushan pumping station controlled by small joint and branch lines was constructed. The upstream flow through the sluice controlled by small joint and branch lines was used as the flow boundary; the downstream water level in front of the Shushan pumping station was selected as the water level boundary, and the measured water level of the Paihekou pumping station was used as the comparison to verify the accuracy of the model. Therefore, the output step size of the model was selected as 2 h/time; the simulation time was 60 h, and the roughness of the canal was the designed value of 0.015. The simulation results are shown in Figure 5.
As can be seen from the above figure, the simulation accuracy of the hydrodynamic model tends to be consistent with the measured value. The maximum deviation of the simulation was 0.26 m, and the minimum deviation was only 0.01 m; the NSE = 0.86. The simulation accuracy was expected and met the requirements of subsequent hydraulic response analysis.

3. Project Case

3.1. Operation Setting

This study took the upstream and downstream canals of the Paihekou pumping station as an example, using the Xiaohe branch line to control the flow of the intake gate as the upper boundary, the Paihekou pumping station as the inner boundary, and the water level in front of the Shushan pumping station as the lower boundary. The influence of the pumping station unit adjustment on the hydraulic response characteristics of the channel was studied. During the actual operation of the project, affected by the time-of-use electricity price, the pumping stations along the line usually chose asynchronous regulation to reduce the costs. At the same time, to make full use of the self-adjusting ability of the canal and pond, the dispatcher will also adjust the time according to the actual choice. However, when the water intake of the channel increases and the downstream pumping station is not adjusted in time, the water level in front of the station will gradually rise until it exceeds the limit. According to the actual needs of maintaining the safe operation of the project, the earliest and latest regulation time of the pump station were studied, and the adjustable time range was provided for the dispatchers. It was assumed that the current flow in and out of the channel is balanced, and the overflow of the inlet sluice is controlled by adjusting the small junction line according to the single flow value of the Paihekou pumping station. The water level of the downstream Shushan pumping station was fixed, including six working conditions of 5.8, 6.6, 7.6, 8.6, 9.6, and 10.7 m. Table 2 shows all the conditions of the flow changes at the upstream boundary for the regulation time.

3.2. Feasible Domain of Safety Regulation Time

Through the hydrodynamic model calculations, the downstream overrun time is significantly shorter than the upstream overrun time, so the water level in front of the Paihekou pumping station is not overrun as the regulation target. The earliest regulation time is 0 h, and the latest regulation time is calculated following the order of the working conditions set in Table 2, as shown in Figure 6.
As can be seen from Figure 6a,b, for a drainage basin, as long as the initial flow rate, downstream water level, and the amount of flow variation are determined, there will be the latest regulation time, and for the same initial flow rate and downstream water level, the regulation time will decrease as the amount of flow variation increases; at the same initial flow rate and amount of flow variation, the latest regulation time will decrease as the water level increases. For the same flow change, the relationship between the downstream water level and the initial flow and the latest regulation time, as can be seen from Figure 6c, when the flow change is the same, with the same downstream water level, the latest regulation time with the initial flow increases and then decreases the trend.
As can be seen from Figure 6, the hydraulic response characteristics can be expressed as a function of some kind, so a numerical method can be used to fit the hydraulic response characteristics to the relational equation, thus providing theoretical support for the rapid regulation of the channel.

3.3. Parametric Sensitivity Analysis

To quickly calculate the regulation time, the Sobol global sensitivity analysis method was used to analyze the most-sensitive factor for the regulation time, which results in a fast prediction equation for calculating the regulation time that is applicable in different situations.

3.3.1. Sobol Global Sensitivity Analysis Method

Parameter sensitivity analysis refers to the degree of contribution of the independent variables of the function to the dependent variable of the function. The more-sensitive independent variables are also more important for the dependent variable, and the selection of the more-sensitive independent variables is particularly important for generating a fast calculation of the regulation time equation.
In the process of calculating the regulation time for the hydrodynamic model, the amount of flow variation, the initial flow, and the downstream boundary level of the model all affect the regulation time, so the Sobol method was used to analyze the sensitivity of the three variables above and select the best-fitting variable. The process used the Sobol sequence sampling method to obtain 1200 parameter samples, which were substituted into the hydrodynamic model for cyclic calculations. The Nash–Sutcliffe efficiency coefficient was chosen to characterize the degree of agreement between the calculated and measured values of the model. As the focus of the pumping station is to consider the effect of different parameters on the water level changes, the pre-station water level at the Paihekou pumping station was the objective function.

3.3.2. Analysis of the Results of the Sobol Method

By comparing the total sensitivity index of the Sobol method, the multi-factor problem can be transformed into a fewer-factor problem or a single-factor problem, which greatly simplifies the work. The results showed that the total sensitivity of the amount of flow variation is higher than that of the initial flow and downstream water level with the water level in front of the Paihekou pumping station as the objective function. Therefore, the amount of flow variation was determined to be the most-sensitive factor affecting the regulation time. The sensitivity indicators for each parameter of the Sobol method are shown in Figure 7.

3.4. Fast Computational Equation Fitting

In the actual project, to protect the safety of the channel, the Paihekou pumping station often runs three units and stabilizes the water level to operate at the designed level, thus saving energy and achieving safe water transfer. For this reason, the fitting equation was selected for the working conditions of a selected initial flow rate of 113.03 m3/s and a downstream water level of 7.6 m.
According to the results of the parameter sensitivity analysis in Section 3.1, it is known that the amount of change in flow is the most-sensitive factor for the regulation time, so the amount of change in flow was used as the independent variable, and the latest regulation time was used as the dependent variable to fit the fast equation for the regulation time. The univariate fitting equation due to the form of the fitting function has a variety of methods to select the best-fitting equation, so there is a need to determine the specific form of the fitting equation. For this purpose, the linear function, exponential function, power function, and logarithmic function were selected for the initial flow rate of 113.07 m3/s. The downstream water level of 7.6 m was chosen for the conditions to fit using Matlab’s toolbox. The results of the fitting are shown in Table 3.
As shown in Table 3, in the form of the fitting equation, the single variable should be fit in the form of a power function.
A univariate equation was used for the fit, and the equation for the fit is:
H t = 961.68 x - 1.022
where Ht is the latest time for regulation, h, and x is the flow change, m3/s.

3.5. Test of the Fitting Equation

To test the accuracy of the fitting equation, different amounts of flow variation were selected to test the general applicability of the fitting equation, and the selected working conditions are shown in Table 4, while the results of the test are shown in Figure 8.
As demonstrated in Figure 8, the simulation performed better with the NSE = 0.98. The latest regulation time derived by fitting the equation tended to be spatially consistent with the latest regulation time predicted by the model. Thus, it can be demonstrated that the engineering dispatching clock can be perfectly adapted to the most-recent regulation time determined by interpolation through the method of fitting the equation, replacing the conventional hydraulics model, and offering safe dispatching decisions for the dispatchers. This can lessen the workload of the schedulers.

4. Conclusions

This paper presented the idea of the earliest and latest regulation time of the regulation building under the flow switching conditions of the open-channel water transfer project with engineering safety as the objective and used the upstream and downstream of the Paihekou pumping station of the river diversion project as the study area for the example analysis. This concept is based on the one-dimensional non-constant flow dynamics numerical simulation model. The key findings are listed below:
(1)
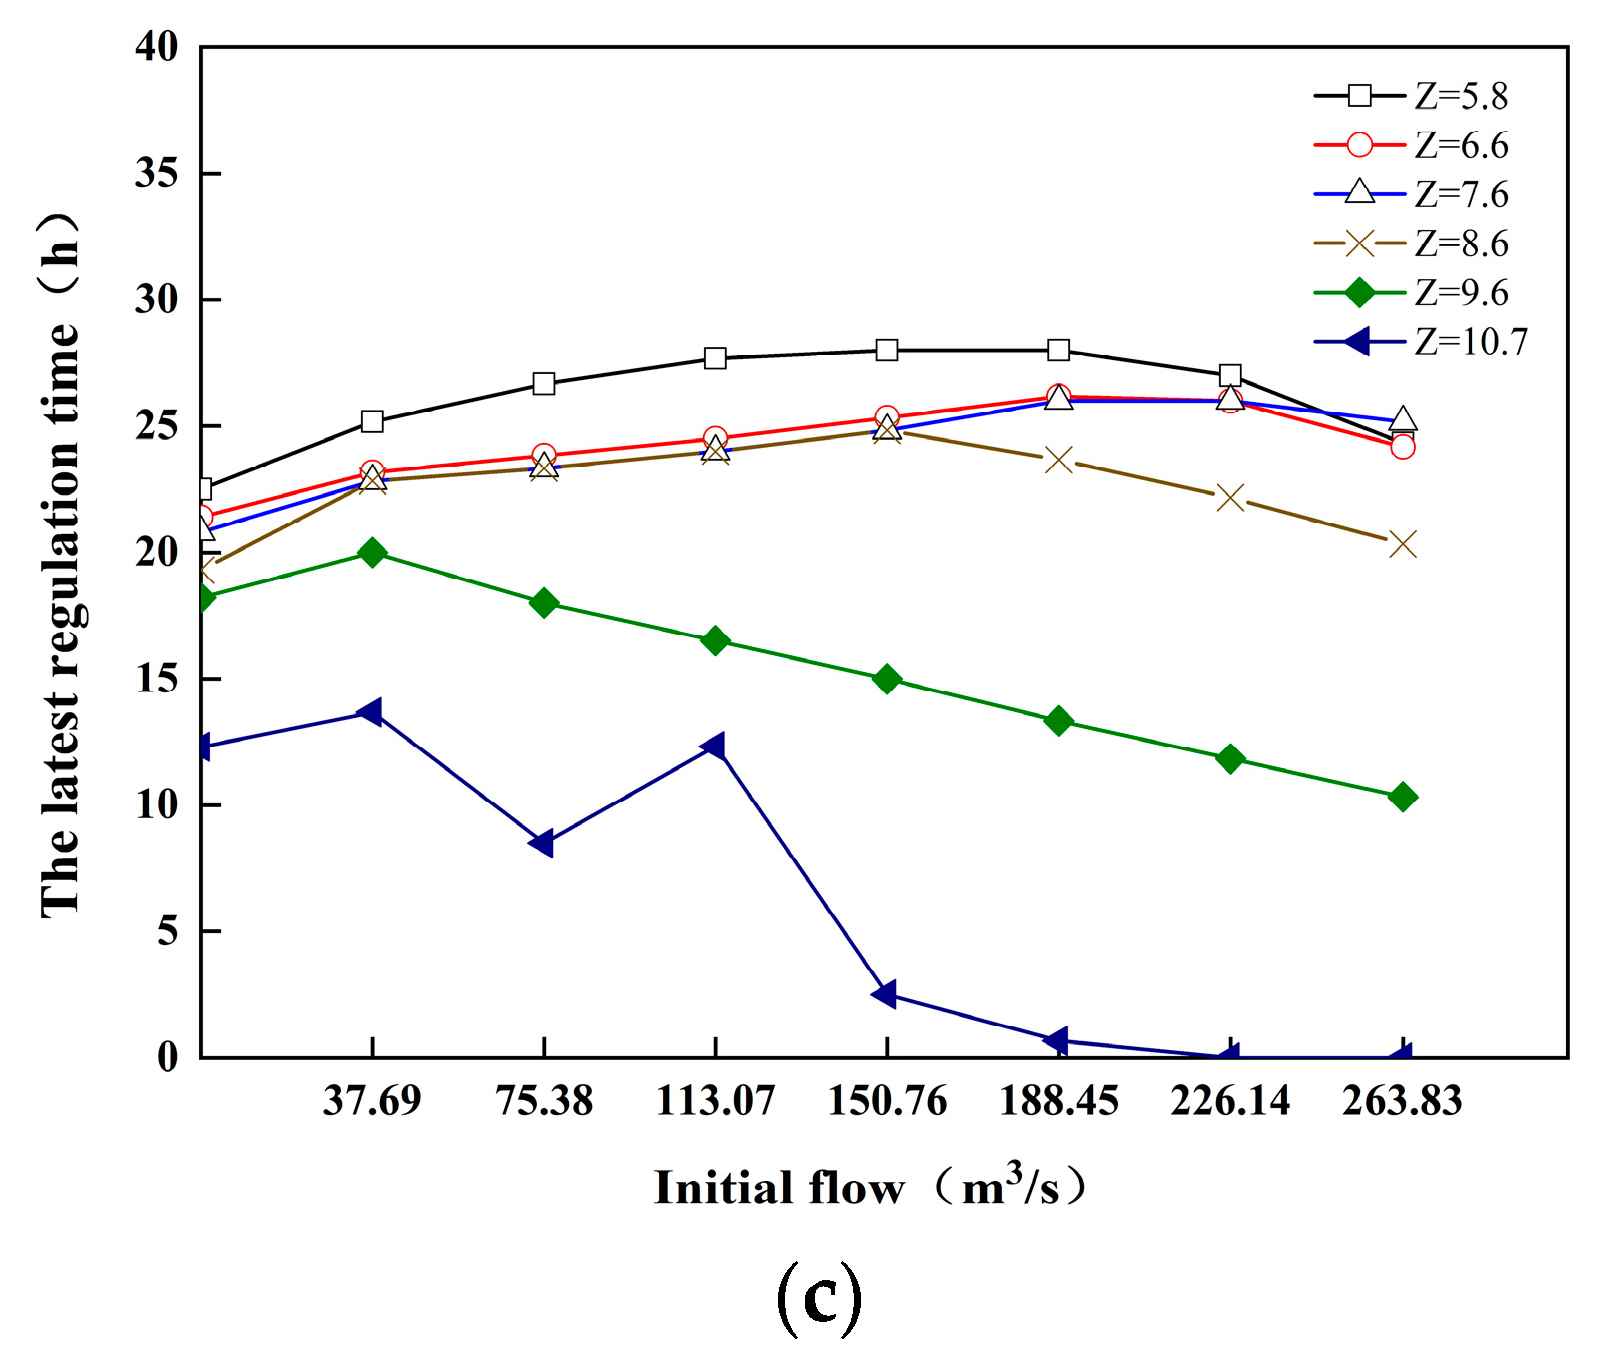
The latest regulation time at the Paihekou pumping station upstream and downstream was calculated in this study to determine the effects of the flow change, downstream water level, and upstream initial flow. It was found that, for the same initial flow and downstream water level, the regulation time decreased with the increase in the flow variation volume; for the same initial flow and flow variation volume, the latest regulation time decreased with the increase in the water level. The latest regulation time with the starting flow increased initially and subsequently reduced in a trending format for the same flow variation and downstream water level conditions.
(2)
The overall sensitivity index of the flow variation was found to be at the maximum when using the Sobol global sensitivity analysis method at the latest regulation time, which is connected to the starting upstream flow, the flow variation, and the downstream water level. At the same time, it was suggested for the method of the fitting equation to be used for the calculation of the most-recent regulation time in order to calculate it rapidly. The hydrodynamic model was used for testing, and the amount of flow change was chosen as a one variate to suit the computation of the most-recent regulation time. The results showed that the effect of the fit was better with the computed NSE = 0.98, and the fitting equation can be a perfect replacement.

Author Contributions

N.Z. and H.R.: conceptualization, data curation, formal analysis, investigation, methodology, software, validation, visualization, writing—original draft, and writing—review and editing. F.L.: resources, supervision, funding acquisition, and project administration. All authors have read and agreed to the published version of the manuscript.

Funding

This research was funded by the National Key Research and Development Program of China, Grant Number 2017YFC0404504, and the National Water Pollution Control and Treatment Science and Technology Major Project, Grant Number 2017ZX07602-002.

Data Availability Statement

Not applicable.

Conflicts of Interest

The authors declare no conflict of interest.

References

  1. Zhang, Z.; Tian, Y.; Lei, X.H. Study and application of general unsteady flow simulation model for complex open channel water transfer Project. In Proceedings of the 2018 CHES Annual Conference, Amsterdam, The Netherlands, 9–12 September 2018. [Google Scholar]
  2. Litrico, X.; Fromion, V. Simplified Modeling of Irrigation Canals for Controller Design. J. Irrig. Drain. Eng. 2004, 130, 373–383. [Google Scholar] [CrossRef]
  3. Qi, J.S.; Cui, Y.R.; Wang, S.Y. Analysis of Hydraulic Response in Emergency Gate Control of the Water Supply Project in North Xinjiang. J. Water Resour. Archit. Eng. 2021, 19, 250–256. [Google Scholar]
  4. Li, K.B.; Shen, B.; Li, Z.L. Open channel hydraulic response characteristics in irrigation area based on unsteady flow simula-tion analysis. Trans. Chin. Soc. Agric. Eng. 2015, 31, 107–114. [Google Scholar]
  5. Schuurmans, J.; Clemmens, A.J.; Dijkstra, S.; Hof, A.; Brouwer, R. Modeling of Irrigation and Drainage Canals for Controller Design. J. Irrig. Drain. Eng. 1999, 125, 338–344. [Google Scholar] [CrossRef]
  6. Bautista, E.; Clemmens, A.J. Volume Compensation Method for Routing Irrigation Canal Demand Changes. J. Irrig. Drain. Eng. 2005, 131, 494–503. [Google Scholar] [CrossRef]
  7. Parrish, J. A Methodology for Automated Control of Sloping Canals; University of Iowa: Lowa City, IA, USA, 1997. [Google Scholar]
  8. Zheng, H.Z.; Tian, Y.; Wang, C. Study on the Predictive Control Method of Cascade Pumping Stations in Water Transfer System. Yellow River 2018, 40, 140–143. [Google Scholar]
  9. Wahlin, B.T.; Clemmens, A.J. Automatic downstream water-level feedback control of branching canal networks: Simula-tion results. J. Irrig. Drain. Eng. 2006, 132, 208–219. [Google Scholar] [CrossRef]
  10. Lu, L.B.; Lei, X.H.; Tian, Y. Research on the Characteristic of Hydraulic Response in Open Channel of the Cascade Pumping Station Project in an Emergent State. J. Basic Sci. Eng. 2018, 26, 263–275. [Google Scholar]
  11. Li, M.X.; Tian, Y.; Lei, X.H. Analysis onemergency response time for accidental pump—Stop at multi—Stage pumping station of Water Diversion Project from Yangtze River to Huaihe River. Yangtze River 2021, 52, 212–217. [Google Scholar]
  12. Liu, Z.Y.; Liu, M.Q. Analysis and Control of Pump-stopping Hydraulic Transient in Cascade Water Supply Pumping Station. China Rural Water Hydropower 2006, 7, 32–34. [Google Scholar]
  13. Zhang, Z.; Lei, X.; Tian, Y.; Wang, L.; Wang, H.; Su, K. Optimized Scheduling of Cascade Pumping Stations in Open-Channel Water Transfer Systems Based on Station Skipping. J. Water Resour. Plan. Manag. 2019, 145, 05019011. [Google Scholar] [CrossRef]
  14. Yan, P.; Zhang, Z.; Lei, X.; Zheng, Y.; Zhu, J.; Wang, H.; Tan, Q. A Simple Method for the Control Time of a Pumping Station to Ensure a Stable Water Level Immediately Upstream of the Pumping Station under a Change of the Discharge in an Open Channel. Water 2021, 13, 355. [Google Scholar] [CrossRef]
  15. Zhu, J.; Zhang, Z.; Lei, X.; Yue, X.; Xiang, X.; Wang, H.; Ye, M. Optimal Regulation of the Cascade Gates Group Water Diversion Project in a Flow Adjustment Period. Water 2021, 13, 2825. [Google Scholar] [CrossRef]
  16. Belaud, G.; Litrico, X.; Clemmens, A.J. Response Time of a Canal Pool for Scheduled Water Delivery. J. Irrig. Drain. Eng. 2013, 139, 300–308. [Google Scholar] [CrossRef]
  17. Burt, C.M.; Feist, K.E.; Piao, X.S. Accelerated Irrigation Canal Flow Change Routing. J. Irrig. Drain. Eng. 2018, 144, 6. [Google Scholar] [CrossRef]
  18. Liao, W.; Guan, G.; Tian, X. Exploring Explicit Delay Time for Volume Compensation in Feedforward Control of Canal Systems. Water 2019, 11, 1080. [Google Scholar] [CrossRef]
  19. Kong, L.; Li, Y.; Tang, H.; Yuan, S.; Yang, Q.; Ji, Q.; Li, Z.; Chen, R. Predictive control for the operation of cascade pumping stations in water supply canal systems considering energy consumption and costs. Appl. Energy 2023, 341, 121103. [Google Scholar] [CrossRef]
  20. Khatavkar, P.; Mays, L.W. Real-Time Operation of Water-Supply Canal Systems under Limited Electrical Power and/or Water Availability. J. Water Resour. Plan. Manag. 2020, 146, 04020012. [Google Scholar] [CrossRef]
  21. Kucuk, H.; Turan, M.; Yarali, K.; Al-Sanabani, H.; Iskefiyeli, M. A new algorithm for load shifting operation of water pumping stations. J. Fac. Eng. Archit. Gaz. 2021, 36, 2087–2093. [Google Scholar]
  22. Shahdany, S.M.H.; Maestre, J.M.; van Overloop, P.J. Equitable Water Distribution in Main Irrigation Canals with Constrained Water Supply. Water Resour. Manag. 2015, 29, 3315–3328. [Google Scholar] [CrossRef]
  23. Wang, J.P.; Lv, W.B.; Fan, Q.F. New Empirical Equations of Equilibrium Flow Scour Depth of Open Channel Outlet. Water Resour. Power 2013, 31, 139–140. [Google Scholar]
  24. Xia, W.Y.; Zhao, X.D.; Zhang, X.Z. Application of Empirical Equation of Sediment Transport Capacity in Forecast of Riv-erbed Erosion and Deposition of Jiaojiang River Estuary. Water Resour. Power 2017, 35, 101–103. [Google Scholar]
  25. Li, G.H.; Zhang, Z.; Kong, L.Z. Research on the Hydraulic Control Method of Shaping II Hydropower Station. China Rural Water Hydropower 2022, 1, 196–199. [Google Scholar]
  26. Malaterre, P.-O.; Rogers, D.C.; Schuurmans, J. Classification of Canal Control Algorithms. J. Irrig. Drain. Eng. 1998, 124, 3–10. [Google Scholar] [CrossRef]
  27. Mu, J.-B.; Zhang, X.-F. Real-Time Flood Forecasting Method With 1-D Unsteady Flow Model. J. Hydrodyn. 2007, 19, 150–154. [Google Scholar] [CrossRef]
  28. Wang, C.H.; Li, G.Z.; Xiang, X.H. Practical River Network Flow Calculation; Hohai University Press: Nanjing, China, 2015. [Google Scholar]
  29. Litrico, X.; Fromion, V.; Baume, J.-P.; Arranja, C.; Rijo, M. Experimental validation of a methodology to control irrigation canals based on Saint-Venant equations. Control Eng. Pract. 2005, 13, 1425–1437. [Google Scholar] [CrossRef]
  30. Mehmed, Y. Steady Non-Uniform Flow in Open Channel; Water Resources and Electric Power Press: Beijing, China, 1987. [Google Scholar]
  31. Wang, C.; Yang, J.; Nilsson, H. Simulation of Water Level Fluctuations in a Hydraulic System Using a Coupled Liquid-Gas Model. Water 2015, 7, 4446–4476. [Google Scholar] [CrossRef]
  32. Yan, P.; Zhang, Z.; Lei, X.; Hou, Q.; Wang, H. A multi-objective optimal control model of cascade pumping stations considering both cost and safety. J. Clean. Prod. 2022, 345, 131171. [Google Scholar] [CrossRef]
  33. Zhang, Z. Research on Perception and Regulation Model of Water Delivery Process in Open Channel Water Transfer Project. Ph.D. Thesis, Hohai University, Nanjing, China, 2020. [Google Scholar]
  34. Olszewski, P. Genetic optimization and experimental verification of complex parallel pumping station with centrifugal pumps. Appl. Energy 2016, 178, 527–539. [Google Scholar] [CrossRef]
Figure 1. Preissmann weighted implicit four-point scheme.
Water 15 03201 g001
Figure 2. The earliest and latest regulation times.
Water 15 03201 g002
Figure 3. Study area graph.
Water 15 03201 g003
Figure 4. Specific parameters of the study area.
Water 15 03201 g004
Figure 5. Comparison of the actual observation and simulation results.
Water 15 03201 g005
Figure 6. The result chart of the latest regulation time. (a) Initial flow of 0–113.07 m3/s. (b) Initial flow of 145.5–258.13 m3/s. (c) Relationship between downstream water level, initial flow, and latest regulation time for the same amount of flow change.
Water 15 03201 g006aWater 15 03201 g006b
Figure 7. Parameter-sensitive indicator graph.
Water 15 03201 g007
Figure 8. The model validation results.
Water 15 03201 g008
Table 1. Engineering foundation information of Paihekou pumping station and Shushan pumping station.
The Pump StationTypeDesign Flow
(m3/s)
NumberDesign Flow
(m3/s)
Water Level in Front of Station
Design (m)Max (m)Min (m)
PaihekouAxial flow37.699301.54.105.803.60
ShushanAxial flow36.2582907.6010.705.80
Table 2. Flow changes at the upstream boundary.
Initial Upstream Flow
(m3/s)
037.6975.38113.07150.76188.45226.14263.83
Flow change
(m3/s)
37.69
75.3875.38
113.07113.07113.07
150.76150.76150.76150.76
188.45188.45188.45188.45188.45
226.14226.14226.14226.14226.14226.14
263.83263.83263.83263.83263.83263.83263.83
301.5301.5301.5301.5301.5301.5301.5301.5
Table 3. Equation fitting form.
NumberVariableFitting Equation FormR2
1Flow changeLinear function fitting0.77
2Exponential function fitting0.92
3Logarithmic function fitting0.90
4Power function fitting0.99
Table 4. Flow switching conditions tested.
NumberFlow Change (m3/s)NumberFlow Change (m3/s)
110660
220770
330880
440990
55010100
Disclaimer/Publisher’s Note: The statements, opinions and data contained in all publications are solely those of the individual author(s) and contributor(s) and not of MDPI and/or the editor(s). MDPI and/or the editor(s) disclaim responsibility for any injury to people or property resulting from any ideas, methods, instructions or products referred to in the content.

