Article

Flow Field and Gas Field Distribution of Non-Submerged Cavitation Water Jet Based on Dual-Nozzle with Concentric Configuration

1
College of New Energy, China University of Petroleum (East China), Qingdao 266580, China
2
State Key Laboratory of Heavy Oil Processing, China University of Petroleum (East China), Qingdao 266580, China
*
Author to whom correspondence should be addressed.
Water 2023, 15(16), 2904; https://doi.org/10.3390/w15162904
Submission received: 21 June 2023 / Revised: 29 July 2023 / Accepted: 6 August 2023 / Published: 11 August 2023
(This article belongs to the Special Issue Advanced Research on Hydraulic Engineering and Hydrological Modelling)

Abstract

:
Cavitation water jet peening is an efficient and green surface treatment technology. The dual-nozzle can realize a cavitation water jet in air (non-submerged condition), which can be used for the surface treatment of large structures. The flow field characteristics of the dual-nozzle determine the cavitation effect. In this paper, the simulation of a cavitation water jet in air is carried out using Fluent software. The flow field characteristics containing velocity distribution, impact pressure, and gas phase volume fraction distribution are studied in detail. Furthermore, the effects of the nozzle structure parameters and incidence pressure on flow field characteristics are discussed. It was found that the structure parameters of the inner nozzle have a great influence on the flow field characteristics. Setting a contraction segment and expansion segment can improve the impact pressure and increase the intensity of the cavitation jet. Increasing the throat diameter and incidence pressure of the internal nozzle is also beneficial to improve the impact pressure and cavitation intensity. In order to assure a good cavitation effect, nozzle optimization should be performed. This study has guiding significance for the design of the dual-nozzle for a non-submerged cavitation water jet.

1. Introduction

Water jet technology is a rapidly developing, environmentally friendly machining process [1]. At present, branch technologies such as the abrasive water jet, pulsed water jet, and cavitation water jet have been gradually developed [2,3,4]. Water jet technology is used in a wide range of fields such as cutting, cleaning, rock breaking, and well drilling [5,6,7]. Water jet peening is a new surface strengthening technology, which originated in the 1980s. Water jet peening can introduce compressive residual stresses on surfaces and subsurfaces, and improve the fatigue life of components [8]. Cavitation peening, which is a new and more efficient surface treatment technology, was developed on the basis of water jet peening [9]. Compared with traditional water jet peening, cavitation water jet peening is a more effective surface strengthening technique with the characteristics of large process range and high treatment efficiency.
Cavitation shot peening uses the huge impact force generated by the collapse of cavitation bubbles to strengthen the surface of the workpiece [10]. Therefore, the number of cavitation bubbles determines the impact pressure and range of action of the cavitation jet. In order to improve the efficiency of cavitation peening, it is necessary to enhance the cavitation intensity in the flow field. Wenqiang Dong established a model of a submerged angular cavitation nozzle, and the flow field of the submerged cavitation nozzle was studied by numerical simulation [11]. It was proved that optimizing the nozzle structure can improve the cavitation effect (the size of the cavitation cloud) in the flow field. Mingming Ge investigated the effect of temperature on the intensity and the dynamics of cavitation [12]. It is found that when the temperature reaches the range of 55–60, the cavitation extent is larger and the vapor cloud shedding is more vigorous [13].
Many attempts have been made to investigate the capabilities of cavitation water jet peening for treating different materials by experimental method. During the initial stage of cavitation water jet peening development, cavitation bubbles are generated by injecting a high-speed water jet into water. Enomoto et al. [14] first reported the injection of a high-speed water jet into water to form a submerged jet, which was used to mitigate the stress corrosion cracking of pressure vessels. Odhiambo and Soyama [15] revealed that the fatigue strength of carbonized chrome–molybdenum alloy steel was improved by submerged cavitation water jet peening. Han et al. [16] demonstrated experimentally that cavitation jets improved the fatigue strength and life of SAE1045 steel. Ju and Han [17] performed microstructure analysis of titanium and concluded that the strengthening mechanism of cavitation jets was caused by the observed twin-crystal and twin-crystal interactions. Hutli et al. [18] found that the high-speed submerged cavitating jets could be used for the surface modification of mechanical and electrostatic properties of aluminum alloy. Balamurugan et al. [19] found that the introduction of compressive residual stresses in gear teeth by cavitation peening can increase their life. To sum up, the abovementioned cavitation peening is a conventional submerged jet, i.e., a cavitation jet in water.
However, it is difficult to treat big pressure vessels and pipes using submerged cavitation jet due to the limitation of the water tank. In response to this problem, Soyama [20] used a low-speed water jet to replace the static water in the water tank, thus realizing the non-submerged cavitation water jet. The high-speed water jet and low-speed water jet were transported by an inner nozzle and external nozzle, respectively. This dual-nozzle realized cavitation jet in air without the submerged environment and treated any-size components in the site. Afterwards, Soyama [21,22] analyzed the beneficial effects of the non-submerged cavitation water jet on the residual stresses and fatigue strength of SUS316L stainless steel and demonstrated the effectiveness of the cavitation jet in air. An important parameter for the cavitation flow is cavitation number, which is a ratio of dynamic pressure and static pressure. To enhance the effect of cavitation peening, a pressurized chamber was used to optimize the cavitation condition considering the cavitation number [23]. After that, the geometry of the nozzle and the outlet bore of the nozzle throat were optimized, thereby enhancing the aggressive intensity of the jet by about 20 times [24,25]. Soyama et al. [26,27] made a detailed comparison between the compressive and the fatigue strength of stainless steel by cavitation peening, water jet peening, shot peening, and laser peening. They concluded that the fatigue strength of the cavitation-peened specimen is the highest. However, most of the current studies have not reported the details of the characteristics in the convection field.
Besides, as an impact treatment method, cavitation peening can also cause erosion damage to equipment surfaces if the working parameters are not appropriate. Yamauchi et al. [28] found that the useful function of cavitation water jet peening depends on the standoff distance. Smaller working distances are suitable for water jet cutting because of the concentration of jet energy and the small treatment area. Longer working distances are suitable for cavitation peening, which guarantees a certain treatment area without damaging the integrity of the surface. Therefore, it is important to accurately clarify the flow field distribution of cavitation water jet peening to determine the optimum conditions without inducing detrimental material erosion. Marcon et al. [29] investigated the effect of concentric jet velocity on cavitation intensity and peening performance for a jet formed by a coaxial double nozzle. It was also pointed out that the jet velocity and the working distance have a great influence on the cavitation intensity and impact performance. The higher the jet velocity, the greater the residual compressive stress that can be generated and the thicker the compressive stress layer. Subsequently, they studied the effects of nozzle dimensions and shape on cavitation intensity and peening performance in co-flow cavitation water jet [30]. However, how the nozzle size and jet pressure affect the flow field distributions are still unrevealed. No studies were performed on the flow field analysis of non-submerged cavitation water jet peening.
Therefore, the aim of this study is to clarify the flow field characteristics of the non-submerged cavitation water jet peening with dual-nozzle based on numerical simulation. The influences of the nozzle dimension and the internal and external pressure on the flow field characteristics were also discussed. This study is of great significance for its application in surface strengthening of actual welded structures.

2. Numerical Simulation

2.1. Geometric Model

Figure 1 shows the schematic of the setup for cavitation jets in air and the geometric dimensions of the concentrically configured dual nozzles. As shown in Figure 1a, the whole device consists of a high-pressure water pump, a low-pressure water pump, a nozzle, two pressure gauges, a sample holder, and water tanks A and B. When the device is started, the high-pressure water pump injects a high-speed water jet with a pressure of ph (20 MPa) into a low-speed water jet with a pressure of pw (0.08 MPa) to form a cavitation water jet.
The nozzle is the key component to generate the cavitation jet, and the nozzle in the device is composed of two parts: the inner nozzle and the external nozzle. The diameter of the inner and external nozzle are dH = 9 mm and dL = 70 mm, respectively. The standoff distance is H = 25 mm, which is the same for the inner and external nozzle. The outer diameter of the inner nozzle is 32 mm, the linear transition segment of the outer wall is 30 mm, and the length of the outer wall constriction segment is 45 mm; the straight segment of the outer nozzle is 20 mm and the inner wall constriction segment is 55 mm. For the inner nozzle, the length of the constriction segment is L = 7 mm, the height is s = 4 mm, and the angle of the contraction segment is α = 30°. The length of the expansion segment is w = 3.5 mm and the expansion angle is β = 45°. The diameter of the throat is d = 1 mm and the length is 7.5 mm.

2.2. Meshing and Boundary Condition

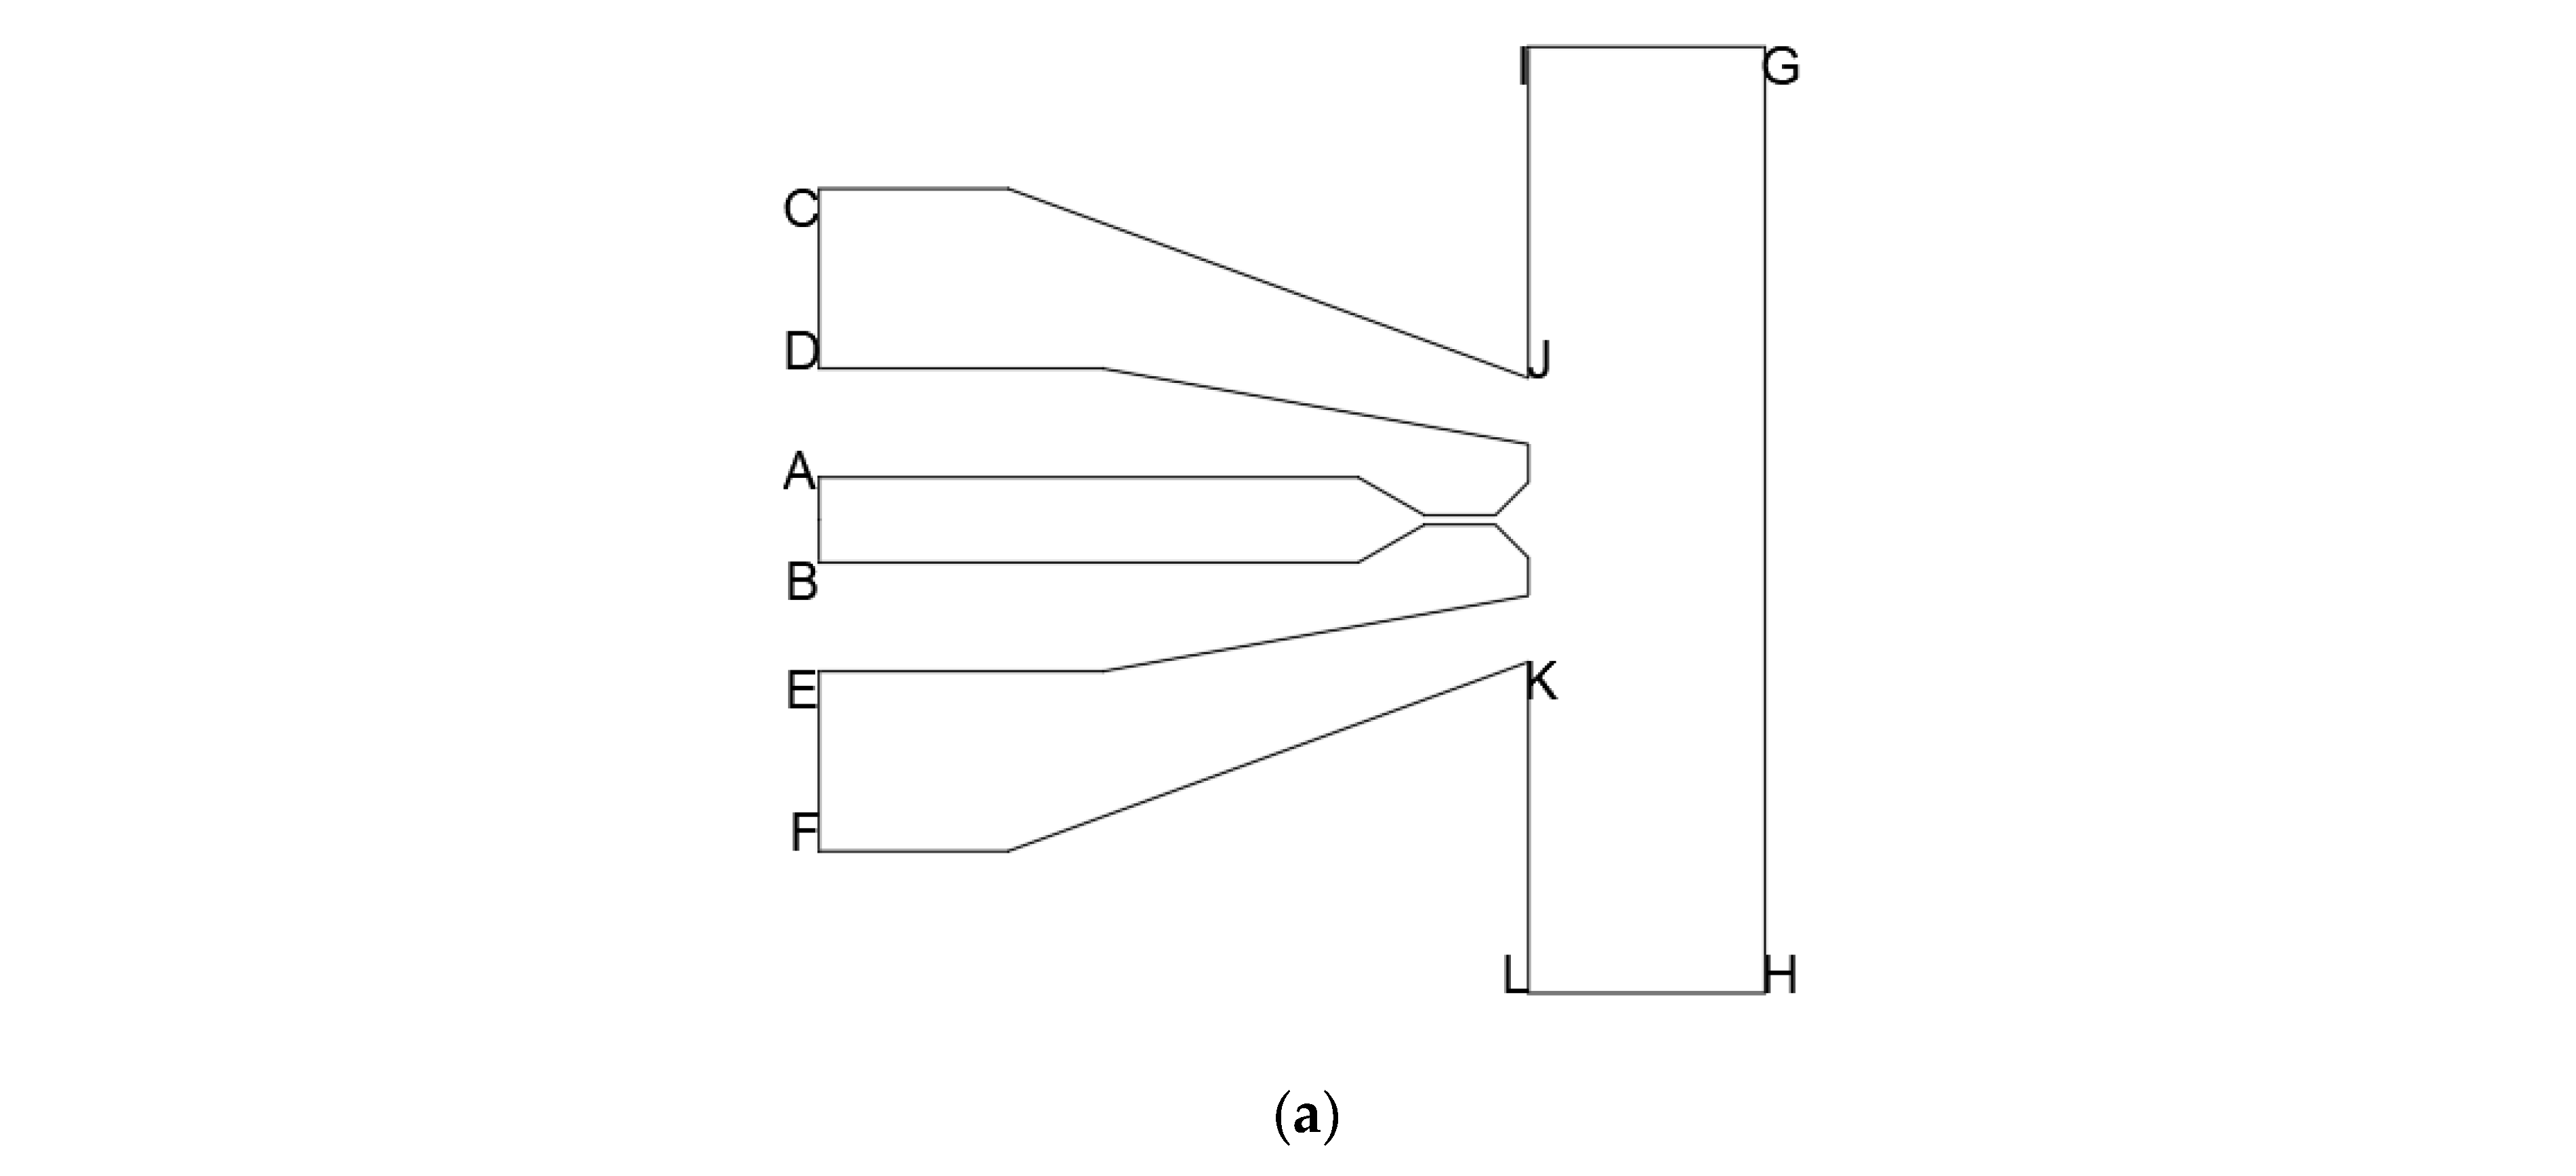
The calculation domain of the flow field is shown in Figure 2a. AB is the high-pressure water inlet. CD and EF are low-pressure water inlets. IJ, KL, IG and KH are pressure outlets. GH is the target surface.
The calculation domain is divided into structured grids by GAMBIT 2.4.6 software, and the core area of the jet and the shear layer near the nozzle outlet is encrypted. The grid of the calculation domain is shown in Figure 2b. In order to reduce the amount of calculation as much as possible while ensuring the calculation effect, the distance between the grid nodes is gradually increased from the center of the nozzle outlet to the downstream and the boundary. Keeping the Courant number within a reasonable range, the grid size at the nozzle outlet shear layer is controlled at about 0.01 mm and the overall grid number in the final calculation domain is 122,840. The values of Equisize Skew and EquiAngle Skew are below 0.54, indicating good grid quality.
The high-pressure inlet pressure is set to 20 MPa, and the low-pressure inlet pressure is set to 0.08 MPa. The initial gas phase fraction of the inlet is 0, the pressure outlet pressure is 101,325 Pa at atmospheric pressure, and the gauge pressure is 0. The solver uses a pressure-based solution. The explicit relaxation factors for momentum and pressure are both 0.75. The second-order windward format is used for fitting, where the time step is 1 × 10⁻⁶ s. When the residual error is controlled within 1 × 10⁻⁶, the calculation is considered to be basically convergent. The CPU used for the calculation is Intel(R) Xeon(R) Gold 6242R. The simulation calculation in this paper used a total of 2000 core hours.

2.3. Control Equation

2.3.1. Multiphase Flow Model

The common multiphase flow model contains the mixture model, VOF model, and Euler model. The mixture model or Euler model should be used to solve the calculation problems of the fluid containing bubbles, droplets, and particles with mass transfer between the fluids, as the VOF model is not suitable. Generally, the calculation results of the Euler model are more accurate than those of the mixture model but the latter requires less computer resources and has relatively high stability of the calculation process. In this study, the mixture model [31] is used:
t ρ m v m + ρ m v m = P + μ m v m + v m T + ρ m g m + F + k = 1 n α k ρ k v d r , k v d r , k
where F is the volume force, and v d r , k is drift velocity at k phase, which is described as follows:
v d r , v = v l v k = 1 n α k ρ k ρ m v v k
Then, the gas phase volume fraction equation can be obtained as follows:
t α v ρ v + · α v ρ v v m = · α v ρ v v d r , v

2.3.2. Turbulence Model

The basic turbulence models include the k-ε model and k-ω model. The k-ε model has better performance and accuracy in high-speed calculation. The SST k-ω model has a good calculation for vortex structures. The velocity gradient of the cavitation jet is quite large at the nozzle and there will be cavitation vortex distribution in the flow field. The capture of such cavitation is very important for the presentation of simulation results. Therefore, SST k-ω turbulence model is selected for simulation calculation.
The equations are as follows [32]:
t ρ k + x i ρ k u i = x j Γ k k x j + G k Y k + S k
t ρ ω + x i ρ ω u i = x j Γ ω ω x j + G ω Y ω + D ω + S ω
Γ k = μ + μ t σ k
Γ ω = μ + μ t σ ω
where Gk is the generating term of turbulent kinetic energy; Gω is the generating term of dissipation rate ω; Yk and Yω represent the dissipation of k and ω caused by turbulence, respectively; Γk and Γω are the effective diffusivity of k and ω, respectively; and σk and σω are the turbulent Prandtl numbers of k and ω, respectively. μt represents the turbulent viscosity, which is calculated by the following equation.
μ t = ρ k ω 1 max 1 α , S F 2 a 1 ω
F 2 = tanh Φ 2 2
Φ 2 = max 2 k 0.09 ω y , 500 μ ρ y 2 ω

2.3.3. Cavitation Model

Cavitation models include Singhal et al.’s model, the Zwart–Gerber–Belamri model, Schnerr and Sauer model, Kunz model, etc. The Zwart–Gerber–Belamri model can be used to simulate the cavitation effect in the mixture model and Euler model. It is easier to converge and saves computational resources. In this paper, the Zwart–Gerber–Belamri model is used as the cavitation model. The convergence result can be obtained quickly.
In cavitation, the mass transfer between the liquid and gas phases is controlled by the vapor transport equation:
t α ρ v + α ρ v V v = R e R c
where
  • v = vapor phase;
  • α = vapor volume fraction;
  • ρ v = vapor density;
  • V v = vapor phase velocity;
  • R e , R c = mass transfer source terms connected to the growth and collapse of the vapor bubbles, respectively.
Assuming that all the bubbles in a system have the same size, Zwart–Gerber–Belamri [33] proposed that the total interphase mass transfer rate per unit volume (R) is calculated using the bubble number densities and the mass change rate of a single bubble:
R = 3 α ρ v R b 2 3 P b P ρ l
where
  • α = vapor volume fraction;
  • ρ v = vapor density;
  • R b = bubble radius;
  • P b = bubble surface pressure;
  • P = local far-field pressure;
  • ρ l = liquid density.
Equation (12) is derived assuming bubble growth. In order to apply it to the bubble collapse process, Zwart–Gerber–Belamri proposed to replace it with Equation (13). Finally, they obtained the cavitation model as follows:
The Zwart–Gerber–Belamri model is described as follows:
If P P v
R e = F v a p 3 α nuc ( 1 α υ ) ρ υ R b 2 ( P v P ) 3 ρ l
If P P v
R c = F c o n d 3 α υ ρ υ R b 2 ( P P v ) 3 ρ l
where
  • P v = saturation vapor pressure;
  • F v a p (evaporation coefficient) = 50;
  • α n u c (volume fraction of gas nuclei) = 5 × 10⁻⁴;
  • ρ v = vapor density;
  • R b (bubble radius) = 1 × 10⁻⁶ m;
  • P = local far-field pressure;
  • ρ l = liquid density;
  • F c o n d (condensation coefficient) = 0.01.

2.4. Mesh Refinement Analysis

For the simulation of fluid dynamics, grid-independence verification is essential. In this paper, the minimum grid size was controlled in order to multiply the number of grids. Finally, six different numbers of grids were divided, as shown in Table 1.
In this paper, the velocity and the gas phase distribution in the flow field were the main focus. Therefore, the velocity along the axial direction and the distribution of the gas phase in the flow field were used as a measure of whether the number of meshes is sufficient.
As shown in Figure 3, as the number of grids multiplied, the maximum velocity increased and reached 200 m/s. It can be found that the velocity profiles overlapped when the number of grids reached 79,200. At this grid number, the velocity results in the flow field are already unaffected by the grid number.
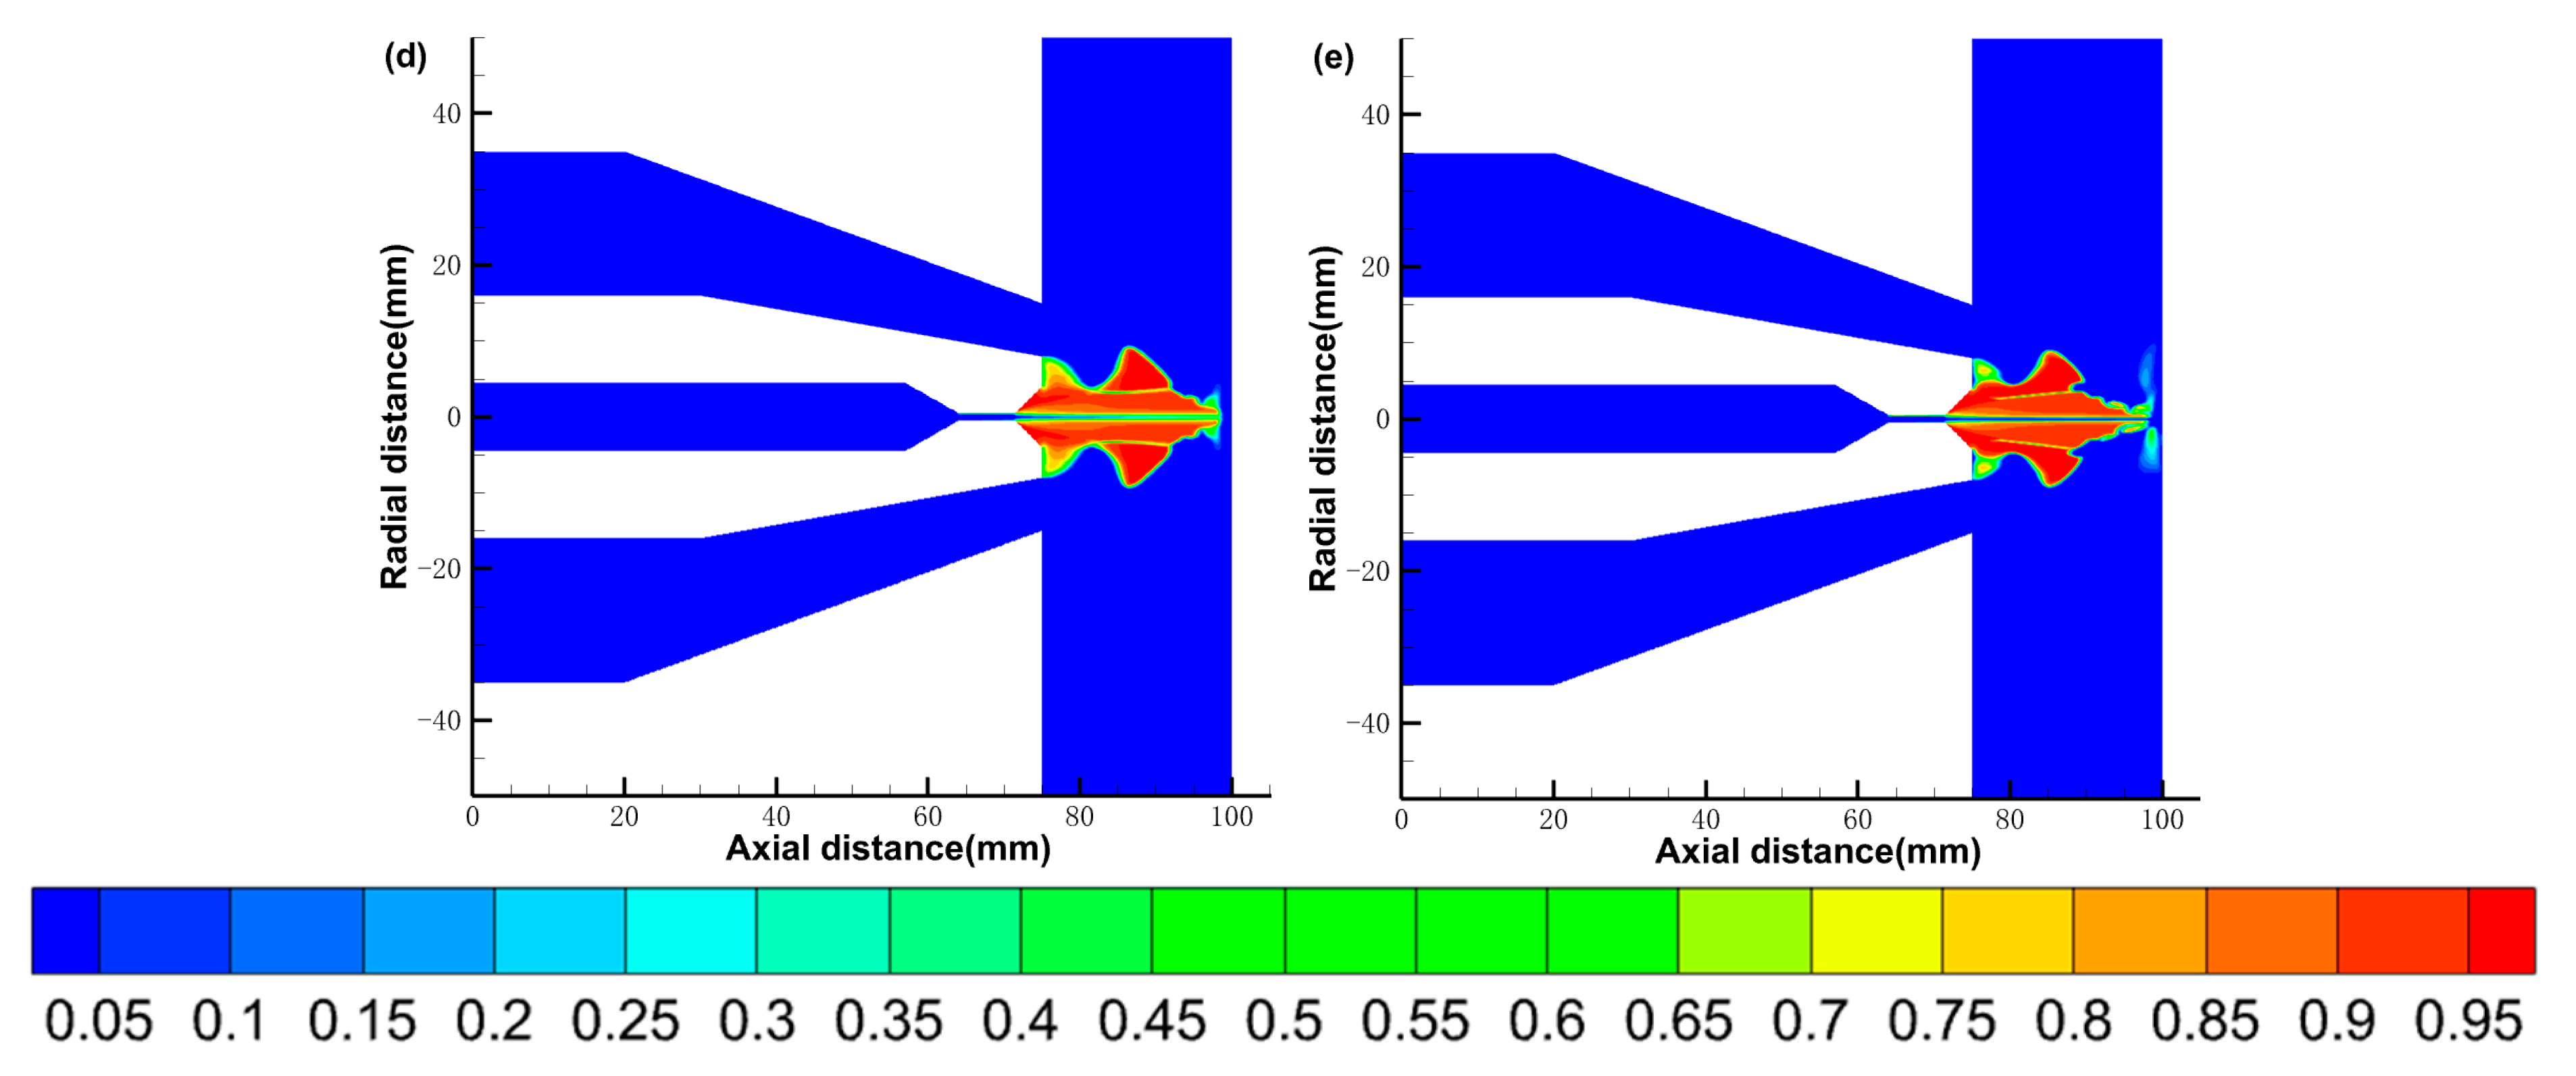
As shown in Figure 4, as the number of grids increased, the morphology of the gas phase within the flow field also changed. When the mesh number is 79,200, the separation of cavitation bubbles can already be simulated. When the grid number is encrypted from 122,840 to 245,400, the difference in calculation results is not much. Therefore, the simulation of the gas phase distribution can be achieved at the grid number of 122,840.
Therefore, combining the velocity results with the gas-phase cloud map results, the simulations in this paper all use a grid number of no less than 122,840 to exclude the effect of grid number on the simulation results.

2.5. Model Experimental Validation

In order to validate the reasonableness of simulations using the model above, some experiments results were compared with simulation results.
Figure 5a shows the morphology of the cavitation jet captured by Yang et al. [34] using a high-speed camera. The nozzle used in the experiment was modeled, and the parameters in the experimental environment were simulated as the initial boundary conditions. The simulation results are shown in Figure 5b.
Comparing the two figures, it can be found that the cavitation bubbles show a gradual growth trend in the range of x = 0~60 mm; after x = 70 mm, the vacuoles start to shed significantly. The general morphology of the cavitation jet and the process of vacuole growth, development, and shedding shown in the two figures are basically consistent. The morphological verification of the cavitation jets by simulation and experiment verifies that the model used in this paper is applicable to simulate cavitation jets.

3. Results and Discussions

3.1. Analysis of Flow Field Characteristics

3.1.1. The Gas Phase Distribution

The calculated results were processed using post-processing software to obtain a cloud diagram of the gas phase distribution within the flow field, as shown in Figure 6. In the figure, the darker the degree of red, the larger the gas content in the region, and closer to blue indicates lower gas content. From the figure, we can see that the maximum gas content reached 0.9 and there is a large range of gas phase area, which indicates that the nozzle can effectively produce the cavitation effect.

3.1.2. The Velocity Distribution

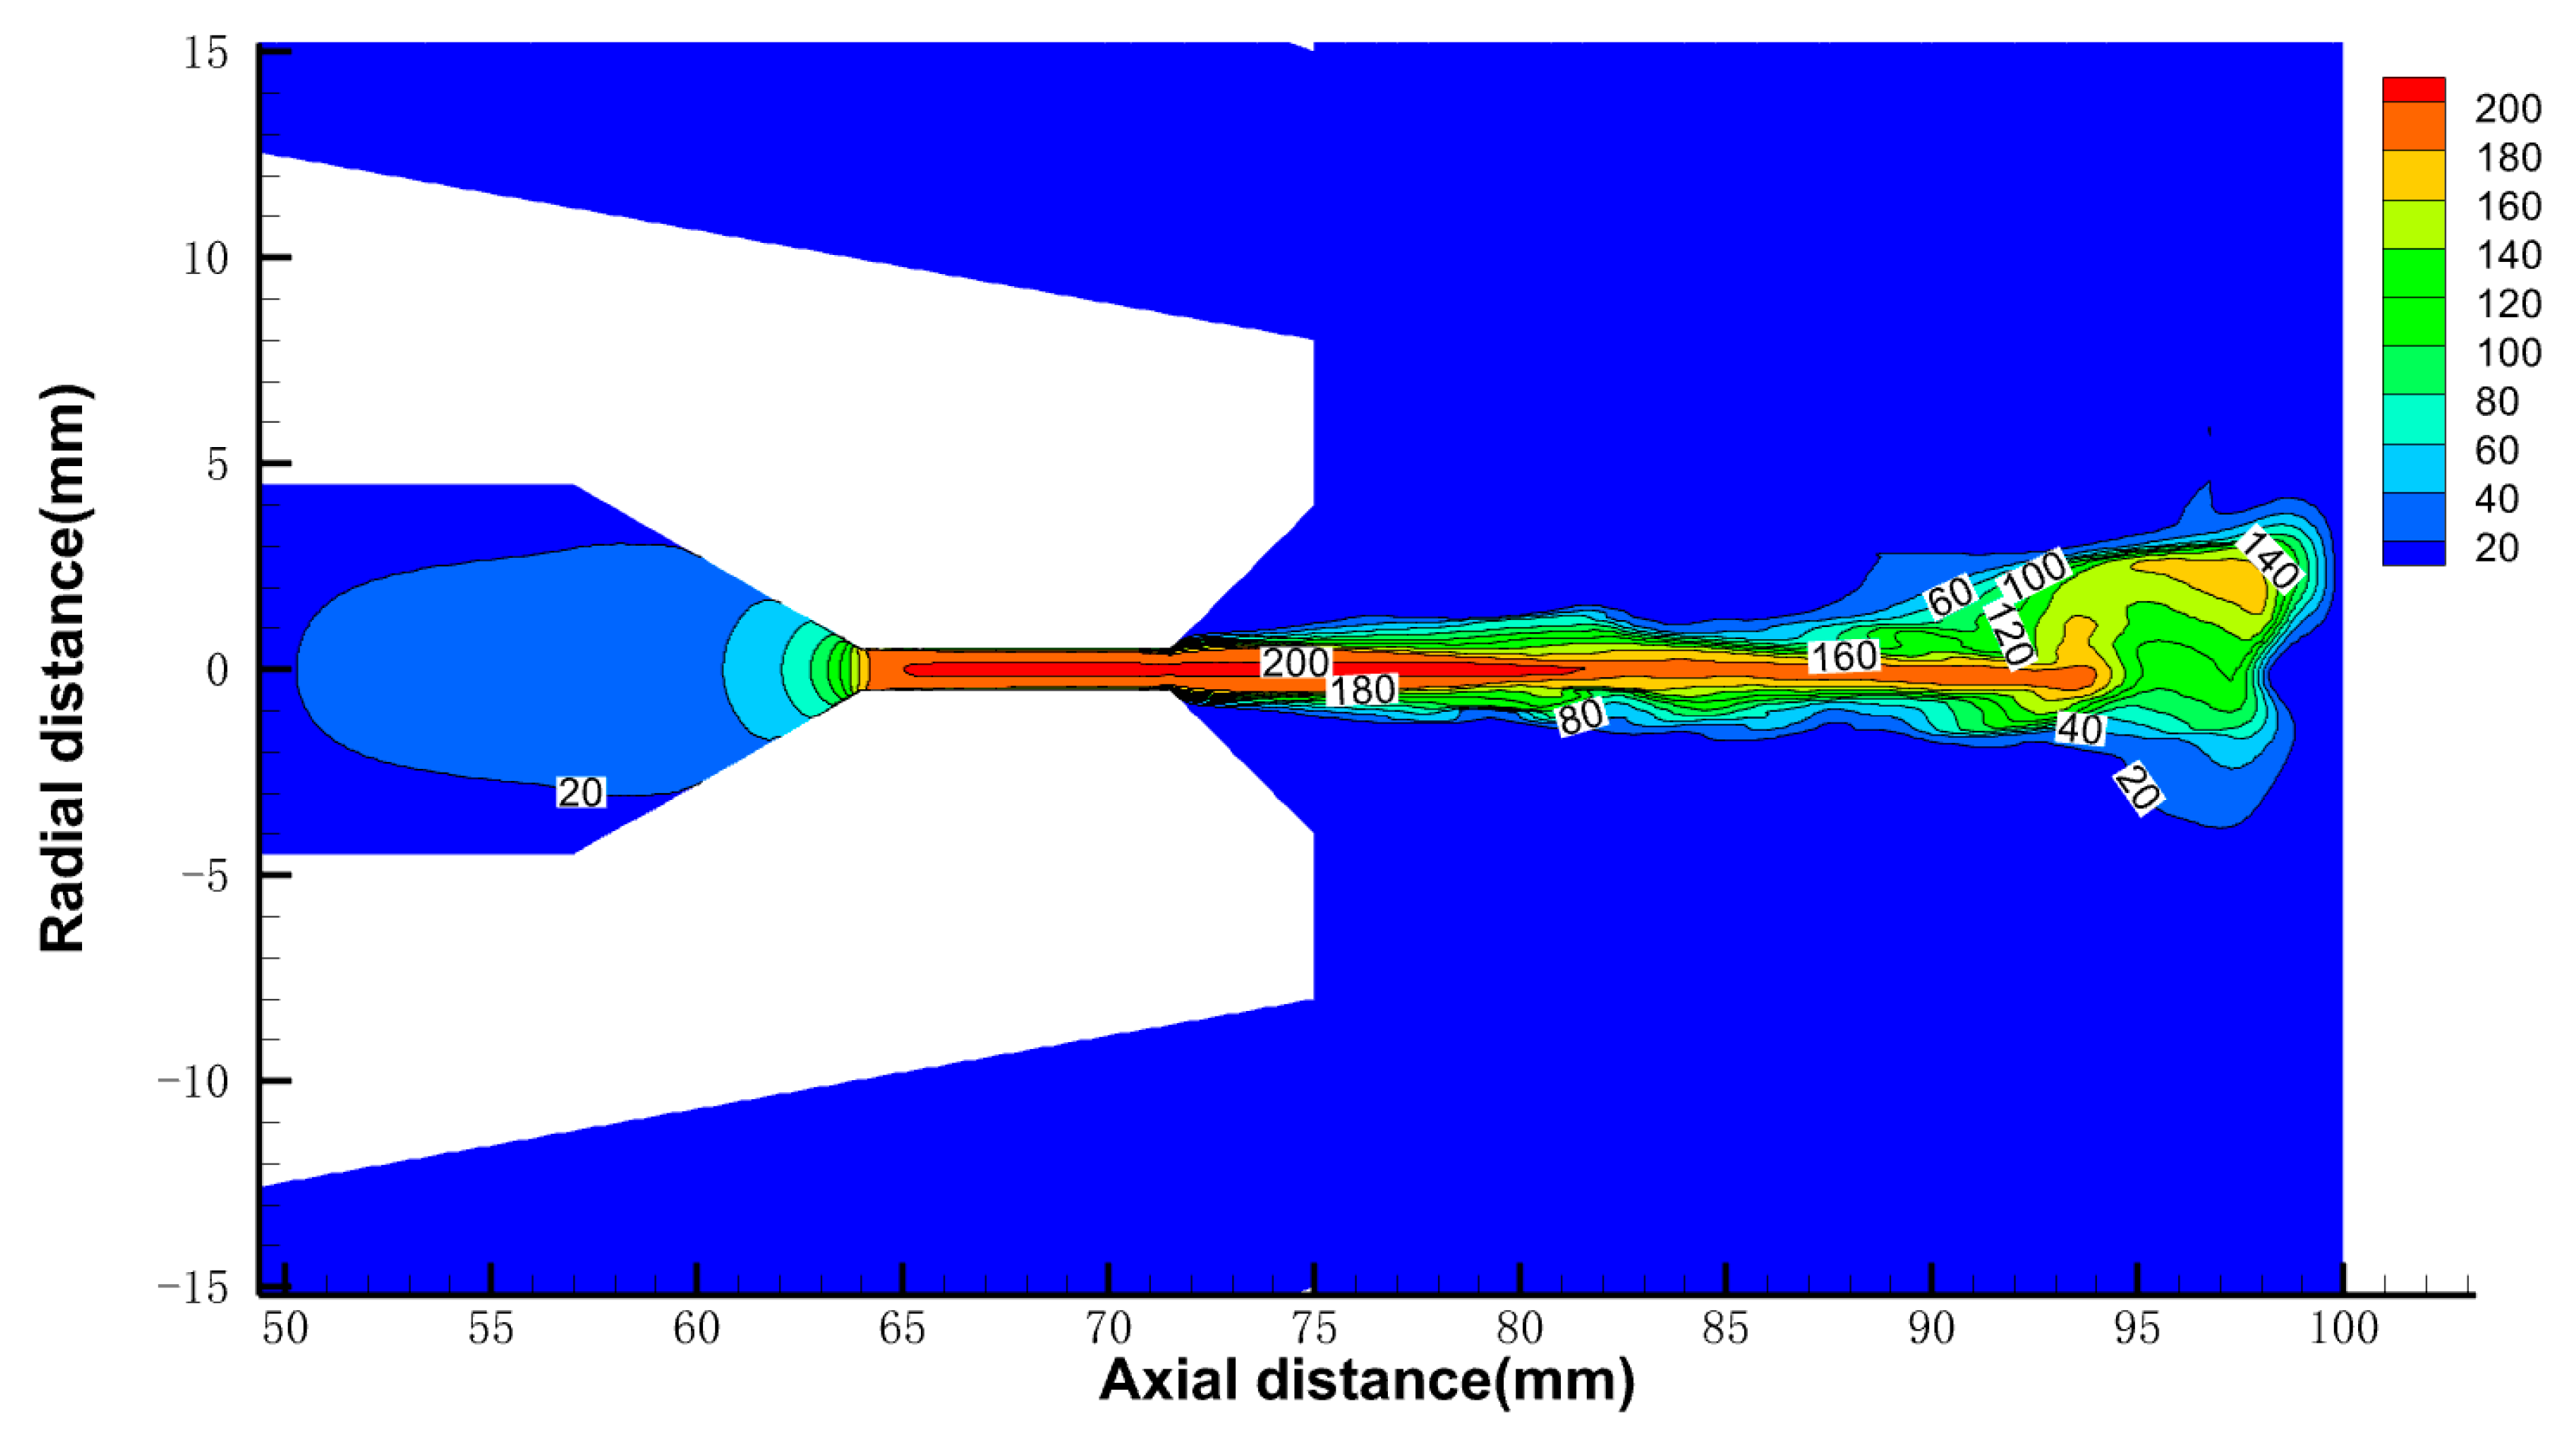
Figure 7 shows the contour distribution of axial velocity within the flow field. It can be seen that the jet velocity increases rapidly when flowing through the throat and the velocity reaches its maximum at the throat exit. From the throat exit to the outside of the flow field, the jet velocity presents obvious stratification due to the occurrence of shear. The middle part has the highest velocity, while the velocity in the surrounding part decreases rapidly. When the jet impinges on the surface of the specimen, the axial velocity decreases to 0 and the kinetic energy is transformed into pressure potential energy.

3.1.3. The Pressure Distribution

Figure 8 shows the impact pressure on the surface of the specimen with the radial distance from the center of the surface. The maximum impact pressure appears in the center of the water-jet-impacted position (the center of the surface of the specimen) and its value is about 9 MPa. Then, it rapidly declines with the increase in radial distance. However, the process of bubbles collapse was ignored in this simulation. The actual impact pressure on the surface of the specimen induced by the bubble collapses is not included in the simulation results. So, the simulation results may have deviations from the actual results.

3.2. Effects of Geometric Parameters of Inner Nozzle

On the basis of the conical composite nozzle shown in Section 2 (hereinafter referred to as nozzle A), a series of conical composite nozzles were designed by changing the structural parameters of the inner nozzle. The structure of each nozzle is shown in Table 2. Compared with nozzle A, the throat diameter of nozzle B was increased to 2 mm. On the basis of nozzle A, the contraction angle of nozzle C was decreased to 18°. Compared with nozzle A, nozzle D did not have the expansion segment. Based on nozzle D, nozzle E omitted the contraction segment. The structural mesh was divided using Gambit 2.4.6 software, as shown in Figure 9. The built model is imported into Fluent software for simulation calculations. The boundary conditions, model selection, and iteration time step for the simulation of nozzles B, C, D, and E are identical to those used for nozzle A.

3.2.1. The Gas Phase Distribution

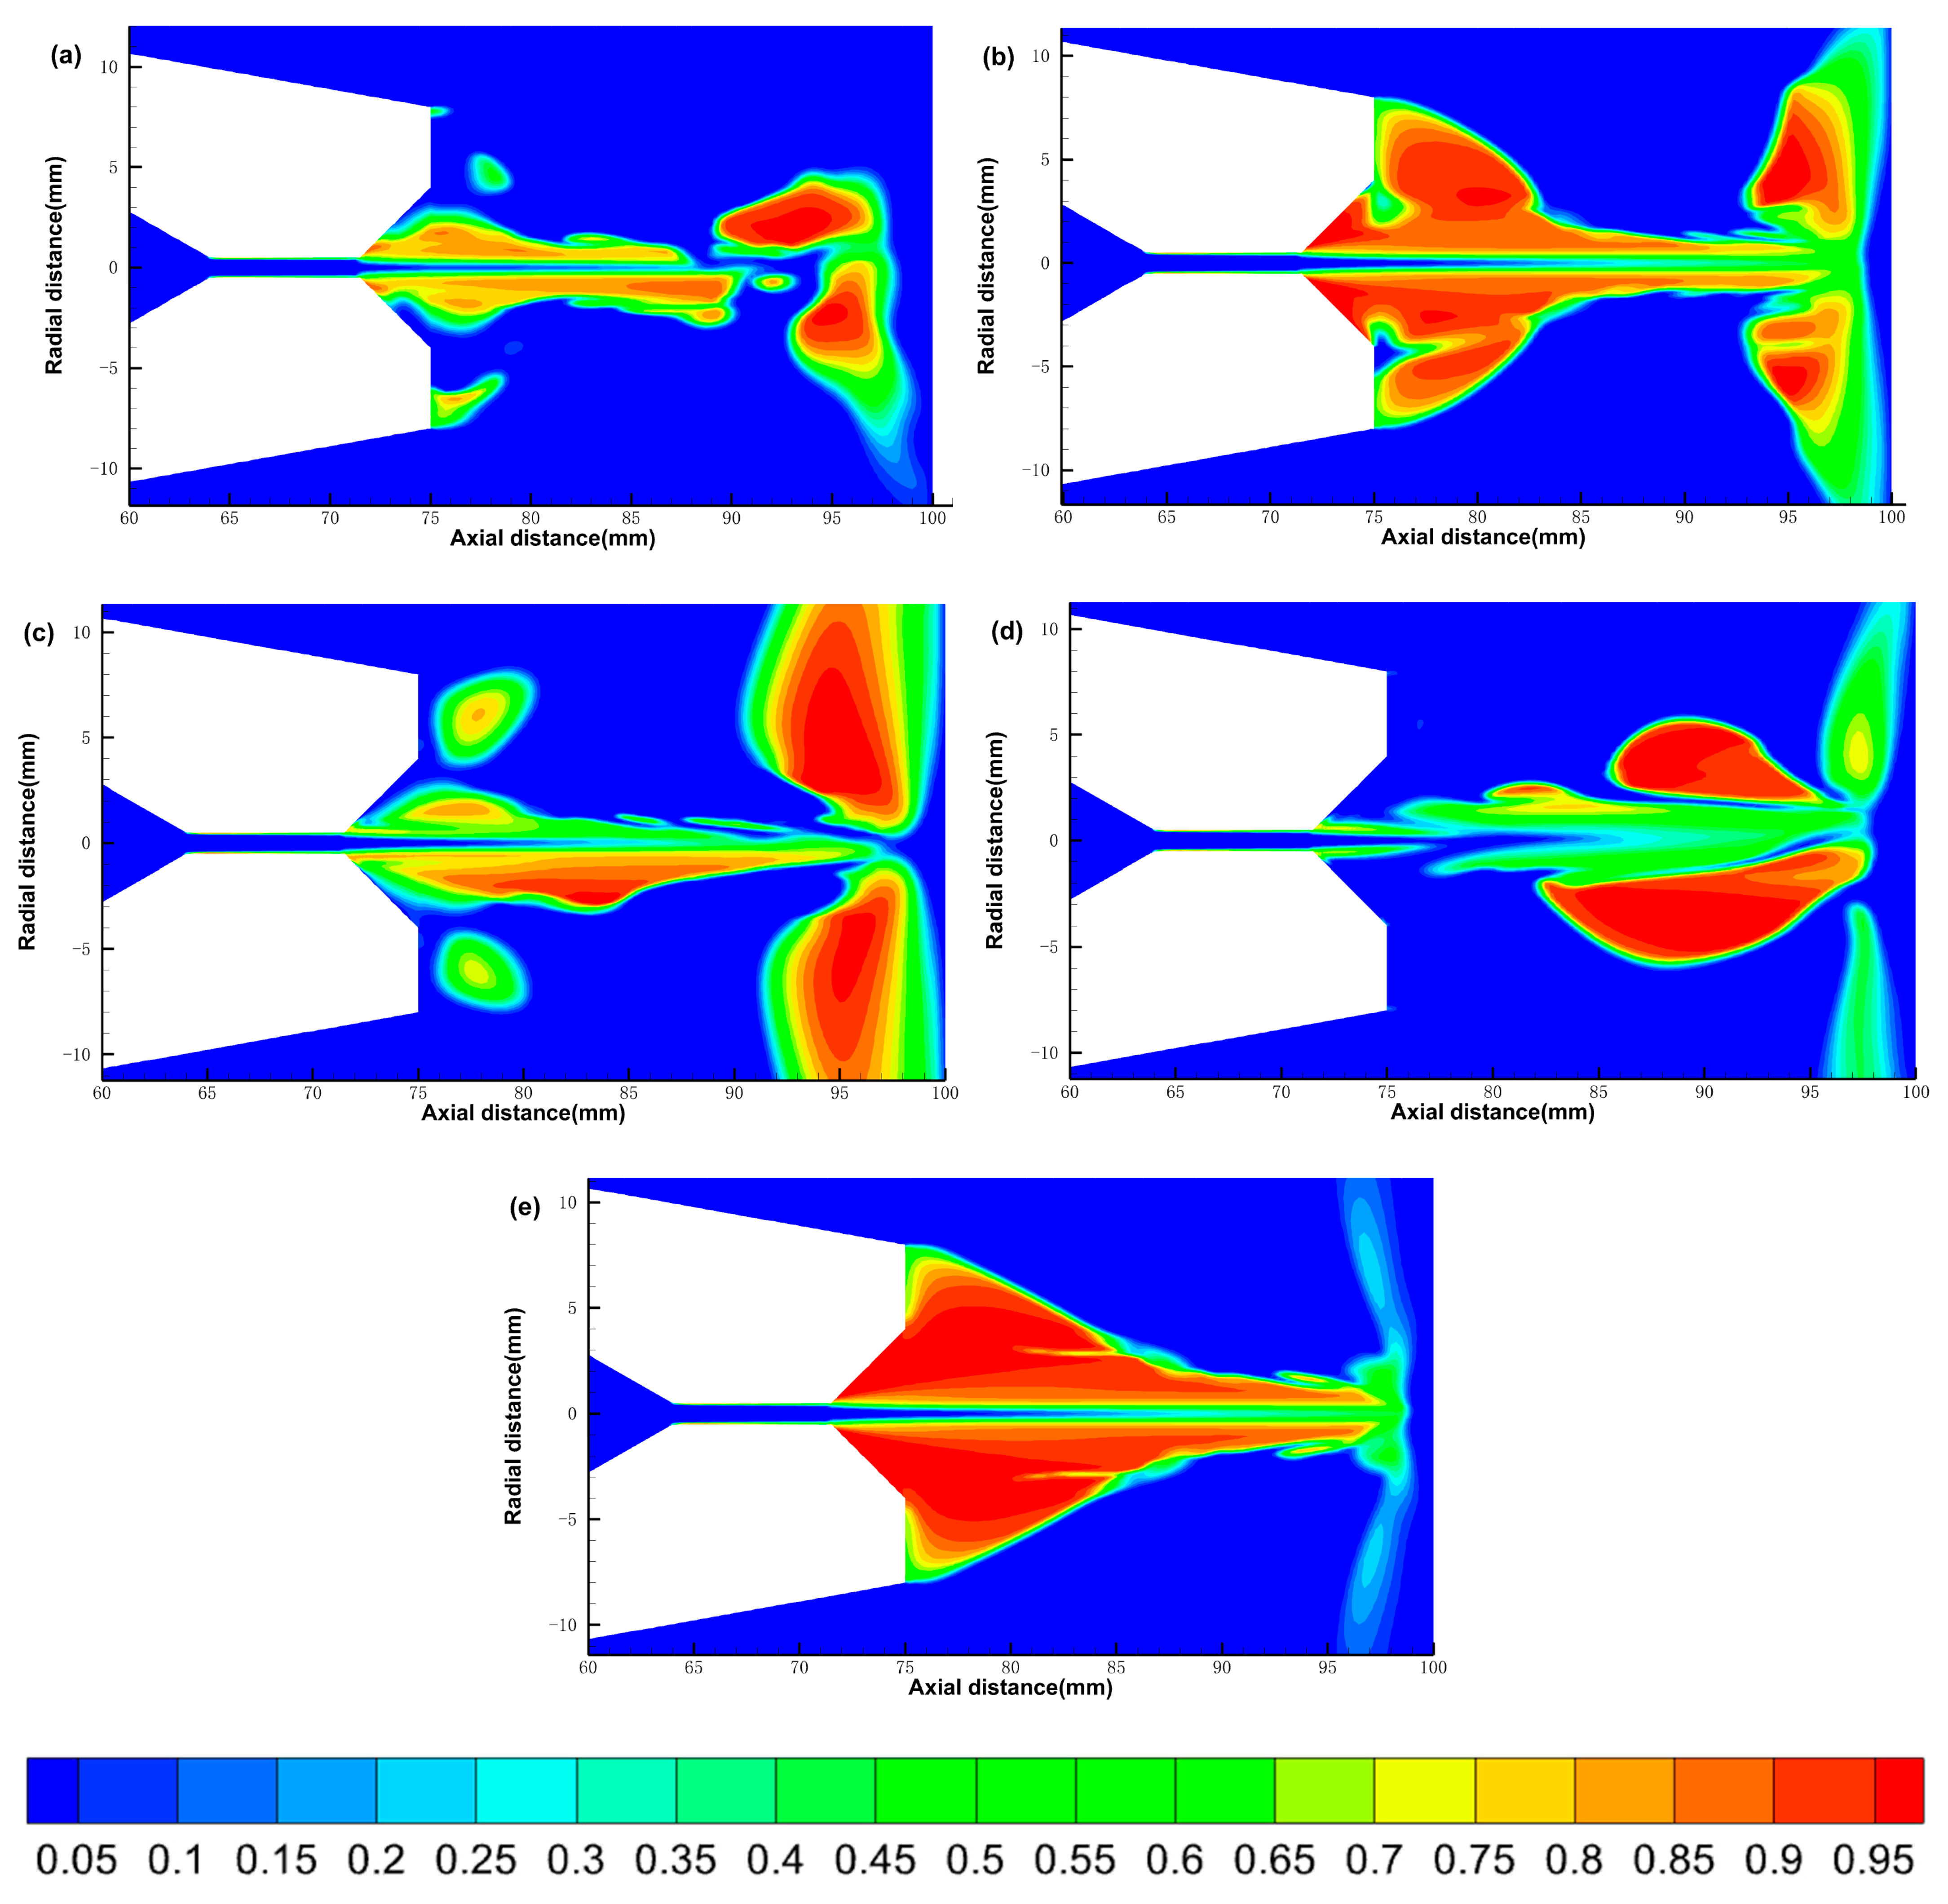
Figure 10 shows the gas phase distribution contour in the flow field of the five nozzles. The colors of the five gas phase distribution clouds correspond to the same gas content values, with red indicating a high gas content and blue indicating a low gas content. In general, all five nozzles are effective for generating cavitation. However, the flow field characteristics show some differences due to the different structures of the inner nozzles. The gas content rate and the area of gas phase region were used to measure the severity of the cavitation. The higher the gas content, the larger the area of the gas phase region, representing a more intense cavitation phenomenon.
Comparing the gas phase distribution of nozzle B, the gas phase region of nozzle A with a smaller throat diameter is larger and the distribution of cavitation bubble is more uniform. Comparing the gas phase distribution in the flow fields of nozzle A and nozzle C, it can be found that the shape and area of the gas phase region in the flow fields of the two nozzles are similar. The gas content rate in the flow field of nozzle C is higher than that in nozzle A. The nozzle with a smaller contraction angle has the higher gas content rate of the flow field. Comparing the gas distribution of nozzle A and nozzle D, the area of the gas phase region within the flow field of the nozzle with an expansion segment (nozzle A) is larger. The gas phase content rate of nozzle D is higher than that of nozzle A. The nozzle with an expansion segment has a larger gas phase region. Comparing the gas distribution in the flow fields of nozzle D and nozzle E, it is found that the gas phase region within the flow field of the nozzle with a contraction segment (nozzle D) is larger; however, the improving effect of gas phase distribution is not as big as that of other parameters.
From the gas phase distribution, the cavitation phenomenon is more intense in the nozzle flow field with expansion and contraction segments. The cavitation effect of the contraction segment with a smaller contraction angle is better. The expansion section and throat diameter have a great influence on the gas phase distribution in the flow field. The gas phase area in the flow field can be significantly increased by setting the expansion section. Increasing the throat diameter will somewhat reduce the gas phase area but will increase the gas phase content rate. Setting the contraction segment can also increase the gas phase region area within the flow field. However, the influence on the flow field is not as significant as that of other parameters.

3.2.2. The Velocity Distribution

Figure 11 shows the variation in the axial velocity of the jet at the central axis of the five nozzles with the axial distance. The solid blue line in the figure is the horizontal line where the nozzle outlet is located (at 75 mm), and the nozzle outlet to the surface of the specimen is the external flow field. The water jet is distributed with the central axis as the axis of symmetry. The axial velocity decreases from the center to all around; so, the velocity on the central axis is maximum. In the external flow field, as the axial distance continues to increase, the water jet velocity is first maintained at the maximum velocity for a distance and then decreases, reaching the specimen when the velocity drops to 0. Regardless of the structure of the nozzle, the maximum velocity in the flow field is almost the same, which is consistent with the conclusion calculated by the Bernoulli equation.
The velocity in the flow field of nozzle E without the constriction segment rises very sharply, while the velocity in the flow field of the nozzle D with the constriction segment rises relatively gently. Comparing the velocity curves in the flow fields of nozzle A and nozzle C, the velocity of nozzle C with a smaller constriction angle rises more gently. It can be found that the constriction segment is equivalent to a transition segment, which can reduce the loss caused by the rapid change of speed; the smaller the constriction angle of the nozzle, the better the effect. In the external flow field, the jet velocity in the flow field of nozzle A with the expansion segment maintains a distance of 20 mm before it begins to drop rapidly. This distance is much larger than that of nozzle D without the expansion segment, which shows that the expansion segment can be effective to increase the cavitation jet’s working distance.
Comparing the axial velocity change curves in the flow fields of nozzle A and nozzle B, in the internal flow fields of the nozzles, the initial velocities of the inner straight sections of the two nozzles are different. The initial velocity of nozzle A with the smaller throat diameter is lower. However, after passing through the constriction segment, the velocity of nozzle B in the external flow field is only slightly higher than that of nozzle A, and the two curves are not very different. Therefore, changing the throat diameter has a limited effect on the velocity in the flow field and the range of action. From the velocity distribution in the flow fields of different nozzles, the nozzle with a smaller contraction segment angle and expansion segment can reach the best velocity distribution. The expansion segment has a more positive influence on the velocity distribution in the flow field than the contraction segment. In addition, changing the diameter has a minimal influence on the velocity in the external flow field.

3.2.3. The Pressure Distribution

Figure 12 shows the impact pressure distribution of the five nozzles on the sample surface. It can be seen from the figure that, in the flow field of all nozzles, the impact pressure near the axis is the largest and the impact pressure decreases with the increase in the radial distance. However, it is worth noting that nozzle C and nozzle D do not strictly follow this law and the impact pressure is the largest at about 2 mm from the center axis of the nozzle. In addition, the speed at which the impingement pressure decreases with the increase in the radial distance is also different for the nozzles of different structures.
Comparing the impact pressure distributions of nozzle A and nozzle B shown in the figure, the impact pressure of a nozzle with a throat diameter of 2 mm (nozzle B) is approximately twice that of a nozzle with a throat diameter of 1 mm (nozzle A). Therefore, increasing the throat diameter will increase the impingement pressure of the jet. The impact pressure of nozzle C with a smaller constriction angle is much greater than that of nozzle A, and the two curves intersect at 28 mm. It can be found that the jet from nozzles with smaller constriction angles have stronger concentration and can achieve higher impact pressures.
The impact pressure of the nozzle with the expansion segment (nozzle A) is always greater than that of the nozzle without the expansion segment (nozzle D). The impingement pressure of nozzle D is greater than the pressure of nozzle E (without constriction). For nozzles with no constriction segment and no expansion segment, the increase in the impact pressure caused by the constriction segment is relatively limited and the impact of the expansion segment on the impact pressure is more significant. From the impact pressure distribution, the nozzle with a smaller contraction angle, contraction segment, and expansion segment has the highest impact pressure. Increasing the throat diameter can significantly increase impact pressure. For a nozzle without a contraction segment and expansion segment, setting the expansion segment increases the impact pressure more obviously.

3.3. Effects of Pressure Ratio of Inner Nozzle to External Nozzle

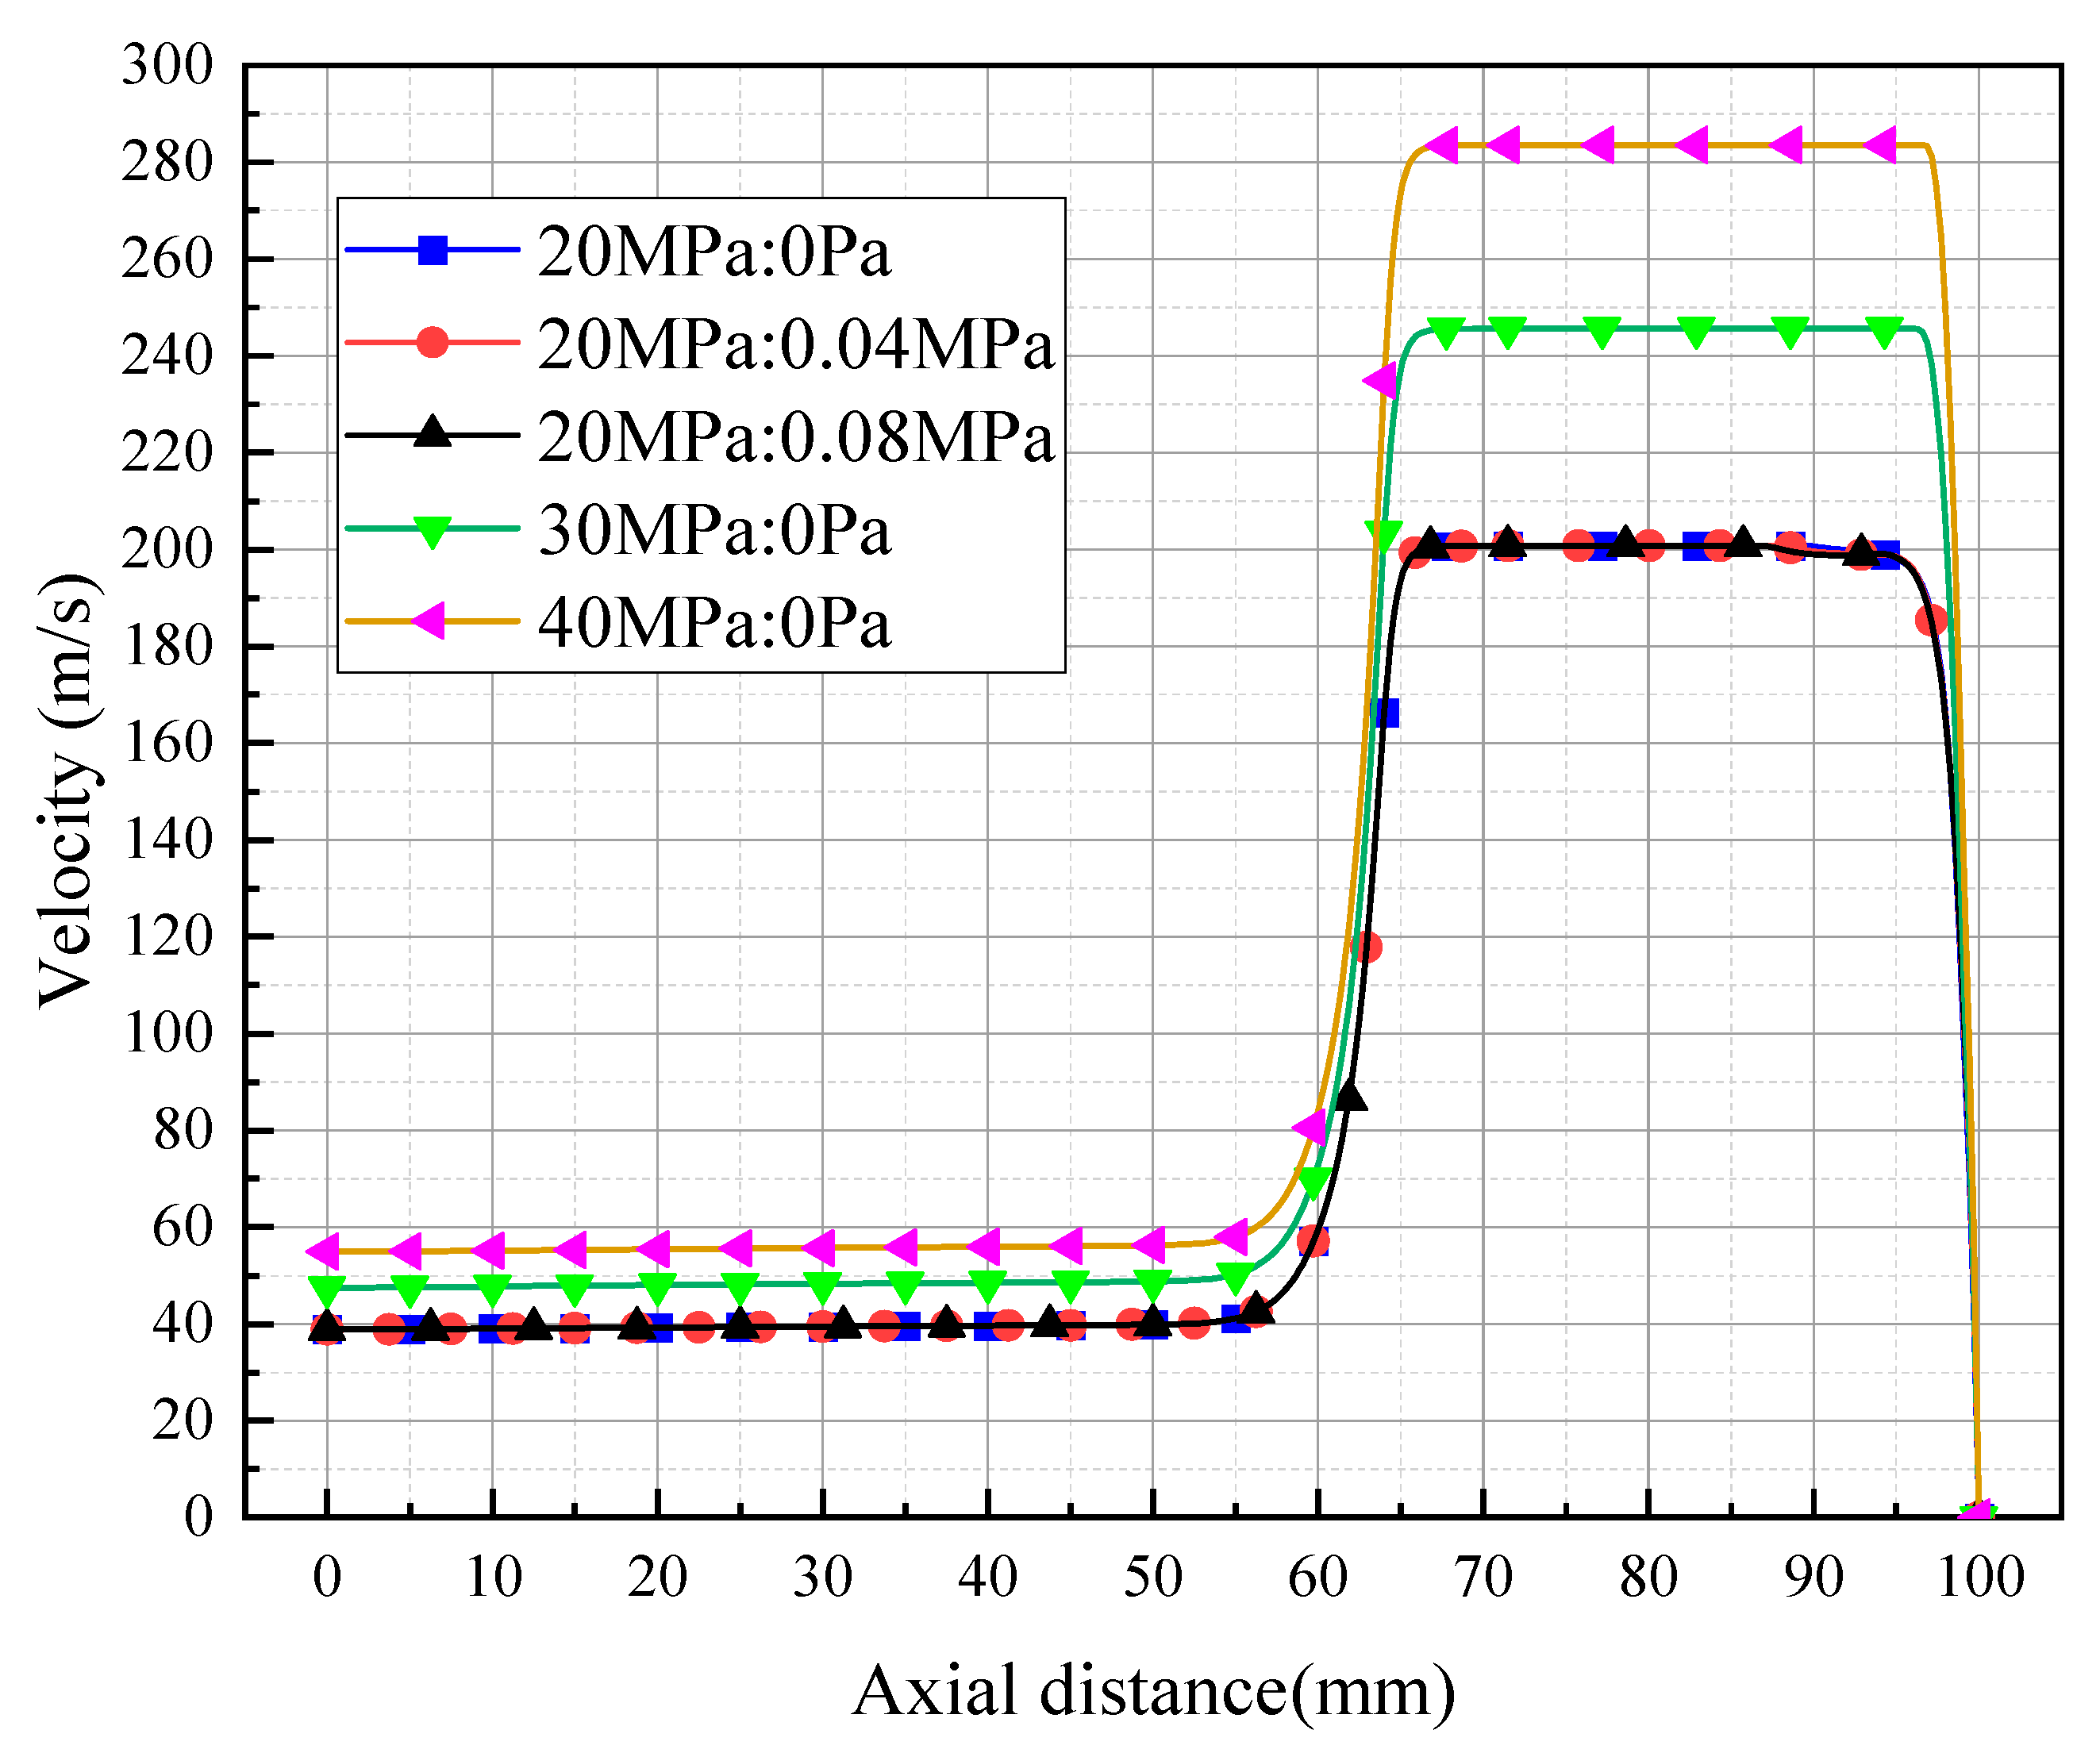
Nozzle A was used to study the effect of the pressure ratio of the inner nozzle to the external nozzle on flow field characteristics. The rest of the conditions were kept constant. The ratios of the internal incidence pressure to external incidence pressure were selected as 20 MPa:0 Pa, 20 MPa:0.04 MPa, 20 MPa:0.08 MPa, 30 MPa:0 Pa, and 40 MPa:0 Pa, respectively. The simulation results were compared to study the effect of the incidence pressure on the flow field characteristics of the water jet.

3.3.1. The Gas Phase Distribution

Figure 13 shows the gas phase distribution clouds in the flow field at different incidence pressures. Comparing panels a, b, and c, it can be found that the area of the gas phase region in the flow field is largest when the incidence pressure of the outer nozzle is 0. Comparing panels a, d, and e, we can find that when the incidence pressure of the outer nozzle is 0, with the increase in the incidence pressure of the inner nozzle, the maximum gas content rate in the flow field basically remains the same but the area of the gas phase region increases.
Changing the internal and external pressure ratio actually changes the cavitation number σ, which is of great importance in cavitation jets. The smaller the cavitation number, the more intense the cavitation phenomenon, and when the cavitation number is larger, the cavitation phenomenon is less likely to occur. The cavitation number can be determined by Equation (15).
σ = p p v 1 2 ρ L v 2 = p 2 p v p 1 p 2 p 2 p 1
where p1 is the upstream pressure of the jet, p2 is the downstream pressure, and pv is the saturated vapor pressure of the environment in which it is located.
As can be seen from Equation (15), when increasing the inner nozzle incidence pressure, the cavitation number decreases, the degree of cavitation is enhanced, and the vacuole cloud in the flow field increases (the area of the gas phase region increases). While increasing the incidence pressure of the outer nozzle, the cavitation number decreases and the degree of cavitation within the flow field decreases accordingly.

3.3.2. The Velocity Distribution

Figure 14 shows the axial velocity distribution along the central axis for different incident pressures. The effect of incident pressure of the outer nozzle on the axial velocity is very small when the incident pressure of the inner nozzle is the same. Keeping the incident pressure of the outer nozzle the same, the axial velocity distribution curves have the same trend for different incident pressures of the inner nozzle. The difference lies only in the maximum value of the velocity. The greater the incident pressure of the inner nozzle, the greater the maximum velocity in the flow field.

3.3.3. The Pressure Distribution

Figure 15 shows the impact pressure distribution at different incidence pressures. It can be seen that the three curves almost overlap when the incidence pressure is 20 MPa:0 Pa, 20 MPa:0.04 MPa, and 20 MPa:0.08 MPa. The impact pressure on the specimen surface is less affected by the incidence pressure of the outer nozzle when the incidence pressure of the outer nozzle is lower. Comparing the impact pressure distribution when the incidence pressure is 20 MPa:0 Pa, 30 MPa:0 Pa, and 40 MPa:0 Pa, the impact pressure on the specimen surface increases as the incidence pressure increases. The maximum impact pressure on the specimen surface is about 2 Mpa lower than the incidence pressure.

3.4. Discussions

In this study, finite element simulations of the flow field of nozzles with different nozzle structures and incidence pressures are performed to obtain the gas phase distribution, velocity distribution, and impact pressure within the flow field. Based on the above analysis, we can conclude that the inner nozzle with a smaller contraction segment, smaller expansion segment, and bigger throat diameter has the better cavitation effect (the cavitation cloud area in the flow field is larger) and impact pressure. Increasing the inner nozzle incidence pressure and reducing the outer nozzle pressure can also improve the cavitation effect and enhance the impact pressure. The contraction segment and expansion segment promote the occurrence of cavitation phenomena. Zhang et al. [35] used pressure-sensitive paper to measure the impact pressure distribution of cavitation water jets along the jet injection direction (axial direction). The study showed that different nozzle shapes can have a significant effect on the cavitation phenomenon. Pressure drop occurs in the throat of nozzles with constricted and expanded segments but not in nozzles without expanded segments. This verifies that our simulation results are right. In addition, Soyama et al. [27] also proved that the cavitation jet of the nozzle with an expanding segment had the highest intensity of erosion on the specimen compared with other conventional water jet nozzles. These results are also consistent with the conclusions of this paper.
It should be noted that the erosion intensity and impact effect of the cavitation water jet are judged mainly by gas phase distribution, velocity distribution, and impact pressure. However, the impact pressure is not accurate enough because the cavitation bubbles′ collapse process is not simulated. So, the impact pressure obtained may not be the actual impact pressure. The modeling of the generation of cavitation bubbles is challenging because of the complexity of the cavitation phenomenon [29]. In addition, only simulation analysis was performed on the cavitation phenomenon and no experiments were carried out. Further numerical simulations and experimental verification of cavitation bubble collapse are required. However, this study still has a great guideline for the design of the conical composite nozzle and the selection of incident pressure.

4. Conclusions

In previous studies, scholars mainly focused on the cavitation phenomenon occurring in venturi tubes and submerged cavitation jets. The more widely used non-submerged cavitation jets are understudied. In this paper, the flow field characteristics containing gas phase distribution, velocity distribution, and impact pressure of the cavitation water jet in air based on a dual-nozzle design with concentric configuration was investigated in detail by numerical simulation. The simulation study of the non-submerged cavitation jet flow field has reference significance and guiding significance for the design of concentric double nozzles. The effects of inner nozzle structure parameters and the incidence pressures on the flow field characteristics were also compared. The following conclusions can be drawn:
The structure of the inner nozzle has a significant impact on the flow field characteristics, and the selection of a suitable inner nozzle structure can improve the action distance of the jet as well as the impact pressure.
The contraction segment of the inner nozzle has the effect of increasing the area of gas phase in the flow field and increasing the impact pressure; the smaller the contraction angle of the contraction segment, the stronger the effect.
The expansion segment of the inner nozzle has a great influence on the characteristics of the flow field. Setting the expansion segment can significantly improve the gas content rate in the flow field and the impact pressure of the jet.
The internal and external incident pressures also affect the flow field characteristics. When increasing the incident pressure of the inner nozzle, the cavitation number decreases and the cavitation phenomenon in the flow field is enhanced. The gas phase area and gas holdup in the flow field will increase, and the impact pressure will increase. In contrast, increasing the incident pressure of the outer nozzle will increase the cavitation number, which in turn will weaken the cavitation in the flow field.

Author Contributions

Conceptualization, Y.L. and J.Z.; methodology, Y.L.; software, J.Z.; validation, J.Z. and H.Z.; formal analysis, J.Z. and H.Z.; investigation, J.Z.; resources, Y.L.; data curation, H.Z.; writing—original draft preparation, J.Z.; writing—review and editing, Y.L.; visualization, Y.L.; supervision, Y.L.; project administration, H.Z.; funding acquisition, Y.L. All authors have read and agreed to the published version of the manuscript.

Funding

This research was funded by [National Key R&D Program of China] grant number [2021YFB4001503], [National Natural Science Foundation of China] grant number [51905545] and [Fundamental Research Funds for the Central Universities] grant number [20CX02219A].

Data Availability Statement

Data available on request due to restrictions eg privacy or ethical. The data presented in this study are available on request from the corresponding author. The data are not publicly available due to the temporary need for secrecy of the project.

Acknowledgments

The authors gratefully acknowledge the support provided by National Key R&D Program of China (2021YFB4001503), National Natural Science Foundation of China (51905545), Fundamental Research Funds for the Central Universities (20CX02219A).

Conflicts of Interest

The authors declare no conflict of interest.

References

  1. Zhang, Q.; Shi, Z.; Shi, W.; Xie, Z.; Tan, L.; Yang, Y. Research on Flow Field Characteristics in Water Jet Nozzle and Surface Damage Caused by Target Impact. Sustainability 2022, 14, 9074. [Google Scholar] [CrossRef]
  2. Chlupová, A.; Hloch, S.; Nag, A.; Šulák, I.; Kruml, T. Effect of pulsating water jet processing on erosion grooves and microstructure in the subsurface layer of 25CrMo4 (EA4T) steel. Wear 2023, 524, 204774. [Google Scholar] [CrossRef]
  3. Natarajan, Y.; Murugesan, P.K.; Mohan, M.; Khan, S.A.L.A. Abrasive Water Jet Machining process: A state of art of review. J. Manuf. Process. 2020, 49, 271–322. [Google Scholar] [CrossRef]
  4. Zhao, H.; Jiang, H.; Warisawa, S.; Li, H. Numerical study of abrasive water jet rotational slits in hard rock using a coupled SPH-FEM method. Powder Technol. 2023, 426, 118622. [Google Scholar] [CrossRef]
  5. Liu, Z.; Ma, Z.; Liu, K.; Zhao, S.; Wang, Y. Coupled CEL-FDEM modeling of rock failure induced by high-pressure water jet. Eng. Fract. Mech. 2023, 277, 108958. [Google Scholar] [CrossRef]
  6. Luo, X.; Zhang, J.; Yang, F.; He, F.; Xia, Y. Research on the hard rock cutting characteristics of disc cutter under front-mounted water jet precutting kerf conditions. Eng. Fract. Mech. 2023, 287, 109330. [Google Scholar] [CrossRef]
  7. Nadolny, K.; Romanowski, M.; Sutowski, P. Assessing the technological quality of abrasive water jet and laser cutting processes by geometrical errors and a multiplicative indicator. Measurement 2023, 217, 113060. [Google Scholar] [CrossRef]
  8. Winter, S.; Smith, A.; Lappin, D.; McDonagh, G.; Kirk, B. Failure of non-vacuum steam sterilization processes for dental handpieces. J. Hosp. Infect. 2017, 97, 343–347. [Google Scholar] [CrossRef] [Green Version]
  9. Yang, Y.F.; Shi, W.D.; Li, W.; Chen, S.P.; Zhang, W.Q.; Pan, B. Experimental study on the surface property changes of aluminum alloy and stainless steel after impingement with submerged cavitation jet. Strength Mater. 2021, 53, 353–363. [Google Scholar] [CrossRef]
  10. Murugesan, P.; Jung, S.; Lee, H. Inner surface peening for long and narrow helical pipe using acoustic cavitation. Mater. Des. 2023, 229, 111906. [Google Scholar] [CrossRef]
  11. Dong, W.; Yao, L.; Luo, W. Numerical Simulation of Flow Field of Submerged Angular Cavitation Nozzle. Appl. Sci. 2023, 13, 613. [Google Scholar] [CrossRef]
  12. Ge, M.; Manikkam, P.; Ghossein, J.; Subramanian, R.K.; Coutier-Delgosha, O.; Zhang, G. Dynamic mode decomposition to classify cavitating flow regimes induced by thermodynamic effects. Energy 2022, 254, 124426. [Google Scholar] [CrossRef]
  13. Ge, M.; Petkovšek, M.; Zhang, G.; Jacobs, D.; Coutier-Delgosha, O. Cavitation dynamics and thermodynamic effects at elevated temperatures in a small Venturi channel. Int. J. Heat Mass Transf. 2021, 170, 120970. [Google Scholar] [CrossRef]
  14. Enomoto, K.; Hirano, K.; Mochizuki, M.; Kurosawa, K.; Saito, H.; Hayashi, E. Improvement of residual stress on material surface by water jet peening; Water jet peening ni yoru zairyo hyomen no zanryu oryoku kaizen koka no kento. Zair. J. Soc. Mater. Sci. Jpn. 1996, 45, 734–739. [Google Scholar] [CrossRef]
  15. Giorgetti, V.; Santos, E.A.D.; Marcomini, J.B.; Sordi, V.L. Stress corrosion cracking and fatigue crack growth of an API 5L X70 welded joint in an ethanol environment. Int. J. Press. Vessel. Pip. 2019, 169, 223–229. [Google Scholar] [CrossRef]
  16. Ryakhovskikh, I.V.; Bogdanov, R.I. Model of stress corrosion cracking and practical guidelines for pipe-lines operation. Eng. Fail. Anal. 2021, 121, 105134. [Google Scholar] [CrossRef]
  17. Shakeri, I.; Shahani, A.R.; Rans, C.D. Fatigue crack growth of butt welded joints subjected to mixed mode loading and overloading. Eng. Fract. Mech. 2021, 241, 107376. [Google Scholar] [CrossRef]
  18. Xu, S.; Wang, C.; Wang, W. Failure analysis of stress corrosion cracking in heat exchanger tubes during start-up operation. Eng. Fail. Anal. 2015, 51, 1–8. [Google Scholar] [CrossRef]
  19. Lv, F.; Hu, X.; Ma, C.; Yang, B.; Luo, Y. Failure analysis on cracking of backing plate of lifting lug for air preheater. Eng. Fail. Anal. 2020, 109, 104395. [Google Scholar] [CrossRef]
  20. Soyama, H. Introduction of compressive residual stress using a cavitating jet in air. J. Eng. Mater. Technol. 2004, 126, 123–128. [Google Scholar] [CrossRef]
  21. Soyama, H. Improvement of fatigue strength by using cavitating jets in air and water. J. Mater. Sci. 2007, 42, 6638–6641. [Google Scholar] [CrossRef]
  22. Soyama, H.; Chighizola, C.R.; Hill, M.R. Effect of compressive residual stress introduced by cavitation peening and shot peening on the improvement of fatigue strength of stainless steel. J. Mater. Process. Technol. 2021, 288, 116877. [Google Scholar] [CrossRef]
  23. Soyama, H.; Hoshino, J. Enhancing the aggressive intensity of hydrodynamic cavitation through a Venturi tube by increasing the pressure in the region where the bubbles collapse. AIP Adv. 2016, 6, 045113. [Google Scholar] [CrossRef] [Green Version]
  24. Nakashima, K.; Ebi, Y.; Shibasaki-Kitakawa, N.; Soyama, H.; Yonemoto, T. Hydrodynamic cavitation reac-tor for efficient pretreatment of lignocellulosic biomass. Ind. Eng. Chem. Res. 2016, 55, 1866–1871. [Google Scholar] [CrossRef]
  25. Soyama, H. Enhancing the aggressive intensity of a cavitating jet by means of the nozzle outlet geometry. J. Fluids Eng. 2011, 133, 101301. [Google Scholar] [CrossRef]
  26. Soyama, H. Comparison between the improvements made to the fatigue strength of stainless steel by cavitation peening, water jet peening, shot peening and laser peening. J. Mater. Process. Technol. 2019, 269, 65–78. [Google Scholar] [CrossRef]
  27. Soyama, H. Cavitation peening: A review. Metals 2020, 10, 270. [Google Scholar] [CrossRef] [Green Version]
  28. Yamauchi, Y.; Soyama, H.; Adachi, Y.; Sato, K.; Shindo, T.; Oba, R.; Oshima, R.; Yamabe, M. Suitable region of high-speed submerged water jets for cutting and peening. JSME Int. J. Ser. B Fluids Therm. Eng. 1995, 38, 31–38. [Google Scholar] [CrossRef] [Green Version]
  29. Marcon, A.; Melkote, S.N.; Castle, J.; Sanders, D.G.; Yoda, M. Effect of jet velocity in co-flow water cavita-tion jet peening. Wear 2016, 360, 38–50. [Google Scholar] [CrossRef]
  30. Marcon, A.; Melkote, S.N.; Yoda, M. Effect of nozzle size scaling in co-flow water cavitation jet peening. J. Manuf. Process. 2018, 31, 372–381. [Google Scholar] [CrossRef]
  31. Zhu, R.; Zhu, H.; Zhang, X. Numerical investigation about the unsteady behavior of a free submerged cavitation jet using the SBES approach. Ocean. Eng. 2023, 281, 115010. [Google Scholar] [CrossRef]
  32. Liu, M.; Li, W.; Li, H.; Xu, X.; Tian, F.; Agarwal, R.K.; Ji, L. Numerical simulation of cryogenic cavitating flow by an extended transport-based cavitation model with thermal effects. Cryogenics 2023, 133, 103697. [Google Scholar] [CrossRef]
  33. Zwart, P.J.; Gerber, A.G.; Belamri, T. A two-phase flow model for predicting cavitation dynamics. In Proceedings of the Fifth International Conference on Multiphase Flow, Yokohama, Japan, 30 May–3 June 2004. [Google Scholar]
  34. Yang, Y.F. Research on the Mechanism of Submerged High-Pressure Water Cavitation Jet and Hollow Bubble Shock Wave Strengthening Metal Properties. Ph.D. Thesis, Jiangsu University, Zhenjiang, China, 2020. Available online: https://kns.cnki.net/KCMS/detail/detail.aspx?dbname=CDFDLAST2021&filename=1020758544.nh (accessed on 20 June 2020).
  35. Zhang, H.; Han, B.; Yu, X.G.; Ju, D.Y. Numerical and experimental studies of cavitation behavior in water-jet cavitation peening processing. Shock Vib. 2013, 20, 895–905. [Google Scholar] [CrossRef]
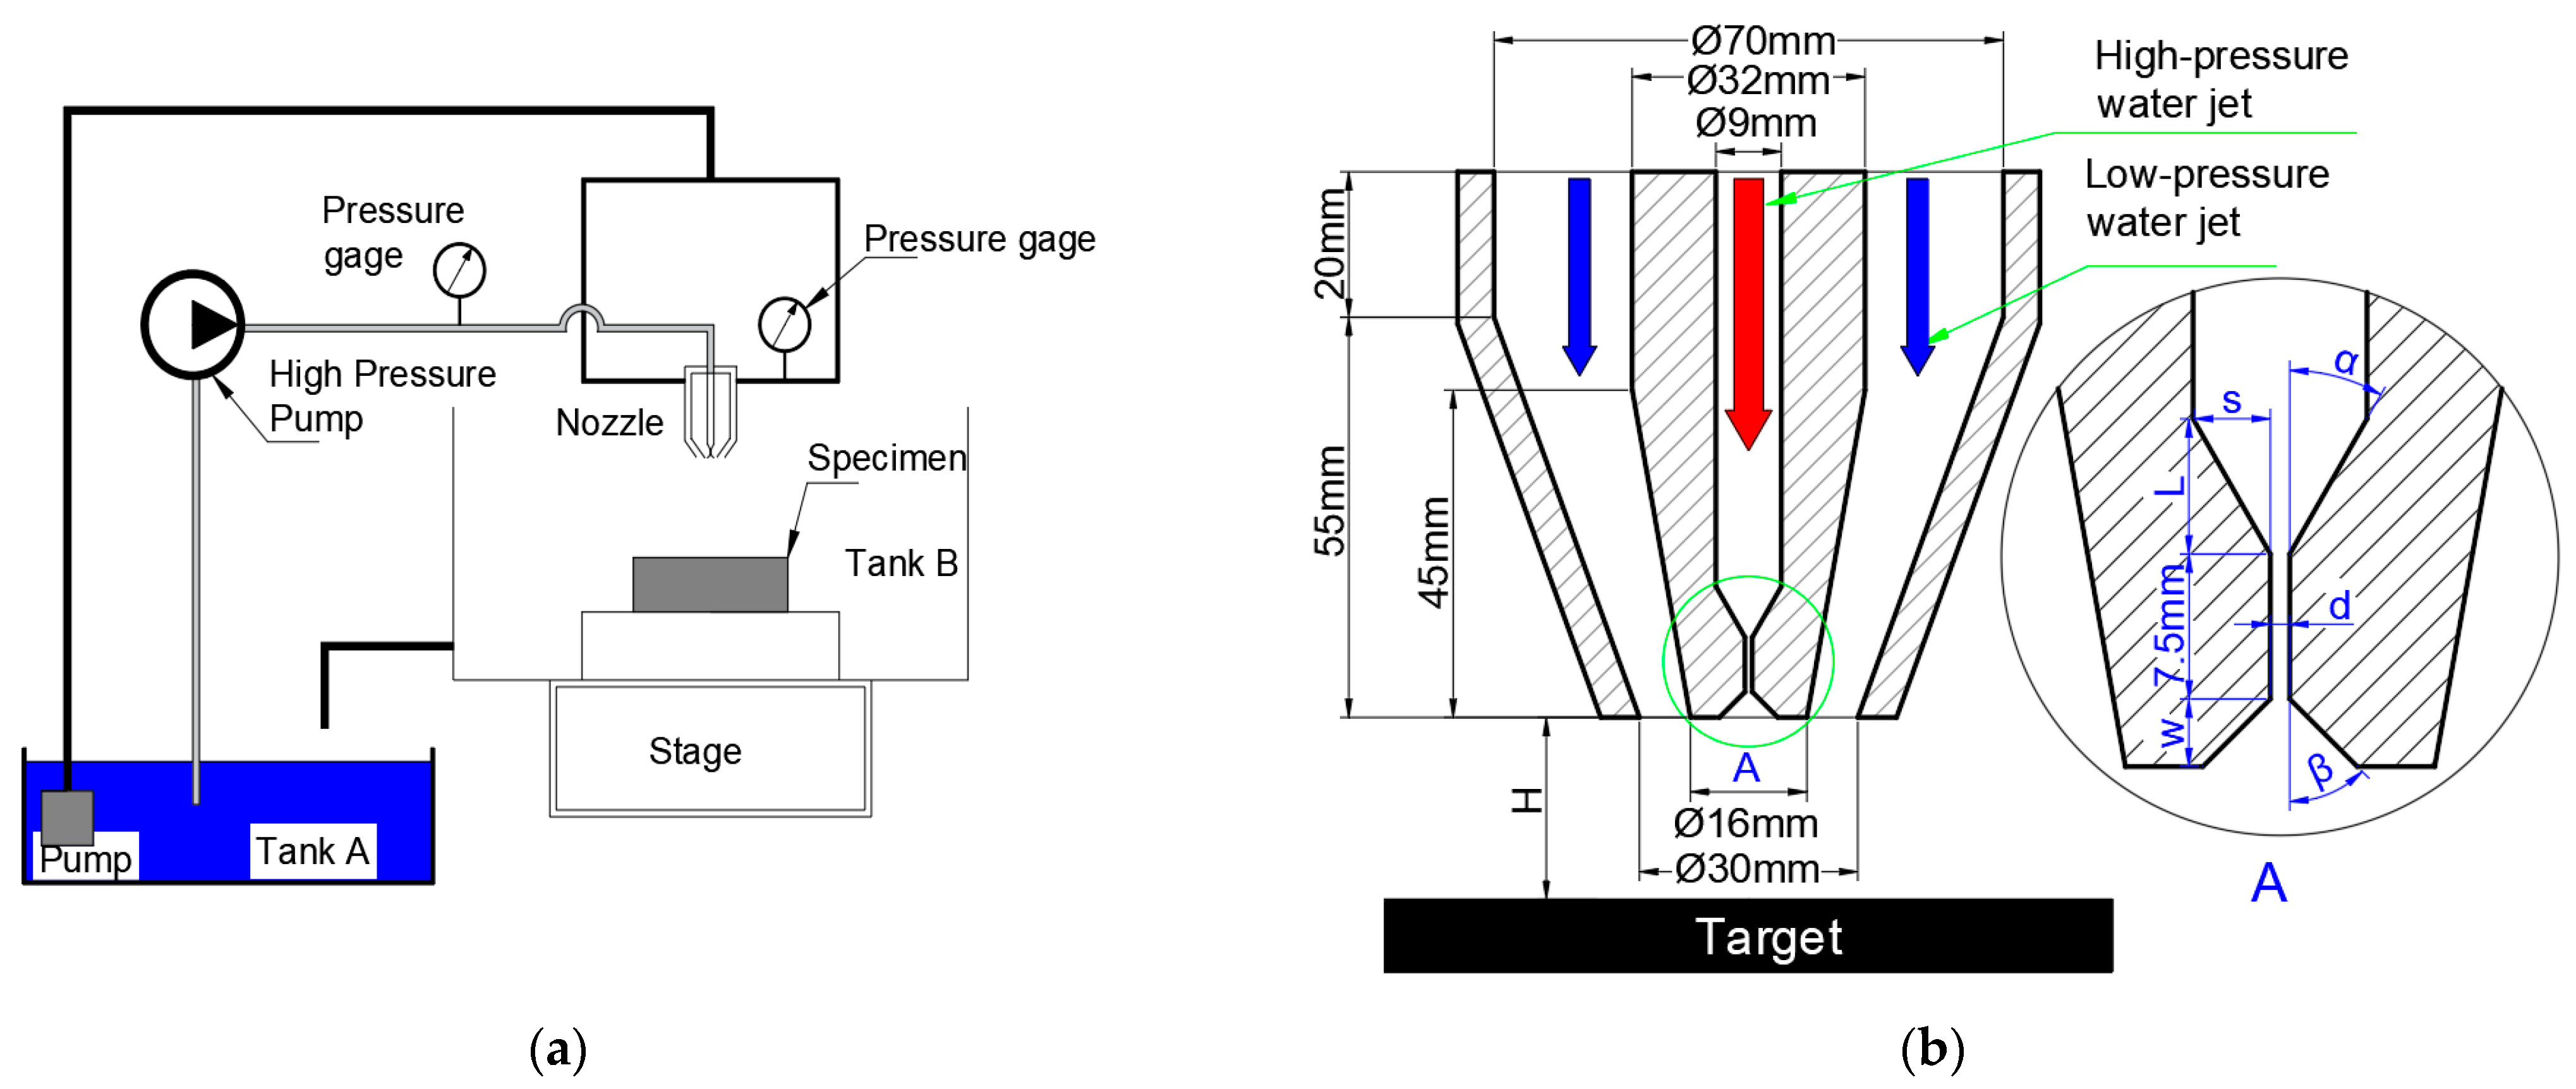
Figure 1. (a) Schematic diagram of cavitation water jet device. (b) Schematic diagram of the geometric size of the nozzle structure.
Water 15 02904 g001
Figure 2. Flow field calculation area (a) and mesh division (b).
Water 15 02904 g002aWater 15 02904 g002b
Figure 3. Variation in axial velocity and axial velocity in the flow field.
Water 15 02904 g003
Figure 4. Cloud map of gas phase distribution in the flow field with different number of grids: (a) 14,860, (b) 22,200, (c) 79,200, (d) 122,840, (e) 245,400.
Water 15 02904 g004aWater 15 02904 g004b
Figure 5. Comparison of cavitation jet morphology from high-speed photography (a) and numerical simulation (b).
Water 15 02904 g005
Figure 6. Cloud map of gas phase distribution in the flow field.
Water 15 02904 g006
Figure 7. Velocity distribution cloud in the flow field.
Water 15 02904 g007
Figure 8. Impact pressure distribution on the surface of the specimen.
Water 15 02904 g008
Figure 9. Conical composite nozzle structure and grid schematic: (a) nozzle B, (b) nozzle C, (c) nozzle D, (d) nozzle E.
Water 15 02904 g009aWater 15 02904 g009b
Figure 10. Cloud diagram of gas phase distribution in the flow fields of five nozzles: (a) nozzle A, (b) nozzle B, (c) nozzle C, (d) nozzle D, (e) nozzle E.
Water 15 02904 g010
Figure 11. Axial velocity distribution of the central axis of the five nozzles.
Water 15 02904 g011
Figure 12. Impact pressure distribution of five nozzles on the surface of the specimen.
Water 15 02904 g012
Figure 13. Flow field gas phase distribution clouds at different incident pressures: (a) 20 MPa:0.08 MPa, (b) 20 MPa:0.04 MPa, (c) 20 MPa:0 Pa, (d) 30 MPa:0 Pa, (e) 40 MPa:0 Pa.
Water 15 02904 g013
Figure 14. Axial velocity distribution at different incident pressures.
Water 15 02904 g014
Figure 15. Impact pressure distribution at different incidence pressures.
Water 15 02904 g015
Table 1. Number of grids at different grid sizes.
Mesh-1Mesh-2Mesh-3Mesh-4Mesh-5
Number of grids14,86022,20079,200122,840245,400
Table 2. Nozzle structure within the conical composite nozzle.
Contraction SegmentExpansion SegmentThroat Diameter dTarget Distance H
Nozzle AL = 7 mm, s = 4 mm (α = 30°)w = 3.5 mm, β = 45°1 mm25 mm
Nozzle BL = 6.125 mm, s = 3.5 mm (α = 30°)w = 3.5 mm, β = 45°2 mm25 mm
Nozzle CL = 12 mm, s = 4 mm (α = 18°)w = 3.5 mm, β = 45°1 mm25 mm
Nozzle DL = 7 mm, s = 4 mm (α = 30°)No expansion segment1 mm25 mm
Nozzle ENo contraction segmentNo expansion segment1 mm25 mm
Disclaimer/Publisher’s Note: The statements, opinions and data contained in all publications are solely those of the individual author(s) and contributor(s) and not of MDPI and/or the editor(s). MDPI and/or the editor(s) disclaim responsibility for any injury to people or property resulting from any ideas, methods, instructions or products referred to in the content.