

Environmental Risk Assessment and Sources of Potentially Toxic Elements in Seawater of Jazan Coastal Area, Saudi Arabia

 ,
,
Abstract
:1. Introduction
2. Materials and Methods
2.1. Study Area
2.2. Sampling and Analytical Procedures
3. Results and Discussion
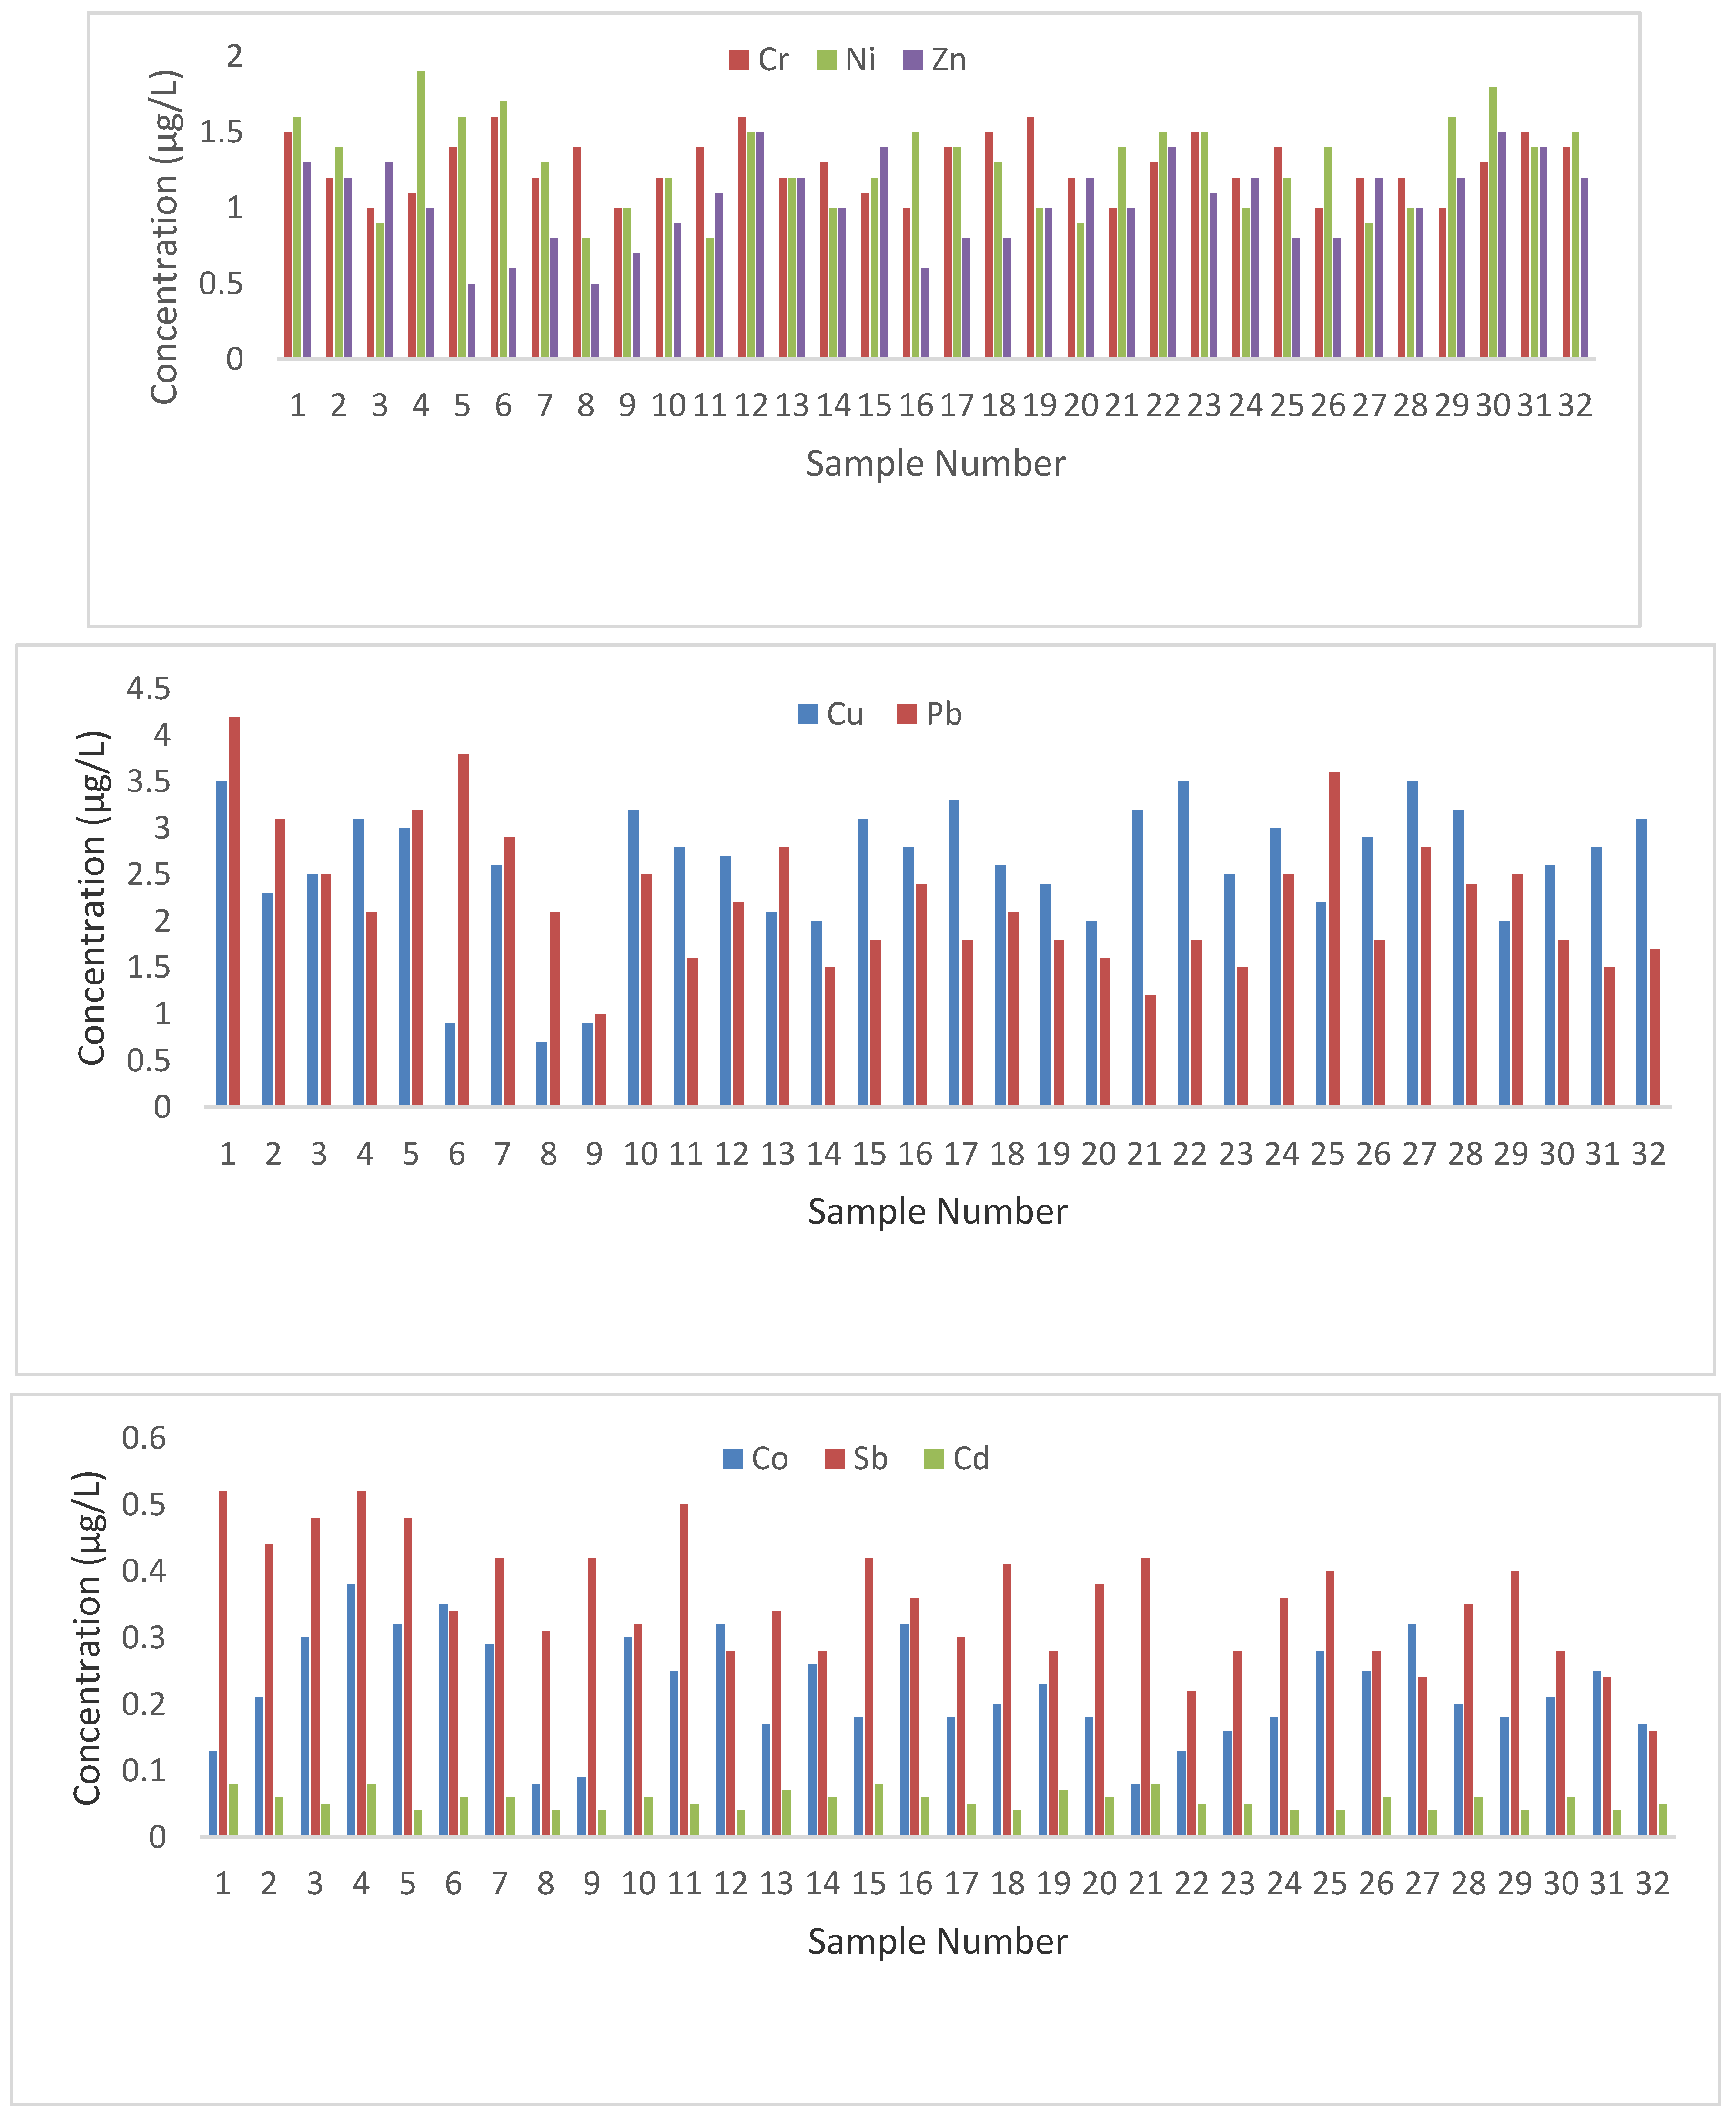
3.1. Distribution of Potentially Toxic Elements
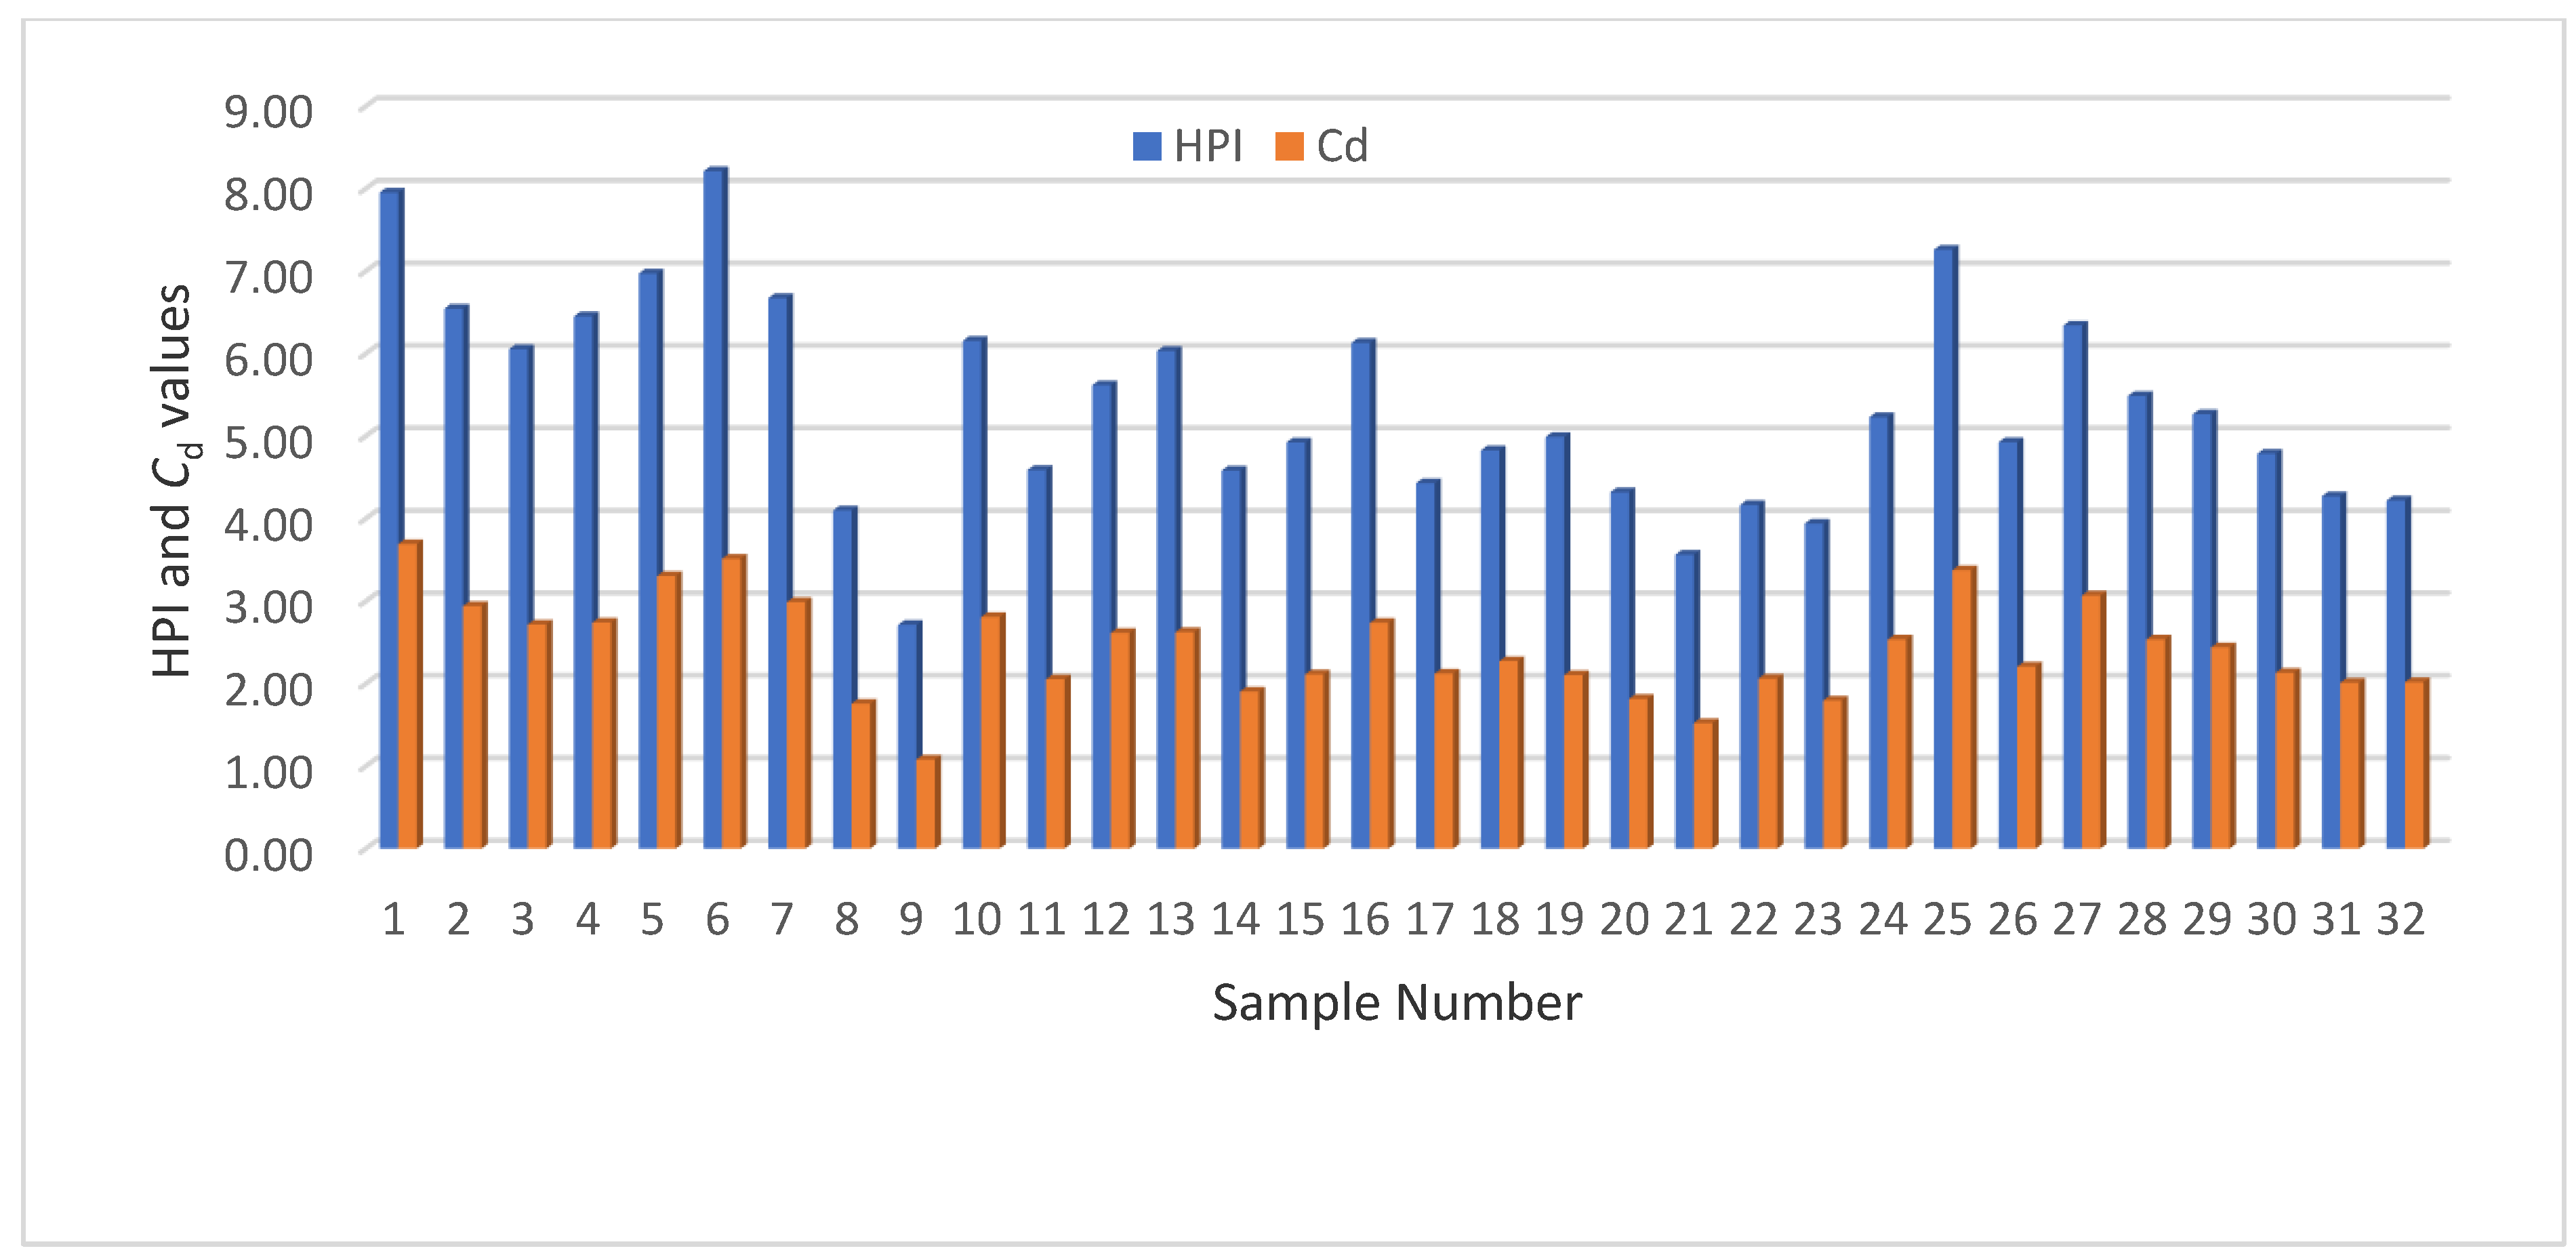
3.2. Environmental Risk Assessment
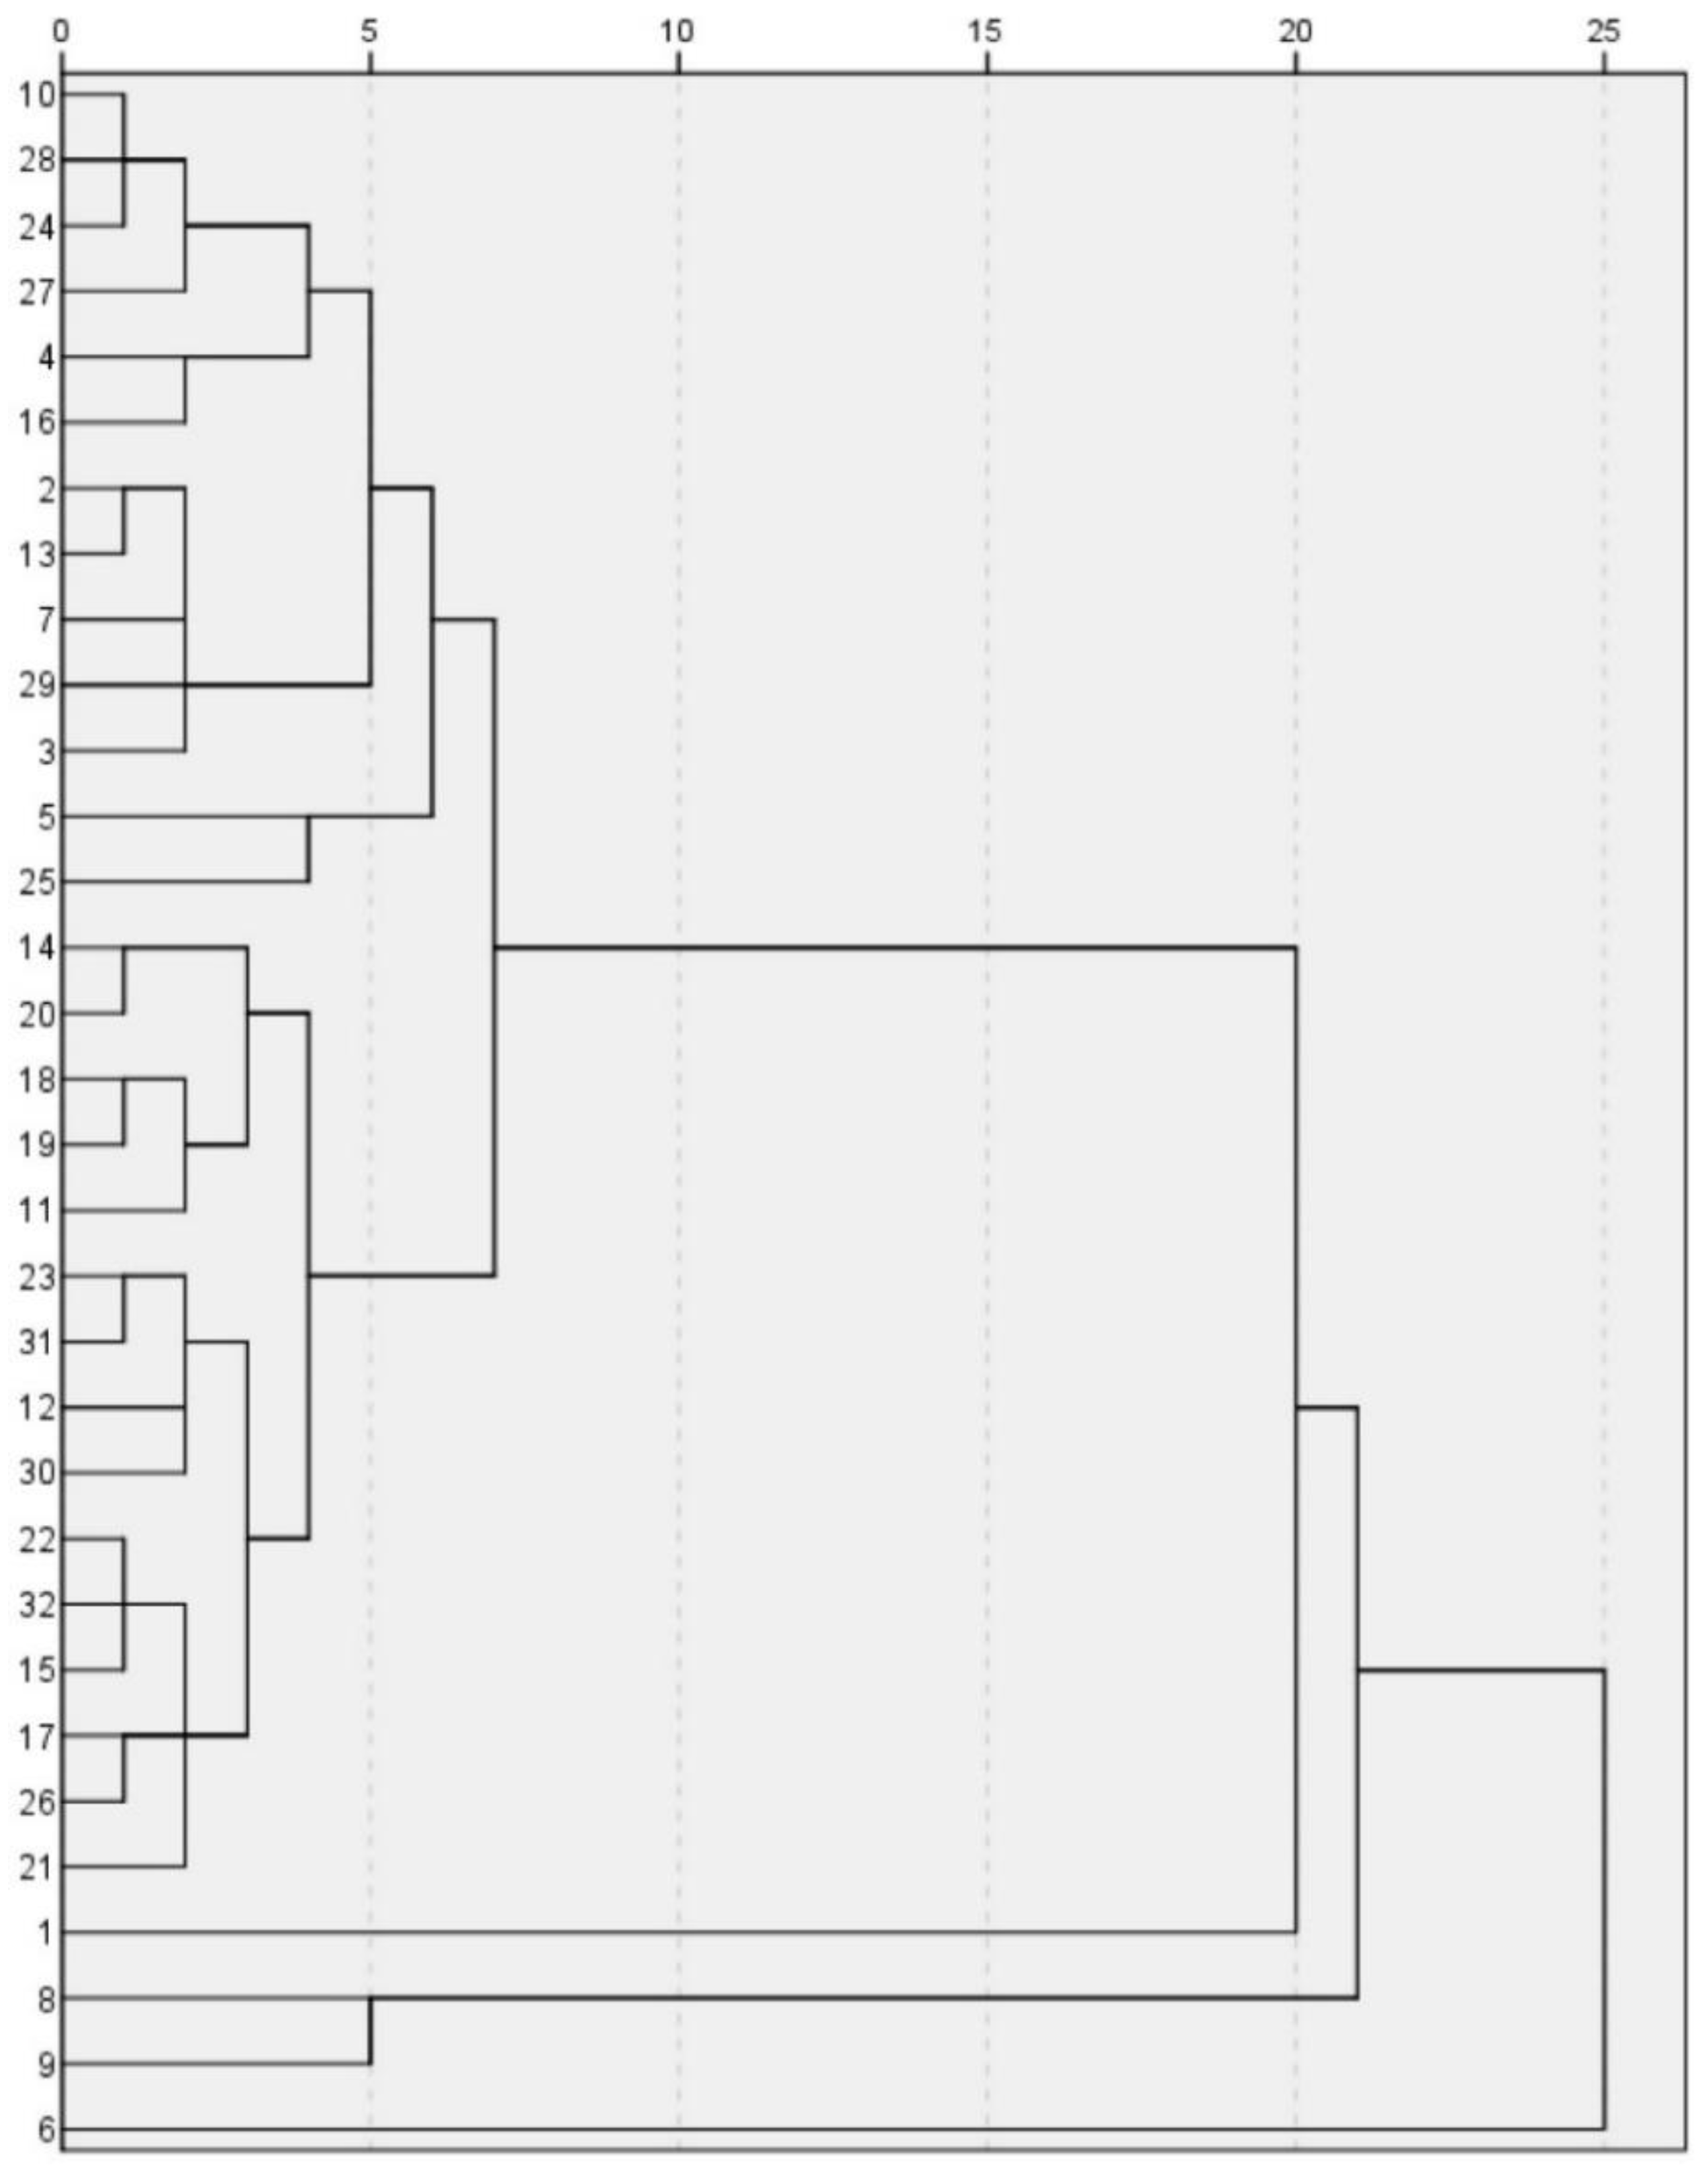
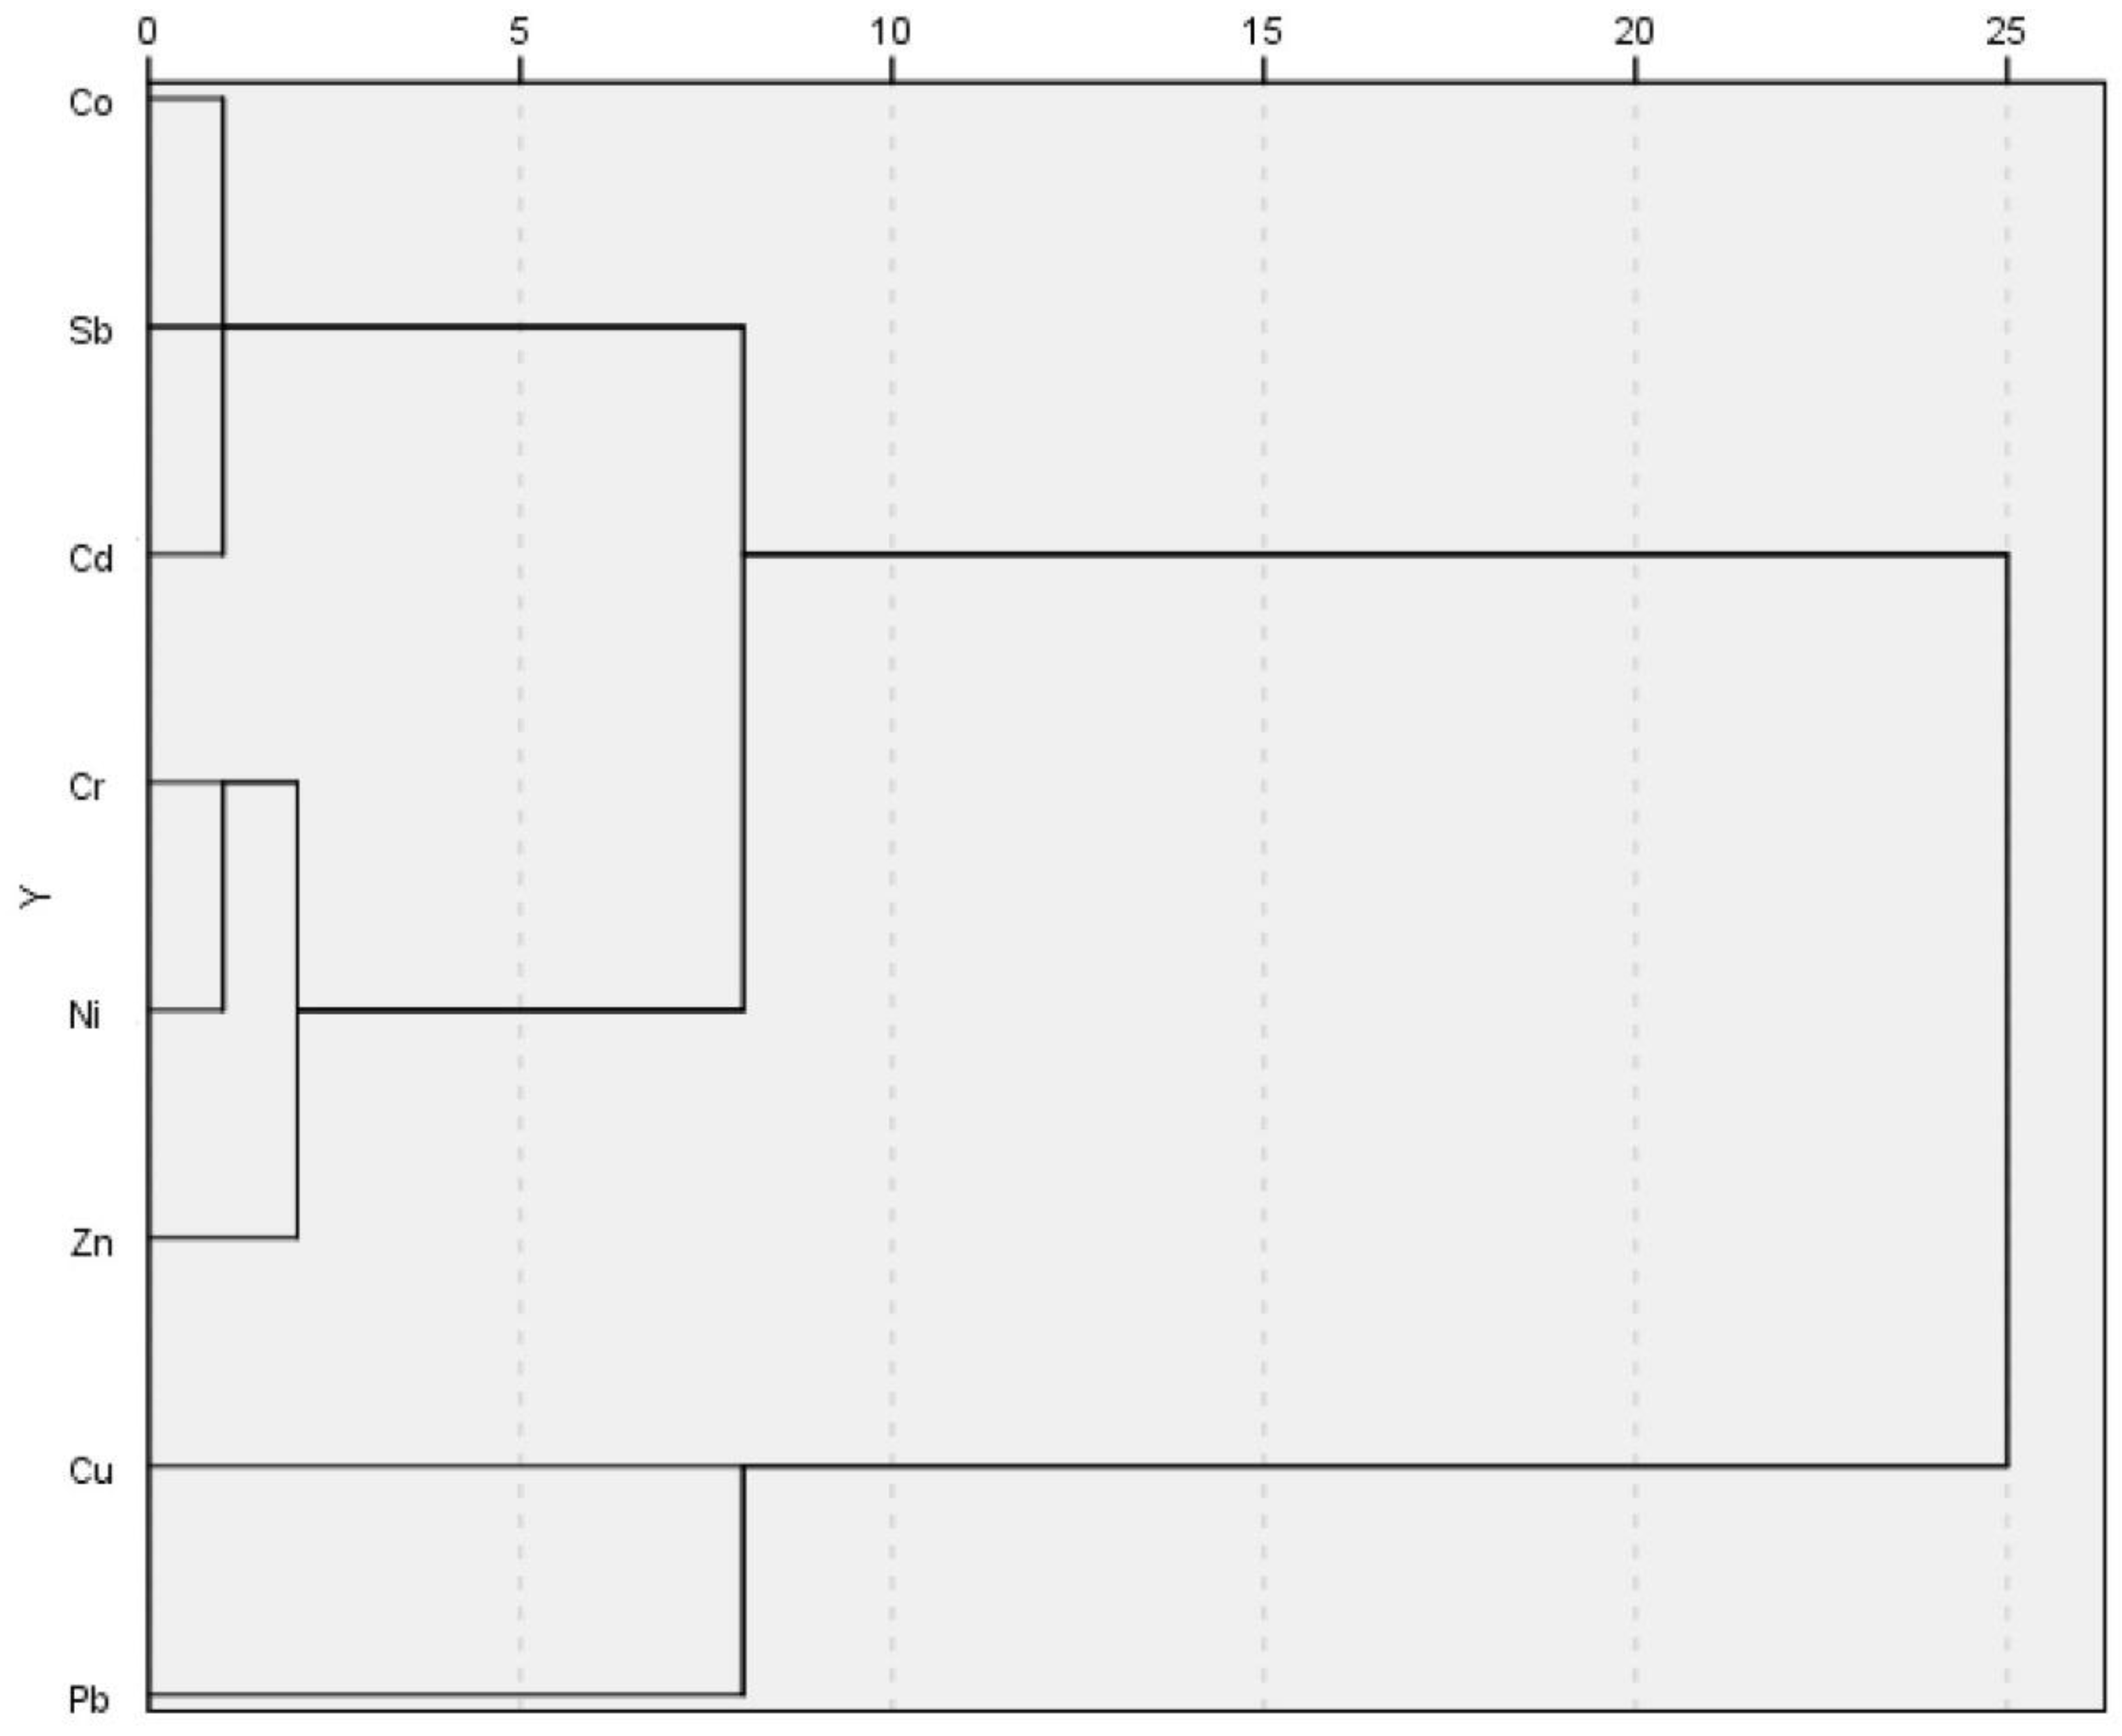
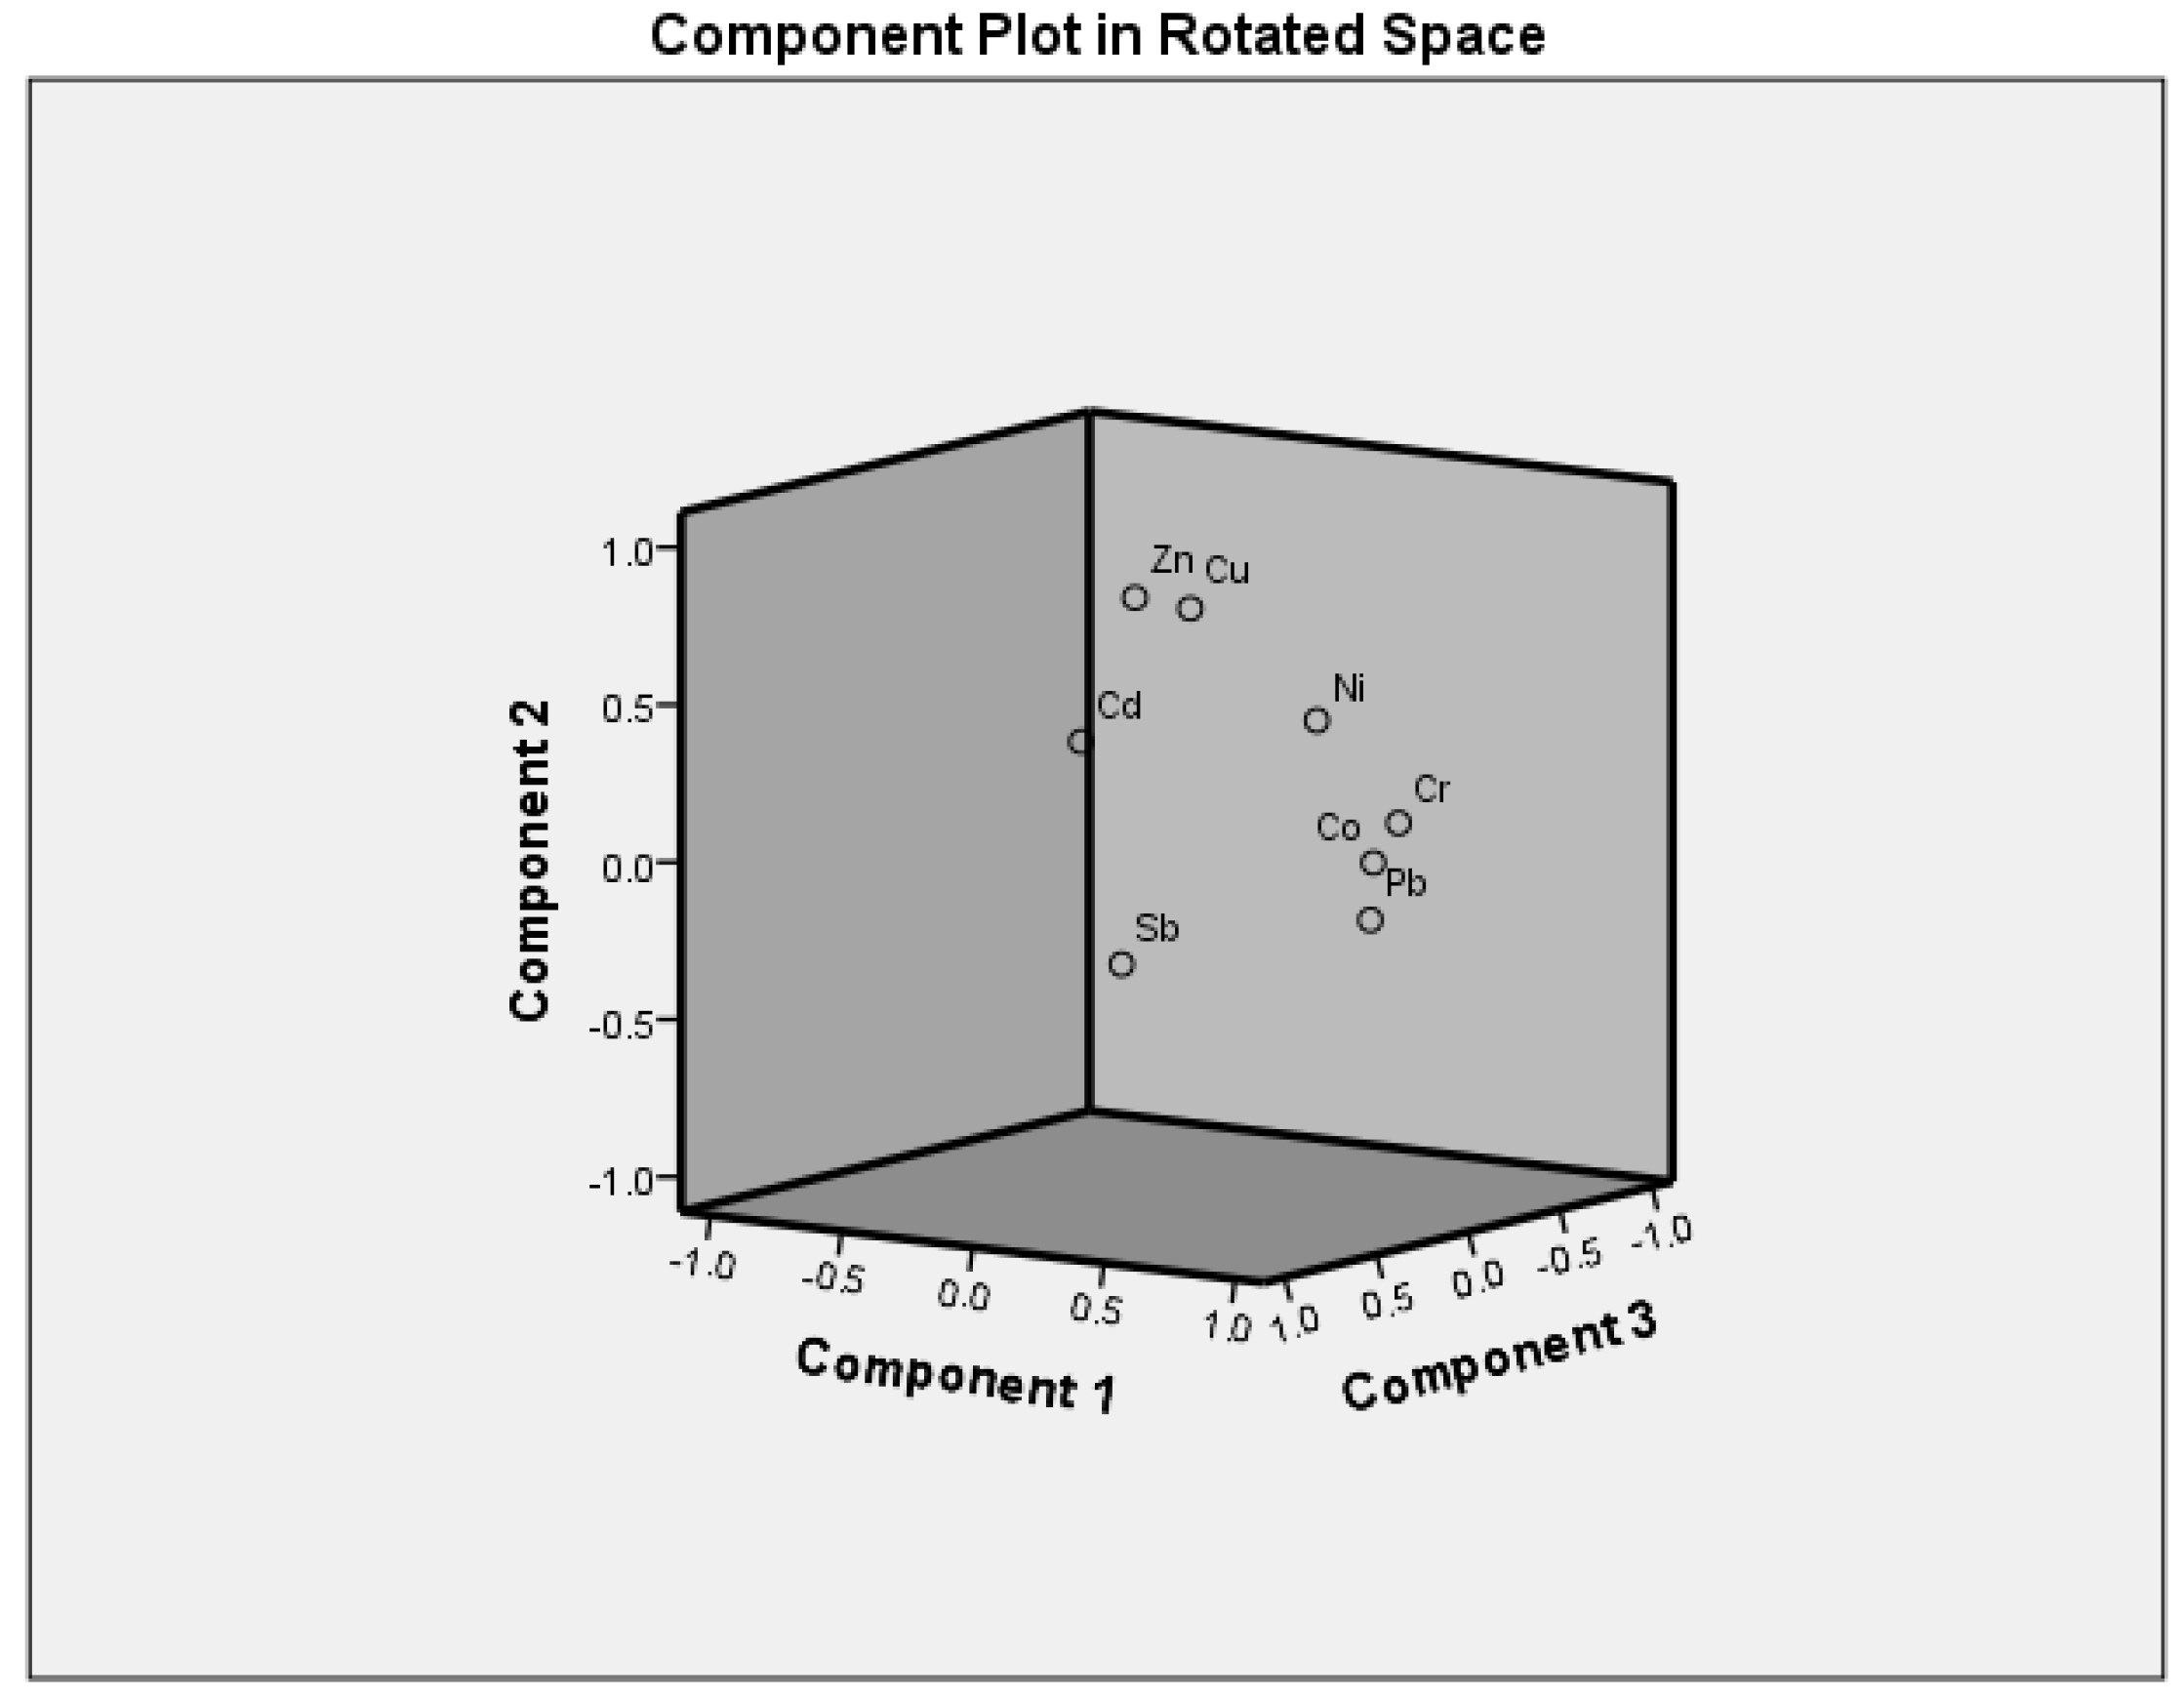
3.3. Possible Sources of PTEs
4. Conclusions
Author Contributions
Funding
Data Availability Statement
Acknowledgments
Conflicts of Interest
References
- Al-Hashim, M.H.; El-Sorogy, A.S.; Al Qaisi, S.; Alharbi, T. Contamination and ecological risk of heavy metals in Al-Uqair coastal sediments, Saudi Arabia. In Marine Pollution Bulletin; Elsevier BV: Amsterdam, The Netherlands, 2021; Volume 171, p. 112748. [Google Scholar] [CrossRef]
- Alarifi, S.S.; El-Sorogy, A.S.; Al-Kahtany, K.; Alotaibi, M. Contamination and Environmental Risk Assessment of Potentially Toxic Elements in Soils of Palm Farms in Northwest Riyadh, Saudi Arabia. Sustainability 2022, 14, 15402. [Google Scholar] [CrossRef]
- Alzahrani, H.; El-Sorogy, A.S.; Qaysi, S.; Alshehri, F. Contamination and Risk Assessment of Potentially Toxic Elements in Coastal Sediments of the Area between Al-Jubail and Al-Khafji, Arabian Gulf, Saudi Arabia. Water 2023, 15, 573. [Google Scholar] [CrossRef]
- Wang, J.; Liu, R.H.; Yu, P.; Tang, A.K.; Xu, L.Q.; Wang, J.Y. Study on the pollution characteristics of heavy metals in seawater of Jinzhou Bay. Environ. Sci. 2012, 13, 1507–1516. [Google Scholar]
- Saleh, A.H.; Gad, M.; Khalifa, M.M.; Elsayed, S.; Moghanm, F.S.; Ghoneim, A.M.; Danish, S.; Datta, R.; Moustapha, M.E.; El-Safa, M.M.A. Environmental Pollution Indices and Multivariate Modeling Approaches for Assessing the Potentially Harmful Elements in Bottom Sediments of Qaroun Lake, Egypt. J. Mar. Sci. Eng. 2021, 9, 1443. [Google Scholar] [CrossRef]
- Abou El-Safa, M.M.A.; Elsayed, S.; Elsherbiny, O.; Elmetwalli, A.H.; Gad, M.; Moghanm, F.S.; Eid, E.M.; Taher, M.A.; El-Morsy, M.H.E.; Osman, H.E.M.; et al. Environmental Assessment of Potentially Toxic Elements Using Pollution Indices and Data-Driven Modeling in Surface Sediment of the Littoral Shelf of the Mediterranean Sea Coast and Gamasa Estuary, Egypt. J. Mar. Sci. Eng. 2022, 10, 816. [Google Scholar] [CrossRef]
- Bozkurt, E.; Eliri, Ö.; Kesiktaş, M. Analysis of heavy metals in seawater samples collected from beaches of Asian side of Istanbul. J. Recreat. Tour. Res. 2014, 1, 39–47. [Google Scholar]
- Soares, H.M.V.M.; Boaventura, R.A.R.; Machado, A.A.S.C.; Esteves da Silva, J.C.G. Sediments as monitors of heavy metal contamination in the Ave river basin (Portuga): Multivariate analysis of data. Environ. Pollut. 1999, 105, 311–323. [Google Scholar]
- Ip, C.C.; Li, X.-D.; Zhang, G.; Wai, O.W.; Li, Y.-S. Trace metal distribution in sediments of the Pearl River Estuary and the surrounding coastal area, South China. Environ. Pollut. 2007, 147, 311–323. [Google Scholar]
- Pejman, A.; Bidhendi, G.N.; Ardestani, M.; Saeedi, M.; Baghvand, A. A new index for assessing heavy metals contamination in sediments: A case study. Ecol. Indic. 2015, 58, 365–373. [Google Scholar]
- Gad, M.; Abou El-Safa, M.M.; Farouk, M.; Hussein, H.; Alnemari, A.M.; Elsayed, S.; Khalifa, M.M.; Moghanm, F.S.; Eid, E.M.; Saleh, A.H. Integration of Water Quality Indices and Multivariate Modeling for Assessing Surface Water Quality in Qaroun Lake, Egypt. Water 2021, 13, 2258. [Google Scholar] [CrossRef]
- Saleh, A.H.; Elsayed, S.; Gad, M.; Elmetwalli, A.H.; Elsherbiny, O.; Hussein, H.; Moghanm, F.S.; Qazaq, A.S.; Eid, E.M.; El-Kholy, A.S.; et al. Utilization of Pollution Indices, Hyperspectral Reflectance Indices, and Data-Driven Multivariate Modelling to Assess the Bottom Sediment Quality of Lake Qaroun, Egypt. Water 2022, 14, 890. [Google Scholar] [CrossRef]
- Gad, M.; Saleh, A.H.; Hussein, H.; Farouk, M.; Elsayed, S. Appraisal of SurfaceWater Quality of Nile River Using Water Quality Indices, Spectral Signature and Multivariate Modeling. Water 2022, 14, 1131. [Google Scholar] [CrossRef]
- Alqarawy, A.; El Osta, M.; Masoud, M.; Elsayed, S.; Gad, M. Use of Hyperspectral Reflectance And Water Quality Indices to Assess Groundwater Quality for Drinking in Arid Regions, Saudi Arabia. Water 2022, 14, 2311. [Google Scholar] [CrossRef]
- Al-Hashim, M.H.; El-Sorogy, A.S.; Alshehri, F.; Qaisi, S. Environmental Assessment of Surface Seawater in Al-Uqair Coastline, Eastern Saudi Arabia. Water 2022, 14, 3423. [Google Scholar] [CrossRef]
- El-Sorogy, A.S.; Youssef, M.; Al-Kahtany, K.h. Integrated assessment of the Tarut Island coast, Arabian Gulf, Saudi Arabia. Environ. Earth Sci. 2016, 75, 1336. [Google Scholar]
- El-Sorogy, A.S.; Youssef, M.; Al-Hashim, M.H. Water Quality Assessment and Environmental Impact of Heavy Metals in the Red Sea Coastal Seawater of Yanbu, Saudi Arabia. Water 2023, 15, 201. [Google Scholar] [CrossRef]
- Kahal, A.; El-Sorogy, A.S.; Alfaifi, H.; Almadani, S.; Ghrefat, H.A. Spatial distribution and ecological risk assessment of the coastal surface sediments from the Red Sea, northwest Saudi Arabia. Mar. Pollut. Bull. 2018, 137, 198–208. [Google Scholar]
- Kahal, A.; El-Sorogy, A.S.; Alfaifi, H.; Almadani, S.; Kassem, S.M. Ahmed Al-Dossaria Contamination and ecological risk assessment of the Red Sea coastal sediments, southwest Saudi Arabia. Mar. Pollut. Bull. 2020, 154, 111125. [Google Scholar]
- Novotný, K.; Turzíková, A.; Komárek, J. Speciation of copper, lead and cadmium in aquatic systems by circulating dialysis combined with flame AAS. Anal. Bioanal. Chem. 2000, 366, 209–212. [Google Scholar]
- DeForest, D.; Brix, K.; Adams, W. Assessing metal bioaccumulation in aquatic environments: The inverse relationship between bioaccumulation factors, trophic transfer factors and exposure concentration. Aquat. Toxicol. 2007, 84, 236–246. [Google Scholar]
- Yılmaz, S.; Sadikoglu, M. Study of heavy metal pollution in seawater of Kepez harbor of Canakkale (Turkey). Environ. Monit. Assess. 2011, 173, 899–904. [Google Scholar] [PubMed]
- Rumisha, C.; Elskens, M.; Leermakers, M.; Kochzius, M. Trace metal pollution and its influence on the community structure of soft bottom molluscs in intertidal areas of the Dar es Salaam coast, Tanzania. Mar. Pollut. Bull. 2012, 64, 521–531. [Google Scholar]
- Dullo, W.-C. Facies, fossil record, and age of pleistocene reefs from the Red Sea (Saudi Arabia). Facies 1990, 22, 1–46. [Google Scholar] [CrossRef]
- Casazza, L.R. Pleistocene reefs of the Egyptian Red Sea: Environmental change and community persistence. PeerJ 2017, 5, 3504. [Google Scholar] [CrossRef]
- El-Sorogy, A.S. Progressive diagenetic sequence for Pleistocene coral reefs in the area between Quseir and Mersa Alam, Red Sea coast, Egypt. Egypt. J. Geol. 1997, 41, 519–540. [Google Scholar]
- El-Sorogy, A.S. Pleistocene coral reefs of southern Sinai, Egypt: Fossil record, facies analysis and diagenetic alterations. Middle East Res. Cent. Ain Shams Univ. Earth Sci. Ser. 1997, 11, 17–36. [Google Scholar]
- El-Sorogy, A.S. Paleontology and depositional environments of the Pleistocene coral reefs of the Gulf of Suez, Egypt. Neues Jahrb. Geol. Paläontol.-Abh. 2002, 225, 337–371. [Google Scholar]
- El-Sorogy, A.S. Contributions to the Pleistocene coral reefs of the Red Sea coast, Egypt. Arab. Gulf. J. Sci. Res. 2008, 26, 63–85. [Google Scholar]
- Abd El-Wahab, M.; El-Sorogy, A.S. Scleractinian corals as pollution indicators, Red Sea coast, Egypt. Neues Jb. Geol. Paläont. Mh. 2003, 11, 641–655. [Google Scholar]
- Kahal, A.; El-Sorogy, A.S.; Alfaifi, H.; Almadani, S.; Kassem, O.M. Biofacies and diagenetic alterations of the Pleistocene coral reefs, northwest Red Sea coast, Saudi Arabia. Geol. J. 2019, 55, 1380–1390. [Google Scholar] [CrossRef]
- El-Sorogy, A.S.; Demircan, H.; Al-Kahtany, K. Taphonomic signatures on modern molluscs and corals from Red Sea coast, southern Saudi Arabia. Palaeoworld 2022, 31, 365–381. [Google Scholar] [CrossRef]
- Demircan, H.; El-Sorogy, A.S.; Alharbi, T. Bioerosional structures from the Late Pleistocene coral reef, Red Sea coast, northwest Saudi Arabia. Turk. J. Earth Sci. 2021, 30, 22–37. [Google Scholar] [CrossRef]
- Al-Farawati, R.; Gazzaz, M.; El Sayed, M.; El-Maradny, A. Temporal and spatial distribution of dissolved Cu, Ni and Zn in the coastal waters of Jeddah, eastern Red Sea. Arab. J. Geosci. 2011, 4, 1229–1238. [Google Scholar] [CrossRef]
- Youssef, M.; El-Sorogy, A.S. Environmental assessment of heavy metal contamination in bottom sediments of Al-Kharrar lagoon, Rabigh, Red Sea, Saudi Arabia. Arab. J. Geosci. 2016, 9, 474. [Google Scholar] [CrossRef]
- Alfaifi, H.; El-Sorogy, A.S.; Qaysi, S.; Kahal, A.; Almadani, S.; Alshehri, F.; Zaidi, F.K. Evaluation of heavy metal contamination and groundwater quality along the Red Sea coast, southern Saudi Arabia. Mar. Pollut. Bull. 2021, 163, 111975. [Google Scholar] [CrossRef] [PubMed]
- APHA Standard Methods for the Examination of Water and Wastewater, 21st ed.; American Public Health Association: Washington, DC, USA; American Water Works Association: Washington, DC, USA; Water Environment Federation: Washington, DC, USA, 2005.
- Papadoyannis, I.N.; Samanidou, V.F. Validation of HPLC Instrumentation. J. Liq. Chromatogr. Relat. Technol. 2004, 27, 753–783. [Google Scholar] [CrossRef]
- Christodoulou, E.A.; Samanidou, V.F. Multiresidue HPLC analysis of ten quinolones in milk after solid phase extraction: Validation according to the European Union Decision 2002/657/EC. J. Sep. Sci. 2007, 30, 2421–2429. [Google Scholar] [CrossRef]
- Prasanna, M.V.; Praveena, S.M.; Chidambaram, S.; Nagarajan, R.R.; Elayaraja, A. Evaluation of water quality pollu-tion indices for heavy metal contamination monitoring: A case study from Curtin Lake, Miri City, East Malaysia. Environ. Earth Sci. 2012, 67, 1987–2001. [Google Scholar] [CrossRef]
- Mohan, S.V.; Nithila, P.; Reddy, S.J. Estimation of heavy metal in drinking water and development of heavy metal pollution index. J. Environ. Sci. Health 1996, A31, 283–289. [Google Scholar] [CrossRef]
- World Health Organization (WHO). Guidelines for Drinking-Water Quality: Fourth Edition Incorporating the First Addendum; World Health Organization: Geneva, Switzerland, 2017. [Google Scholar]
- El-Sorogy, A.S.; Youssef, M. Pollution assessment of the Red Sea-Gulf of Aqaba seawater, northwest Saudi Arabia. Environ. Monit. Assess. 2021, 193, 141. [Google Scholar] [CrossRef]
- Backman, B.; Bodis, D.; Lahermo, P.; Rapant, S.; Tarvainen, T. Application of a groundwater contamination index in Finlandand Slovakia. Environ. Geol. 1997, 36, 55–64. [Google Scholar] [CrossRef]
- Caerio, S.; Costa, M.H.; Ramos, T.B.; Fernandes, F.; Silveira, N.; Coimbra, A.; Painho, M. Assessing heavy metal contamination in Sado Estuary sediment: An index analysis approach. Ecol. Indic. 2005, 5, 155–169. [Google Scholar] [CrossRef]
- Donat, J.R.; Bruland, K.W. Trace Elements in the Oceans. In Trace Elements in Natural Waters; Salbu, B., Steinnes, E., Eds.; CRC Press: Boca Raton, FL, USA, 1995; pp. 247–292. [Google Scholar]
- Al-Taani, A.A.; Batayneh, A.; Nazzal, Y.; Ghrefat, H.; Elawadi, E.; Zaman, H. Status of trace metals in surface seawater of the Gulf of Aqaba, Saudi Arabia. Mar. Pollut. Bull. 2014, 86, 582–590. [Google Scholar] [CrossRef] [PubMed]
- Broecker, W.; Peng, T. Tracers in the Sea; Lamont-Doherty Geological Observatory, Columbia University: Palisades, NY, USA, 1982. [Google Scholar]
- Al-Sayed, H.; Mahasneh, A.M.; Al-Saad, J. Variations of trace metal concentrations in seawater and pearl oyster Pinctada radiata from Bahrain (Arabian Gulf). Mar. Pollut. Bull. 1994, 28, 370–374. [Google Scholar] [CrossRef]
- Al-Kahtany, K.; El-Sorogy, A.S. Heavy metal contamination of surface seawaters in Abu Ali Island, Saudi Arabia. Arab. J. Geosci. 2022, 15, 1662. [Google Scholar] [CrossRef]
- Alharbi, T.; Alfaifi, H.; El-Sorogy, A.S. Metal pollution in Al-Khobar seawater, Arabian Gulf, Saudi Arabia. Mar. Pollut. Bull. 2017, 119, 407–415. [Google Scholar] [CrossRef] [PubMed]
- Alharbi, T.; El-Sorogy, A. Assessment of seawater pollution of the Al-Khafji coastal area, Arabian Gulf, Saudi Arabia. Environ. Monit. Assess. 2019, 191, 383. [Google Scholar] [CrossRef] [PubMed]
- Shriadah, M.A.; Okbah, M.A.; El-Deek, M.S. Tracemetals in thewater columns of the Red Sea and the Gulf of Aqaba, Egypt. Water Air Soil Pollut. 2004, 153, 115–124. [Google Scholar] [CrossRef]
- Ali, A. Sudanese Coastal Water—Composition and Some Environmental Aspects. Master’s Thesis, Universitas Bergensis, Bergen, Norway, 2012; 72p. [Google Scholar]
- Bzzi, A.O. Heavy metals in seawaters, sediments and marine organisms in the Gulf of Chbahar, Oman Sea. J. Oceanogr. Mar. Sci. 2014, 5, 20–29. [Google Scholar] [CrossRef]
- El-Sorogy, A.; Attiah, A. Assessment of metal contamination in coastal sediments, seawaters and bivalves of the Mediterranean Sea coast, Egypt. Mar. Pollut. Bull. 2015, 101, 867–871. [Google Scholar] [CrossRef] [PubMed]
- Abadi, M.; Zamani, A.; Parizanganeh, A.; Khosravi, Y.; Badiee, H. Heavy metals and arsenic content in water along the southern Caspian coasts in Iran. Environ. Sci. Pollut. Res. 2019, 25, 23725–23735. [Google Scholar] [CrossRef] [PubMed]
- Häder, D.-P.; Helbling, E.W.; Villafañe, V.E. Anthropogenic Pollution of Aquatic Ecosystems; Springer: Basel, Switzerland, 2021; p. 426. [Google Scholar] [CrossRef]
- Chen, H.; Lu, X.; Li, L.Y. Spatial distribution and risk assessment of metals in dust based on samples from nursery and primary schools of Xi’an, China. Atmos. Environ. 2014, 88, 172–182. [Google Scholar] [CrossRef]
- Zhou, L.; Yang, B.; Xue, N.; Li, F.; Seip, H.M.; Cong, X.; Yan, Y.; Liu, B.; Han, B.; Li, H. Ecological risks and potential sources of heavy metals in agricultural soils from Huanghuai Plain, China. Environ. Sci. Pollut. Res. 2014, 21, 1360–1369. [Google Scholar] [CrossRef] [PubMed]
- Adimalla, N.; Qian, H.; Wang, H. Assessment of heavy metal (HM) contamination in agricultural soil lands in northern Telangana, India: An approach of spatial distribution and multivariate statistical analysis. Environ. Monit. Assess. 2019, 191, 246. [Google Scholar] [CrossRef]
- Wang, J.; Liu, R.; Zhang, P.; Yu, W.; Shen, Z.; Feng, C. Spatial variation, environmental assessment and source identification of heavy metals in sediments of the Yangtze River Estuary. Mar. Pollut. Bull. 2014, 87, 364–373. [Google Scholar] [CrossRef]
- Zhang, L.; Shi, Z.; Zhang, J.; Jiang, Z.; Wang, F.; Huang, X. Toxic heavy metals in sediments, seawater, and molluscs in the eastern and western coastal waters of Guangdong Province, South China. Environ. Monit. Assess. 2016, 188, 313. [Google Scholar] [CrossRef]


| S.N. | Latitudes | Longitudes | Cr | Co | Ni | Cu | Zn | Cd | Sb | Pb | HPI | Cd |
|---|---|---|---|---|---|---|---|---|---|---|---|---|
| S1 | 16°48′84″ | 42°76′36″ | 1.50 | 0.13 | 1.60 | 3.50 | 1.30 | 0.08 | 0.52 | 4.20 | 7.95 | 3.69 |
| S2 | 16°50′08″ | 42°74′03″ | 1.20 | 0.21 | 1.40 | 2.30 | 1.20 | 0.06 | 0.44 | 3.10 | 6.55 | 2.94 |
| S3 | 16°53′35″ | 42°72′63″ | 1.00 | 0.30 | 0.90 | 2.50 | 1.30 | 0.05 | 0.48 | 2.50 | 6.05 | 2.72 |
| S4 | 16°55′40″ | 42°72′48″ | 1.10 | 0.38 | 1.90 | 3.10 | 1.00 | 0.08 | 0.52 | 2.10 | 6.45 | 2.74 |
| S5 | 16°60′26″ | 42°71′63″ | 1.40 | 0.32 | 1.60 | 3.00 | 0.50 | 0.04 | 0.48 | 3.20 | 6.97 | 3.31 |
| S6 | 16°70′45″ | 42°70′90″ | 1.60 | 0.35 | 1.70 | 0.90 | 0.60 | 0.06 | 0.34 | 3.80 | 8.21 | 3.51 |
| S7 | 16°76′79″ | 42°67′81″ | 1.20 | 0.29 | 1.30 | 2.60 | 0.80 | 0.06 | 0.42 | 2.90 | 6.67 | 2.99 |
| S8 | 16°78′56″ | 42°67′40″ | 1.40 | 0.08 | 0.80 | 0.70 | 0.50 | 0.04 | 0.31 | 2.10 | 4.10 | 1.76 |
| S9 | 16°80′93″ | 42°64′51″ | 1.00 | 0.09 | 1.00 | 0.90 | 0.70 | 0.04 | 0.42 | 1.00 | 2.71 | 1.08 |
| S10 | 16°81′98″ | 42°63′51″ | 1.20 | 0.30 | 1.20 | 3.20 | 0.90 | 0.06 | 0.32 | 2.50 | 6.16 | 2.81 |
| S11 | 16°82′26″ | 42°60′96″ | 1.40 | 0.25 | 0.80 | 2.80 | 1.10 | 0.05 | 0.50 | 1.60 | 4.59 | 2.05 |
| S12 | 16°83′96″ | 42°58′97″ | 1.60 | 0.32 | 1.50 | 2.70 | 1.50 | 0.04 | 0.28 | 2.20 | 5.62 | 2.62 |
| S13 | 16°83′49″ | 42°57′43″ | 1.20 | 0.17 | 1.20 | 2.10 | 1.20 | 0.07 | 0.34 | 2.80 | 6.03 | 2.62 |
| S14 | 16°87′36″ | 42°54′89″ | 1.30 | 0.26 | 1.00 | 2.00 | 1.00 | 0.06 | 0.28 | 1.50 | 4.58 | 1.91 |
| S15 | 16°90′38″ | 42°54′42″ | 1.10 | 0.18 | 1.20 | 3.10 | 1.40 | 0.08 | 0.42 | 1.80 | 4.92 | 3.69 |
| S16 | 16°93′52″ | 42°54′50″ | 1.00 | 0.32 | 1.50 | 2.80 | 0.60 | 0.06 | 0.36 | 2.40 | 6.13 | 2.11 |
| S17 | 16°95′40″ | 42°53′80″ | 1.40 | 0.18 | 1.40 | 3.30 | 0.80 | 0.05 | 0.30 | 1.80 | 4.43 | 2.74 |
| S18 | 17°01′17″ | 42°53′31″ | 1.50 | 0.20 | 1.30 | 2.60 | 0.80 | 0.04 | 0.41 | 2.10 | 4.83 | 2.12 |
| S19 | 17°02′75″ | 42°52′68″ | 1.60 | 0.23 | 1.00 | 2.40 | 1.00 | 0.07 | 0.28 | 1.80 | 4.99 | 2.27 |
| S20 | 17°04′12″ | 42°47′90″ | 1.20 | 0.18 | 0.90 | 2.00 | 1.20 | 0.06 | 0.38 | 1.60 | 4.32 | 2.10 |
| S21 | 17°07′56″ | 42°44′10″ | 1.00 | 0.08 | 1.40 | 3.20 | 1.00 | 0.08 | 0.42 | 1.20 | 3.56 | 1.81 |
| S22 | 17°14′74″ | 42°42′07″ | 1.30 | 0.13 | 1.50 | 3.50 | 1.40 | 0.05 | 0.22 | 1.80 | 4.17 | 1.52 |
| S23 | 17°36′70″ | 42°31′50″ | 1.50 | 0.16 | 1.50 | 2.50 | 1.10 | 0.05 | 0.28 | 1.50 | 3.94 | 2.06 |
| S24 | 17°37′84″ | 42°32′10″ | 1.20 | 0.18 | 1.00 | 3.00 | 1.20 | 0.04 | 0.36 | 2.50 | 5.23 | 1.80 |
| S25 | 17°39′51″ | 42°32′47″ | 1.40 | 0.28 | 1.20 | 2.20 | 0.80 | 0.04 | 0.40 | 3.60 | 7.26 | 2.54 |
| S26 | 17°40′96″ | 42°32′53″ | 1.00 | 0.25 | 1.40 | 2.90 | 0.80 | 0.06 | 0.28 | 1.80 | 4.93 | 3.38 |
| S27 | 17°42′84″ | 42°32′31″ | 1.20 | 0.32 | 0.90 | 3.50 | 1.20 | 0.04 | 0.24 | 2.80 | 6.34 | 2.21 |
| S28 | 17°44′33″ | 42°29′62″ | 1.20 | 0.20 | 1.00 | 3.20 | 1.00 | 0.06 | 0.35 | 2.40 | 5.49 | 3.07 |
| S29 | 17°45′02″ | 42°76′36″ | 1.00 | 0.18 | 1.60 | 2.00 | 1.20 | 0.04 | 0.40 | 2.50 | 5.27 | 2.54 |
| S30 | 17°46′06″ | 42°27′26″ | 1.30 | 0.21 | 1.80 | 2.60 | 1.50 | 0.06 | 0.28 | 1.80 | 4.79 | 2.44 |
| S31 | 17°47′81″ | 42°25′85″ | 1.50 | 0.25 | 1.40 | 2.80 | 1.40 | 0.04 | 0.24 | 1.50 | 4.27 | 2.13 |
| S32 | 17°49′91″ | 42°24′06″ | 1.40 | 0.17 | 1.50 | 3.10 | 1.20 | 0.05 | 0.16 | 1.70 | 4.22 | 2.01 |
| Minimum | 1.00 | 0.08 | 0.80 | 0.70 | 0.50 | 0.04 | 0.16 | 1.00 | 2.71 | 1.08 | ||
| Maximum | 1.60 | 0.38 | 1.90 | 3.50 | 1.50 | 0.08 | 0.52 | 4.20 | 8.21 | 3.69 | ||
| Average | 1.28 | 0.22 | 1.30 | 2.56 | 1.04 | 0.06 | 0.36 | 2.27 | 5.37 | 2.38 | ||
| Std. Deviation | 0.20 | 0.80 | 0.30 | 0.73 | 0.29 | 0.01 | 0.09 | 0.76 | 1.28 | 0.64 | ||
| MAC | 50.0 | 5.00 | 20.0 | 2000 | 40.0 | 3.00 | 20.0 | 10.0 | ||||
| Location | Pb | Cd | Zn | Ni | Co | Cr | Cu | Reference |
|---|---|---|---|---|---|---|---|---|
| Red Sea, Saudi Arabia | 2.27 | 0.06 | 1.04 | 1.30 | 0.22 | 1.28 | 2.56 | Present study |
| Al-Uqair Coastline, Arabian Gulf | 0.26 | 0.05 | 6.72 | 3.01 | - | 9.64 | 2.48 | [15] |
| Arabian Gulf, Saudi Arabia | 0.48 | 0.03 | 0.97 | - | 2.06 | 12.95 | 2.65 | [16] |
| Yanbu, Red Sea, Saudi Arabia | 0.28 | 0.31 | 1.67 | 4.42 | 0.14 | 0.72 | 2.45 | [17] |
| North Atlantic | 125 | 5.5 | 0.15 | - | 159 | 3.5 | 1.15 | [46] |
| North Pacific | 32 | 5.5 | 0.15 | - | 27 | 3 | 0.9 | |
| Gulf of Aqaba, Saudi Arabia | 0.20 | 0.03 | 3.32 | - | 0.24 | 0.96 | 6.18 | [47] |
| Average oceanic concentration | 0.001 | 0.07 | 0.4 | - | - | 0.33 | 0.12 | [48] |
| Arabian Gulf, Bahrain | 0.16 | 0.11 | 0.84 | 0.31 | - | - | 0.20 | [49] |
| Abu Ali Island, Arabian Gulf | 0.15 | 0.08 | 11.44 | 3.49 | 0.27 | - | 3.77 | [50] |
| Arabian Gulf, Saudi Arabia | 0.04 | 0.11 | 16.21 | 4.36 | 0.36 | 1.38 | 5.24 | [51] |
| Arabian Gulf, Saudi Arabia | 0.28 | 0.07 | 1.53 | 4.40 | 0.23 | 2.44 | 2.44 | [52] |
| Gulf of Aqaba | 0.32 | 0.57 | 0.24 | 0.22 | 0.17 | - | 0.14 | [53] |
| Red Sea Coast, Egypt | 0.03 | 0.06 | 5.5 | 0.76 | 0.03 | 0.18 | 0.97 | [54] |
| Oman Sea, Oman | 2.22 | 0.13 | 11.7 | 10.9 | - | 15.51 | 2.77 | [55] |
| Mediterranean Sea, Egypt | 0.426 | - | 1.694 | 1.92 | - | 0.133 | - | [56] |
| Caspian Sea Coast, Iran | 1.67 | 0.27 | 16.94 | 9.93 | 1.65 | 5.02 | [57] |
| Cr | Co | Ni | Cu | Zn | Cd | Sb | Pb | |
|---|---|---|---|---|---|---|---|---|
| Cr | 1 | |||||||
| Co | 0.082 | 1 | ||||||
| Ni | 0.114 | 0.214 | 1 | |||||
| Cu | −0.072 | 0.141 | 0.223 | 1 | ||||
| Zn | 0.021 | −0.130 | 0.075 | 0.402 * | 1 | |||
| Cd | −0.216 | −0.035 | 0.233 | 0.241 | 0.143 | 1 | ||
| Sb | −0.281 | 0.106 | 0.009 | −0.037 | −0.184 | 0.281 | 1 | |
| Pb | 0.201 | 0.369 * | 0.217 | 0.011 | −0.159 | 0.043 | 0.342 | 1 |
| Component | |||
|---|---|---|---|
| 1 | 2 | 3 | |
| Cr | −0.048 | −0.235 | 0.763 |
| Co | 0.575 | −0.291 | 0.312 |
| Ni | 0.582 | 0.187 | 0.338 |
| Cu | 0.393 | 0.668 | 0.196 |
| Zn | −0.011 | 0.759 | 0.239 |
| Cd | 0.495 | 0.444 | −0.396 |
| Sb | 0.539 | −0.238 | −0.617 |
| Pb | 0.669 | −0.445 | 0.172 |
| % of Variance | 22.593 | 20.621 | 18.215 |
| Cumulative % | 22.593 | 43.214 | 61.429 |
Disclaimer/Publisher’s Note: The statements, opinions and data contained in all publications are solely those of the individual author(s) and contributor(s) and not of MDPI and/or the editor(s). MDPI and/or the editor(s) disclaim responsibility for any injury to people or property resulting from any ideas, methods, instructions or products referred to in the content. |
© 2023 by the authors. Licensee MDPI, Basel, Switzerland. This article is an open access article distributed under the terms and conditions of the Creative Commons Attribution (CC BY) license (https://creativecommons.org/licenses/by/4.0/).
Share and Cite
Kahal, A.Y.; El-Sorogy, A.S.; Qaysi, S.I.; Al-Hashim, M.H.; Al-Dossari, A. Environmental Risk Assessment and Sources of Potentially Toxic Elements in Seawater of Jazan Coastal Area, Saudi Arabia. Water 2023, 15, 3174. https://doi.org/10.3390/w15183174
Kahal AY, El-Sorogy AS, Qaysi SI, Al-Hashim MH, Al-Dossari A. Environmental Risk Assessment and Sources of Potentially Toxic Elements in Seawater of Jazan Coastal Area, Saudi Arabia. Water. 2023; 15(18):3174. https://doi.org/10.3390/w15183174
Chicago/Turabian StyleKahal, Ali Y., Abdelbaset S. El-Sorogy, Saleh I. Qaysi, Mansour H. Al-Hashim, and Ahmed Al-Dossari. 2023. "Environmental Risk Assessment and Sources of Potentially Toxic Elements in Seawater of Jazan Coastal Area, Saudi Arabia" Water 15, no. 18: 3174. https://doi.org/10.3390/w15183174
APA StyleKahal, A. Y., El-Sorogy, A. S., Qaysi, S. I., Al-Hashim, M. H., & Al-Dossari, A. (2023). Environmental Risk Assessment and Sources of Potentially Toxic Elements in Seawater of Jazan Coastal Area, Saudi Arabia. Water, 15(18), 3174. https://doi.org/10.3390/w15183174