Article

Risk Assessment and Control of Geological Hazards in Towns of Complex Mountainous Areas Based on Remote Sensing and Geological Survey

1
SinoProbe Center, Chinese Academy of Geological Sciences and China Geological Survey, Beijing 100084, China
2
Center for Hydrogeology and Environmental Geology Survey, CGS, Baoding 071051, China
3
Institute of Geotechnical Engineering, Xi’an University of Technology, Xi’an 404100, China
4
China Institute of Geo-Environment Monitoring, Beijing 100081, China
5
Xi’an Geological Survey Center of China Geological Survey, Xi’an 710061, China
*
Authors to whom correspondence should be addressed.
These authors contributed equally to this work.
Water 2023, 15(18), 3170; https://doi.org/10.3390/w15183170
Submission received: 30 April 2023 / Revised: 17 August 2023 / Accepted: 29 August 2023 / Published: 5 September 2023
(This article belongs to the Special Issue Mine and Water)

Abstract

:
Mountainous areas have become among the most developed areas of geological hazards due to special geological environmental conditions and intensive human engineering activities. Geological hazards are a main threat to urbanization, rural revitalization, and new rural construction in complex mountainous areas. It is of great strategic significance to conduct large-scale geological hazard investigation and risk assessment in urban areas, control the risk of geological hazards at the source and propose risk control measures. In this paper, we established the technical methods of geologic hazard risk assessment and control in complex mountain towns by taking Longlin Town in the mountainous region of Gansu Longnan, China as the study area, with the Quanjia bay debris flows and Panping Village landslides as the typical pilot investigation and assessment. The methods consist of six stages—risk identification, hazard disaster model investigation, risk analysis, vulnerability assessment, risk evaluation and risk management and control measures and proposals. On this basis, the results of geological hazards with different precipitation frequencies (5%, 2%, 1%) are presented. The results show that 75.23% of the regions remained at low risk levels; 24.38% of the regions increased a risk level with decreasing precipitation frequency, and 0.39% of the regions remained at extremely high risk levels under different precipitation frequency conditions. For the Quanjia bay debris flows and Panping Village landslides case, we discussed the geological hazards risk source control contents, management and control technologies, engineering and non-engineering measures of disaster prevention and control for urban disasters and specific disaster areas. This research can provide technical support and reference for disaster prevention and mitigation, and territorial spatial planning.

1. Introduction

Many cities have been built on the region of canyon terraces, debris flow accumulation fans and slopes or landslides with fragile ecological environments due to the special natural geography and geological environmental conditions in the mountainous areas of western China. The occurrence and development of geological hazards in the mountains area were affected by human engineering activities in the process of city construction and development, resulting in frequent geological hazards and huge casualties and economic losses. In addition, the threat and danger of geological hazards are further increased by the increase and intensification of extreme weather, earthquakes, and large-scale engineering and economic activities. In the process of urban planning and development in mountainous areas, practical and reliable geological hazard risk zoning and control measures are an urgent need to reduce the casualties and economic losses caused by geological hazards. In particular, a scientific large-scale geological hazard survey and quantitative multi-hazard risk assessment is urgently needed to provide a technical basis for land use planning, disaster prevention and mitigation, and implementation of prevention and control projects.
The evaluation and management control of geological hazard risk is an effective way to prevent and reduce disasters, which mainly includes five major steps—risk identification, risk analysis and evaluation, risk countermeasure decision, implementation decision and risk supervision [1]. Geological hazard risk management control has become an important part of the disaster prevention and reduction strategy system in the world. At present, the technical methods and theoretical systems of geological hazard risk control have been formed basically according to the actual situation of the country or region, and geological hazard risk management has gradually changed from a semi-quantitative to a quantitative direction [2,3,4,5,6,7]. In recent years, many researchers have focused on the geological hazard risk assessment method system and the risk management system. In the mountainous areas of western China, the assessment of urban geological hazard risk, the formation of a series of ideas and technical methods for geological hazard investigation and risk assessment, and the proposition of a series of risk reduction programs have been undertaken [8,9,10,11,12,13,14]. Considering the possible damage of monolithic geologic hazards to population gathering areas and cities, many scholars have carried out the risk assessment of monolithic geologic hazards based on dynamic processes. For example, Xiao Lili et al. analyze the motion accumulation process of Sunjia landslide used by the numerical simulation and profiled the landslide risk level under extreme scenarios quantitatively [15]; Du Juan et al. established a computational model based on the finite volume method by considering the erosion effect and frictional resistance of the lower surface of the landslide during the motion of the landslide debris flow, and predicted the hazard and risk of the El Picacho landslide disaster in El Salvador [16]; Cui Peng et al. took the debris flow in Qingping town as an example, explained the formation mechanism of flash flood debris flow and the methods and contents of risk analysis and management, and proposed a series of risk assessment and risk management theory and method system based on the dynamic process of flash flood debris flow [17]; Shu Heping constructed the area, thickness and morphological characteristics of debris flow accumulation in Sanyanyu through physical simulation tests, and classified the hazard degree [18].
However, most of the above urban geological hazard risk assessments are based on factor analysis of statistical methods; there are many questions in the sufficient reflection of the detailed information of specific hazard sites, the application of assessment results in the risk control of each specific hazard site, and meeting the new requirements of taking the new road of urbanization and comprehensively improving the quality of urbanization [19,20,21]. In addition, there has been a lot of research about static risk assessment focused on the regions or single units, which are mainly applied to risk management planning, while there is a lack of research on the dynamic risk assessment of geological hazards at the town scale [22,23]. For the risk control of urban agglomerations and specific disaster sites, it is necessary to further carry out geological hazard risk source identification, hazard analysis, and vulnerability analysis based on the physical and mechanical characteristics of specific hazards and the dynamic process of hazards. Additionally, on this basis, calculate the risk value and classification of each geological hazard and hidden spot.
In this paper, we build a procedure and method for evaluating the risk of geological hazards in complex mountainous towns with reference to the technical methods and theory of geological hazard evaluation at home and abroad in Longlin Town, which is a typical mountainous town in the Lixian County, Gansu Province. Then, we analyze the potential hazards of typical geological hazards around the Longlin Town area, study the vulnerability of the town area and the surrounding disaster-bearing bodies, and divide the risk areas of geological hazards under different rainfall frequencies. Finally, the proposals for urban geological hazard risk control measures were discussed and used to provide technical support for disaster prevention and mitigation and territorial spatial planning of complex mountainous towns.

2. Materials and Methods

2.1. Overview of the Geological Environment of the Study Area

Longlin Town is located in the south of Lixian County in the West Hanshui basin of Longnan City, Gansu, and with a serious geological hazard. Its river system range includes the first-level watershed that is located on both sides of the West Hanshui River valley and takes mudstone ditch watershed as the boundary. The geographical range of the town area is between 105°02′29.5″ E~105°08′47.4″ E, 33°53′29.7″ N~33°57′50.1″ N and with the area of 38.4 km2. Approximately 11,550 people and 9 administrative villages were in the town area. Because the climate of the town is temperate continental monsoon with a mild and humid climate, the average annual rainfall in the area is 499.4 mm, and the rainfall is concentrated from June to September, often in the form of heavy and continuous rain.
The Longlin Town area is characterized by the complex landscape of medium to high mountains and valleys that is situated in the western part of the West Lishan interrupted basin of the West Qinling Mountains in the Longnan Mountains of China. The slopes of high and steep creating favorable topographic conditions for the occurrence of geological hazards. The study area is located at the eastern Tibetan plateau active block, between the north margin of the West Qinling left-slip fault and the East Kunlun left-slip fault. The main faults in the study area are active fault zone with the NW and NE trending thrust and strike-slip characterized by complex structural styles and intense activity. Longlin Township was shaped by a wedge confined by the Lintan–Tangchang fault, the Lixian–Luojiabao fault, the Feng–Tai fault and the Liangdang–Jiangluo fault [24,25,26]. The stratigraphy in the region is mainly the Middle Devonian West Hanshui Group fifth and sixth lithologic section (D22xh5 and D22xh6) and includes light gray shale and slate with a small amount of chert and siltstone, etc. The rock mass in the study area is broken, weathered highly and weaker competency that is affected by the surrounding active fault. The features of rock mass are collapse and landslide, which includes the black carbonaceous shale and schist fragments with significant rheological properties.
Further, the study area experienced historically strong earthquakes frequently with a VIII degree of regional seismic intensity due to its location in the north-central part of the north–south seismic zone of China. There are as many as 15 earthquakes of Ms 7.0 magnitude or higher recorded in history, among which the 8-magnitude earthquake in Lixian County, Gansu Province, China on 21 July 1654, caused the most intense landslide. Historical earthquakes lead to the formation of geological hazards because of their age in the geotechnical structures and other structures in the area and reduce mechanical strength [26,27].
In conclusion, the study area is a site in the mid-alpine canyon area on the eastern margin of the Tibetan Plateau formed by strong erosion and cutting. The area suffered frequent geological disasters due to active neotectonics movements, complex and fragmented rock structures, and the development of weak rock layers (Figure 1). Further, in recent years, the increasing intensity of human engineering activities also aggravated the occurrence of geological hazards in the area, mainly including land use, road construction, and urbanization.

2.2. Study Data Sources

The main data (Table 1) in this study were obtained from the information listed in Table 1, mainly including ① basic feature information obtained from geological hazard site survey; ② 1:10,000 topographic map data, DEM and 1:200,000 geological map; ③ 1:10,000 land-use type data; ④ 1:10,000 accuracy of physical source feature data; ⑤ Pléiades satellite remote sensing data with 0.5 m accuracy that obtained on 3 May 2016, and UAV mapping data with 0.1 m accuracy obtained on 15 October 2020; ⑥ historical geological hazard rainfall data and 406 meteorological observation data points in the Longnan Mountains in the study area; ⑦ major geological hazard body survey and geotechnical body experimental test data.

3. Methodology

3.1. Town Risk Assessment Process

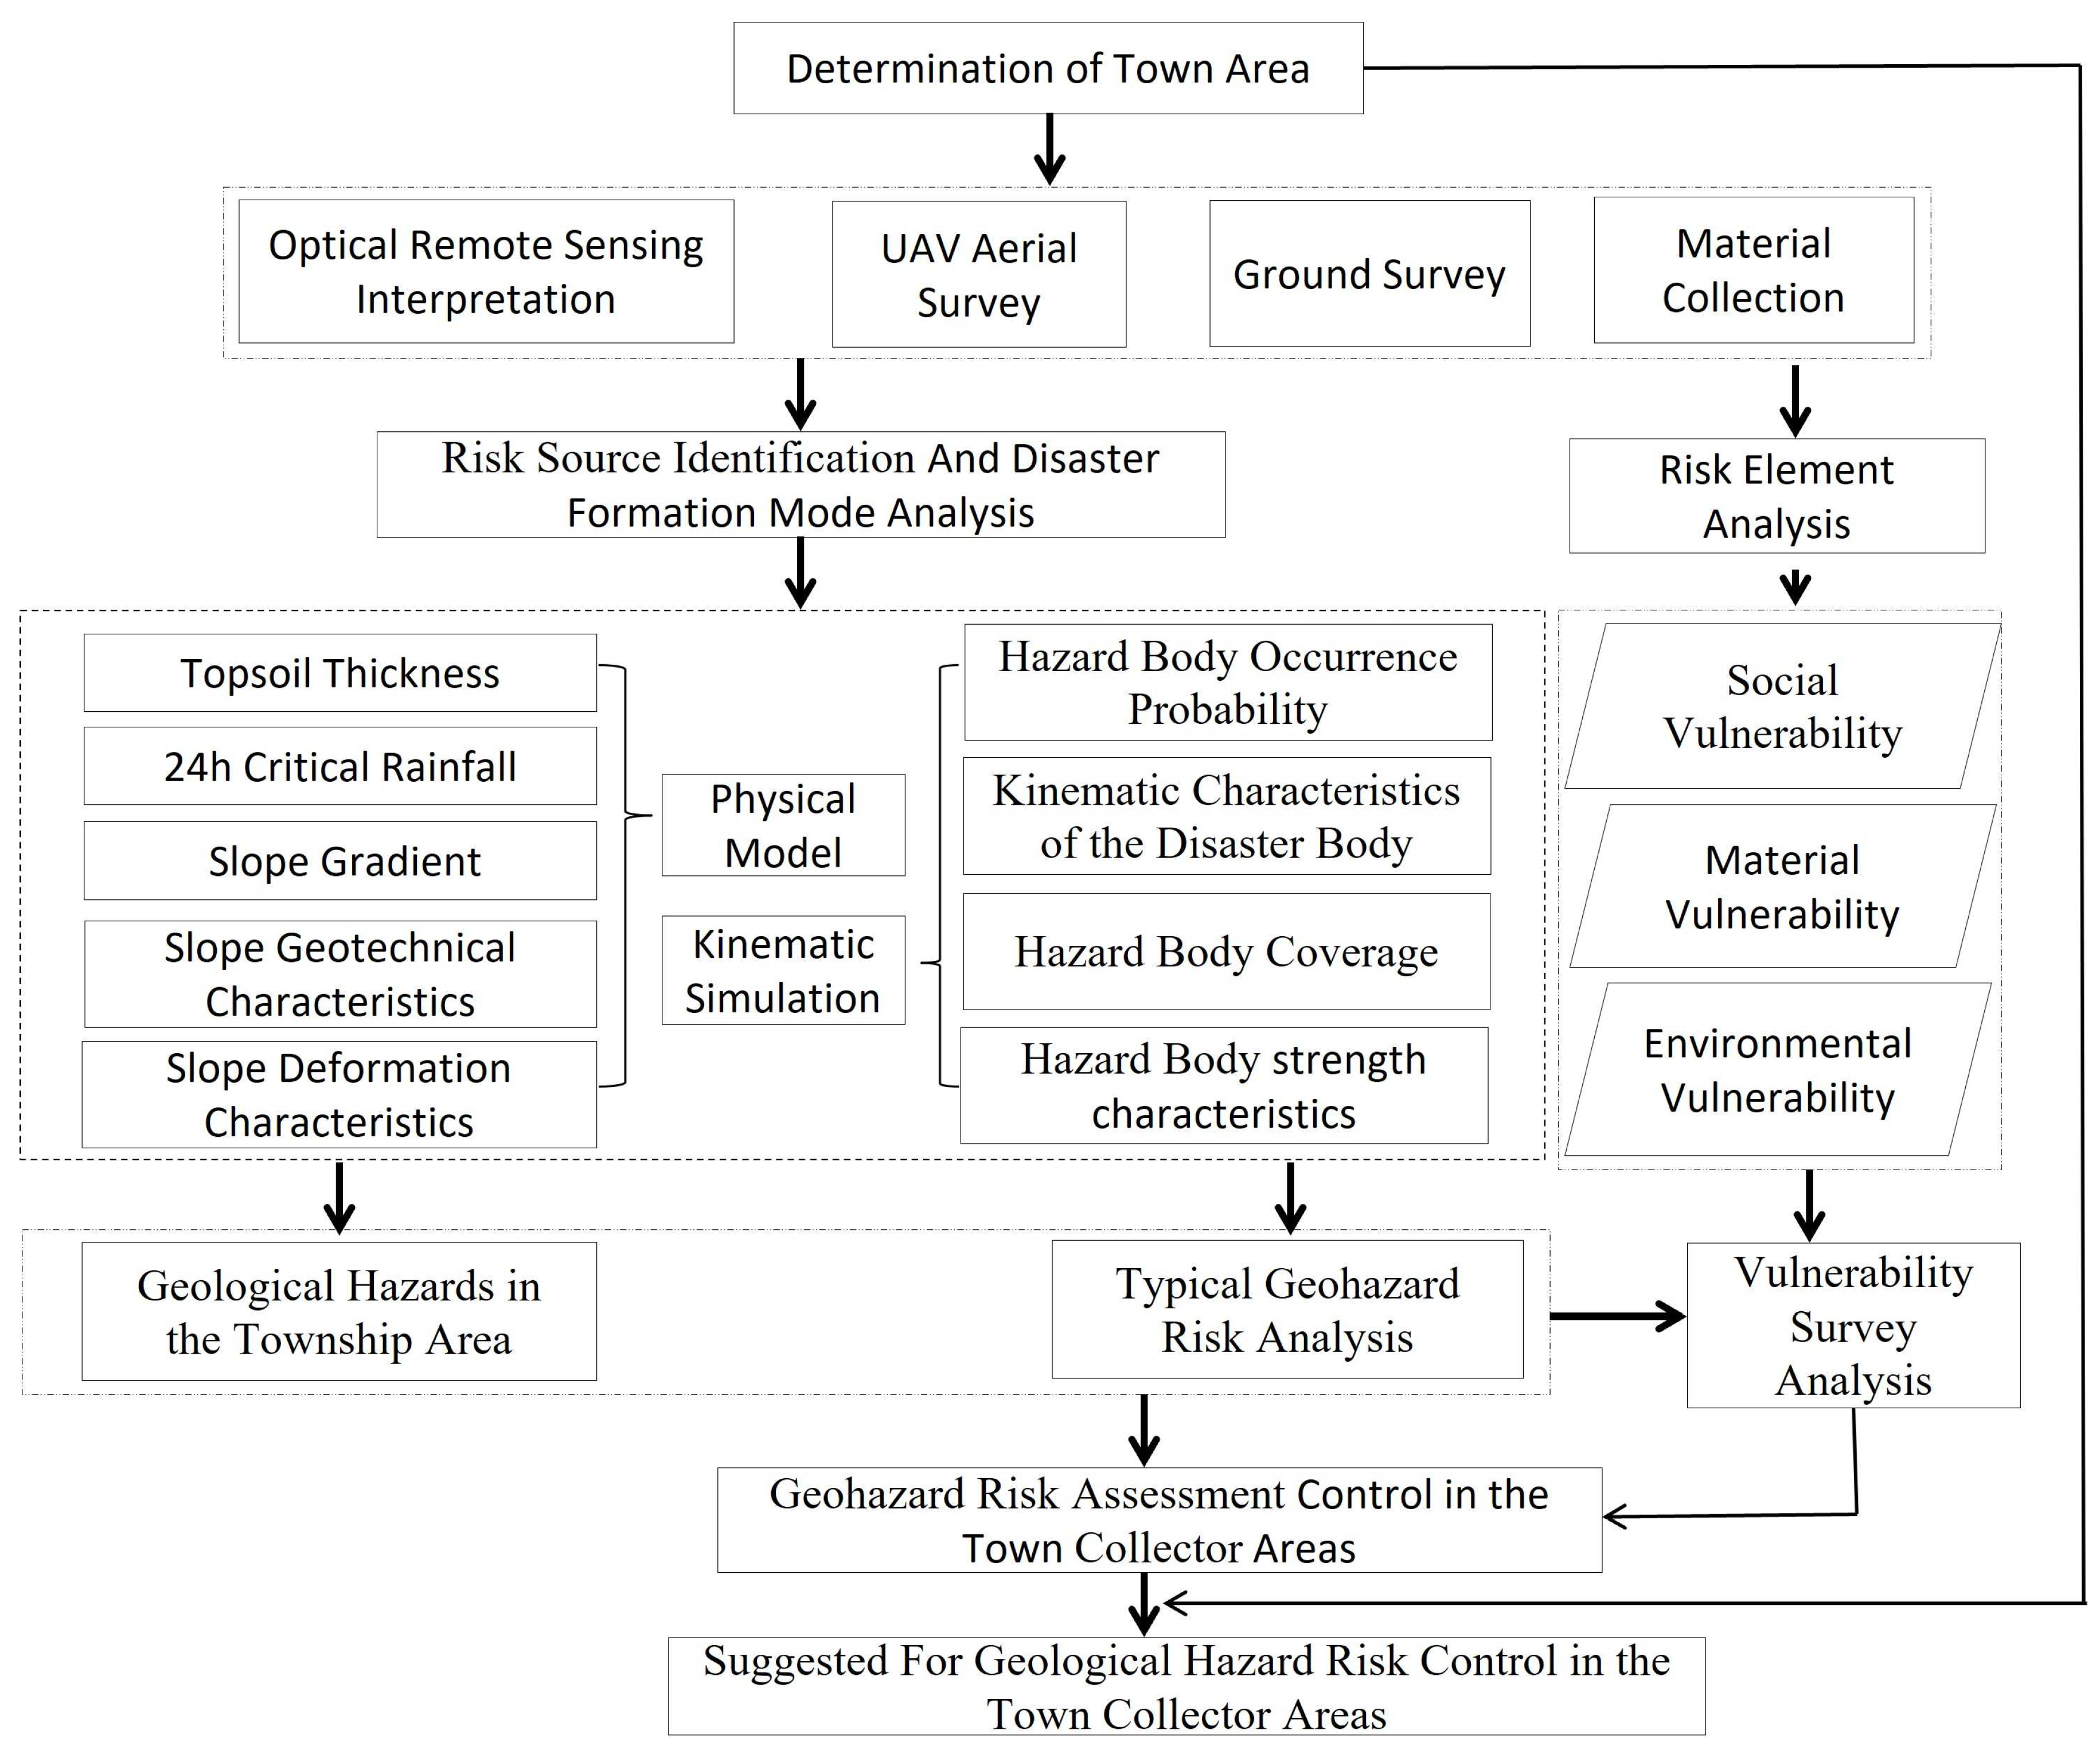
Geohazard risk assessment is a research work that is aimed at a certain area or a typical geohazard body. The urban geohazard risk assessment investigates the threat of geohazard potential and its cascading hazards based on the geohazard data of the urban study area. In this paper, the following steps and methods are used to realize the study of geohazard risk assessment and control for towns in typical middle and high mountain valley areas (Figure 2).
  • Geological hazard risk identification.
Hazard source identification focuses on the r of the parcels within the township that may cause geological hazards, the major geological hazards and the degree of population concentration, the general impact area is within 1~3 km upstream and downstream along the river valley. The content of geohazard risk identification is analyzing the lots that may be destabilized to produce collapse and landslide mainly in the first-level slope zone on both sides of the river valley and the area below the circulation area of each branch gully, and analyzing whether the type of debris flow gully is slope or flash flood type for the mountainous gully. Additionally, we consider the extent of secondary effects after the occurrence of chain geologic hazards under extreme conditions [28].
  • Research on the formation mode of geological hazards.
It is including the analysis of the conditions of geohazard potential disasters and the process of disaster formation, the study of the basic formation conditions, development characteristics, development process and characteristics of geohazards and early detection signs, and establishing geological detection signs and indicators of geohazards of different types and development stages [29,30,31,32]. The study region is a fault-controlled hillslope area, and the large landslides caused by the soft and hard laminated rock groups composed of shallow phyllite rocks such as micro phyllite rocks and schists, debris flow have multiple, multi-level block activities characteristics, and their disaster modes are featured by the chain such as landslide-debris flow or barrier lake. The large debris flow has obvious branch gully grouping to block and collapse step by step, and the flow increases significantly, which is easy to block the river valley to form a chain disaster.
  • Geohazard Risk Analysis.
The overlaid analysis was carried out with the critical rainfall distribution map in the study that was obtained used by the slope hydrology model and the infinite slope stability model and the existing disaster-inducing rainfall data to obtain the spatial distribution of slope stability under different rainfall conditions in 24 h [33,34]. Then, the future development trend of the slope is qualitatively discriminated according to the surface deformation law, which is represented by the slope development rate. Finally, the two are combined for comprehensive analysis to calculate the damage probability of the slope [35,36,37,38,39]. In the first-class slope zone around the township area, the potential hazard degree under different rainfall conditions is predicted and analyzed one by one for landslide/debris flow that may cause disasters. Based on the geological hazard generation model, a reasonable mathematical model of geotechnical movement and fluid-solid coupling movement is used to analyze the geological hazard movement and accumulation characteristics under each condition and predict its hazard range. According to the three-level superposition of slope destabilization, landslide damage and debris flow occurrence, the hazard blocks or strip slope units composed of raster cells in the study area are reasonably delineated and form the geological hazard zoning map of the collector area.
  • Vulnerability assessment of potential disaster-bearing bodies.
The vulnerability analysis of geological hazards is a comprehensive analysis way to the resilience of disaster-bearing bodies, and its degree depends on the sensitivity of disaster-bearing bodies to the effects of geological hazards, which is usually expressed by the value (or number) of disaster-bearing bodies and their vulnerability index [40]. Based on the geological hazard zoning map, it is mainly focused on the potential disaster-bearing bodies exposed to medium or higher-level geological hazards, which includes permanent and temporary buildings exposed to the threat of geological hazards, linear projects such as roads/highways/pipelines, population distribution and age structure, etc., and ecological environment conditions. The comprehensive value of disaster-bearing bodies is obtained by calculating the average unit value of the above-mentioned disaster-bearing bodies and the actual number of disaster-bearing bodies, and then carrying out qualitative or quantitative vulnerability index analysis according to the form of damage by spatial movement of geological hazards and the structural strength of the disaster-bearing bodies themselves, to obtain the vulnerability assessment zoning map of potential disaster-bearing bodies of geological hazards in the study area.
  • Geological hazard risk assessment in the township area.
The probability of occurrence of geological hazards in different risk areas was obtained by using historical geohazard cases and corresponding trigger rainfall record data in the study area. The quantitative and qualitative methods were used to evaluate the risk of geological hazards in urban towns by combined with the degree of risk of geological hazards and the vulnerability of hazard-affected bodies and formed the risk zoning map of geological hazards in the study area.
  • Recommend countermeasures for risk control.
Proposing specific measures such as risk source elimination, risk area reduction, and integrated risk control by a comprehensive consideration of the risk distribution of disaster-bearing bodies in the study area.

3.2. Geohazard Risk Identification and the Disaster Generation Model

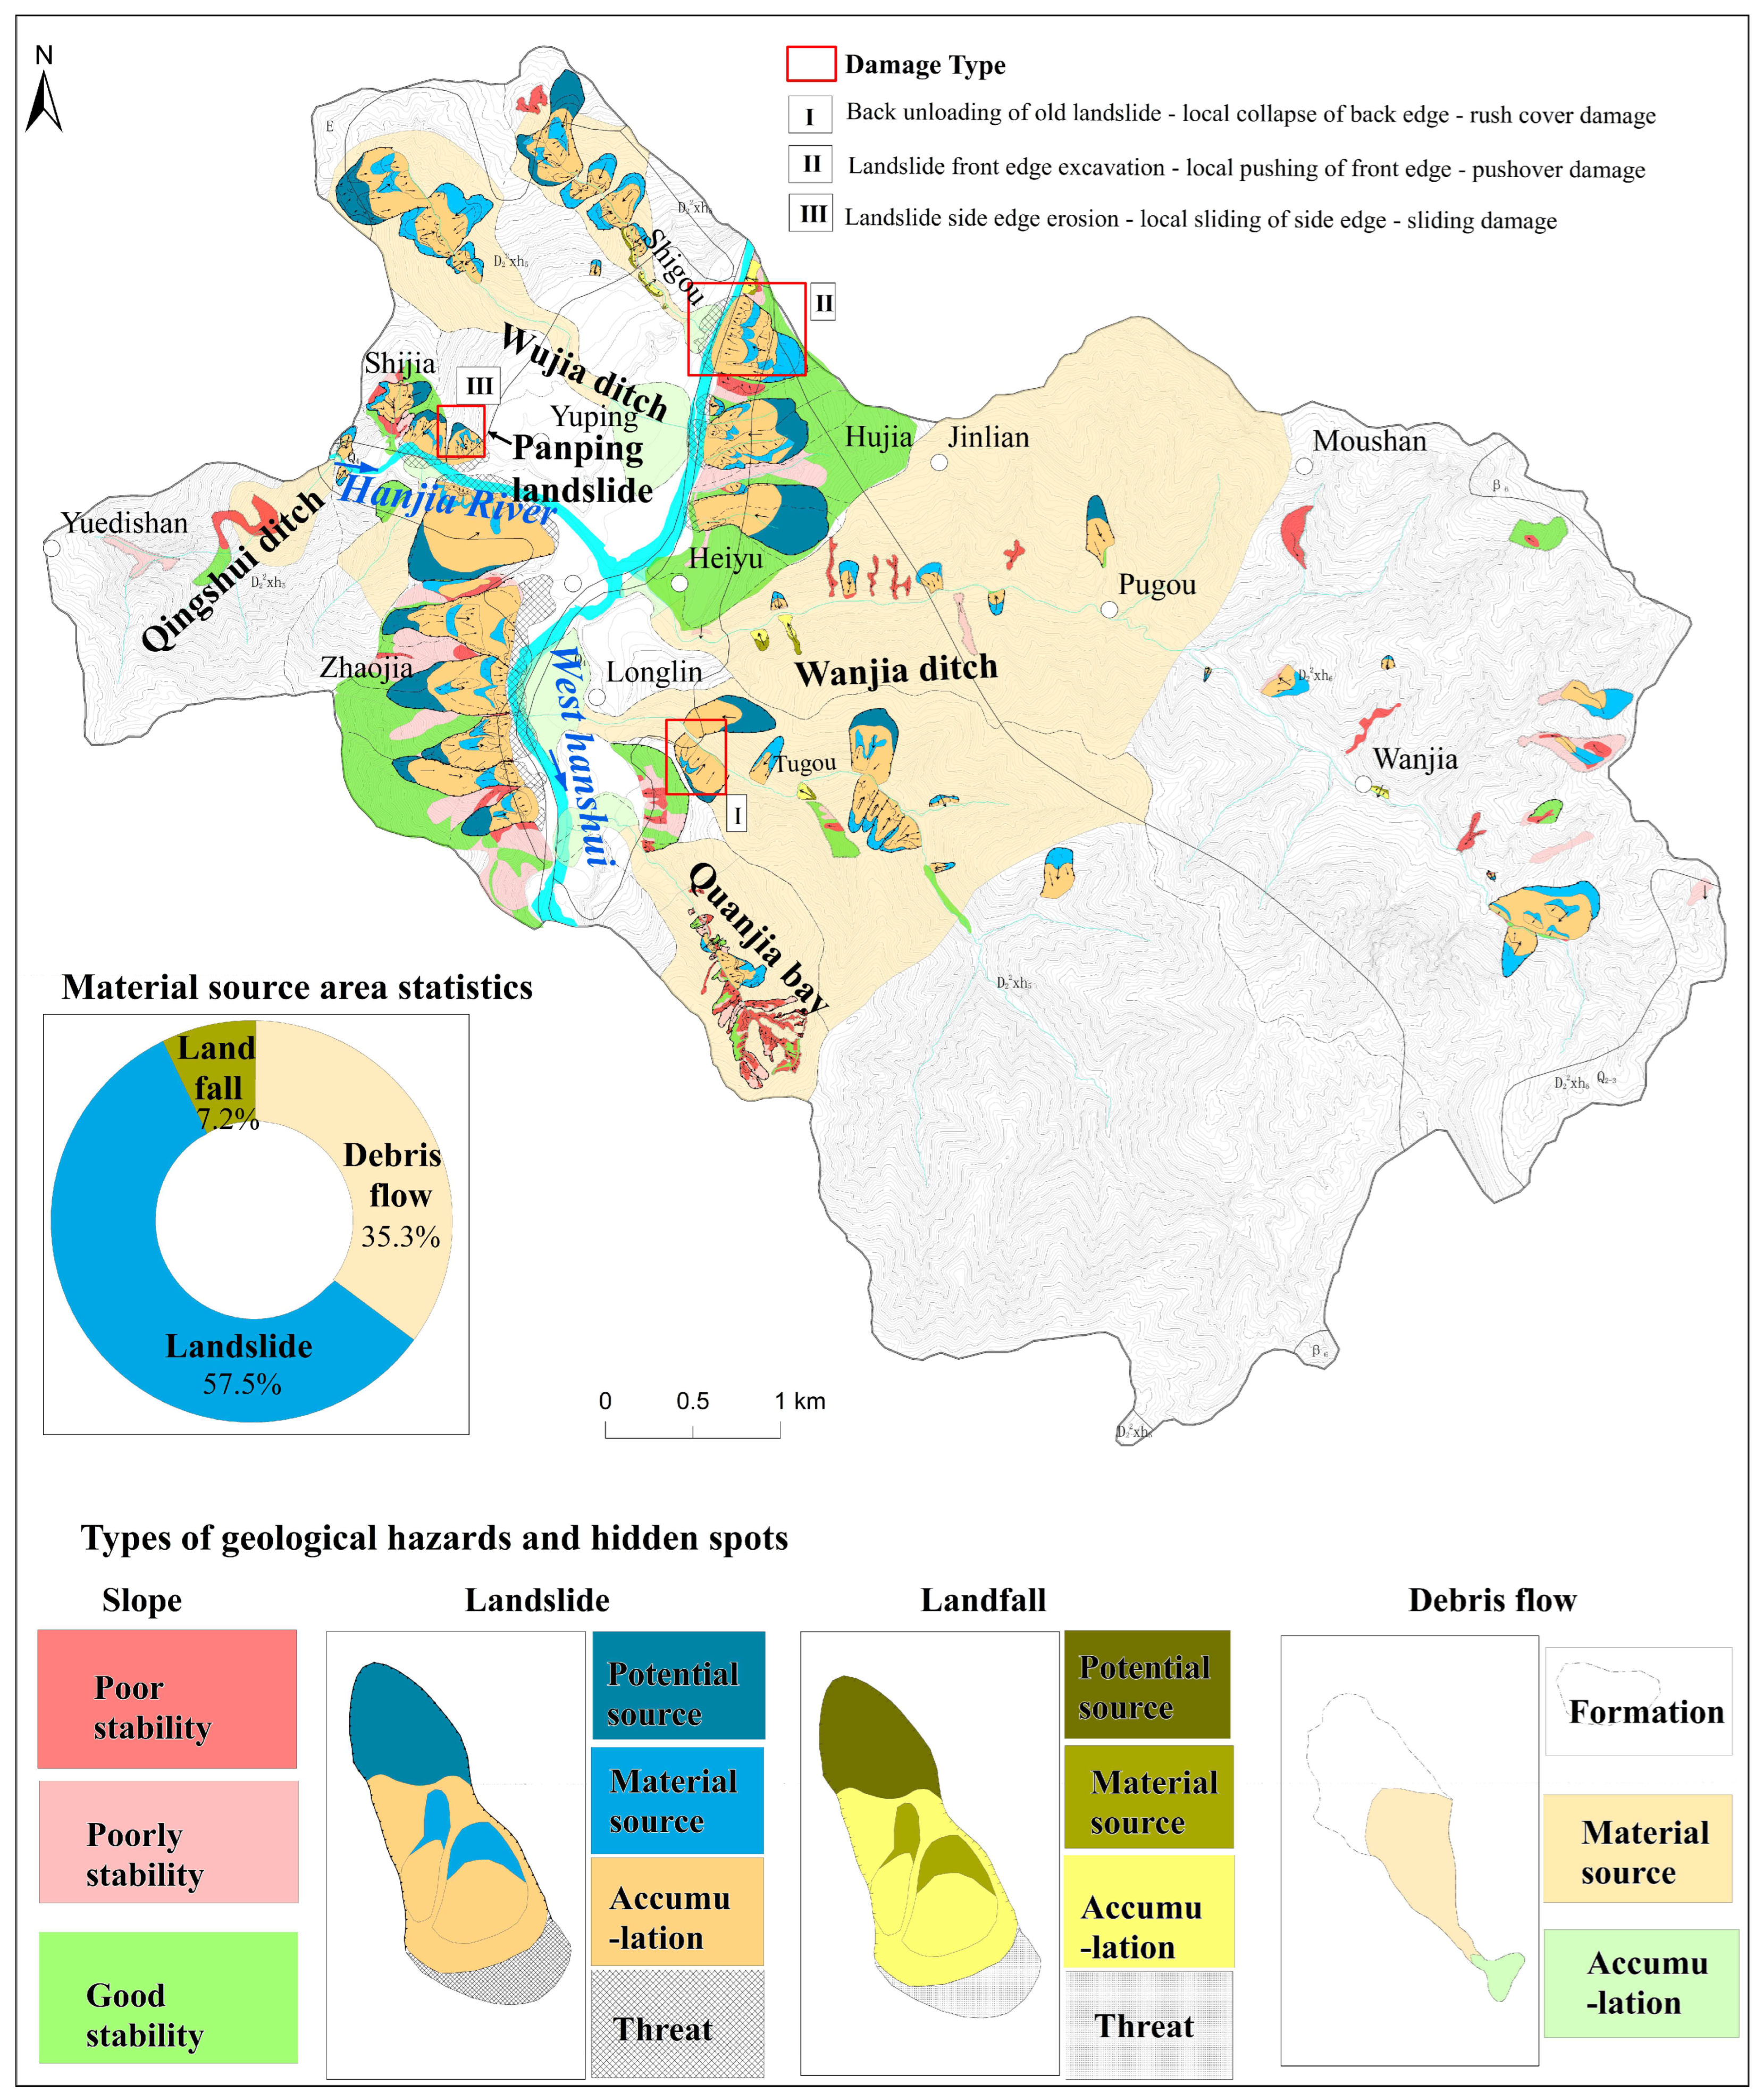
Geological disaster risk identification focuses on the identification of hazard sources such as landslides, landslides and debris flow in the areas that may produce geological disasters in the planning area of the township. For example, we analyze the lots that may be destabilized to produce collapse and landslide in the first-class slope zone on both sides of the river valley and the area below the circulation area of each branch ditch and analyze whether the debris flow valley is a slope type or flash flood valley in the mountainous valley. First, effectively identify the surface deformation according to the spectral and texture change characteristics of multi-period optical remote sensing images, to circle the major hidden hazard and potential geological hazard hidden danger lots combined with the topographic features and census the old landslides that had occurred and the areas with obvious signs of deformation [41,42,43,44,45]. Secondly, forming three-dimensional images in the exposed areas of bedrock such as weathered phyllite rock and shale are most prone to geological hazards such as collapse and landslide using an aerial survey of UAV, so that various features and signs of slope deformation can be visually analyzed, and deformation sections or blocks can be circled in detail [46]. Finally, the identification results obtained by the first two means are supplemented and verified, with emphasis on selecting potential geological hazard sites or typical geological hazard sites with obvious deformation characteristics that pose a threat to people’s lives and property safety and are visually blinded by remote sensing interpretation [47]. After a general, detailed survey and verification, there are 71 geological hazards in the study area, including 4 landslides, 53 rockfalls, 7 gully-type debris flows and 7 slope debris flows (Figure 3). The total area of landslide geological hazards is approximately 3.23 km2, accounting for 8.4% of the total area of the study area, and the density of hazard development is 1.85 places/km2. The total area of provenance area of landslide, landslide and debris flow development is 1.67 km2, and the area of their corresponding provenance areas are 7.2%, 57.5% and 35.3%, respectively.
Landslide is one of the most widely distributed types of geological hazards in the study area, the amount is accounting for 74.6% of the total number of hazard sites in the study area. It is densely distributed on both sides of West Hanshui and Hanjia Rivers and on the slopes of both sides of each branch ditch, mostly developed in the loose accumulation of the Quaternary sediments, Devonian carbonaceous shale, micaceous rocks and tuffs with soft and hard intervals, and easily sliding engineering rock groups. It is concluded that the large-scale landslides in the study area are ancient landslides formed under the movement of earthquake or tectonic activities with a total of 13 landslides developed by combined with the UAV images, field survey and literature. Some other small and medium-sized landslides are developed on older landslide accumulations and are characterized by the multi-period sliding that is mostly under the influence of rainfall, human engineering activities, or river erosion.
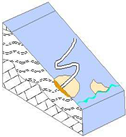
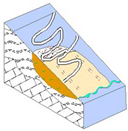
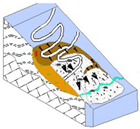
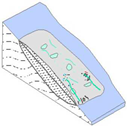
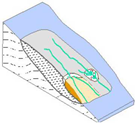
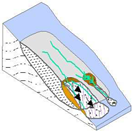
The disaster mode is follows 3 types: Type I, the old landslide back wall unloading effect produces small avalanches and slides under the collapse, the slide body forward movement, the formation of rush cover damage. Type II, the landslide in the front edge of the excavation and erosion, the leading edge of the front body forward movement, the formation of pushover damage. Type III, the side edge of the landslide under the erosion of the cutting gully, the side edge of the local sliding to form the secondary landslides, the formation of further sliding damage.
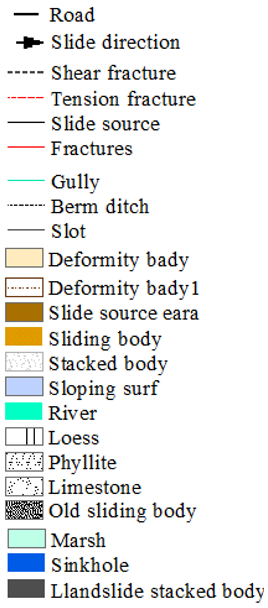
The basic formation conditions, development characteristics, development and evolution processes and characteristics, and early identification marks of the three types of landslides were further analyzed and studied. Finally, an intuitive map of the geological identification marks of landslides with different disaster formation modes was constructed, and geological identification marks and indicators of landslides corresponding to different types and development stages were established (Table 2).
The amount of debris flow is account for 19.7% of the total number of hazards in the study area. The overall gully debris flow is shaped narrow, and the source, circulation and accumulation area are relatively complete. The source area is mostly developed with small and medium-sized avalanche slides and other sources, with obvious signs of local blockage of the gully; the circulation area has clear traces of erosion and scouring by flowing water; the accumulation area has obvious fan-shaped land. Slope debris flow is mostly developed in the slope triangle area with the deep channel. The sources are mostly developed in the middle and lower reaches of the watershed and are small avalanche slides, the slope gradient of the gully bed is large, and the fan shape of the accumulation area is not obvious. The main disaster mode includes 2 types, the gully uncovered bottom-siltation type damage and slope runoff erosion slip type—diffuse flow type damage.
The number of collapses is relatively small, accounting for 5.7% of the total number of disasters. They mostly occur in the steeper slope areas on both sides of river gullies and highways, and the slope structure is mainly bedrock and loess-soft rock slopes with good prominence, developed structural surface, and unclear texture.

3.3. Town Risk Assessment Methods and Models

3.3.1. The Slope Stability Evaluation Model

The infinite slope model proposed by Skempton and Delory [48] is to consider the response of rainfall erosion slope surface, infiltration slope body and geotechnical properties to the slope under different rainfall frequencies, which can achieve quantitative stability evaluation of the slope. Montgomery et al. [49] combined it with the slope hydrology model to obtain a critical rainfall calculation formula for shallow landslide initiation. The slope instability in the study area is mainly influenced by rainfall, and the depth of the landslide is much smaller than the width and length of the slope. Therefore, according to the limiting equilibrium theory, the slope stability coefficient within each raster cell is Fs:
F s = c + ( ρ s g D ρ w g h ) c o s θ t a n φ ρ s g D s i n θ
where c′ is the effective cohesion of the slope (kPa). φ′ is the effective angle of internal friction of the slope (°). ρs is the natural weight of the geotechnical body (kg/m3). t is the potential slip thickness (m). θ is the slope inclination (°). h is the slope groundwater level (m). ρw is the weight of water (kg/m3).
Under certain rainfall intensity conditions, the water table height in the slope. h is:
h = I A T b s i n θ
where I is the equivalent rainfall intensity (m/d). A is the watershed area (m2). T is the hydraulic conductivity of the saturated soil (m2/d). b is the width of the considered water flow cross-section (grid accuracy) (m).
Combining Equation (1) with Equation (2), such that Fs = 1, the critical rainfall for rainfall-induced slope initiation can be obtained as
I c = T b A s i n θ   ρ s ρ w · 1 t a n θ t a n φ + c ρ w g D c o s θ t a n φ

3.3.2. The FLO-2D Fluid Model

Most of the debris flow hazards in the study area are rainfall controlled in nature, and few of the debris flow gullies have been subjected to engineering control measures. Therefore, this paper simulates the future debris flow hazard in the study area based on the FLO-2D model [50,51]. The FLO-2D model was proposed by O’Brien [52] in the early 1990s based on a non-Newtonian fluid model and a finite difference method to solve the motion control procedure, which can be used for two-dimensional flood hazard management and debris flow motion. In the FLO-2D model, the debris flow control equation is
h t + ( u h ) x + ( v h ) y = I
( S o x S f x ) g = h x g + u ( u h ) x + v ( u h ) y + u t
( S o y S f y ) g = h y g + u ( v h ) x + v ( v h ) y + v t
where t is the evolution time (s), h is the depth (m), I is the rainfall intensity (mm/h), u is the velocity in the x-direction (m/s), and v is the velocity in the y-direction (m/s), Sox and Soy are the streambed slope drops in the x-direction and y-direction (%), Sfx and Sfy are the frictional slope drops in the x-direction and y-direction (%). FLO-2D provides dynamic wave mode and diffusion seeding mode to simulate the process of movement and accumulation. Equation (2) is the continuity equation, which is the volume mass conservation equation. Equations (5) and (6) are the equations of motion of the force balance. In this model, the expression of the shear stress gradient of the fluid:
S f = S y + S v + S t d = τ y γ m h + K η u 8 γ m h 2 + n 2 u 2 h 4 / 3
where Sf is frictional decline (%), Sy is yield decline (%), Sv is viscous decline (%), Std is turbulent-dispersion decline (%), τy is yield stress (MPa), γm is specific gravity of fluid (t/m3), K is laminar drag coefficient, η is fluid viscosity coefficient, n is Manning coefficient, and v is flow velocity (m/s). The parameters τ y and η are calculated from the equation η = α 1 e β 1 C v and τ y = α 2 e β 2 C v , α 1 , α 2 , β 1  and β 2 are set by rheological tests or table setting.

3.3.3. The River-Flow 2D Rheological Model

The landslides in the study area mostly developed on the slopes of loose accumulations that were composed of weak and shallow metamorphic phyllite and slate zone. The damage process is usually discontinuous, which is characterized by the high concentration of non-Newtonian fluid. The River-Flow2D [15] numerical model is a multidimensional simulation software that adopts a finite volume method to integrate hydrodynamic and hydrologic elastic mesh [53,54]. In the process of landslide simulation, it mainly considers the change in frictional resistance on the bottom surface of the debris body. It can realize the two-dimensional or three-dimensional simulation and display the accumulation characteristics of landslide-clastic flow movement (slip velocity, slip distance and accumulation body thickness).
Different sliding friction calculation models are given in the River-Flow 2D numerical model calculation process for different properties of the sliding material, which can simulate the landslide motion process reasonably and determine the stress boundary conditions accurately. It mainly includes the Bingham model [55,56], the Voellmy model [57,58], and the friction flow model [59]. Among them, Bingham is a friction resistance model considering the plasticity and viscosity of the slide, when the starts to flow after reaching the critical value of shear stress, and its bottom friction value is calculated as Equation (8). Additionally, the formula of the Vowelly flow model mainly includes the turbulence term and frictional resistance term, and the formula is Equation (9). The frictional flow is calculated as Equation (10).
v = h 6 η ( 2 τ 3 τ + τ 3 τ 2 )
τ = γ h c o s α + a c g t a n ϕ + γ v i 2 ξ
τ = γ h c o s α + a c g ( 1 r u ) t a n ϕ
where η is the Bingham viscosity coefficient. v is the slip velocity (m/s); according to the Cullen viscosity theory, τ′ can be expressed by the positive slip surface stress. γ is the slip body capacity (kg/m3). a is the slip surface inclination angle (°). ϕ is the internal friction angle (°). ac = vi2/R is the centrifugal acceleration of the curved slip surface. ru is the cavity pressure coefficient, the ratio of the cavity pressure to the normal stress at the bottom of the calculation unit. ξ is the turbulence coefficient (m2/s).
During the River-Flow 2D simulation, when the slide stress is gradually dispersed near the slide bed and there is a turbulence effect, the frictional resistance characteristics mainly depend on the shear stress change in the slide, and viscous stress, yield stress, dispersion stress, and inelastic collision of solid particles in the debris-fluid soil and rock mixture, etc. The standard Bingham frictional resistance model is
f 1 τ 0 , τ 1 = 2 τ b 3 3 τ y + 2 τ μ τ b 2 + τ y 3 = 0
where τb is the slip stress (MPa), τb = gρhcosθtanθb, τy is the yield stress (MPa), τy = 0.181 ∙ exp(25.7CV)/10 is the yield stress (MPa), τu is the viscous stress (MPa), τu = 0.036 ∙ exp(22.1CV)/10. ρ = ρw (1 + 1.65CV) and θ is the slope of the landslide (°). θb is the internal friction angle of the landslide (°), and ρ is the fluid density of the landslide debris (kg/m3). ρw is the water weight (kg/m3). CV is the volume concentration.
According to the above evaluation model and method, this paper further elaborates on the technical framework and related technical means for geological hazard risk evaluation and control in complex mountainous towns in the typical relocation and resettlement area of the Longnan mountainous area, Longlin Town collector town. The results show that there are many potential major geological hazards in the first-class slope zone on both sides of the river valley in the planning area of the townships. We select a typical landslide and debris flow for demonstration by the FLO-2D model and River-Flow 2D because the multiple major geological hazards and the calculation and analysis process is similar to the single body. In the other areas of the township area, the 5 m × 5 m resolution raster cells are used as the basic evaluation units of geological hazards for geological hazard evaluation and risk analysis by selecting the slope stability evaluation model.

4. Model Validation and Results

4.1. Model Validation

Geological hazard risk assessment is based on the analysis of geological conditions and triggering factors of geological hazards, and analyzes the time probability and movement accumulation characteristics of geological hazards occurrence, and its core content is to determine the probability of destabilization and coverage of geological hazard bodies under different working conditions [60,61,62,63]. The types of geological hazards in the study area are mainly landslides and hazards, and geological hazards have rainfall-controlled characteristics, so a comprehensive evaluation of the hazard of different rainfall conditions is mainly conducted for slopes and major geological hazard bodies in the catchment area. Finally, the hazard levels are divided into four levels: very high, high, middle, and low.

4.1.1. Town Slope Hazard Analysis

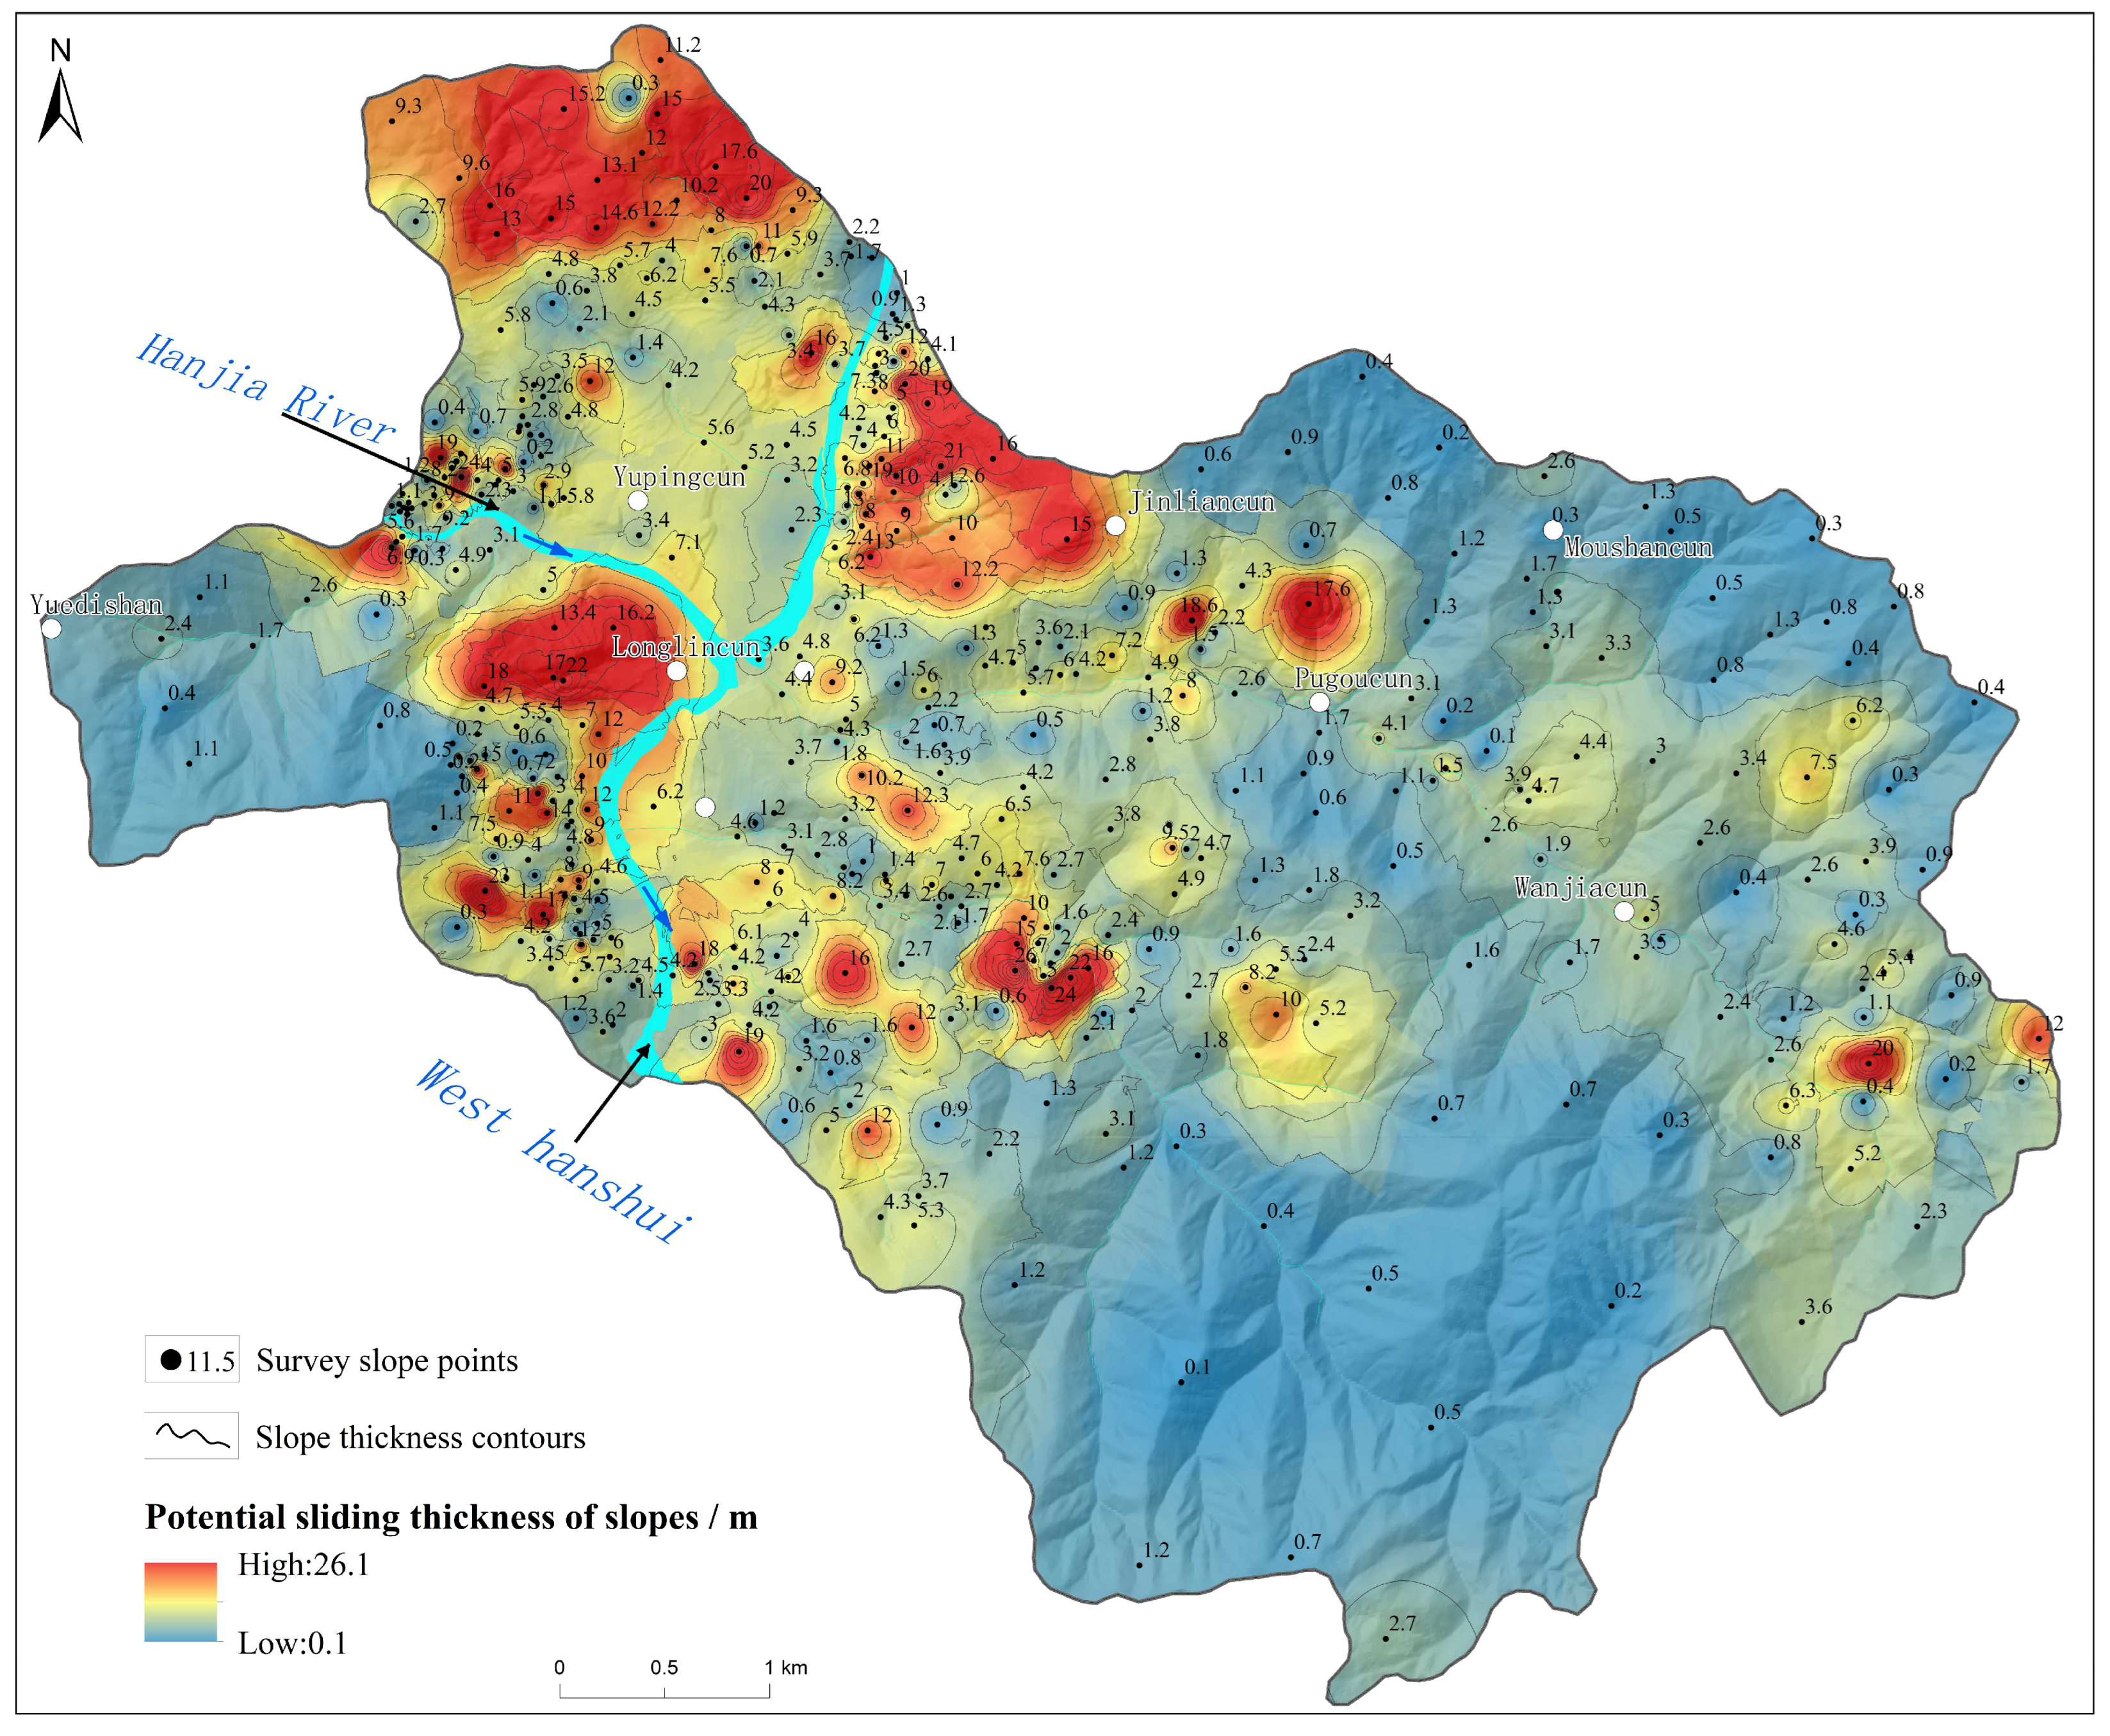
The slope structure in the study area is mostly a laminar slope structure characterized by loose accumulation layer slope and overlying loess or residual slope accumulation rubble layer with underlying highly weathered soft bedrock, which can meet the assumptions of the infinite slope model, and the catchment area is generally small. The required physical and mechanical indices of the geotechnical body are easy to obtain and can meet the requirements of the model calculation. Firstly, the survey and investigation data of the slopes in the study area show that most of the landslide damage modes are multi-phase shallow sliding, while the thickness of the overlying gravel soil layer of the slope (such as poor stability and good stability in the slope unit) is investigated and counted. The total number of slope thickness points in this investigation is 463, the maximum overburden thickness was 26.1 m, and the minimum overburden thickness is 0.1 m. Based on these data, ArcGIS spatial analysis is used to interpolate the slope thickness and obtain the distribution of potential slope slip thickness (Figure 4). Secondly, according to the series of spatial layers such as stratigraphic structure type, material composition, and fragmentation degree from the slope refinement survey, the study area distinguishes six types of slope structure types including loose accumulation layer, loess-soft rock, loess, soft rock, soft rock-hard rock and hard rock. Based on the field survey and investigation data, the geotechnical samples of various slopes were analyzed to determine the basic physical and mechanical parameters such as effective cohesion, effective internal friction angle, natural weight of the geotechnical body, and hydraulic conductivity of saturated soil body. The slopes in the study area were rasterized into a 5 m × 5 m grid, and then the critical rainfall for each grid in the study area was obtained according to Equation (3). According to the field survey and collected historical data, the geological hazard outbreak in Longnan Mountains usually reaches 20~50 mm in 24 h rainfall, and when the 24 h continuous rainfall is more than 100 mm, it often induces a cluster geological hazard of uneven scale. The maximum 24 h rainfall ever occurred in the study area is 116.3 mm, combined with the rainfall intensity classification standard promulgated by the National Meteorological Bureau, the three 24 h rainfall amounts set under different rainfall conditions, 20-year, 50-year, and 100-year scenarios, are 25, 50 and 100 mm, respectively. With the critical rainfall distribution map, the overlay analysis is carried out under the ArcGIS platform, which would obtain the spatial distribution maps of slope stability under different rainfall conditions.
However, the slope stability calculation only represents the existence of a possible internal state and is only a quantitative evaluation of the stability state at different stages, but cannot represent the future development trend of the slope. The slope deformation and damage characteristics, i.e., slope development rate, is an assessment of the future slope development trend based on the surface deformation law [64]. Therefore, the individual slope damage analysis should combine the stability calculation results with the development rate judgment, and comprehensively judge the possibility of future development trend of the slope, i.e., the slope damage probability. The slope damage probability calculation method not only includes the slope stability calculation results but also considers the macroscopic deformation development state of the slope surface, combining microscopic analysis and macroscopic judgment, which can reflect the landslide damage situation more accurately. Its characteristic is to determine the development trend of slope damage in a targeted way based on the realism of slope surface deformation. Thus, it avoids focusing only on the artificial random adjustment of physical and mechanical parameters of slopes and ignores the damage probability calculation results of slope surface deformation.
Finally, according to the slope damage probability evaluation reference Table 3, the slope stability under different rainfall conditions is categorized into four levels, which are superimposed with the resulting map of landslide development rate grading to obtain the hazard zoning map of slopes in the catchment area under different rainfall conditions.

4.1.2. Typical Evaluation Demonstration

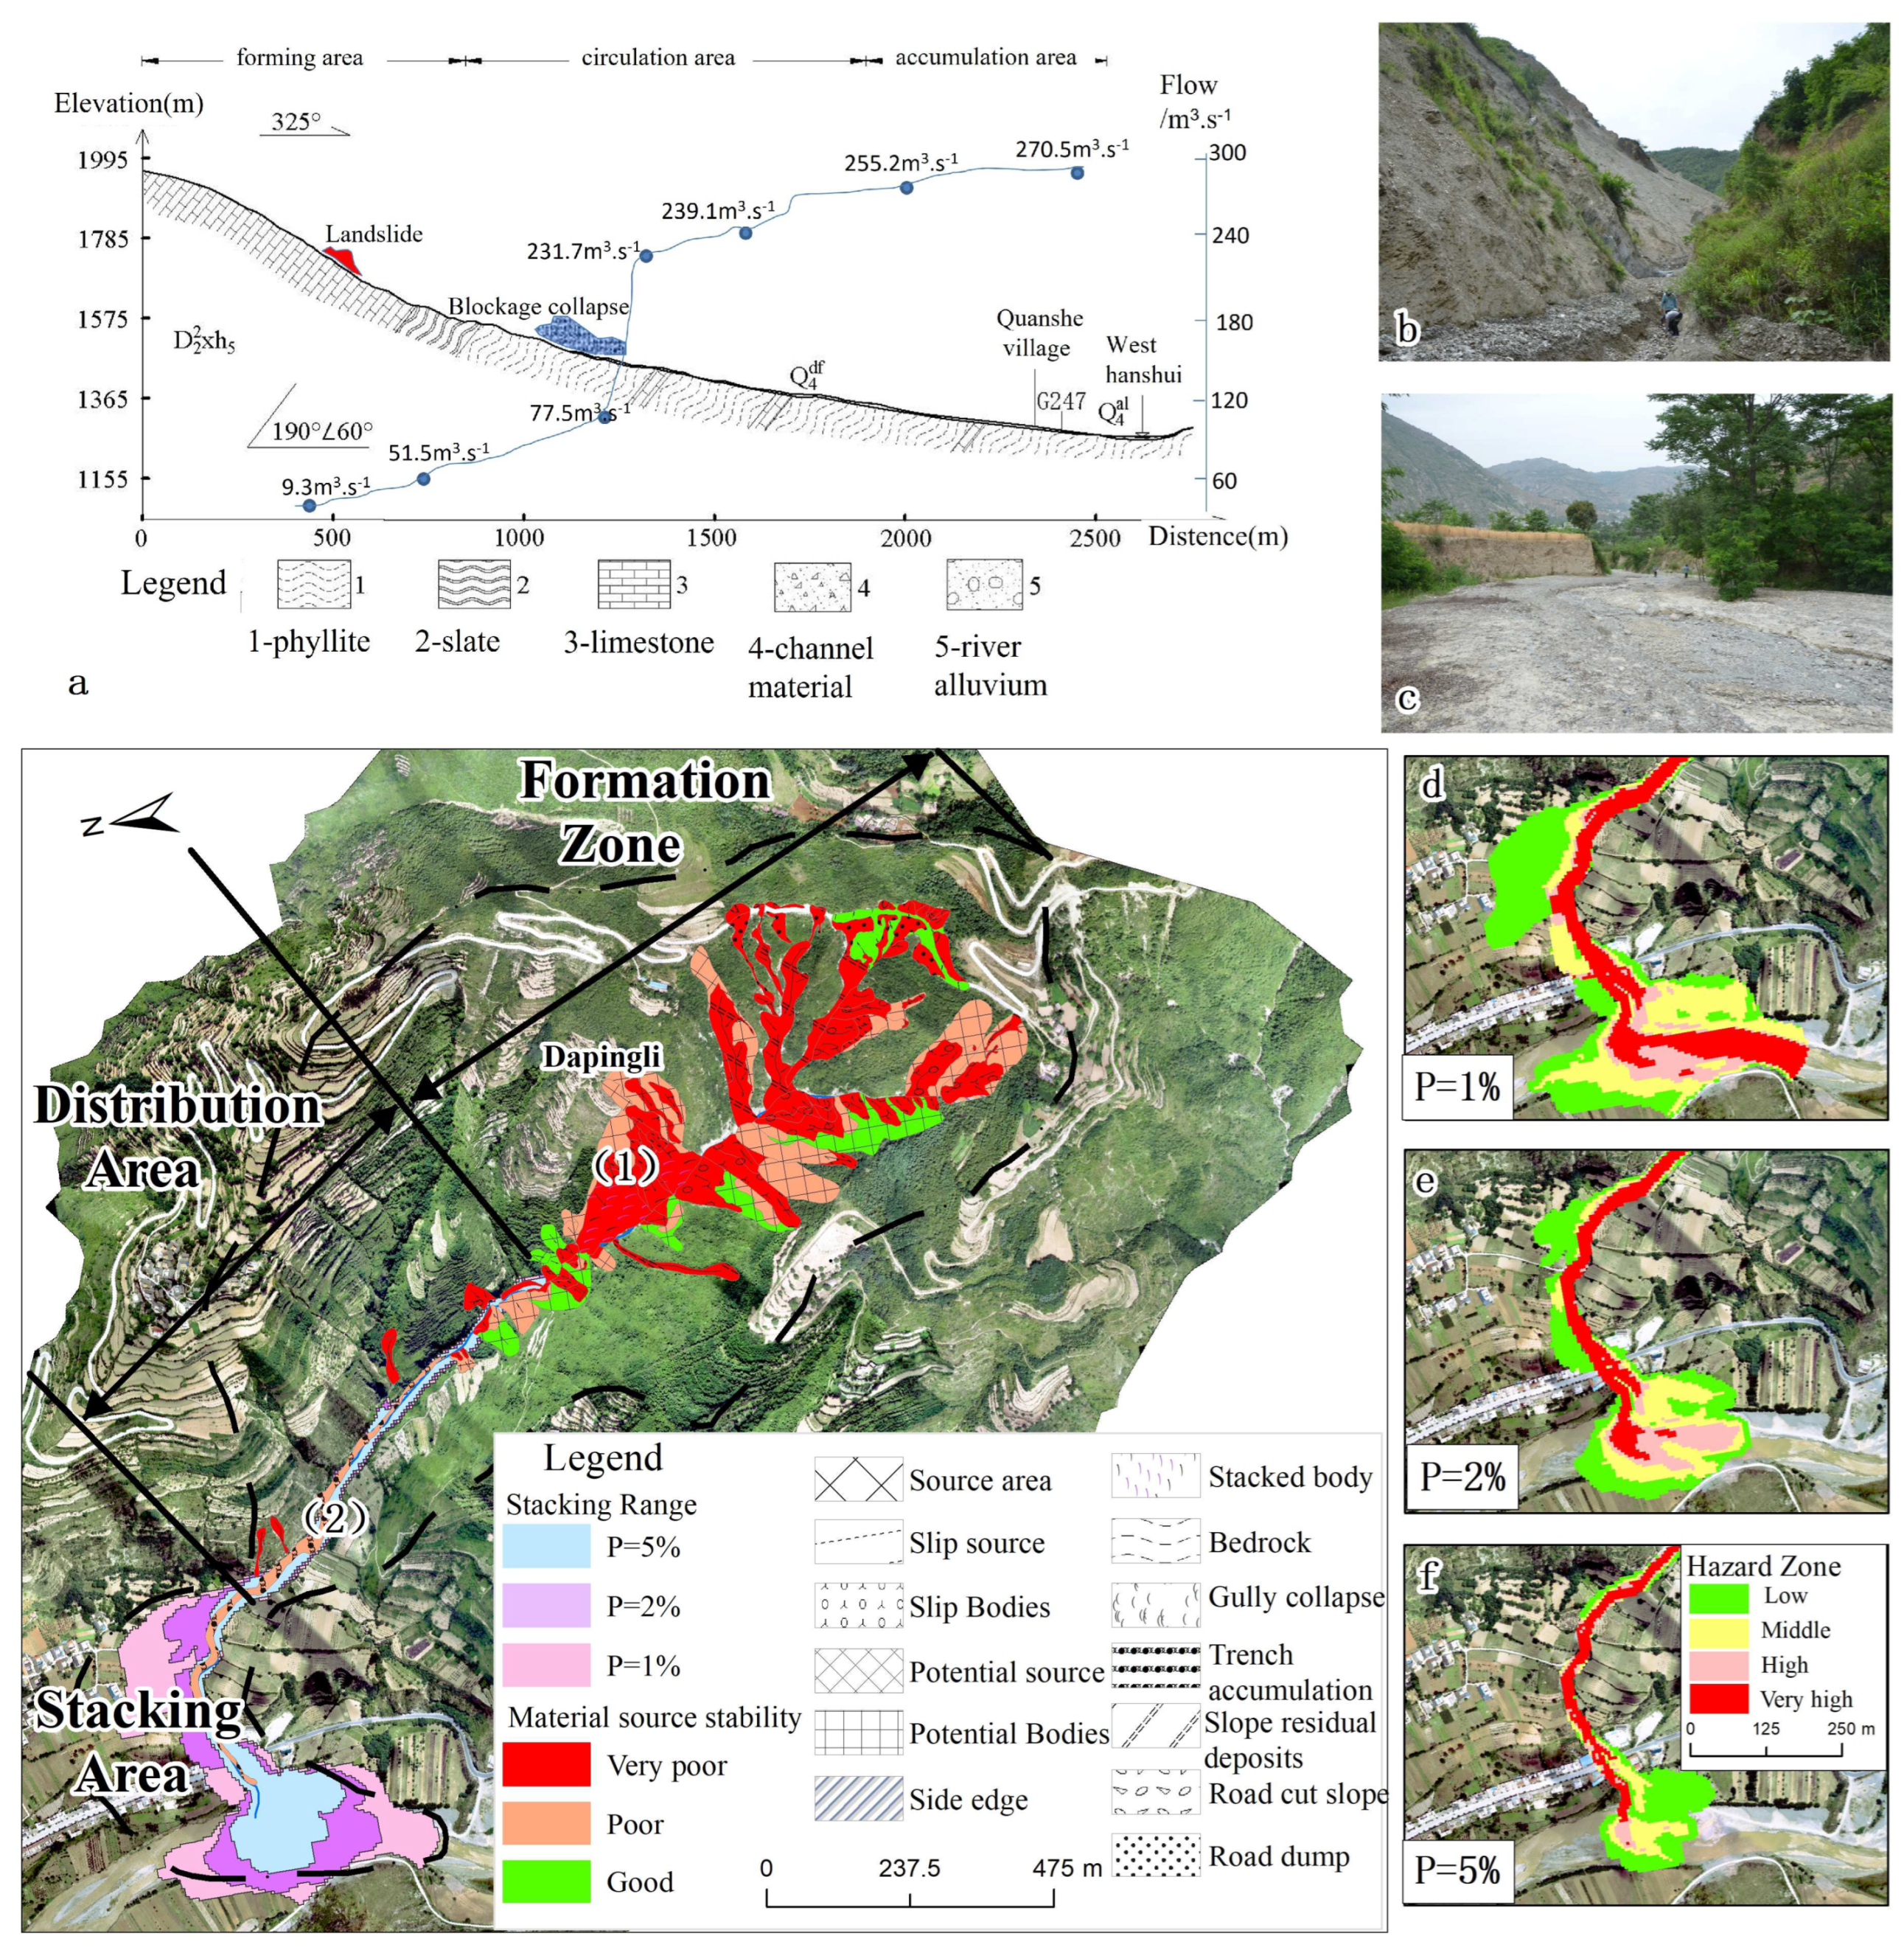
Quanjia Bay debris flow is located in the Longlin Town Quandu village group, West Hanshui left bank, its watershed area is 1.26 km2, the relative height difference in the area is 693 m, the main channel length is 2.53 km, the average longitudinal ratio drop of the ditch bed is 273.9‰, and the total amount of loose solids source in the watershed reaches 242.38 × 10⁴ m3. The field investigation data show that the debris flow dynamic process is: soft and hard lithology combination of medium and shallow landslide start → blockage body instantaneous collapse flow amplification → along the course of channel erosion → more intense bend wash silt → stop silt accumulation or blockage of the river, is a typical collapse—channel erosion mixed debris flow. In the process of movement, the flow is immediately amplified 3~10 fold after experiencing the blockage and collapse of loose accumulation source or coarse and large particle source, forming a super large-scale mudflow.
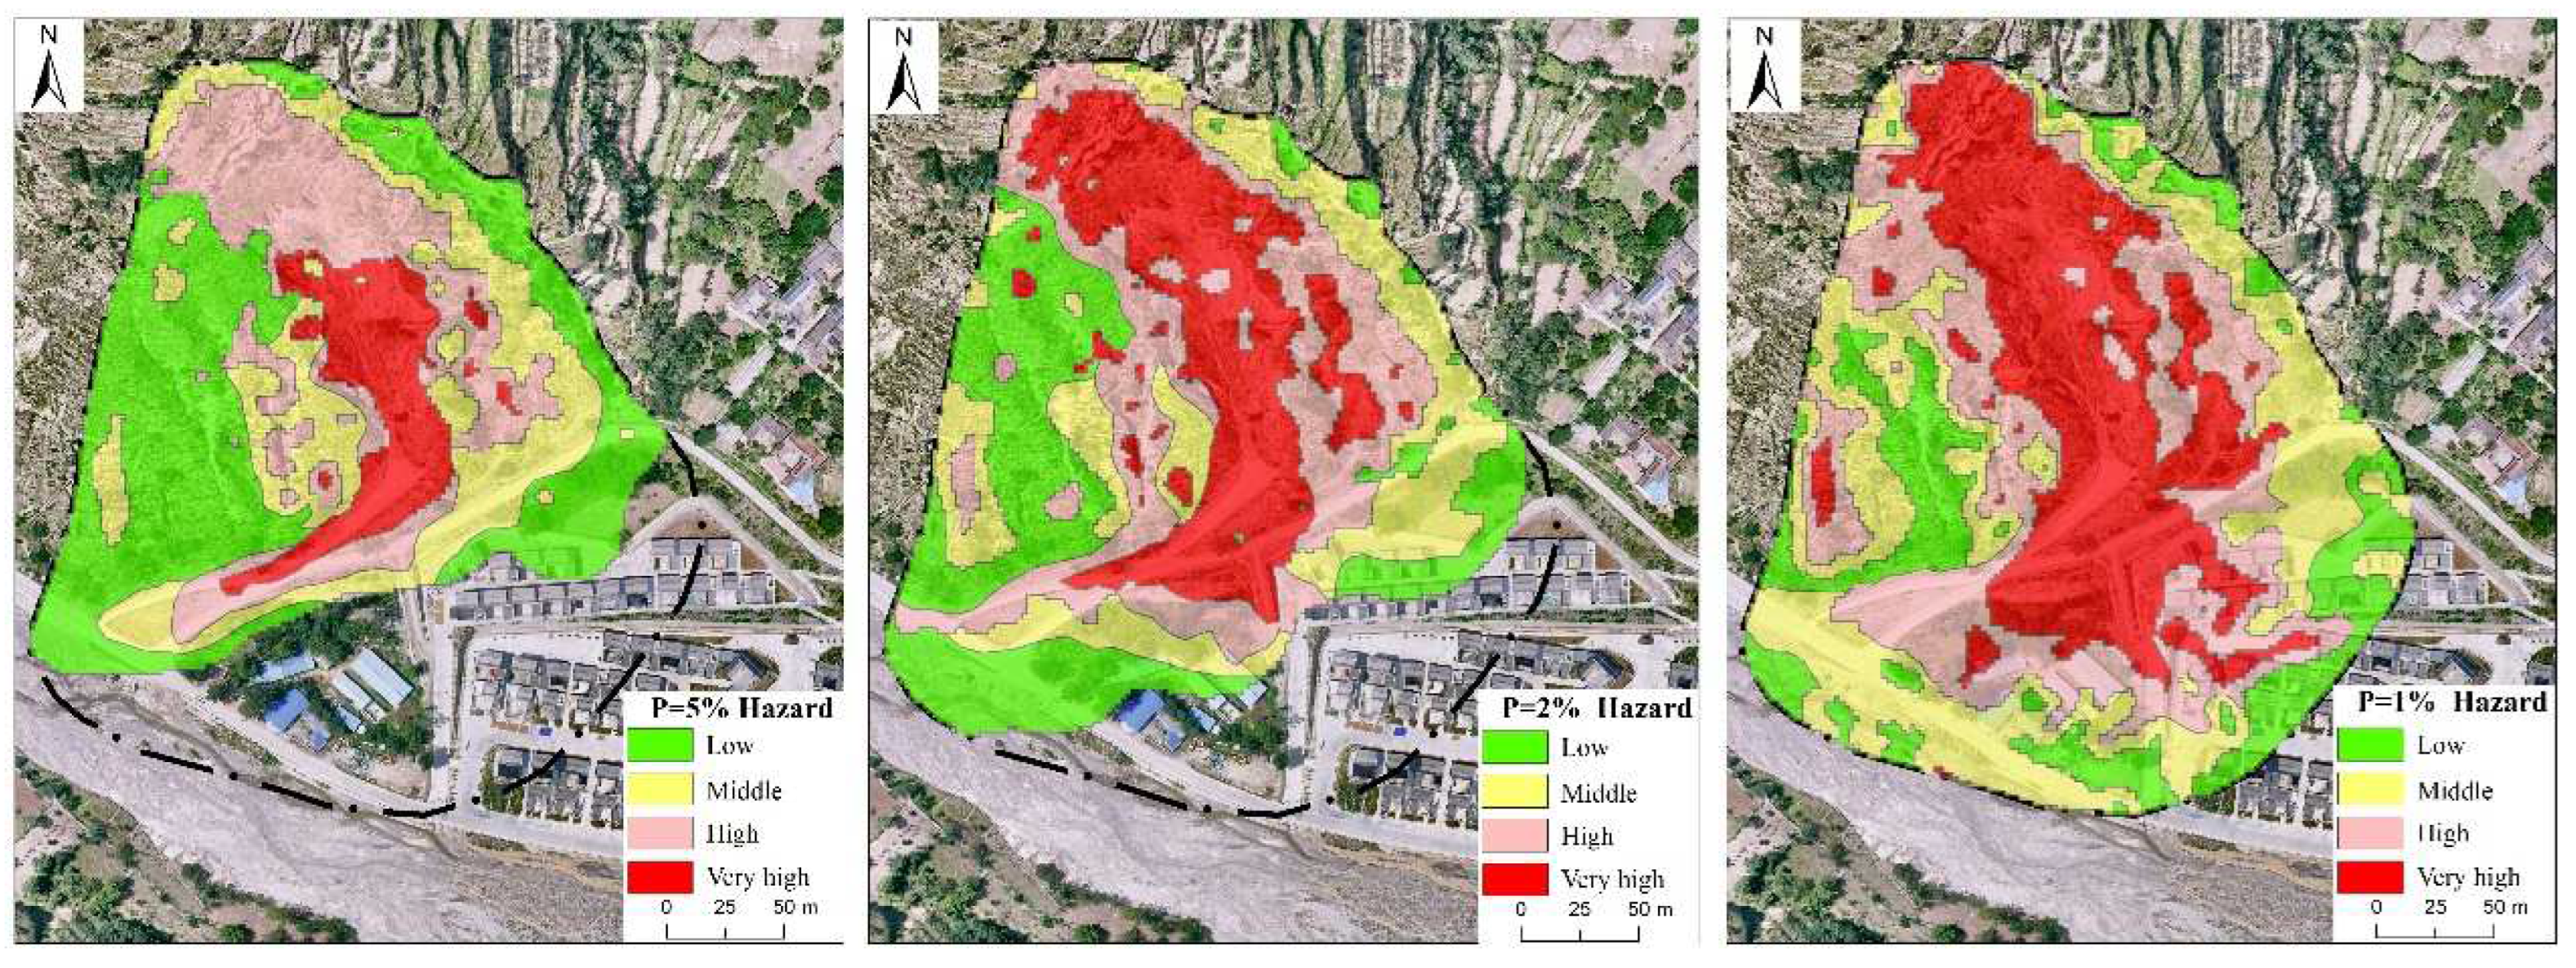
The debris flow in Quanjia Bay is a rainfall type debris flow gully, and without engineering control, measures are taken. Therefore, this paper mainly deals with the simulation of the debris flow movement characteristics of the debris flow in Quanjia Bay under 100-year (1% frequency), 50-year (2% frequency) and 20-year (5% frequency) rainfall conditions based on the FLO-2D model under rainfall conditions. The characteristic values of its movement were quantitatively obtained, and the spatial distribution of the intensity values of the mud level depth and flow velocity of the debris flow in each raster cell is used as an expression of the debris flow hazard.
FLO-2D model parameters are obtained from 0.5 m DEM, four sets of particle gradation at different cross sections, and other watershed characterization parameters. Combined with the debris flow dynamic characteristics and the Gansu Province small watershed storm flood model, the debris flow flows were calculated under different capacities of 1.77 t/m3, 1.89 t/m3 and 1.97 t/m3. In the actual investigation, the upstream channel in Quanjia Bay is severely blocked, and the formation after the collapse of the middle and shallow landslide weir will produce a certain amplification effect, so the input of the FLO-2D model is calculated multiplied by the volume expansion coefficient. Finally, the parameters and rate were input of the FLO-2D model (Table 4), and the calculation results were more reliable and realistic without human intervention during the whole process.
The simulation of FLO-2D results (Figure 5) indicates that the areas of the very high-risk zone, high-risk zone, medium-risk zone and low-risk zone under 100-year (1% frequency) precipitation are 4.45 × 10⁴ m2, 1.36 × 10⁴ m2, 3.26 × 10⁴ m2, 4.35 × 10⁴ m2. The areas of the very high-risk zone, high-risk zone, medium-risk zone and low-risk zone under 50-year (2% frequency) precipitation are 2.80 × 10⁴ m2, 1.10 × 10⁴ m2, 1.96 × 10⁴ m2, and 2.95 × 10⁴ m2. The areas of very high-risk zone, high-risk zone, medium-risk zone and low-risk zone under 20-year (5% frequency) precipitation are 1.79 × 10⁴ m2, 0.42 × 10⁴ m2, 0.98 × 10⁴ m2, 2.04 × 10⁴ m2.

4.1.3. Typical Landslide Evaluation Demonstration

The landslide in Panping Village is located approximately 2 km northwest of Longlin Town, on the left bank of the Datang River, a right-bank tributary of the West Hanshui. The landslide is generally tongue shaped on the plane, with obvious rear edge circle chair-like terrain, there are two secondary slides composed of approximately 250 m in length and 180 m in width. The landslide occurs at an elevation of 1320~1481 m, with a relative height difference of approximately 161 m, an average thickness of approximately 25 m, a volume is approximately 112.5 × 10⁴ m2, a main slide direction is 154°, and a total slope is 27°. The field investigation shows that the disaster mode of the landslide is a small avalanche slip collapse overburden damage under the unloading effect of the back wall of the old landslide.
In this paper, the base map data used for numerical simulation is the DEM with an accuracy of 0.5 m resolution obtained by UAV mapping in 2020. Based on the above proposed 2D calculation model of the landslide process based on the finite volume method, the river-Flow 2D landslide motion simulation system is used to obtain the sliding velocity, sliding distance, and thickness of the slide during the motion. In this example, the soil friction model adopts the Bingham standard friction resistance model, which is widely used in the calculation and simulation of the sliding distance, especially for the debris-fluid landslides with high water content of slide material, which can obtain more ideal calculation results, and the calculation formula is shown in Equation (11). In this paper, the parameters in Table 5 are used for the simulation calculation, and the simulation test and movement process analysis are carried out for the landslide of Panping Village under different precipitation conditions.
In the landslide-debris flow movement stage, for the building, the maximum thickness of its location during the movement of the slide is one of the direct factors affecting its deformation and damage condition, so the thickness of the landslide is chosen as an important index for evaluating the landslide hazard. According to the previous studies and the actual situation of the landslide, the landslide hazard is divided into four levels according to the thickness of the movement accumulation, low hazard zone when H ≤ 1 m, medium hazard zone when 1 < H ≤ 3 m, high hazard zone when 3 < H ≤ 5 m, and very high hazard zone when H > 5 m. The simulation results (Figure 6) show that the areas of very high hazard zone, high hazard zone, medium hazard zone, and low hazard zone under the 100-year (1% frequency) precipitation condition of the Panping Village landslide are 1.94 × 10⁴ m2, 1.62 × 10⁴ m2, 1.79 × 10⁴ m2, 1.02 × 10⁴ m2. The areas of very high hazard zone, high hazard zone, medium hazard zone, and low hazard zone under the 50-year (2% frequency) precipitation condition are 1.36 × 10⁴ m2, 1.24 × 10⁴ m2, 1.17 × 10⁴ m2, 1.42 × 10⁴ m2. The areas of very high hazard zone, high hazard zone, medium hazard zone, and low hazard zone under the 20-year (5% frequency) precipitation condition are 0.54 × 10⁴ m2, 1.11 × 10⁴ m2, 1.07 × 10⁴ m2, 1.83 × 10⁴ m2.
According to the above-mentioned risk evaluation process of the urban geohazard chain, geological hazards such as landslides and in the first-class slope zone on both sides of the river valley are analyzed one by one under different precipitation conditions, and the hazard area is predicted. Finally, according to the three-level superposition of slope destabilization, landslide damage and mudslide occurrence, the hazard blocks or strip slope units composed of grid cells in the study area are reasonably delineated to form a geological hazard zoning map of the watershed. The simulation results (Figure 7) show that the areas of very high hazard zone, high hazard zone, medium hazard zone and low hazard zone under 100-year (1% frequency) precipitation in Longlin Town are 2.36 km2, 4.64 km2, 13.97 km2 and 17.43 km2, respectively. The areas of very high hazard zone, high hazard zone, medium hazard zone and low hazard zone under 50-year (2% frequency) precipitation are 1.19 km2, 1.78 km2, 7.28 km2, and 28.14 km2, respectively. The area of the very high-risk zone, high-risk zone, medium-risk zone and low-risk zone under 20-year (5% frequency) precipitation condition is 0.53 km2, 0.75 km2, 4.13 km2, and 32.99 km2, respectively.

4.2. Results

4.2.1. Assessment of the Vulnerability of Towns to Geological Hazards

Considering the characteristics of the variety of structures and functions of disaster-bearing bodies in mountainous towns, we extract the types of disaster-bearing bodies automatically used by the hyperspectral curve features and image recognition technology based on the high-resolution images of Gaofen-2 satellite and UAV aerial photography, which improves the identification efficiency of a large number of disaster-bearing bodies. Synthesize on field surveys, interviews, urban planning, and construction information, the information on disaster-bearing bodies is optimized, and a real-time state database of spatial attributes of urban disaster-bearing bodies is constructed, which is summarized into 4 items and 22 categories. Among them, the population includes two categories—population density and population age; the buildings include nine categories—building areas, government administrative districts, schools, hospitals, factories, commercial houses, supermarkets, tourist attractions and temples; the roads includes four categories: national roads, township roads, general roads and bridges; ecological environment includes seven categories: forest land, grassland, cultivated land, garden land, green land, bare land and water.
Geological hazard vulnerability analysis is a comprehensive analysis of the resilience of a hazard-bearing body. The degree of the vulnerability of a hazard-bearing body depends on the sensitivity of the hazard-bearing body to the effects of the geohazard, which is usually expressed by the value (or number) of the hazard-bearing body and its vulnerability index.
The comprehensive value of the hazard-bearing body can be obtained by calculating the average unit value of the hazard-bearing body and the actual number of affected bodies. The vulnerability of a hazard-bearing body is a description of how easily which it can be destroyed by a disaster, and it can be expressed as a number between 0 and 1, with the larger the value, the higher destroy degree. The quantitative description of the vulnerability of a hazard-bearing body is complicated and is mainly influenced by the structural strength of the hazard-bearing body itself and the damage form of the geological hazard. For example, if a hazard-bearing body is located at different places about landslides and hazards, it will be damaged in different ways. The buildings and structures in its main flow line will be mainly affected by impact hazards, and in the landslide’s edge or the fan’s front edge will be affected by siltation hazards.
The buried disaster-bearing body is difficult to be reused mostly, and it is difficult to play the original planning and design effect due to the change in topography even if the structure is intact. The vulnerability calculation method of a disaster-bearing body is illustrated by the example of a house or structure. The vulnerability index of a disaster-bearing body affected by the siltation hazard is the ratio of the siltation thickness of landslide, debris flow and other hazards to the effective height of the disaster-bearing body itself (Equation (12)).
C d = H d / H c .
where Cd is the vulnerability index of the disaster-bearing body. Hd is the burial depth of the debris-flow siltation (m). Hc is the effective height of the building or structure (m); if (Hd/Hc) ≥ 1, it means that the building or structure has been completely buried by the landslide, and its value is 1.
The vulnerability of the disaster-bearing body is calculated by combining the results of the simulation calculation of the formation mechanism and movement process of geological hazards such as landslides, and considering the spatial variability of the disaster intensity. Finally, the vulnerability of the disaster-bearing body in Longlin Town is superposition evaluated according to the principle of choice high and forms a zoning map of the vulnerability of the geological hazard-bearing body in the populated area of Longlin Town (Figure 8).

4.2.2. Risk Assessment of Urban Geological Hazards

The risk value of each evaluation unit under different precipitation conditions is calculated according to the definition of hazard risk [65,66,67] based on the results of the geological hazard and vulnerability analysis of Longlin Town.
R = H × V × P i
where R is the value of the riskiness index of the evaluation unit. H is the value of the hazard index of the evaluation unit. V is the value of the vulnerability index of the evaluation unit. Pi is the probability of risk occurrence under different precipitation working conditions. Before calculation, all kinds of indices in Equation (13) must be normalized, and the normalization method is as follows:
H = ( H H m i n ) / ( H m a x H m i n )
V = ( V V m i n ) / ( V m a x V m i n )
where H′ is the normalized value of hazard level. H is the value of the hazard index Hmax and Hmin are the maximum and minimum hazard values, respectively. V′ is the normalized value of vulnerability. V is the normalized value of vulnerability. Vmax and Vmin are the maximum and minimum vulnerability values, respectively.
Among them, the Pi calculation method takes the previous geological hazard statistical samples of the study area as an example. A logistic regression statistical model is used to determine the spatial and temporal probability of geological hazard risk in Longlin Town based on the completion of regional geological hazard risk zoning. The Pi is 0.72 for 100-year rainfall conditions, 0.23 for 50-year rainfall conditions, and 0.08 for 50-year rainfall conditions, respectively. After normalizing the risk and vulnerability of geohazards in Longlin Town, the calculation method of Equation (13) is used to calculate the risk probability of geohazards under different precipitation conditions. The comprehensive risk degree of geohazards in Longlin Town is obtained by multiplying the normalized data of hazard of geohazard chains and the normalized data of vulnerability of disaster-bearing bodies. The risk evaluation results classification was conducted used by the method of the natural breakpoint and characteristic points according to the risk characteristics of geological hazards in Longlin Town and the objectives of risk control. The risk degree is divided into four levels: very high risk (0.697~1), high risk (0.538~0.697), medium risk (0.356~0.538), and low risk (0~0.356). The blocks of each risk level were indicated by different spots based on the risk level classification standard, and the raster units of the same risk level were combined to draw the geological hazard risk zoning map of Longlin Town (Figure 9).
The results show that the area of very high-risk zone, high-risk zone, medium-risk zone, and low-risk zone under 100-year (1% frequency) precipitation conditions are 1.91 km2, 4.54 km2, 7.02 km2, and 24.93 km2, respectively. The area of the very high-risk zone, high-risk zone, medium-risk zone and low-risk zone under 50-year (2% frequency) precipitation conditions are 0.64 km2, 1.41 km2, 5.14 km2, and 31.21 km2, respectively. The area of the very high-risk zone, high-risk zone, medium-risk zone and low-risk zone under 20-year (5% frequency) precipitation conditions are 0.15 km2, 0.64 km2, 3.32 km2, and 34.29 km2, respectively.
Under different rainfall frequencies, 75.23% of the areas always maintain low risk, which is mainly the wasteland or forest where people are rarely found. The area suffered from geological hazards with very few and small scales, and danger and vulnerability and the risk of damage caused by disasters are very low. Among in the 24.38% of the areas, risk level increases with the decrease in rainfall frequency. For example, the risk level of Yuping Village from medium-low risk gradually increases to high–very high risk under the rainfall condition of from one rainfall in 20 years to one rainfall in 100 years. Therefore, regular inspection and professional monitoring and early warning facilities are required to protect people’s production and living safety. A total of 0.39% of the areas always remain very high risk due to the wide distribution of geological hazards, large scale, strong destructive power, concentrated distribution of population and property, high hazard and vulnerability, such as Longlin Village, Shuandu Village, and the residential areas on both sides of the Quanjia Bay ditch, which should strengthen risk control by immediately implement of comprehensive disaster prevention projects.

5. Discussion

5.1. Disaster-Forming Pattern Identification Markers

The risk as assessment of urban geological hazards has improved the level of early identification and prediction of risk areas and sources, mitigated the risk of geological hazards at source effectively, and provided a scientific basis for territorial spatial planning and geological hazard prevention and control. In order to better study the distribution characteristics of geological hazards, assess their risk and strengthen the control of geological hazard risks at source in complex mountainous cities, a refined risk assessment was conducted for 19 medium and large geological hazards in Longlin Town, such as the Quanjia Bay debris flow and the Panping Village landslide. There are a total of 71 geological hazards were identified in Longlin Town, the expression of characteristics, such as geological and potential hazard’s disaster environment, triggering factors and disaster-bearing bodies, and the typical potential hazard’s morphological, deformation and situation, were realized through the construction of the Three Investigations system and formation of the geological hazard knowledge map. It plays an important role in improving the identification, monitoring and early warning ability of geological hazards, solving the problem of where are the hidden hazards effectively and strengthening the foundation of geological hazard risk control.

5.2. Development and Evolution of Disasters under Different Rainfall Scenarios

Influenced by the rainfall conditions, the area of very high and high risk increases as the rainfall level upgrading, e.g., the area of very high risk in the study region is 6.45 km2 under 100-year rainfall conditions, which are 3.14, and 8.16 multiple more than that in under 50-year and 20-year rainfall conditions, respectively. The area of high risk is 7.0 km2 under 100-year rainfall conditions, which are 2.36- and 5.47-fold higher than in under 50-year and 20-year rainfall conditions, respectively. Under different rainfall frequencies, 75.23% of the area always remained low risk, 24.38% of the area’s risk level increased with decreasing rainfall frequency, and 0.39% of the area always remained very high risk. Our research obtains the mapping of geological hazards and risk regionalization in the study area under different precipitation frequencies. The results show that rainfall can not only scour the loose accumulation of rock and soil bodies on the slope of landslides but also exacerbate the deformation and damage of landslides by the formation of high dynamic water pressure on the potential slip surface separated from water relatively. The area of very high and high risk reaches the biggest under 100-year extraordinary rainstorm conditions, it is indicated that rainfall has a very significant role in the induction of geologic hazard. The geological conditions of the study area also impacted the occurrence of geological disasters. The region is characterized by active neotectonics movement, discordant valley landforms by the denudation and cutting strongly, complicated and broken rock structure, and developed weak rock. The formation of soft and fluid plastic soften belt on the contact surface between the soil and rock due to the strength of the soil and the lower part of the soft rock is greatly reduced, which are induced landslides by reducing the stability of the slope.

5.3. Suggestions for Geological Hazard Risk Control

(1) Geological hazard risk control is a way to minimize the risk and possible loss of geological hazards by evaluating the possible geological hazard risks and proposing targeted risk control measures based on the systematic understanding of the geological hazard risks formation process and mechanism, such as the cause, mechanical mechanism, motion law and disaster formation mechanism, and the physical characteristics of different types of geological hazards and their disaster formation characteristics. The general idea and specific measures for mitigating the risk of geological hazards in the Longlin Town catchment area are proposed to provide technical support for disaster prevention and mitigation and land use spatial planning control.
(2) Comprehensively analyze the engineering geological conditions, engineering technical difficulty, and engineering cost of the risk section, and carry out engineering treatment of high-risk geological hazard sites in a hierarchical and targeted manner to reduce geological hazard risks. According to the development law, movement characteristics and disaster formation mode of geological hazard, based on the accurate judgment of geological hazards and threat scope, in accordance with the principle of comprehensive analysis and differentiation of priorities, the staff will implement step-by-step work such as engineering treatment and risk-avoidance and relocation. Finally, taking into account the return on investment and the conditions of implementation, appropriate measures are selected from among the available mitigation approaches and technologies for effective disaster risk management. Under different rainfall frequencies, taking the rainfall condition of one in 50 years as an example, a risk control chart (Figure 10) is established with a combination of point and polygon with an Area Grid-based Double Control mechanism to realize the organic combination of prevention and control of hidden hazard points and risk source areas and to support and guide the dynamic risk control of geological hazards. After the comprehensive risk control measures, the area of high and very high risk areas under 50-year rainfall conditions is reduced by 39.41%, among which the area of very high risk areas can be reduced by 87.81%, the investment efficiency ratio of comprehensive risk control is 80.78%, the risk reduction ratio of comprehensive risk control is 9.78%, and the risk reduction effect of risk areas is good, and the risk reduction rate of comprehensive risk control is 92.11%, and the risk reduction is obvious.
(3) It can reduce the probability of encountering disaster-bearing bodies and disaster events as well as the value of geological hazard losses according to a series of works, which were including strengthen the combination of monitoring and early warning by general and specialization, carrying out popular science propaganda and technical training continuously, improve the awareness level of the public, and standardize production and living activities.
In the populated areas along the banks of West Hanshui and Hanjia Rivers, with an area of approximately 3.55 km2 in the catchment area, we will improve the disaster prevention knowledge and awareness of the residents in the affected areas through policies, propaganda training and social management. Carrying out some work enhanced the ability of group measurement and monitoring and emergency avoidance, which are strengthening propaganda and training, professional guidance, inspection and control, and emergency drills in flood and key areas. Further, the level of disaster prevention and mitigation can be improved by summarizing the experience and lessons learned in disaster prevention and mitigation and revising the behaviors, habits, and guidelines for disaster prevention and mitigation continuously.

6. Conclusions

(1) This paper analyzes and studies the dynamic process and risk management and control objectives of geological hazards, and puts forward the ideas and methods of geological hazard risk assessment and control in complex mountainous cities and towns, based on the identification of geological hazard risk source, research on geological hazard formation mode, geological hazard risk analysis, evaluation of vulnerability of potential disaster-bearing bodies, and proposals of geological hazard risk assessment and control in the township area. The effective service support for residential area construction and disaster prevention planning of disaster points is a double risk control technology method worthy of popularization and application. After the comprehensive risk control measures, the area of high and very high-risk areas under 50-year rainfall conditions are reduced by 39.41%, and the risk reduction ratio of comprehensive risk control is 9.78%, which is a good risk reduction effect.
(2) Taking Longlin Town, Lixian County, Longnan Mountainous Area, a typical mid-alpine valley landform, as an example, a total of 71 geological hazards were identified in the study area through remote sensing identification and detailed investigation, including 4 landslides, 53 landslides, 7 gully-type debris flows, and 7 slope-type debris flows. Through the analysis of slope structure, rock, and soil mass structure characteristics, properties, and deformation, it is concluded that the main disaster modes of landslides in this area are small-scale landslide collapse and overburden damage under the unloading effect of the back wall of the old landslide, pushover damage under the excavation and erosion effect of the middle front edge of the landslide, and secondary landslide slide damage under the erosion of the side edge of the landslide. The main disaster mode of debris flow is two types, gullying uncovered soil-siltation type damage slope runoff erosion slip type-diffuse flow type damage. On this basis, an intuitive and visual early detection map of landslides is constructed.
(3) The hydrologic-fluid coupling model was used to simulate and analyze the impact range and intensity of hazards under different precipitation conditions in the study area. According to the three-level superposition of slope destabilization, landslide damage and occurrence, the risk assessment of geological hazards in the study area was realized. The results show that 75.23% of the area always maintain low risk under different rainfall frequency, 24.38% of the regional risk level increases with the decrease in rainfall frequency, 0.39% of the areas always maintain extremely high risk, and the research results show that the research areas should immediately implement a comprehensive disaster prevention project to strengthen risk management and control.
The research on urban geological disaster risk prevention and control is still in the initial stage, and in the future, it will further deepen and improve the risk analysis based on the formation mechanism and disaster dynamic process. It is significant for improving the risk control system, responsibility system and technical methods, strengthening the investigation and hidden hazard identification ability of potential severe and major high-level geological disasters, and attacking the multi-scale and multi-hazard risk development and coordinated prevention and control technology.

Author Contributions

Conceptualization, W.D., G.W. and Q.Y.; methodology, G.W. and Q.Y.; software, W.D., G.W. and L.H.; validation, G.W., Q.Y., Y.G. and X.C.; formal analysis, Y.X. and Q.Y.; investigation, G.W., Q.Y. and Y.G.; resources, G.W. and Q.Y.; data curation, W.D., G.W., Q.Y., S.X. and X.Y.; writing—original draft preparation, W.D., G.W. and Q.Y.; writing—review and editing, W.D., G.W. and Q.Y.; supervision, G.W. and Q.Y.; project administration, G.W. and Y.G. All authors have read and agreed to the published version of the manuscript.

Funding

This study was financially supported by the China Geological Survey (Nos. DD20230008, DD20221747, DD20160083) and the National Key Research and Development Program of China (Nos. 2022YFC3003403, 2018YFC0603701).

Data Availability Statement

The data presented in this study are all available in this article.

Acknowledgments

The authors are thankful to the National Aeronautics and Space Administration (NASA) for the ASTER DEM, to the United States Geological Survey (USGS) for providing SRTM DEM, and to the reviewers for their constructive suggestions on improving the manuscript. All authors have agreed to the final version.

Conflicts of Interest

The authors declare that they have no known conflict of interest or personal relationship that could have appeared to influence the work reported in this paper.

References

  1. Alam, E.; Ray-Bennett, N.S. Disaster risk governance for district-level landslide risk management in Bangladesh. Int. J. Disaster Risk Reduct. 2021, 59, 102220. [Google Scholar] [CrossRef]
  2. Damalas, A.; Mettas, C.; Evagorou, E.; Giannecchini, S.; Iasio, C.; Papadopoulos, M.; Konstantinou, A.; Hadjimitsis, D. Development and Implementation of a DECATASTROPHIZE platform and tool for the management of disasters or multiple hazards. Int. J. Disaster Risk Reduct. 2018, 31, 589–601. [Google Scholar] [CrossRef]
  3. Jaiswal, P.; Westen, C.; Jetten, V. Quantitative landslide hazard assessment along a transportation corridor in southern India. Eng. Geol. 2010, 116, 236–250. [Google Scholar] [CrossRef]
  4. Shi, J.S.; Zhang, Y.S.; Dong, C.; Wu, S.R. GIS-based landslides hazard zonation of the New Badong County site. Acta Geosci. Sin. 2005, 26, 275–282. [Google Scholar]
  5. Tang, Y.M.; Zhang, M.S.; Li, L.; Xue, Q. Discrimination to the landslide susceptibility, hazard and risk assessmennt. Hydrogeol. Eng. Geol. 2011, 38, 125–129. [Google Scholar]
  6. Wu, S.R.; Shi, J.S.; Zhang, C.S.; Wang, T. Preliminary discussion on technical guideline for geohazard risk assessment. Geol. Bull. China 2009, 28, 995–1005. [Google Scholar]
  7. Xu, Q.; Zhang, Y.F.; Chen, W. Vulnerability assessment of geohazards in south-west mountainous area Danba County, Sichuan, China as an example. Geol. Bull. China 2010, 29, 729–738. [Google Scholar]
  8. Zhang, C.S.; He, S.J.; Xin, P.; Sun, W.F.; Tan, C.X.; Wu, S.R.; Wang, T.; Liu, X. Risk evaluation of geological hazard in Weibin District, Bao Ji City, Shanxi Province, China. Geol. Bull. China 2009, 28, 1054–1063. [Google Scholar]
  9. Guo, F.Y.; Meng, X.M.; Zhang, Y.J.; Li, S.; Xie, Z.T.; Xiong, M.Q.; Guo, P. Geological disaster risk assessment methods for mountainous cities and towns in Gansu Province. J. Lanzhou Univ. Nat. Sci. 2014, 50, 604–610. [Google Scholar]
  10. Cui, P.; Zou, Q. Theory and method of risk assessment and risk management of debris flows and flash floods. Prog. Geogr. 2016, 35, 137–147. [Google Scholar]
  11. Zhang, M.S.; Xue, Q.; Jia, J.; Xu, J.W.; Gao, B.; Wang, J.Y. Methods and practices for the investigation and risk assessmengt of Geo-hazards in mountainous towns. Northwestern Geol. 2019, 52, 125–135. [Google Scholar]
  12. Wang, G.F.; Ye, Z.N.; Li, G.; Tian, Y.T.; Chen, Z.L.; Deng, B. Geological hazard risk assessment of Zhouqu county in Bailong river basin. J. Catastrophol. 2019, 34, 128–133. [Google Scholar]
  13. Zhou, C.; Chang, M.; Xu, L.; Che, H.X. Risk assessment of typical urban mine geological disasters in Guizhou province. Geomat. Inf. Sci. Wuhan Univ. 2020, 45, 1782–1791. [Google Scholar]
  14. Huang, B.L.; Yin, Y.P.; Li, B.; Feng, W.L.; Qin, Z.; Zhang, P. Study of risk assessment and mitigation for landslide-induced impulse wave near towns in reservoir areas. Acta Geol. Sin. 2021, 95, 1949–1961. [Google Scholar]
  15. Xiao, L.; Zhang, Y.; Peng, G. Landslide Susceptibility Assessment Using Integrated Deep Learning Algorithm along the China-Nepal Highway. Sensors 2018, 18, 4436. [Google Scholar] [CrossRef]
  16. Su, H.P.; Su, S.; Ma, J.Z.; Liu, D.F.; Zhang, P. Risk assessment of single debris flow gully in south Gansu province, China. Mt. Res. 2016, 34, 337–345. [Google Scholar]
  17. Du, J.; Yin, K.L.; Wang, H.H. Simulation of three-dimensional movement of landslide-debris flow based on finite volume method. Chin. J. Rock Mech. Eng. 2015, 34, 480–488. [Google Scholar]
  18. Wang, G.F.; Yang, Q.; Chen, Z.L.; Mao, J.R. Risk assessment of debris flow in the Ganjia gully of the Bailongjiang basin. J. Sediment. Res. 2020, 45, 66–73. [Google Scholar]
  19. Cascini, L. Applicability of landslide susceptibility and hazard zoning at different scales. Eng. Geol. 2008, 102, 164–177. [Google Scholar] [CrossRef]
  20. Chen, W.; Pourghasemi, H.; Zhao, Z. A GIS-based comparative study of Dempster-Shafer, logistic regression, and artificial neural network models for landslide susceptibility mapping. Geocarto Int. 2016, 32, 367–385. [Google Scholar] [CrossRef]
  21. van Westen, C.J.; Castellanos, E.; Kuriakose, S.L. Spatial data for landslide susceptibility, hazard, and vulnerability assessment: An overview. Eng. Geol. 2008, 102, 112–131. [Google Scholar] [CrossRef]
  22. Cui, P.; Peng, J.; Shi, P.; Tang, H.; Ouyang, C.; Zou, Q.; Liu, L.; Li, C.; Lei, Y. Scientific challenges of research on natural hazards and disaster risk. Geogr. Sustain. 2021, 2, 216–223. [Google Scholar] [CrossRef]
  23. Ma, Z.; Mei, G. Deep learning for geological hazards analysis: Data, models, applications, and opportunities. Earth-Sci. Rev. 2021, 223, 103858. [Google Scholar] [CrossRef]
  24. Ren, F.; Chen, W.; Han, W. Study on reason and spatial-temporal distribution characteristics of debris flow in Longnan area along G212. Chin. J. Rock Mech. Eng. 2008, 27, 3237–3243. [Google Scholar]
  25. Chen, C.; Ren, J.; Meng, G.; Yang, P.; Zhang, J.; Su, X. Analysis of modern activity of major faults in northeast margin of Baryan-Har Block. J. Geod. Geodyn. 2012, 3, 27–30. [Google Scholar]
  26. Yang, X.; Feng, X.; Huang, X.; Song, F.; Li, G.; Chen, X.; Zhang, L.; Huang, W. The Late Quaternary activity characteristics of the Lixian—Luojiabu fault: A discussion on the seismogenic mechanism of the Lixian M8 earthquake in 1654. Chin. J. Geophys. 2015, 58, 504–519. [Google Scholar]
  27. Han, Z.; Xaing, H.; Ran, Y. Activity analysis of Lixian-Luojiapu fault zone in the east boundary of Tibetan Plateau since the Late-Pleistocene. Seismol. Geol. 2001, 1, 43–48. [Google Scholar]
  28. Wei, R.; Zeng, Q.; Davies, T.; Yuan, G.; Wang, K.; Xue, X.; Yin, Q. Geohazard cascade and mechanism of large debris flows in Tianmo gully, SE Tibetan Plateau and implications to hazard monitoring. Eng. Geol. 2018, 233, 172–182. [Google Scholar] [CrossRef]
  29. Bayer, B.; Simoni, A.; Schmidt, D.; Bertello, L. Using advanced InSAR techniques to monitor landslide deformations induced by tunneling in the Northern Apennines, Italy. Eng. Geol. 2017, 226, 20–32. [Google Scholar] [CrossRef]
  30. Ciampalini, A.; Raspini, F.; Bianchini, S.; Frodella, W.; Bardi, F.; Lagomarsino, D.; Di Traglia, F.; Moretti, S.; Proietti, C.; Pagliara, P.; et al. Remote sensing as tool for development of landslide databases: The case of the Messina Province (Italy) geodatabase. Geomorphology 2015, 249, 103–118. [Google Scholar] [CrossRef]
  31. Sun, Q.; Zhang, L.; Ding, X.L.; Hu, J.; Li, Z.W.; Zhu, J.J. Slope deformation prior to Zhouqu, China landslide from InSAR time series analysis. Remote Sens. Environ. 2015, 156, 45–57. [Google Scholar] [CrossRef]
  32. Xu, C.; Xu, X. Comment on “Spatial distribution analysis of landslides triggered by 2008.5.12 Wenchuan Earthquake, China” by Shengwen Qi, Qiang Xu, Hengxing Lan, Bing Zhang, Jianyou Liu [Engineering Geology 116 (2010) 95–108]. Eng. Geol. 2012, 133–134, 40–42. [Google Scholar] [CrossRef]
  33. Zhao, C.; Liu, C.; Zhang, Q.; Lu, Z.; Yang, C. Deformation of Linfen-Yuncheng Basin (China) and its mechanisms revealed by Π-RATE InSAR technique. Remote Sens. Environ. 2018, 218, 221–230. [Google Scholar] [CrossRef]
  34. Tsunetaka, H.; Hotta, N.; Imaizumi, F.; Hayakawa, Y.S.; Masui, T. Variation in rainfall patterns triggering debris flow in the initiation zone of the Ichino-sawa torrent, Ohya landslide, Japan. Geomorphology 2021, 375, 107529. [Google Scholar] [CrossRef]
  35. Ba, R.; Deng, Q.; Liu, Y.; Yang, R.; Zhang, H. Multi-hazard disaster scenario method and emergency management for urban resilience by integrating experiment–simulation–field data. J. Saf. Sci. Resil. 2021, 2, 77–89. [Google Scholar] [CrossRef]
  36. Huang, Y.; Dai, Z. Large deformation and failure simulations for geo-disasters using smoothed particle hydrodynamics method. Eng. Geol. 2014, 168, 86–97. [Google Scholar] [CrossRef]
  37. Małkowski, P.; Niedbalski, Z. A comprehensive geomechanical method for the assessment of rockburst hazards in underground mining. Int. J. Min. Sci. Technol. 2020, 30, 345–355. [Google Scholar] [CrossRef]
  38. Mohammadi, S.; Taiebat, H. Finite element simulation of an Excavation-triggered landslide Using large deformation theory. Eng. Geol. 2016, 205, 67–72. [Google Scholar] [CrossRef]
  39. Pistolesi, M.; Cioni, R.; Rosi, M.; Aguilera, E. Lahar hazard assessment in the southern drainage system of Cotopaxi volcano, Ecuador: Results from multiscale lahar simulations. Geomorphology 2014, 207, 51–63. [Google Scholar] [CrossRef]
  40. Prieto, J.A.; Journeay, M.; Acevedo, A.B.; Arbelaez, J.D.; Ulmi, M. Development of structural debris flow fragility curves (debris flow buildings resistance) using momentum flux rate as a hazard parameter. Eng. Geol. 2018, 239, 144–157. [Google Scholar] [CrossRef]
  41. Caviedes-Voullième, D.; García-Navarro, P.; Murillo, J. Influence of mesh structure on 2D full shallow water equations and SCS Curve Number simulation of rainfall/runoff events. J. Hydrol. 2012, 448–449, 39–59. [Google Scholar] [CrossRef]
  42. Naef, D.; Rickenmann, D.; Rutschmann, P.; McArdell, B.W. Comparison of flow resistance relations for debris flows using a one-dimensional finite element simulation model. Nat. Hazards Earth Syst. Sci. 2006, 6, 155–165. [Google Scholar] [CrossRef]
  43. Siviglia, A.; Stecca, G.; Vanzo, D.; Zolezzi, G.; Toro, E.F.; Tubino, M. Numerical modelling of two-dimensional morphodynamics with applications to river bars and bifurcations. Adv. Water Resour. 2013, 52, 243–260. [Google Scholar] [CrossRef]
  44. Septian, A.; Llano-Serna, M.A.; Ruest, M.R.; Williams, D.J. Three-dimensional Kinematic Analysis of Bingham Canyon Mine Pit Wall Slides. Procedia Eng. 2017, 175, 86–93. [Google Scholar] [CrossRef]
  45. Kumar, V.; Gupta, V.; Jamir, I.; Chattoraj, S.L. Evaluation of potential landslide damming: Case study of Urni landslide, Kinnaur, Satluj valley, India. Geosci. Front. 2019, 10, 753–767. [Google Scholar] [CrossRef]
  46. Salvatici, T.; Di Roberto, A.; Di Traglia, F.; Bisson, M.; Morelli, S.; Fidolini, F.; Bertagnini, A.; Pompilio, M.; Hungr, O.; Casagli, N. From hot rocks to glowing avalanches: Numerical modelling of gravity-induced pyroclastic density currents and hazard maps at the Stromboli volcano (Italy). Geomorphology 2016, 273, 93–106. [Google Scholar] [CrossRef]
  47. Zhang, W.; Ji, J.; Gao, Y.; Li, X.; Zhang, C. Spatial variability effect of internal friction angle on the post-failure behavior of landslides using a random and non-Newtonian fluid based SPH method. Geosci. Front. 2020, 11, 1107–1121. [Google Scholar] [CrossRef]
  48. Chigira, M.; Duan, F.; Yagi, H.; Furuya, T. Using an airborne laser scanner for the identification of shallow landslides and susceptibility assessment in an area of ignimbrite overlain by permeable pyroclastics. Landslides 2004, 1, 203–209. [Google Scholar] [CrossRef]
  49. Ciampalini, A.; Raspini, F.; Frodella, W.; Bardi, F.; Bianchini, S.; Moretti, S. The effectiveness of high-resolution LiDAR data combined with PSInSAR data in landslide study. Landslides 2015, 13, 399–410. [Google Scholar] [CrossRef]
  50. Horton, P.; Jaboyedoff, M.; Rudaz, B.; Zimmermann, M. Flow-R, a model for susceptibility mapping of debris flows and other gravitational hazards at a regional scale. Nat. Hazards Earth Syst. Sci. 2013, 13, 869–885. [Google Scholar] [CrossRef]
  51. Miao, S.; Zhu, Q.; Zhang, B.; Ding, Y.; Zhang, J.; Zhu, J.; Zhou, Y.; He, H.; Yang, W.; Chen, L. Knowledge-guided consistent correlation analysis of multimode landslide monitoring data. Int. J. Geogr. Inf. Sci. 2017, 31, 2255–2271. [Google Scholar] [CrossRef]
  52. Bui, D.T.; Tuan, T.A.; Klempe, H.; Pradhan, B.; Revhaug, I. Spatial prediction models for shallow landslide hazards: A comparative assessment of the efficacy of support vector machines, artificial neural networks, kernel logistic regression, and logistic model tree. Landslides 2015, 13, 361–378. [Google Scholar]
  53. Gorum, T. Landslide recognition and mapping in a mixed forest environment from airborne LiDAR data. Eng. Geol. 2019, 258, 105155. [Google Scholar] [CrossRef]
  54. Lan, H.; Martin, D.; Zhou, C.; Lim, C. Rockfall hazard analysis using LiDAR and spatial modeling. Geomorphology 2010, 118, 213–223. [Google Scholar] [CrossRef]
  55. Kromer, R.A.; Hutchinson, D.J.; Lato, M.J.; Gauthier, D.; Edwards, T. Identifying rock slope failure precursors using LiDAR for transportation corridor hazard management. Eng. Geol. 2015, 195, 93–103. [Google Scholar] [CrossRef]
  56. Skempton, A.W.; Delory, F.A. Stability of natural slopes in London clay. In Selected Papers on Soil Mechanics; Thomas Telford Publishing: London, UK, 1984; pp. 70–73. [Google Scholar]
  57. Wang, G.F.; Chen, Z.L.; Mao, J.R.; Tian, Y.T.; Gao, Y.L.; Deng, B. Debris flow risk assessment in Bailong river basin under different engineering scenarios and rainfall frequency conditions. J. Shandong Univ. Sci. Technol. Nat. Sci. 2020, 39, 30–40. [Google Scholar]
  58. Erena, S.H.; Worku, H.; De Paola, F. Flood hazard mapping using FLO-2D and local management strategies of Dire Dawa city, Ethiopia. J. Hydrol. Reg. Stud. 2018, 19, 224–239. [Google Scholar] [CrossRef]
  59. Fang, Q.; Tang, C.; Chen, Z.; Wang, S.; Yang, T. A calculation method for predicting the runout volume of dam-break and non-dam-break debris flows in the Wenchuan earthquake area. Geomorphology 2019, 327, 201–214. [Google Scholar] [CrossRef]
  60. Caccavale, M.; Matano, F.; Sacchi, M. An integrated approach to earthquake-induced landslide hazard zoning based on probabilistic seismic scenario for Phlegrean Islands (Ischia, Procida and Vivara), Italy. Geomorphology 2017, 295, 235–259. [Google Scholar] [CrossRef]
  61. Harp, E.L.; Keefer, D.K.; Sato, H.P.; Yagi, H. Landslide inventories: The essential part of seismic landslide hazard analyses. Eng. Geol. 2011, 122, 9–21. [Google Scholar] [CrossRef]
  62. Neaupane, K.; Piantanakulchai, M. Analytic network process model for landslide hazard zonation. Eng. Geol. 2006, 85, 281–294. [Google Scholar] [CrossRef]
  63. Van Den Eeckhaut, M.; Hervás, J. State of the art of national landslide databases in Europe and their potential for assessing landslide susceptibility, hazard and risk. Geomorphology 2012, 139–140, 545–558. [Google Scholar] [CrossRef]
  64. Qiao, J.P.; Yang, Z.J. The K-P method based failure probability calculation on landslides. Chin. J. Geol. Hazard Control 2013, 24, 1–5. [Google Scholar]
  65. Chen, L.X.; van Westen, C.J.; Haydar, H.; Roxana, L.C.; Thea, T.; Diana, C.R.; Dhruba, P.S. Integrating expert opinion with modelling for quantitative multi-hazard risk assessment in the Eastern Italian Alps. Geomorphology 2016, 273, 150–167. [Google Scholar] [CrossRef]
  66. Martha, T.R.; van Westen, C.J.; Kerle, N.; Jetten, V.; Kumar, K.V. Landslide hazard and risk assessment using semi-automatically created landslide inventories. Geomorphology 2013, 184, 139–150. [Google Scholar] [CrossRef]
  67. Rabiya, M. Review of National Multi-Hazard Early Warning System Plan of Pakistan in context with Sendai Framework for Disaster Risk Reduction. Procedia Eng. 2018, 212, 206–213. [Google Scholar]
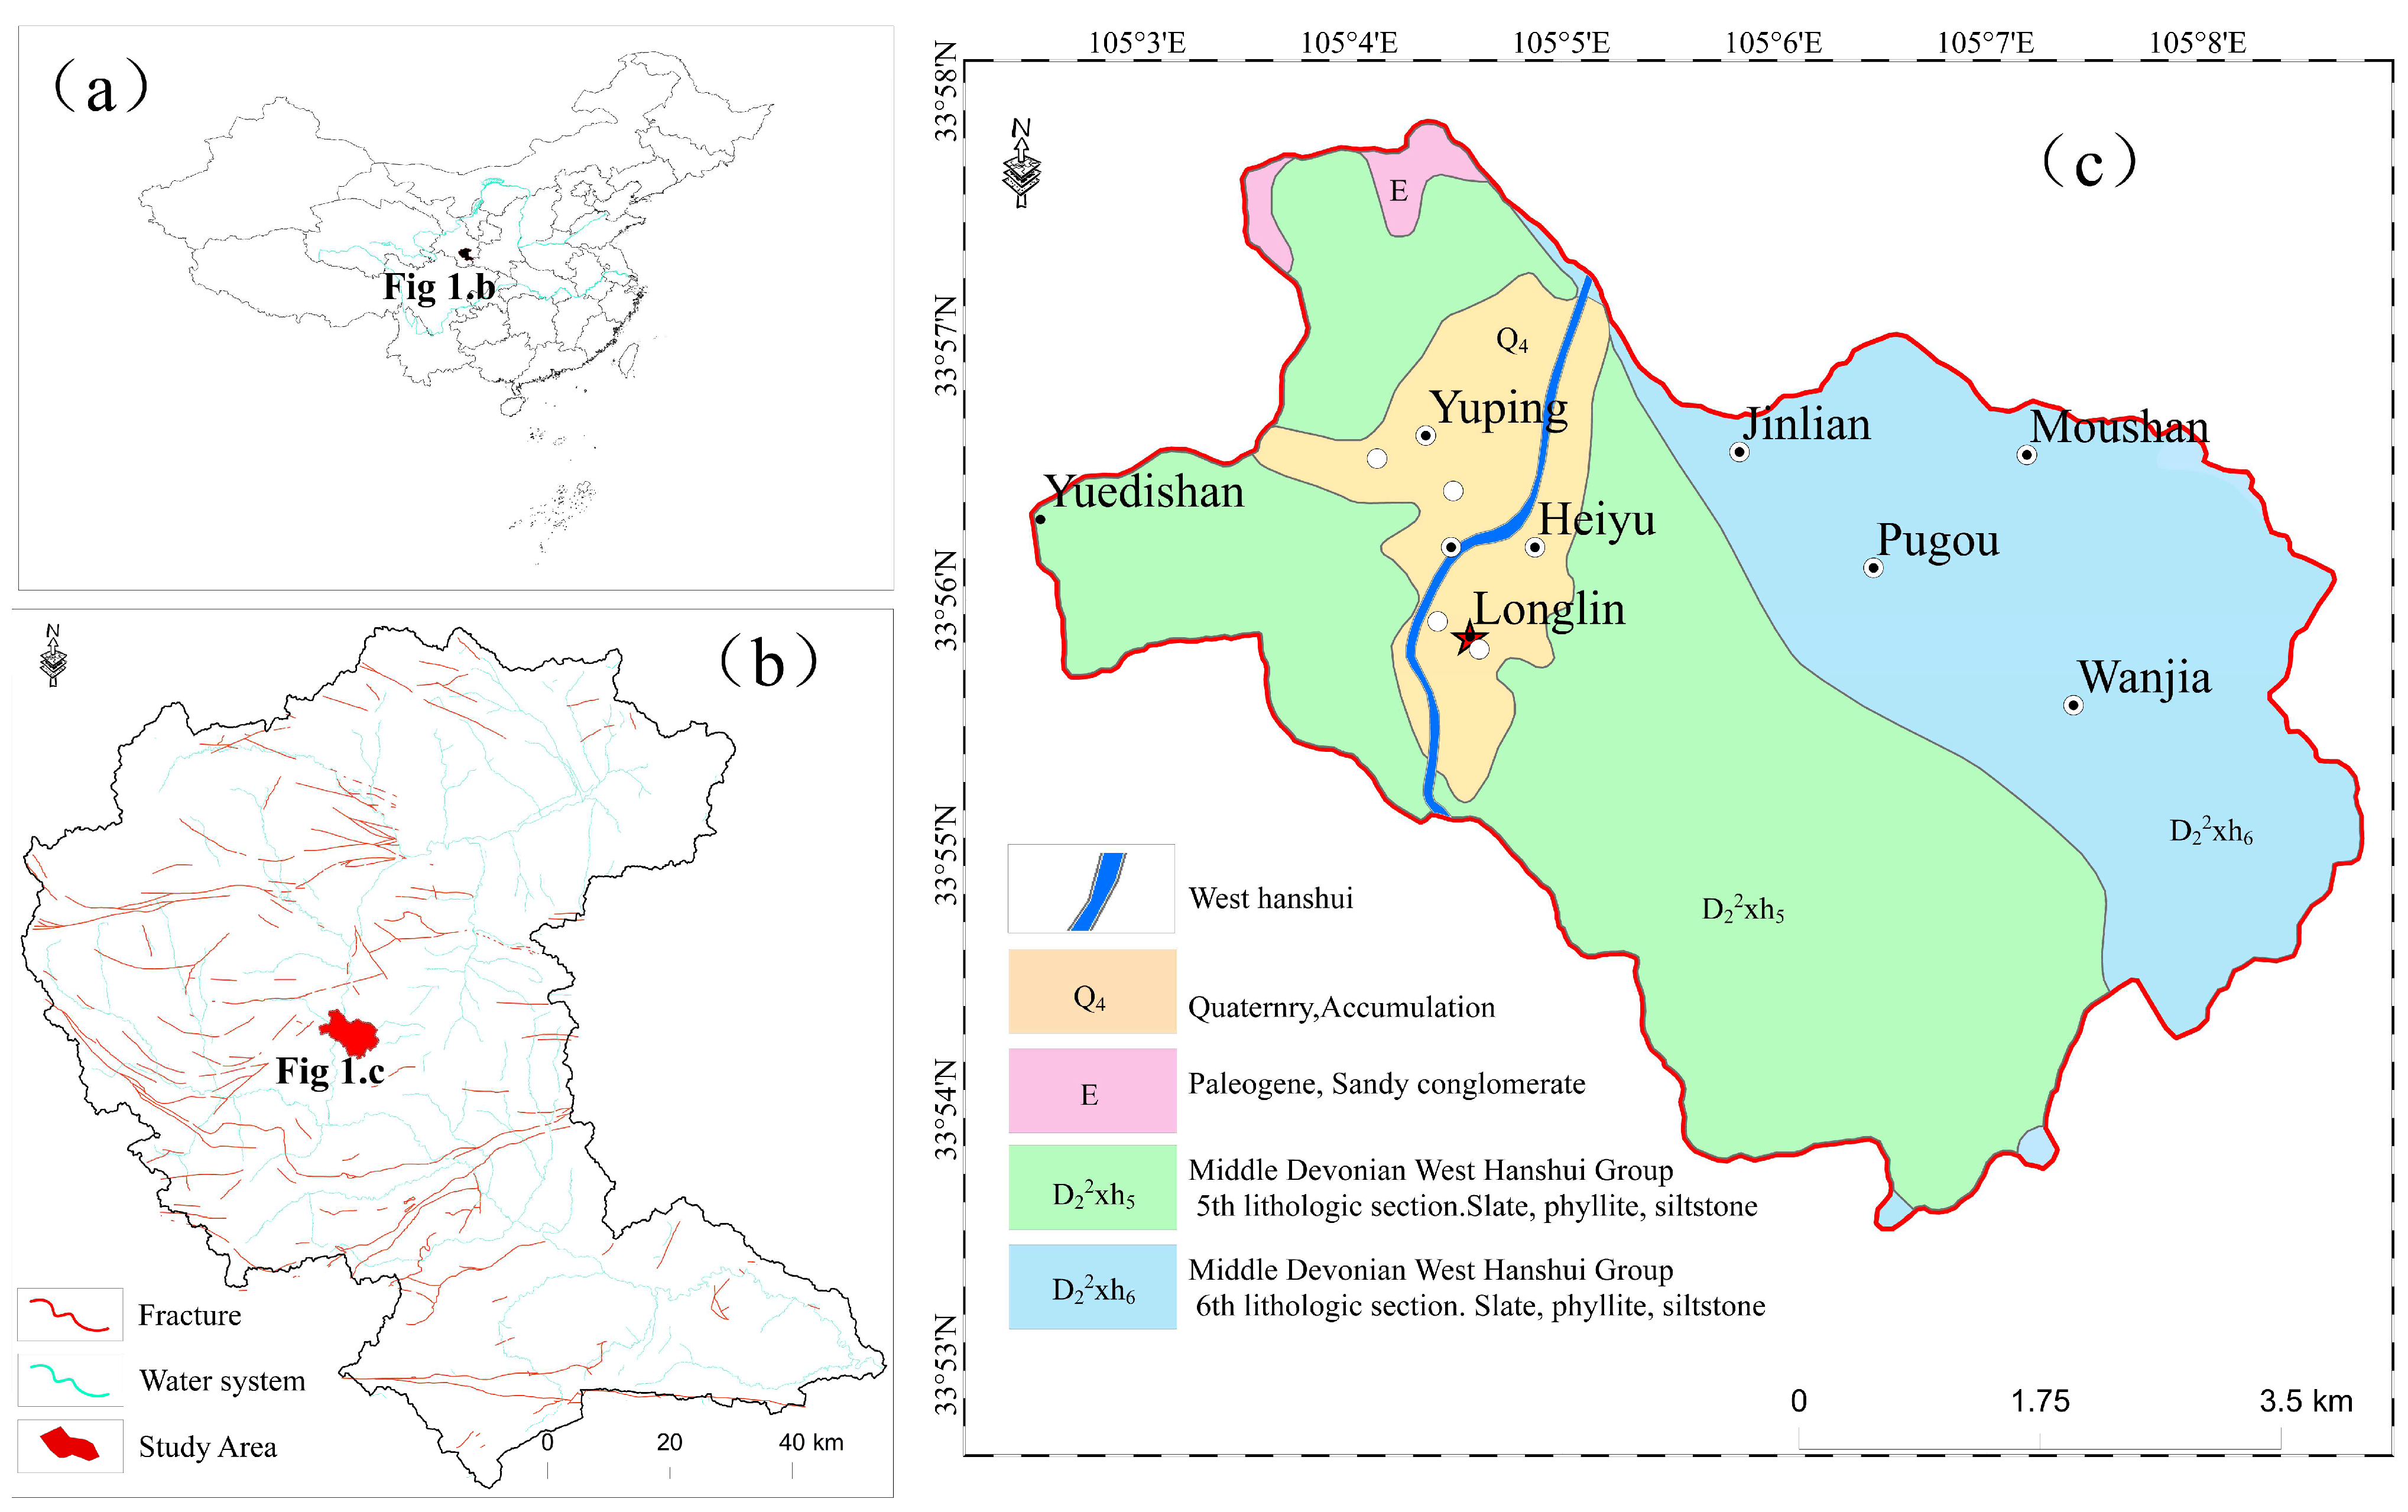
Figure 1. Geological background map of study area. (a). The location of the West Hanshui Basin in China. (b). The structural outline map of the West Hanshui Basin. (c). Development of weak rock layers in Longlin Town.
Water 15 03170 g001
Figure 2. Flowchart of geohazard risk assessment and control for cities and towns in complex mountainous areas.
Water 15 03170 g002
Figure 3. Distribution map of geological hazards and hidden dangers in the study area.
Water 15 03170 g003
Figure 4. Distribution of potential slope damage thickness in the study area.
Water 15 03170 g004
Figure 5. Simulation results of debris flow risk in Jianyuwan under different precipitation conditions. (a). Longitudinal profile of the main channel. (b). Blockage of the main channel downstream of formation area. (c). The situation of the main channel downstream of the circulation area. (d). A total of 100 hazard zones of debris flow under the condition of one rainfall. (e). A total of 50 risk zones of debris flow under one rainfall condition. (f). A total of 20 hazard zones of debris flow in case of rainfall.
Water 15 03170 g005
Figure 6. Simulation results of landslide hazard in Panping Village under different precipitation conditions.
Water 15 03170 g006
Figure 7. Zoning map of geohazards Longlin town under different conditions.
Water 15 03170 g007
Figure 8. Vulnerability zoning map of geohazards in the Longlin Town Collective Area under different conditions.
Water 15 03170 g008
Figure 9. Regional map of geohazards Longlin Town Collective Area under different conditions.
Water 15 03170 g009
Figure 10. Recommended map of Comprehensive Risk Control of Geohazard in Longlin Town (20a).
Water 15 03170 g010
Table 1. Data type and source.
Basic DataData Source and ProductionData Format
Geohazard dataFrom the Longnan West Hanshui Basin Disaster Geological Survey
(2019–2021) project database
1:10,000 precision vector data
DEMGeospatial data to extract slope, gully density, debris flow gully bed ratio drop, etc.5 m × 5 m raster data
DOM/DLGLand use type data5 m × 5 m raster/vector data
Remote Sensing
Data
Interpretation for risk source identification, carrier types, etc.P-star and UAV data, raster data
Rainfall informationLanzhou Central Weather Station, Longnan town geohazard Professional Monitoring NetworkVector data
Geological dataLithological zoning, fracture structure1:200,000 regional geological map, vector data
Survey and test dataPhysical and mechanical indicators such as geotechnical density/capacity, water content/permeability coefficient, and angle of internal friction, cohesion, etc., for model calculation and analysisText Data Format
Table 2. Landslide and hidden danger point disaster pattern identification mark statistics.
TypeInitial StateAgeing Deformation StageProgressive Deformation Damage StagePost-Damage StateDescription of Model Elements
Type
I
Water 15 03170 i001Water 15 03170 i002Water 15 03170 i003Water 15 03170 i004Water 15 03170 i005
Type
II
Water 15 03170 i006Water 15 03170 i007Water 15 03170 i008Water 15 03170 i009
Type
III
Water 15 03170 i010Water 15 03170 i011Water 15 03170 i012Water 15 03170 i013
Table 3. Reference for slope failure probability evaluation.
GradingLandslide Stability Calculation Concerning Surface Macro DeformationLandslide Development Rate Evaluation Reference
Surface Macro Deformation CharacteristicsStable StateReference Value of Stability CoefficientDevelopmental
Status
Landslide Development CharacteristicsFertility Reference Values
Extremely high Signs of overall landslide sliding can be clearly observed on the surface, and the slide body can be separated from the slide bed Landslide initiation <0.9 Full developmental maturity Landslide has been initiated and overall sliding is highly probable 0.9~1
High Landslides can be initiated when there is localized damage to the ground surface, and overall sliding precursors appear Unstable 0.9~1.00 Developmental maturity Slippery slope can be started, the overall sliding possibility is high 0.7~0.9
Medium Signs of surface deformation begin to intensify and the landslide progresses rapidly toward the initiation phase; or the surface shows significant local deformation, but the rate of deformation is slow Critical state or less stable 1.00~1.10 Developmental immaturity or onset of development Accelerated deformation of the landslide, with the possibility of overall sliding; or local deformation of the slope, with the possibility of forming a landslide 0.3~0.7
Low There are only local signs of minor deformation on the surface, and there is no development trend for the time being, or no signs of deformation are observed on the surface for the time being Basically, stable or stable 1.10~1.20 Not yet developed or not developed The slope deformation range is very small and the possibility of landslide formation is minimal; or no landslide <0.3
Table 4. Basic characteristics and FLO-2D simulation parameters of Quanjia Bay.
ProjectsFrequency of RainstormsSimulation
Parameters
Value
P = 5%P = 2%P = 1%
Watershed area/(km2)1.26Calculation grid/(m)5 × 5
Total material sources/(104 m3)242.38Manning roughness coefficient0.15/Residential district
Debris flow capacity/(t/m3) 1.771.891.970.05/Road
Debris flow peak/(m3/s)6.4910.3812.970.22/Cultivated land
Sediment correction factor0.891.171.440.2/Bare ground
Sediment blockage factor3.50.8/Woodland
Debris flow discharge/(m3/s)42.9478.8110.82laminar flow friction factor K2280
Volumetric concentration0.470.540.59 α 1 0.811
Debris flow amplification factor1.892.172.44 α 2 0.00462
Simulation flow/(m3/s)81.21170.93270.45 β 1 13.72
Simulation time/(h)0.30.81.5 β 2 11.24
Simulation accuracy/(%)81.3875.5386.74Sediment specific gravity/(t/m3)2.65
Table 5. Model calculation parameters under different precipitation conditions.
ProjectsP = 5%P = 2%P = 1%
Internal friction angle θb/(°) 14.4 12.96 11.6
Slip density ρ/(kg/m3) 20.2 23.23 25.05
Volumetric concentration CV 0.618 0.802 0.912
Slip body yield stress τy/(MPa) 0.886 1.4221.886
Slip viscous stress τμ/(MPa) 0.141 0.2120.270
Disclaimer/Publisher’s Note: The statements, opinions and data contained in all publications are solely those of the individual author(s) and contributor(s) and not of MDPI and/or the editor(s). MDPI and/or the editor(s) disclaim responsibility for any injury to people or property resulting from any ideas, methods, instructions or products referred to in the content.