1. Introduction
The active deformation of Iran is primarily governed by the convergence of multiple tectonic plates, including the Arabia-Iran in the southwestern region, Iran-Eurasia in the northern part, the Makran subduction zone in the southern region, and the Afghan and Lut blocks in the eastern area. This deformation is predominantly accommodated through distributed faulting within prominent mountain ranges, such as Zagros, Alborz, and Makran [
1,
2,
3,
4]. Conversely, the surrounding regions to the north and east display minimal deformation and are considered aseismic.
The seismic activity in Iran is predominantly attributed to the convergence between different geological components and zones. Historical and instrumental earthquake data have revealed the presence of two major seismic belts within Iran. The southern belt, encompassing the Zagros Mountains, exhibits a northwest-southeast trend, while the northern belt comprises the Alborz and Kepe Dagh mountains.
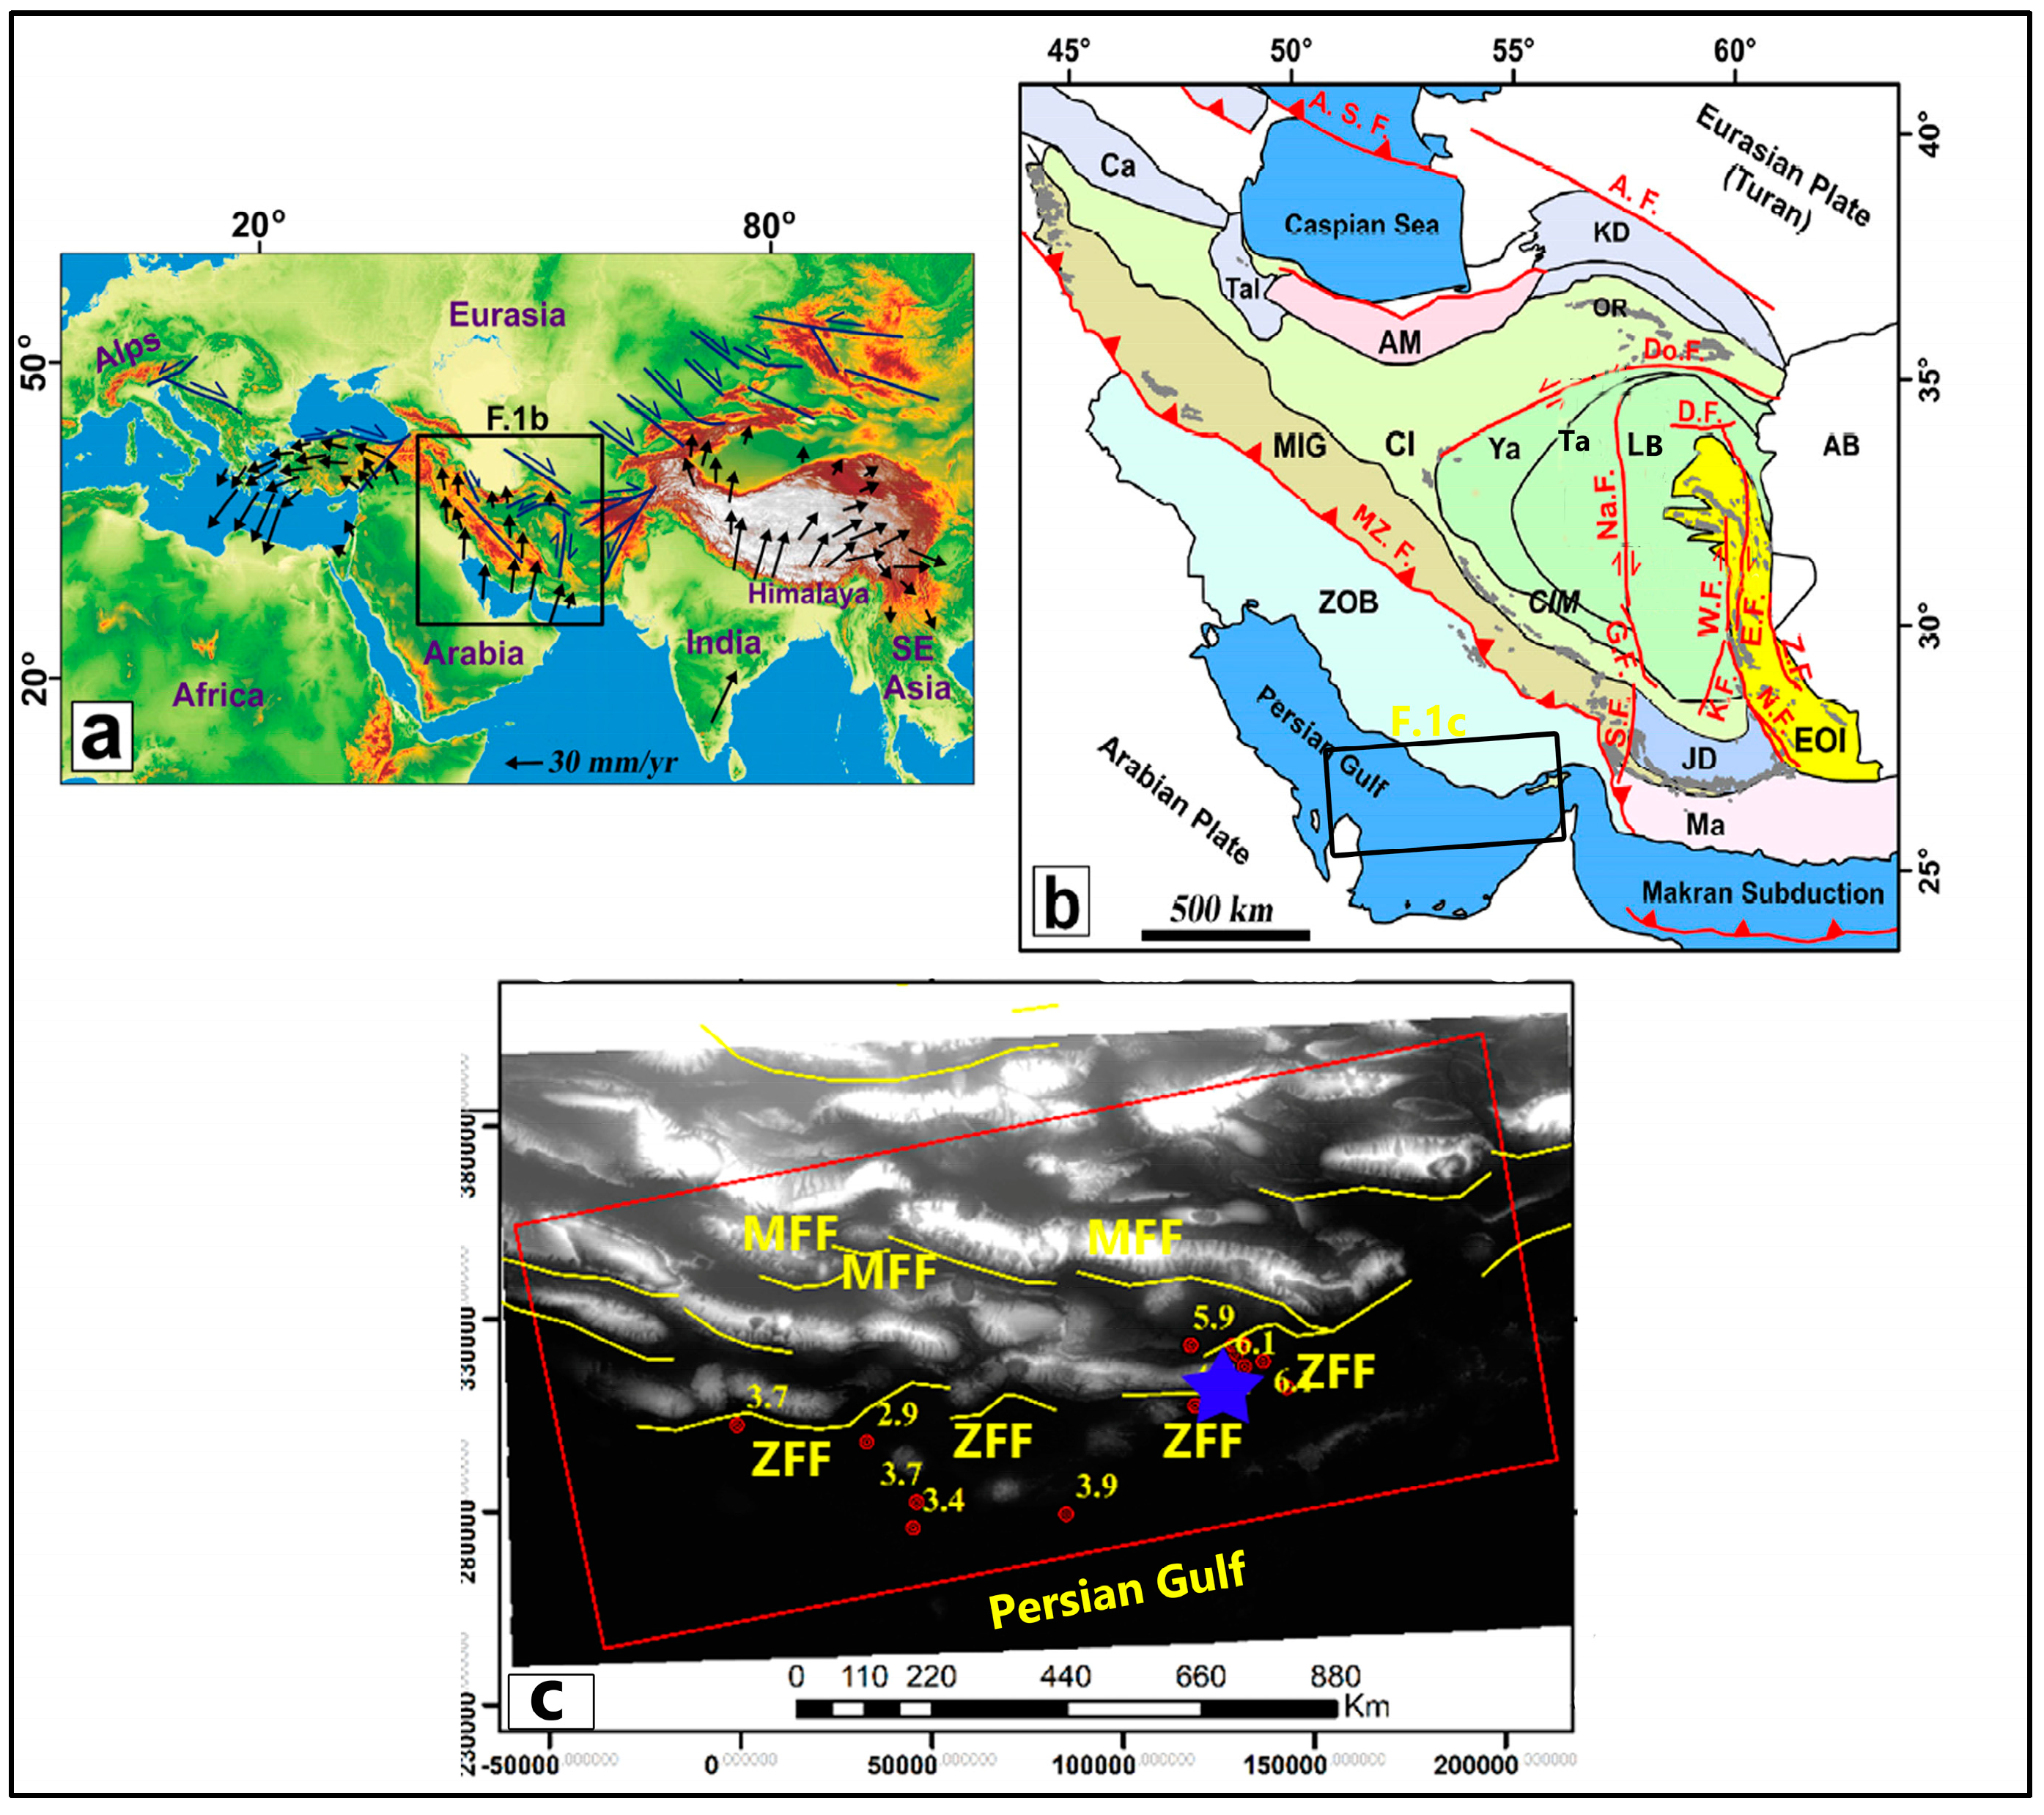
The Alpine-Himalayan range starts from Western Europe and continues after passing through Turkey, Iran, Afghanistan to Tibet, and the vicinity of Burma and Indonesia. This orogeny results from the orogenic process resulting from the collision of Gondwana with Eurasia and the closing of the Tethys Ocean. Iran is located in the center of this orogeny (
Figure 1a). The location of countries such as Iran, Turkey, Syria, Afghanistan, the countries of Central Asia and the Caucasus, and China on this orogenic belt, these countries have faced large earthquakes and many losses and casualties in recent years. The main tension with the trend of N20E due to the movement of the Arabian plate towards Iran and the subduction of the Oman seabed under Makran is the main cause of earthquakes in Iran. Geologically, Zagros can be divided into two or three parts: North Zagros, Middle Zagros, and South Zagros. Fars and Kohgiluyeh Boyer Ahmad provinces, the southern parts of Isfahan, Chaharmahal and Bakhtiari provinces, the eastern highlands of Bushehr province, and the northern highlands of Hormozgan province are all considered South Zagros. Mount Zagros is home to one of the largest hydrocarbon reserves on the planet, and many gas and oil fields are operating and being extracted in this area. The existence of a high number of hydrocarbon fields and their extraction, as well as the natural tectonic activity in Zagros, has made this orogeny an unparalleled example on the planet. From a tectonic point of view, the Zagros region is classified as an active region [
5,
6]. The western and southern part of the Zagros mountain range, with a length of about 1375 km and a width between 120 and 250 km, is called folded Zagros. This part continues from Zagros, in line with high Zagros, to the Persian Gulf and the Strait of Hormuz. Large and elongated anticlines are characteristic of folded Zagros.
Iran is highly prone to earthquakes, which pose significant risks in terms of severe damage and casualties [
7,
8,
9]. As a country situated in a structurally and tectonically active region, Iran experiences approximately 8% of global earthquakes and contributes to 17% of major earthquakes worldwide, establishing its position as one of the most seismically active countries [
10]. These earthquakes have the potential to cause devastating consequences, resulting in numerous casualties and extensive destruction of critical infrastructure, including buildings, roads, and bridges [
11,
12]. Given the frequency of earthquakes in Iran, it is of paramount importance to prioritize effective earthquake preparedness and response measures in order to safeguard communities, minimize the impact on lives, and mitigate property damage [
13,
14].
In addition to various methods employed for monitoring geohazards, the radar interferometry technique emerges as one of the most accurate and cost-effective remote sensing techniques. This technique offers the advantage of operating in all weather conditions and providing wide coverage of the Earth’s surface at any time of the day or night, with high spatial and temporal resolution. It has proven instrumental in detecting and monitoring changes in the Earth’s surface, as well as observing slow and unstable movements of slopes across different regions [
15,
16]. However, limitations such as topographical error, orbital effects, atmospheric disturbances, and other sources of noise can compromise the accuracy of radar interferometry. Overcoming these limitations has been the focus of numerous studies, leading to the development of various methods by different researchers.
The early application of radar interferometry using airborne radar data dates back to the 1970s [
17]. Subsequently, the utilization of space-borne radar interferometry gained popularity, particularly after the publication of research results by Massonnet et al. in the journal
Nature [
18]. In addition to measuring signal intensity, radar images carry valuable phase information, enabling their application in fault and earthquake studies through phase analysis and radar interferometry [
19,
20,
21].
Due to advancements in radar interferometry techniques for identifying and monitoring displacements caused by earthquakes, several noteworthy research studies have been conducted in this field. For instance, Liu et al. [
22] employed RADARSAT, Sentinel-1, and ALOS-2 satellite images to investigate the Gorkha-Nepal earthquake. Their research estimated a maximum slip of 6 m at a depth of 13 km using radar interferometry.
In a similar vein, Nath et al. [
23] utilized the D-InSAR technique to study the deformation of the Earth’s crust resulting from the Kashmir earthquake. Their findings revealed significant surface changes in the northeast of the Samwal Fault and the northwest of the Jhelum Fault.
Another relevant study conducted by Kandregula et al. [
24] focused on investigating land surface deformation in the Kachchh region of western India over three distinct periods. Radar interferometry, along with a combination of ENVI ASAR images, ALOS PALSAR satellite images, and Sentinel-1A images, was employed for this research. The results obtained through the Persistent Scatterer Interferometry (PSI) method indicated an average change of ±22 mm between 2003 and 2005. Additionally, the maximum observed displacement from 2007 to 2009 was ±1.2 cm using ALOS PALSAR satellite data. The Sentinel-1A satellite data revealed ±16 mm per year of changes in the western region and 6 mm of uplift per year in the central area of Kochich East from 2016 to 2020. Their study confirmed the reliability of the obtained deformation rates by correlating them with spatial information system results.
In Italy, Mancini et al. [
25] investigated the Earth deformation in an area located on the Po plate using Sentinel-1A pair data and the interferometric technique. They concluded that the SNAP 9.0 software and STAMPS are reliable for processing Sentinel-1 images.
Syafriani et al. [
26] examined land changes resulting from seismic activity on rock and soil layers. By comparing satellite images before and after an earthquake, they determined that parts of Padang City experienced a height decrease of 40 mm, with a subsidence of 0–20 mm along the city’s coast.
While recent studies in the study region have primarily focused on structural geology, active tectonics, and geodynamics [
27,
28,
29], limited attention has been given to the monitoring of land surface changes. Therefore, the objective of this research is to estimate the elevation and subsidence of the Earth’s surface using Sentinel-1A radar images taken before (2022/06/22) and after (2022/07/16) the earthquake, employing radar interferometric techniques.
2. Materials and Methods
Bandar Khamir is a city located in the southern region of Hormozgan province in Iran. It is situated 95 km southwest of Bandar Abbas and 110 km from Bandar Lange. Bandar Khamir, positioned at 26 degrees and 57 min north latitude and 55 degrees and 35 min east longitude relative to the Greenwich meridian, sits at an elevation of 15 m above sea level [
1]. On 07/01/2022, at 21:32:06, an earthquake measuring 6.1 in magnitude struck near Bandar Khamir, specifically at coordinates 26 degrees and 83 min north latitude and 55 degrees and 27 min east longitude. Following the main earthquake, numerous aftershocks occurred in the same vicinity, as well as additional earthquakes in the Persian Gulf region on the same date. The earthquake had a magnitude of 6.1Mw and occurred at a depth of 10 km. Hormozgan province is located in the two zones of Makran in the east of the province and Zagros in the west of this province in terms of tectonic earthquakes, and it is considered among the earthquake-prone regions of the country. The closest fault to the epicenter of the earthquake is the southern branches of the Zagros Foredeep Fault (ZFF) and the Mountain Frontal Fault (MFF) (
Figure 1b,c). Tragically, this event resulted in five fatalities and caused injuries to 45 individuals [
2]. For a comprehensive investigation into the extent of displacement and changes caused by the earthquake, this study expands its focus beyond the immediate epicenter (
Figure 1c and
Table 1).
Figure 1.
Geographical and structural context of the studied area. (
a) SRTM30 map depicting the Alpine-Himalaya orogenic system resulting from the collision of the Eurasian plate with the Indian, Arabian, and African plates. Velocity vectors are relative to the Eurasian reference frame [
30]. (
b) Regional structure illustrating the Eurasia-Arabia collision and the location of the Eastern Iran orogen. Abbreviations: Ca = Caucasus; Tal = Talesh; AM = Alborz Mountains; KD = Kopet Dagh; OR = ophiolitic rocks; MIG = zone of metamorphic rocks and intruded granitoids; CIM = Central Iranian Microcontinent; Cl = Central Iran; Ya = Yazd; Ta = Tabas; LB = Lut block; AB = Afghan block; ZOB = Zagros orogenic belt; JD = Jazmurian depression; Ma = Makran; EOI = Eastern Iran orogen; A.S.F. = Apsheron Sill fault; A.F. = Ashkabad fault; Do. F = Doruneh fault; D.F. = Dasht-e Bayaz fault; Na.F. = Nayband fault; G.F. = Gowk fault; S.F. = Sabzevaran fault; W.F. = West Neh fault; E.F. = East Neh fault; K.F. = Kahourak fault; N.F. = Nosratabad fault; Z.F. = Zahedan fault. (
c) Active faults in the studied area, including the Zagros Foredeep Fault (ZFF) and Mountain Front Fault (MFF). The red circles indicate the surface epicenters of the earthquakes, while the blue star marks the location of Bandar Khamir.
![Water 15 03108 g001]()
In this study, our objective was to assess the displacement caused by the earthquake in the vicinity of Bandar Khamir. To accomplish this, we obtained earthquake information and locations from the research center of the Ministry of Roads, Housing, and Urban Development of the country (BHRC). Subsequently, Sentinel-1 satellite images of the studied area were acquired for three specific dates:
1—The base image was taken before the earthquake.
2—The follower image was captured three days after the earthquake, serving as both a follower image and the base image for the subsequent period.
3—The additional follow-up image was obtained eleven days after the earthquake.
Both of these acquired images are descending in nature. In the field of interferometry, the accuracy of detecting changes in the Earth’s surface displacement improves with a smaller spatial baseline, which represents the distance between satellite flight paths. Hence, efforts were made to utilize images with a minimal baseline.
Radar interferometric methods have proven to be a powerful technique for identifying vertical changes in the Earth’s surface, offering extensive spatial coverage and high accuracy. However, several factors, including topographical error, orbital effects, atmospheric disturbances, and other sources of error, can diminish the precision of radar interferometry. To mitigate these limitations, multitime radar interferometry methods such as persistent scatterer interferometry (PSI) and small baseline subset algorithm (SBAS) have been introduced.
Table 2 provides an overview of different interferometric techniques along with their respective limitations.
This study employed two different periods to examine the initial displacements resulting from the earthquake as well as the ongoing effects. Given the extensive size of the study area, a range of 3 to 7 images were utilized for each of the three segments. A comprehensive overview of the utilized images can be found in
Table 3, while the research workflow is depicted in
Figure 2.
3. Results and Discussion
Estimating the extent of destruction resulting from earthquakes and other natural disasters in the immediate aftermath of such events is crucial for rapid damage assessment and effective crisis management. Various methods are employed to assess the magnitude of damage caused by earthquakes, including the utilization of remote sensing optical images, diverse photogrammetry techniques, radar interferometry, and on-site inspections. Radar data, available round the clock and in all weather conditions, is often accessible to users at minimal cost or even free of charge. In recent times, radar interferometric technology has emerged as a potent tool for monitoring the Earth’s crustal deformations and changes, offering a multitude of capabilities and products in the realms of phase and range analysis.
During the initial investigation period from 22 June 2020 to 4 July 2022, two Sentinel-1A radar images were acquired for analysis. These images, captured before and immediately after the earthquake, were utilized to examine the changes and vertical displacements induced by the seismic event.
To streamline the image processing, the first step involved cropping both images based on the range boundary using the Top sar_split tool. Images from the 3rd to 7th and all three parts of the image were used in subsequent analysis.
Next, the orbital files were applied to the images using the Apply-Orbit-File tool to generate accurate orbits for each image. Then, the Back Geocoding tool was employed to ensure precise pixel alignment between the two images.
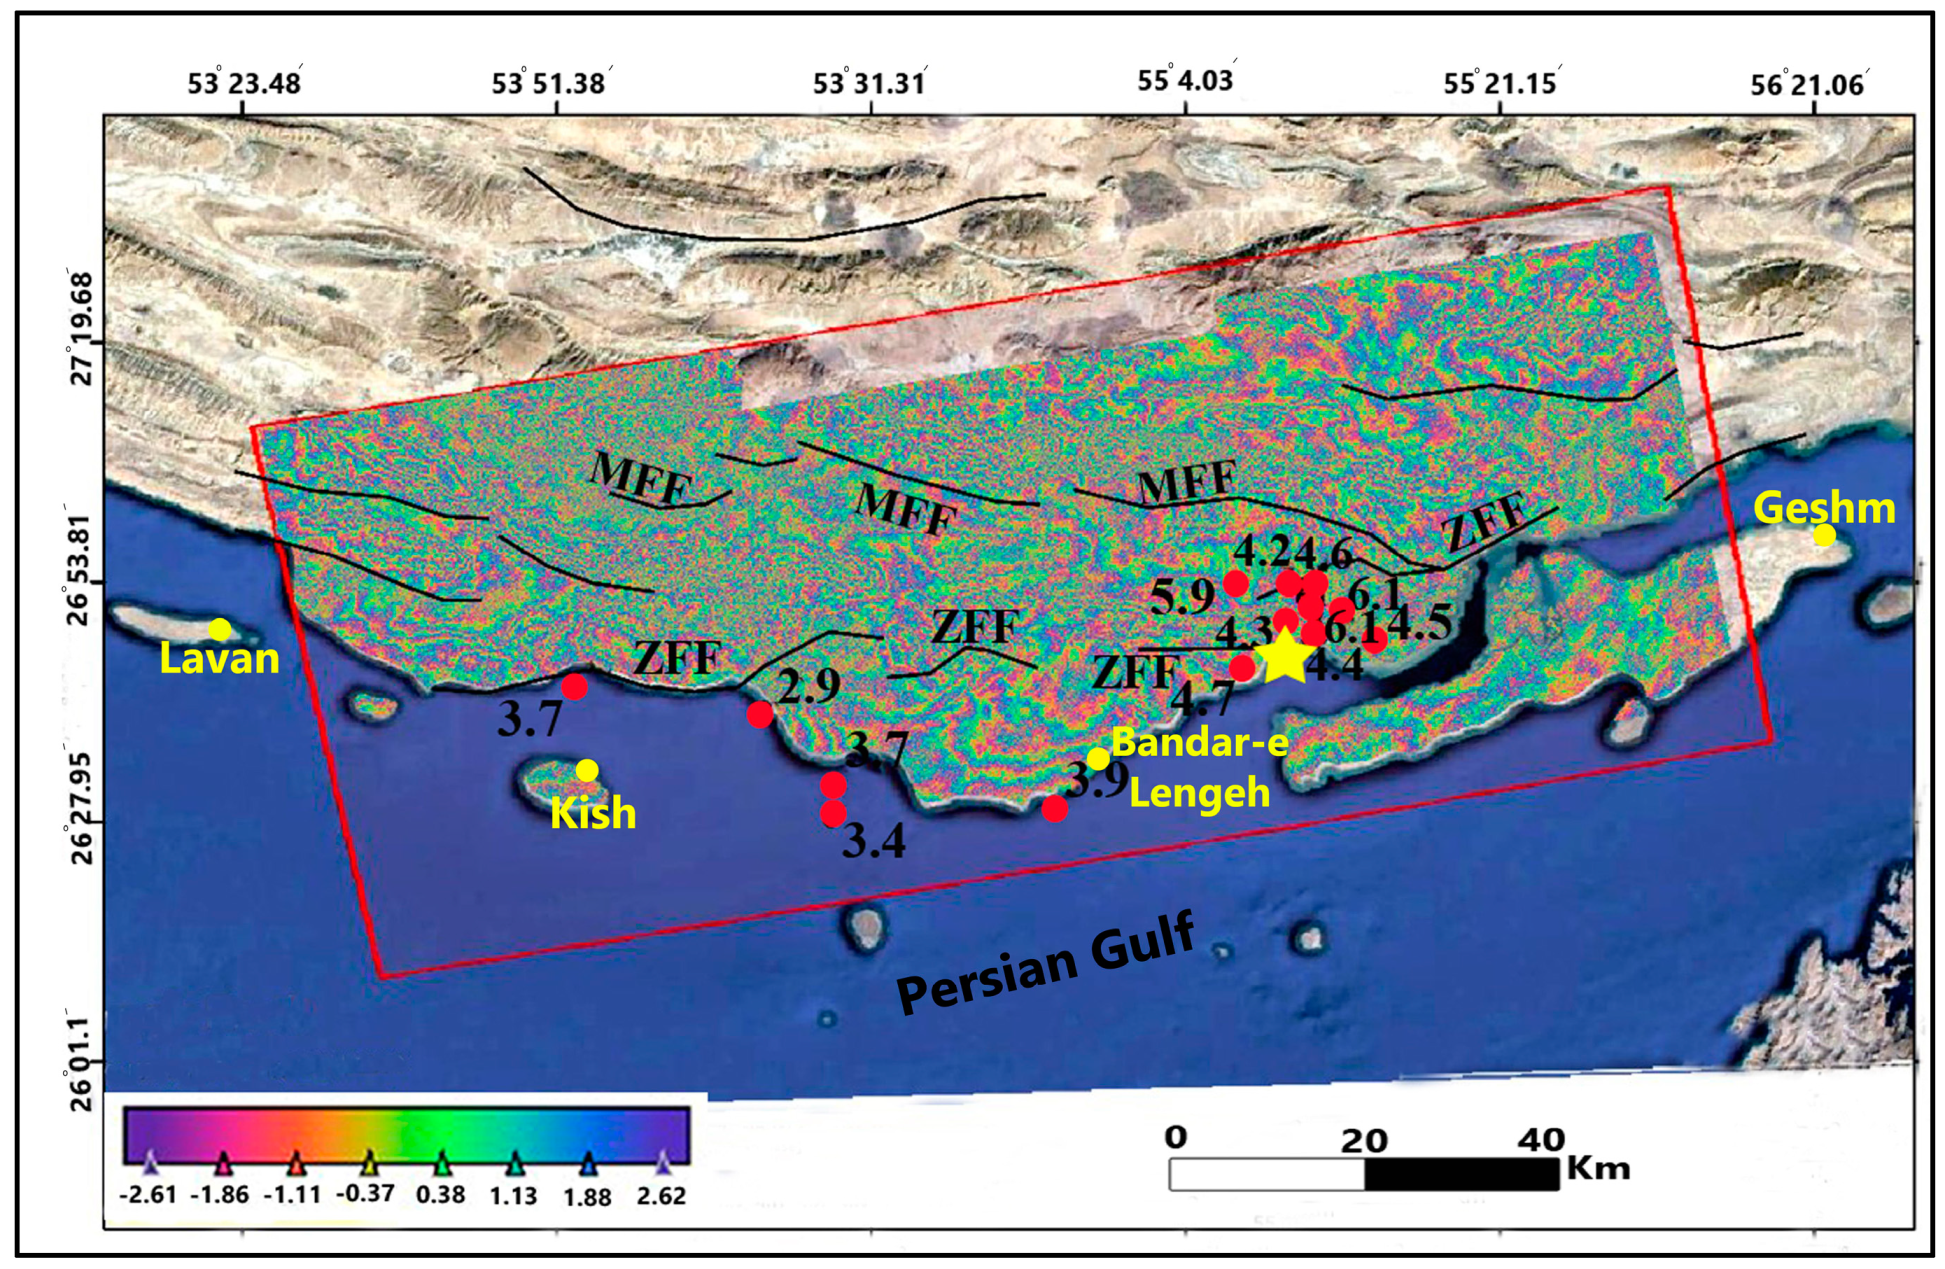
Subsequently, the images were prepared for interferometric mapping. The Interferogram tool was utilized to calculate the interferometric coherence, which represents the correlation between the radar signals. Additionally, the phase image was generated, illustrating the disparity between the transmitted radar beams and the received signals for each pixel. Put simply, it depicts the energy difference between the transmitted and received signals.
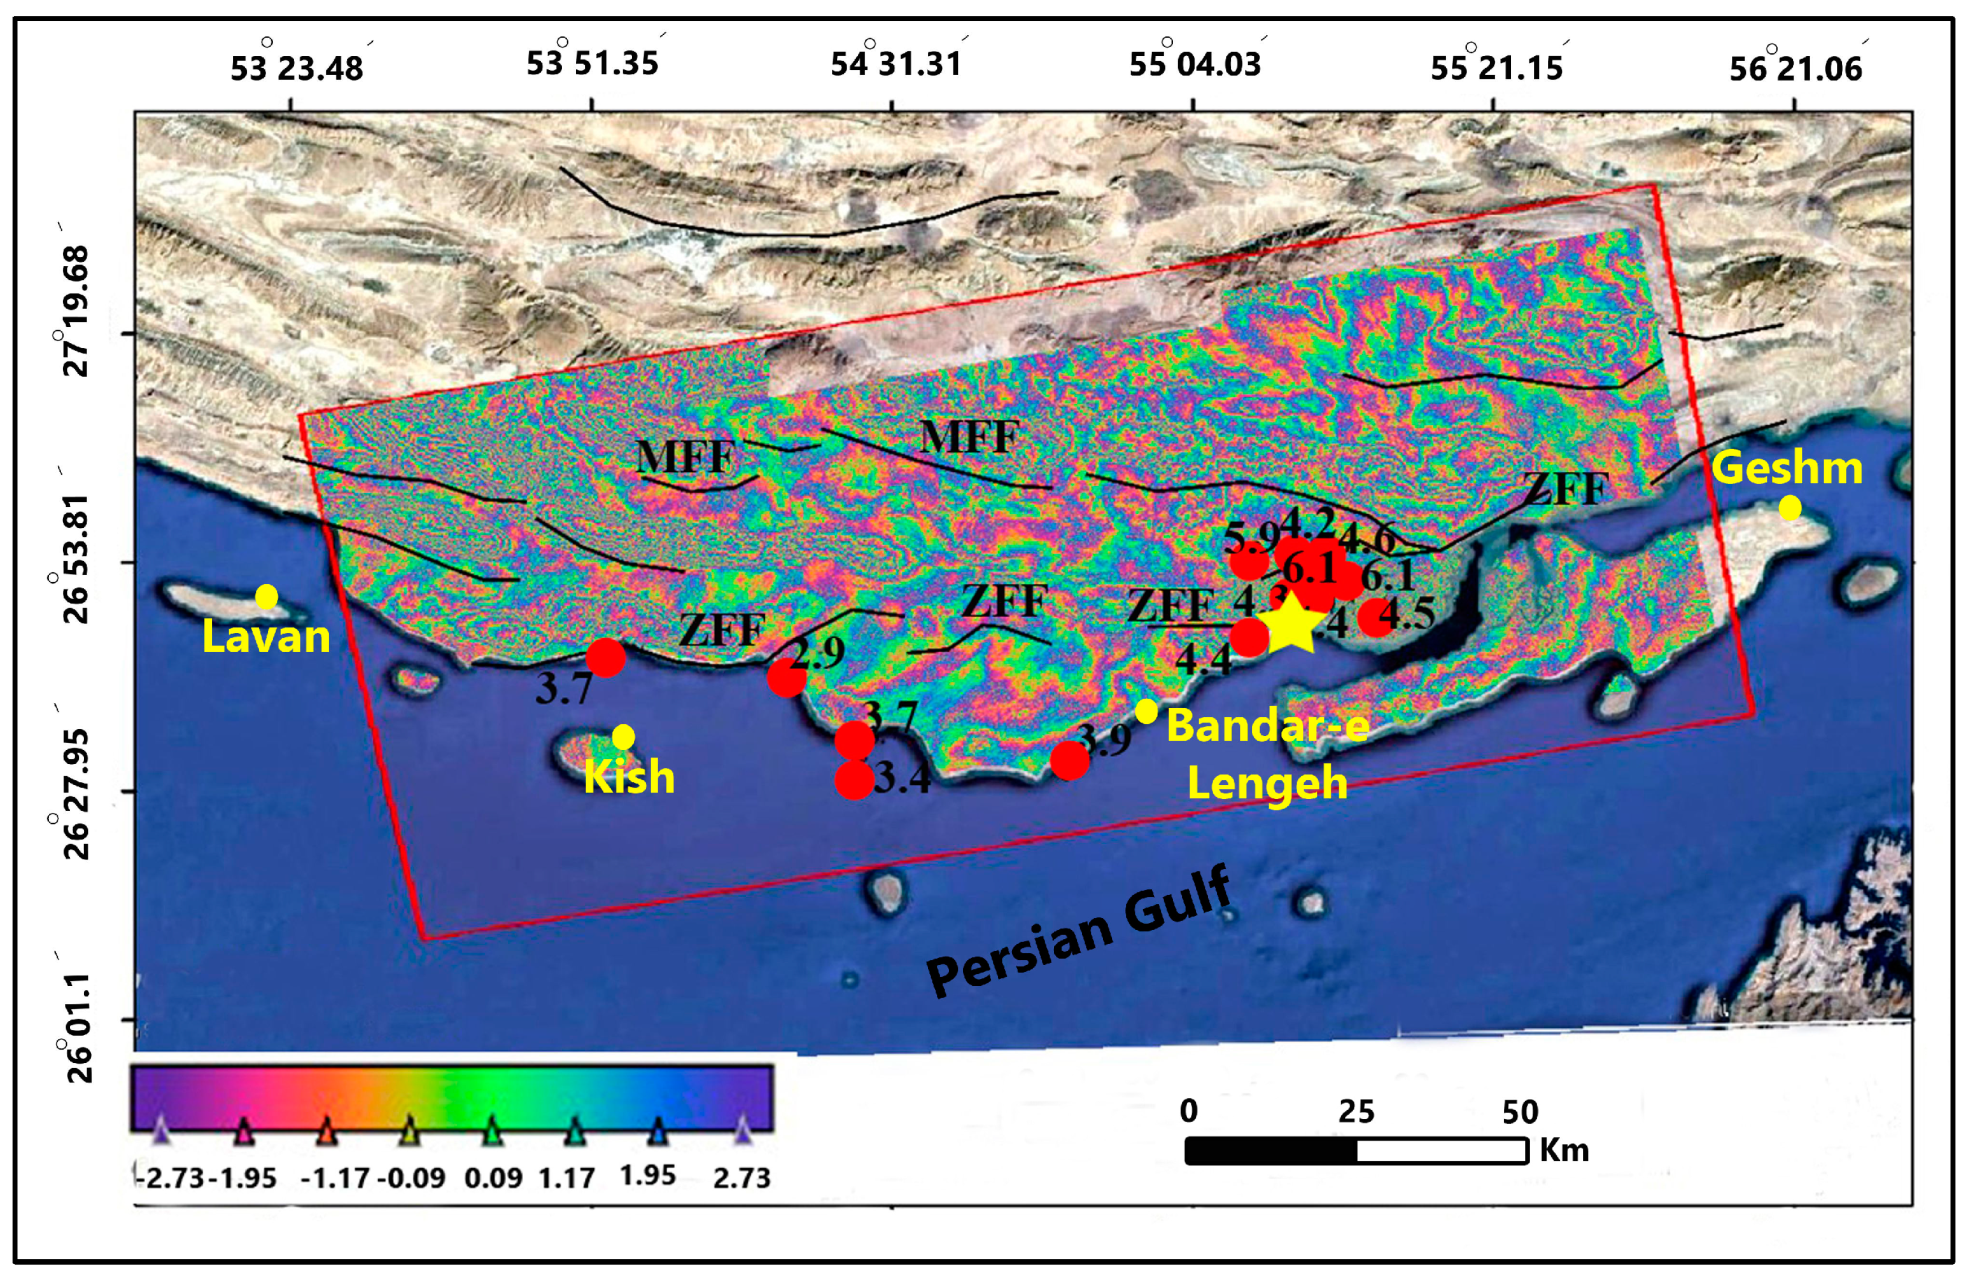
Figure 3 displays the phase image of the study area.
In the subsequent step, mitigating the impact of topography in the image is crucial for accurately estimating the displacement in the area. To achieve this, a digital elevation model (DEM) SRTM image of the region, along with a topo phase removal tool and the application of the SNAP software, were utilized.
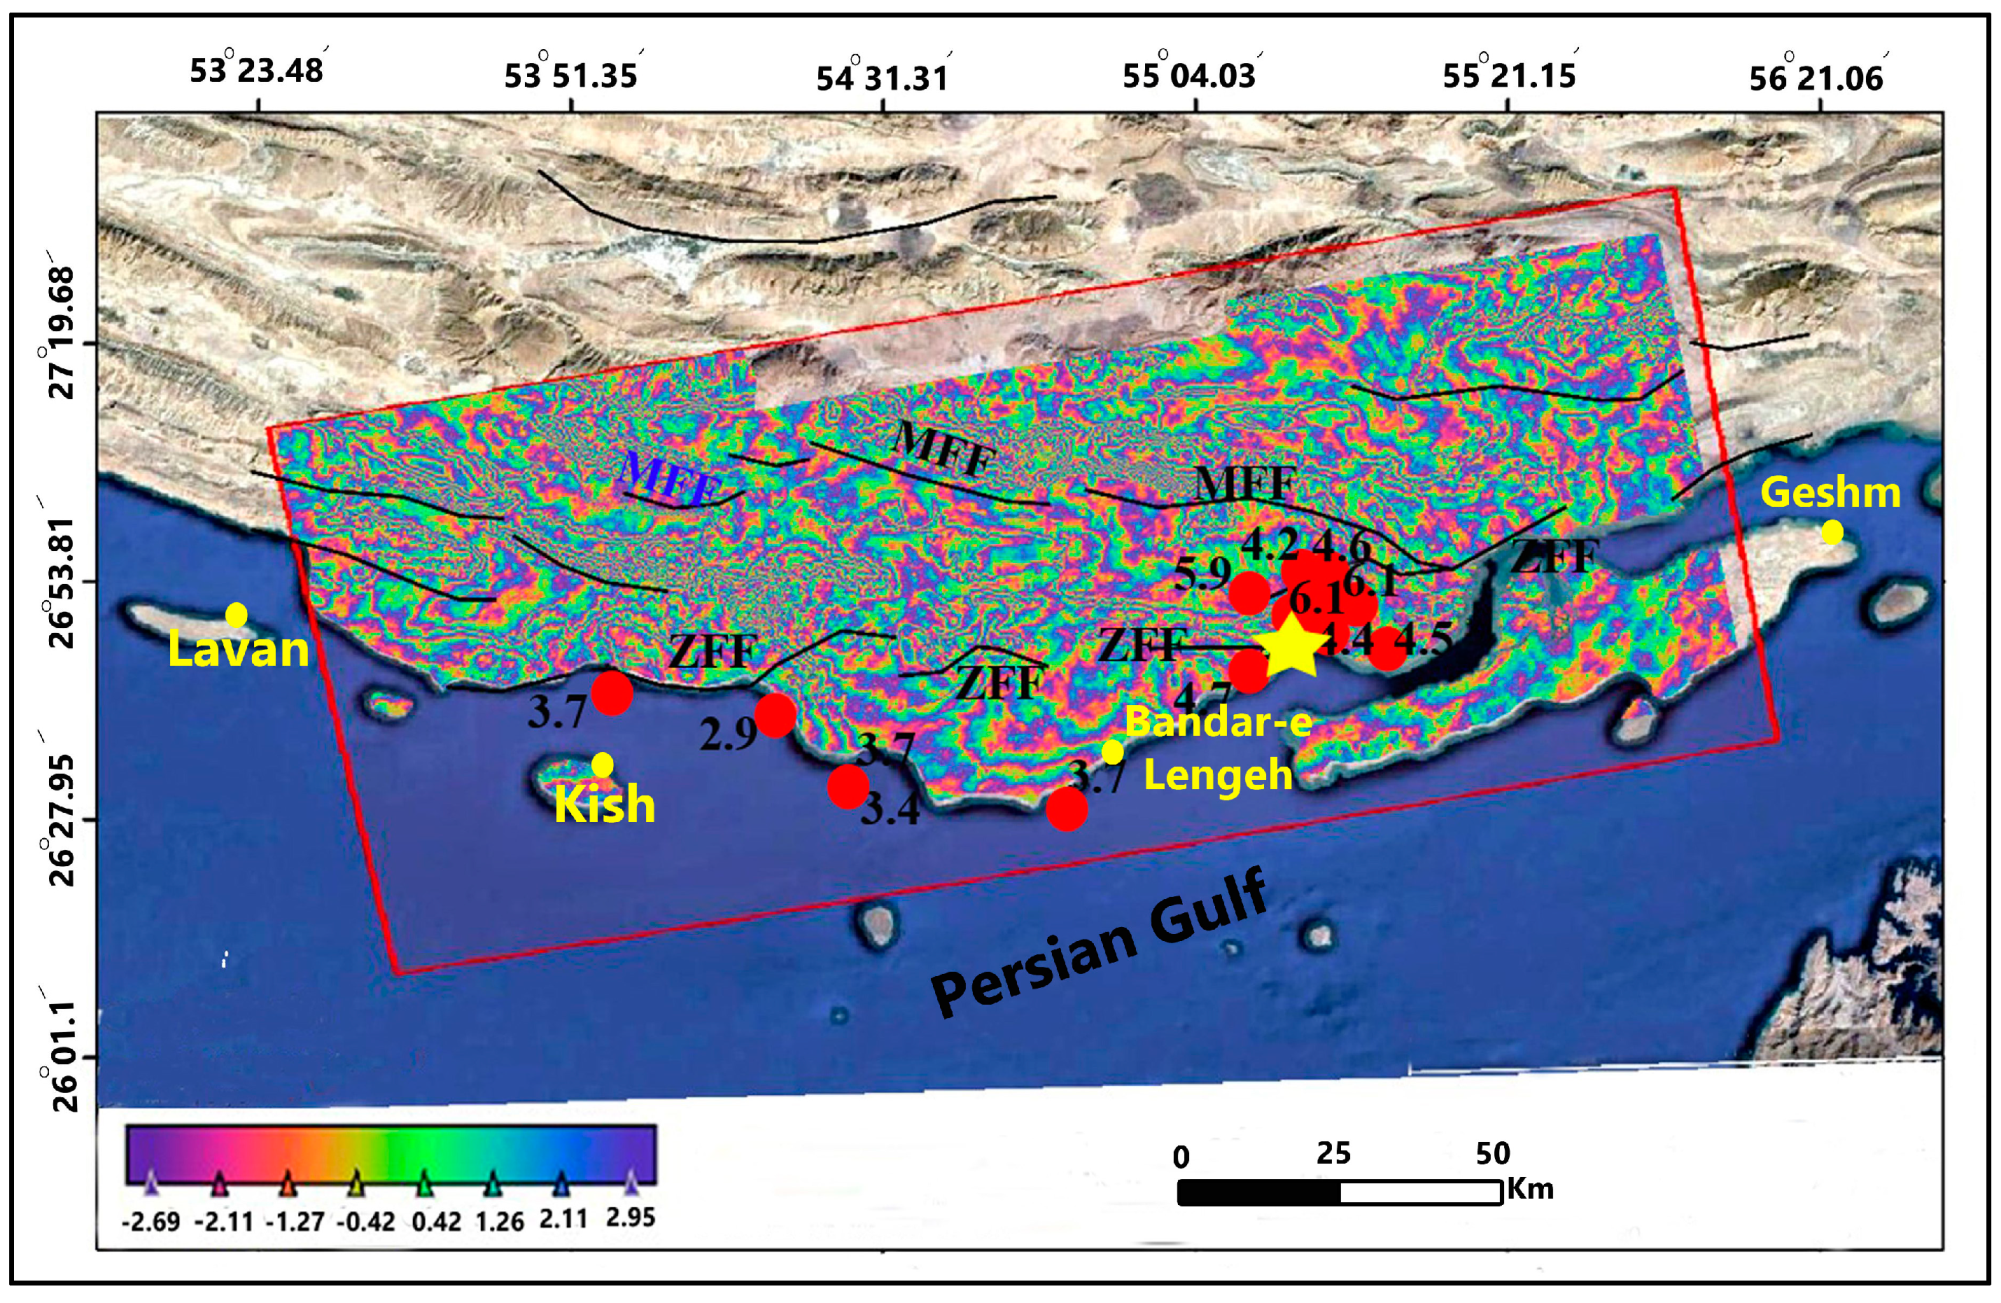
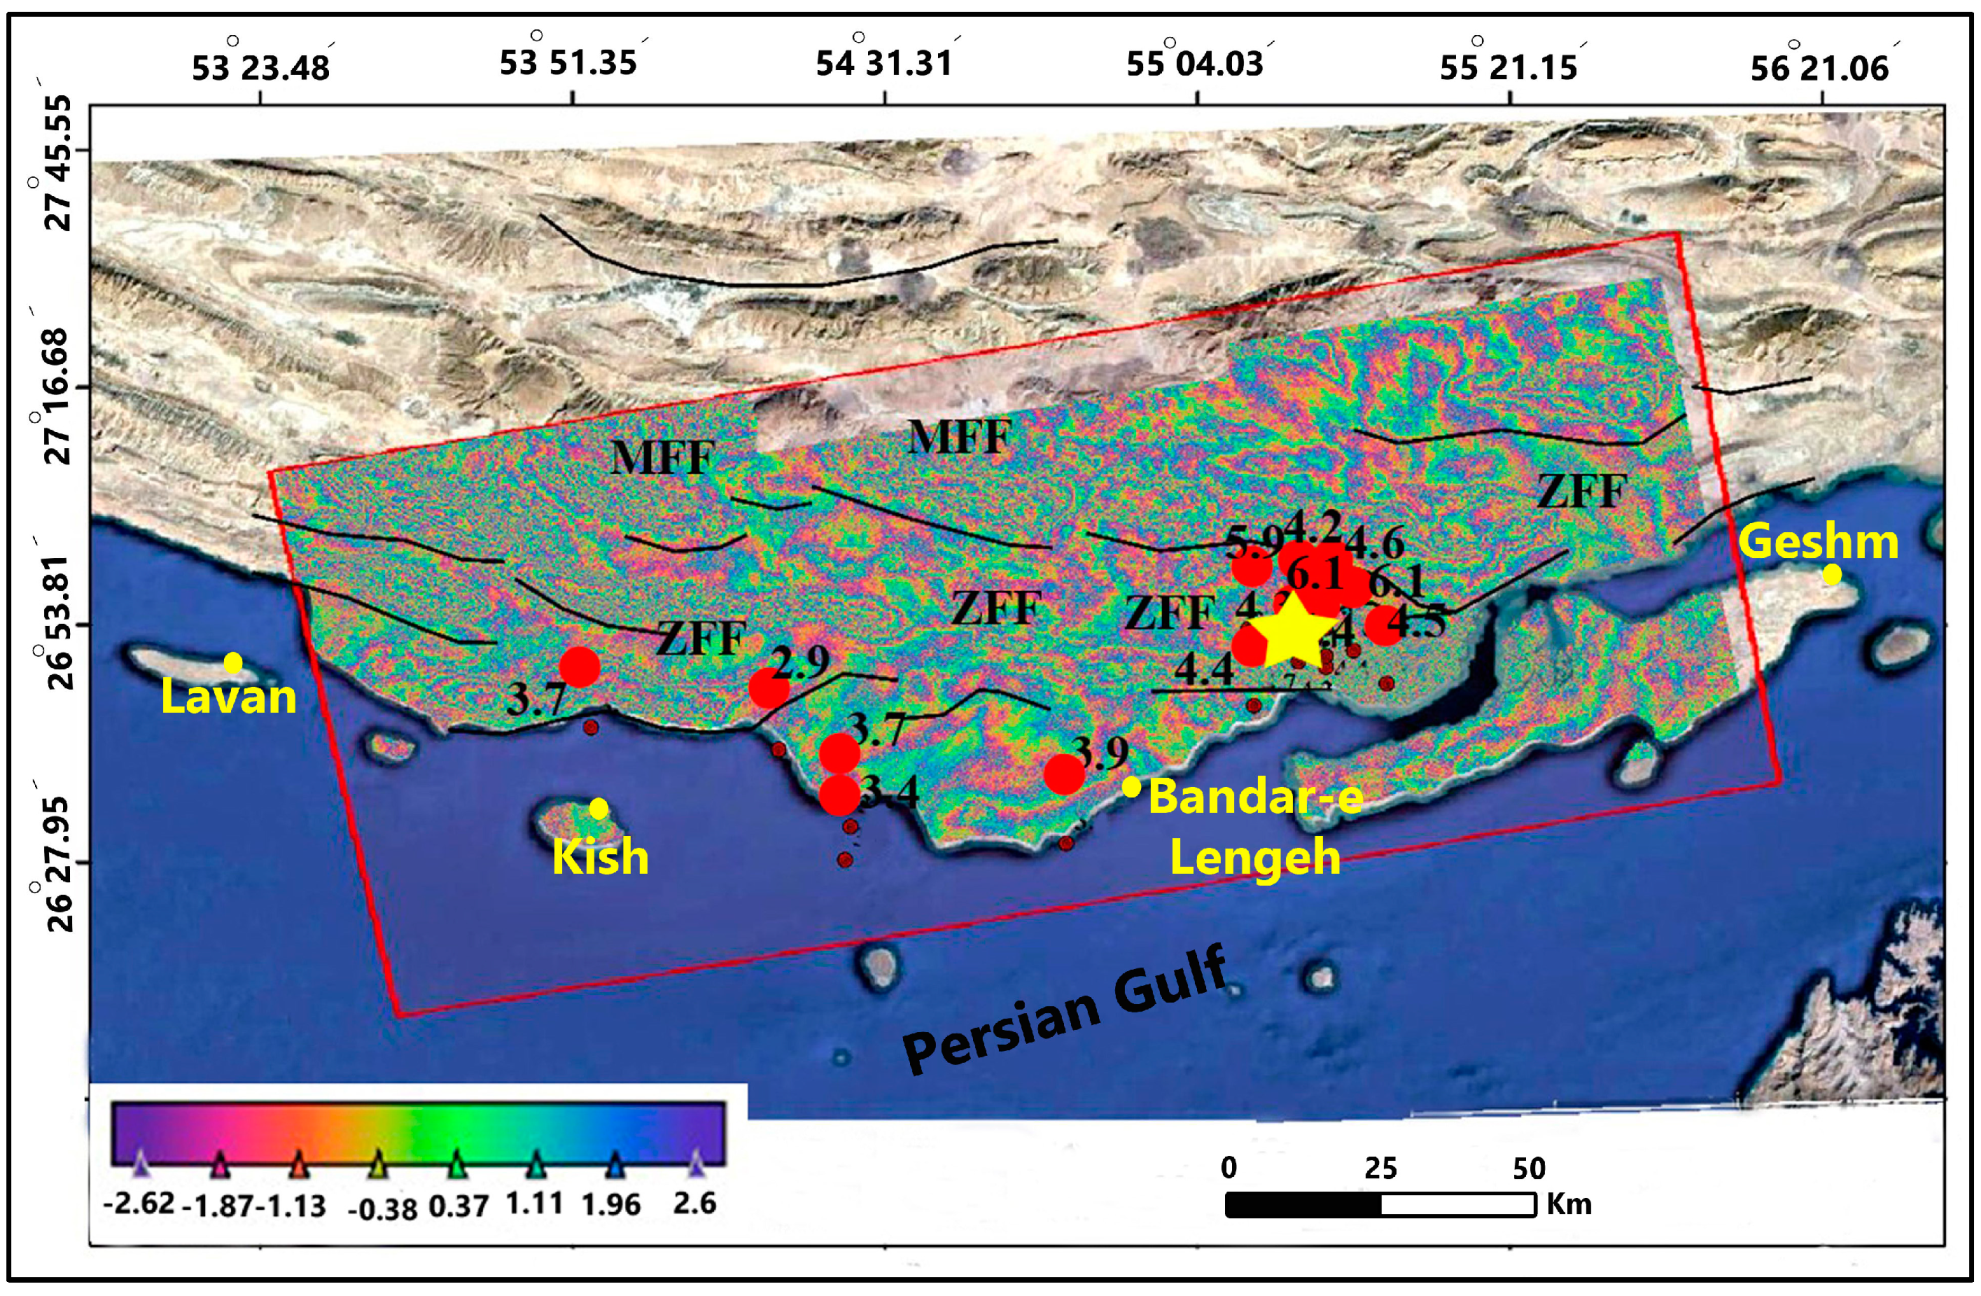
To address the speckle noise present in the data, the Martin Looking method and the Goldstein filter were employed. The Goldstein filter was particularly effective in eliminating image errors. Detailed results of the applied filters can be observed in
Figure 4 and
Figure 5.
3.1. Generation of Vertical Displacement Map Resulting from the Earthquake in the First Period
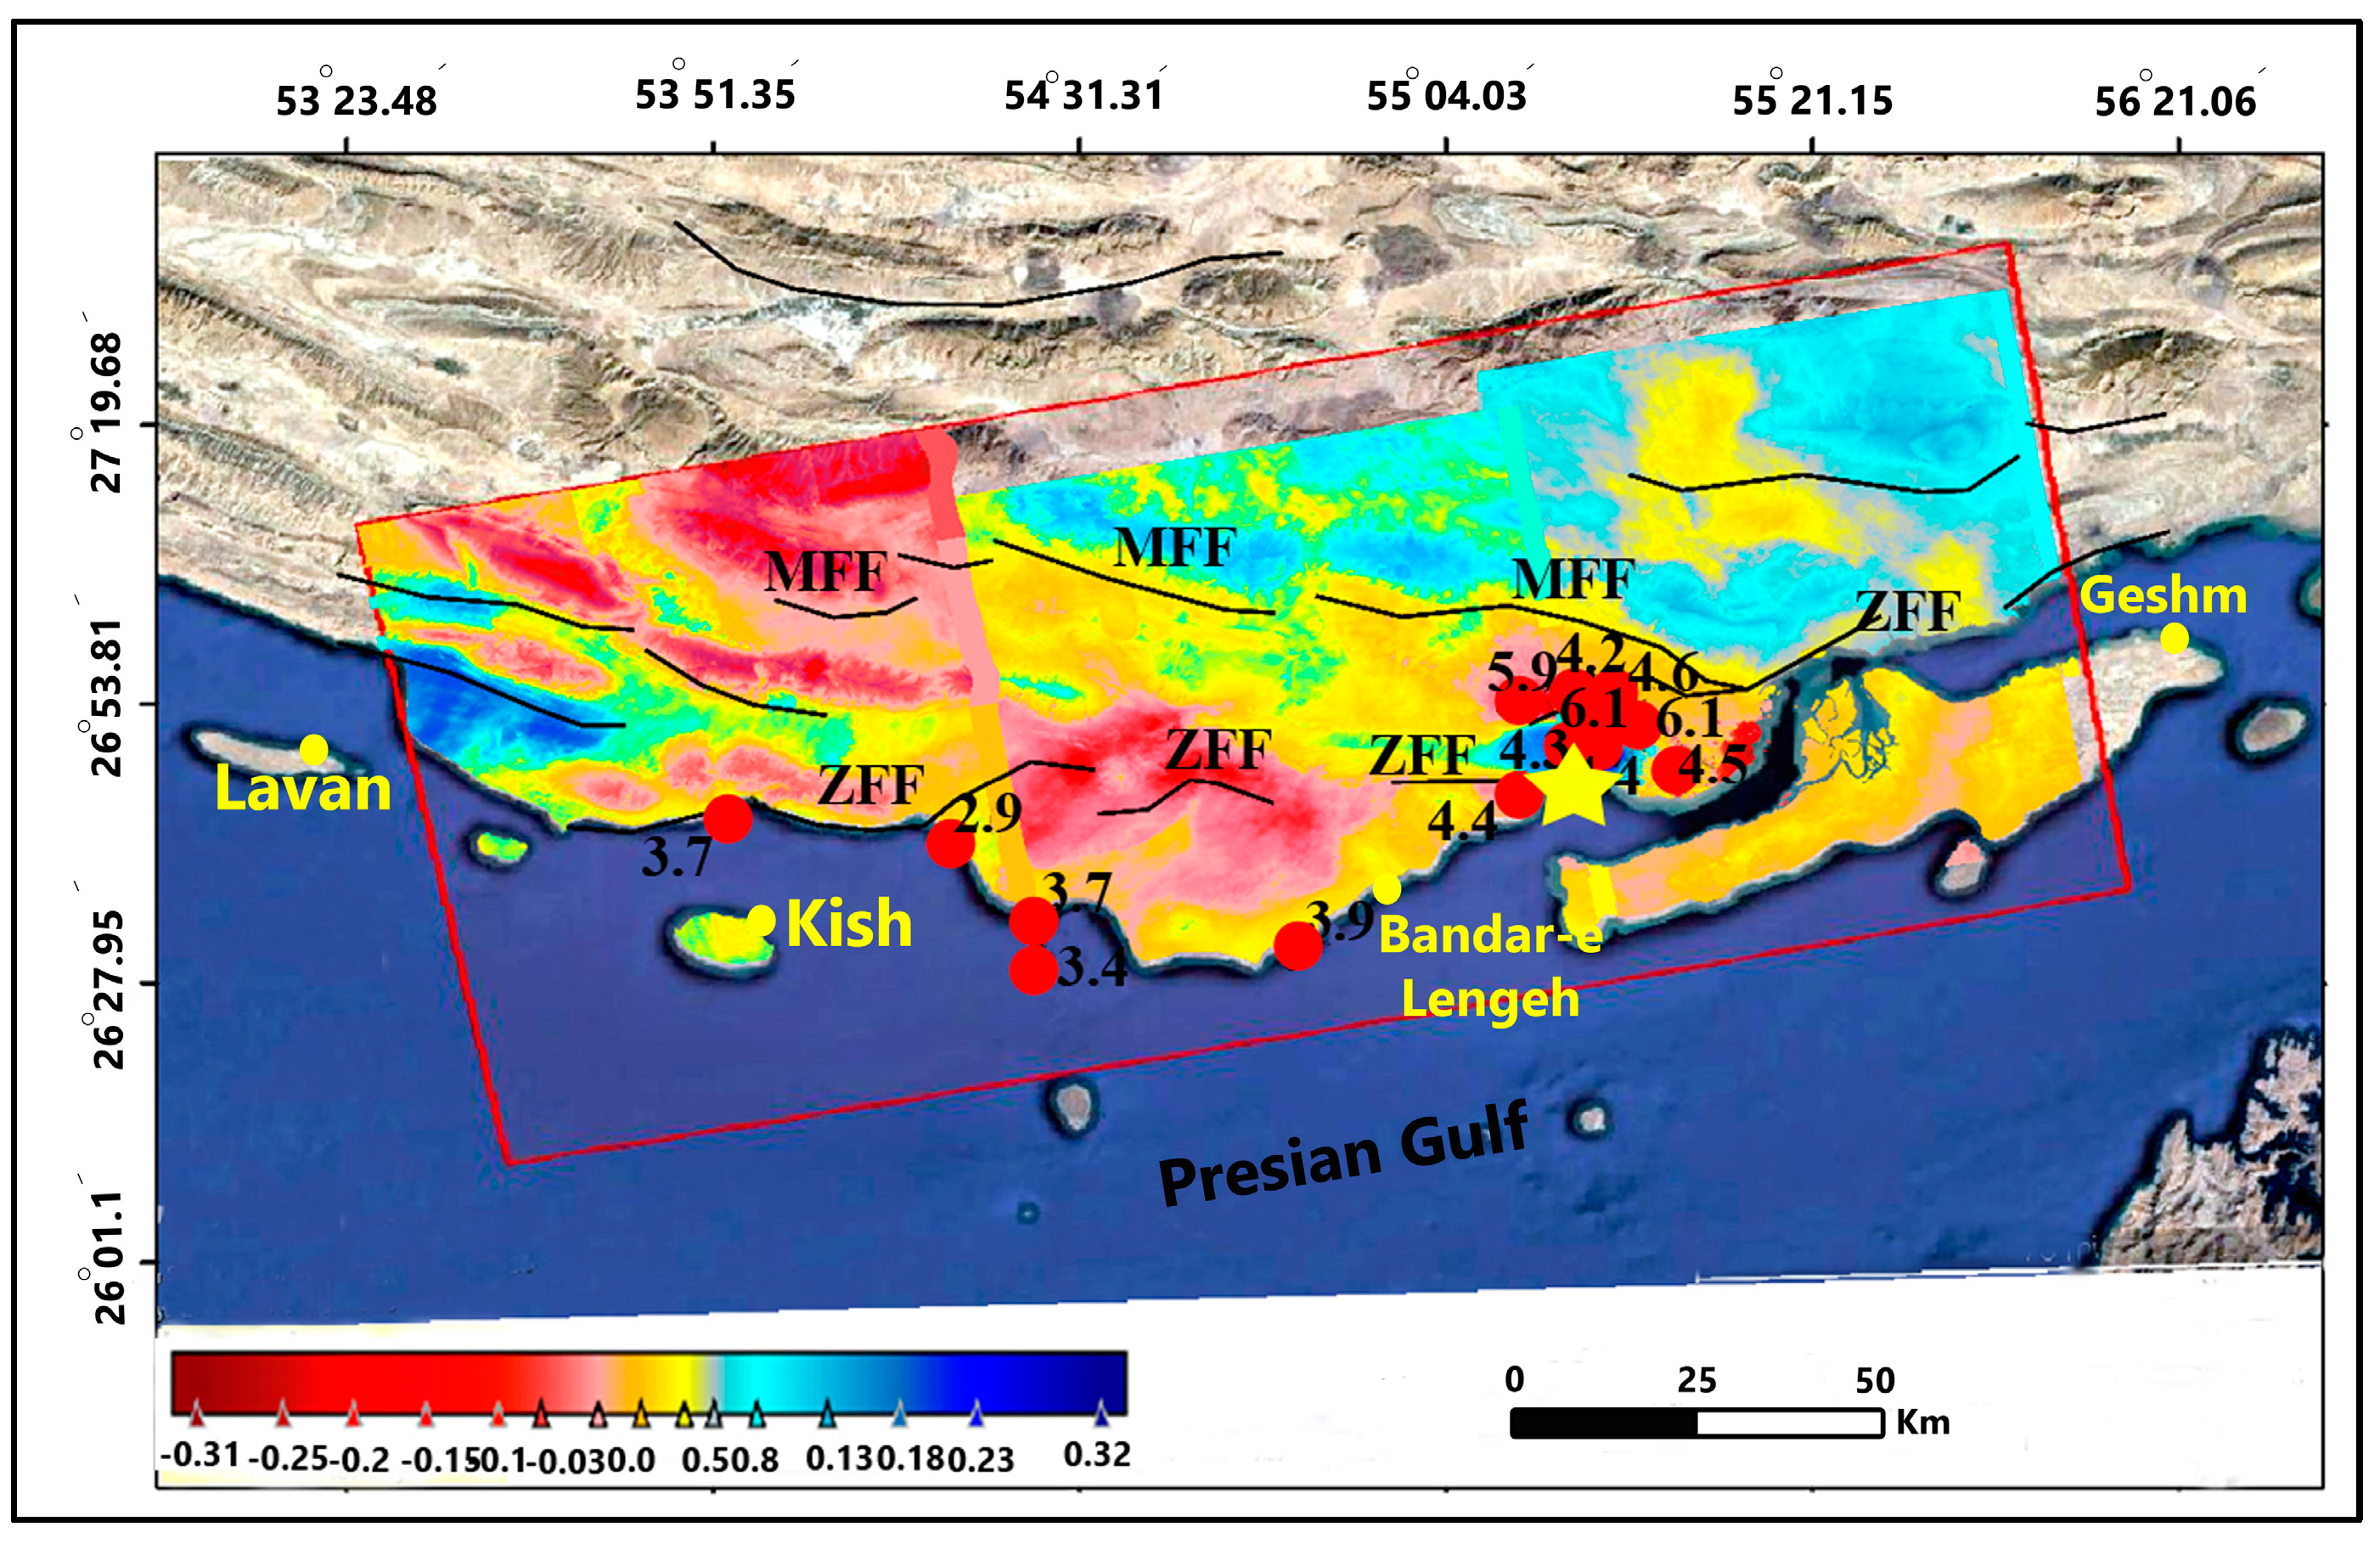
After applying the Martin-Looking and Goldstein filters to the interference map image and correcting any potential errors, the displacement calculation image is prepared. However, before conducting this operation, there is a challenge in accurately determining the number of phase cycles due to the 2π scale interference map. To address this issue and calculate in centimeters, the unwrapping phase method was employed. Following the application of the de-ambiguation filter to the vertical displacement map of the earthquake area, the phase to displacement tool was utilized. Detailed results of this analysis are depicted in
Figure 6.
Based on the research conducted between 06/22/2022 and 07/04/2022, the analysis reveals significant findings regarding the vertical displacement caused by earthquakes. The results indicate a maximum subsidence of 12 cm, depicted in shades of red to pink. Conversely, the maximum uplift of 14 cm is predominantly observed in the vicinity of Bandar Khamir, represented by warmer colors. The primary focal point of the earthquake is highlighted in blue. Additionally, areas depicted in yellow indicate no visible changes in displacement.
3.2. Analysis Results of Radar Image Processing during the Second Period
During the second phase of this investigation (from 07/04/2022 to 07/16/2022), our focus shifted towards analyzing the displacements resulting from the earthquake and its subsequent aftershocks. Two Sentinel-1 radar images were carefully examined to provide insights into these phenomena. Similar to the initial period, the first step involved calculating the phase of the image. Subsequently, topography and noise effects were mitigated through the application of Martin Lucking and Goldstein speckle filters, following the same procedure as before. The outcomes of this analysis are visually represented in
Figure 7,
Figure 8 and
Figure 9.
3.3. Generation of the Vertical Displacement Map for the Second Earthquake
After applying the Martin-Looking and Goldstein filters to the interference map and utilizing the disambiguation filter to rectify any potential errors, the displacement map for the second period was generated following the same procedure as in the first period.
Figure 10 showcases the detailed outcomes of this analysis.
According to the results obtained in the second period of the research, spanning from 07/04/2022 to 07/16/2022, the maximum amount of subsidence caused by earthquakes reached 31 cm, represented by shades of red to pink in the map. The highest amount of uplift, reaching 32 cm, was predominantly observed around Bandar Khamir and the northern parts of the region, indicated by the blue color. Areas displayed in yellow on the map showed no visible displacement changes.
These findings highlight that the displacements caused by the earthquake during the 15-day period following the event were significantly greater compared to the initial days of the earthquake. The quantification of vertical ground displacement using radar interferometry and Sentinel-1 images demonstrates the potential of this method in conducting detailed risk studies.
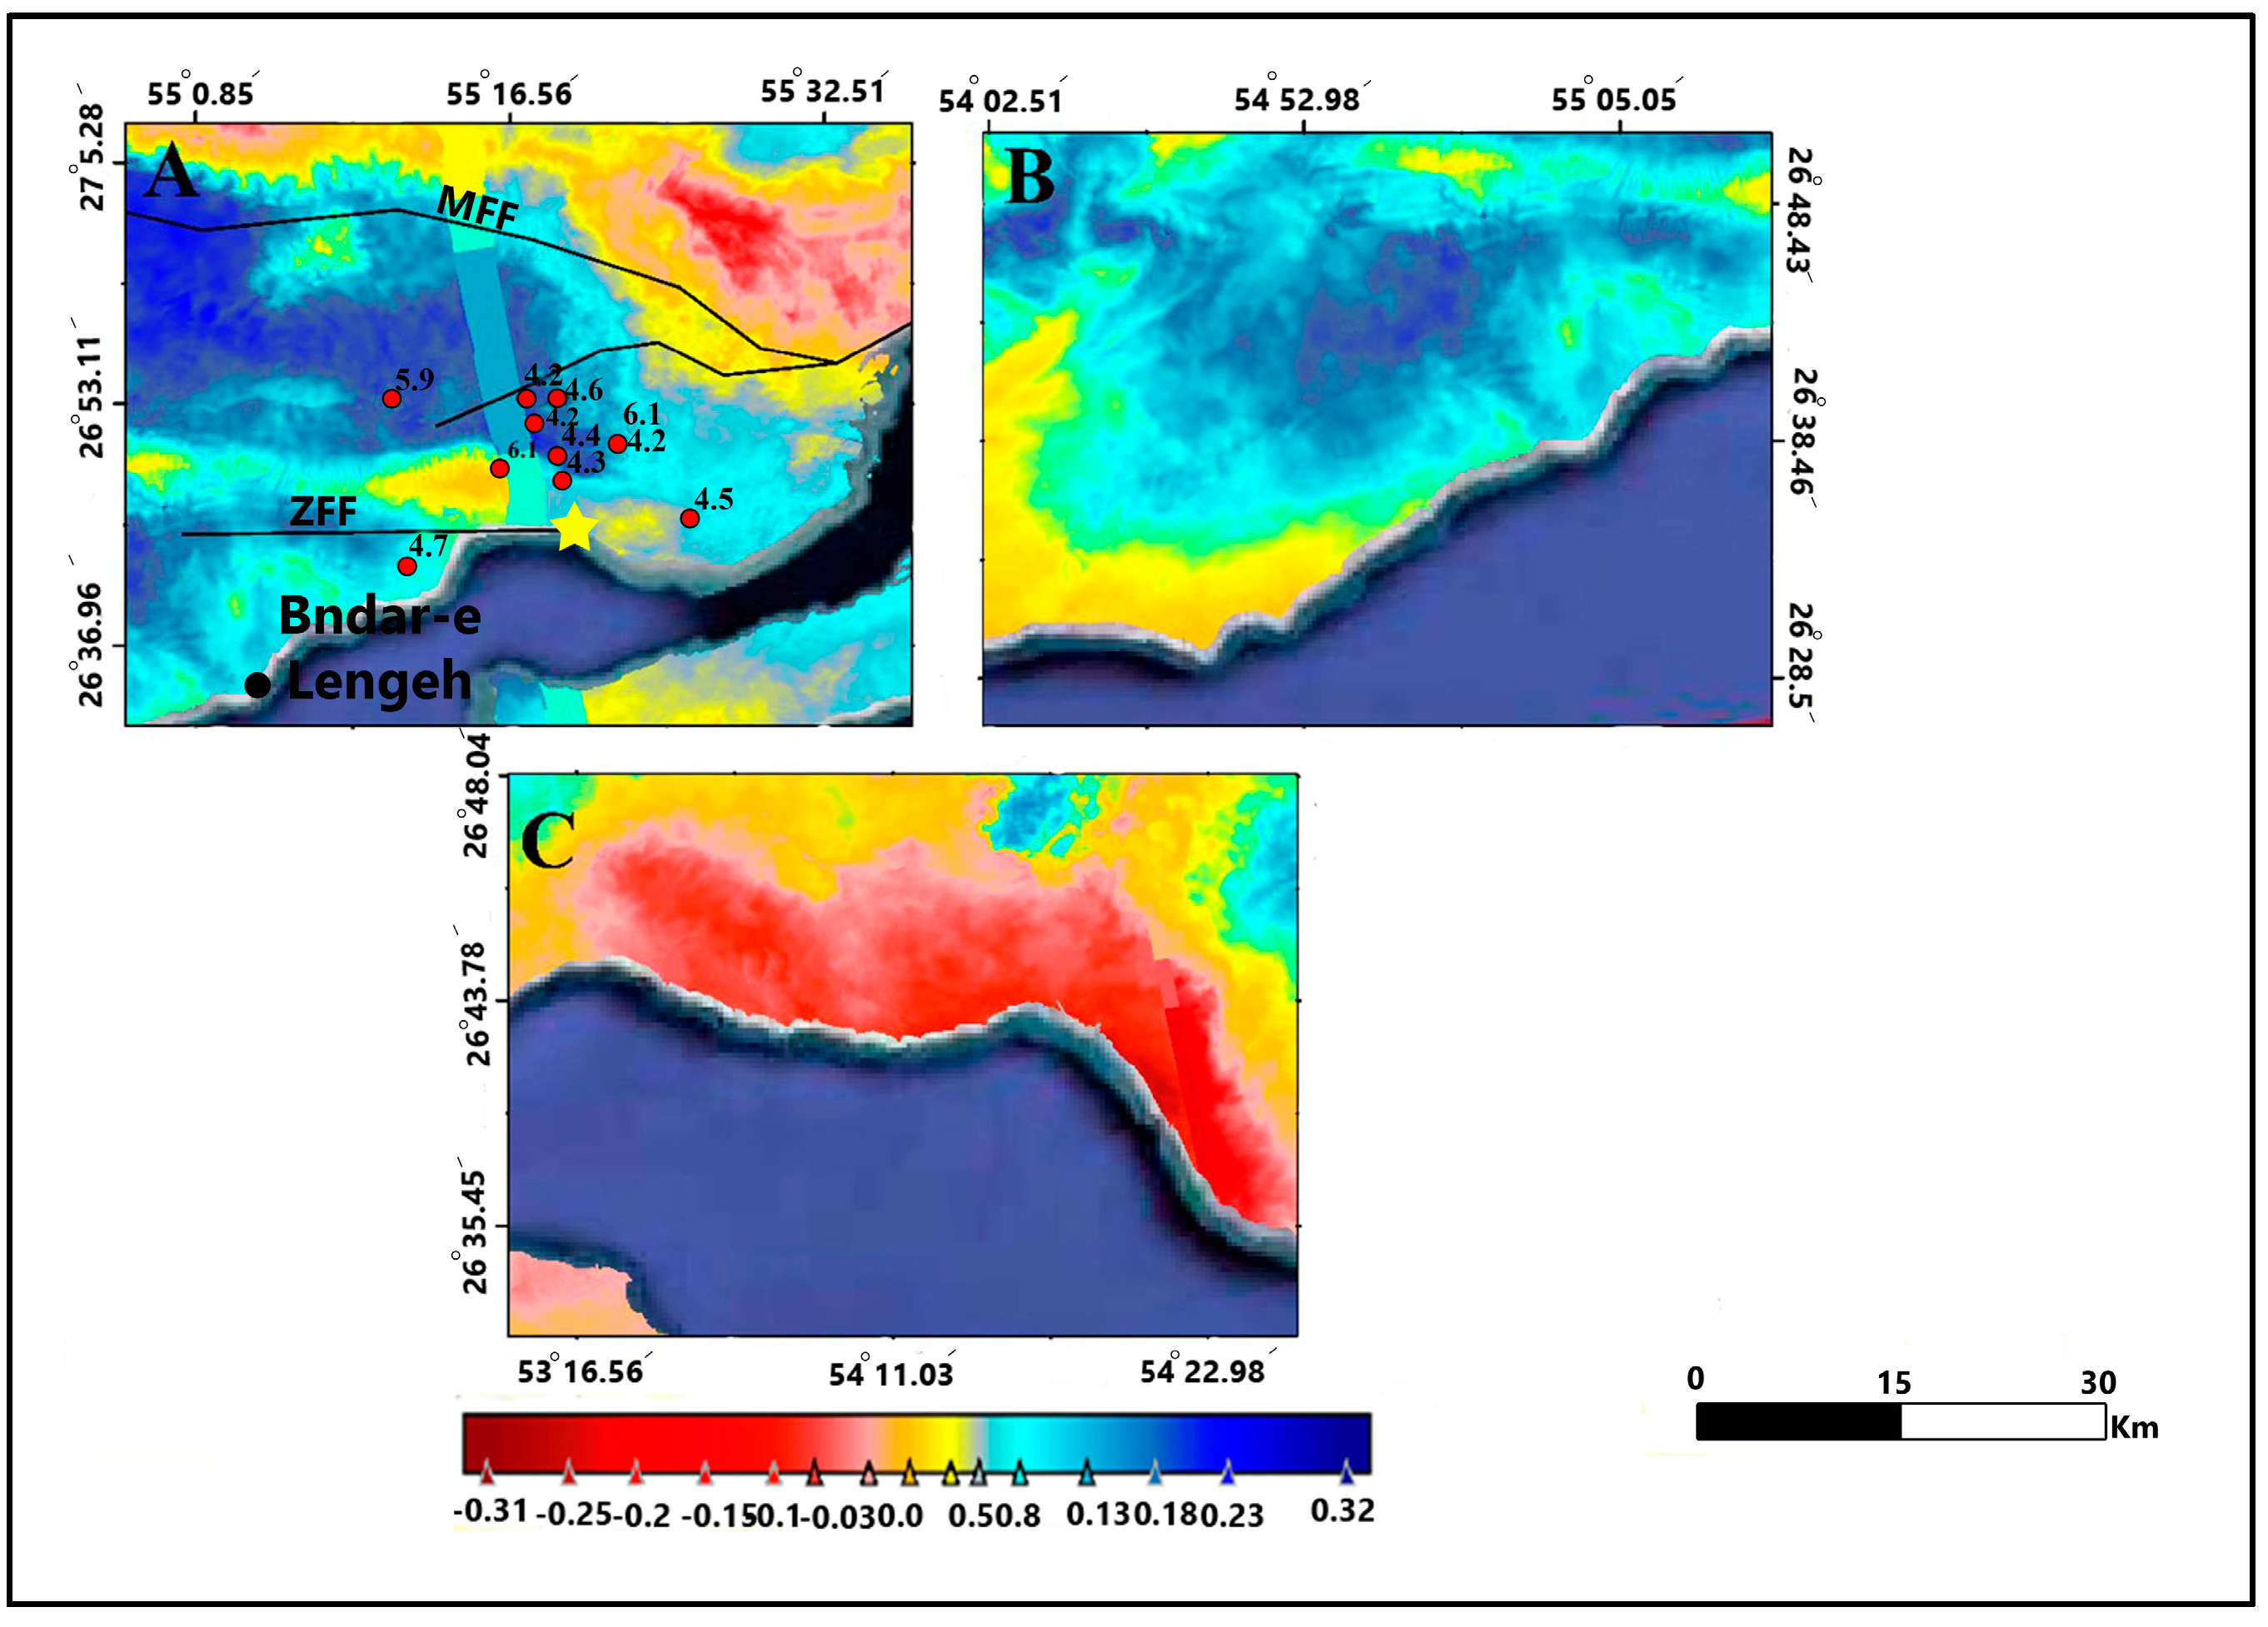
The results from the first period of this study, which examined the two days following the earthquake, indicate that the area around Bandar Khamir (A) experienced an uplift of approximately 14 cm, with a similar uplift observed near Bandar Lange (B). Conversely, earthquakes in the vicinity of Bandar Charak (C) resulted in ground subsidence of approximately 12 cm.
Figure 11 provides a comprehensive visualization of these detailed investigation results.
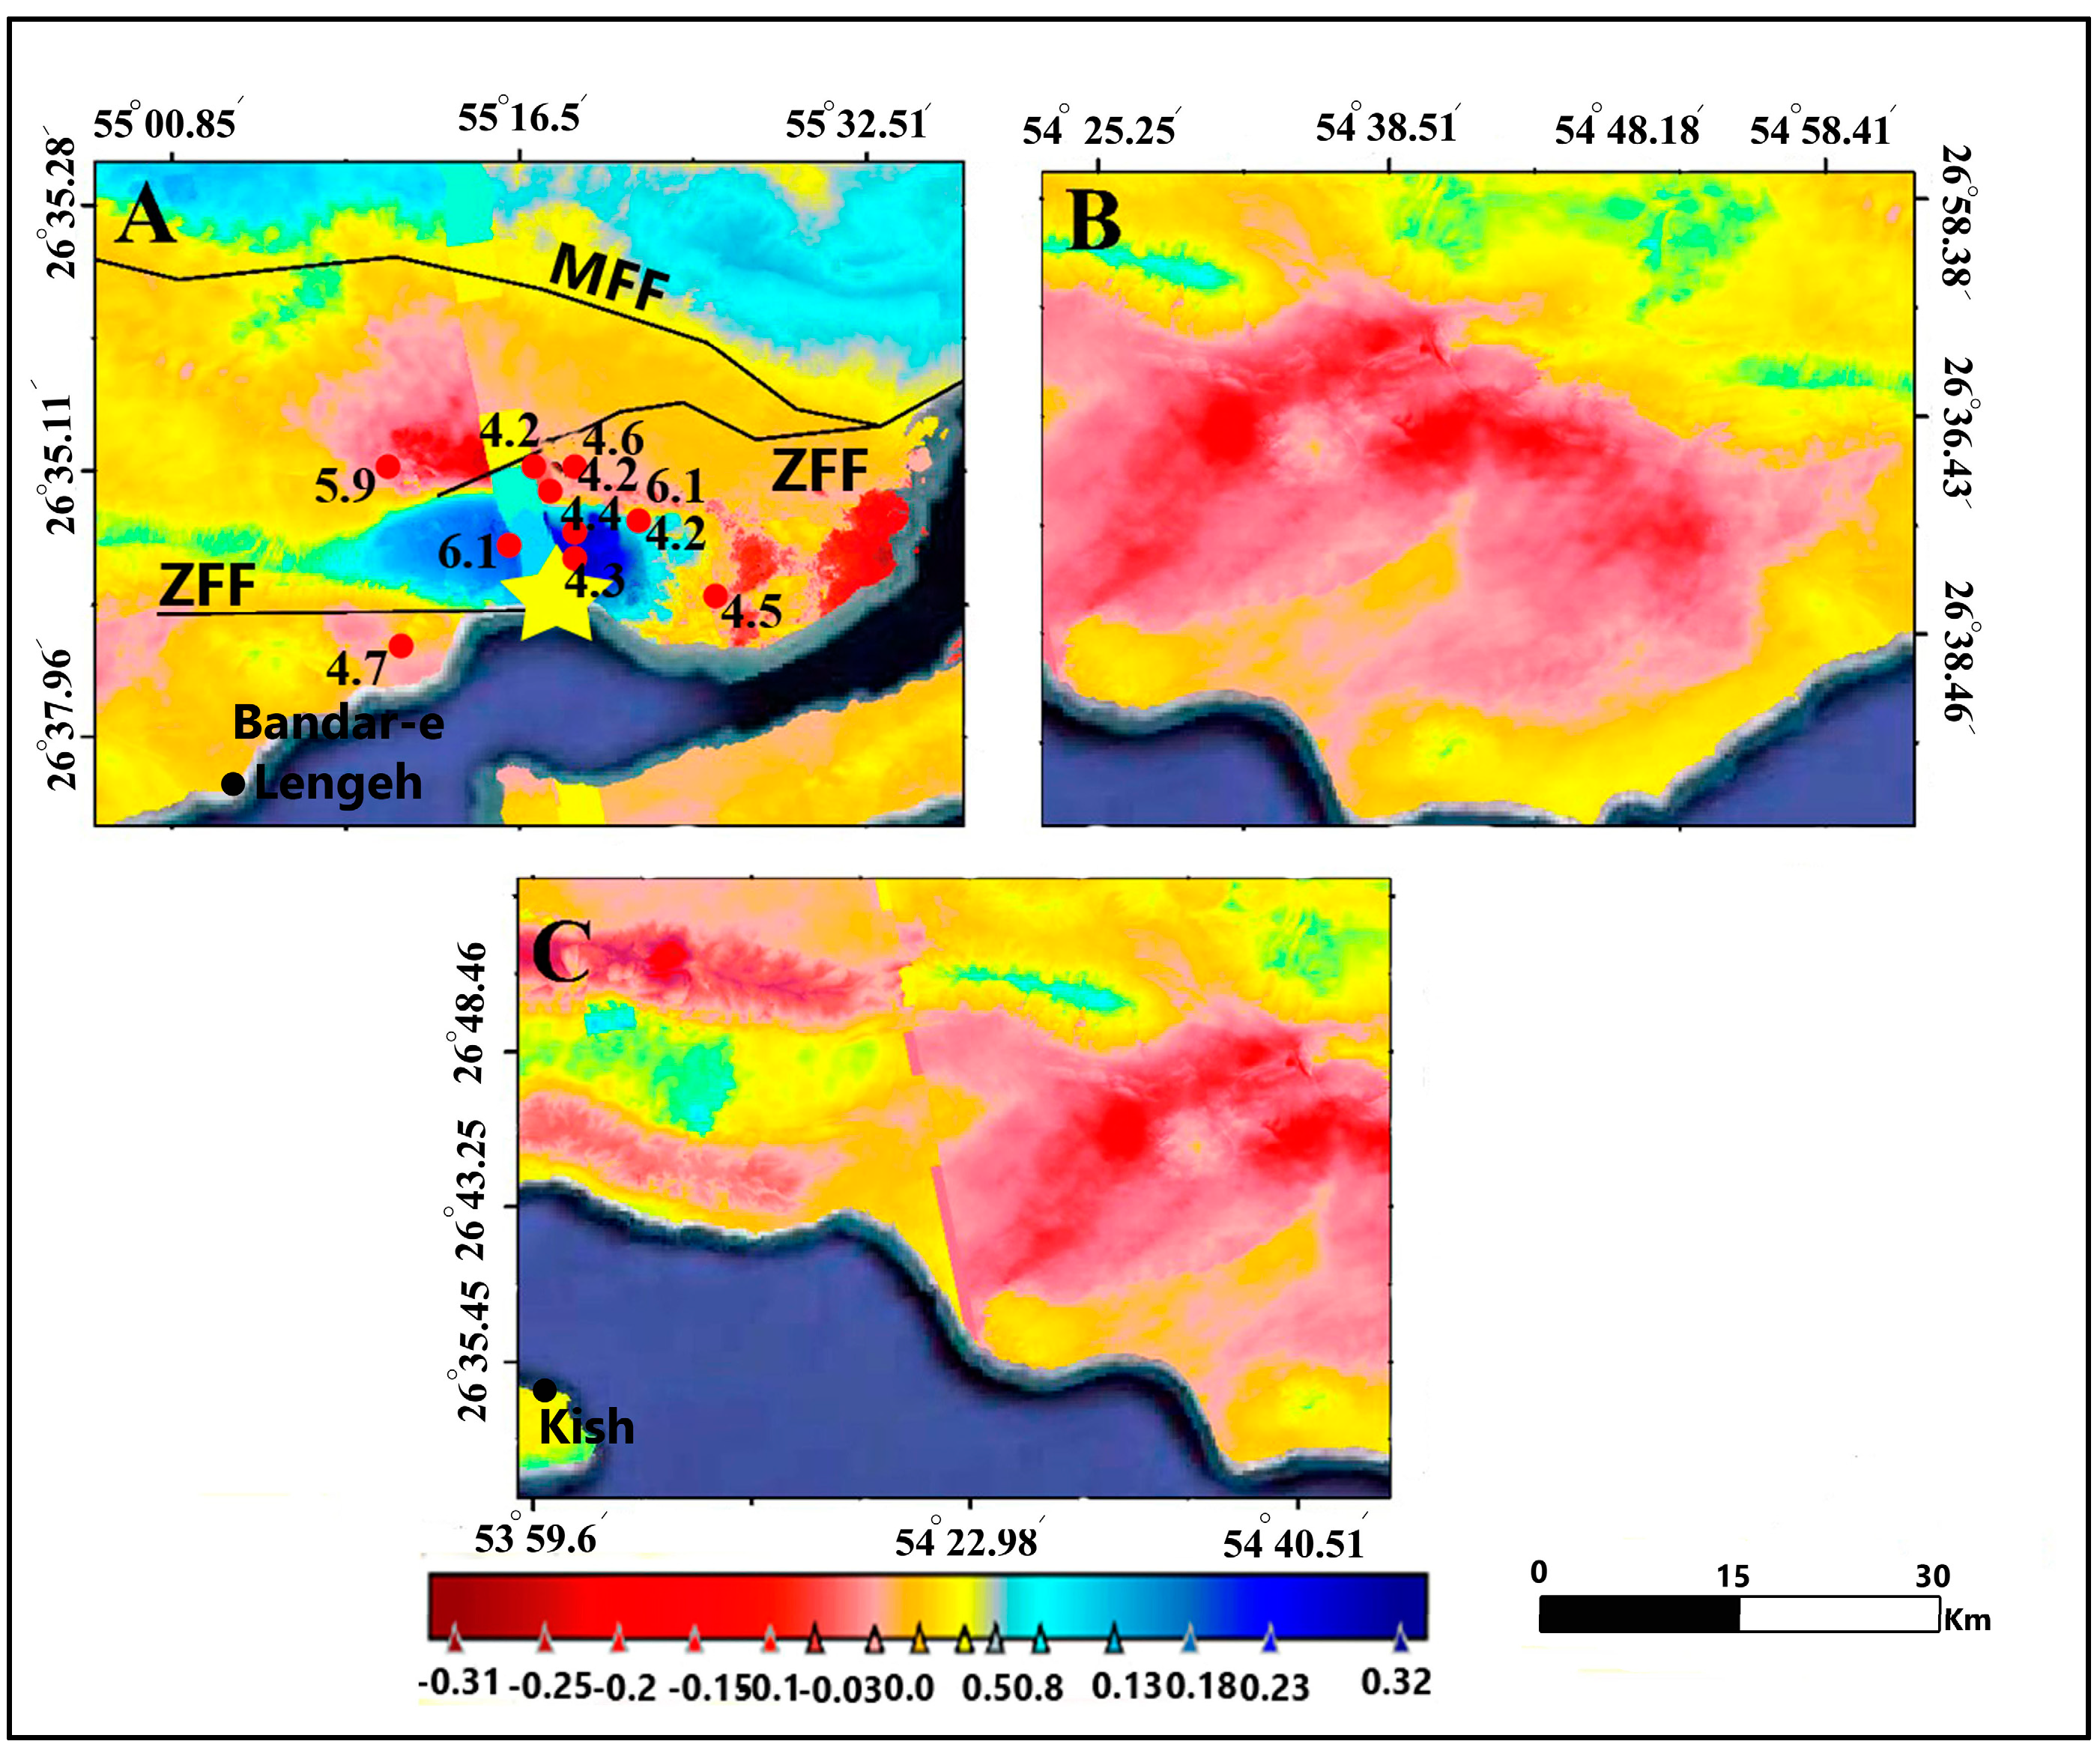
In the second period (11 days after the earthquake), a broader investigation was conducted to analyze the extent of displacement caused by the earthquake. The results revealed more significant displacements compared to the initial period.
This study unveiled an uplift of up to 32 cm near Bandar Khamir (A), while the eastern and northern regions of Bandar Khamir experienced subsidence of up to 31 cm. In the vicinity of Bandar Lange (B), which previously exhibited partial uplift, a subsidence of 31 cm or less was observed, mainly in the northern area. Furthermore, the investigations around Bandar Charak (C) indicated greater subsidence in the east and north compared to the previous period. The detailed results of this analysis can be seen in
Figure 12.
Based on the received images (two Sentinel-1A low-pass radar images acquired between 22/06/2020 and 04/07/2020), an interferogram was generated to analyze the concurrent coseismic changes. The interferogram comprises an image captured before the main shock and another image captured after the main shock. It reveals a deformation field along the fault, displaying a considerable area of subsidence and a smaller area of uplift along the satellite’s line of sight (
Figure 11). Positive values in the interferogram indicate displacement towards the satellite (uplift), while negative values indicate displacement moving away from the satellite (subsidence). By analyzing the phase difference of the radar image, the displacement, and deformation of the Earth’s crust were estimated to be approximately 14 cm uplift around Bandar Khamir and approximately 12 cm subsidence around Bandar Charak Park.
The seismic cycle of an earthquake can be divided into three distinct phases: interseismic, coseismic, and post-seismic stages. During the interseismic phase, tectonic plates experience relative motion, accumulating energy while the fault remains locked. Once the accumulated energy reaches a critical threshold, the fault undergoes rupture, resulting in a seismic event and gradual release of the stored energy. Post-earthquake deformation encompasses the response and adjustment of the crust and upper mantle to these changes, providing valuable insights into the rheological properties of the lithosphere. The temporal and spatial distribution of post-earthquake deformation exhibits significant variations, ranging from short-term effects spanning days to months to long-term effects lasting hundreds of years [
31,
32]. This deformation can occur on local scales, affecting areas within a few kilometers of the seismogenic fault [
33] or on a global scale [
34].
Three commonly employed models are used to describe post-earthquake deformation: afterslip [
35], the coupling effect between the lower crust and upper mantle with viscoelastic relaxation properties [
28], and the pore rebound effect of the crustal porous medium [
36]. Each of these mechanisms operates in different spatial and temporal domains following an earthquake. An afterslip, driven by inertia, occurs as the fault continues to slide in the coseismic direction, playing a significant role in the immediate aftermath of the earthquake. Poroelastic rebound, similar to afterslip, primarily manifests in the upper crust and exhibits deformation trends opposite to those observed during the coseismic phase [
33,
35]. The viscoelastic relaxation effect arises from stress changes between the lower mantle and upper crust, contributing to long-term post-seismic deformation, particularly pronounced in the far field [
35]. Considering these factors, we can deduce that short-term viscoelastic relaxation was not the predominant post-seismic deformation mechanism in this earthquake.
In the aftermath of an earthquake, the gradual dissipation of accumulated energy often leads to main shocks and post-seismic events, impacting surrounding faults and causing deformation in neighboring fractures, consequently triggering aftershocks. To assess the influence of post-earthquake effects on surrounding faults, we employed Radar Interferometry techniques, specifically InSAR, to obtain the deformation field subsequent to the earthquake. Given the proximity of the earthquake epicenter to the ZFF near Bandar Khamir (
Figure 1), our focus centered on studying the post-earthquake deformation in this particular area. The time span of the post-earthquake images ranged from 04/07/2022 to 16/07/2022.
Our findings revealed a prevalent uplift in the vicinity of Bandar Khamir, with a maximum uplift of 32 cm (
Figure 12). Conversely, significant subsidence, reaching up to 31 cm, was observed in the eastern and northern regions of Bandar Khamir, indicating compression between the two faults. The post-earthquake deformation primarily manifested along the fault, signifying stress changes resulting from the coseismic rupture. Moreover, the deformation pattern during the post-seismic phase closely mirrored that observed during the coseismic phase, leading us to exclude the poroelastic rebound effect as a major contributor. Consequently, we tentatively conclude that the dominant post-earthquake deformation mechanism was predominantly afterslip. Additionally, the distribution of aftershocks correlated with areas exhibiting higher levels of deformation (
Figure 12).
In the final maps related to the displacement resulting from interferometric processing, positive values always mean a decrease in the distance of the sensor to the Earth’s surface, or in other words, an elevation of the Earth’s surface and negative values are interpreted as the opposites of this process, i.e., a decrease in the Earth’s surface in the direction of the satellite view. The highest amount of displacement has been observed in the form of positive changes (uplift) in the epicenter of the earthquake. As can be seen in
Figure 12, the displacement difference started from the epicenter of the earthquake, which has the highest subsidence between −12 and −14 mm, and in the south of this region, it has experienced the highest rise in the amount of 31 to 32 mm.
4. Conclusions
In conclusion, the accurate and timely recognition of phenomena with potential risks to human societies is of utmost importance for their analysis, control, and management. In this context, radar interferometry emerges as a valuable technique utilizing the interference of electromagnetic waves to extract information and estimate crustal deformation. This technique has demonstrated its effectiveness in assessing ground surface displacement resulting from earthquakes and determining the earthquake epicenter. While earthquake prediction remains elusive, radar images generated through interferometry offer a comprehensive map of affected areas and crucial insights for understanding the environment and identifying the fault systems responsible for the seismic activity.
Interferometry is the technique of using electromagnetic wave interferometry to extract information. Radar interferometry, using the even phase difference of the radar image with high spatial resolution, seeks to produce a digital height model of the area and estimate the displacement of the Earth’s crust. One of the important applications of this technique is the estimation of ground surface displacement due to earthquakes and earthquake focus.
The primary objective of this study was to evaluate the vertical displacement caused by recent earthquakes over two distinct periods, employing Sentinel-1 images and radar interferometry. The results revealed that the initial displacements triggered by the earthquakes continued significantly in the days following the events. Specifically, within two days of the earthquake, the region surrounding Bandar Khamir exhibited an uplift of approximately 14 cm, extending towards Bandar Lengeh. Conversely, earthquakes near Bandar Charak resulted in subsidence of around 12 cm. Eleven days after the earthquake, the vicinity of Bandar Khamir experienced a prominent uplift of 32 cm, while nearby areas demonstrated subsidence of up to 31 cm. These findings underscore the critical role of interferometry as a reliable technique for comprehending the effects of earthquakes and assessing their impact on the Earth’s surface.
By enabling precise measurement and visualization of ground deformations, radar interferometry equips scientists and decision-makers with essential tools for understanding earthquake dynamics and their consequences. The information derived from this technique enhances our ability to evaluate and mitigate the effects of seismic events, contributing to more effective disaster management strategies. Continued advancements in interferometry and its integration with other geospatial technologies hold great potential for furthering our understanding of earthquake processes and promoting societal resilience in the face of seismic hazards.
