Article

Surface Condensation Water under Salix psammophila Is the Main Water Source in Addition to Rainfall in the Kubuqi Desert

1
College of Energy and Transportation Engineering, Inner Mongolia Agricultural University, Hohhot 010018, China
2
Ordos City Science and Technology Business Development Center, Ordos 017000, China
3
College of Water Conservancy and Civil Engineering, Inner Mongolia Agricultural University, Hohhot 010018, China
*
Author to whom correspondence should be addressed.
These authors contributed equally to this work.
Water 2023, 15(17), 3098; https://doi.org/10.3390/w15173098
Submission received: 10 June 2023 / Revised: 25 August 2023 / Accepted: 26 August 2023 / Published: 29 August 2023
(This article belongs to the Special Issue Advances in Hydraulic and Water Resources Research)

Abstract

:
Amidst climate change, managing water and vegetation adaptability is vital in ecology and agriculture. Salix psammophila is key in deserts, maintaining ecological balance and combating desertification. Understanding its surface condensation and response to weather is critical for survival. This study aims to investigate the formation patterns of surface condensation water under S. psammophila at different irrigation levels and the influence of precipitation, temperature, relative humidity, and wind speed. Conducted in China’s Kubuqi Desert from June to September 2022, the study employed micro-lysimeters with four irrigation test sets and a control group, conducting detailed observations at various locations. The results indicate that S. psammophila significantly influences surface condensation water by blocking solar radiation and reducing wind speed. The drip irrigation system also regulates surface condensation water on S. psammophila. Moreover, meteorological factors such as 24 h maximum temperature, relative humidity difference, wind speed, and air vapor pressure deficit show significant correlations with surface condensation water formation. In conclusion, this study enhances the understanding of desert ecosystem water balance, vegetation adaptability, and efficient water resource utilization. It provides valuable scientific guidance for the conservation and restoration of desert ecosystems.

1. Introduction

Condensation water is water that condenses on the ground surface during clear, windless, or breezy nights or early mornings when the air temperature near the surface drops below the dew point owing to the radiative cooling of the surface. In arid and semi-arid areas, such as the Kubuqi Desert, which experience little rainfall and have dry weather, condensation water is the main source of water other than rainfall and is important for small organisms such as algae, mosses, insects, and shallow-rooted plants [1]. Condensation water can also compensate for the water lost by evaporation from the soil and is key to maintaining the stability of sand dunes [2,3]. The sources of condensation water are water vapor in the air, water vapor in the soil pore space, and water vapor released by vegetation transpiration [4]. The main meteorological factors affecting water condensation are region-dependent, and those affecting surface water condensation include air humidity near the surface, air temperature, and wind speed [5].
Studies have focused on various aspects related to condensation water, such as the measurement methods, the formation process, related influencing factors, and the ecological significance of condensation water [6,7,8,9]. Researchers in China have investigated surface condensation water in different regions. Bin et al. [10] studied the formation characteristics of condensation water in the Maowusu Sand and its influence on water balance; Xiaohan et al. [11] investigated the characteristics of surface condensation water under different types of sand-fixing shrubs in the Maousu Sandy Area; Zhifeng et al. [12] investigated the source of water vapor in soil condensation in the Guanzhong Plain; Wanpeng et al. [13] investigated the formation characteristics of soil condensate in Cocosi; Qiancheng et al. [14] investigated the characteristics of soil condensation and the source of water vapor in winter deserts; Chunjie et al. [15] explored the evaporative condensation in the Qinghai–Tibet Plateau region; Long et al. [16] investigated the effect of biological soil crust on condensation in alpine sand areas; Rongyi et al. [17] analyzed the formation of soil condensation in the Gurbantunggut Desert; Yanxia et al. [18] discussed the influence of topography on condensation in the Shapotou area; and Bin et al. [19] studied soil condensation in different substrates of the Tarim River.
Condensation water plays an important role in the vegetation growth and ecology of an area, and in turn, plant communities influence the production of condensation water. In the Horqin Sands, the amount of condensation water under the farmland community was found to be much higher than that under the camphor pine community [20]. Furthermore, the amount of condensation water was much higher in the farmland community than in the sphagnum community. It was also shown that the amount at different growth stages of the vegetation differed; it was much lower at the surface when the vegetation was in the late growth stage than when the vegetation was at the vigorous growth stage [21]. Different plants have different effects on condensation water. Compared with that on the bare ground in the Maowusu sand, the amount of condensation water under S. psammophila, Caragana korshinskii, and Artemisia ordosica was reduced by 29%, 32%, and 33%, respectively [11]. This indicates that vegetation is an important factor influencing condensation water production; however, related research is relatively scarce, and the effects of vegetation on condensation water production warrant further in-depth studies.
The Kubuqi Desert in the northwestern part of the Inner Mongolia Autonomous Region is a typical arid and semi-arid region, which is a key area in the transition from the northwestern arid zone to the eastern humid zone, with a single vegetation and few biological species, and is one of the key areas where wind and sand disasters frequently occur in China. Therefore, the study of desertification control and vegetation ecology in this region is very representative. The pioneer tree of the Kubuqi Desert, S. psammophila, is a native tree preserved under the natural conditions of desertification soil and severe soil erosion in the Ordos, with the characteristics of cold resistance, heat resistance, drought resistance, strong resistance to adversity, easy reproduction and high economic value, and its research has high ecological value.
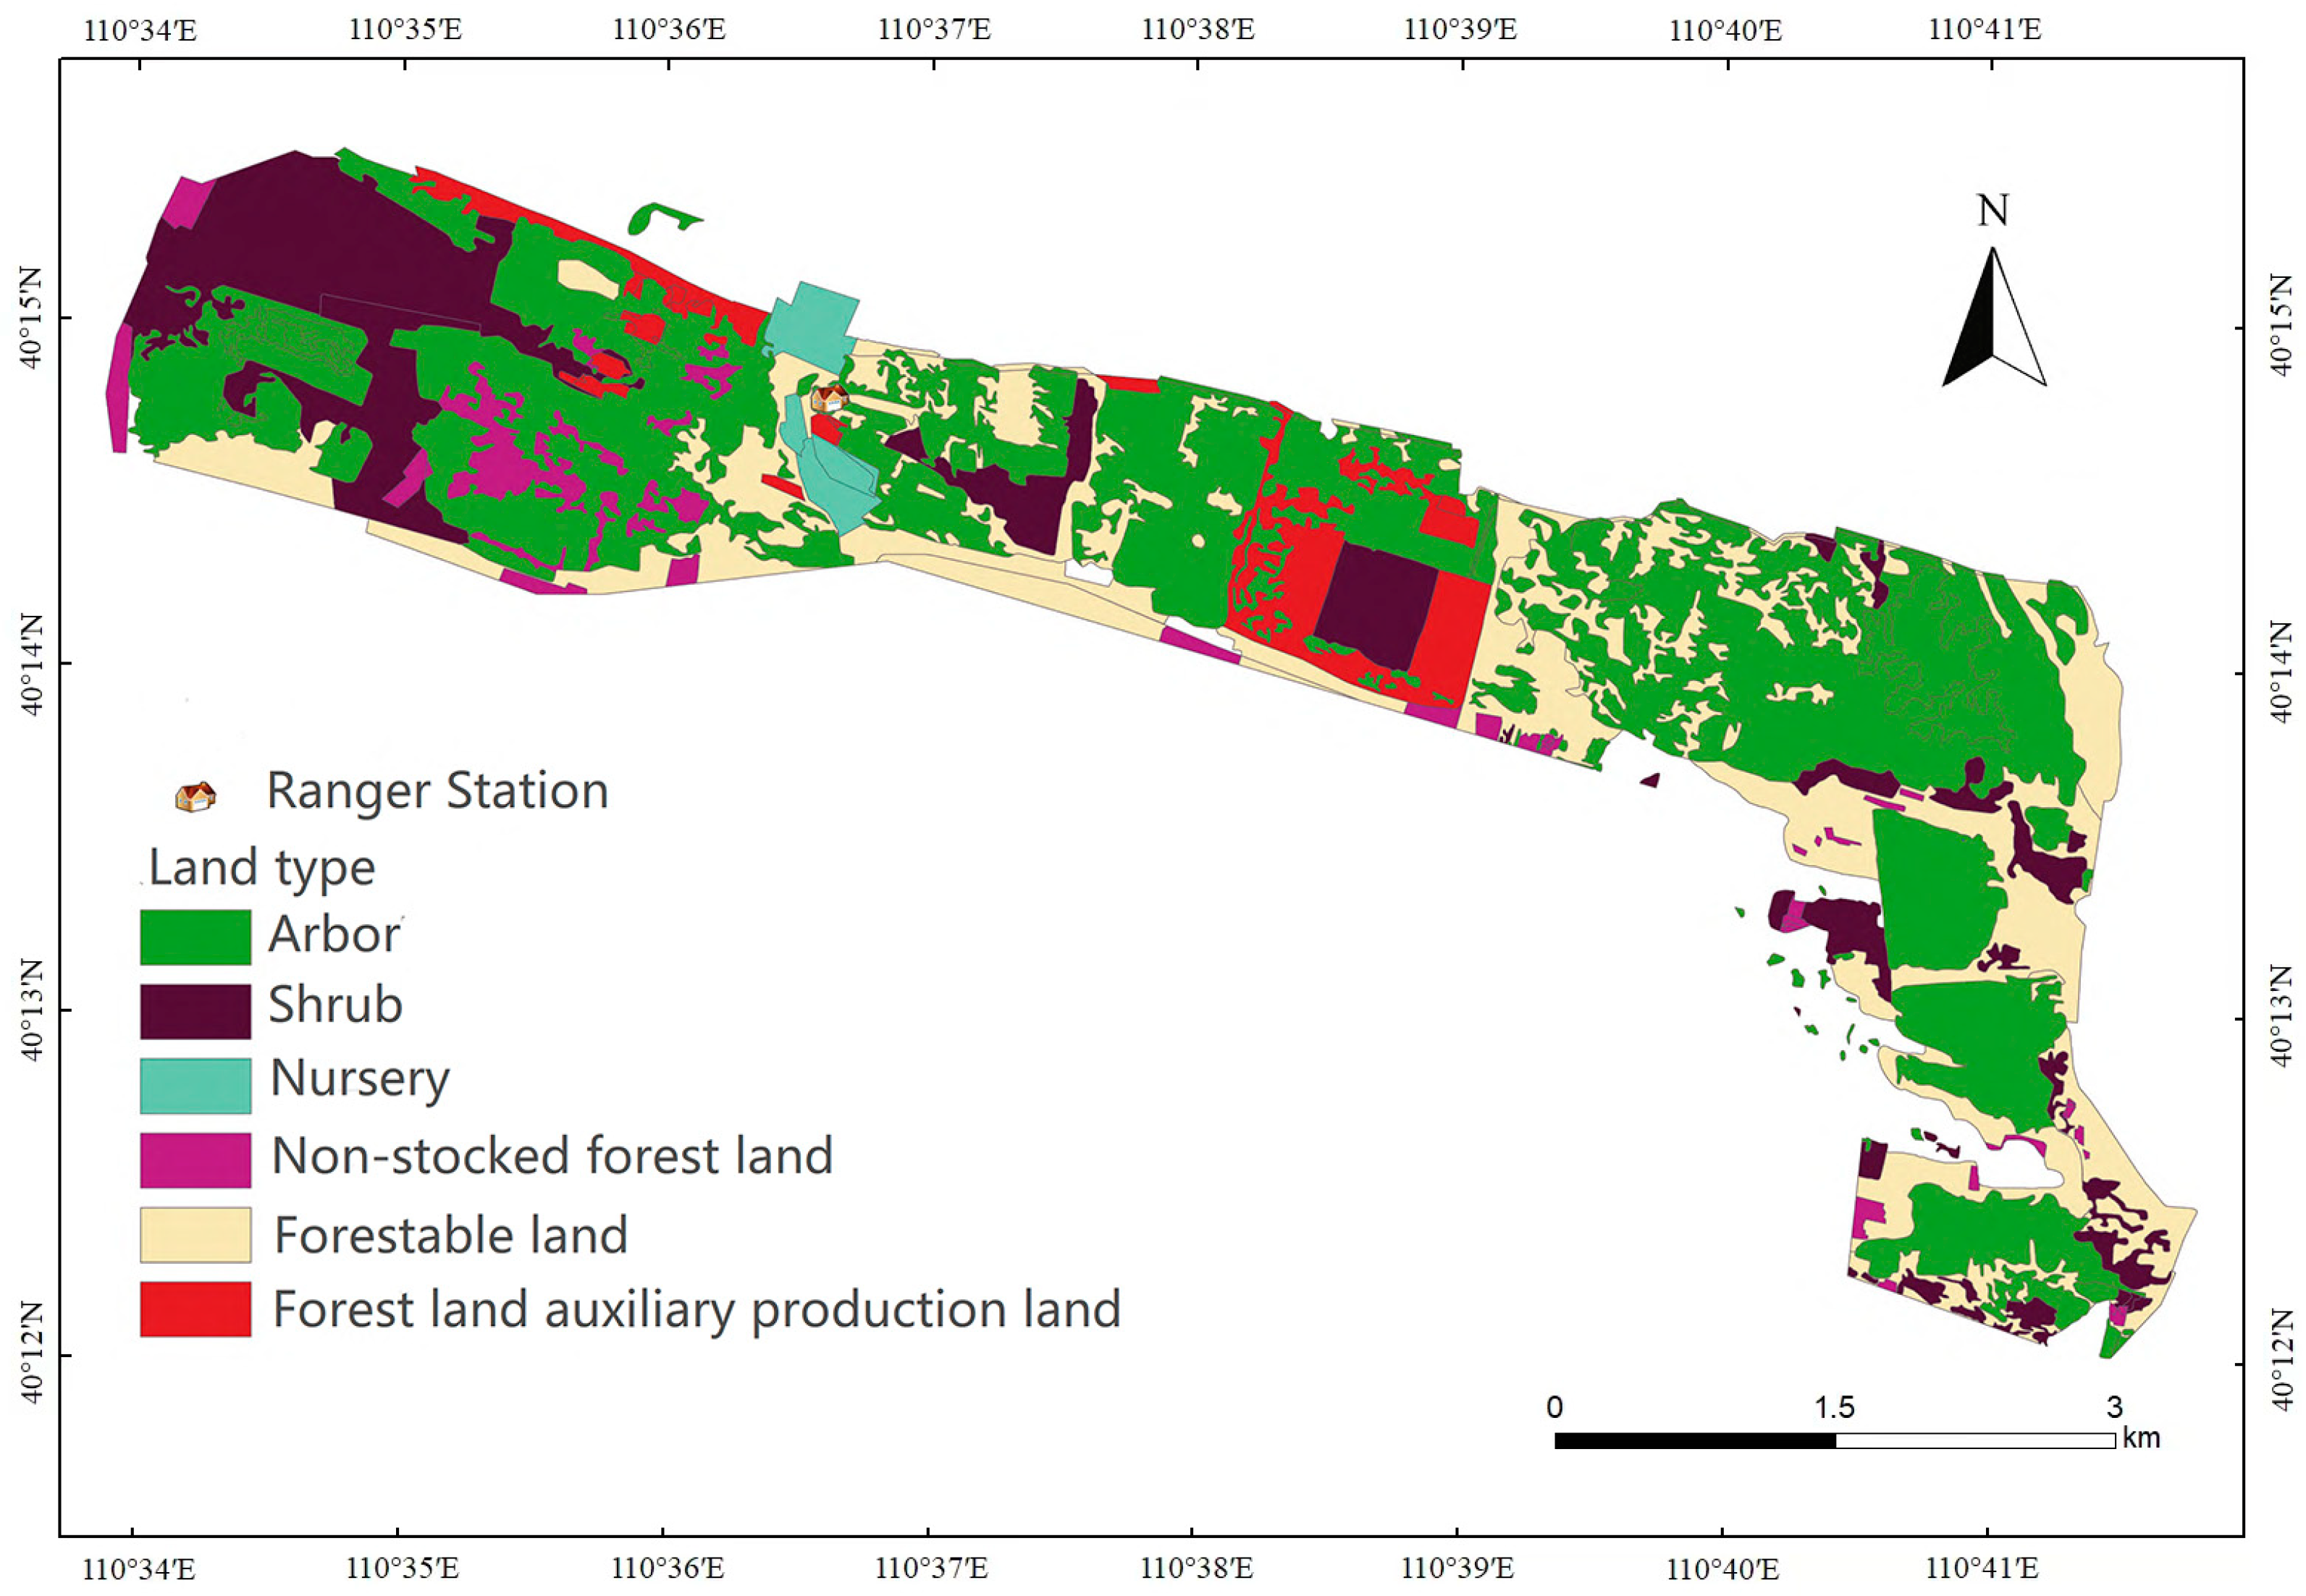
The S. psammophila holds significant importance in desert ecosystems. As a plant well-adapted to desert environments, the S. psammophila plays a crucial role in desert protection, soil conservation, and ecological restoration. Firstly, its root system possesses strong sand fixation capabilities, effectively mitigating wind erosion and preventing the displacement of desert soil. The complex root network firmly anchors sand dunes and desert areas, forming sand islands that contribute to windbreak and sand stabilization. Secondly, the S. psammophila plays a vital role in regulating the water balance of desert ecosystems. Through transpiration, it releases substantial amounts of water, creating a microclimate and providing precipitation conditions, which serve as a water source for surrounding plants and animals, maintaining the balance of the ecosystem. Figure 1 represents the experimental site of the S. psammophila in this study.
Furthermore, as a significant component of vegetation in desert regions, the sand willow is essential for maintaining vegetation diversity and ecological integrity. It provides a habitat and a food source, offering crucial protection and living conditions for many desert organisms. In conclusion, as one of the key plants in desert ecosystems, the sand willow is irreplaceably vital for desert ecological restoration, environmental protection, and biodiversity maintenance.
Based on the above discussion, we investigated the characteristics of surface condensation water under S. psammophila under different irrigation amounts and the influence of meteorological factors on condensation water using a micro-lysimeter (ML) in the Kubuqi Desert. The study provides references for the analysis of dry and wet climate conditions, water resource utilization and assessment, agricultural crop water storage management, and ecological environment changes in arid and semi-arid regions and may help rationalize the use of water resources.

2. Materials and Methods

2.1. Study Area

The test site is located at Cao Sidan Ranger Station, Gouxinzhao Sub-Field, Dalate Banner, Ordos City, Inner Mongolia Autonomous Region (40°14′24″ N, 110°39′14″ E, 1128 m above sea level); the regional distribution map is shown in Figure 2. The study area has a temperate continental monsoon climate, with dryness and low rainfall, cold winters, hot summers, large temperature differences (TDs) between day and night, daily maximum and minimum temperatures of 38 °C and −31.4 °C, respectively, and an annual average temperature of 6.1 °C. The average precipitation is 297.3 mm, mainly concentrated in July to September, accounting for 70% of the annual precipitation; the multi-year average evaporation is 2506.3 mm, 7.2 times the precipitation, with the maximum occurring in May to July. The annual average wind speed (Ws) is 3.6 m/s, and the maximum Ws is 22 m/s. The soil is mainly meadow sandy soil. The main tree species of the plantation include S. psammophila, fast-growing poplar, dry willow, and elm, and the herbaceous vegetation under the forest is mainly comprised of sandy plants [22].

2.2. Research Methodology

2.2.1. Experimental Design

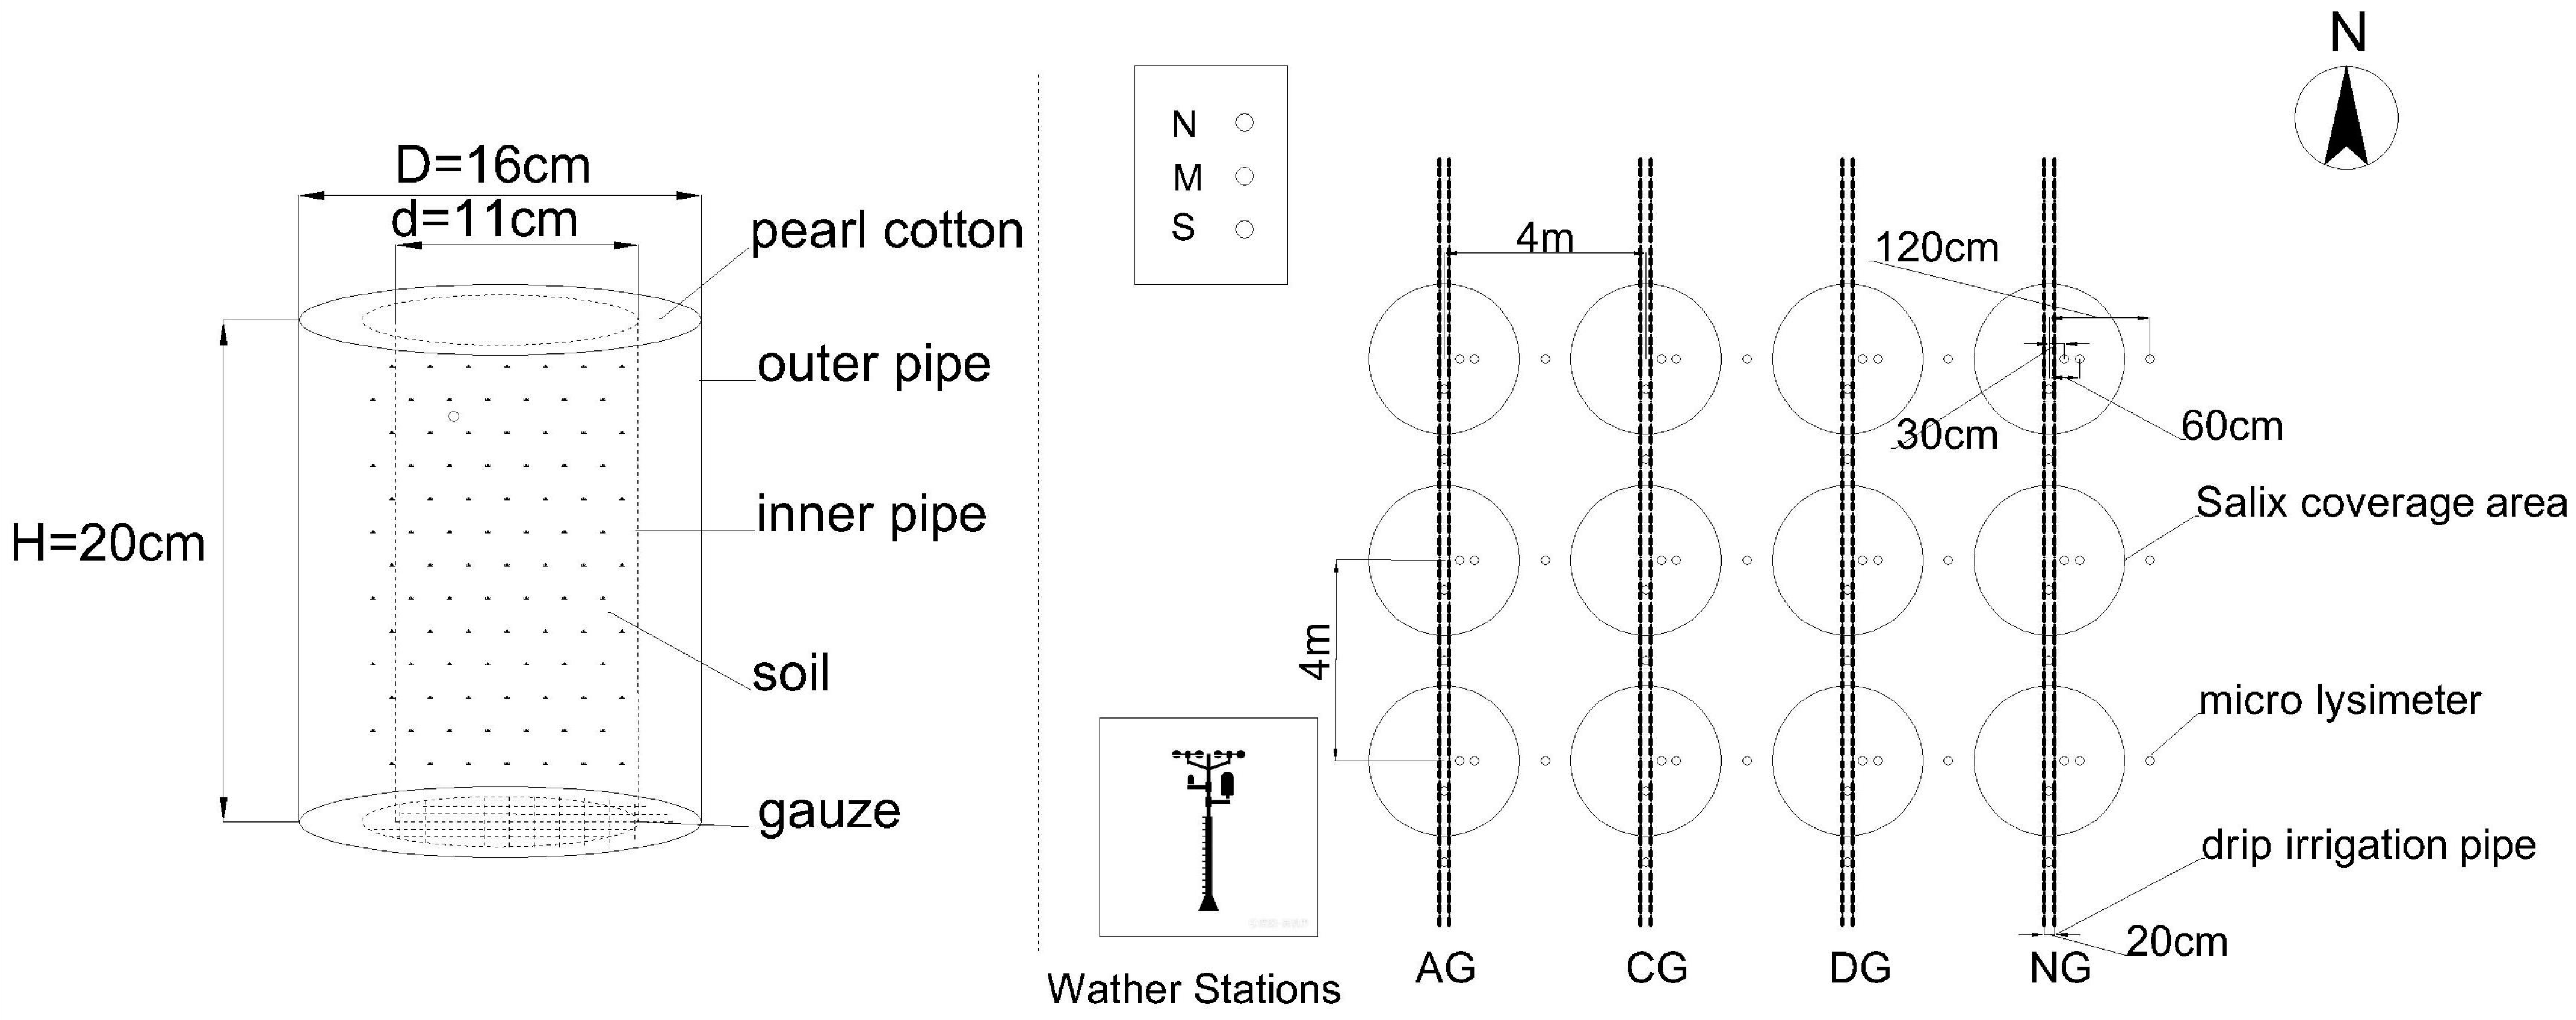
Fixed observation plots were set up at the Cao Sitan Ranger Station in a good-growing S. psammophila forest. The total area of S. psammophila plantation was 8.27 hm2, and 12 trees were evenly spaced at 4 m between rows and 4 m between plants. These 12 S. psammophila samples were divided into four groups (Ample Irrigation Group, AG; Controlled Irrigation Group, CG; Drought Irrigation Group, DG; and Non-irrigated Blank Control Group, NG) according to the amount of irrigation water. The information of S. psammophila sample trees is shown in Table 1. The water potentials of AG, CG, and DG were controlled at −25, −50, and −75 kpa, respectively (70%, 62%, and 55% of the field capacity in order) and named the irrigation group; NG was the natural control group. Three replicates were set up for each group. An ML was set up in four directions under S. psammophila at the following three locations: roots, half of the canopy, and outside the canopy (i.e., between S. psammophila). In addition, three MLs, labeled as CK, were placed on bare ground at a distance of 10 m away from the experimental site, with a spacing of 20 cm between each plot. The sample plots were irrigated by above-ground drip irrigation, and the drip irrigation pipes were laid in two strips (drip irrigation pipes were located on both sides of the tree, 10 cm from the roots) along the tree rows. Based on the size of the wetting body previously reported [22], the spacing was set at 4 m (the same as the plant spacing next to S. psammophila), with a flow rate of 3 L/h. The layout of the test site is shown in Figure 3.
Using an ML to determine condensation water is a simple and effective approach and causes less disturbance to the soil [23]. The ML is made of a PVC pipe; the inner pipe is 11 cm in diameter and 20 cm in length, the outer pipe is 16 cm in diameter and the same length as the inner pipe, and a 2-cm thick impermeable pearl cotton is used as a partition between the inner and outer pipes to prevent rainwater from entering the gap. The schematic diagram of ML is shown in Figure 3. When installing the ML, it was first pressed vertically into the soil, after which the upper edge of the ML was flushed with the ground surface, the ML was removed, and the soil was sealed with a gauze net. The inner tube was then placed in the outer tube, which was buried in soil beforehand. Water and heat in the ML could be exchanged with the lower soil through the gauze. During the test period, the soil inside the ML must be removed and replaced after approximately 1 week (as the natural settlement of the soil causes the soil level inside the barrel to drop, affecting the test accuracy) and after rainfall (as rainwater entering the ML causes the surface soil to slump, which is not conducive to the evaporation and condensation of the soil inside the ML).

2.2.2. Measurement Method

The test was conducted between June and September 2022. The amount of surface condensation water was determined from soil samples using an electronic balance (accuracy: 0.01 g). The soil (or water) weight was measured once at 19:00 on the same day’s evening and once at 07:00 on the next day’s morning. The balance was calibrated with a 1 kg weight before each measurement; the difference between masses was considered the amount of surface condensation water produced on that day. When weighed with the ML, the sand and soil on the surface of the ML were swept away to prevent any influence on the experimental results. Simultaneously, one HOBOU30 mini-weather station was installed in an open area 10 m away from the sample plot to monitor the total solar radiation (Rs, W/ m 2 ), wind speed (Ws, m/s), wind direction (Wd, 0–360°), air temperature (Ta, °C), and relative humidity (RH, %). The data were recorded once every 10 min and stored.

2.2.3. Meteorological Factors

The meteorological factors studied were the 24 h average temperature (T) from 12:00 of the day to 12:00 of the next day, the 12 h average nighttime temperature (NT) from 19:00 of the day to 7:00 of the next day, the 24 h maximum temperature difference(TD) from 12:00 of the day to 12:00 of the next day, the 24 h average relative humidity(RH)from 12:00 of the day to 12:00 of the next day, the 12 h average nighttime relative humidity (NRH) from 19:00 of the day to 7:00 of the next day, the 24 h maximum relative humidity difference (RHD) from 12:00 of the day to 12:00 of the next day, Ws, and air VPD.

2.2.4. Analysis Methods

In order to eliminate the influence of abnormal data on experimental results, the method for processing ML data proposed by Chen [24] was used to filter the data. According to this method, the difference between each data point and its average value over a period of time needed to be less than δ . The data satisfying Equation (1) were retained, and those that did not satisfy the condition were excluded.
x i x ¯ < δ
where x i denotes the ML data, x ¯ is the mean value of the data, and δ is the threshold value, which is generally 1.5 times the standard deviation of the data.
The amount of condensation water at the surface was expressed as the difference between the morning and evening weighing masses of the ML. The increase and decrease in the apparent mass indicate water condensation and evaporation, respectively. The amount of condensation water expressed by the change in the mass of the ML was then converted to the amount of condensation water expressed by the height, using Equation (2):
H = 10 m ρ π r 2
where H is the amount of condensation water on the surface (mm), m is the difference between the mass changes of the ML (g), ρ is the density of water (kg- m 3 ), and r is the radius of the ML (cm).
The air vapor pressure deficit (VPD) was calculated using Equation (3):
VPD   =   0.611   ×   e 17.502 T T + 240.97 ( 1     RH )
where T is the temperature (°C), and RH is the relative humidity (%).
All raw data were processed using Microsoft Excel (Microsoft Excel 2022, Microsoft, Redmond, WA, USA) and analyzed using SPSS (IBM SPSS Statistics 27, IBM, Chicago, IL, USA). Graphs were produced using Origin (Origin 2022, OriginLab, Northampton, MA, USA) and AutoCAD (AutoCAD 2023, Autodesk, San Francisco, CA, USA). One-way analysis of variance (ANOVA) was used to assess the differences between the average daily condensation water under S. psammophila under different irrigation levels (AG, CG, and DG) and the bare ground control (NG) as well as to assess the variability of cumulative condensation water at different locations under S. psammophila with different irrigation rates. A multiple linear regression analysis method was used to construct an expression formula for the condensation volume, and the contribution values of meteorological factors were quantified to measure the relative contributions of each factor and identify key influencing factors.

3. Results

3.1. Daily Variations in Condensation Water

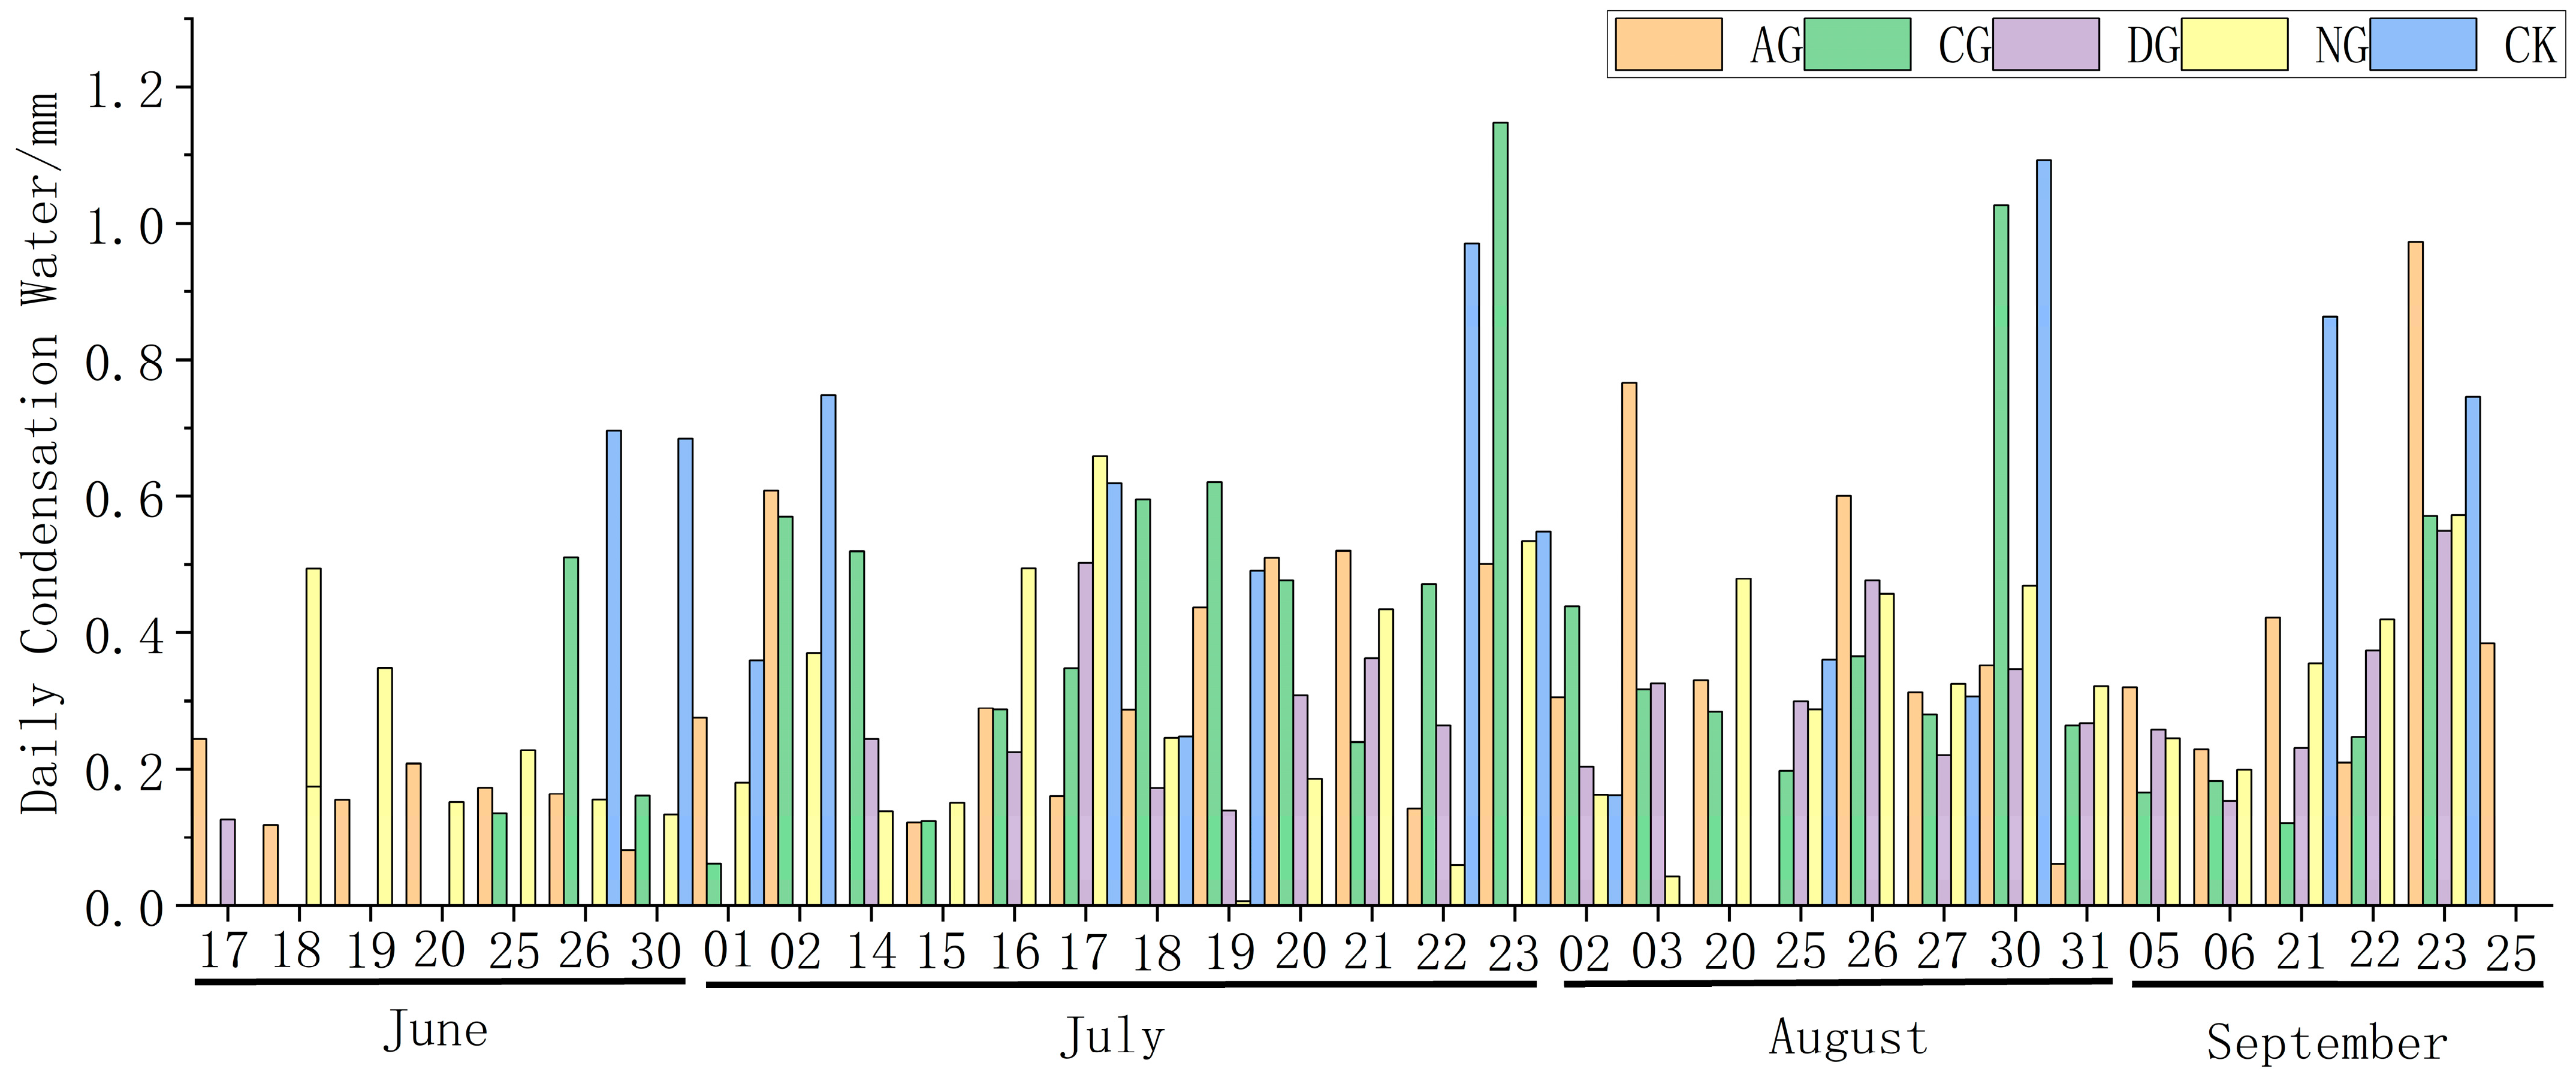
The test observations started on 15 June 2022 and ended on 27 September 2022. Surface condensation of water was observed 34 times during the experiment. The amounts of surface condensation water under S. psammophila and the bare ground control under different irrigation rates are shown in Figure 4. The maximum amount of condensation water was 0.38 mm per day in September, and the minimum amount of condensation water was 0.26 mm per day in June. In addition, 45.40 mm of total condensation water and 224.96 mm of total rainfall were observed during the four months, accounting for 20.18% of the total rainfall in the study period.
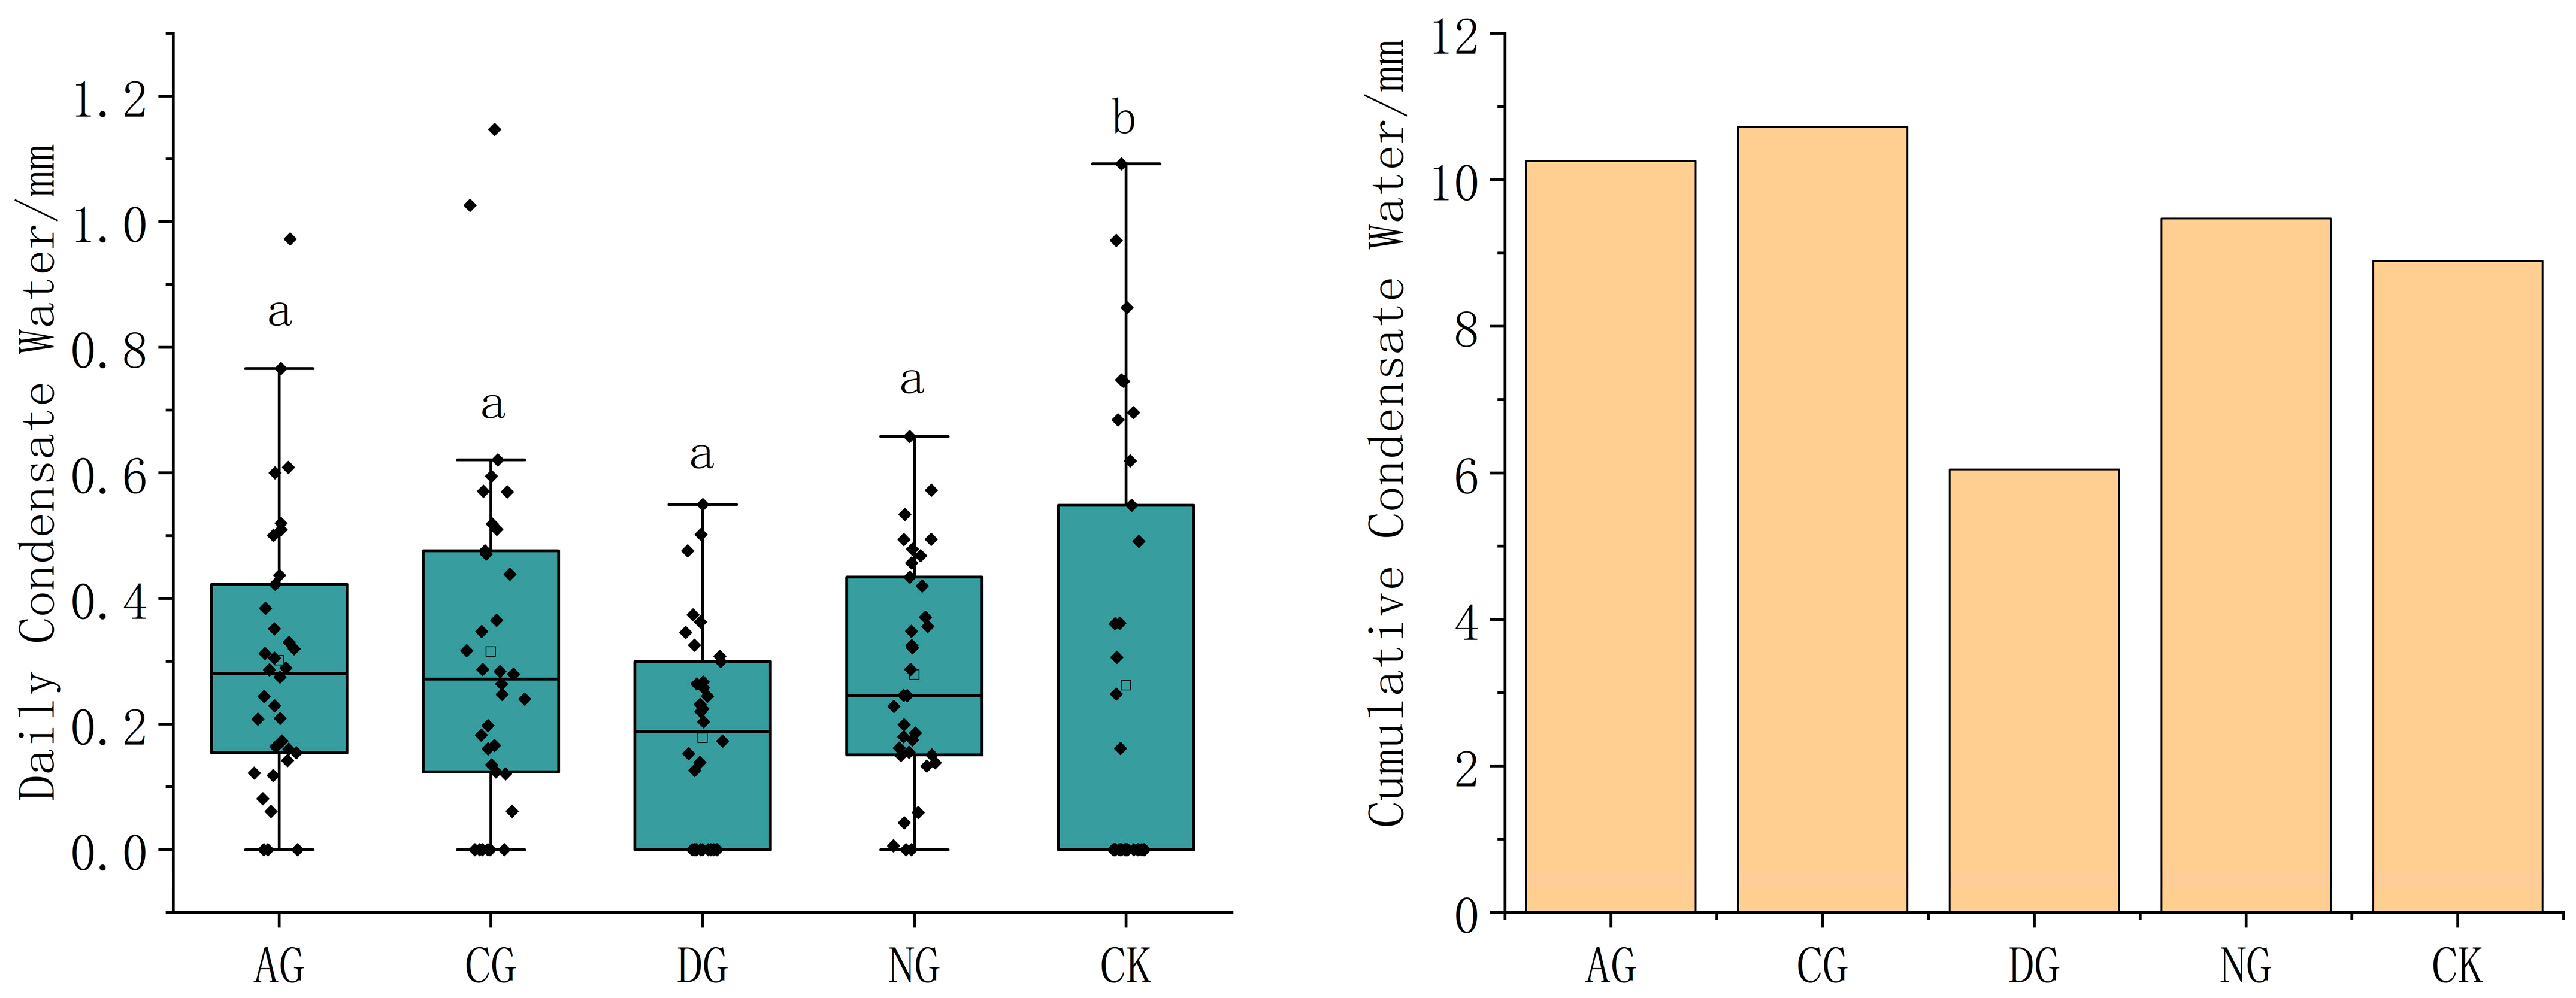
There was a large difference in the average daily condensation water between S. psammophila and the bare ground controls at different irrigation rates. As shown in Figure 5, the trend of the average daily condensation water was 0.593 (CK) > 0.383 (CG) > 0.302 (AG) > 0.296 (NG) > 0.288 (DG). Compared with that on CK, the amount of surface condensation water on AG, CG, DG, and NG decreased by 49%, 35%, 51%, and 50%, respectively. One-way ANOVA revealed that the average daily condensation water of NG was much higher than that of AG, CG, and DG, but the differences among the average daily condensation water values of AG, CG, and DG were not significant.

3.2. Variations in Characteristics of Condensation Water at Different Locations under S. psammophila

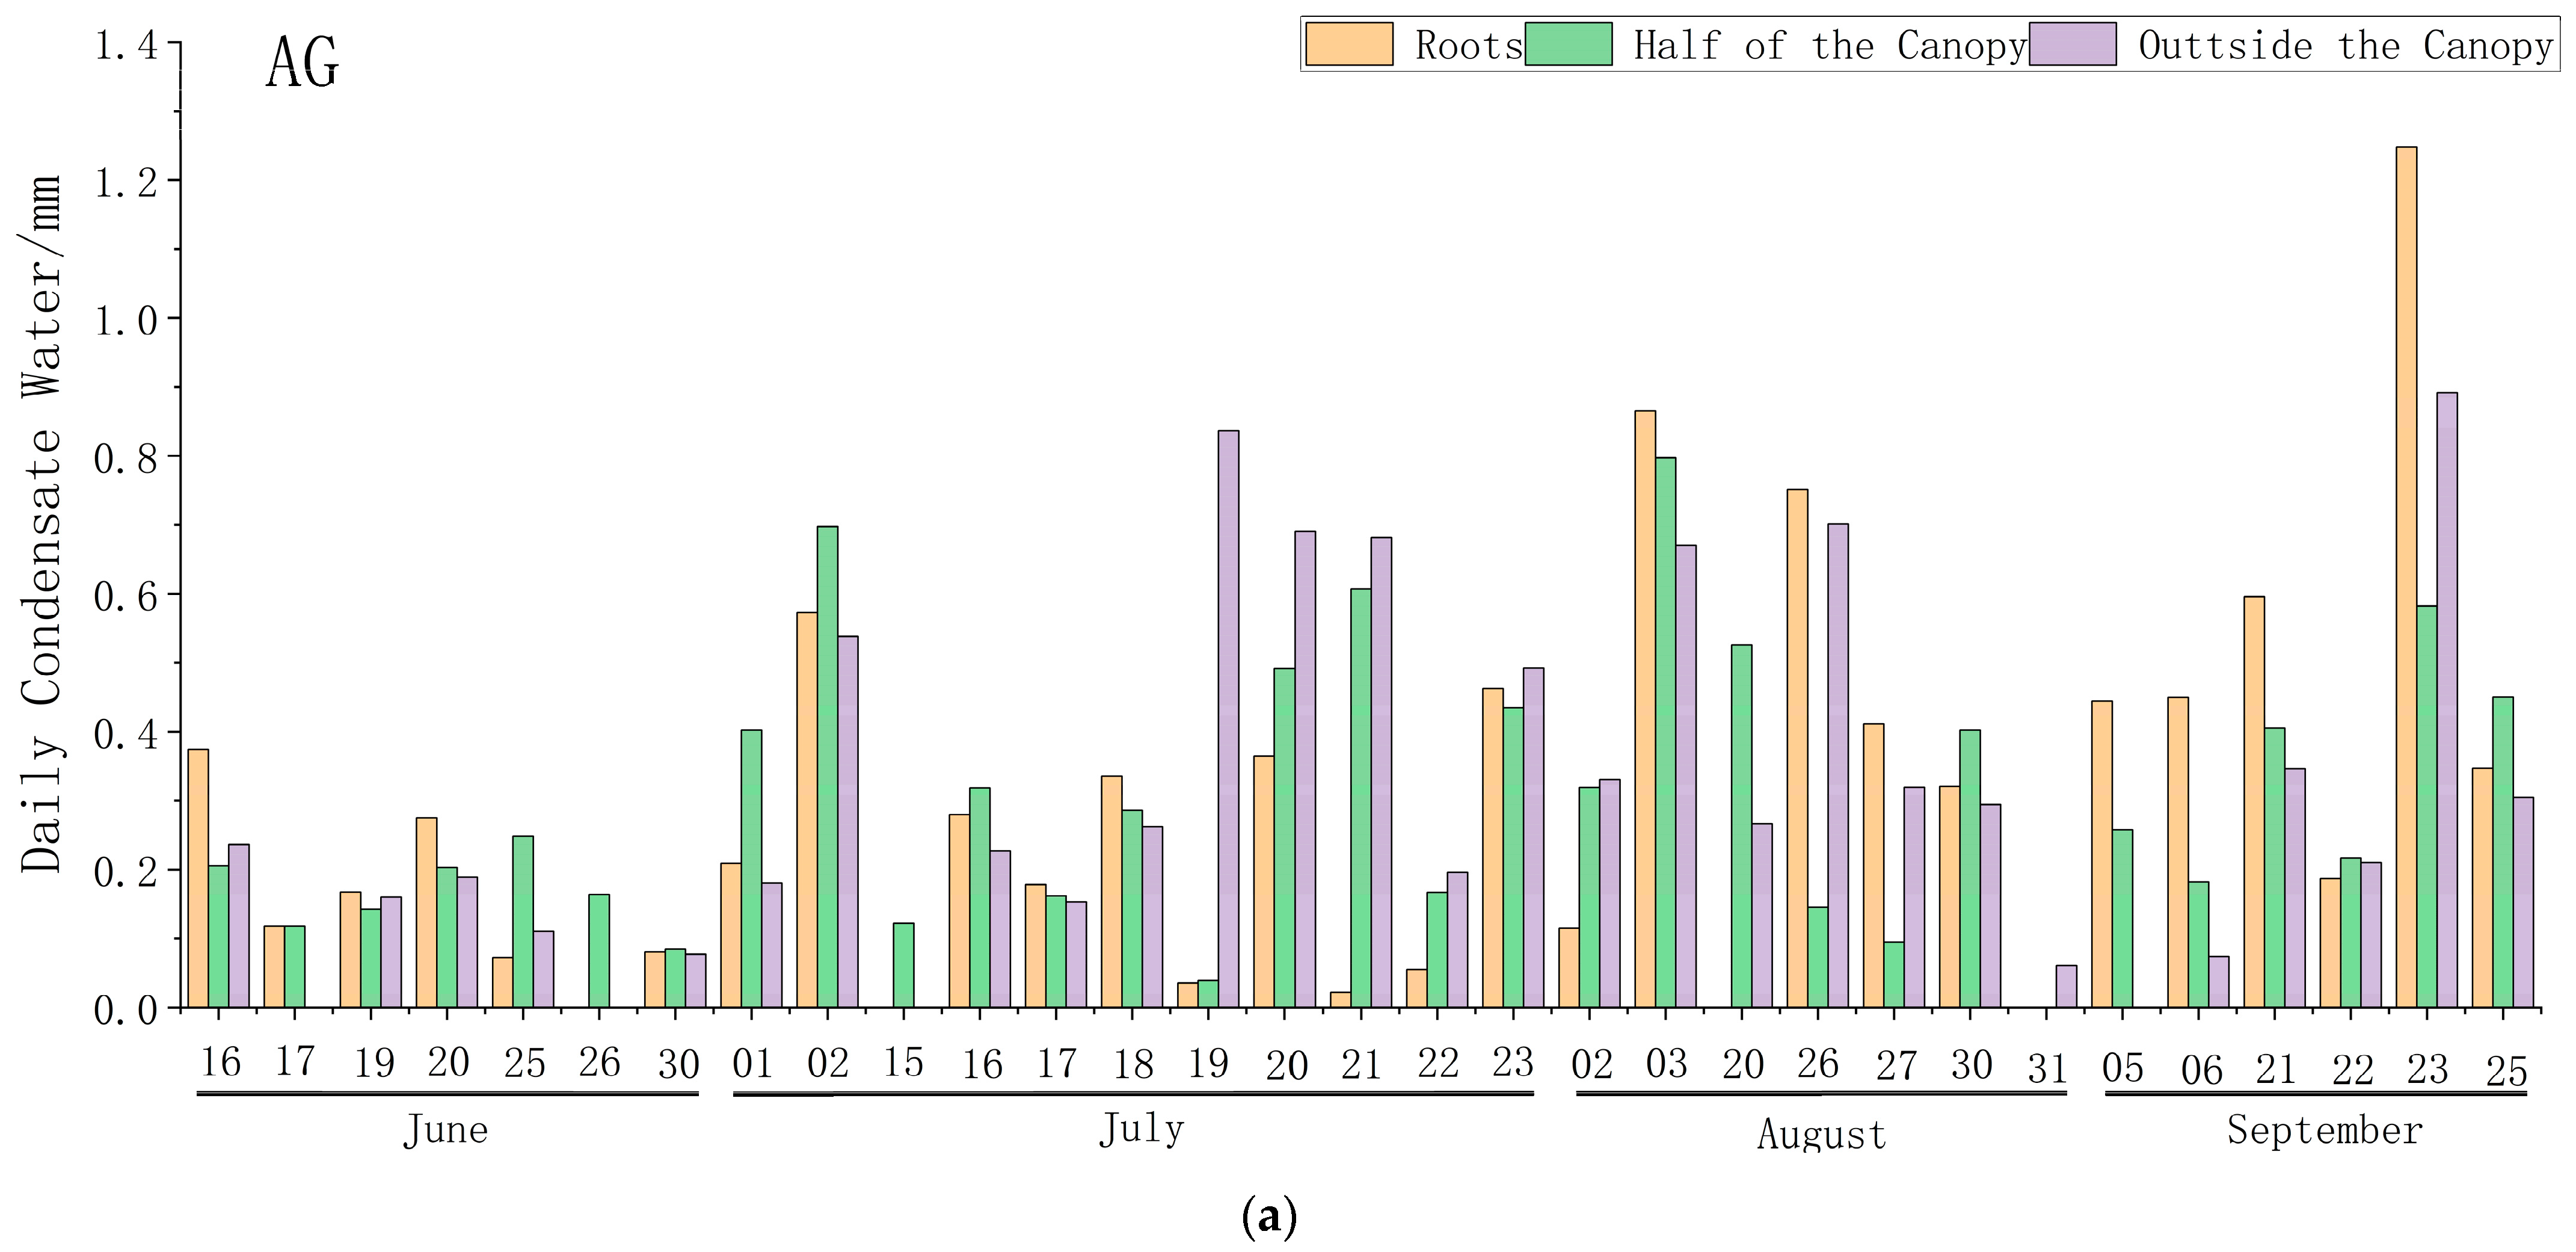
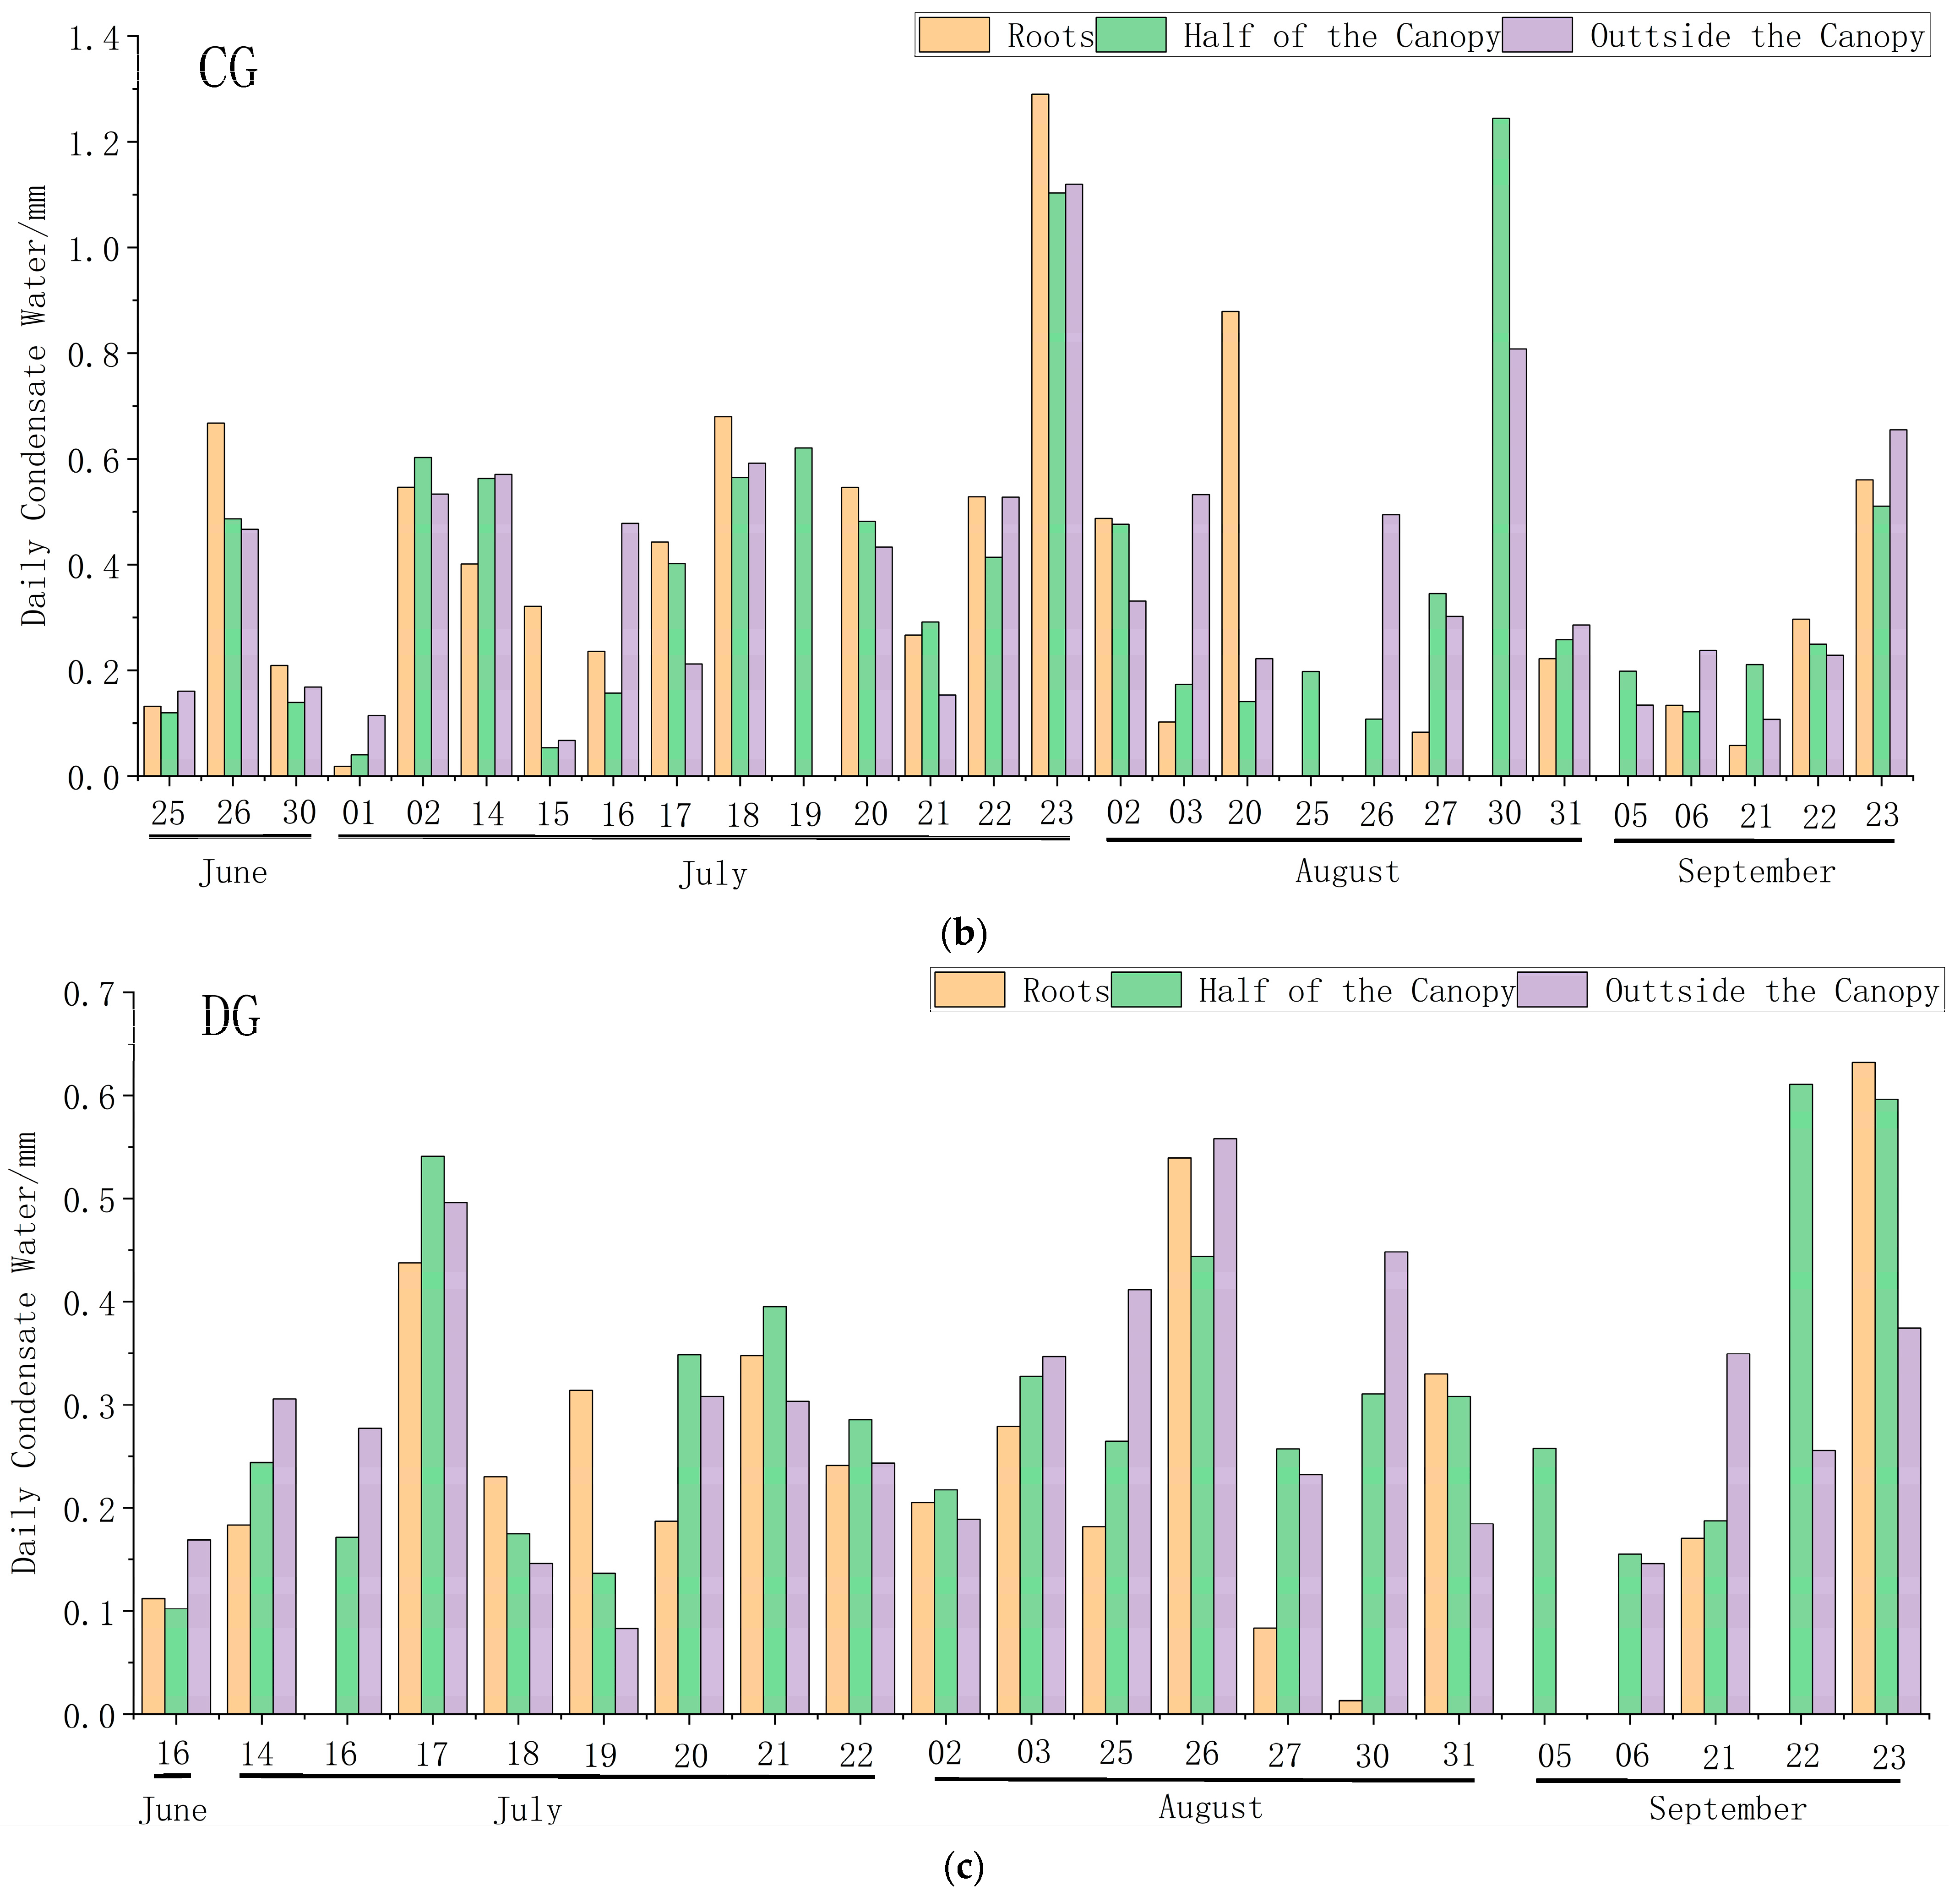
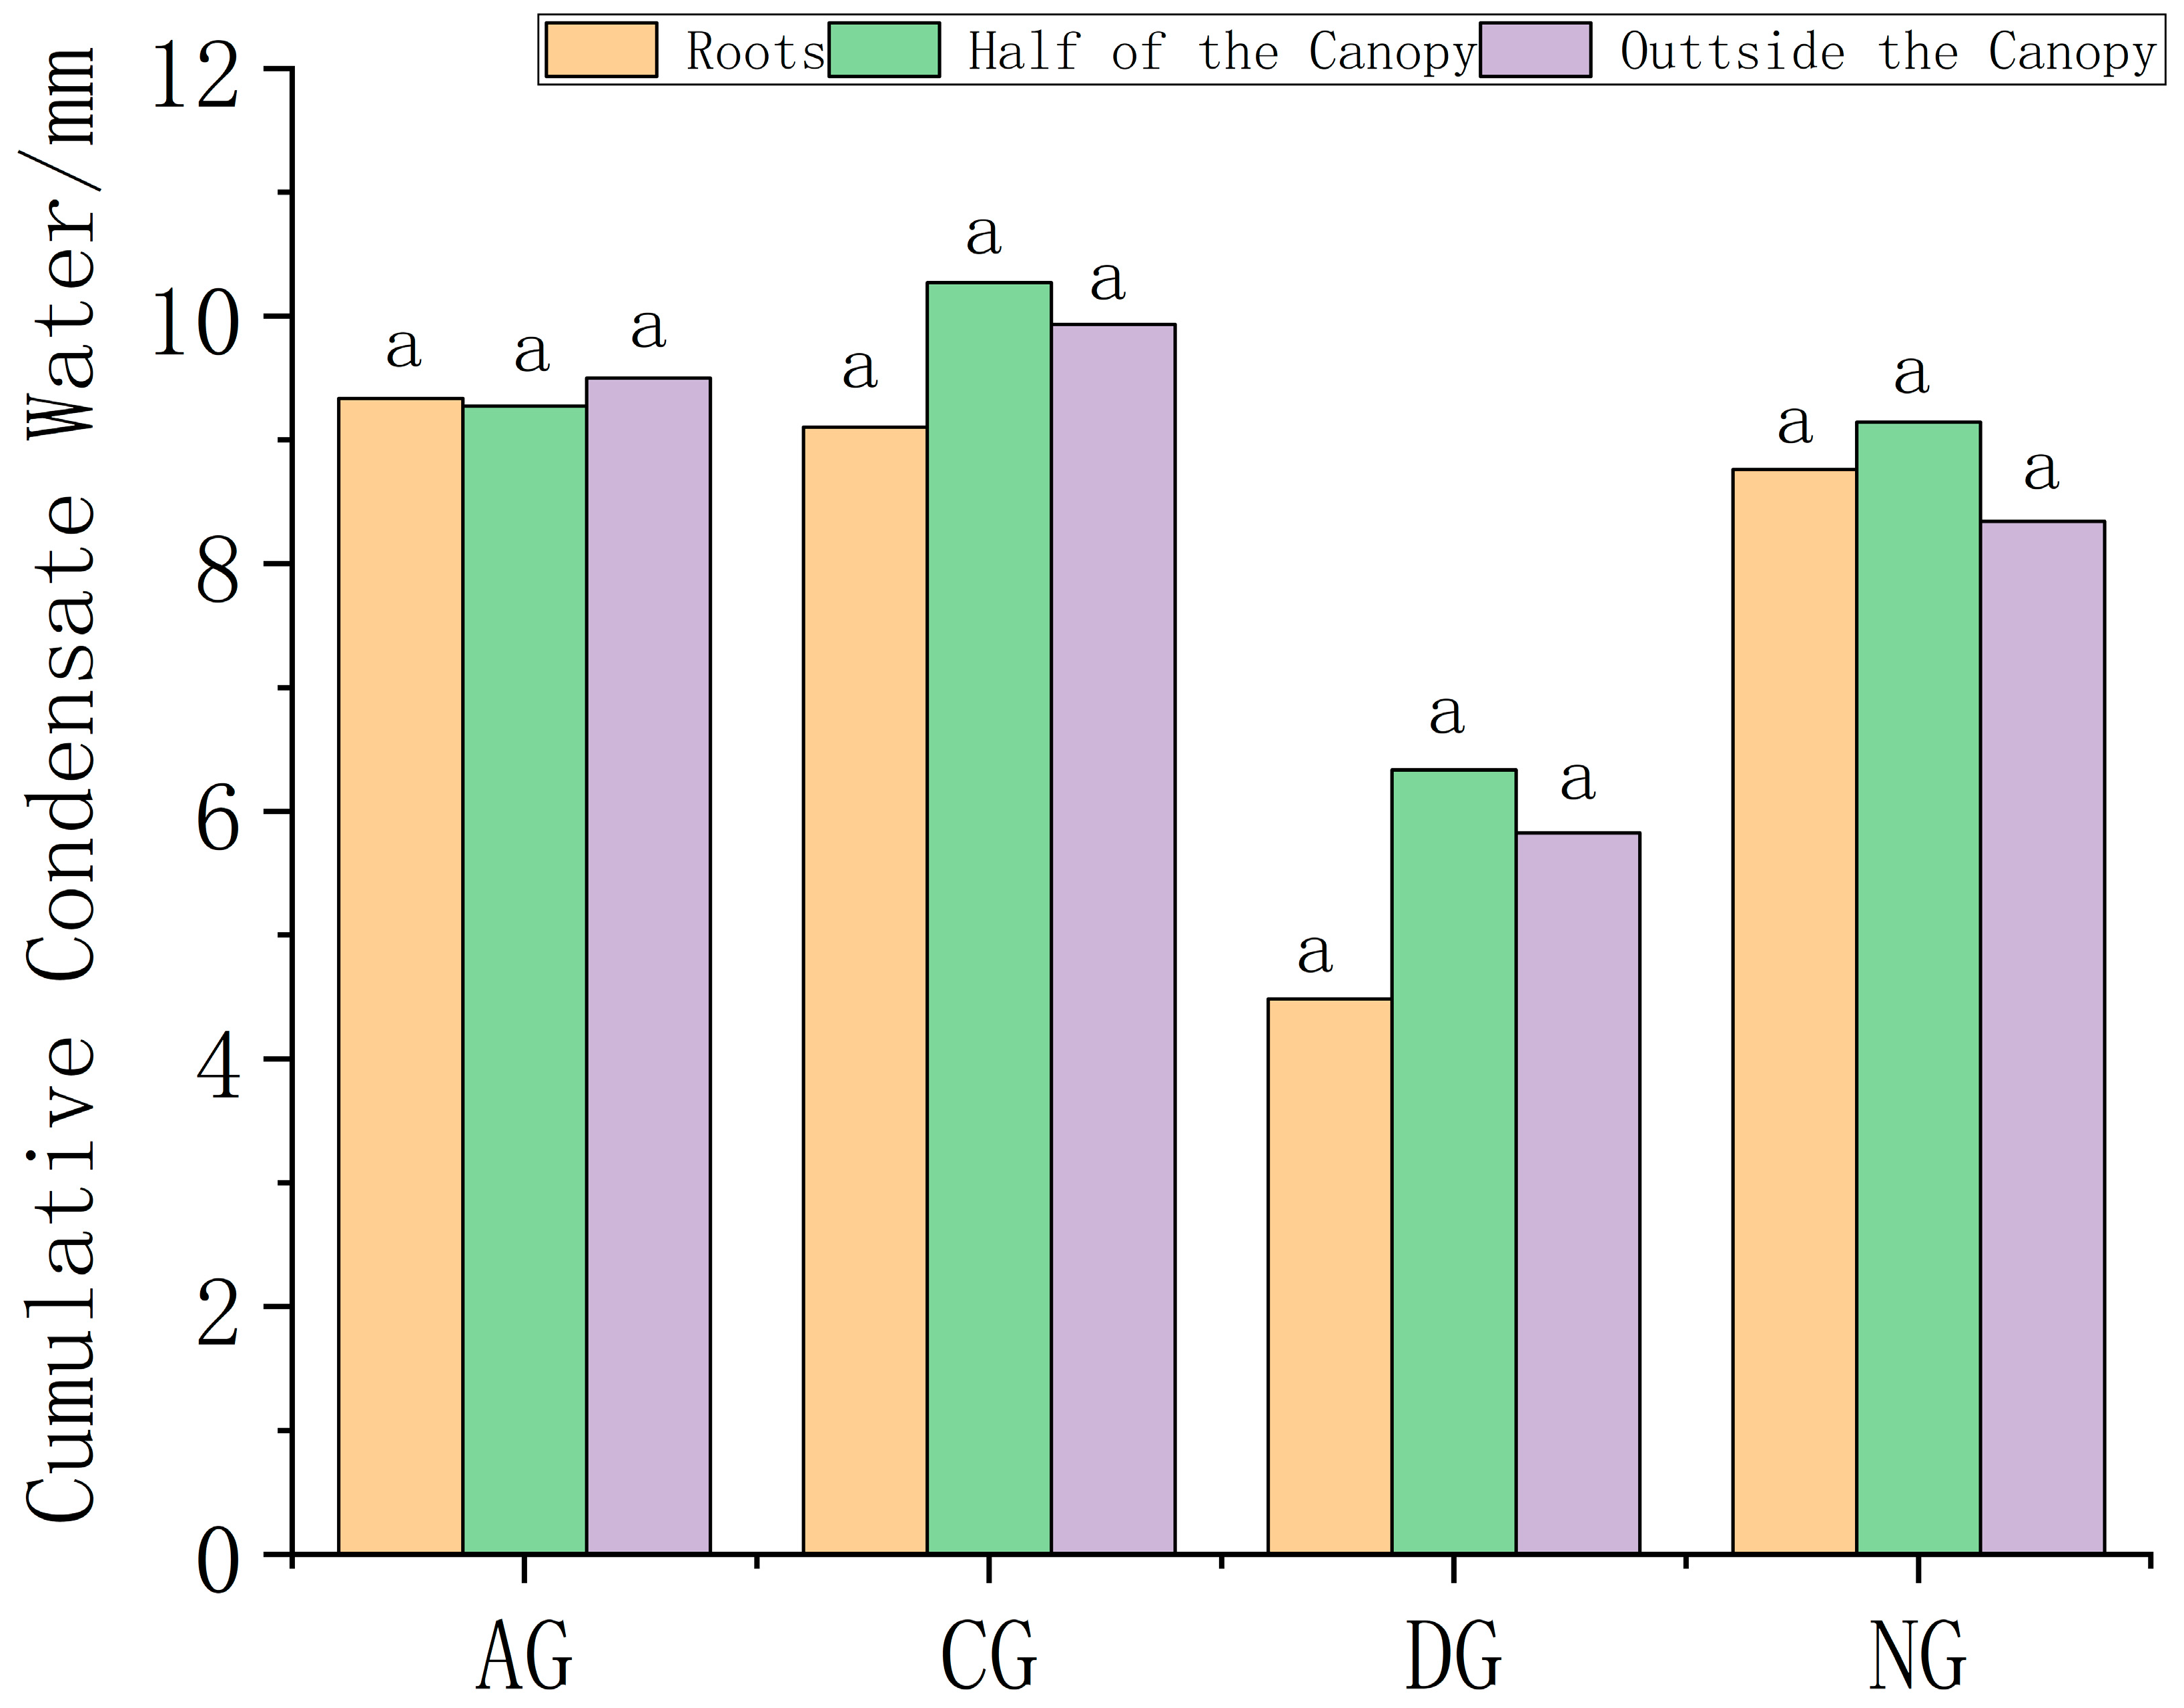
The amount of condensation water at the surface varied under the influence of S. psammophila with different irrigation rates. At different locations, the amount of condensation water increased from the roots to half of the canopy, to the outside of the canopy, and from the inside to the outside. That is, the maximum amount of condensation water was outside the canopy, followed by half of the canopy, and the minimum amount of condensation water was at the roots (Figure 6). One-way ANOVA revealed that the differences were not significant (Figure 7). Multivariate ANOVA revealed that the effect of different irrigation volumes and locations on surface condensation water was limited (Table 2). The a in Figure 7 indicates a non-significant difference between the cumulative amount of condensation water at the surface at different locations under S. psammophila.

3.3. Relationship between Condensation Water and Meteorological Factors

Surface condensation water showed a highly significant positive correlation with TD and RHD, a significant negative correlation with Ws, and a highly significant negative correlation with VPD (correlation coefficients: 0.189, 0.212, −0.077, and −0.096, respectively). The results of this analysis are presented in Table 3.
The correlations between surface condensation water and meteorological factors differed when analyzed from different locations. At the roots of S. psammophila, surface condensation water showed a significant positive correlation with TD and RHD, as well as a significant negative correlation with VPD (correlation coefficients: 0.203, 0.181, and −0.198, respectively); at the one-half canopy of S. psammophila, surface condensation water showed a highly significant positive correlation with TD and RHD (the correlation coefficients: 0.195 and 0.243, respectively). Outside the canopy of S. psammophila, the surface condensation water showed a highly significant positive correlation with TD and RHD (correlation coefficients: 0.176 and 0.187, respectively). The results of this analysis are presented in Table 4.
The correlations between surface condensation water and meteorological factors differed from the different irrigation amounts. In the irrigation group, surface condensation water showed highly significant positive correlations with TD and RHD, significant negative correlations with T, NT, and Ws, and highly significant negative correlations with VPD (correlation coefficients: 0.190, 0.212, −0.072, −0.079, −0.079, and −0.102, respectively). In AG, surface condensation water showed significant positive correlations with TD, highly significant positive correlations with RHD, and significant negative correlations with Ws (correlation coefficients: 0.161, 0.229, and −0.161, respectively). In CG, surface condensation water showed a significant positive correlation with TD (correlation coefficients: 0.168). In DG, surface condensation water showed a highly significant normal correlation with TD and RHD, a highly significant negative correlation with T, NT, VPD, and TD, and significant negative correlations with Ws (correlation coefficients: 0.285, 0.352, −0.288, −0.288, −0.223, −0.264, and −0.166, respectively).In NG, surface condensation water showed a highly significant normal correlation with TD and RHD and a highly significant negative correlation with T, NT, VPD, and TD (correlation coefficients: 0.213, 0.251, and −0.254, respectively). In CK, surface condensation water showed a significant positive correlation with NRH, a highly significant negative correlation with T and NT, and a significant negative correlation with VPD and TD (correlation coefficients: 0.476, −0.516, −0.594, −0.376, and −0.353, respectively). The results of this analysis are presented in Table 5.
The results of the multiple linear regression analysis show that the fitted equation for the condensation water is as follows:
Condensation   Water = 0.0025 + 0.0032 T 0.0023 NT + 0.0178 TD + 0.0110 RH 0.0092 NRH + 0.0034 RHD 0.1131 Ws 0.0552 VPD ,   R 2   =   0.074 ,   p < 0.0001
In the equation, Ws has the greatest impact on the condensation water (Table 6), contributing 51.94%, followed by VPD, contributing 25.37%; TD, RH, NRH, RHD, T, and NT contribute 8.16%, 5.06%, 4.24%, 1.55%, 1.49%, and 1.05% respectively.

4. Discussion

4.1. Effect of S. psammophila on Surface Condensation Water

The Kubuqi Desert is dry, with little rainfall. From June to September 2022, surface condensation water accounted for 20.18% of the rainfall in the same period, which was the most important source of water vapor other than rainfall. The largest amount of condensation water was observed in the bare ground control group; the average daily condensation water under S. psammophila was 0.317 mm, which was 47% less than that of the bare ground control group [25]. This is consistent with the experimental results of Pan et al. [25] in the Maowusu Desert. The reasons could be the following three points: First, the larger canopy width of S. psammophila was 3.31 m, which effectively blocked solar radiation, resulting in lower near-surface temperature and weaker water evaporation. Second, S. psammophila reduced the Ws from the lower surface, further weakening the soil evaporation intensity, resulting in the soil moisture content in the lower surface layer of S. psammophila being higher than that in the bare ground control. Moist soils have higher thermal conductivity than dry soils and are more likely to gain heat from the lower soil [26]. Third, the presence of S. psammophila reduces the amount of water vapor in the air reaching the surface, which reduces the amount of condensation from the source [25]. After the generation of condensation water, some of the water adheres to the surface of S. psammophila leaves, and the amount of surface condensation water is reduced accordingly.
In addition, there were differences in the amounts of condensation water at different locations under S. psammophila. This is consistent with the findings of Xiaohan et al. [10] in the Mao Usu Desert, and the reasons could be as follows: (1) S. psammophila has a dense root morphology with dispersed outer edges, and the roots can block solar radiation more effectively than the outer edges of the canopy, lowering the surface temperature and weakening soil evaporation; (2) the dense branches and leaves can reduce the Ws more effectively than the open canopy, reducing soil water loss at the surface; (3) dense branches and leaves intercept more water vapor reaching the surface than outside the canopy. Therefore, the amount of condensation water gradually increases from the inside to the outside. While we investigated the differences in condensation water volume among different locations under S. psammophila, whether differences exist in the condensation water volume in different directions under S. psammophila warrants further investigation.

4.2. Influence of Irrigation Volume on Surface Condensation Water

There was no significant difference in the amount of condensation water under the different irrigation conditions of S. psammophila. Some of the water vapor sources of condensation water were mainly water vapor in the surface soil pore space. Analysis of the surface condensation water under S. psammophila under different irrigation conditions revealed evident seasonal variations in surface soil condensation. In the wet season, frequent rainfall provides a sufficient water vapor source for the surface soil and the amount of condensation water increases. In the dry season with little rainfall, the water content of the surface soil is low, and the water from the deep soil cannot be transported to the surface soil through the capillary action of the soil pores but diffuses upward in the form of gas, and the amount of condensation water decreases [27]. The drip irrigation method used in this study allowed most of the water to flow into the deep soil, and the amount of irrigation did not have a significant effect on the amount of condensation water at the surface. Moreover, the water input to the deep soil by the drip irrigation method could be fully absorbed by the root system of S. psammophila [21].

4.3. Effect of Meteorological Factors on Surface Condensation Water

Meteorological factors play a vital role in the creation of surface condensation water. Temperature is a fundamental driver of water vapor movement in the environment. RH exhibits a positive correlation with the volume of condensation water; higher RH levels contribute more water vapor for condensation water formation [10]. In this study, the amount of condensation water at the test site displayed a strong positive correlation with the 24 h maximum TD and the 24 h maximum RHD. As air temperature rises, its capacity to hold water vapor increases, and when temperature drops, the air’s capacity to retain water vapor diminishes, resulting in the condensation of excess water vapor into liquid form. A higher maximum TD within a day implies more significant temperature fluctuations, thereby enhancing the potential for soil-generated condensation water. Similarly, a larger maximum RHD leads to easier saturation of airborne water vapor, causing it to condense on the surface, thus increasing the amount of condensation water. The amount of condensation water demonstrated a substantial negative correlation with Ws, aligning with Luming et al.’s findings [28]. Elevated Ws disperses atmospheric water vapor, consequently diminishing surface condensation water. Additionally, the amount of condensation water exhibited a notable negative correlation with VPD, representing the actual air distance from saturation or air dryness. A higher VPD indicates drier air, thereby reducing the likelihood of soil-based condensation water production.
The correlations between surface condensation water and meteorological factors were essentially the same for the three locations’ setups. However, there were variations among the roots, half of the canopy width, and the width outside the canopy. The correlation between surface condensation water at the roots and the 24-h maximum TD and 24-h maximum RHD was weaker compared to the other two positions yet still exhibited a significant positive correlation. The dense morphology of S. psammophila roots and their outward dispersion led to greater obstruction of solar radiation and interception of water vapor reaching the surface, particularly when contrasted with the other two positions. This significantly reduced Ws and rendered the generation of condensation water less susceptible to external environmental influences. The correlations between meteorological factors at half of the canopy and outside the canopy exhibited relatively minor differences.
In this study, we established four irrigation water groups and a control group with bare ground. Different correlations were observed between surface condensation water and meteorological factors within each group. Among the irrigation groups, the correlation with VPD grew stronger as irrigation volume decreased, leading to reduced soil water content, lower soil evaporation intensity, and increased air dryness. The correlation between surface condensation water and temperature was weaker in the irrigation group compared to the bare ground control group, likely due to the presence of S. psammophila mitigating the influence of environmental factors. Additionally, the correlation between surface condensation water and RH was weaker in the irrigation group than in the bare ground control group, possibly because drip irrigation resulted in significantly higher soil moisture content in the irrigation group. While the correlation between surface condensation water and Ws was stronger in the irrigation group, the bare ground control group exhibited much higher Ws. This was attributed to the absence of shading from S. psammophila in the bare ground control group, leading to a higher temperature difference between the air and surface. Moreover, the impact of Ws on the formation of condensation water was less pronounced in the bare ground control group compared to the irrigation group.
In this study, we employed a multiple linear regression analysis to thoroughly investigate the influences and contributions of various meteorological factors on the condensation water. Our findings reveal that Ws and VPD are the primary drivers. Given our research site’s location in the Kubuqi Desert, known for frequent sandstorms, wind speed emerges as the most significant factor in condensation water dynamics. Firstly, high wind speeds can transport water vapor away, intensifying the difference in humidity between gas and liquid phases, which accelerates evaporation and diminishes condensation. Secondly, wind, through its cooling effect, extracts heat and lowers surface temperatures, potentially fostering condensation as wind speed rises. Additionally, wind speed influences air humidity distribution, impacting condensation patterns. Moreover, as a crucial component of the climate system, wind speed interacts with other climatic factors, such as temperature and humidity, collectively shaping condensation volume. VPD, a key indicator of air dryness, represents the disparity between saturated and actual vapor pressure at current temperatures. A higher VPD value signifies drier air. VPD significantly impacts condensation volume. Firstly, elevated VPD indicates drier air and a greater demand for water from the air, accelerating evaporation and consequently reducing condensation volume. Secondly, in regions with high VPD values (like dry areas such as deserts), decreased ambient temperatures could lead to the condensation of water vapor into droplets, potentially resulting in more noticeable condensation. Lastly, in vegetated zones, VPD could affect S. psammophila transpiration. As VPD rises, S. psammophila might close their stomata to minimize water loss, potentially influencing regional humidity and condensation volume.

5. Conclusions

The characteristics of surface condensation water under S. psammophila with different irrigation rates were investigated in the Kubuqi Desert from June to September 2022 using an ML, and the influence of meteorological factors on surface condensation water was analyzed. The following main conclusions were obtained:
(1)
From June to September 2022, the total amount of surface condensation water under S. psammophila was 45.40 mm, and the total precipitation for the same period was 224.96 mm, with the total condensation water accounting for 20.18% of the rainfall for the same period. During the test period, the highest amount of condensation water was recorded in September (0.38 mm), whereas the lowest was recorded in June (0.26 mm).
(2)
The presence of S. psammophila considerably reduced the amount of surface condensation water, with the average daily condensation water in the different irrigation groups (AG, CG, DG, and NG) being 49%, 35%, 51%, and 50% lower than that of the bare ground control group, respectively. The amount of surface condensation water tended to increase from the roots of S. psammophila to half of the canopy to the outside of the canopy, from the inside to the outside. S. psammophila blocked solar radiation and reduced the Ws, which decreased the near-surface temperature, intercepted some water vapor from reaching the ground, and decreased the intensity of soil condensation and evaporation.
(3)
The reason for the small difference in the amount of surface condensation water under S. psammophila under different irrigation amounts was that drip irrigation delivered most of the water to the deep soil, and the water was fully absorbed by the plant roots.
(4)
The amount of surface condensation water was highly significantly correlated with the 24 h maximum TD and the 24 h maximum RHD, where the temperature determines the ability of air to hold water vapor. Higher RH provided more sources of water vapor for condensation that was significantly negatively correlated with Ws; wind disperses the water vapor in the air when the Ws is too high, reducing the amount of condensation water produced from the source. Condensation was significantly negatively correlated with the air-water VPD. There is a significant negative relationship with the air-water VPD; the greater the air-water vapor deficit, the less water vapor in the air, which reduces the amount of condensation water.

Author Contributions

Conceptualization, X.L.; Investigation, H.W. (Han Wang) and X.S.; Methodology, Y.C. and Y.L.; Software, K.S.; Supervision, Z.P.; Writing—original draft, J.Z.; Writing—review and editing, H.W. (Haichao Wang). All authors have read and agreed to the published version of the manuscript.

Funding

This study was jointly supported by the Science and Technology Plan Project of Inner Mongolia Autonomous Region (2020GG0078) (Inner Mongolia Autonomous Region Department of Science and Technology) , the Inner Mongolia natural science foundation (2020MS03009) (Inner Mongolia Autonomous Region Department of Science and Technology), the National Natural Science Foundation of China Projects (52169016) (National Natural Science Foundation), the National Natural Science Foundation of China (52069018) (National Natural Science Foundation), the Inner Mongolia Autonomous Region Science and Technology Major Special Project Funding (2021ZD0008−5) (Inner Mongolia Autonomous Region Department of Science and Technology), Key Special Project of ‘Science and Technology Revitalizing Inner Mongolia’ Action in Inner Mongolia Autonomous Region(2022EEDSKJXM004)(Inner Mongolia Autonomous Region Department of Science and Technology).

Institutional Review Board Statement

Not applicable.

Informed Consent Statement

Not applicable.

Data Availability Statement

Not applicable.

Conflicts of Interest

The authors declare no conflict of interest.

References

  1. Guo, Z.; Liu, H. Condensated Water and Its Ecological Environment Effect in Northwestern of China. In Proceedings of the Fourth National Symposium for Young Geologists, Beijing, China, 26–28 August 2023; pp. 10–1999. [Google Scholar]
  2. Li, X. Effects of gravel and sand mulches on dew deposition in the semiarid region of China. J. Hydrol. 2002, 260, 151–160. [Google Scholar] [CrossRef]
  3. Agam, N.; Berliner, P.R. Dew formation and water vapor adsorption in semi-arid environments—A review. J. Arid Environ. 2005, 65, 572–590. [Google Scholar] [CrossRef]
  4. LI, H.; Zhang, G.; Wang, L.; Zhang, X. Comparison of Soil Absorbtion of Condensation Water among Three Underlying Surfaces in Mu Us Sandland. J. Arid. Land Resour. Environ. 2009, 23, 122–125. [Google Scholar]
  5. Bai, A.; Yu, J.; Bian, C.; Zhang, H.; Han, M.; Gao, Z. Research Progress on Soil Absorption and Condensation Water. J. Inn. Mong. For. Sci. Technol. 2010, 36, 50–53. [Google Scholar]
  6. Richards, K. Observation and simulation of dew in rural and urban environments. Prog. Phys. Geogr. 2004, 28, 76–94. [Google Scholar] [CrossRef]
  7. Agam, N.; Berliner, P.R. Diurnal Water Content Changes in the Bare Soil of a Coastal Desert. J. Hydrometeorol. 2004, 5, 922–933. [Google Scholar] [CrossRef]
  8. Liu, L.-C.; Li, S.-Z.; Duan, Z.-H.; Wang, T.; Zhang, Z.-S.; Li, X.-R. Effects of microbiotic crusts on dew deposition in the restored vegetation area at Shapotou, northwest China. J. Hydrol. 2005, 328, 331–337. [Google Scholar] [CrossRef]
  9. Shachak, M.; Leeper, A.; Degen, A.A. Effect of population density on water influx and distribution in the desert snail Trochoidea seetzenii. Écoscience 2002, 9, 287–292. [Google Scholar] [CrossRef]
  10. Ran, B.; Zhang, Z.; Yang, J.; Xu, D.; Gong, C. Formation regularity of dew by Artemisia lordosis in the Mu Us sandy desert and its impact on water balance. Trans. Chin. Soc. Agric. Eng. 2023, 39, 111–119. [Google Scholar]
  11. Chen, X.; Wu, Y.; Hai, C. Effects of surface dew under different types of sand-fixing shrubs in the southern margin of Mu UsSandy Land, Northern China. J. Desert Res. 2023, 43, 83–95. [Google Scholar]
  12. Jia, Z.; Chen, D.; Wang, Z.; Liu, P.; Liu, P.; Yao, C. Characteristics and source of soil condensation water in Guanzhong Plain, China. Chin. J. Appl. Ecol. 2023, 34, 369–376. [Google Scholar]
  13. Shi, W.; Li, B.; Liu, J.; Zhuo, Z.; Chen, X. Formation characteristics and factors effecting of condensation water in surface soil in Hoh Xil area. Arid. Land Geogr. 2022, 45, 1729–1739. [Google Scholar]
  14. Si, Q.; Li, J.; Cui, W.; Yang, F. Characteristics and source of soil condensation in desert dune in winter. J. Arid Land Resour. Environ. 2021, 35, 44–51. [Google Scholar]
  15. Li, C. Study on the mechanism of evaporation and condensation process in alpine meadows. Village Technol. 2021, 12. [Google Scholar] [CrossRef]
  16. Cheng, L.; Jia, X.; Wu, B.; Li, Y.; Zhao, X.; Zhou, H. Effects of biological soil crusts on the characteristics of hygroscopic and condensate water deposition in alpine sandy lands. Acta Ecol. Sin. 2018, 38, 5037–5046. [Google Scholar]
  17. Chen, R.; Wei, W.; Wang, M.; Mamtimin, A. Factors Effecting the Total Amount of Condensation Water Formation on Topsoil in the Gurbantunggunt Desert. Desert Oasis Meteorol. 2015, 9, 1–5. [Google Scholar]
  18. Pan, Y.; Wang, X.; Zhang, Y.; Hu, R. Influence of Topography on Formation Characteristics of Hygroscopic and Condensate Water in Shapotou, Ningxia, China. J. Desert Res. 2014, 34, 118–124. [Google Scholar]
  19. Guo, B.; Chen, Y.; Hao, X.; Li, B.; Cao, Z. Characteristics of Soil Condensation Water and lts Influencing Factors on Different Underlying Surfacesin the Lower Reaches of the Tarim River. J. Nat. Resour. 2011, 26, 1963–1974. [Google Scholar]
  20. Liu, X.; He, Y.; Zhao, X.; Li, Y.; Li, Y.; Li, Y.; Li, S. Soil condensation water in different habitats in Horgin sandy land: An experimental study. Chin. J. Appl. Ecol. 2009, 20, 1918–1924. [Google Scholar]
  21. Xiao, H.; Meissner, R.; Seeger, J.; Rupp, H.; Borg, H. Effect of vegetation type and growth stage on dewfall, determined with high precision weighing lysimeters at a site in northern Germany. J. Hydrol. 2009, 377, 43–49. [Google Scholar] [CrossRef]
  22. Yang, J.; Sun, G.; Wang, H.; Ding, J.; Sun, K.; Alatengsuhe. Numerical Simulation of Soil Water Movement in the Kubuqi Sandy Land. For. Sci. Technol. 2023, 48, 28–32. [Google Scholar]
  23. Ma, F.; Zhu, X.; Fu, S.; Luo, G. A Comparative Study of Soil Evaporativeness Measured with the Sealed and Not Sealed MicroLysimeter Placed in the Typical Black Soil Area of Northeast China. J. Irrig. Drain. 2016, 35, 7–11. [Google Scholar]
  24. Ji, C.; Zhu, Z.; Xu, Z. Data processing of high precision weighing lysimeter. J. Beijing Norm. Univ. 2016, 52, 628–634. [Google Scholar]
  25. Pan, Y.X.; Wang, X.P. Effects of shrub species and microhabitats on dew formation in a revegetation-stabilized desert ecosystem in Shapotou, northern China. J. Arid. Land 2014, 6, 389–399. [Google Scholar] [CrossRef]
  26. Zhang, Y.-F.; Chen, L.; Liu, X.-D.; Yang, X.-G.; Li, X.-B. Spatial Characteristics of Soil Moisture of 2 Communities in Desert Grassland. Southwest China J. Agric. Sci. 2017, 30, 836–841. [Google Scholar]
  27. Kobayashi, T.; He, W.; Nagai, H. Mechanisms of evaporation from soil with a dry surface. Hydrol. Process. 1998, 12, 2185–2191. [Google Scholar] [CrossRef]
  28. Yang, L. Forming process of soil condensation water and its response to environmental factors in the Mu Us desert. Doctoral Thesis, Beijing Forestry University, Beijing, China, 2016. [Google Scholar]
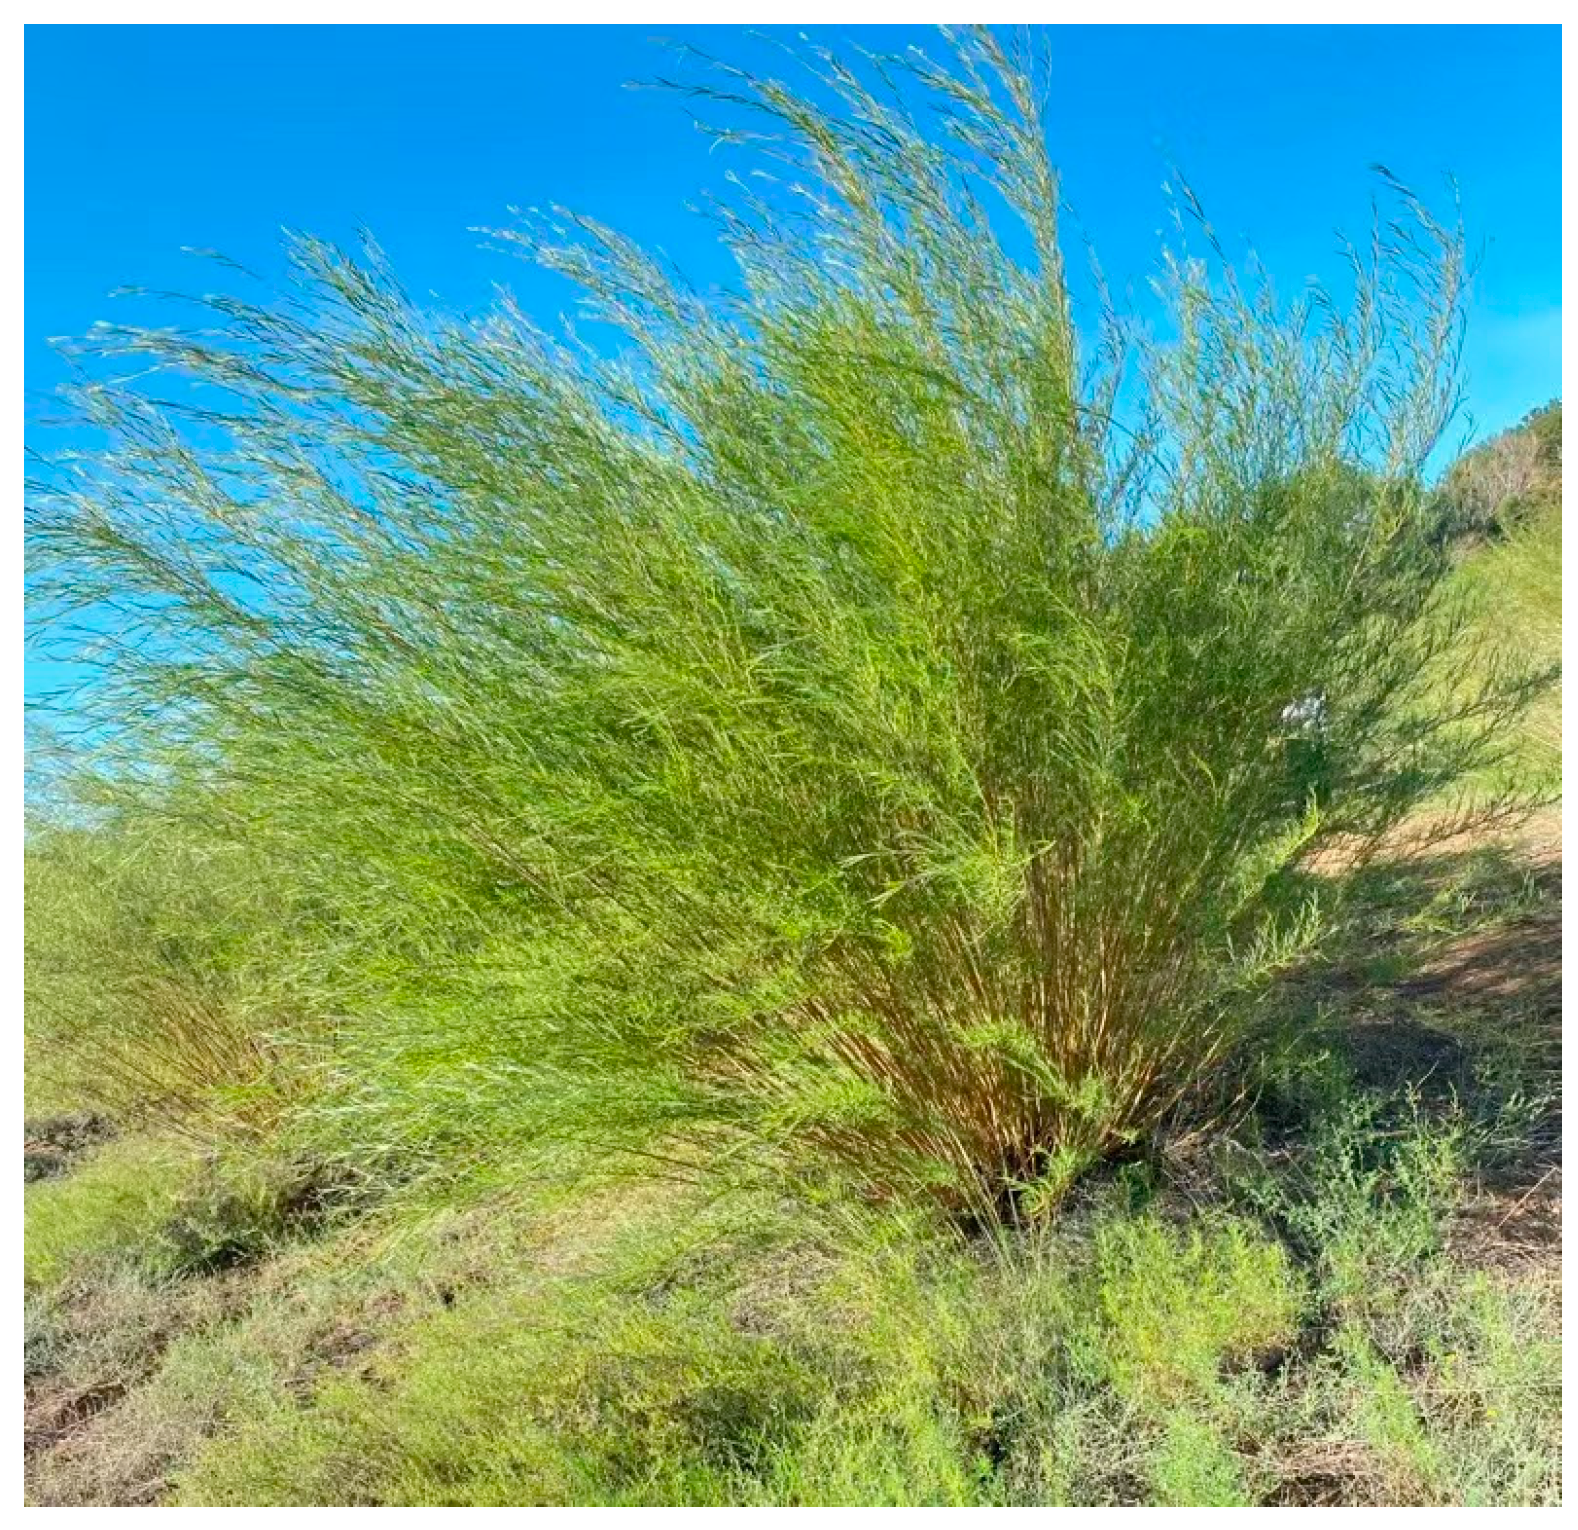
Figure 1. Map of S. psammophila in the test site.
Water 15 03098 g001
Figure 2. Map of Cao Sitan Ranger Station Area.
Water 15 03098 g002
Figure 3. Schematic diagram of Micro-Lysimeter and test site layout.
Water 15 03098 g003
Figure 4. Variation of daily dew of different irrigation levels of S. psammophila and control group.
Water 15 03098 g004
Figure 5. Variation of daily average dew amount and cumulative dew amount of different irrigation levels of S. psammophila and control group.
Water 15 03098 g005
Figure 6. Diurnal variation of surface dew at different locations under the influence of different irrigation levels of S. psammophila (a) the daily condensate water of AG; (b) the daily condensate water of CG; (c) the daily condensate water of DG; (d) the daily condensate water of NG.
Water 15 03098 g006aWater 15 03098 g006bWater 15 03098 g006c
Figure 7. Variation of cumulative surface dew in different locations under the influence of different irrigation levels of S. psammophila.
Water 15 03098 g007
Table 1. Information of S. psammophila sample trees.
GroupNumberPlant Height/mMaximum Canopy/mMinimum Canopy/mVegetation Coverage/%
AG12.642.932.9615
42.483.843.3528
72.473,353.0926
CG22.933.963.8232
82.553.642.9819
102.283.513.3621
DG32.384.194.0423
62.693.192.9819
92.922.982.9818
NG112.553.433.1921
122.473.532.7527
132.932.742.6712
Table 2. Results of multivariate analysis of variance on the effects of irrigation level, locations, and their interactions on surface dew.
FreedomFP
Irrigation level30.1980.898
location20.0030.997
Irrigation × location60.0141.000
Table 3. Results of correlation analysis between dew amount and meteorological factors.
TNTTDRHNRHRHDWsVPD
correlation coefficient−0.062−0.0700.189 **−0.068−0.0450.212 **−0.077 *−0.096 **
Note(s): * p < 0.05; ** p < 0.01.
Table 4. Results of correlation analysis between dew amount and meteorological factors in different locations.
Environmental FactorRootsHalf of the CanopyOutside the Canopy
T−0.119−0.049−0.050
NT−0.141−0.050−0.063
TD0.203 *0.195 **0.176 **
RH−0.173−0.040−0.052
NRH−0.125−0.031−0.025
RHD0.181 *0.243 **0.187 **
Ws−0.059−0.094−0.064
VPD−0.198 *−0.066−0.087
Note(s): * p < 0.05; ** p < 0.01.
Table 5. Results of correlation analysis between dew amount and meteorological factors at different irrigation levels.
Environmental FactorIrrigation GroupAGCGDGNGCK
T−0.072 *−0.0570.091−0.288 **−0.254 **−0.516 **
NT−0.079 *−0.0570.051−0.288 **−0.210 **−0.594 **
TD0.190 **0.161 *0.168 *0.285 **0.213 **0.234
RH−0.063−0.050−0.1190.027−0.0440.312
NRH−0.036−0.053−0.1090.133−0.0140.476 **
RHD0.212 **0.299 **0.1050.352 **0.251 **0.309
Ws−0.079 *−0.161 *−0.090−0.166 *0.012−0.032
VPD−0.102 **−0.042−0.017−0.223 **−0.274 **−0.376 *
Note(s): * p < 0.05; ** p < 0.01.
Table 6. The contribution of each meteorological factor to the condensation water.
TNTTDRHNRHRHDWsVPD
contribution value0.01490.01050.08160.05060.04240.01550.51940.2537
Disclaimer/Publisher’s Note: The statements, opinions and data contained in all publications are solely those of the individual author(s) and contributor(s) and not of MDPI and/or the editor(s). MDPI and/or the editor(s) disclaim responsibility for any injury to people or property resulting from any ideas, methods, instructions or products referred to in the content.