Article

Groundwater Contamination and Risk Assessment in Greater Palm Springs

by
Warda Khalid
1,2,
Muhammad Yousuf Jat Baloch
3,*,
Asmat Ali
2,
Mbega Ramadhani Ngata
4,
Abdulwahed Fahad Alrefaei
5,
Abdur Rashid
2,
Predrag Ilić
6,
Mikhlid H. Almutairi
5 and
Jamil Siddique
7
1
Environmental Protection Division, Zijin Mining Group, Longyan 364200, China
2
School of Environmental Studies, China University of Geosciences, Wuhan 430074, China
3
College of New Energy and Environment, Jilin University, Changchun 130021, China
4
Key Laboratory of Theory and Technology of Petroleum Exploration and Development, China University of Geosciences, Wuhan 430074, China
5
Department of Zoology, College of Science, King Saud University, P.O. Box 2455, Riyadh 11451, Saudi Arabia
6
Institute for Protection and Ecology of the Republic of Srpska, 78000 Banja Luka, Republic of Srpska, Bosnia and Herzegovina
7
Department of the Earth Sciences, Quaid-I-Azam University Islamabad, Islamabad 45320, Pakistan
*
Author to whom correspondence should be addressed.
Water 2023, 15(17), 3099; https://doi.org/10.3390/w15173099
Submission received: 25 July 2023 / Revised: 20 August 2023 / Accepted: 24 August 2023 / Published: 29 August 2023

Abstract

:
Groundwater is an essential resource for drinking water, but its contamination with potentially toxic elements and arsenic (As) is a global issue. To evaluate As and its levels in the Coachella Valley, the US Geological Survey (USGS) collected 17 groundwater samples. This study looked into the arsenic distribution, enrichment, hydrogeochemical behavior, and health risks associated with the samples. The comparative analysis between groundwater contamination in Greater Palm Springs and similar regions, could provide valuable insights into regional differences and common challenges. The hydrogeochemical facies showed the dominance of calcium and magnesium-bicarbonate-carbonate, indicating permanent hardness and salt deposits of residual carbonate. The Gibbs plot demonstrated that chemical weathering of rock-forming minerals and evaporation are the primary forces impacting groundwater chemistry. Geochemical modeling revealed saturation for calcite and dolomite, and under-saturation for halite. Principal component analysis identified the potential contributory sources for contamination of groundwater. The carcinogenic and non-carcinogenic potentials of the toxic elements arsenic, cadmium, chromium (VI), and lead were calculated using a human health risk assessment model. For both adults and children, the highest non-carcinogenic mean value was observed for arsenic (8.52 × 10⁻¹), with the lowest for cadmium (1.32 × 10⁻³). Children had the highest cumulative non-carcinogenic risk from potentially toxic elements. Our research offers crucial baseline data for assessing arsenic in groundwater at the regional level, which is important for health risk reduction and remediation programs. The data show that preventative action must be taken to reduce the potential health risks in the study area from drinking groundwater, particularly for children.

Graphical Abstract

1. Introduction

Groundwater (GW) is a vital resource that is essential for sustaining life on Earth, but chemical and microbial contamination are challenging issues in the protection of groundwater [1]. Groundwater has received much attention due to its exposure to contamination, including from potentially toxic elements (PTEs) that are persistent in the environment worldwide. This is an extremely important issue, and to ensure clean drinking water supplies assessment of groundwater is vitally important [2]. A recent study [3] utilized several types of machine-learning software to visualize the spatial distribution of PTEs for hazards to GW quality on a regional scale and suggested an extensive study for GW quality. Complete evaluation of groundwater for multiple purposes will be challenging. However, several pieces of literature that consider limited purposes are available [4,5,6]. Comparing studies [7,8] concluded that water risk assessment is an effective tool for water management, and global warming, and anthropogenic activities contribute to groundwater contamination, which has a significant impact on human health and ecological services.
The occurrence of PTEs, such as As, Pb, Cd, and Cr, in groundwater of the top most productive countries for research, including the USA, China, Pakistan, India, and Germany [9], were recorded as 4.10, 0.47, 0.05, and 0.52 ppb [10], respectively. Whereas in China, India, and Germany 2.0, 0.9, 5.0, and 4.0 ppb [11], As 8.61 ppb [12], Pb 196.15, Cd 10.11, and Cr 187.12 ppb [13] and the maximum concentrations as (µg L−1) of As, Pb, Cd were 35, 10, 21 in Germany [14]. Arsenic is a toxic metalloid found in groundwater that comes from natural sources as well as geogenic sources. There are about 150 million people throughout the world who are at risk of being exposed to increased levels of pollution in their drinking water. The carcinogenic effects can result in cancer of multiple organs, kidney failure, lung infections, hair loss, and skin diseases. The ingestion of As, even in trace amounts, has been associated with an elevated risk of cancer in humans according to a number of studies. It has been established that groundwater in Argentina, Bangladesh, Chile, China, Hungary, West Bengal (India), Mexico, Taiwan, Vietnam, and many portions of the United States contains high elevated concentrations of polluted arsenic (more than 50 g L−1). The release of dissolved ionic species into groundwater is a vast and significant source of concern in many different locations.
As is the most discussed potentially toxic element [15], which acts as the most potential carcinogen [16]. Millions of people are exposed to high As doses via drinking water, while successful implementation of As mitigation strategies requires public engagement [17].
Along with PTEs, contamination in GW may also be defined by elemental composition, physicochemical parameters, and stable isotope measurements. Elemental composition, including cations and anions, along with physicochemical variables, such as pH, total dissolved solids (TDS), and electrical conductivity, have previously been reported by [18]. However, GW is probably rich in isotopes [19].
This study explores the groundwater used for drinking water supplies and domestic purposes in Coachella Valley, California, which has one of the highest contamination levels of PTEs namely As, Cd, Cr, and Pb. This study also explored the characteristics of Coachella Valley groundwater based on a statistical analysis of physicochemical parameters, including PTE contamination resulting in carcinogenic and non-carcinogenic risk through the human health risk assessment model (HHRA model), to analyze the suitability of water for drinking purposes [20]. Moreover, the results demonstrate the potential health effects on humans in order to determine prevention and mitigation measures for a sufficient drinking water supply.
The objectives of this study are of great importance for Coachella Valley, California, given its geographic location and the nature of the water sources. First, the concentration of arsenic, fluoride, and PTEs in the groundwater needs to be investigated in order to properly identify the water quality status. Second, the origin of the groundwater should be assessed to understand the enrichment mechanisms for water contamination. Finally, the health risks of the water should be calculated for both children and adults living in the area using the US Environmental Protection Agency (EPA) equation, as this is a key factor in ensuring the safety of the local population. Ultimately, the findings of this study will provide valuable insight into the groundwater management of Coachella Valley, California.

2. Materials and Methods

2.1. Study Area

Coachella Valley, which encompasses some of California’s fastest expanding towns, stretches 72 km southeast of the San Bernardino Mountains to the Salton Sea, which is 24 km wide. The elevation of the valley floor ranges from 1600 feet (490 m) above sea level at the northern end to 250 feet (76 m) below sea level around the community of Mecca. The rainwater serves as recharge sources for the aquifer. The population of the valley varies between 500,000 in April, 200,000 in July, and 800,000 in January. The valley is bounded on the west by the San Jacinto Mountains and the Santa Rosa Mountains, on the north and east by the Little San Bernardino Mountains, and on the north by the Salton Trough, which includes the Salton Sea. Because of its pleasant weather, palm trees, and snowbirds, the valley is well-known as a winter resort destination. During the winter, daytime temperatures vary from 20 °C to 31 °C, and night-time lows range from 8 °C to 18 °C, with the majority of the precipitation occurring in winter. In the summer, daytime temperatures range from 40 °C to 44 °C, and night-time lows range from 24 °C to 30 °C. Los Angeles and San Diego receive their drinking water from the valley. In addition, the valley generates agricultural products, including fruits and vegetables, which were worth over USD 600 million in 2010.

2.2. Collection and Analysis of Groundwater Samples

The standard data for 17 groundwater samples were collected from 17 wells by the US Geological Survey (USGS) at different sites in 2021 (Figure 1) in the Indio sub-basin, Coachella Valley, California [21]. The samples were analyzed for water quality parameters, ionic species, PTEs, isotope ratios, and noble gases. Groundwater samples were characterized considering various sample times and dates, altitude of the land-surface datum (LSD) (feet), depth to the top of the perforated or open interval (feet below LSD), depth to the bottom of the perforated or open interval (feet below LSD), and the well depth (feet below LSD) (Table S1).
The pH, electrical conductivity (EC), total dissolved solids (TDS), total hardness (TH), and turbidity were evaluated in the study area using the multi-parameter analyzer (Hanna HI9829, Hanna Instruments, Smithfield, RI, USA). The samples were examined for significant anions, such as NO3−, SO42−, and PO43−, using a UV-VIS spectrophotometer (EMC Lab Instruments, Duisburg, Germany). The concentration of F was determined using “Mohr’s method and Fluoride Analyzer” ISE (ion-selective electrode). Bicarbonate (HCO3) and chloride (Cl) were determined using titration. Calcium (Ca2+) and magnesium (Mg2+) concentrations were measured by volumetric titration with ethylenediaminetetra-acetic acid. A flame photometer was used to measure sodium (Na+) and potassium (K+) concentrations. Iodine (I) was measured by benchtop photometers and arsenic (As) was determined in the samples using an atomic absorption spectrophotometer.
To check the accuracy of the results, the charge balance error (CBE) for each sample was calculated using Equation (1) (ionic concentrations are measured in meq/L). Groundwater samples containing ±5% CBE were chosen for further analysis.
% C B E = [ c a t i o n s a n i o n s ] c a t i o n s + a n i o n s × 100

2.3. Statistical Analysis

Statistical analysis of groundwater physicochemical parameters is shown as a range, mean, and standard deviation is compared to the world health organization (WHO 2011) standards [22]. To evaluate the factors influencing groundwater quality, statistical analyses, such as Pearson correlations and principal component analysis (PCA), were performed using XLSTAT 2019 (XLSTAT, Paris, France) and Origin version 2022 for Windows 10 (Microsoft, Redmond, WA, USA). For the prevalent groundwater chemistry, a Piper diagram [23] was drawn using Golden Software Grapher 18.3 (Golden Software, Golden, CO, USA) for the dominant groundwater chemistry. The Origin version 19 Gibbs plot [24] describes the effects of rock–water interaction, evaporation, and precipitation.

2.3.1. Geochemical Modeling

The mineral saturation levels were calculated using the PHREEQC version 2.0 software program (USGS) [25]. The saturation index (SI) was used to show that the properties of the representative mineral phases, such as calcite, dolomite, gypsum, and halite, are essential in the region under study. Equation (2) was used to determine the SI, which describes the thermodynamic tendency of minerals to precipitate or dissolve:
SI = log (IAP⁄Ksp) = logIAP − logKsp
IAP denotes the ion activity product for dissociated species in solution, and Ksp denotes the equilibrium solubility product for compounds involved at sample temperature. When SI = 0, this indicates a hydrochemical equilibrium state, whereas negative and positive values for SI indicate mineral undersaturation and oversaturation, respectively.

2.3.2. Human Health Risk Assessment Model (HHRAM)

The United State Environmental Protection Agency (US-EPA) proposed that public health concerns quantify the potential health effects of drinking PTE contaminated groundwater [26]. The HHRA model was used to evaluate the toxicity of PTE levels found in contaminated Coachella Valley groundwater [27]. The calculated values for As, Cr, Pb, and Cd are given in Supplementary Table S2. The ingestion rate for children and adults exposed to PTEs from groundwater in terms of daily metal intake (DMI) was calculated according to Equation (3). The hazard quotient (HQ) was used to calculate the non-carcinogenic risk according to Equation (4). In contrast, the cancer risk assessment determined the carcinogenic risk (CR) according to Equation (5) [28].
DMI_ingestion = C × (EF × ED × IngR)/(BW × AT) × 10−3
HQ = DMI/RfD
Risk (CR) = DMI × CSF
The DMI (in mg−1 kg−1 day−1) indicates the PTE levels in groundwater in Coachella Valley.

3. Results

3.1. Characteristics of Coachella Valley Groundwater

Table 1 summarizes the basic parameters for Coachella Valley groundwater, such as depth, pH, TDS, dissolved oxygen (DO), temperature, and specific conductance (SC). For all the Coachella Valley groundwater samples, groundwater depth ranged from 215 to 1475 feet, and pH values ranged from 7.3 to 9.3, with a mean value of 8, indicating that the groundwater in nature is neutral to alkaline [28]. The TDS levels in the samples ranged from 163 to 11,800 mg L−1, with a mean value of 2634.1 mg L−1. Ions leaching into the groundwater system could cause elevated values of TDS [29]. DO concentrations ranged from 0.2 to 13.1 mg L−1 in all selected Coachella Valley groundwater samples, with a mean value of 5.3 mg L−1. The temperature range was found to be 20–31 °C, with a mean value of 24.8 °C, indicating an enhanced rate of pollutant uptake due to higher physiological activity and decreased oxygen solubility [30]. The current investigation also observed high and low values for SC of 18,800 µS cm−1 and 283 µS cm−1.
All the field parameters for the groundwater samples revealed that the pH and temperature were within the WHO allowable limits [22], whereas 3 of the 17 wells had high TDS values, suggesting a high concentration of dissolved ions [31]. This can cause gastrointestinal discomfort in humans by lowering palatability [32]. DO levels were found to be low in nine of the wells and increased in three wells.

3.2. Concentration of Dissolved Components

Table 2 summarizes the concentrations of dissolved components in groundwater from Coachella Valley. Anion concentrations for Br, Cl, F, I, SO42−, ClO4, HCO3, CO32−, and NO3 were in the ranges 0.02–8.5, 5.9–6840, 0.1–6.8, 0.001–1.3, 13.6–1570, 0.15–4.4 mg L−1, and 22.9–236, 0.1–8.1, and 0.4–16.8 mg L−1, respectively, with a mean content of 0.6, 497.7, 1.3, 0.1, 268.6, 1 mg L−1, and 118.2, 1.5, and 4.14 mg L1. The high concentration of Br-, was previously reported by [33], suggests that salinity increases as the Na⁺ and Cl concentration increases. The range of SO42− surpassed WHO limits and can result in laxative effects in humans, while the lower concentration of F, in 10 out of the 17 wells, indicates fluoride deficiency, which can result in weak bones and teeth [34]. The availability of anions was shown to occur in the following order: SO4 > HCO3 > NO3 > F > CO32− > ClO4 > Br > I.
The concentration range of the major cations, namely, Ca2⁺, Mg2⁺, K⁺, and Na⁺, in groundwater from Coachella Valley was 2.1–1350, 0.04–107, 0.5–21.9, and 28.1–2670 mg L−1, with a mean concentration of 161.1, 16.5, 6.2, and 268.2 mg L−1, respectively. According to WHO 2011, the permitted limits for Ca2⁺, Mg2⁺, K⁺, and Na⁺ are 100, 50, 12, and 200 mg L−1, respectively, thus the predominance of the cations in the groundwater samples is in the following order: Ca2⁺ > Na⁺ > K⁺ > Mg2⁺, as previously reported for the Southern Gangetic Plain by [35]. Because of the high concentration of Na⁺ found in the current investigation, weathering of silicate rocks and processes of ion exchange with clay were also confirmed. In contrast, the average Mg2⁺ and K⁺ concentrations are within the permitted range. The general trend in the order of both types of ionic species was determined to be as follows: Cl > Ca2⁺ > Na⁺ > Br > F > HCO3 > K⁺ > Mg2⁺ > CO32− > NO3 > ClO4 > I.
Elements such as SiO2, Al, Sb, Ba, B, Fe, and CaCO3 ranged in concentration from 12.1–25.6, 9–45, 0.123–0.4, 1.6–248, 22–940, 5.1–334 mg L−1, and 18.9–194 mg L−1 with mean values of 18, 9, 0.04, 65.3, 184.4, 29.9 mg L−1, and 99.6 mg L−1, respectively (Table 2). Antimony (Sb), Ba, B, and CaCO3 all exceeded the WHO limits. At the same time, Al and Fe were found to be within the WHO limits [22]. The elements followed the trend of B > Ba > CaCO3 > Sb > Fe > Al.

3.3. PTE Distribution in Coachella Valley Groundwater

The concentration ranges for the PTEs (As, Cd, Cr VI, and Pb) were 0.1–125, 0.033–0.32 mg L−1, 0.05–37.1, and 0.02–0.75 µg L−1, with mean concentrations of 21.3, 0.05 mg L−1, 5.40, and 0.12 µg L−1, respectively (Table 3). The concentration of PTEs increased according to the following trend: As > Cd > Cr(VI) > Pb. Thus, 16 out of the 17 samples have an excess level of As, and 7 samples have an excess level of Cd, according to the WHO criteria [22]. The highest levels of As and Cd (125, 0.32 mg L−1) were found at a depth of 700 feet, while the lowest levels of As (0.1 mg L−1) and Cd (0.033 mg L−1) were found at 500, 590, 600, 775, 1129, and 1475 feet. Both Cr and Pb were found to be within acceptable limits.

3.4. Geochemical Evolution of Groundwater

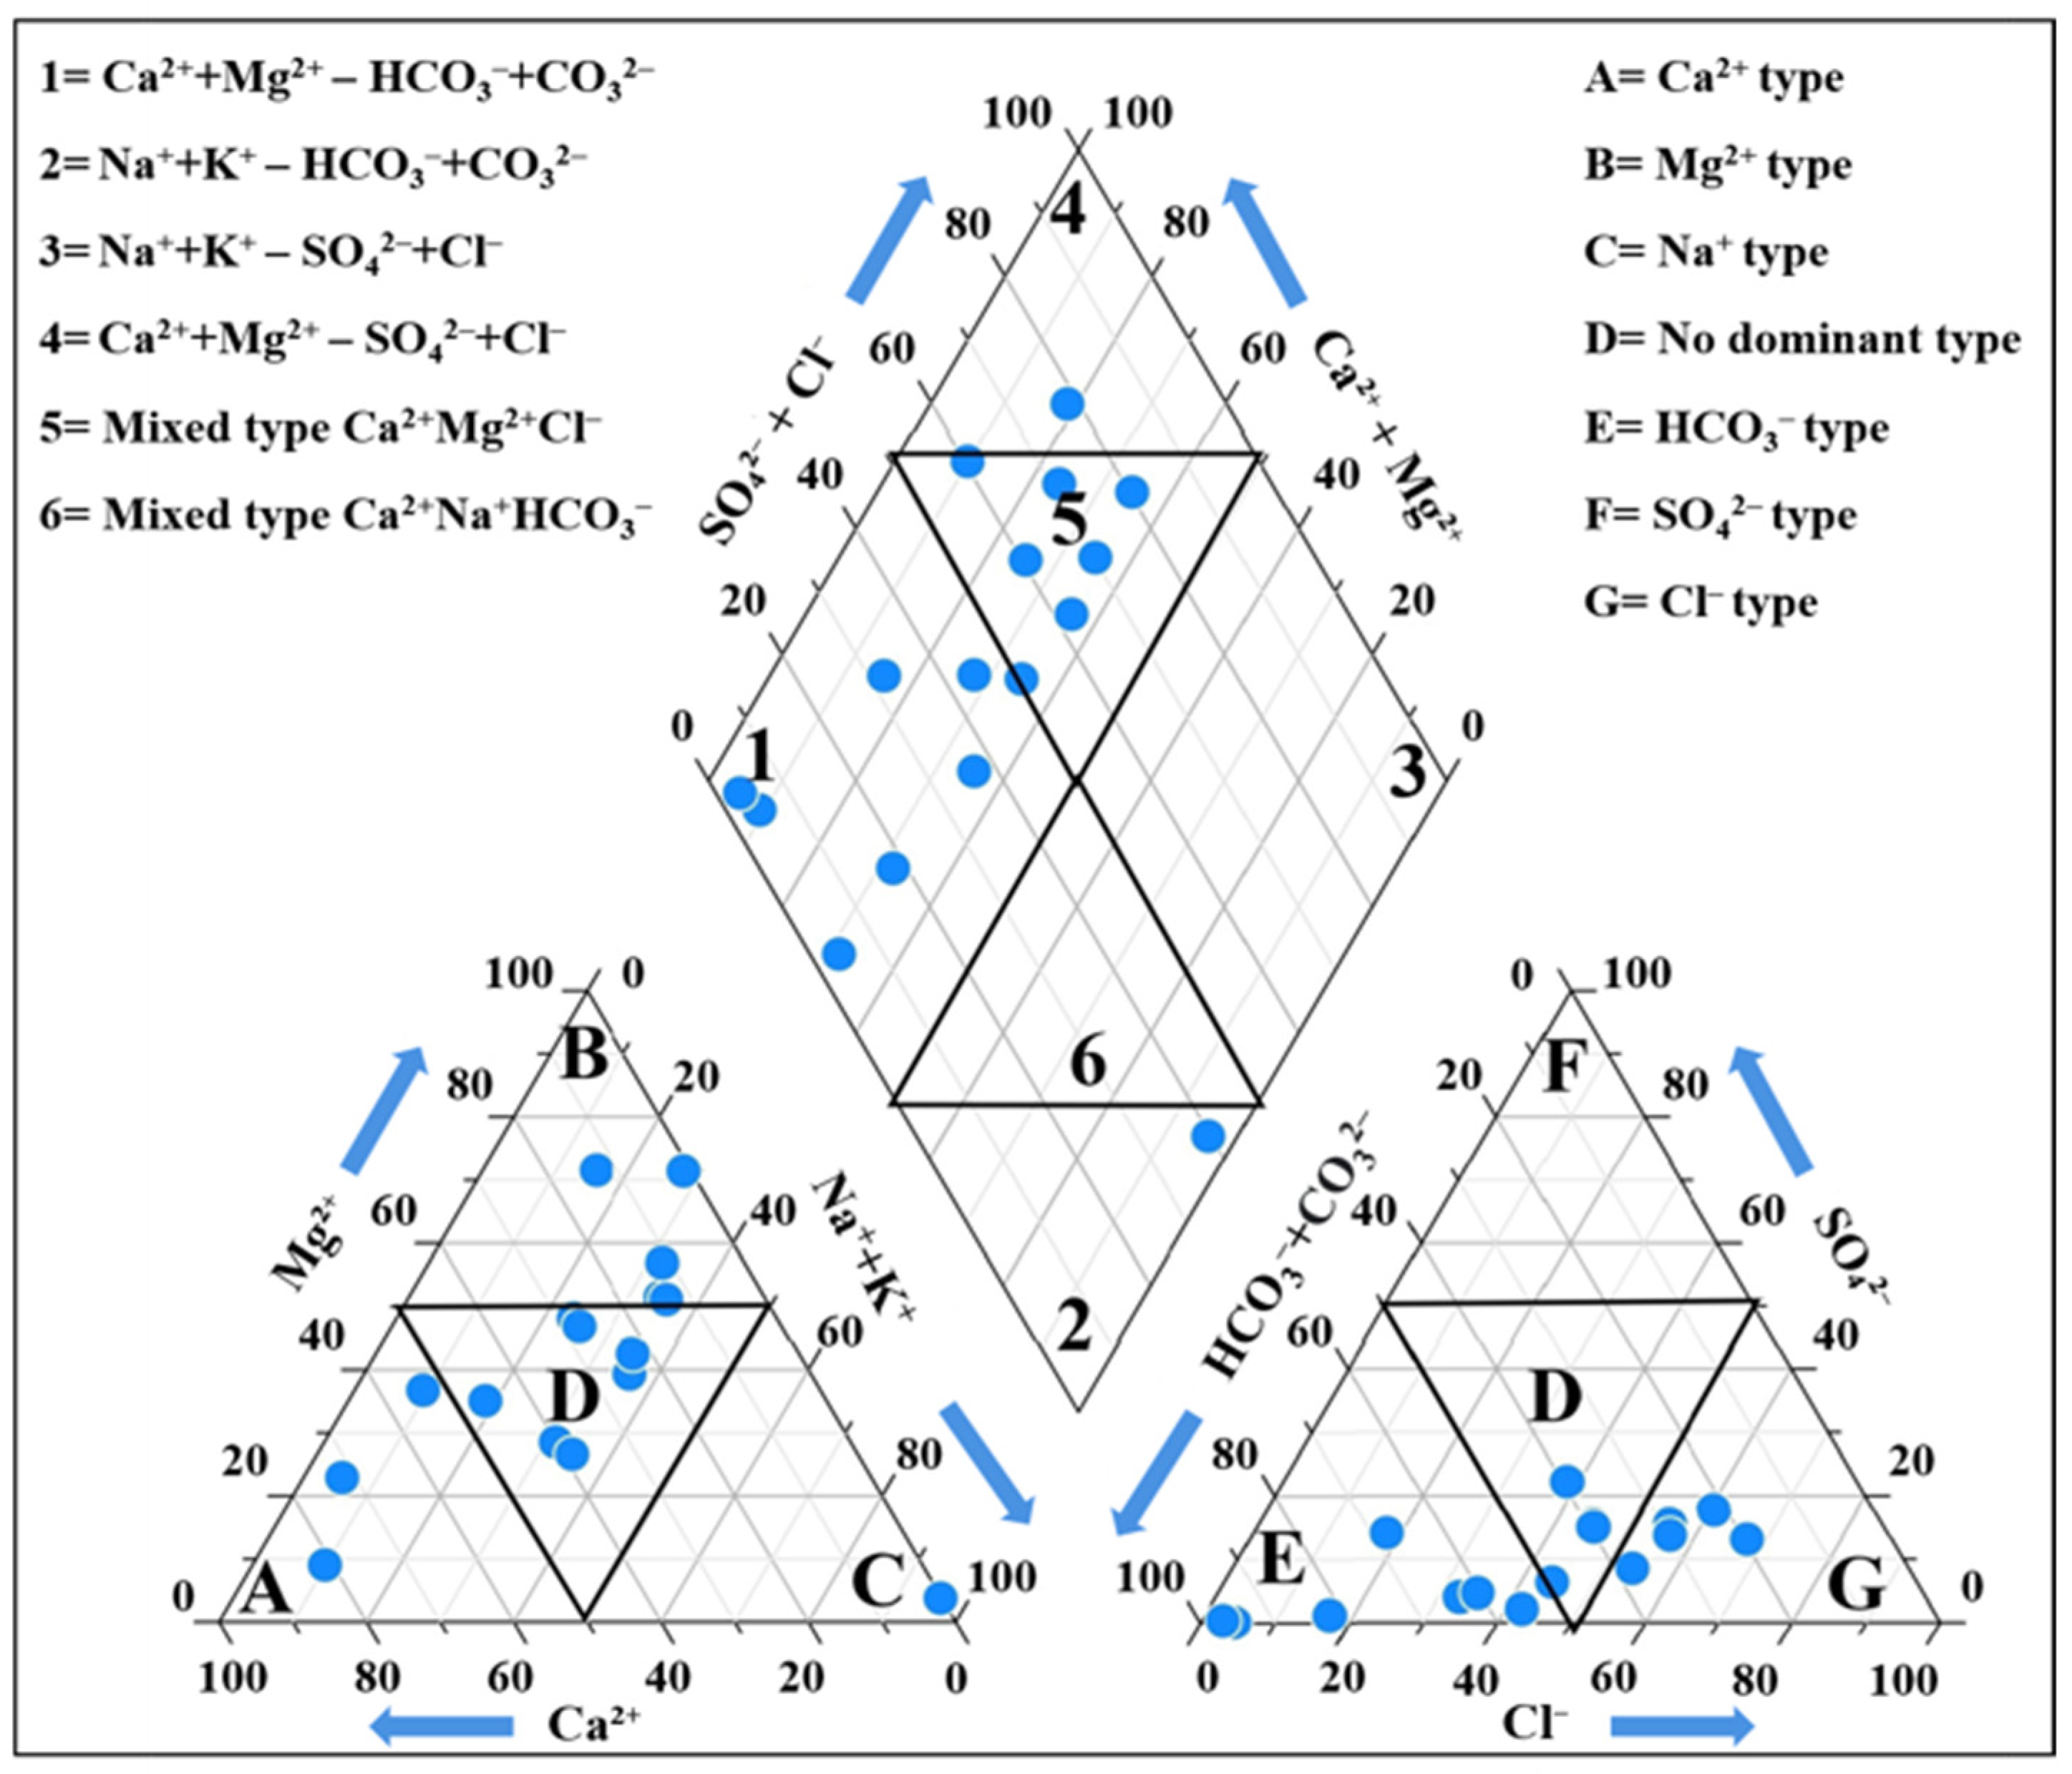
3.4.1. Geochemical Facies of Groundwater

Hydrogeochemical facies refer to the amounts of water that differ in their chemical composition based on solution dynamics, rock–water interactions, geology, and pollution sources. Ref. [23] discovered a simple method for classifying and comparing groundwater chemistry by displaying the chemical data on a trilinear diagram (Figure 2). Based on the ionic composition, six major varieties of water were identified. The majority of groundwater samples were from the first zone (Ca2⁺ + Mg2⁺–HCO3 + CO32−) and the fifth zone (i.e., mixed-type Ca2⁺Mg2⁺Cl), with only one sample from the second (Na⁺ + K⁺–HCO3 + CO32−) and fourth (Ca2⁺ + Mg2⁺–SO42− + Cl) regions, indicating that the groundwater possesses permanent hardness and salt deposits of residual carbonate, which causes foaming. The left side of the Piper diagram reveals that most of the samples are in the D and B zones, whereas the majority of the samples on the right side are in series at the bottom in the E, D, and G zones, with no samples in the F zone. As a result, groundwater is dominated by Ca2⁺, Mg2⁺, HCO3, and Cl, indicating ion exchange and silicate weathering [36,37]. A Gibbs plot was used to further investigate these findings.

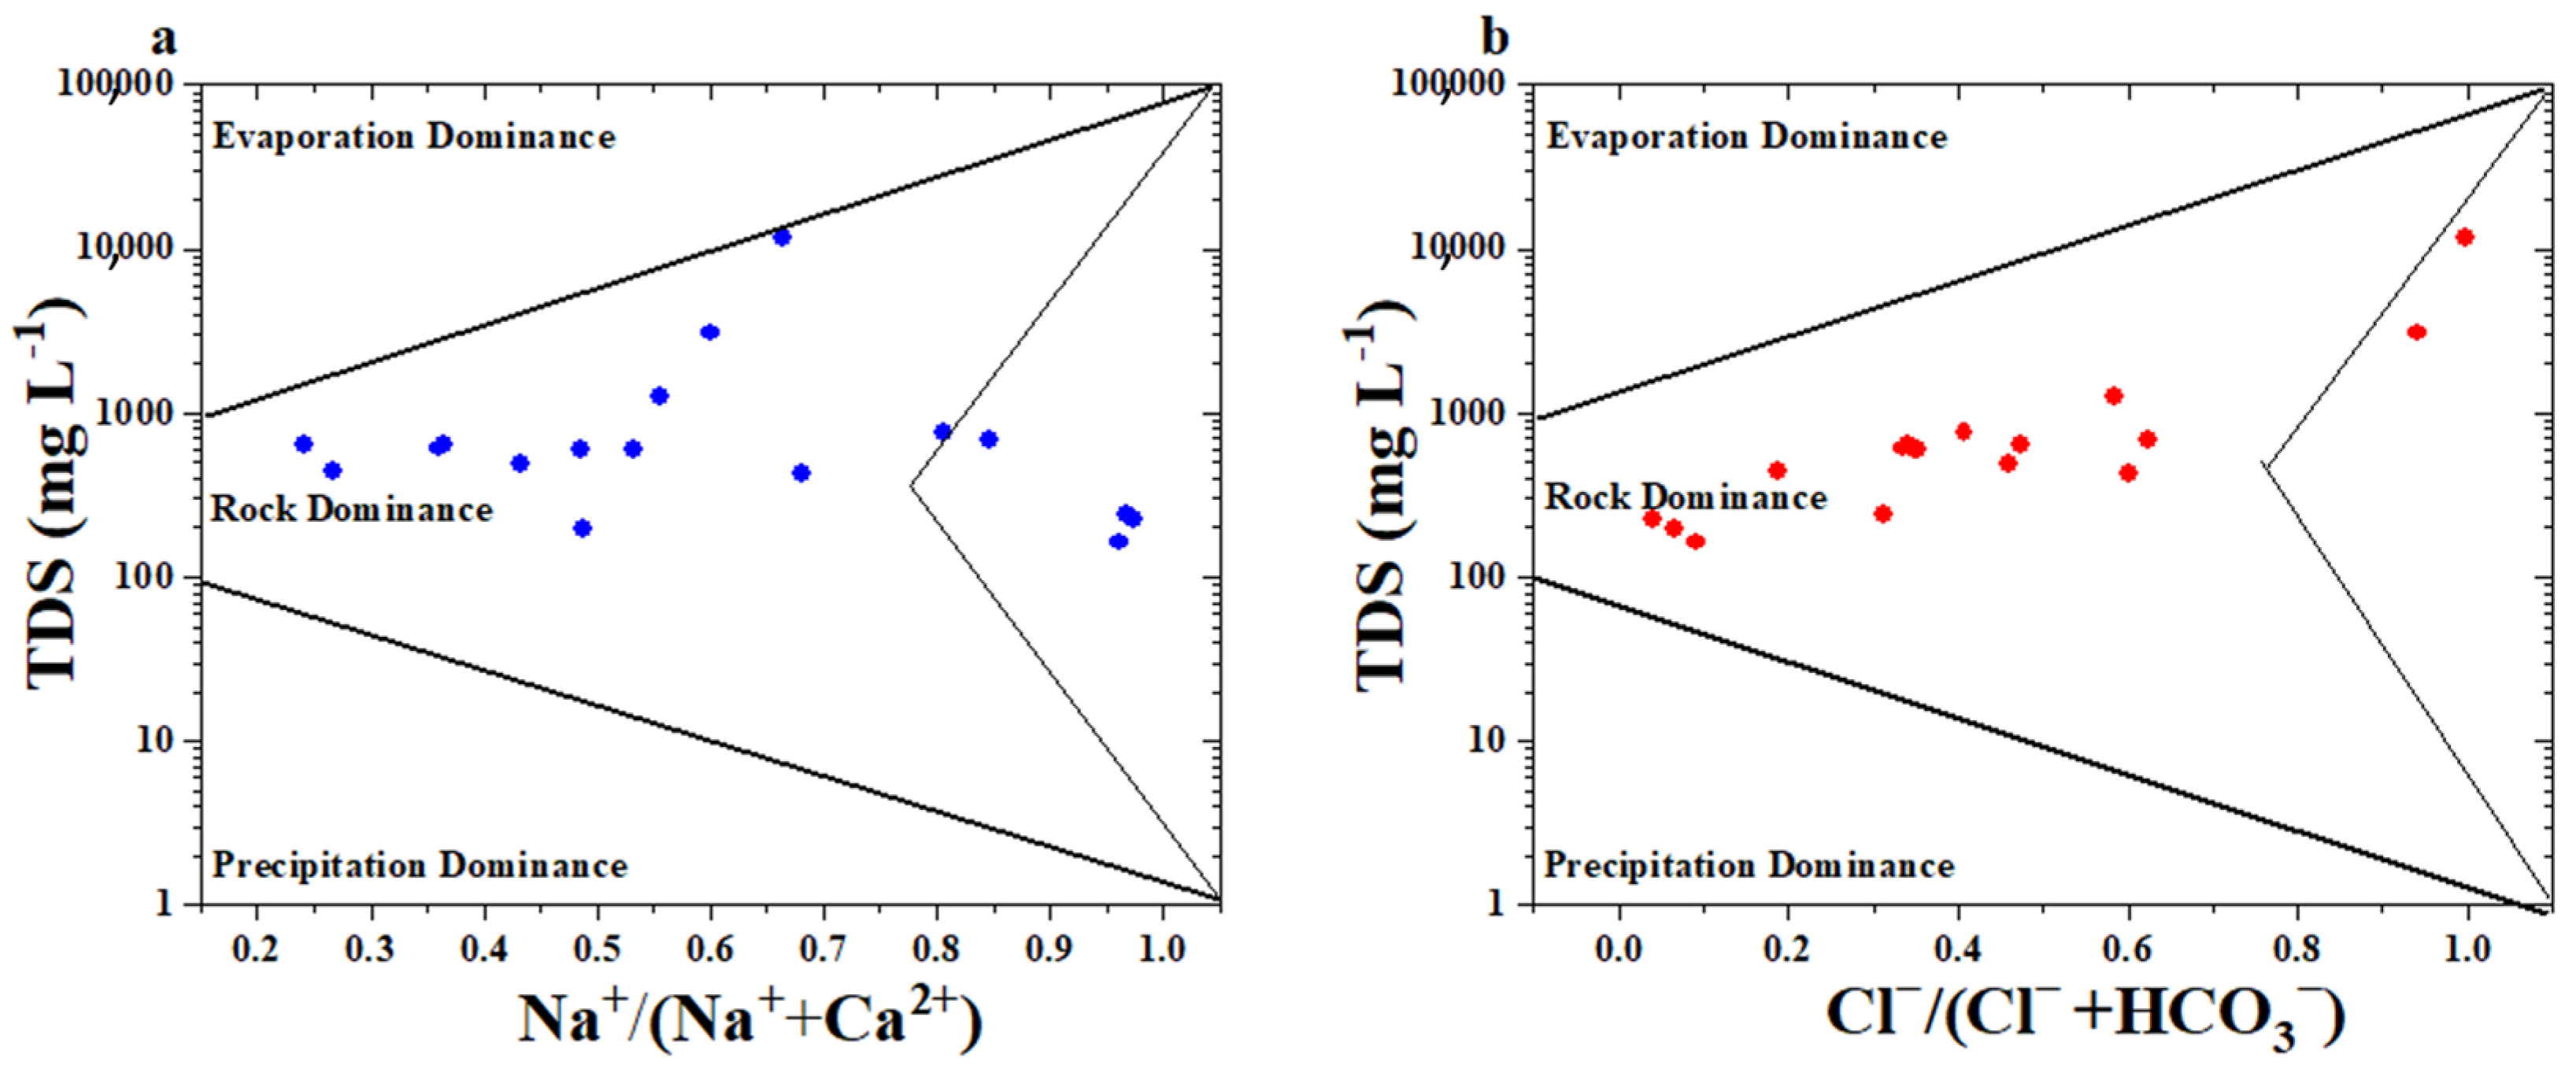
3.4.2. Hydrogeochemical Processes

To determine the effects of water–rock interaction, evaporation, and precipitation on the groundwater chemistry, a Gibbs plot [24] of TDS versus the weight ratios of Na+/(Na+ + Ca2+) Figure 3a and TDS versus the weight ratios Cl/Cl + HCO3 were produced, as shown in Figure 3b. The findings from this plot suggest that the main factors impacting groundwater chemistry in the area examined are chemical weathering of rock-forming minerals and, to a lesser degree, evaporation. Chemical weathering and human activities enhance evaporation, which raises the TDS levels. As a result, samples tend to move from the rock-dominant region to the evaporation zone [38,39,40].

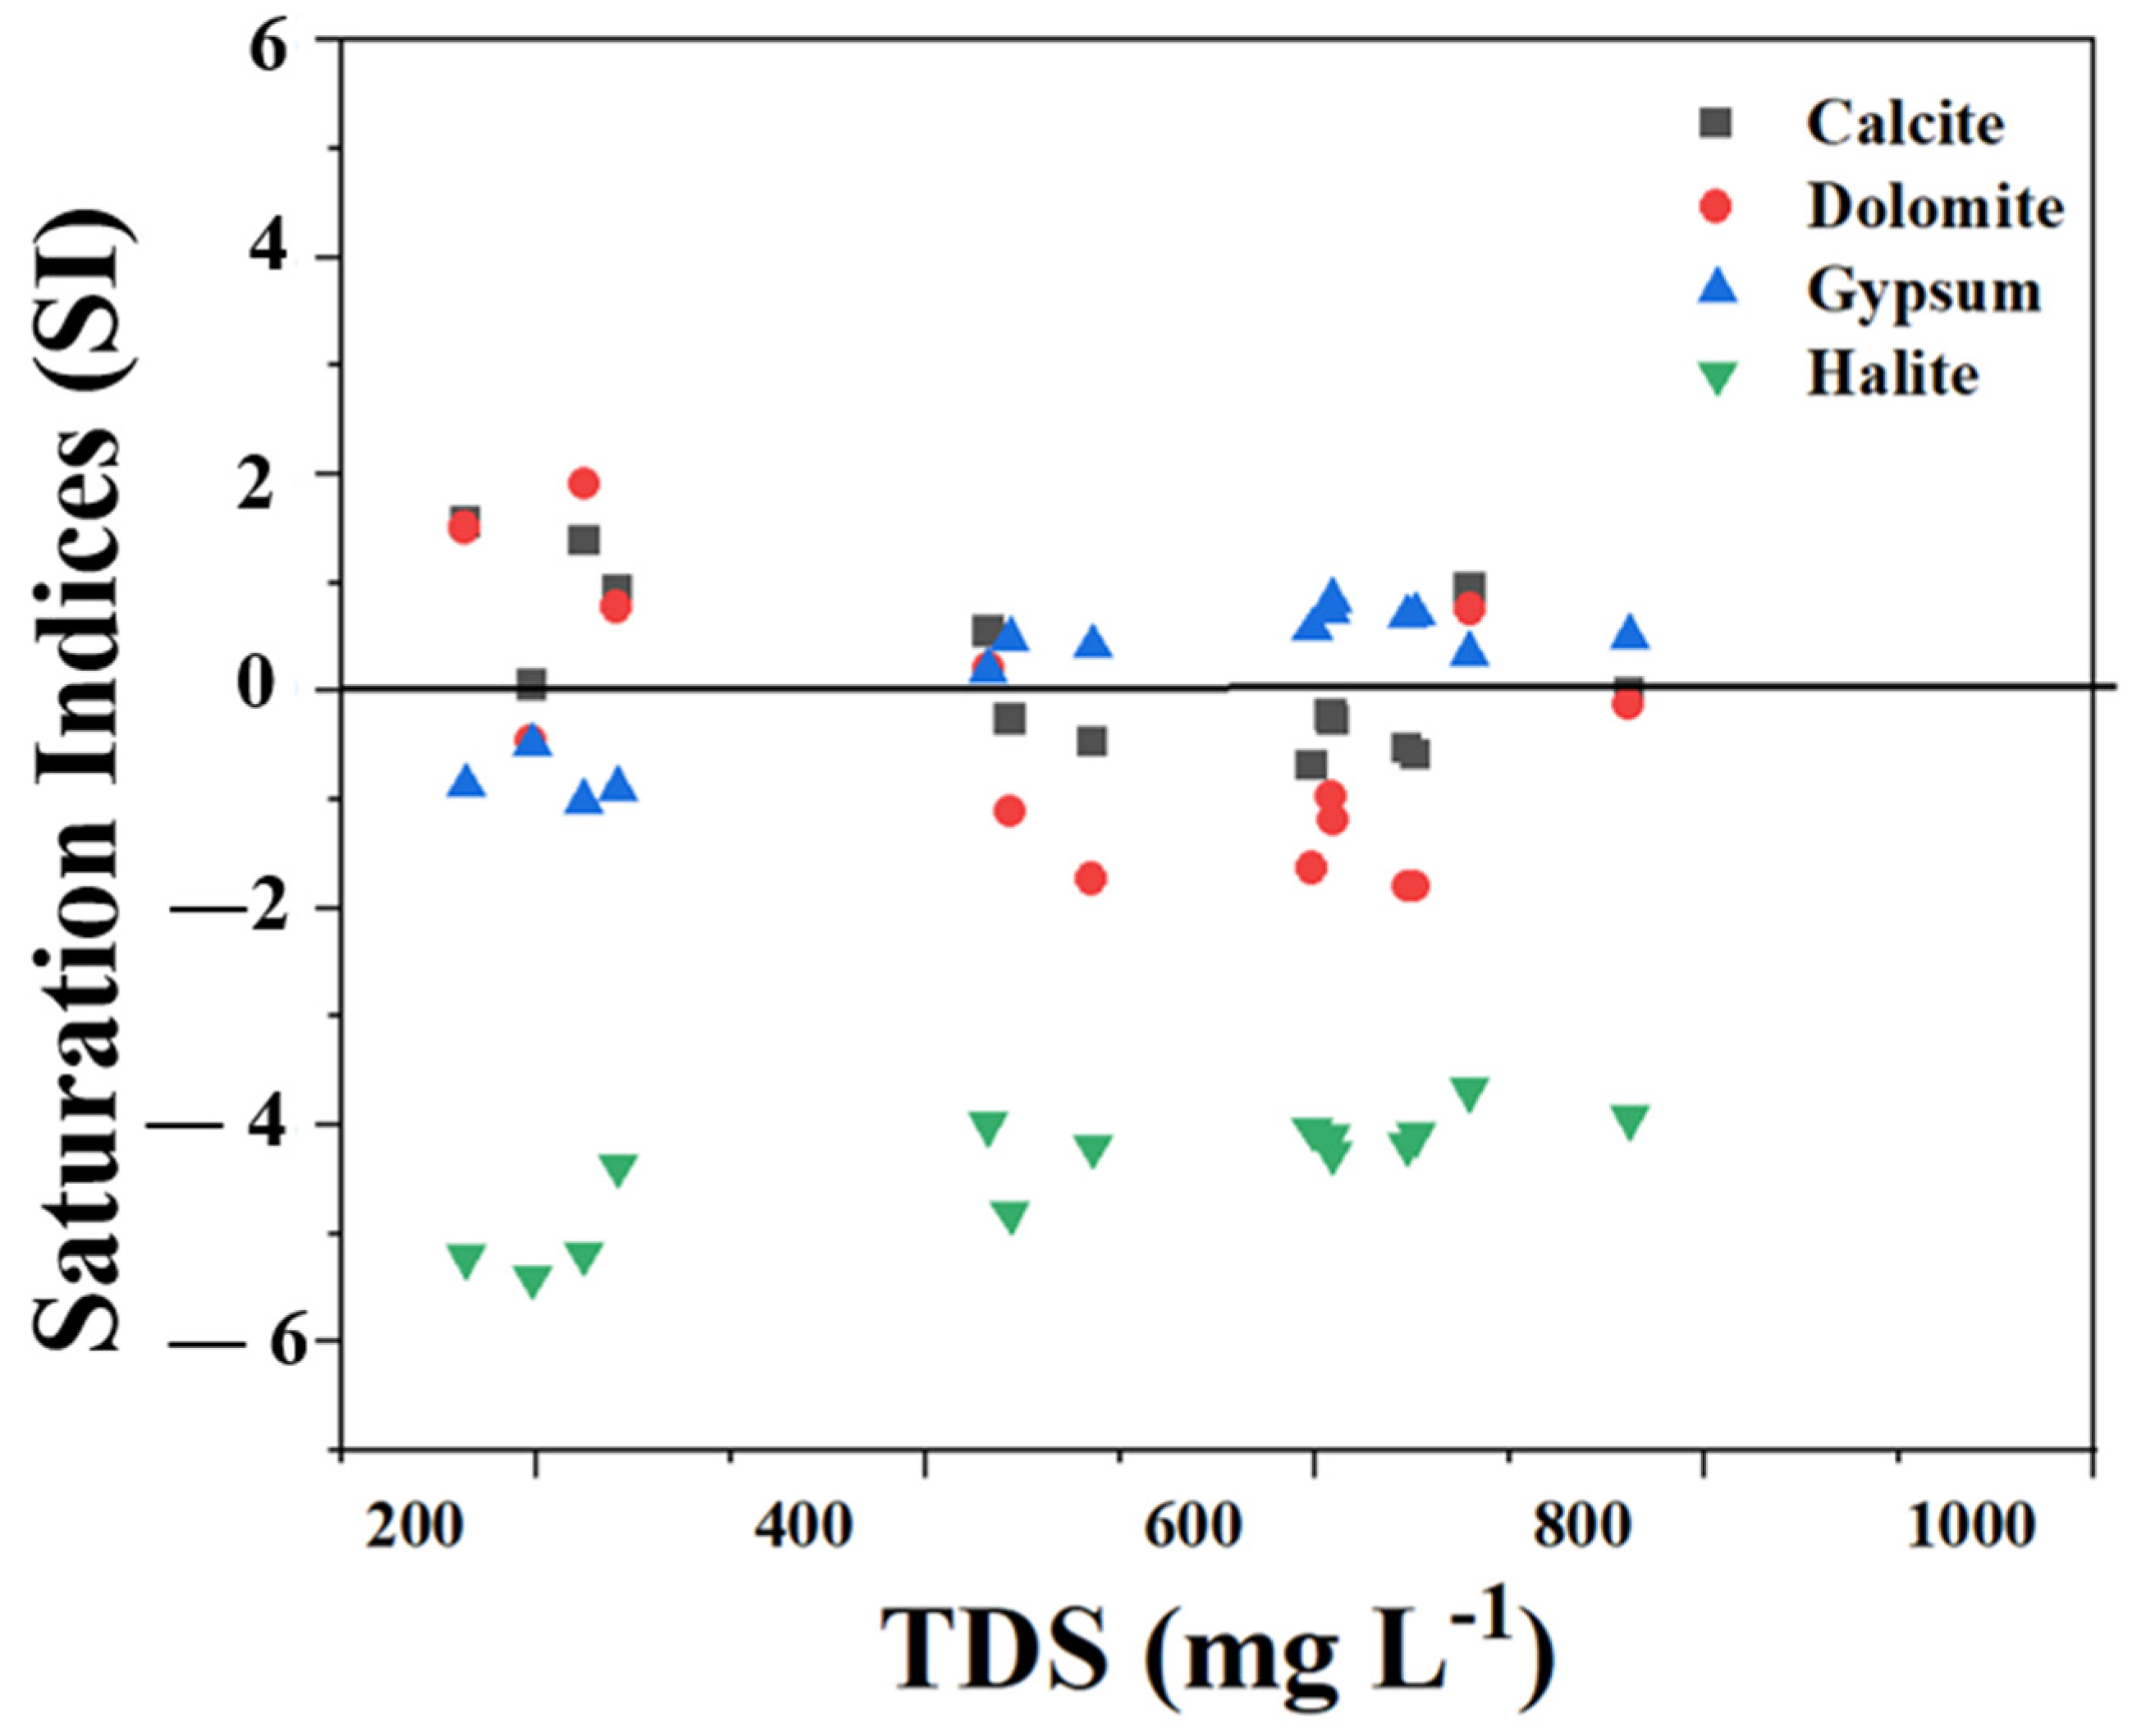
3.4.3. Mineral Saturation Index

Table S3 and Figure 4 show the saturation index values of the carbonate minerals, such as calcite, dolomite, gypsum, and halite minerals. Carbonate concentrations result from the presence of carbonate in the soil zone formed by weathering of geological minerals. Because the minerals calcite and dolomite are precipitated, the source of minerals with unsaturation (SI < 0) are halite (NaCl), with an average value of −3.57322, and dolomite [(CaMg(CO3)2], with an average −0.738. These mineral phases exhibiting negative SI values are unlikely to precipitate, but their dissolution may play an important role in releasing primary contaminants into the aquifer. By contrast, the oversaturation (SI > 0) with calcite (CaCO3), with an average of 0.164, and gypsum (CaSO4·2H2O), with an average of 0.702, indicates that the mineral is supersaturated and tends to precipitate in the groundwater [41].

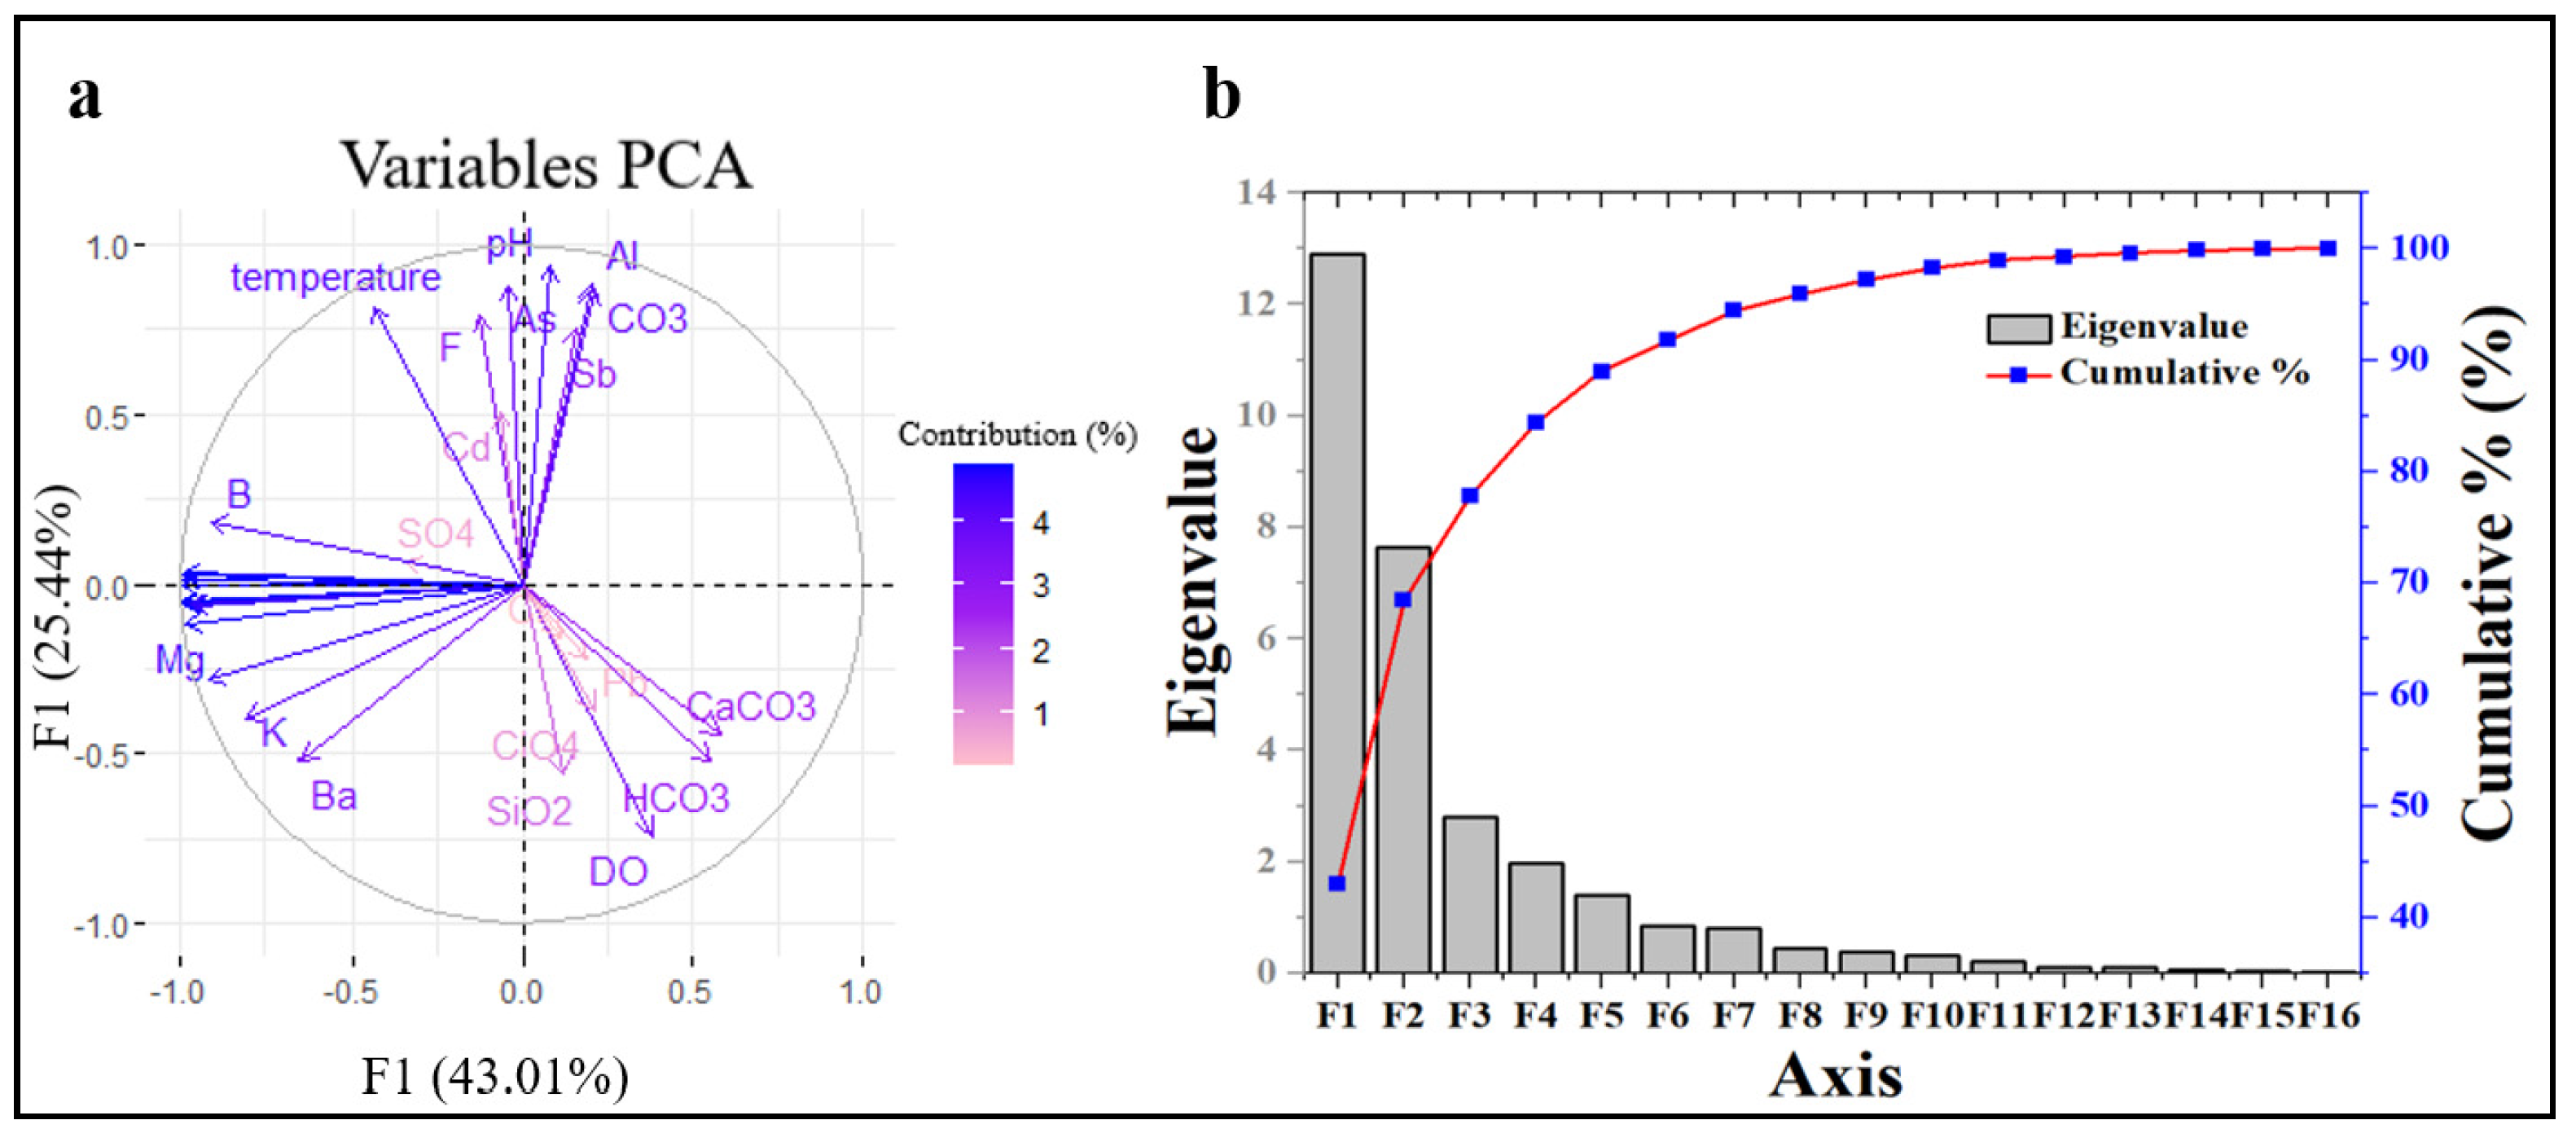
3.5. Principal Component Analysis and Pearson Correlation Analysis

To evaluate all the geochemical processes occurring in the groundwater samples, the correlation coefficient values (r) in the groundwater for drinking were calculated using an efficient Pearson’s formula [42]. Table 4 exhibits the PCA results for n = 17 groundwater samples. PCA multilinear regression (PCA-MLR) was used in this study to extract five principal components (factors) based on eigenvalues (eigenvalue > 1) and total variance. The PCA results yielded three factors (F1, F2, and F3). With an eigenvalue of 26.69, these three rotating principal component factors explained 77.80% of the variance (Figure 5a,b).
F1 variability was 43.02%, with eigenvalues of 12.905. TDS (0.994), SC (0.991), Ca (0.982), Mg (0.911), K (0.804), Na (0.993), Br (0.963), Cl (0.970), I (0.989), B (0.915), Fe (0.992), and Li (0.994) all had high positive loading. Factor F1 was dominated by groundwater variables, revealing their genesis from geogenic sources, weathering of acidic, mafic, and sulfide rocks, water–rock interaction, and ion exchange processes [43].
F2 explained 25.45% of the variance, with eigenvalues of 7.634, and a strong positive loading for pH (0.934), temperature (0.796), F (0.790), Al (0.884), Sb (0.755), As (0.875), Cd (0.523), and CO32− (0.871). The high loading of pH and temperature in the study area influences the As, F, and other parameters. Factor F2 originates from anthropogenic sources. namely effluent from steel industry and wood industries [44].
F3 explained 9.34% of the variance, with eigenvalues of 2.802. This indicates that there is no factor with a high load. Except for SO42− (0.776) and Cd (0.592), almost all factors were in the negative or very low factor loading range, indicating that anthropogenic activities, such as sewage, landfill, metal industry, and mining may contaminate the groundwater [45]. F1 and F2 are the main high-loading factors; thus, these factors were built in a biplot and demonstrated 68.46% variability (Figure 5a).
Extraction method: principal component analysis. Rotation method: Kaiser normalization of Varimax. Bold values show higher loading value.

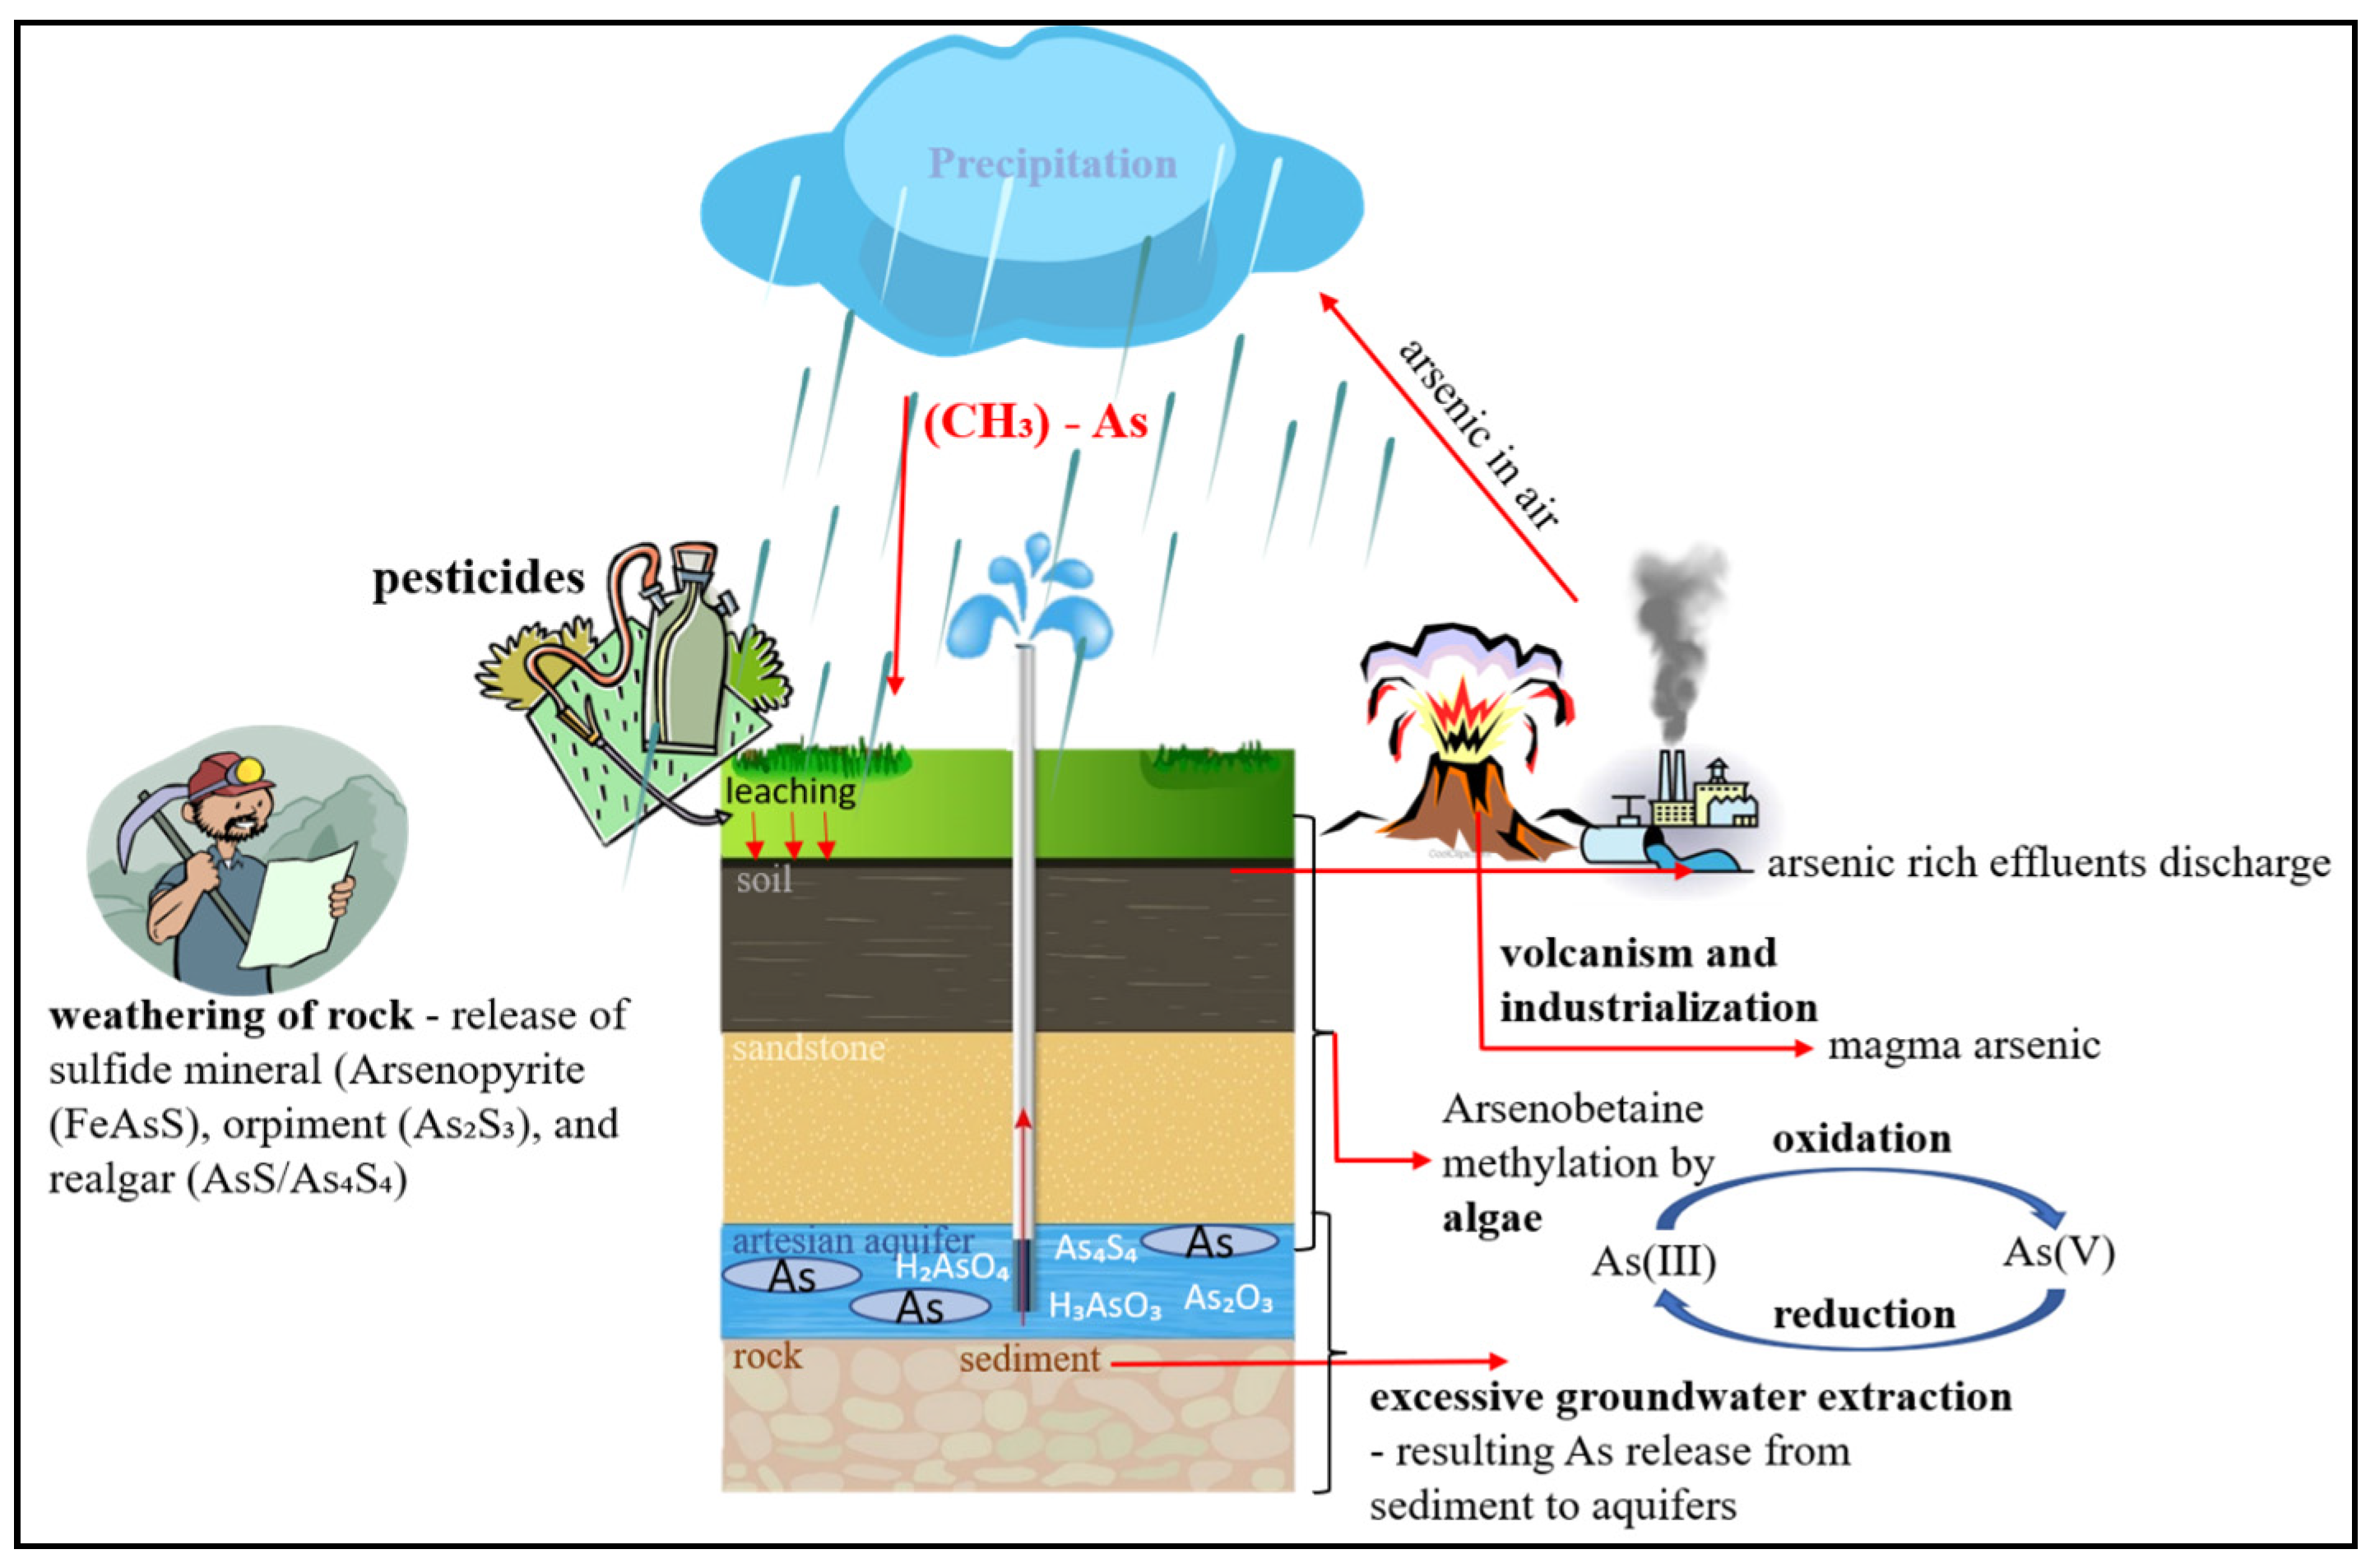
3.6. Arsenic Mechanism in Groundwater

Arsenic in groundwater is typically found in two forms: arsenite (As(III)) and arsenate (As(V)) [46]. Arsenite is more toxic than arsenate and is more mobile in groundwater [47]. Arsenic enters groundwater through natural processes, such as weathering of rocks and minerals, or through human activities, such as mining, smelting, and use of arsenic-containing pesticides, as shown in Figure 6. Once in the groundwater, arsenic can be transported and transformed by chemical and biological processes; another possibility is that microbes themselves harbor that capacity to directly dissolute metal-bearing minerals and release metals [48]. Organic matter is important for metal mobilization in the aquifer [49]. Biological processes include microbial reduction of arsenate to arsenite [50] and microbial oxidation of arsenite to arsenate [51], which influence the mobility and toxicity of arsenic in groundwater [52]. Furthermore, minerals such as FeCO3 react with natural calcium carbonate, potentially triggering aquifer disintegration and releasing As into the groundwater. The presence of natural organic chemicals and microbial activity potentially contribute to groundwater contamination. Sulfur is also released by anthropogenic sources, such as coal mining.

3.7. Health Risk Assessment

Health risk assessment was calculated for the 17 wells to analyze carcinogenic and non-carcinogenic risk, including DMI, HQ, and risk of exposure through ingestion, for children and adults. Table 5 shows all the RfD values for ingestion [53]. DMI values for As, Cd, Cr, and Pb were higher in children than in adults due to the differences in body weight [54]. The highest HQ non-carcinogenic mean value was observed for As, while the lowest HQ mean value for Cd was observed in children as mentioned in Table 5. However, HQ values for all PTEs were lower than the standard limit (HQ < 1), indicating a non-carcinogenic risk to both adults and children. The HQ ingestion of PTEs in children was higher than in adults. In both children and adults, the trend in risk in descending order is as follows: As > Cd > Cr > Pb.
The CR values for PTEs were found to be lower than the US EPA (2001) [55] standard limits (Table 5). At the same time, the mean HI values for all PTEs in children and adults were lower than the US EPA guideline values and followed the same increasing trend (As < Cr < Pb < Cd). Compared to adults, children had the highest cumulative non-carcinogenic risk from PTEs. Thus, maximum control and prevention of potential health risks in the groundwater in the Indio Sub-basin of the Coachella Valley, California, are required, as well as immediate attention to PTE exposure, particularly in children [56].

4. Conclusions

This research examined the predominance of potentially toxic elements and arsenic contamination in the groundwater of Greater Palm Springs, Coachella Valley, California, and assessed its health risks. The results from a Piper plot indicate the dominance of Ca2⁺ + Mg2⁺–HCO3 + CO32− and mixed-type Ca2⁺Mg2⁺Cl, which are representative of groundwater with permanent hardness and salt deposits from residual carbonate. A Gibbs plot indicated that chemical weathering of rock-forming minerals and evaporation were the primary variables affecting the groundwater chemistry. The geochemical modeling showed that the minerals with unsaturated SI values (SI < 0) were halite (NaCl) and dolomite [(CaMg(CO3)2], and were unlikely to precipitate. On the other hand, the oversaturation (SI > 0) with calcite (CaCO3) and gypsum (CaSO4·2H2O) indicated that these minerals are supersaturated and precipitate in the groundwater. Evidence from multivariate analysis, such as principal component analysis, also suggested the critical roles of these minerals and their sources in the aquifer. The human health risk assessment model included carcinogenic and non-carcinogenic measures, which showed a trend in effect, in descending order, of As > Cd > Cr > Pb in children and adults. The highest non-carcinogenic hazard quotient was observed for arsenic, and the lowest hazard quotient was observed for cadmium in children. The carcinogenic risk indicated that children had the highest cumulative non-carcinogenic risk from potentially toxic elements. Our study makes it clear that decision-makers in the study area should adopt immediate management actions and develop long-term strategies to safeguard groundwater resources and prevent pollution.

Supplementary Materials

The following supporting information can be downloaded at: https://www.mdpi.com/article/10.3390/w15173099/s1, Table S1: Characterization of groundwater samples; Table S2: Parameters used for estimation of groundwater health risk; Table S3: Saturation index values of various mineral phases in the study area.

Author Contributions

In this paper W.K.: Writing—original draft; M.Y.J.B. and A.A.: software/formal analysis; W.K., M.Y.J.B., P.I., J.S. and A.A.: review and editing; W.K., M.Y.J.B., A.A., M.R.N., A.R., A.F.A. and M.H.A.: visualization. All authors have read and agreed to the published version of the manuscript.

Funding

This research was funded by the Deputyship for Research and Innovation, “Ministry of Education” in Saudi Arabia, grant number (IFKSUOR3-574-2).

Data Availability Statement

The data is available from the corresponding author on request.

Acknowledgments

The authors extend their appreciation to the Deputyship for Research and Innovation, “Ministry of Education” in Saudi Arabia for funding this research (IFKSUOR3-574-2).

Conflicts of Interest

The authors declare no conflict of interest.

References

  1. Zhang, W.; Chai, J.; Li, S.; Wang, X.; Wu, S.; Liang, Z.; Jat Baloch, M.Y.; Silva, L.F.; Zhang, D. Physiological characteristics, geochemical properties and hydrological variables influencing pathogen migration in subsurface system: What we know or not? Geosci. Front. 2022, 1, 101346. [Google Scholar] [CrossRef] [PubMed]
  2. Li, S.; Zhang, W.; Zhang, D.; Xiu, W.; Wu, S.; Chai, J.; Ma, J.; Jat Baloch, M.Y.; Sun, S.; Yang, Y. Migration risk of Escherichia coli O157: H7 in unsaturated porous media in response to different colloid types and compositions. Environ. Pollut. 2023, 323, 121282. [Google Scholar] [CrossRef] [PubMed]
  3. Hope, M.J. Visualizing Arsenic Groundwater Contamination in Coachella Valley, California Through Spatial Analysis and Modeling. Master’s Thesis, University of California, Los Angeles, CA, USA, 2022. [Google Scholar]
  4. Jat Baloch, M.Y.; Su, C.; Talpur, S.A.; Iqbal, J.; Bajwa, K.J.; Jo, E.S. Arsenic Removal from Groundwater Using Iron Pyrite: Influence Factors and Removal Mechanism. J. Earth Sci. 2023, 34, 857–867. [Google Scholar] [CrossRef]
  5. Tariq, A.; Ali, S.; Basit, I.; Jamil, A.; Farmonov, N.; Khorrami, B.; Khan, M.M.; Sadri, S.; Baloch, M.Y.J.; Islam, F.; et al. Terrestrial and groundwater storage characteristics and their quantification in the Chitral (Pakistan) and Kabul (Afghanistan) river basins using GRACE/GRACE-FO satellite data. Groundw. Sustain. Dev. 2023, 23, 100990. [Google Scholar] [CrossRef]
  6. Zhang, W.; Zhu, Y.; Gu, R.; Liang, Z.; Xu, W.; Jat Baloch, M.Y. Health risk assessment during in situ remediation of Cr (VI)-contaminated groundwater by permeable reactive barriers: A field-scale study. Int. J. Environ. Res. Public Health 2022, 19, 13079. [Google Scholar] [CrossRef]
  7. Zhang, Q.; Li, P.; Lyu, Q.; Ren, X.; He, S. Groundwater Contamination Risk Assessment Using a Modified DRATICL Model and Pollution Loading: A Case Study in the Guanzhong Basin of China. Chemosphere 2022, 291, 132695. [Google Scholar] [CrossRef]
  8. Bertrand, G.; Petelet-Giraud, E.; Cary, L.; Hirata, R.; Montenegro, S.; Paiva, A.; Mahlknecht, J.; Coelho, V.; Almeida, C. Delineating Groundwater Contamination Risks in Southern Coastal Metropoles through Implementation of Geochemical and Socio-Environmental Data in Decision-Tree and Geographical Information System. Water Res. 2022, 209, 117877. [Google Scholar] [CrossRef]
  9. Papazotos, P. Potentially Toxic Elements in Groundwater: A Hotspot Research Topic in Environmental Science and Pollution Research. Environ. Sci. Pollut. Res. 2021, 28, 47825–47837. [Google Scholar] [CrossRef]
  10. Rivera-Hernández, J.R.; Green-Ruiz, C.R.; Pelling-Salazar, L.E.; Flegal, A.R. Monitoring of As, Cd, Cr, and Pb in Groundwater of Mexico’s Agriculture Mocorito River Aquifer: Implications for Risks to Human Health. Water Air Soil Pollut. 2021, 232, 291. [Google Scholar] [CrossRef]
  11. Gu, X.; Xiao, Y.; Yin, S.; Liu, H.; Men, B.; Hao, Z.; Qian, P.; Yan, H.; Hao, Q.; Niu, Y.; et al. Impact of Long-Term Reclaimed Water Irrigation on the Distribution of Potentially Toxic Elements in Soil: An In-Situ Experiment Study in the North China Plain. Int. J. Environ. Res. Public Health 2019, 16, 649. [Google Scholar] [CrossRef]
  12. Adimalla, N.; Manne, R.; Zhang, Y.; Qian, H. Appraisal of Vulnerable Zones of Non-Carcinogenic and Carcinogenic Causing Health Risks Associated with Exposure of Potentially Toxic Elements in Soils of India: A Meta-Analysis. Environ. Res. 2022, 202, 111674. [Google Scholar] [CrossRef]
  13. Selvam, S.; Venkatramanan, S.; Singaraja, C. A GIS-Based Assessment of Water Quality Pollution Indices for Heavy Metal Contamination in Tuticorin Corporation, Tamilnadu, India. Arab. J. Geosci. 2015, 8, 10611–10623. [Google Scholar] [CrossRef]
  14. Cabral Pinto, M.M.S.; Ordens, C.M.; Condesso de Melo, M.T.; Inácio, M.; Almeida, A.; Pinto, E.; Ferreira da Silva, E.A. An Inter-Disciplinary Approach to Evaluate Human Health Risks Due to Long-Term Exposure to Contaminated Groundwater Near a Chemical Complex. Expo. Health 2019, 12, 199–214. [Google Scholar] [CrossRef]
  15. Chandrajith, R.; Diyabalanage, S.; Dissanayake, C.B. Geogenic Fluoride and Arsenic in Groundwater of Sri Lanka and Its Implications to Community Health. Groundw. Sustain. Dev. 2020, 10, 100359. [Google Scholar] [CrossRef]
  16. Ghosh (Nath), S.; Debsarkar, A.; Dutta, A. Technology Alternatives for Decontamination of Arsenic-Rich Groundwater—A Critical Review. Environ. Technol. Innov. 2019, 13, 277–303. [Google Scholar] [CrossRef]
  17. Alarcón-Herrera, M.T.; Gutiérrez, M. Geogenic Arsenic in Groundwater: Challenges, Gaps, and Future Directions. Curr. Opin. Environ. Sci. Health 2022, 27, 100349. [Google Scholar] [CrossRef]
  18. Devaraj, N.; Chidambaram, S.; Panda, B.; Thivya, C.; Tirumalesh, K.; Thilagavathi, R. Determination of Anthropogenic Sources in the Groundwater Chemistry Along KT Boundary of South India. In Emerging Issues in the Water Environment during Anthropocene; Springer: Singapore, 2020; pp. 127–142. [Google Scholar] [CrossRef]
  19. Uugwanga, M.N.; Kgabi, N.A.; Knoeller, K.; Motsei, L. Isotopic Composition of Water Bodies in the Kuiseb and Cuvelai-Etosha Basin, Namibia. Namib. J. Res. Sci. Technol. 2018, 1, 33–40. [Google Scholar] [CrossRef]
  20. Zhang, Z.; Guo, Y.; Wu, J.; Su, F. Surface Water Quality and Health Risk Assessment in Taizhou City, Zhejiang Province (China). Expo. Health 2022, 14, 1–16. [Google Scholar] [CrossRef]
  21. U.S. Geological Survey. Groundwater and Surface Water Data for a Regional Assessment of Groundwater Salinity Variations and Sources in the Indio Subbasin of the Coachella Valley, California. Available online: https://www.usgs.gov/data/groundwater-and-surface-water-data-a-regional-assessment-groundwater-salinity-variations-and (accessed on 8 June 2022).
  22. World Health Organization. Guidelines for Drinking-Water Quality, 4th ed.; WHO Library Cataloguing-in-Publication Data; World Health Organization: Geneva, Switzerland, 2011; ISBN 978 92 4 154815 1. [Google Scholar]
  23. Piper, A.M. A Graphic Procedure in the Geochemical Interpretation of Water-Analyses. Eos Trans. Am. Geophys. Union 1944, 25, 914–928. [Google Scholar] [CrossRef]
  24. Gibbs, R.J. Mechanisms Controlling World Water Chemistry. Science 1970, 170, 1088–1090. [Google Scholar] [CrossRef]
  25. Parkhurst, D.L.; Appelo, C. User’s guide to PHREEQC (Version 2) (Equations on which the program is based). Water-Resour. Investig. Rep. 1999, 99, 4259. [Google Scholar]
  26. Rashid, A.; Ayub, M.; Khan, S.; Ullah, Z.; Ali, L.; Gao, X.; Li, C.; El-Serehy, H.A.; Kaushik, P.; Rasool, A. Hydrogeochemical Assessment of Carcinogenic and Non-Carcinogenic Health Risks of Potentially Toxic Elements in Aquifers of the Hindukush Ranges, Pakistan: Insights from groundwater pollution indexing, GIS-based, and multivariate statistical approaches. Environ. Sci. Pollut. Res. 2022, 29, 75744–75768. [Google Scholar] [CrossRef] [PubMed]
  27. Tepanosyan, G.; Sahakyan, L.; Chemosphere, N.M. Identification of Spatial Patterns, Geochemical Associations and Assessment of Origin-Specific Health Risk of Potentially Toxic Elements in Soils of Armavir Region, Armenia. Chemosphere 2021, 262, 128365. [Google Scholar] [CrossRef]
  28. Jat Baloch, M.Y.; Zhang, W.; Zhang, D.; Al Shoumik, B.A.; Iqbal, J.; Li, S.; Chai, J.; Farooq, M.A.; Parkash, A. Evolution mechanism of arsenic enrichment in groundwater and associated health risks in southern Punjab, Pakistan. Int. J. Environ. Res. Public Health 2022, 19, 13325. [Google Scholar] [CrossRef] [PubMed]
  29. Parvaiz, A.; Khattak, J.A.; Hussain, I.; Masood, N.; Javed, T.; Farooqi, A. Salinity Enrichment, Sources and Its Contribution to Elevated Groundwater Arsenic and Fluoride Levels in Rachna Doab, Punjab Pakistan: Stable Isotope (Δ2H and Δ18O) Approach as an Evidence. Environ. Pollut. 2021, 268, 115710. [Google Scholar] [CrossRef] [PubMed]
  30. Castaño-Sánchez, A.; Hose, G.C.; Reboleira, A.S.P.S. Salinity and Temperature Increase Impact Groundwater Crustaceans. Sci. Rep. 2020, 10, 12328. [Google Scholar] [CrossRef]
  31. Talpur, S.A.; Noonari, T.M.; Rashid, A.; Ahmed, A.; Jat Baloch, M.Y.; Talpur, H.A.; Soomro, M.H. Hydrogeochemical signatures and suitability assessment of groundwater with elevated fluoride in unconfined aquifers Badin District, Sindh, Pakistan. SN Appl. Sci. 2020, 2, 1038. [Google Scholar] [CrossRef]
  32. Jat Baloch, M.Y.; Zhang, W.; Sultana, T.; Akram, M.; Al Shoumik, B.A.; Khan, M.Z.; Farooq, M.A.J.E.T. Utilization of sewage sludge to manage saline-alkali soil and increase crop production: Is it safe or not? Environ. Technol. Innov. 2023, 32, 103266. [Google Scholar] [CrossRef]
  33. Deng, Y.; Wang, Y.; Geochemistry, T.M.-A. Isotope and Minor Element Geochemistry of High Arsenic Groundwater from Hangjinhouqi, the Hetao Plain, Inner Mongolia. Appl. Geochem. 2009, 24, 587–599. [Google Scholar] [CrossRef]
  34. Brima, E.I. Physicochemical Properties and the Concentration of Anions, Major and Trace Elements in Groundwater, Treated Drinking Water and Bottled Drinking Water in Najran Area, KSA. Appl. Water Sci. 2014, 7, 401–410. [Google Scholar] [CrossRef]
  35. Sethy, S.N.; Syed, T.H.; Kumar, A.; Sinha, D. Hydrogeochemical Characterization and Quality Assessment of Groundwater in Parts of Southern Gangetic Plain. Environ. Earth Sci. 2016, 75, 232. [Google Scholar] [CrossRef]
  36. Karunanidhi, D.; Aravinthasamy, P.; Deepali, M.; Subramani, T.; Shankar, K. Groundwater Pollution and Human Health Risks in an Industrialized Region of Southern India: Impacts of the COVID-19 Lockdown and the Monsoon Seasonal Cycles. Arch Environ. Contam. Toxicol. 2021, 80, 259–276. [Google Scholar] [CrossRef] [PubMed]
  37. Iqbal, J.; Su, C.; Wang, M.; Abbas, H.; Jat Baloch, M.Y.; Ghani, J.; Ullah, Z.; Huq, M.E. Groundwater fluoride and nitrate contamination and associated human health risk assessment in South Punjab, Pakistan. Environ. Sci. Pollut. Res. 2023, 30, 61606–61625. [Google Scholar]
  38. Yang, Q.; Li, Z.; Xie, C.; Liang, J.; Ma, H. Risk assessment of groundwater hydrochemistry for irrigation suitability in Ordos Basin, China. Nat. Hazards 2020, 101, 309–325. [Google Scholar] [CrossRef]
  39. Jat Baloch, M.Y.; Zhang, W.; Chai, J.; Li, S.; Alqurashi, M.; Rehman, G.; Tariq, A.; Talpur, S.A.; Iqbal, J.; Munir, M.; et al. Shallow Groundwater Quality Assessment and Its Suitability Analysis for Drinking and Irrigation Purposes. Water 2021, 13, 3361. [Google Scholar] [CrossRef]
  40. Iqbal, J.; Su, C.; Rashid, A.; Yang, N.; Jat Baloch, M.Y.; Talpur, S.A.; Ullah, Z.; Rahman, G.; Rahman, N.U.; Sajjad, M.M.; et al. Hydrogeochemical Assessment of Groundwater and Suitability Analysis for Domestic and Agricultural Utility in Southern Punjab, Pakistan. Water 2021, 13, 3589. [Google Scholar] [CrossRef]
  41. Chen, J.; Wu, H.; Qian, H.; Health, Y.G.-E. Assessing Nitrate and Fluoride Contaminants in Drinking Water and Their Health Risk of Rural Residents Living in a Semiarid Region of Northwest China. Expo. Health 2017, 9, 183–195. [Google Scholar] [CrossRef]
  42. Jat Baloch, M.Y.; Zhang, W.; Shoumik, B.A.A.; Nigar, A.; Elhassan, A.A.M.; Elshekh, A.E.A.; Bashir, M.O.; Mohamed Salih Ebrahim, A.F.; Adam Mohamed, K.a.; Iqbal, J. Hydrogeochemical Mechanism Associated with Land Use Land Cover Indices Using Geospatial, Remote Sensing Techniques, and Health Risks Model. Sustainability 2022, 14, 16768. [Google Scholar] [CrossRef]
  43. Rashid, A.; Ayub, M.; Ullah, Z.; Ali, A.; Khattak, S.A.; Ali, L.; Gao, X.; Li, C.; Khan, S.; El-Serehy, H.A.; et al. Geochemical Modeling Source Provenance, Public Health Exposure, and Evaluating Potentially Harmful Elements in Groundwater: Statistical and Human Health Risk Assessment (HHRA). Int. J. Environ. Res. Public Health 2022, 19, 6472. [Google Scholar] [CrossRef]
  44. Rivera-Rivera, D.M.; Escobedo-Urías, D.C.; Jonathan, M.P.; Sujitha, S.B.; Chidambaram, S. Evidence of Natural and Anthropogenic Impacts on Rainwater Trace Metal Geochemistry in Central Mexico: A Statistical Approach. Water 2020, 12, 192. [Google Scholar] [CrossRef]
  45. Jat Baloch, M.Y.; Mangi, S.H. Treatment of synthetic greywater by using banana, orange and 2021sapodilla peels as a low cost activated carbon. J. Mater. Environ. Sci. 2019, 10, 966–986. [Google Scholar]
  46. Jat Baloch, M.Y.; Talpur, S.A.; Talpur, H.A.; Iqbal, J.; Mangi, S.H.; Memon, S. Effects of Arsenic Toxicity on the Environment and Its Remediation Techniques: A Review. J. Water Environ. Technol. 2020, 18, 275–289. [Google Scholar]
  47. Shaji, E.; Santosh, M.; Sarath, K.V.; Prakash, P.; Deepchand, V.; Divya, B.V. Arsenic Contamination of Groundwater: A Global Synopsis with Focus on the Indian Peninsula. Geosci. Front. 2020, 12, 101079. [Google Scholar] [CrossRef]
  48. Sheng, Y.; Baars, O.; Guo, D.; Whitham, J.; Srivastava, S.; Dong, H. Mineral-Bound Trace Metals as Cofactors for Anaerobic Biological Nitrogen Fixation. Environ. Sci. Technol. 2023, 57, 7206–7216. [Google Scholar] [CrossRef] [PubMed]
  49. Natural Organic Matter Influences Arsenic Release into Groundwater. PressPacs. 11 March 2020. Available online: https://www.acs.org/pressroom/presspacs/2020/acs-presspac-march-11-2020/natural-organic-matter-influences-arsenic-release-into-groundwater.html (accessed on 8 June 2022).
  50. Mazumder, P.; Sharma, S.K.; Taki, K.; Kalamdhad, A.S.; Kumar, M. Microbes Involved in Arsenic Mobilization and Respiration: A Review on Isolation, Identification, Isolates and Implications. Environ. Geochem. Health 2020, 42, 3443–3469. [Google Scholar] [CrossRef] [PubMed]
  51. Li, C.; Bundschuh, J.; Gao, X.; Li, Y.; Zhang, X.; Luo, W.; Pa, Z. Occurrence and Behavior of Arsenic in Groundwater-Aquifer System of Irrigated Areas. Sci. Total Environ. 2022, 838, 155991. [Google Scholar] [CrossRef]
  52. Wang, Z.-W.; Yang, G.; Chen, J.; Zhou, Y.; Núñez Delgado, A.; Cui, H.-L.; Duan, G.-L.; Rosen, B.P.; Zhu, Y.-G. Fundamentals and Application in Phytoremediation of an Efficient Arsenate Reducing Bacterium Pseudomonas Putida ARS1. J. Environ. Sci. 2024, 137, 237–244. [Google Scholar] [CrossRef]
  53. US EPA. Risk Assessment Guidance for Superfund (RAGS): Part A. Available online: https://www.epa.gov/risk/risk-assessment-guidance-superfund-rags-part (accessed on 6 September 2022).
  54. Guadie, A.; Yesigat, A.; Gatew, S.; Worku, A.; Liu, W.; Ajibade, F.O.; Wang, A. Evaluating the Health Risks of Heavy Metals from Vegetables Grown on Soil Irrigated with Untreated and Treated Wastewater in Arba Minch, Ethiopia. Sci. Total Environ. 2021, 761, 143302. [Google Scholar] [CrossRef] [PubMed]
  55. US EPA. Chemical Contaminant Rules. Available online: https://www.epa.gov/dwreginfo/chemical-contaminant-rules (accessed on 18 July 2023).
  56. Ghani, J.; Nawab, J.; Faiq, M.E.; Ullah, S.; Alam, A.; Ahmad, I.; Ali, S.W.; Khan, S.; Ahmad, I.; Muhammad, A.; et al. Multi-Geostatistical Analyses of the Spatial Distribution and Source Apportionment of Potentially Toxic Elements in Urban Children’s Park Soils in Pakistan: A Risk Assessment Study. Environ. Pollut. 2022, 311, 119961. [Google Scholar] [CrossRef]
Figure 1. Counties of Coachella Valley and locations of groundwater 17 sampling points.
Water 15 03099 g001
Figure 2. Geochemical evolution of groundwater types from the study area which shows the hydrogeochemistry of groundwater.
Water 15 03099 g002
Figure 3. Gibbs diagrams demonstrating the ionic composition of groundwater samples. (a) Na+/Na+ + Ca2+ mg L−1 versus TDS; (b) Cl/Cl + HCO3 mg L−1 versus TDS.
Water 15 03099 g003
Figure 4. Saturation indices of calcite, dolomite, gypsum, and halite in groundwater.
Water 15 03099 g004
Figure 5. Principal component analysis of groundwater samples parameters. (a) Significant factors; (b) overall loading of factors in groundwater.
Water 15 03099 g005
Figure 6. Mechanism and sources of As mobilization in groundwater.
Water 15 03099 g006
Table 1. Summary of statistics of measured field parameters in groundwater in the Indio Sub-basin of the Coachella Valley, California (n = 17).
Field ParametersRangeMean ± SDWHO (2011)
Depth (feet)215–1475567.06 ± 358-
pH7.3–9.38 ± 0.66.5–9.2
TDS (mg L−1)163–11,8001250.1 ± 2634.11000
DO (mg L−1)0.2–13.15.3 ± 4.1
Temperature (°C)10.6–3124.8 ± 5.120–50
SC (µS cm−1)283–18,8001929.3 ± 4169.5400,000
Table 2. Summary of concentrations of dissolved components measured in groundwater in the Indio Sub-basin of the Coachella Valley, California (n = 17).
ParameterRange *Mean ± SDWHO (2011)
Ca22.1–1350161.1 ± 319.2100
Mg20.04–10716.5 ± 24.750
K⁺0.5–21.96.2 ± 5.212
SiO212.1–25.618 ± 4.1-
Na⁺28.1–2670268.2 ± 631.8200
Br0.02–8.50.6 ± 20.01
Cl5.9–6840497.7 ± 1637.7>250
F0.1–6.81.3 ± 1.71.5
I0.001–1.30.1 ± 0.31
SO42−13.6–1570268.6 ± 360500
Al9–459 ± 16.6900
Sb0.123–0.40.04 ± 0.10.02
Ba1.6–24865.3 ± 64.70.7
B22–940184.4 ± 251.12.4
Fe5.1–33429.9 ± 80.5300
ClO40.15–4.41 ± 1.4-
CaCO318.9–19499.6 ± 47.240
HCO322.9–236118.2 ± 58.2-
CO32−0.1–8.11.5 ± 2.6-
NO30.4–16.84.14 ± 5.950
Note: * All units in mg L−1, except Al, Fe, and ClO4 in µg L−1.
Table 3. Summary of concentrations of heavy metals measured in the groundwater in the Indio Sub-basin of the Coachella Valley, California (n = 17).
Heavy MetalRange *Mean ± SDWHO (2011)
As0.1–12521.3 ± 39.40.01
Cd0.033–0.320.05 ± 0.080.05
Cr(VI)0.05–37.15.40 ± 9.0550
Pb0.02–0.750.12 ± 0.2110
Note: * As and Cd units in mg L−1 while Cr and Pb are in µg L−1.
Table 4. Factor loading for groundwater physicochemical parameters in the study area. Bold values in the table represent higher loading values.
ParametersF1F2F3
pH−0.0650.934−0.046
TDS0.994−0.073−0.070
DO−0.391−0.722−0.071
Temperature0.4530.7960.115
SC0.991−0.079−0.105
Ca20.982−0.138−0.085
Mg20.911−0.299−0.187
K⁺0.804−0.4090.125
SiO2−0.133−0.564−0.392
Na⁺0.993−0.025−0.096
Br0.963−0.085−0.229
Cl0.970−0.077−0.214
F0.1420.790−0.021
I0.9890.014−0.131
SO42−0.3510.0630.776
Al−0.1880.884−0.377
Sb−0.1410.755−0.377
As0.0590.875−0.445
Ba0.639−0.537−0.361
B0.9150.1710.237
Cd0.0820.5230.592
Cr−0.113−0.1590.454
Fe0.992−0.012−0.102
Pb−0.200−0.248−0.123
ClO4−0.222−0.3860.073
HCO3−0.560−0.505−0.428
CO32−−0.1910.871−0.397
CaCO3−0.585−0.427−0.470
NO3−0.247−0.466−0.091
Eigenvalue12.9057.6342.802
Variability (%)43.01725.4469.339
Cumulative (%)43.01768.46377.802
Table 5. Carcinogenic and non-carcinogenic risks posed by each PTE through the ingestion exposure pathway.
IngestionRfDCSFNon-Carcinogenic RiskCarcinogenic Risk
HQ (Child)HQ (Adult)HI (Child)HI (Adult)Risk (Child)Risk (Adult)
As-cancer3.00 × 10−41.50 × 100----8.00 × 10−79.55 × 10−7
As-non--1.78 × 10−32.12 × 10−33.02 × 10−23.61 × 10−2--
Cd-cancer5.00 × 10−41.00 × 10⁻³----1.37 × 10−121.64 × 10⁻¹²
Cd-non--2.75 × 10−63.28 × 10−64.67 × 10−55.58 × 10−5--
Cr-cancer1.50 × 1005.00 × 10−1----6.75 × 10−88.06 × 10−8
Cr-non--9.01 × 10−81.08 × 10−71.53 × 10−61.83 × 10−6--
Pb-cancer3.60 × 10−28.50 × 10⁻³----2.72 × 10−113.25 × 10⁻¹¹
Pb-non--8.88 × 10−81.06 × 10−71.51 × 10−61.80 × 10−6--
Notes: As-non: As non-carcinogenic, Cd-non: Cd non-carcinogenic, Cr-non: Cr non-carcinogenic, Pb-non: Pb non-carcinogenic.
Disclaimer/Publisher’s Note: The statements, opinions and data contained in all publications are solely those of the individual author(s) and contributor(s) and not of MDPI and/or the editor(s). MDPI and/or the editor(s) disclaim responsibility for any injury to people or property resulting from any ideas, methods, instructions or products referred to in the content.

