1. Introduction
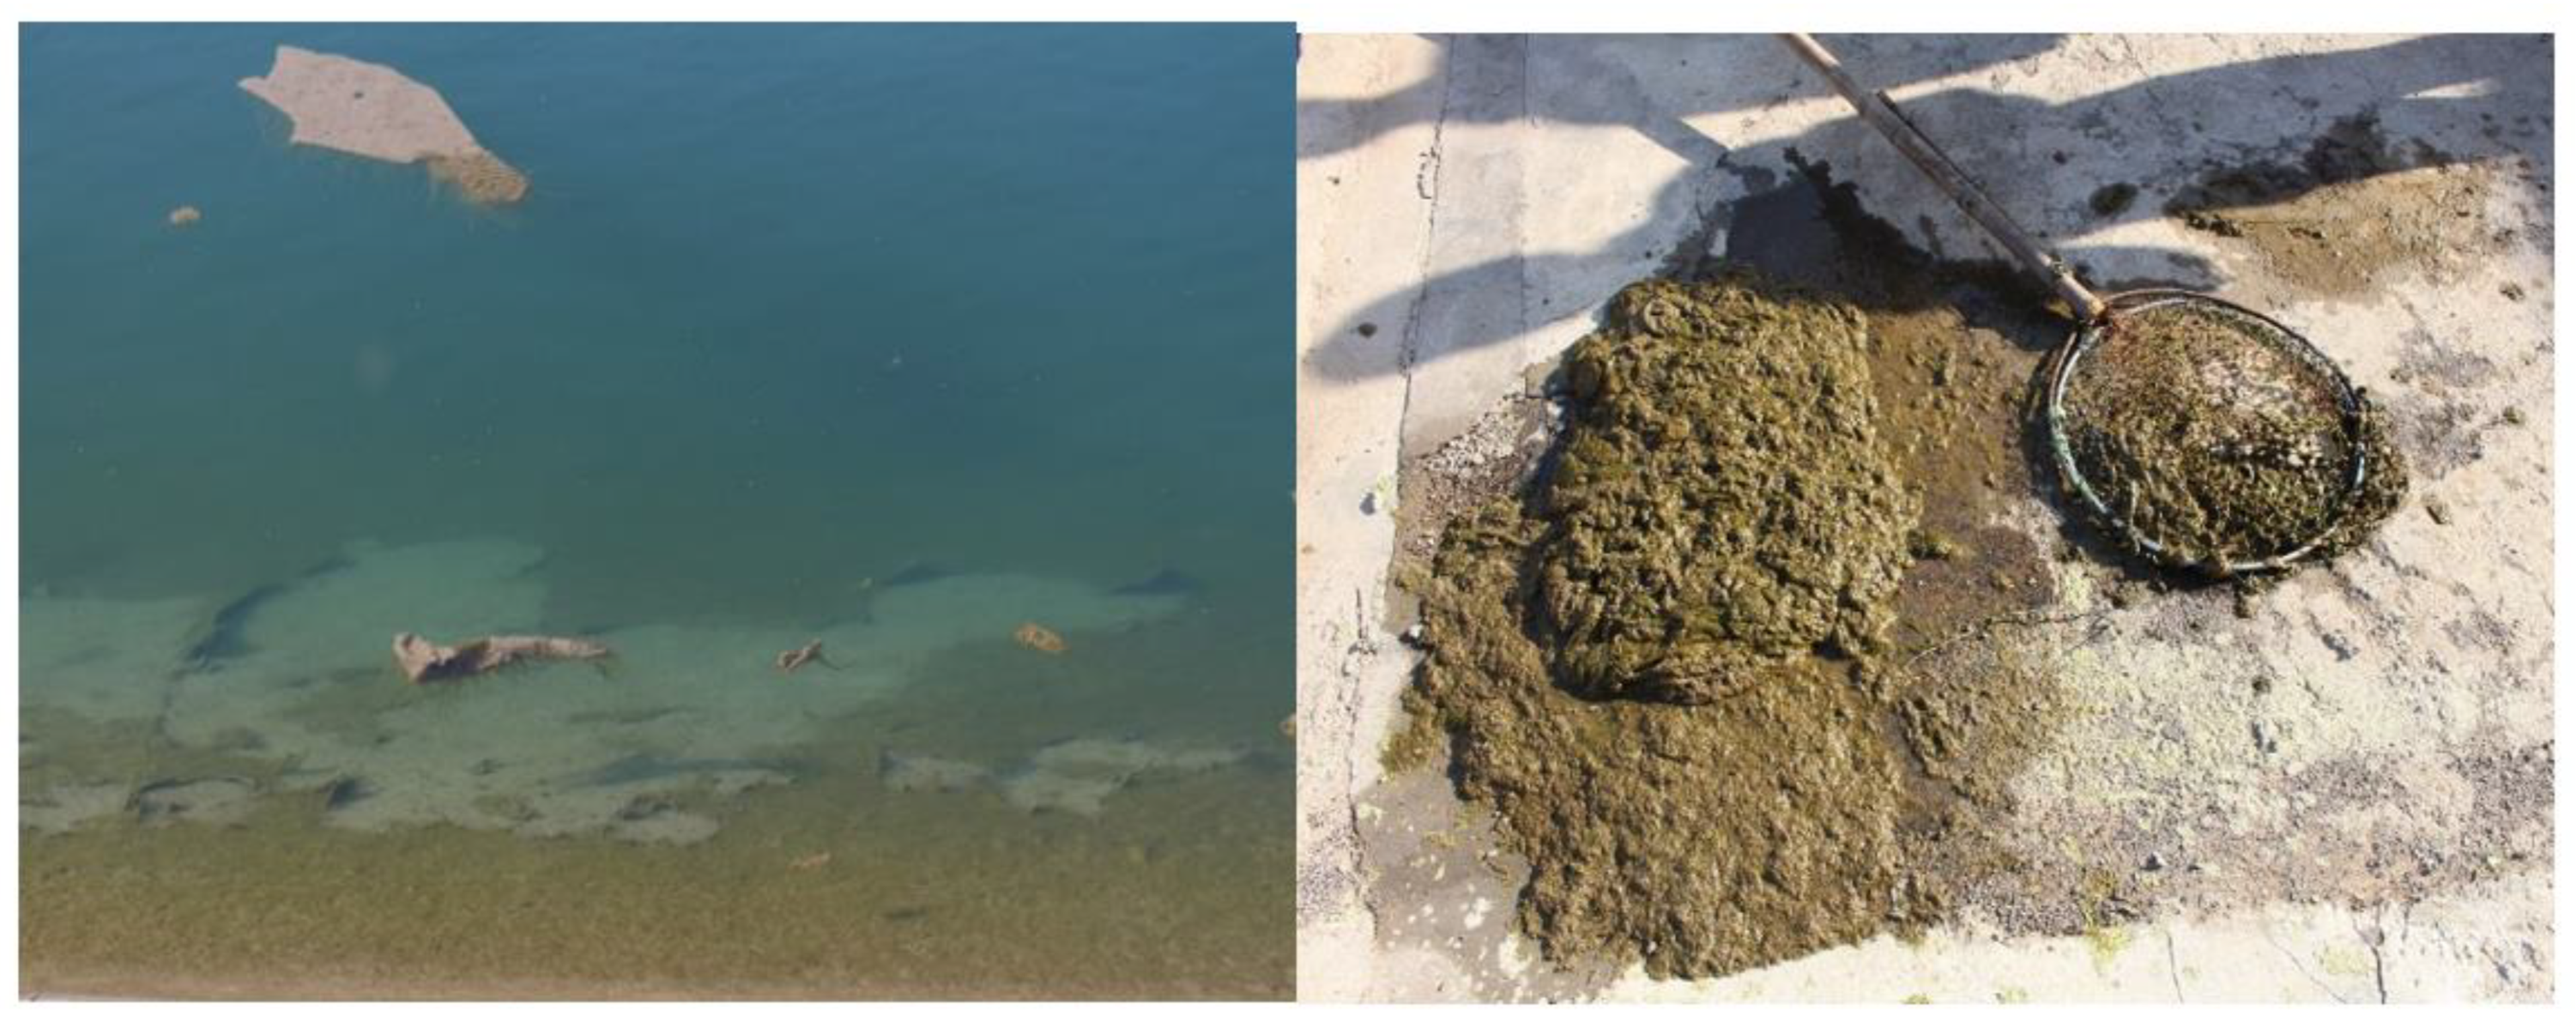
Through the investigation of the oblique side wall of the artificial open channel, it has been found that, due to the slow flow velocity, the precipitation of river organic matter and very fine sediment, and the nourishment of sunlight, the side wall of an open channel often produces epipelic algae that affect the water quality and landscape environment (
Figure 1). In recent years, the water transfer project has attracted much attention. Through the connection between the three water transfer lines of the east, middle, and west lines and the four major rivers of the Yangtze River, Yellow River, Huaihe River, and Haihe River, the overall layout with ‘four horizontal and three vertical’ as the main body is formed, which is conducive to the realization of the rational allocation of water resources in China from north to south and from east to west. However, the problem of water quality safety in the development of water diversion projects is particularly important. Large-scale water diversion projects have many potential safety hazards of water pollution accidents due to long channels and multiple canal sections intersecting with many rivers and transportation buildings. A small amount of fine-grained sediment due to wind carrying on the side wall of the artificial channel provides nutrients for the growth of algal clusters. When natural conditions such as light are suitable in some channels with low flow rates, it is extremely easy for the frenzied proliferation of algal clusters to break out.
Experts and scholars have achieved rich results in the study of planktonic algae in rivers, lakes, and reservoirs. However, research on the hydrodynamic mechanism of the erosion and shedding of algae mass is quite rare. At present, research on the growth of algae mass mainly focuses on two aspects: hydrodynamic factors and environmental factors such as nutrients, light, and temperature. The growth and reproduction of algal clusters and the occurrence of algal blooms are the result of the combined effects of the water environment and hydrodynamic forces [
1,
2]. Their effects on the growth of different algal clusters are qualitatively consistent, but there are certain differences among algal clusters in quantification. The results of Desortová B [
3] showed that the slow flow rate was the main reason for the frequent blooms. Nie Kaixia [
4] proposed that the water flow velocity of 0.45 m/s was most conducive to the growth of Microcystis. Li Bo [
5] showed that the flow velocity of 1 m/s had a significant inhibitory effect on the growth of algal cells in the South-to-North Water Diversion Project. Zhang Haihan [
6] proposed that hydrodynamic conditions affected the growth of algae. Zhou Jing [
7] proposed that different continuous flow conditions were an important reason for the changes in the number of planktonic algae and physiological indicators. Chen Yongcan [
8] believed that water erosion and the corresponding changes in light intensity have an important impact on the growth of algae in rivers. Huisman J [
9] believed that water flow affects the growth of algal clusters by using the mixing and material transport of water bodies such as dissipative vortices, and the scale of turbulent dissipative vortices is an important parameter affecting the growth of algal clusters. The growth characteristics of periphyton have a great relationship with its substrate. Pei Guofeng et al. [
10] compared the growth of periphyton on different artificial substrates and found that polyethylene plastic plate was the most suitable for the growth of benthic periphyton compared with granite, glass, and wood plate. There was no significant difference in the species and biodiversity index of periphyton on granite and natural matrix pebble. Yi Kelang and Dai Zhigang [
11] found that the community establishment of the algal mass was not related to the roughness of the substrate but rather determined by the living habits and structure of the algal mass. Liu Haiping et al. [
12] believed that the surface roughness of the substrate can affect the growth of the algal mass, and the species richness of the algal mass growing on the rough surface is larger than that of the smooth-surface substrate. The epipelic algae attached to the oblique side wall of the open channel directly determines its difference from the cohesive fine sediment incipience at the bottom of the river or channel.
The influence of algae clusters on the water environment of the channel wall is more prominent only when they are washed off into the water flow, especially when the algae clusters washed off along the way are gathered somewhere downstream, which will cause great harm to the water quality of the local channel section. Unfortunately, there are few reports on the research of the problem of the erosion and shedding of the algae group, especially because the algae group and the attached mud are interwoven and mixed together on the concrete, which makes the problem more complicated and brings great difficulties to the management and dispatching of water. Due to the inability to analyze the hydrodynamic changes in the epipelic algae on the side wall of the open channel in real time according to the changes in the flow conditions in the prototype observation, and the inability to simulate and observe the erosion and shedding process in the whole cycle, the rationality of the model design will directly determine the authenticity of the simulation and the reliability of the test results.
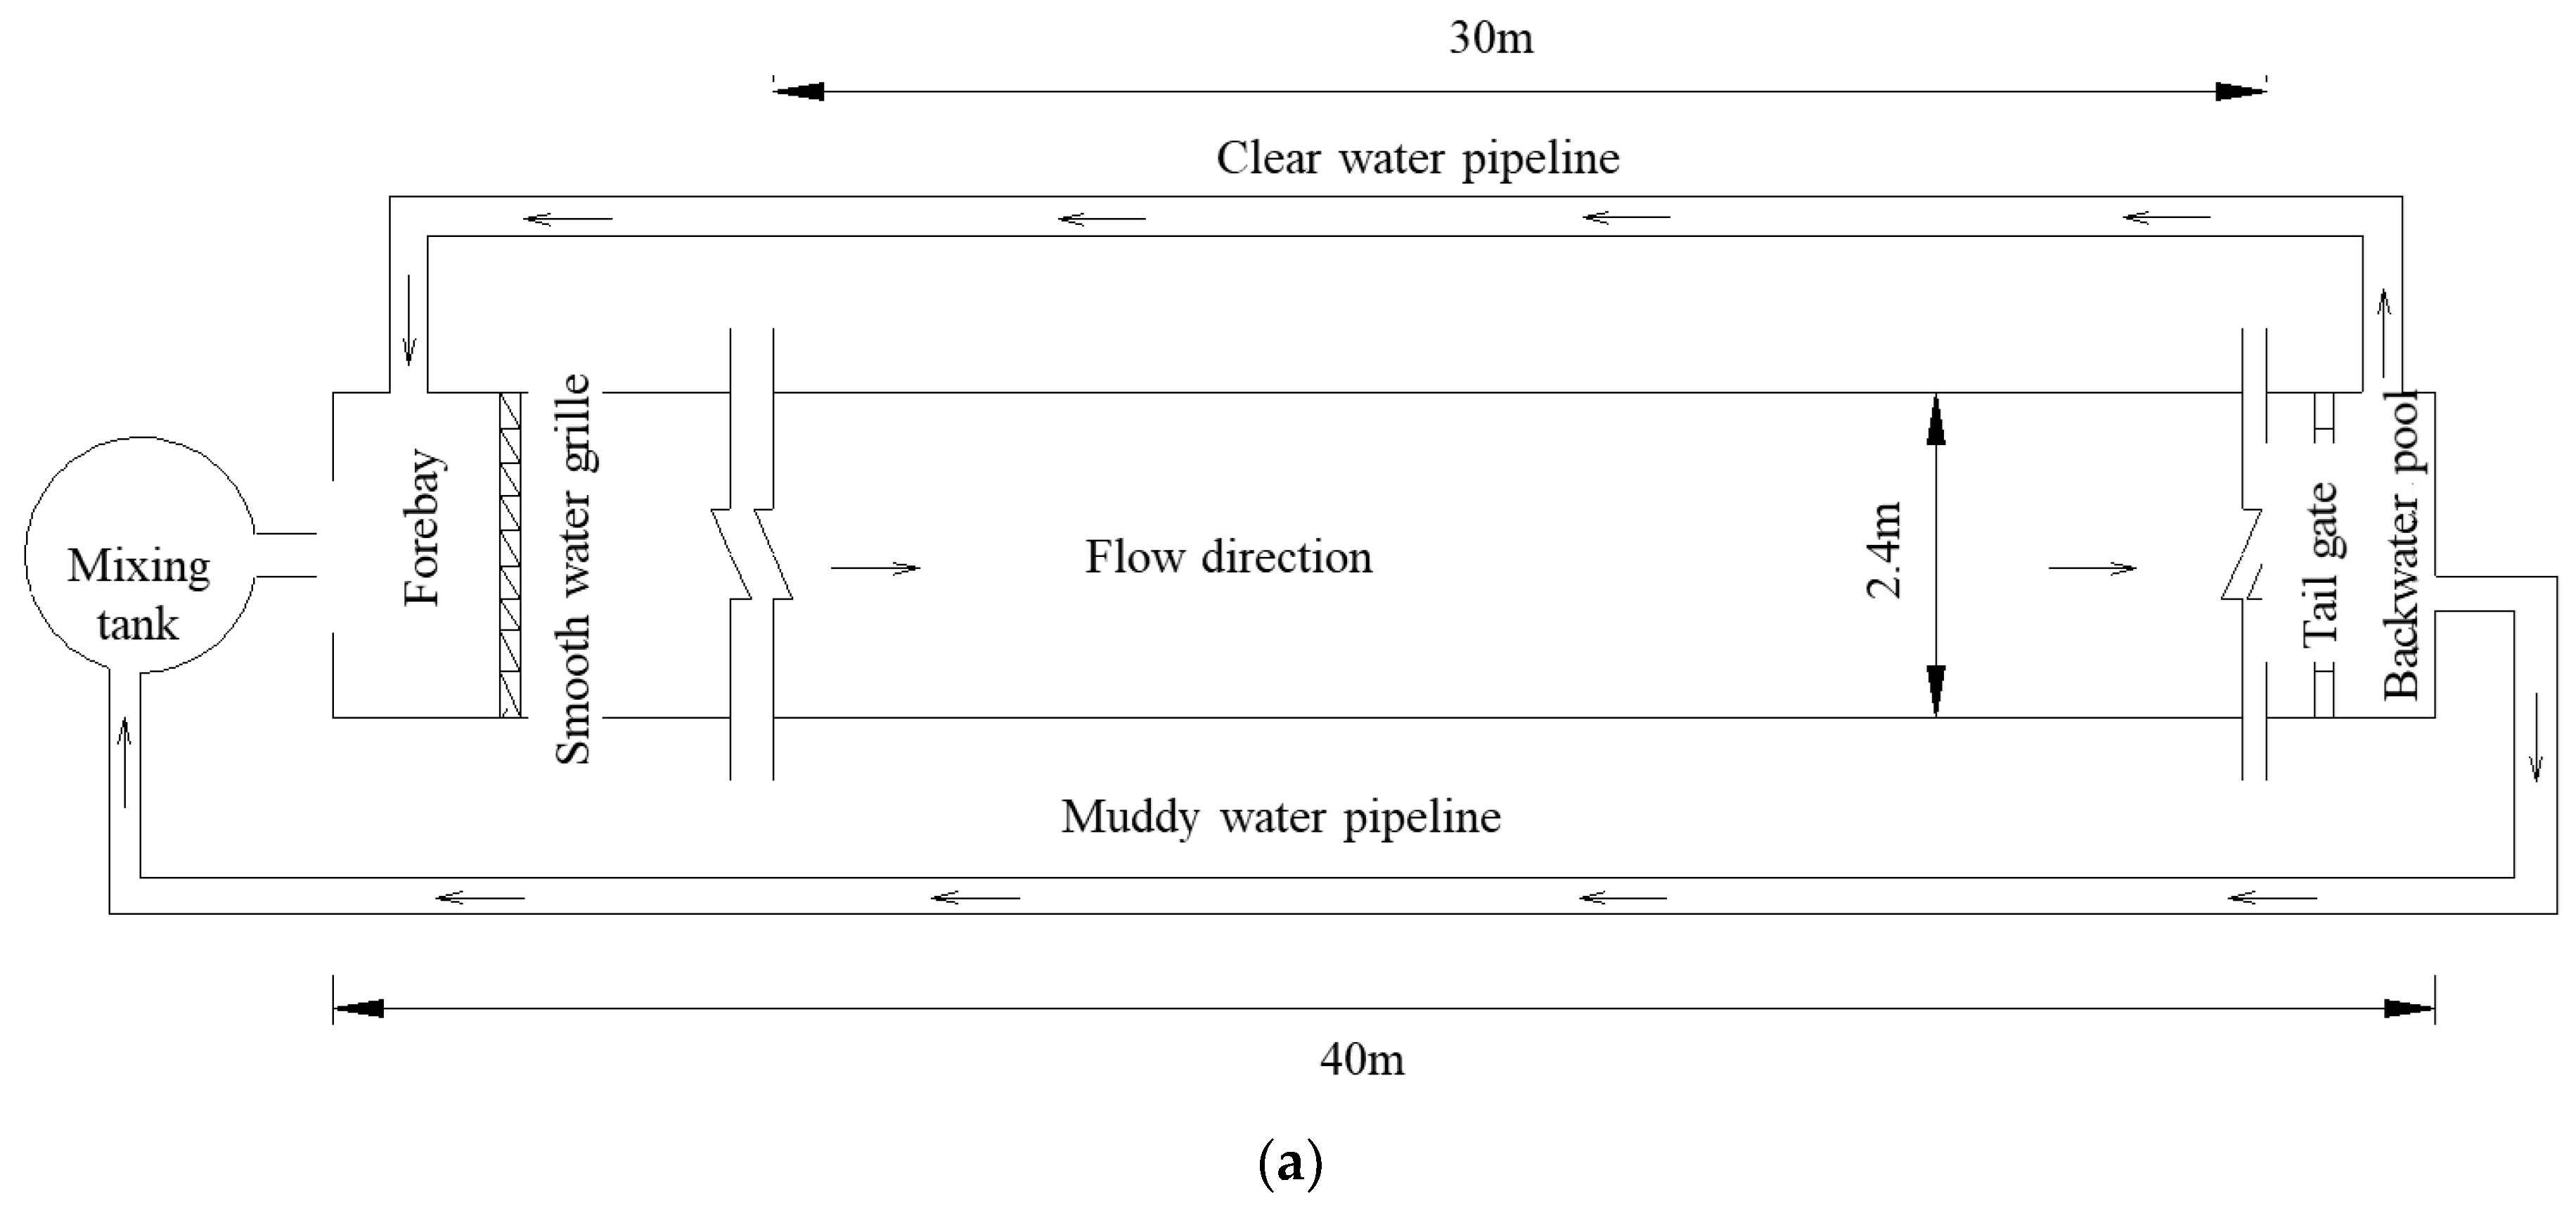
By referring to the design parameters of the water diversion project channel, this study took the epipelic algae growing on the side wall of the open channel as the research object and used the scale of 1:30 to carry out a generalized flume experiment. Considering the physical characteristics of the epipelic algae analyzed using prototype sampling, artificial cultivation and the simulation of the adhesion force of the side wall were adopted. Through the analysis of the physical characteristics of the prototype sample, and the simulation of the cohesive force between the oblique side wall and the epipelic algae, multi-group and multi-series hydrodynamic tests were carried out. Through the study of the channel flow field with and without epipelic algae, the hydrodynamic law was analyzed.
This study provides basic theoretical support for the later in-depth study of its erosion and shedding. The research results of the hydrodynamic law of the oblique side wall will further improve the relevant research results of the vegetation flow. It also has important scientific guiding significance and practical value for the regulation of water quantity and water quality safety, as well as the protection of long-distance water diversion projects.
4. Discussion
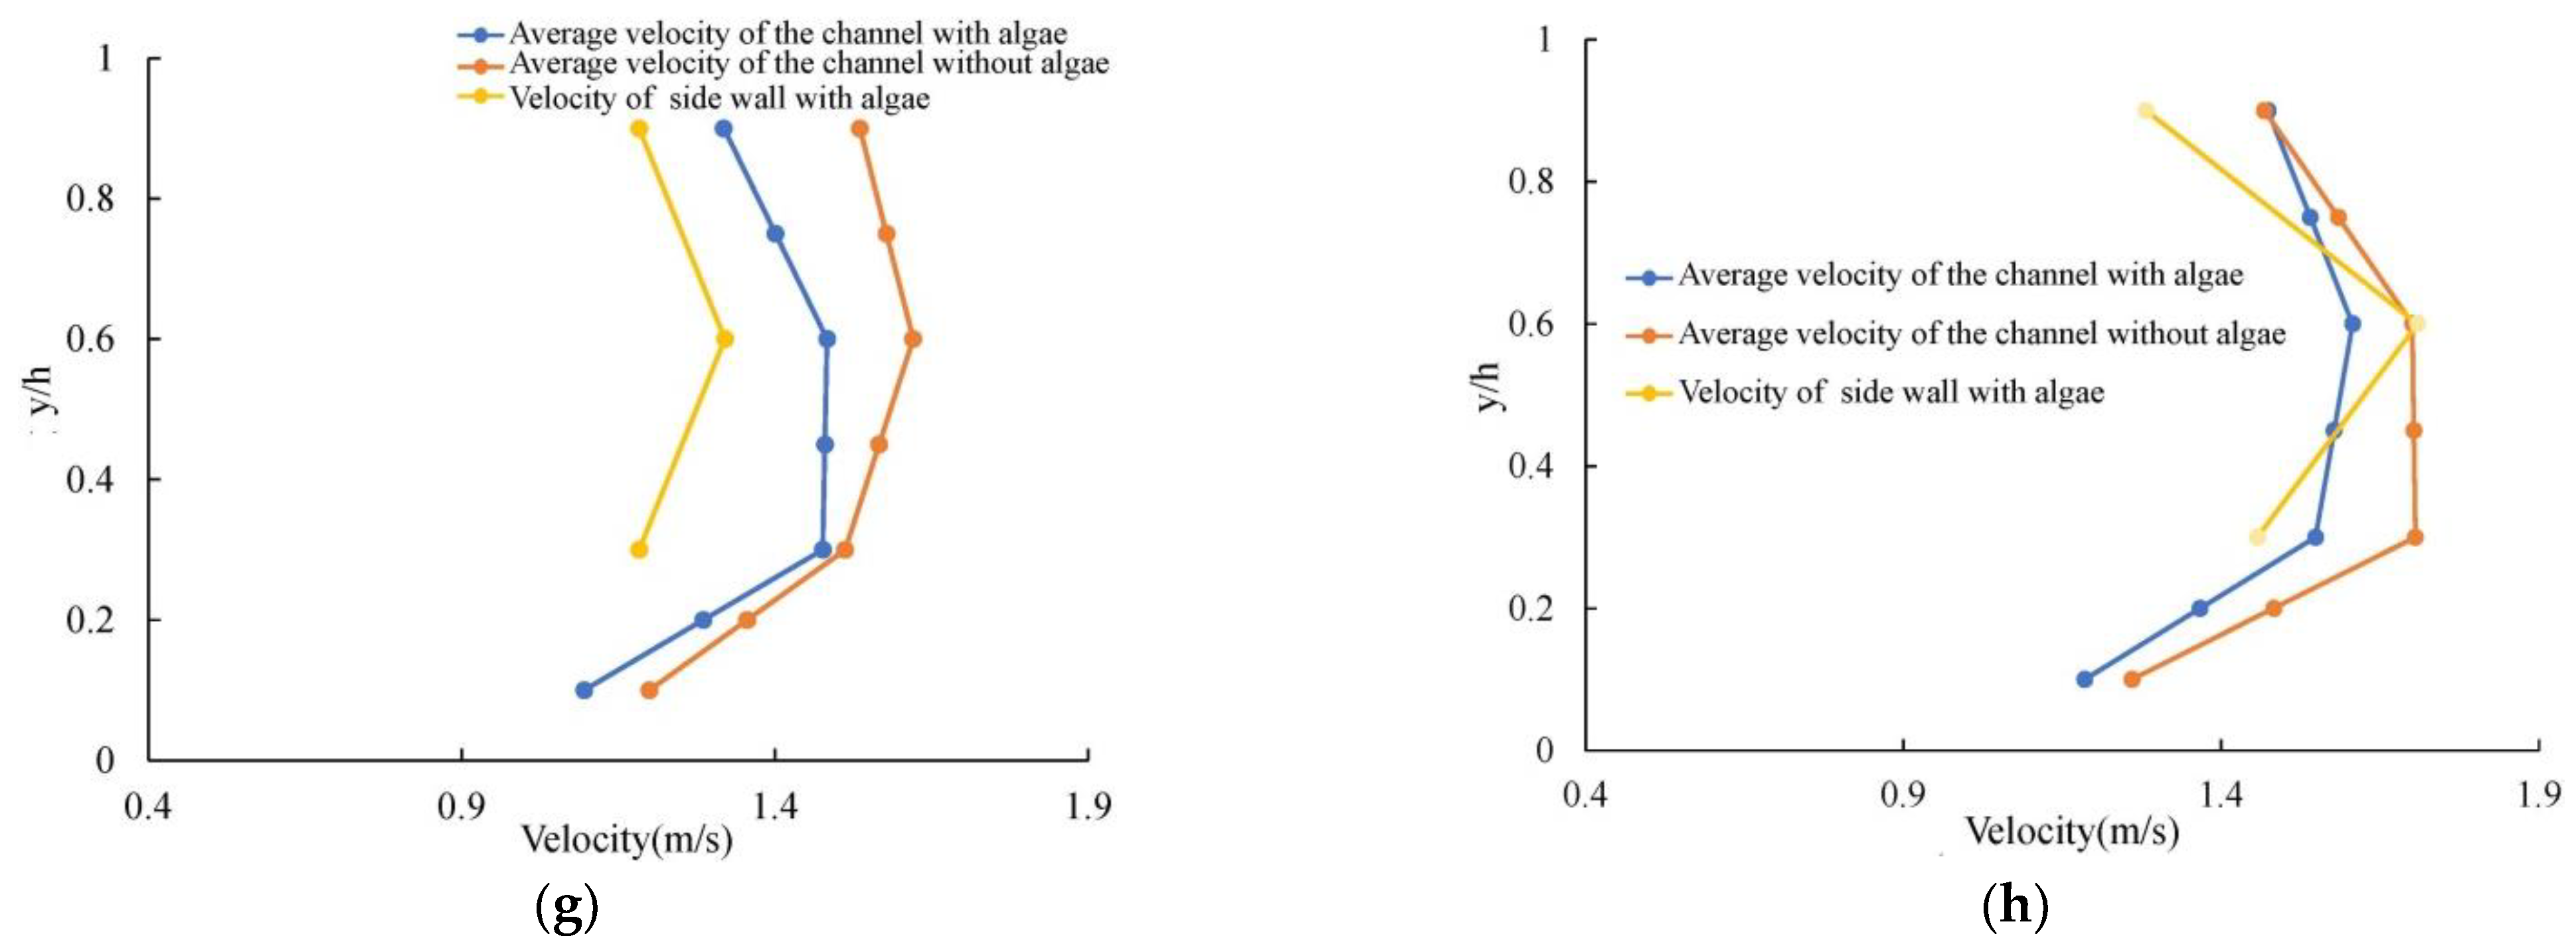
4.1. The Effect of Epipelic Algae under Maximum Velocity in the Vertical Distribution
The effect of epipelic algae on the side wall makes the maximum velocity in the vertical distribution appear within the relative water depth of 0.6, which slightly deviates from the existing results of the vertical distribution of velocity in the open channel with vegetation.
For example, Niu Mengfei et al. [
16] found that the maximum velocity of the vertical distribution occurs at the relative water depth of 0.7~0.8 in the study of the distribution law of velocity of the thin layer on the slope under the condition of a low sediment concentration. Xie Zhifeng et al. [
17] believed that the peak value of flow velocity appeared at one-fifth of the vertical line from the water surface to the bottom. Xie Xuedong et al. [
18] analyzed the evolution law of the vertical distribution of velocity under the ice cover at the three hydrological stations of Bayangaole, Sanhuhekou, and Toudaoguai in the Inner Mongolia section of the Yellow River during the whole freezing period. The results show that the maximum velocity position often appears at the relative water depth of 0.6~0.8 in the early stage of freezing, and the maximum velocity position has been kept near the relative water depth of 0.4 from the early stage of freezing to the beginning of the river thawing. This is because the existing research on open channel vegetation is mostly based on the growth of vegetation at the bottom of the channel, and the particularity of this study lies in the growth of epipelic algae on the oblique side wall. The complexity of the turbulent flow on the oblique side wall and the physical and biochemical effects of epipelic algae will inevitably lead to deviation between these research results and the existing research results of open channel vegetation.
4.2. The Effect of Epipelic Algae under Different Flow Rates
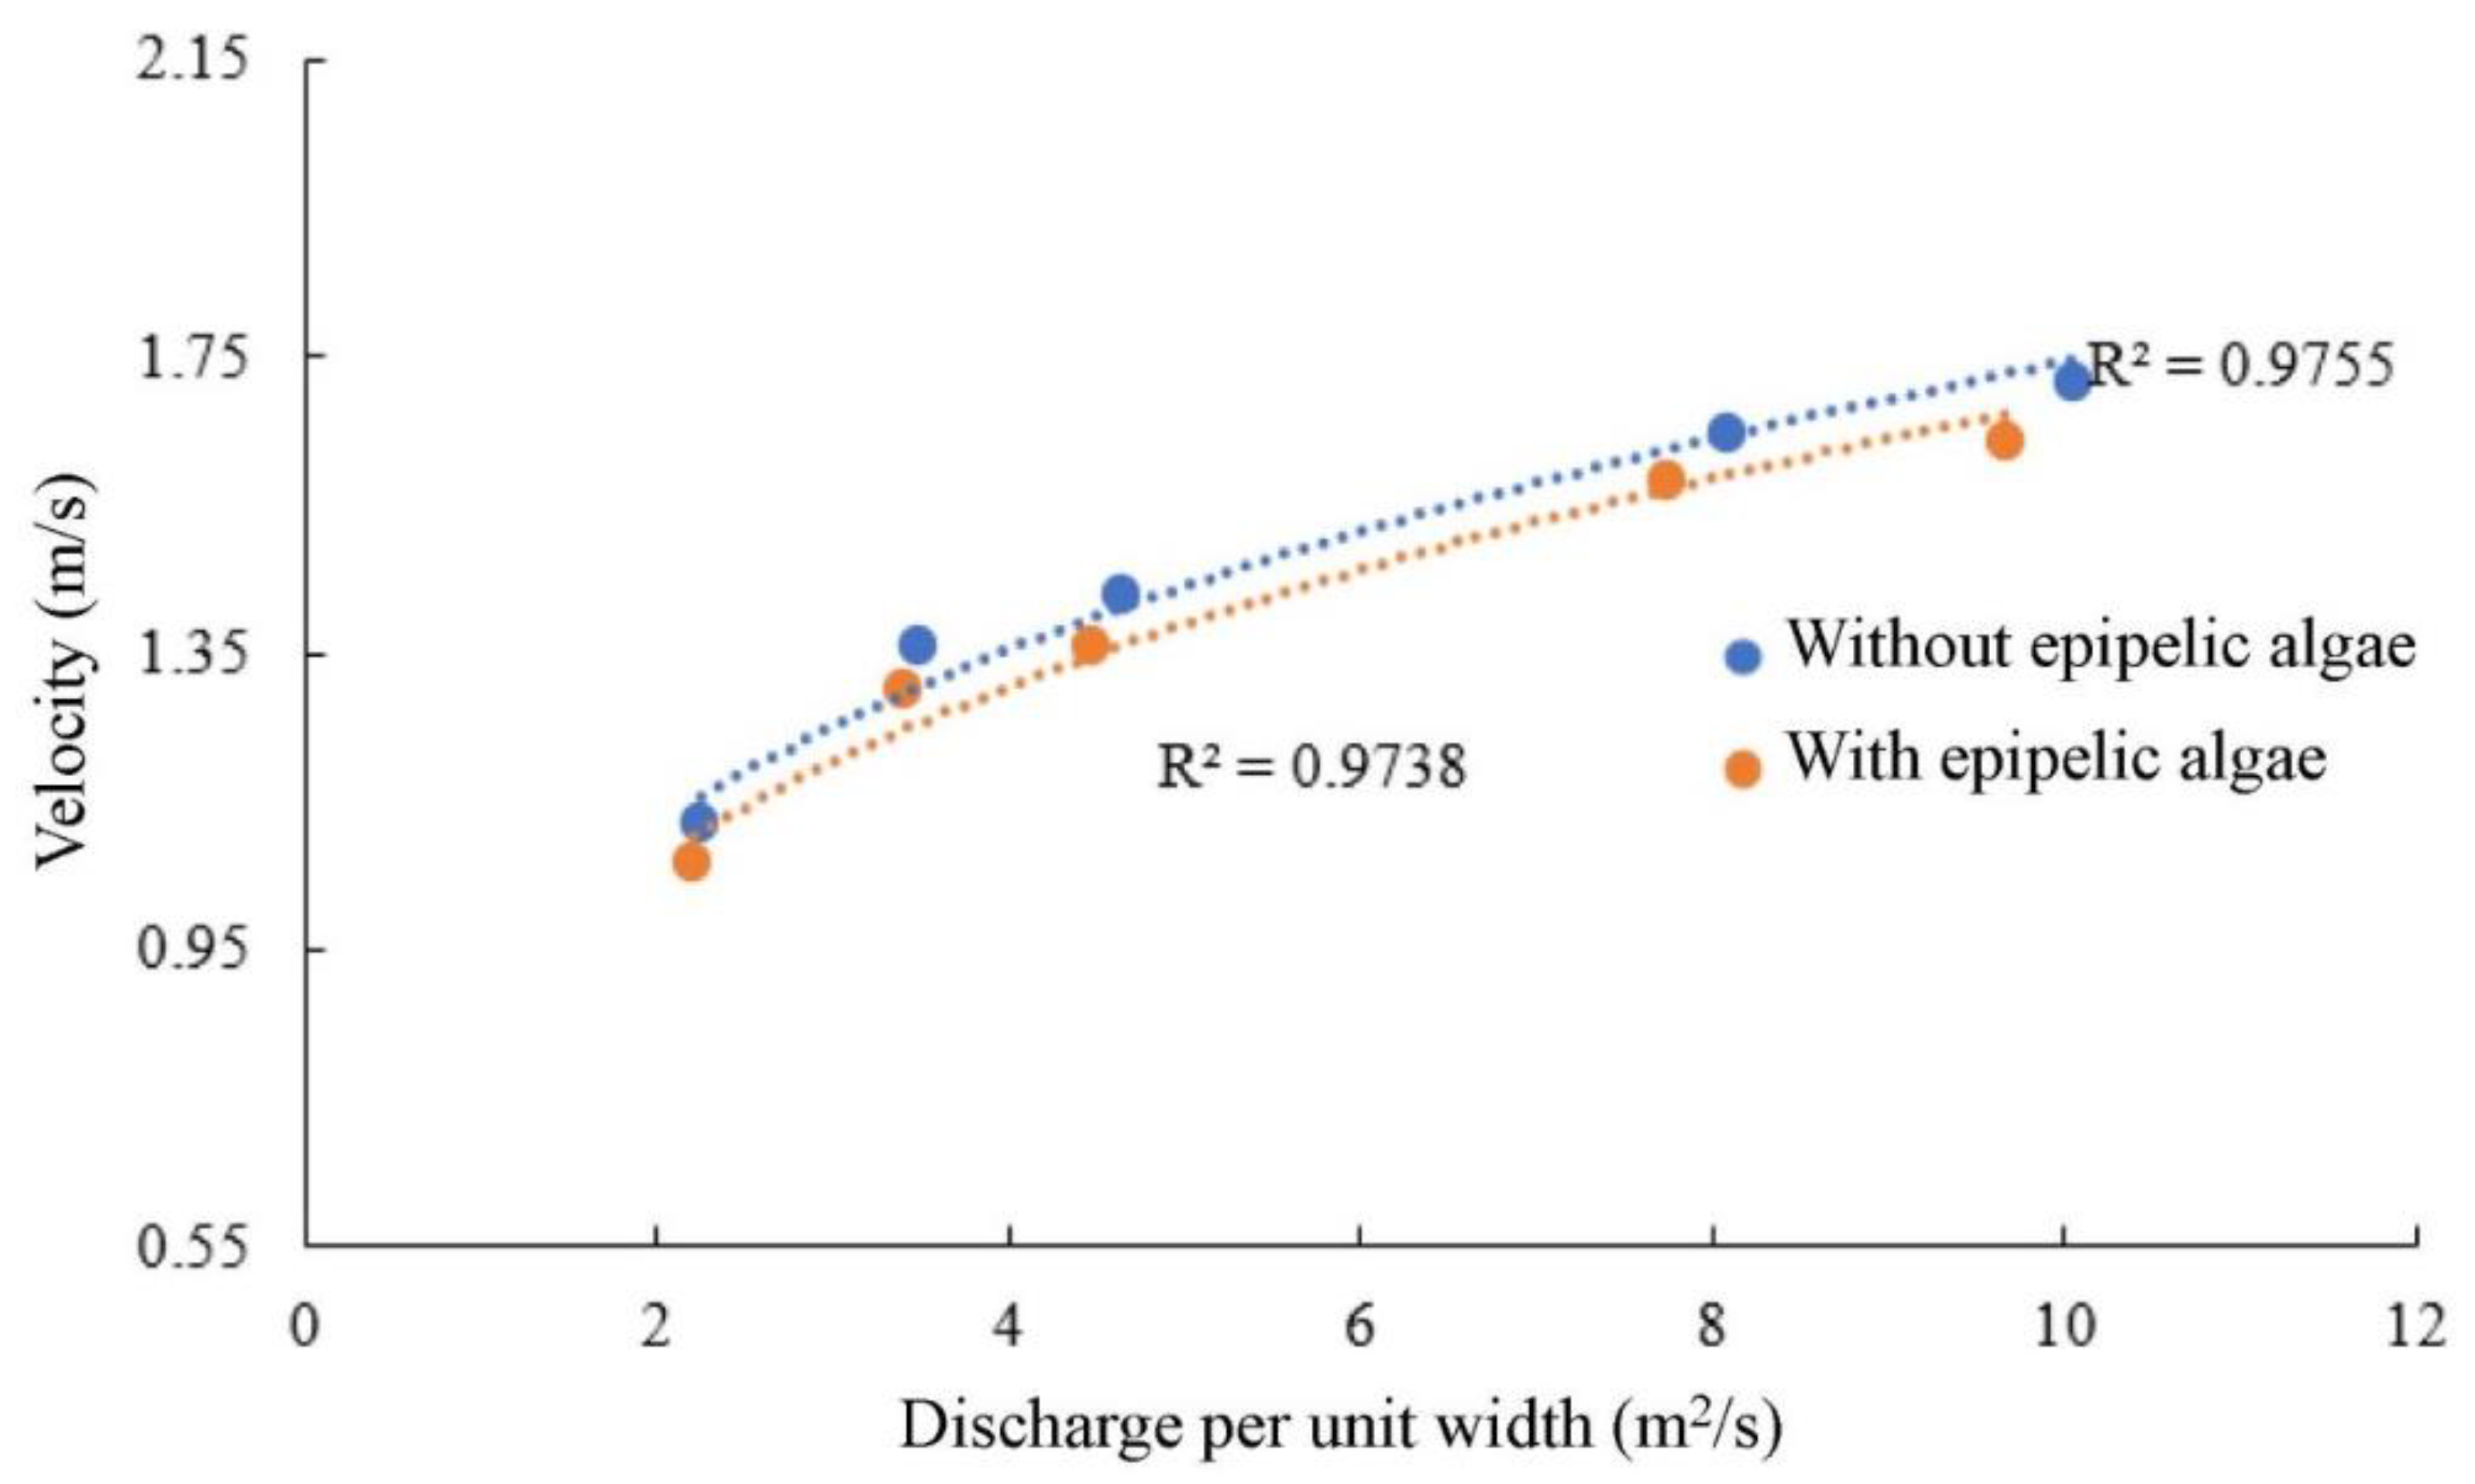
In the case of small flow, when the size of the epipelic algae group is small, the epipelic algae group has a minimal hindrance to the average flow rate of the channel. The data results show that the epipelic algae group only reduces the average flow rate of the channel by 5~6%. With the increase in the size of the epipelic algae group, the influence on the flow rate gradually increases; in the case of large flow, the effect of epipelic algae on the channel flow rate is minimal.
Through the relation between the average flow velocity and discharge per unit width on the side wall with or without epipelic algae, the average flow velocity of the channel increases with the increase in the discharge per unit width. As the flow discharge increases, the increase in the flow velocity decreases. This result is the same as the experimental conclusion obtained by Zhang Guanghui [
19]. The side wall has little effect on the average flow velocity of the whole channel. Ou Zuxian [
20] concluded that the velocity near the side wall of the channel is small due to the obstruction of the side wall roughness, but he did not propose the relation between the flow field near the wall and the main channel.
4.3. The Effect of Epipelic Algae under Vertical Distribution of Velocity
When the flow discharge is small, the vertical distribution of the average velocity of the near-wall area where the epipelic algae is located does not conform to the logarithmic distribution. This study is different from the research results of Zhang Peng [
21]. Zhang Peng believes that the vertical velocity distribution in the near-wall region of non-uniform flow still conforms to the logarithmic law. With the gradual increase in the flow discharge, the velocity distribution is more uneven when the relative water depth is less than 0.3, and the velocity gradient changes more greatly. The velocity inhomogeneity gradually appears when the relative water depth is greater than 0.3, but the effect is still less than the relative water depth below 0.3. Gong Weijun [
22] proposed that when the relative water depth is less than 0.2, the velocity gradient is larger, and the velocity gradient is smaller when it is greater than 0.2.
4.4. The Influence of Epipelic Algae on the Main Flow
The minimum velocity of the channel along the water depth plane is located near the wall, and the maximum velocity is not located in the middle of the channel but rather in the center of the channel inclined to the side wall. A possible reason for this is that the existence of epipelic algae leads to turbulent energy exchange in the open channel, and the convergence of turbulent energy is the maximum velocity. In addition, the presence of epipelic algae increases the roughness of the side wall. Under the action of epipelic algae, the velocity of the side wall is significantly reduced.
4.5. The Influence of Epipelic Algae on Sediment Deposition
The epipelic algae not only reduces the flow velocity of the channel but also significantly reduces the range of the peak flow velocity along the water depth plane of the channel, which will lead to the continuous deposition of sediment on the side wall in the later period, and the amount of deposition will be significantly higher than that without epipelic algae. Therefore, we will consider the sediment deposited on the mud algae as the influencing factor of the shedding of the mud algae.
4.6. The Influence of Epipelic Algae on Turbulent Vortex
The closer the water flow is to the side wall, the greater the velocity gradient changes, so that the flow field becomes more uneven. Because it is easily affected by the secondary flow near the wall, the direction of the main flow velocity and the position of the main flow are changed. The turbulent flow around the oblique side wall diverges from the bottom of the channel to the water surface. The closer to the water surface, the smaller the turbulent vortex is. The turbulent vortex gradually increases with the increase in the flow rate.
5. Conclusions
Through the analysis of the physical characteristics of the prototype sample, and the simulation of the cohesive force between the oblique side wall and the epipelic algae, multi-group and multi-series hydrodynamic tests were carried out. The flow velocity distribution law and the development and change in the turbulent vortex on the side wall were analyzed.
(1) The effect of epipelic algae on the side wall makes the maximum velocity in the vertical distribution appear within the relative water depth of 0.6, which is slightly deviated from the existing results of the vertical distribution of velocity in the open channel with vegetation. This is because the existing research on open channel vegetation is mostly based on the growth of vegetation at the bottom of the channel, and the particularity of this study lies in the growth of epipelic algae on the oblique side wall. The complexity of the turbulent flow on the oblique side wall and the physical and biochemical effects of epipelic algae will inevitably lead to deviation between these research results and the existing research results of open channel vegetation.
(2) In the case of small flow, when the size of the epipelic algae group is small, the epipelic algae group is of minimal hindrance to the average flow rate of the channel. The data results show that the epipelic algae group only reduces the average flow rate of the channel by 5~6%. With the increase in the size of the epipelic algae group, the influence on the flow rate gradually increases; in the case of large flow, the effect of epipelic algae on the channel flow rate is minimal.
(3) With the gradual increase in the flow discharge, the velocity distribution is more uneven when the relative water depth is less than 0.3, and the velocity gradient changes more greatly. The velocity inhomogeneity gradually appears when the relative water depth is greater than 0.3, but the effect is still less than the relative water depth below 0.3. When the flow discharge is small, the vertical distribution of the average velocity of the near-wall area where the epipelic algae is located does not conform to the logarithmic distribution. With the increase in the flow discharge, the velocity mutation is more obvious. Regardless of the presence or absence of epipelic algae, the vertical distribution of the average velocity of the channel basically conforms to the logarithmic distribution.
(4) The attached mud algae group significantly reduces the range of the peak velocity of the channel along the water depth plane, and the flow velocity of each section on the epipelic algae will be significantly reduced. It is easy to be affected by the secondary flow near the wall, which leads to the change in the main flow velocity direction and the main flow position. The maximum flow velocity of the channel along the water depth plane appears at the center of the channel inclined to the side wall. The turbulent flow around the oblique side wall diverges from the bottom of the channel to the water surface, and the turbulent vortex gradually increases with the increase in the flow rate.
In the future, more in-depth and detailed research is needed, for instance, (1) the conversion relation between the turbulent kinetic energy of the side wall and the main channel will be further explored, and the shedding mechanism of the epipelic algae group of the side wall will be studied with regard to the energy conversion at a deeper level. (2) The physical figure and the critical formula of the shedding of the epipelic algae group attached to the oblique side wall of the open channel will be further analyzed and established so as to deepen the theory of the development and change in the turbulent vortex in water flow.


