Article

Use of Plackett–Burman and Box–Behnken Designs to Optimize Bioelectricity Production from Winery Residues

1
Defense University Center, Spanish Naval Academy, University of Vigo, Plaza de España, 36920 Marín, Spain
2
Department of Industrial Engineering, Ferrol Polytechnic University School, University of A Coruña, 15403 A Coruña, Spain
*
Author to whom correspondence should be addressed.
Water 2023, 15(17), 3051; https://doi.org/10.3390/w15173051
Submission received: 26 July 2023 / Revised: 15 August 2023 / Accepted: 22 August 2023 / Published: 25 August 2023
(This article belongs to the Special Issue Wastewater and Bioelectricity Generation)

Abstract

:
This study aimed to estimate the bioelectricity production process using a vinasse solution through the application of Plackett–Burman and Box–Behnken designs. An electrochemical cell was constructed using Arduino to measure the potential difference between an anode and cathode immersed in a vinasse solution, which is a byproduct of wine production containing organic compounds and ions that undergo redox reactions. The Plackett–Burman design identified the most influential variables among eight previously selected (concentration of the electrolyte, pH, temperature, stirring, addition of NaCl, yeast dose and electrode:solution ratio). The results showed that the most influencing variables were the vinasse concentration and stirring and a peak of 306 mV could be observed for a 100 mL experiment. The third most influential variable regarding the process was NaCl addition, which showed its high influence at larger times. Based on these results, the Box–Behnken design was used to determine the possible ranges of variation of the independent variables (vinasse concentration, stirring and NaCl dose) to maximize the bioelectricity production. Therefore, with the combination of the intermediate concentrated vinasse (1:3 v/v ratio) and stirring, a peak of 431.1 mV could be observed when adding 2% NaCl after 15 min of the experiment. In what concerns the instant bioelectricity, measured after 1 min of the experiment, values up to 437.9 mV could be observed although yeast and/or NaCl are necessary at short times. This study provides insights into the bioelectricity production process from vinasse, contributing to the understanding and potential for sustainable energy generation.

1. Introduction

Experimental design is an approximation commonly employed to make experimentation more efficient. It is based on the combination of mathematical models and graphical representations that help to identify the optimal combination of variables to achieve the best results [1]. In chemical or biological engineering, it is common to employ chemometric tools for process optimization. They present advantages such as a reduction in the number of experiments carried out, which leads to considerably less work in the laboratory and a consequent cost reduction. These tools allow for the development of models that facilitate the evaluation of the results, obtaining statistical parameters, and identifying the interaction between different factors to check the significant variations that may occur in the parameters of interest. Optimization techniques arise as a set of methods to improve the operation of systems and to identify the optimal values of variables influencing their functioning. Data processing techniques are used to compare data with others to identify trends or recognize patterns aiming at classifying the data into clusters or to predict future observations.
Among the design of experiments (DoE) techniques, one of the best-known today is the use of factorial and fractional factorial designs [2]. These methods allow for deducing a behavior from various data observed. The process needs a careful examination of the variables that influence the process and the selection of which values they can obtain. When conducting these experiments, several values may be modified simultaneously instead of just one. In this method, a mesh is made in which there are 2k points, where k is the number of factors to vary. In the fractional case, only 2k-p values of the mesh will be taken into consideration. In this equation, the superscript k-p defines the resolution of the system, where k is the number of factors and p is the number of their interactions. However, these systems can become very complex if the number of variables increases. To carry out an optimizing technology with a considerable number of variables, multivariate optimization techniques will have to be applied on a larger scale. This work highlights the importance of the Plackett–Burman and Box–Behnken designs, which have similar characteristics but different purposes. The first one facilitates the selection of the most influential parameters and the second one allows for their combination to provide their optimal experimentation to maximize or minimize the response.
In this study, Plackett–Burman and Box–Behnken designs were applied to obtain bioelectricity from winery residues. The European Union is the world’s largest wine producer, with some of its countries leading the wine business, such as France, Spain and Italy [3,4]. Although wine production has been interpreted as a respectful process for the environment, winemaking generates large amounts of solid and liquid wastes [5]. Tons of bagasse, lees and vinasses, among others, are generated each year and valorization strategies are encouraged in order to mitigate the huge environmental impact they produce. In this sense, fermentation of grape marc, trimming vine shoot or vinification lees may be employed to produce lactic acid, biosurfactants, xylitol, ethanol and other compounds. Also, grape marc and seeds may exhibit antioxidant properties, and vinasse contains tartaric acid that can be extracted and commercialized [6]. The complexity of these procedures has led some producers to manufacture compost, which is another by-product of agricultural interest [7]. Vinasses present favorable chemical characteristics for their use in the production of sustainable energy since they present conditions that help with electricity production: they have a remarkable acidity (pH = 2–6); high salinity; high values of dissolved oxygen; and high content of organic matter (900–35,000 mg/L) due to its high carbon, nitrogen and potassium concentrations, in addition to phenolic substances and heavy metals [8,9].
Bioelectricity using vinasse residues was analyzed by other authors, although there are scarce references about winery materials. In the viticulture and winemaking processes, the winery residues are rich in organic compounds such as polyphenols, tannins and volatile compounds. While these compounds contribute to the desirable sensory attributes of wine, they also possess the potential to exert harmful effects on soil, water and biota when not properly managed. Using microbial fuel cells (MFCs) to treat disposal materials presents the advantage that this technique is not affected by the toxicity of the materials, e.g., fungicide [10] or pyretroid drugs [11], among other agrochemical products.
In relation to the MFC configuration, previous results showed that these complex residues operate more efficiently with an inoculum concentration of 20 to 30%. This dilution rate is necessary to avoid the high organic load, low pH and high polyphenol contents [12], which may even inhibit the energy production. Also, a short distance between electrodes, between 1 cm [13] and up to 6 cm [14], was documented to favor redox reactions. Seasonality in the composition of this wastewater must also be considered as nutrient or microorganisms’ content may vary [15], although Liu et al. [16] treated the winery sources with organic amendments to stabilize the electrical energy recovered by cycle.
Therefore, the main objective of this study was to employ winery residues to produce bioelectricity to generate renewable energy. Red wine residues were selected, as they are the most common wine species produced in our study area. The Plackett–Burman design was employed as a previous screening to a series of factors that affect the MFC configuration (concentration of the electrolyte, pH, temperature, stirring, addition of NaCl, yeast dose and electrode:solution ratio). Next, the Box–Behnken design was used to evaluate the capacity of the three variables that most influenced the process to maximize bioelectricity production.
Also, the secondary benefits are the reduction in waste production and disposal, as management of these residues can be a challenge to wineries, and they can benefit from an environmentally friendly approach, which will also contribute to reducing their carbon footprint. Finally, reducing waste can bring benefits from an economical perspective, as wineries can reduce their energy costs by using their residues to generate bioelectricity, becoming more self-sufficient.

2. Materials and Methods

2.1. Construction of the Electrochemical Cell and Electrolyte Employed

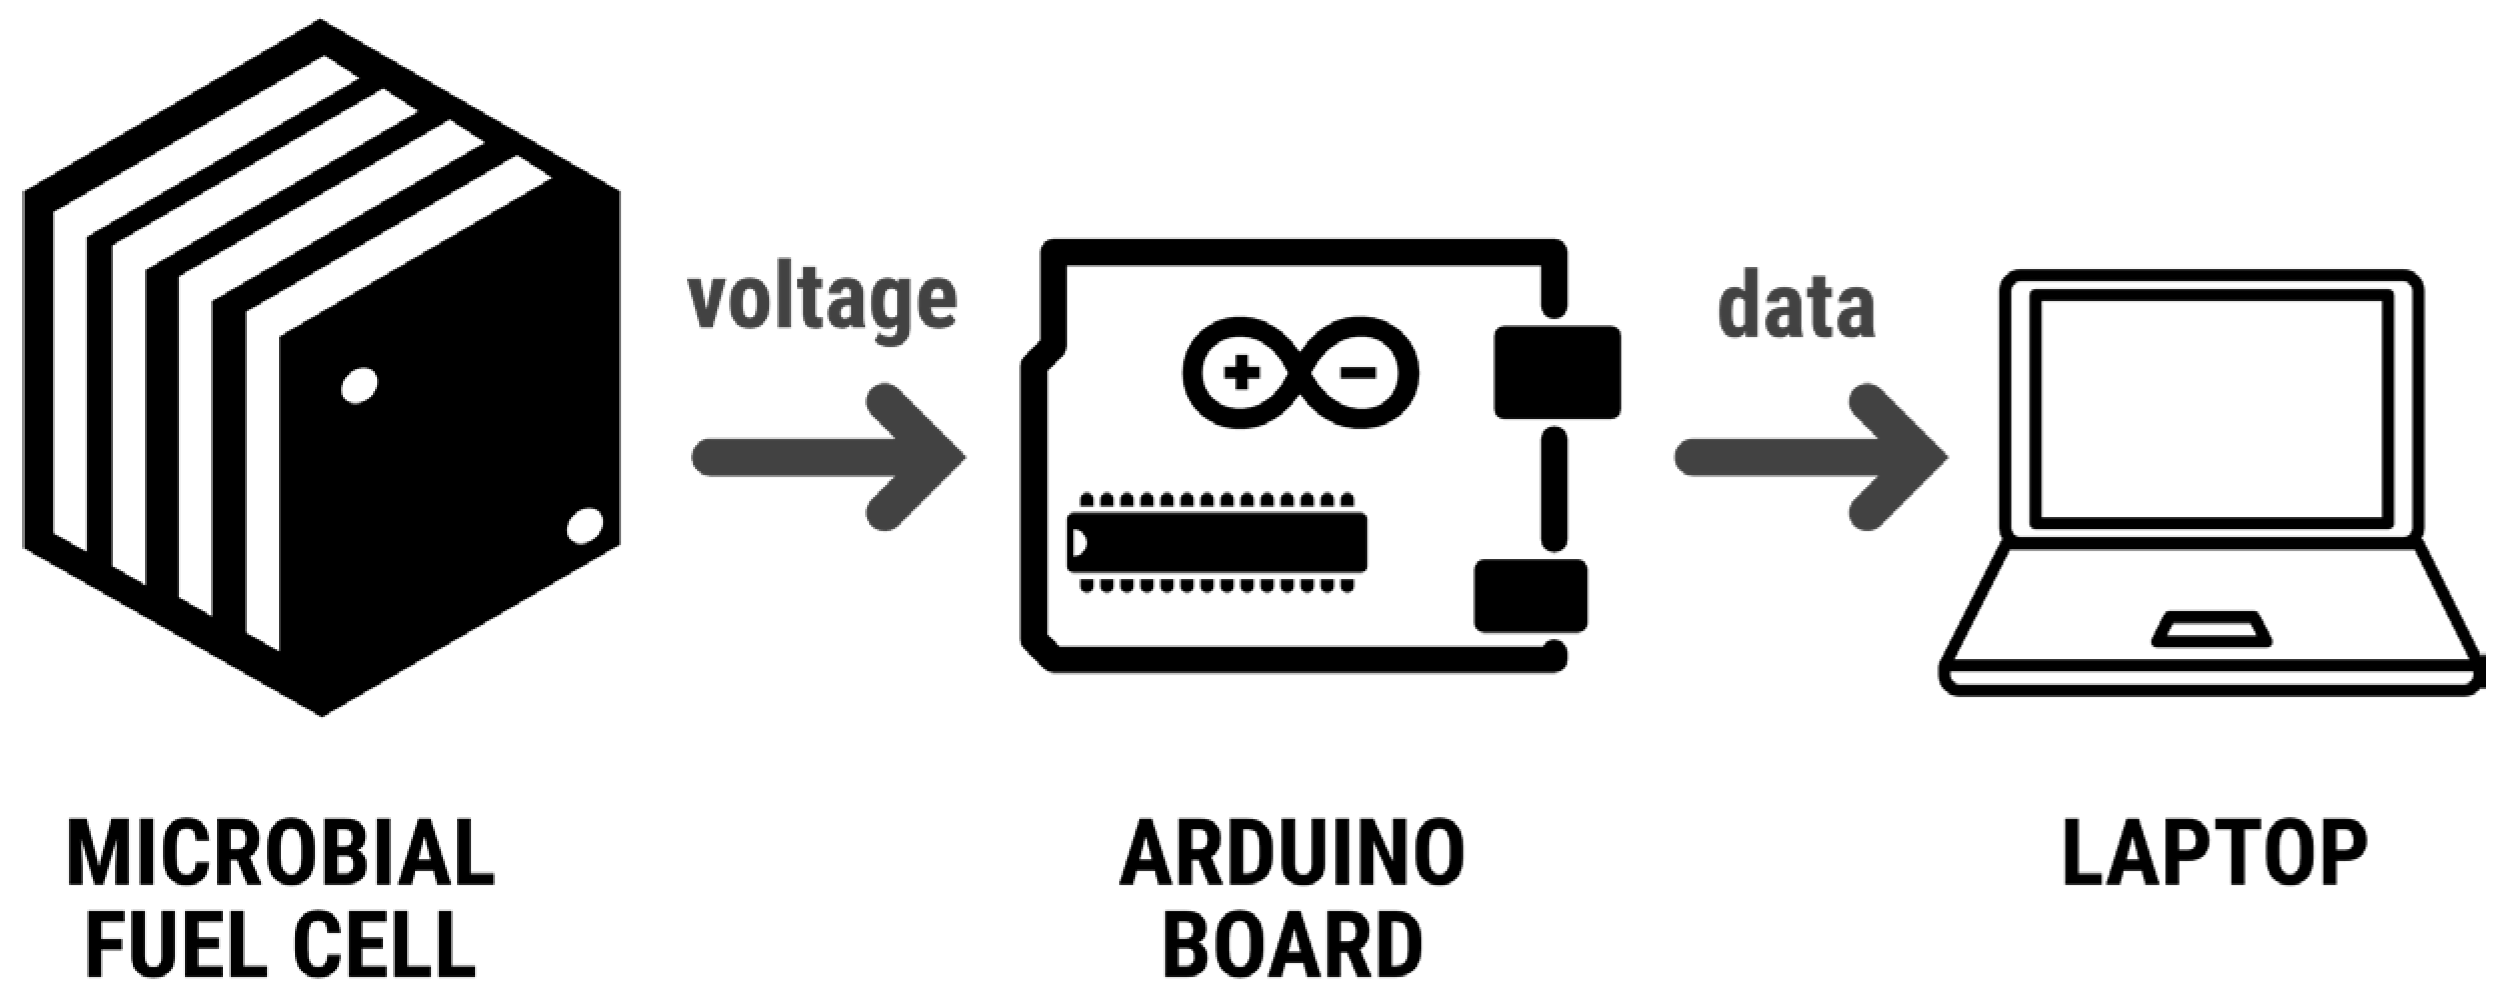
The objective of this experiment was to build an electrochemical cell with one chamber, using vinasse residues as the electrolyte and copper/zinc electrodes. An Arduino was used to measure the potential difference between the anode and cathode while they were immersed in a solution of vinasse. The vinasse solution is a byproduct of wine production that contains organic compounds and ions that can undergo redox reactions at the electrodes. The Arduino served as the data acquisition system to measure the potential difference between the electrodes and to record the values in real time (Figure 1).
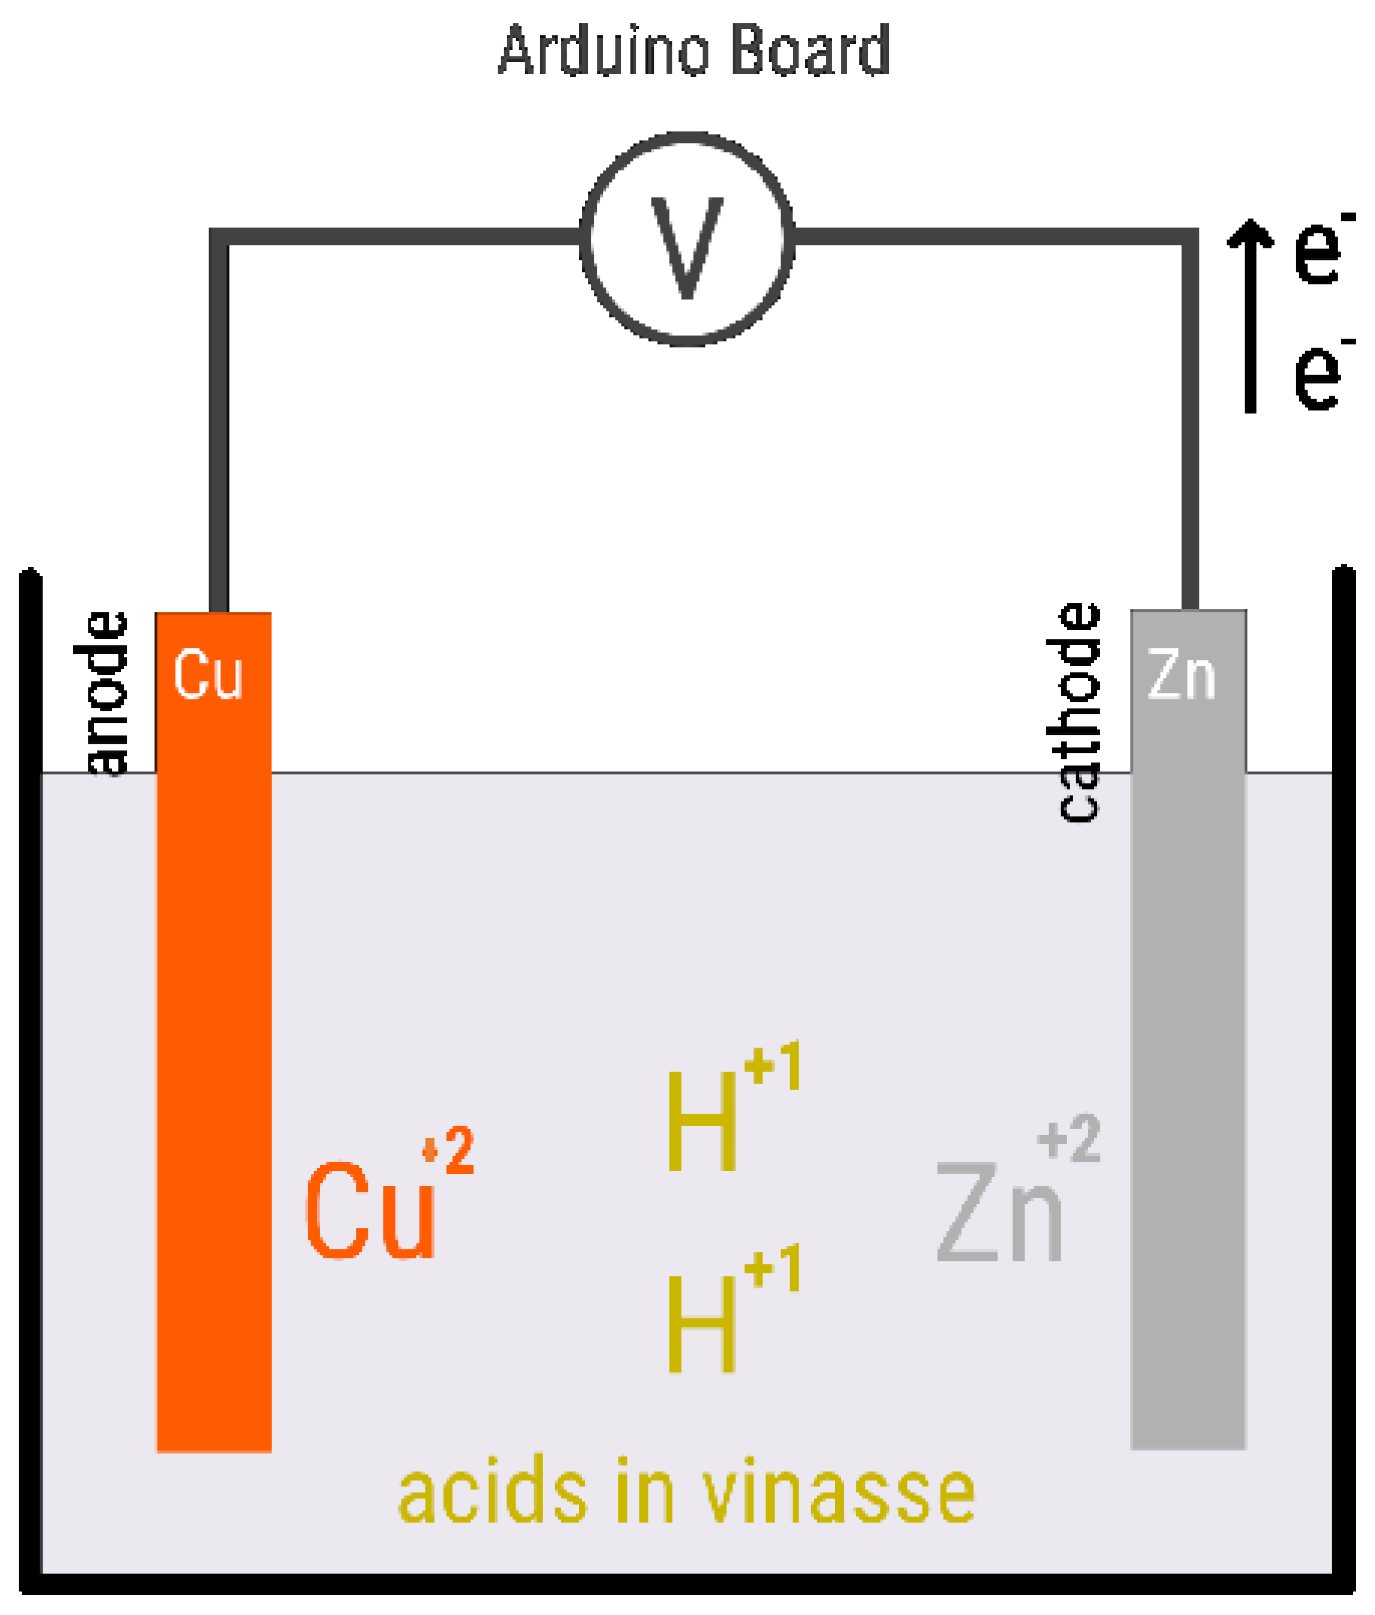
Connecting the Arduino board to the USB port of a computer was achieved as following: (1) the blue wire was connected to the GND port of the Arduino and the other end to the breadboard; (2) a 100 Ω resistor and a wire were connected to the zinc cathode (10 × 2 cm) and the wire to the breadboard was connected in parallel with the blue wire; (3) the red wire was connected to one of the analog input ports of the Arduino and the other end to a 100 Ω resistor; (4) the resistor was connected in parallel with another wire that went to the copper anode (10 × 2 cm), and the wire was connected to the breadboard; (5) the surfaces of the zinc cathode and copper anode were sanded to remove impurities; (6) the electrodes were cleaned with pure ethanol and then with distilled water to remove any remaining impurities; (7) the electrodes were dried with laboratory paper to minimize contamination; (8) the electrodes were inserted into the beaker containing the vinasse solution, making sure they did not touch each other; (9) insulating tape and clips were used to attach the wires to the electrodes, ensuring that the wire ends were in continuous contact with the electrodes; (10) the Arduino was turned on and the data acquisition software was opened; and (11) the potential difference values were monitored on the computer screen and the data were recorded. On the other hand, wine residues in a fermentation process were employed as the electrolyte in the electrochemical cell. Residues were employed at a 1/10 dilution rate to decrease the viscosity of the samples. A total of 100 mL of liquid waste was placed in 250 mL beakers equipped with a pH meter and a thermometer to register data continuously (Figure 2).
The electrolyte used in this experiment, namely, vinasse, was modified in the first laboratory phase to find out under what conditions the energy production was maximized. Thus, in some of the experiments, the initial vinasse was modified by adding sodium chloride, with the aim of checking whether the addition of an additional electrolyte increased the efficiency of the process. On the other hand, the initial sample was incubated with 1 g/L of yeast at 28 °C for 24 h to check whether the conduction improved with the count of microorganisms. Finally, it was also evaluated whether the effectiveness of the electrolyte was affected by its pH.

2.2. Phase 1: Analysis of the Most Influential Variables with a Plackett–Burman Design

One of the factorial designs that allow for the combination of a high number of variables is Plackett–Burman screening. It is a process with L levels and (L − 1) variables, which generates a table with L(L − 1) combinations, whose values depend on a numerical value, in this case, one as a positive value and another that is negative (Table 1). The order of the rows and the table code values are generated randomly so that there is no influence between each of the experiments. This method allows for discriminating between a high number of variables to find which of them is really influencing a process [17,18].
The initial phase of this study focused on identifying the variables that had the greatest impact on the process of generating electricity from vinasse. This stage starts with the design of a Plackett–Burman experiment in which seven variables were selected, each with a minimum and maximum value assigned. The following independent variables were studied, including their ranges of variation in parentheses:
  • A: concentration of the electrolyte, diluted in H2O (1:4–1:2);
  • B: pH (native value (2.5) and corrected native value (4.5));
  • C: temperature (25–35 °C);
  • D: stirring (with or without stirring);
  • E: additional electrolyte, i.e., effect of adding NaCl (without salt and with salt at 10% by volume);
  • F: additional microorganisms, i.e., the effect of adding yeast extract (without yeast and adding 1 g/L);
  • G: electrode ratio in 50 and 100 mL.
A total of eight series of experiments were carried out using this design. Each series was carried out in triplicates and three measurements were carried out for each of them. The Plackett–Burman table was generated using the Tibco Statistica 13.3 program (Table 1).

2.3. Phase 2: Maximizing Bioelectricity Production by Means of a Box–Behnken Factorial Design

Between the first and second stages of the experiment, the data obtained were analyzed to determine the most influential variables for the project’s continuation. After the analysis, three variables were selected to move on to the next stage, while all other variables were discarded. The selected variables were the vinasse concentration, sodium chloride dose, and stirring, which are further explained in the Section 3.
The other design of experiments method employed in this study was the Box–Behnken design, which is a three-level incomplete design that combines factorial designs that are employed to predict the response of the dependent variables via the estimation of the coefficients fitted to a polynomial equation [19]. In this model, data are classified into two types: variables and responses. The model was fit to a quadratic model (Equation (1)), as we wanted to obtain a response surface and it was suspected that it has a curvature since the relationship between the variables and data did not vary linearly [20,21].
Y = b 0 + b 1 x 1 + b 2 x 2 + b 3 x 3 + b 4 x 1 x 2 + b 5 x 1 x 3 + b 6 x 2 x 3 + b 7 x 1 2 + b 8 x 2 2 + b 9 x 3 2
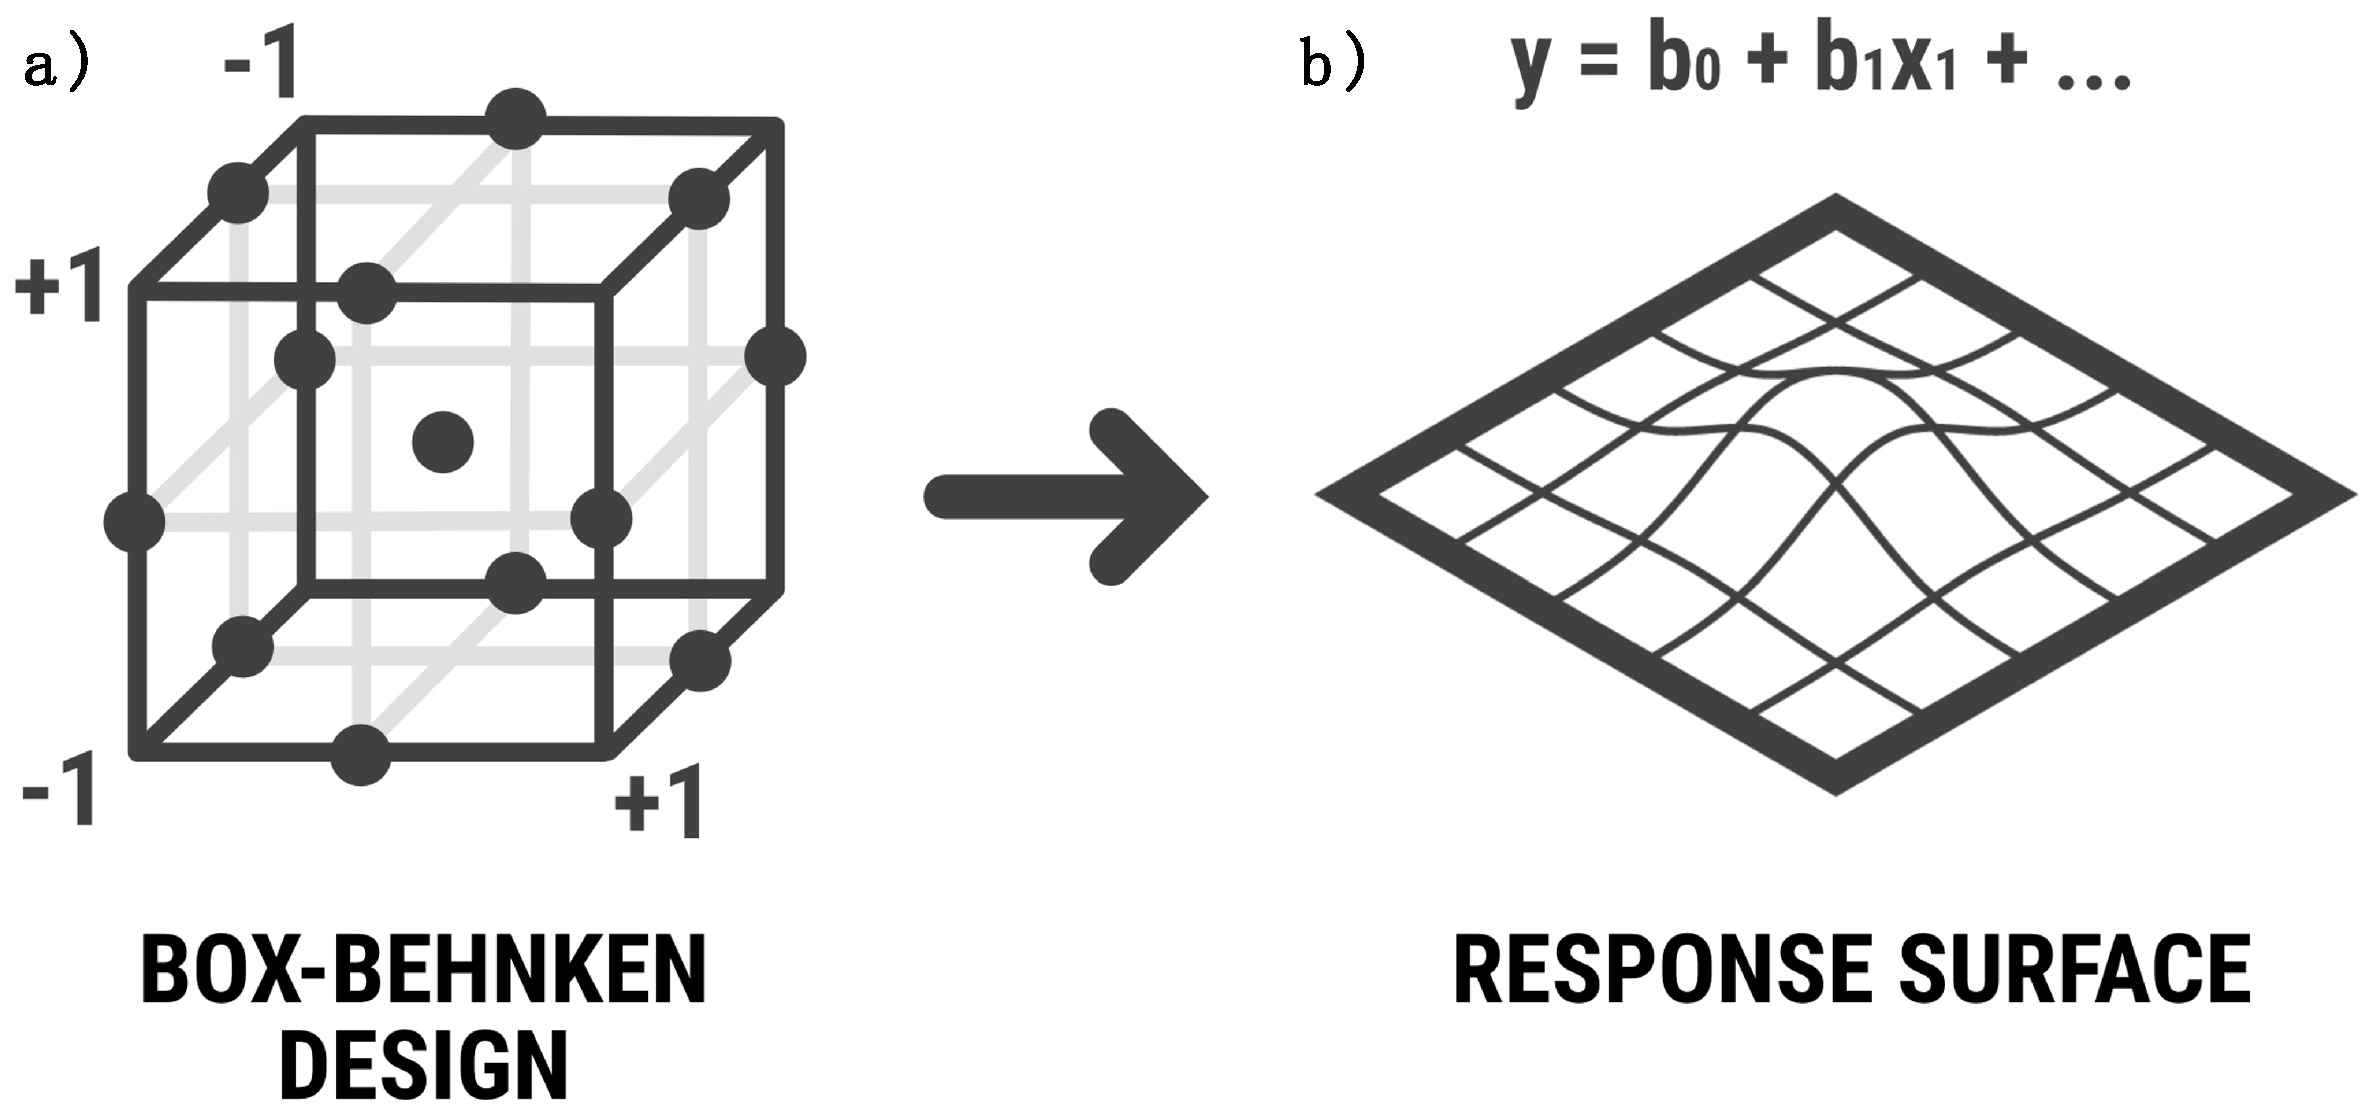
In the Box–Behnken Design, the sample corresponds to a repeated three-level factorial design with different combinations. Parameters that are not included in the two-level factorial design are put at their mean value. This is essential to be able to map a response surface region (Figure 3), which will allow for deducing responses at intermediate conditions not assayed. The Box–Behnken design manages to study the combination of variables more precisely than the Plackett–Burman design.
In this study, an incomplete 33 factorial design was carried out with twelve combinations of the three independent variables and three replicates of one central point. The three most influential parameters were varied according to Table 2. The parameters and their ranges of variation were as follows: electrolyte concentration diluted in H2O (1:4–1:2–1:1); minimum, medium, and maximum stirring (100, 3100 and 6200 rpm); and additional electrolyte, i.e., the effect of adding NaCl (2%, 6% and 10% of the volume of the solution). The parameters not used in this stage were kept constant, such as temperature, pH, the same electrode–solution ratio and no addition of yeast. A thermometer and pH meter were used to ensure that all fifteen samples started from the same initial conditions. If necessary, adjustments were made to the temperature and pH values to ensure consistency between the samples.

3. Results

3.1. Phase 1: Analysis of Plackett–Burman Results to Identify Patterns

The vinasse concentration, pH, temperature, stirring, NaCl concentration, yeast dose and electrode:solution ratio were tested as influential variables in the bioelectricity production. The measurements were taken at multiple time points, starting from 1 min and continuing at 5, 10 and 15 min. Measuring the bioelectricity at short intervals, ranging from 1 to 15 min, is important in microbial fuel cell experiments. The dynamic nature of bioelectrochemical processes occurring within these systems necessitates frequent monitoring to capture the transient behavior and fluctuations in electrical output and provides valuable data for comprehensive analysis, improves experimental control and enhances the understanding of bioelectrochemical processes in microbial fuel cells. Table 3 shows the average values obtained for the six experiments of the Plackett–Burman design with measurements registered every 10 s.
The observed millivolt values exhibited a gradual decline over time, except for experiment 1, where the minimum values decreased by up to 60% of the maximum peaks at the 15 min mark (Figure 4). The maximum value was observed in experiment 1, reaching over 306 mV. However, in the other six experiments, the millivolt values were sustained at around 90% of their maximums after 15 min. Notably, the minimum values consistently remained above 75% of the maximum values, except for the aforementioned exception.
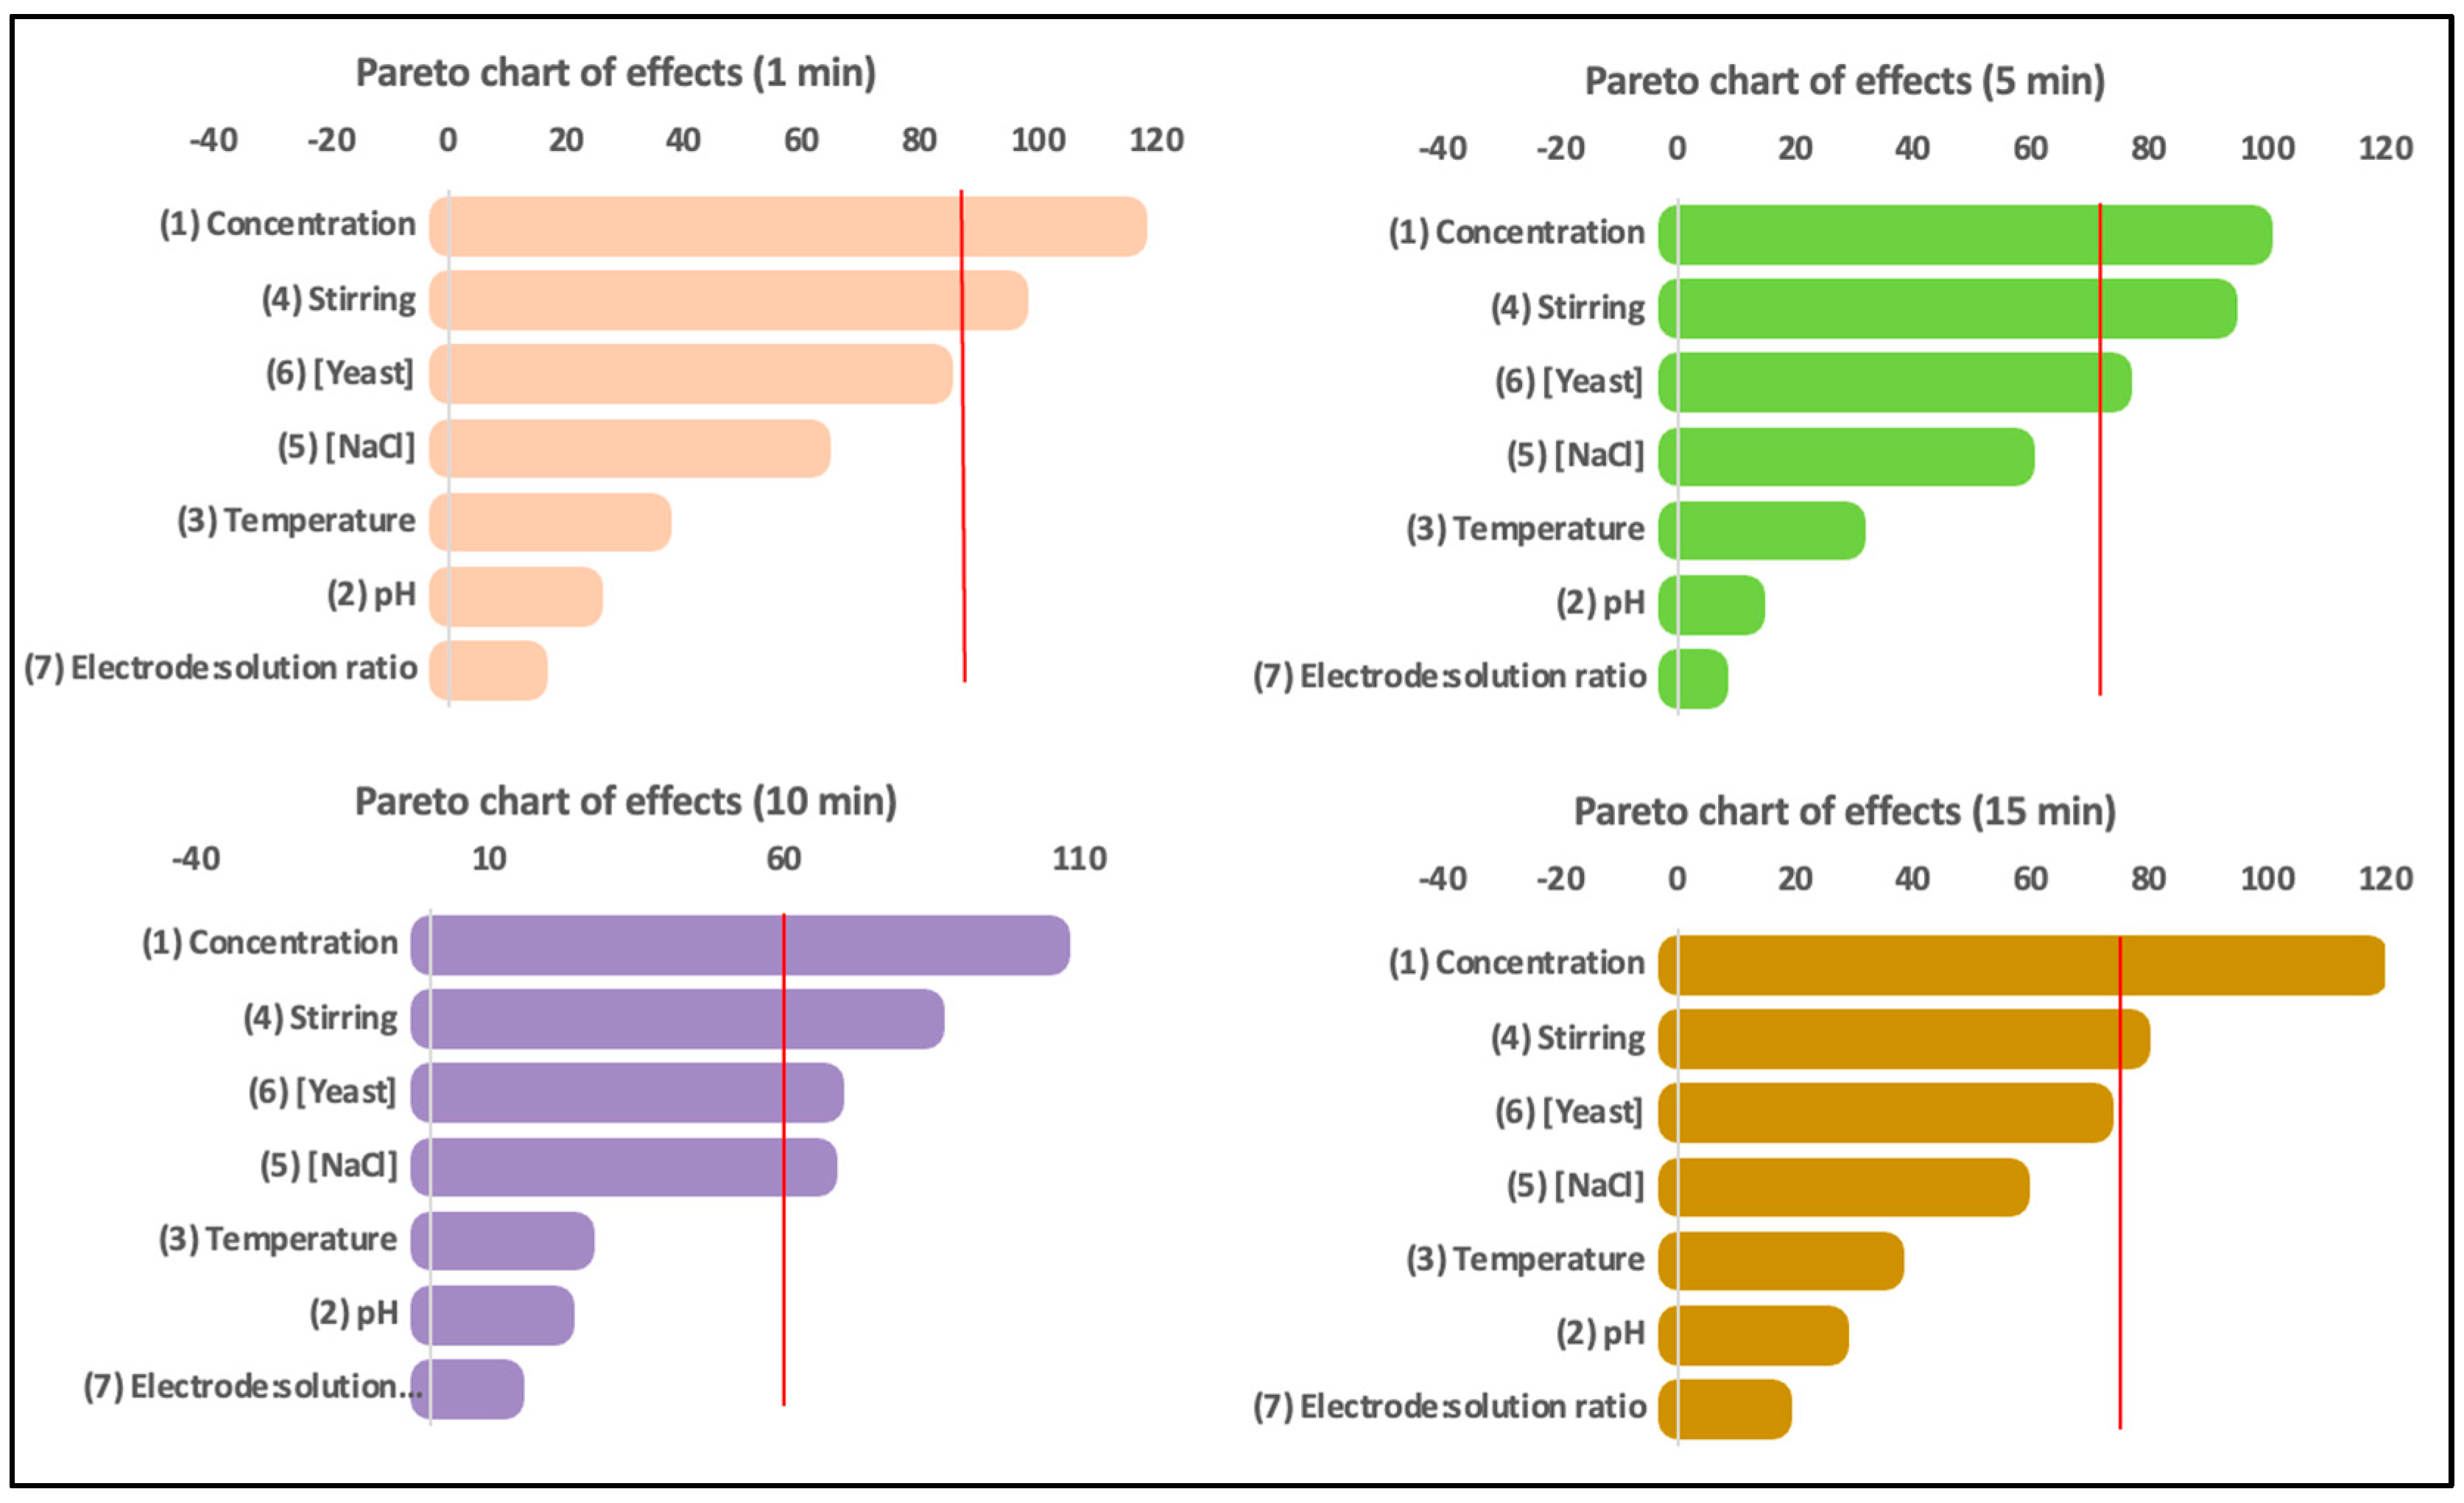
The Plackett–Burman design experiments were further analyzed using Pareto charts, as depicted in Figure 5, which illustrate the influence of the analyzed variables on the millivolt production. The data reveal that the concentration, stirring, and yeast were the most influential variables, while temperature showed a negative correlation. Within 1 min of the experiment starting, these three variables accounted for up to 70% of the millivolt variability. However, after 15 min, their influence increased to approximately 83%. As the experiment progressed, stirring became more important, while the influence of concentration and yeast decreased. The pH showed a slight positive influence on the conductivity of the solution, and the concentration of NaCl increased over time. Additionally, the concentration was found to have an inverse relationship with stirring.
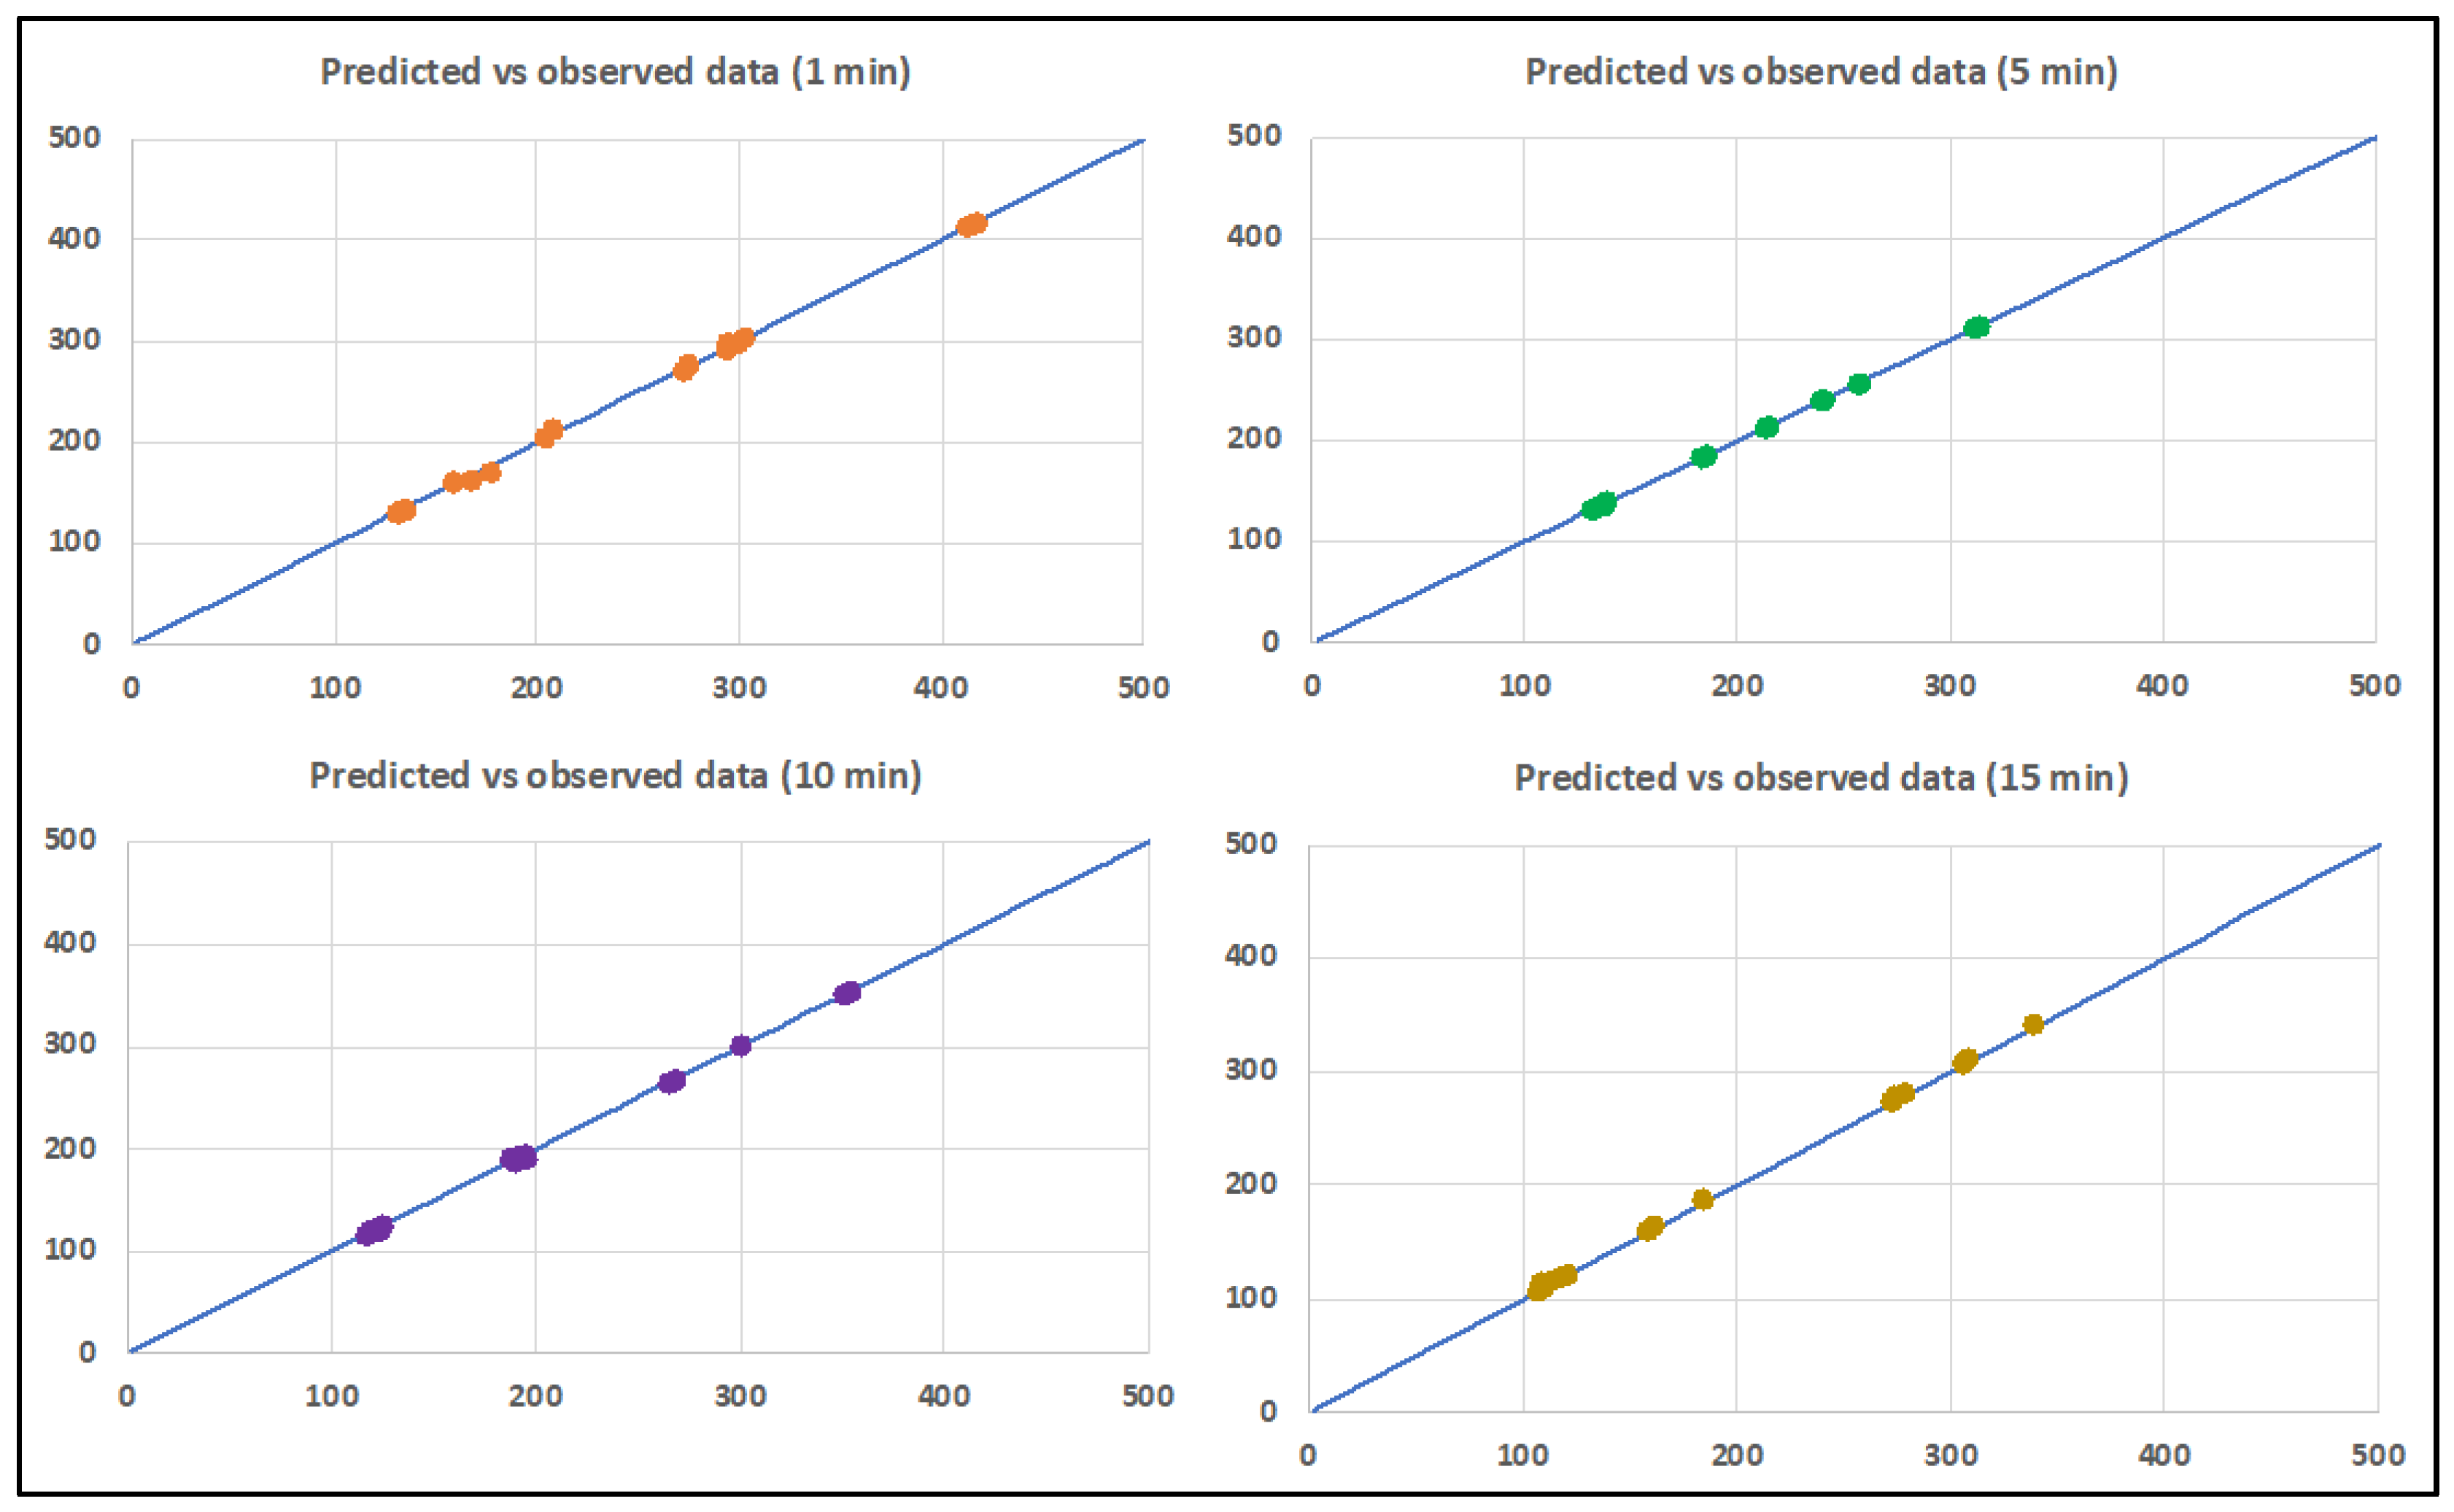
Validation of the statistical analysis is shown in Figure 6, which shows the relation between the observed and predicted data for the millivolt production, showing good reproduction of the experimental data in all cases.
Also, the significance of each coefficient was determined using p-values for the variables A to G, corresponding to bioelectricity production after 1, 5, 10 and 15 min, respectively (Table 4).
Based on the obtained results, the Plackett–Burman model successfully identified the most important parameters for optimizing the process of electricity production from a solution. Concentration and stirring consistently appeared as important factors in the process. However, yeast concentration appeared as an important factor only during the first five minutes of the experiments and its importance decayed in favor of NaCl, whose influence seemed more important for larger experiments. Therefore, for the second stage of the experiment, stirring, concentration, and sodium chloride were chosen as the relevant parameters. Stirring was considered the most important parameter, although its use required energy. Concentration positively influenced the electricity production, but finding the optimal concentration was challenging due to the balance between density and the ability to agitate or dilute the solution. Sodium chloride was chosen due to its lower cost, ability to work for an extended time, and ease of instant preparation compared with yeast. Furthermore, the use of seawater instead of distilled water and sodium chloride was suggested to increase sustainability and reduce costs.
In summary, the study identified the key variables that influenced bioelectricity production and highlighted the importance of stirring, concentration, and yeast. The results of the Plackett–Burman design experiments provided insights into the optimal parameters for the electricity production process. The microbial fuel cell experiment conducted in this study was performed at a small scale, which allowed for controlled conditions and ease of monitoring. However, scaling up the microbial fuel cell system holds the potential to enhance electricity generation and address the cost associated with stirring. By increasing the scale, a higher volume of microbial biomass and substrate can be accommodated, leading to increased power output. The larger surface area and increased number of electrochemically active microorganisms can result in greater electron transfer rates and improved the overall performance. Moreover, as the scale increases, the need for mechanical stirring can be reduced or eliminated. At larger scales, natural convection and diffusion processes can play a more significant role in providing adequate mixing and substrate availability throughout the system. This equilibrium between electricity production and reduced stirring costs makes scaling up microbial fuel cells an attractive avenue for achieving higher energy yields and improving the economic feasibility of the technology.

3.2. Phase 2: Optimization of the Process to Maximize Milivolt Production

The Plackett–Burman design allowed for identifying the concentration, stirring and yeast as the most important factors that affect the process. This analysis allowed for screening many factors at once with a minimum number of experimental runs. After the Plackett–Burman analysis, the most significant factors were selected for further optimization using a Box–Behnken design. Overall, the combined findings from the Plackett–Burman design and subsequent Box–Behnken design highlighted the influential factors in bioelectricity production and provided insights into their optimal settings. By systematically varying and analyzing these factors, this study aimed to optimize the process and achieve the desired bioelectricity output.
The Box–Behnken design, which is a type of response surface methodology, enables the optimization of multiple factors concurrently while minimizing the number of experimental runs required. This approach involves systematically varying each factor across low, medium and high levels to determine their optimal values. The goal is to identify the combination of factor settings that yield the desired response or outcome. The Box–Behnken Design typically involves a series of experimental runs, where the response of interest is measured and used to construct a mathematical model to predict the optimal settings for each factor.
In the experiments conducted, the observed millivolt values exhibited notable differences depending on the specific experiment (Table 5). For example, experiment 1 displayed low millivolt values, as it was carried out with an intermediate vinasse concentration, along with the lowest stirring and NaCl values. Conversely, experiments 13 to 15, which utilized intermediate values of concentration, NaCl and stirring, significantly increased the millivolt values. The maximum bioelectricity production was observed in experiment 2, with an average value of 431.1 mV. This experiment employed the highest stirring value, intermediate concentration and minimum NaCl dose. Importantly, the minimum millivolt values consistently remained above 75% of the maximum values throughout the experiments.
In this study, a Pareto chart was employed as a tool to detect the influence of the variables. The use of a Pareto chart of standardized effects in the analysis of influential variables in bioelectricity production provides valuable insights into the significance of each factor. The Pareto chart allows for a visual representation of the magnitude of the effects, helping to prioritize and focus on the most influential factors for process optimization. The use of a standardized effects chart allows for a fair comparison of the influence of different variables, as the effects are normalized to a common scale. This normalization enables researchers to identify the most critical factors that significantly impact the response variable, regardless of the differences in their units or scales. In this study, the standardized effects chart provided a clear representation of the relative importance of the variables, highlighting the concentration, stirring and yeast as the primary drivers of millivolt production.
In the presented study, the Pareto chart of standardized effects (Figure 7) revealed that the vinasse concentration and stirring were the most influential variables in the bioelectricity production process at the beginning of the process. These variables exhibited positive effects on millivolt production, indicating that higher levels of concentration and stirring were associated with increased bioelectricity generation. These variables showed positive significant influence, both in linear and quadratic forms.
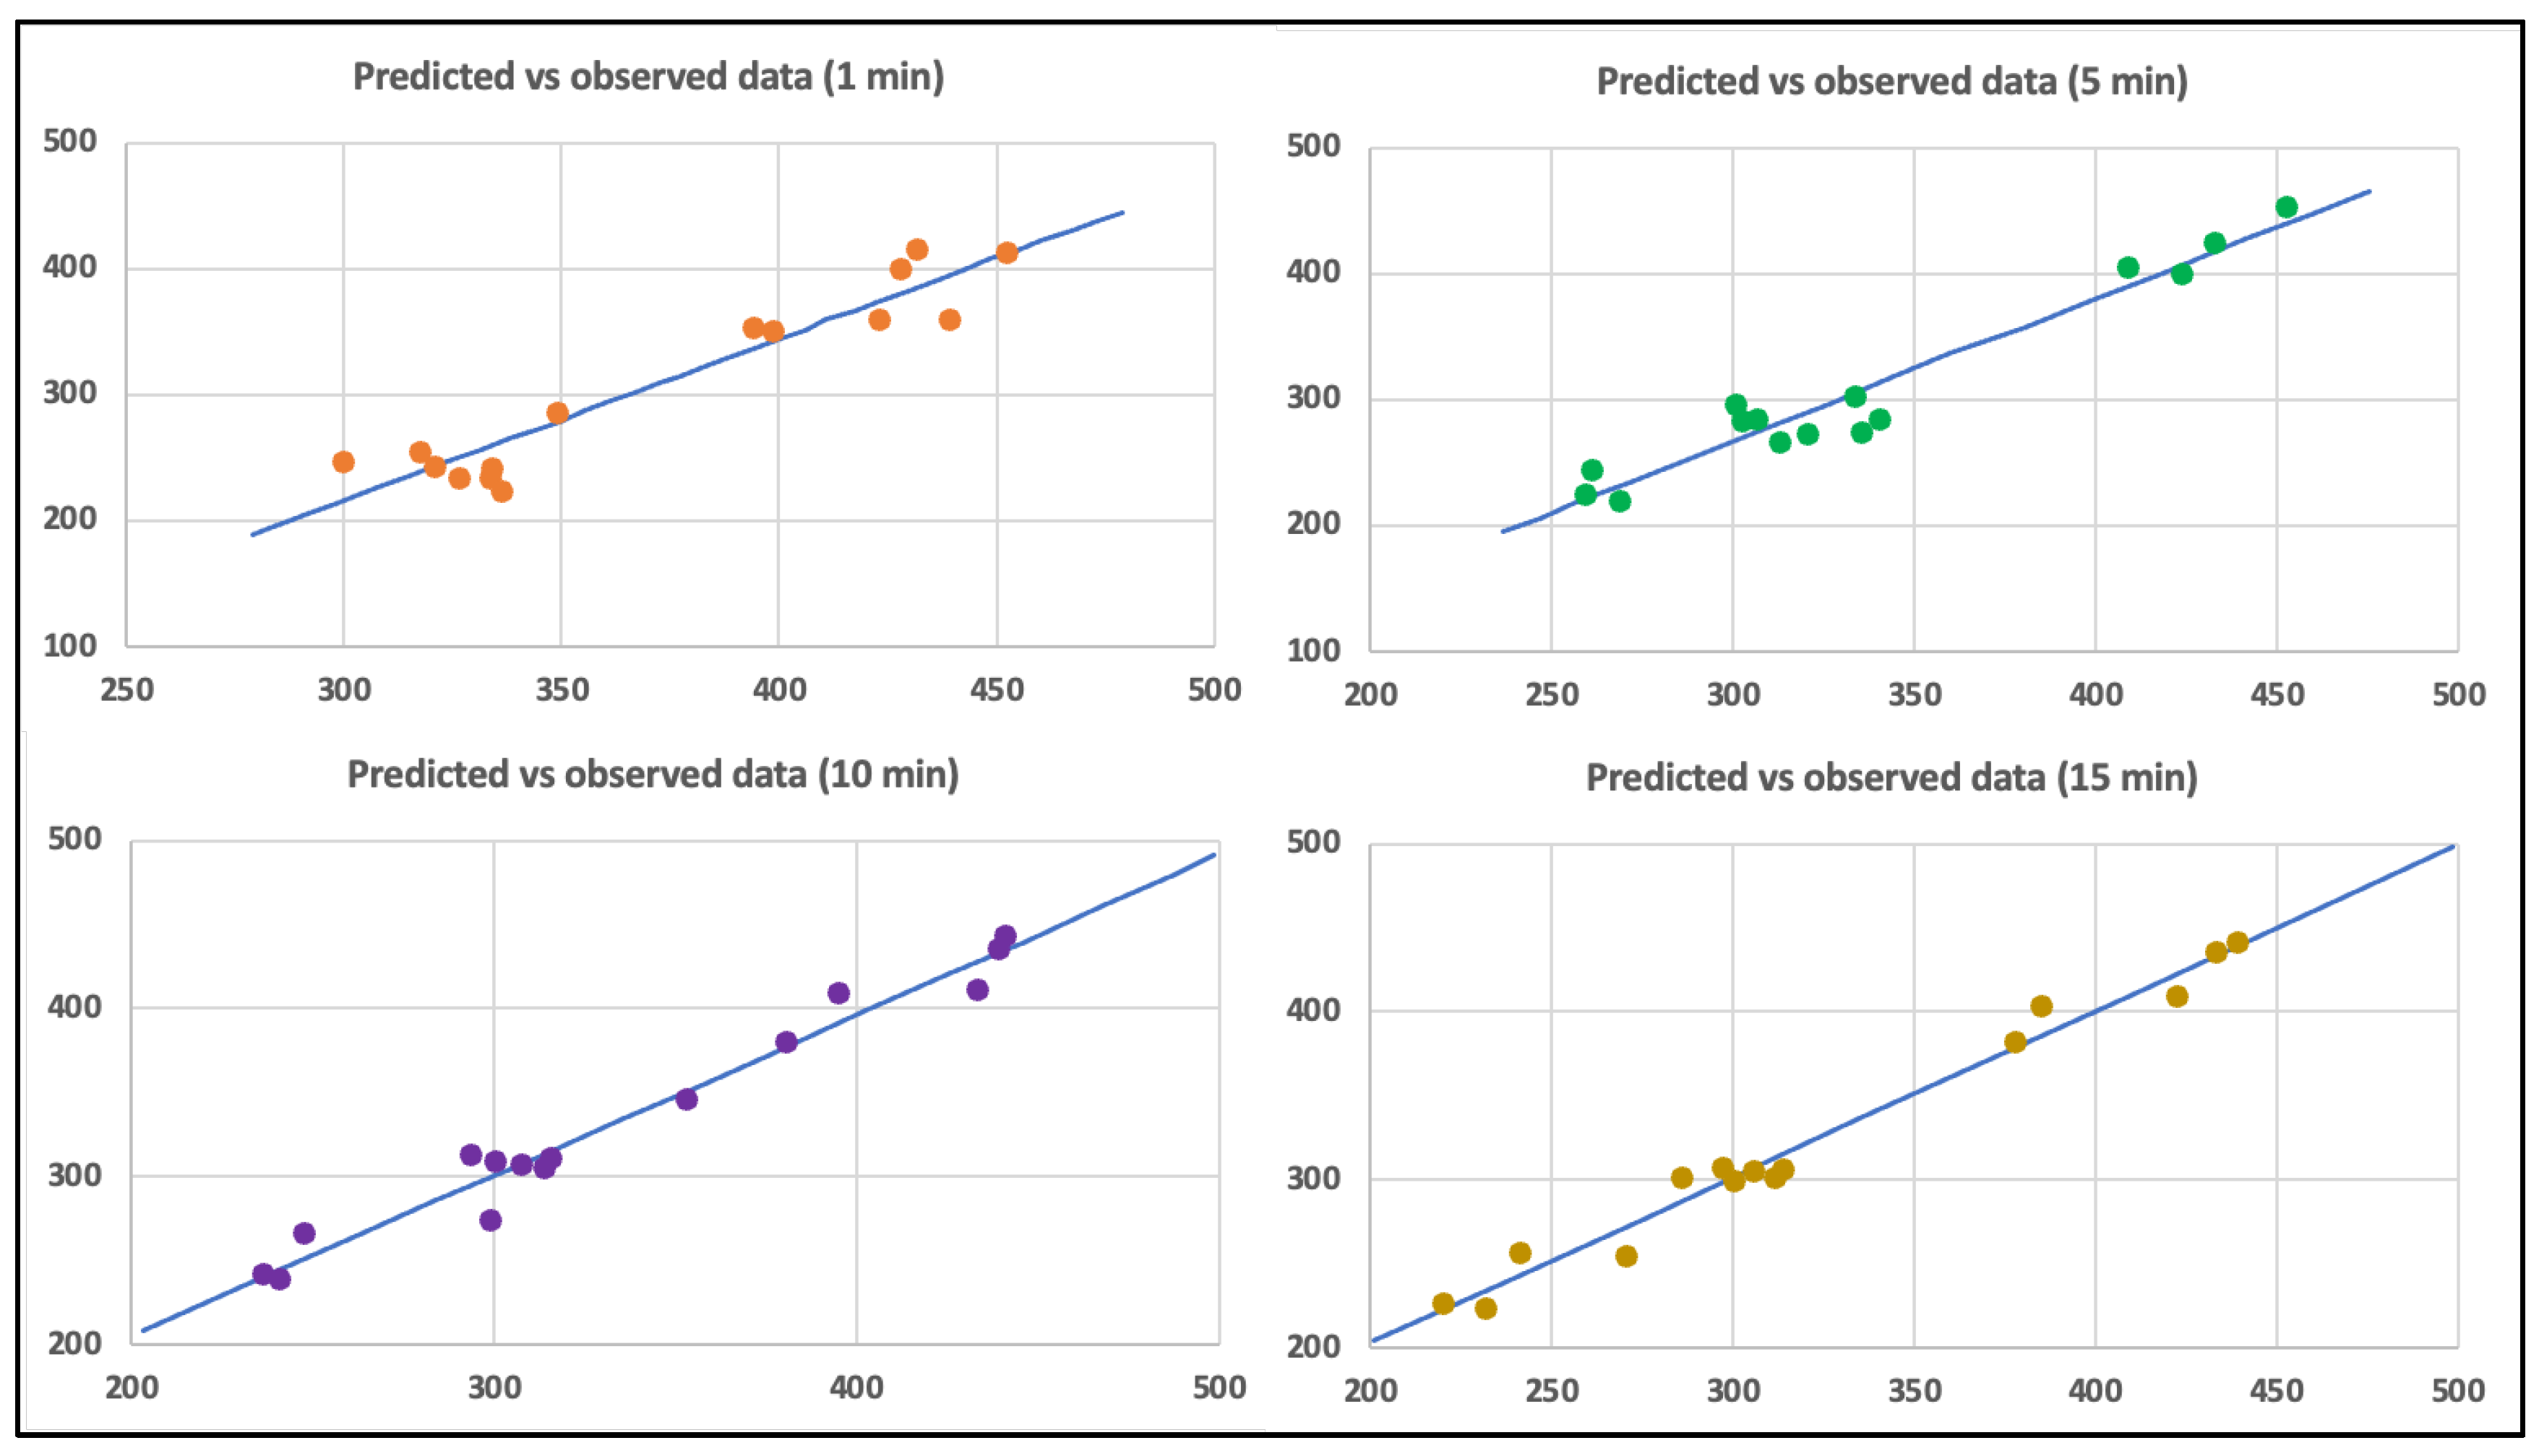
Validation of the statistical analysis is shown in Figure 8, which shows the relationship between the observed and predicted data for the millivolt production, demonstrating a good reproduction of the experimental data in all cases. Also, the significance of each coefficient was determined using p-values for the variables A to G, corresponding to bioelectricity production after 1, 5, 10 and 15 min, respectively (Table 6).
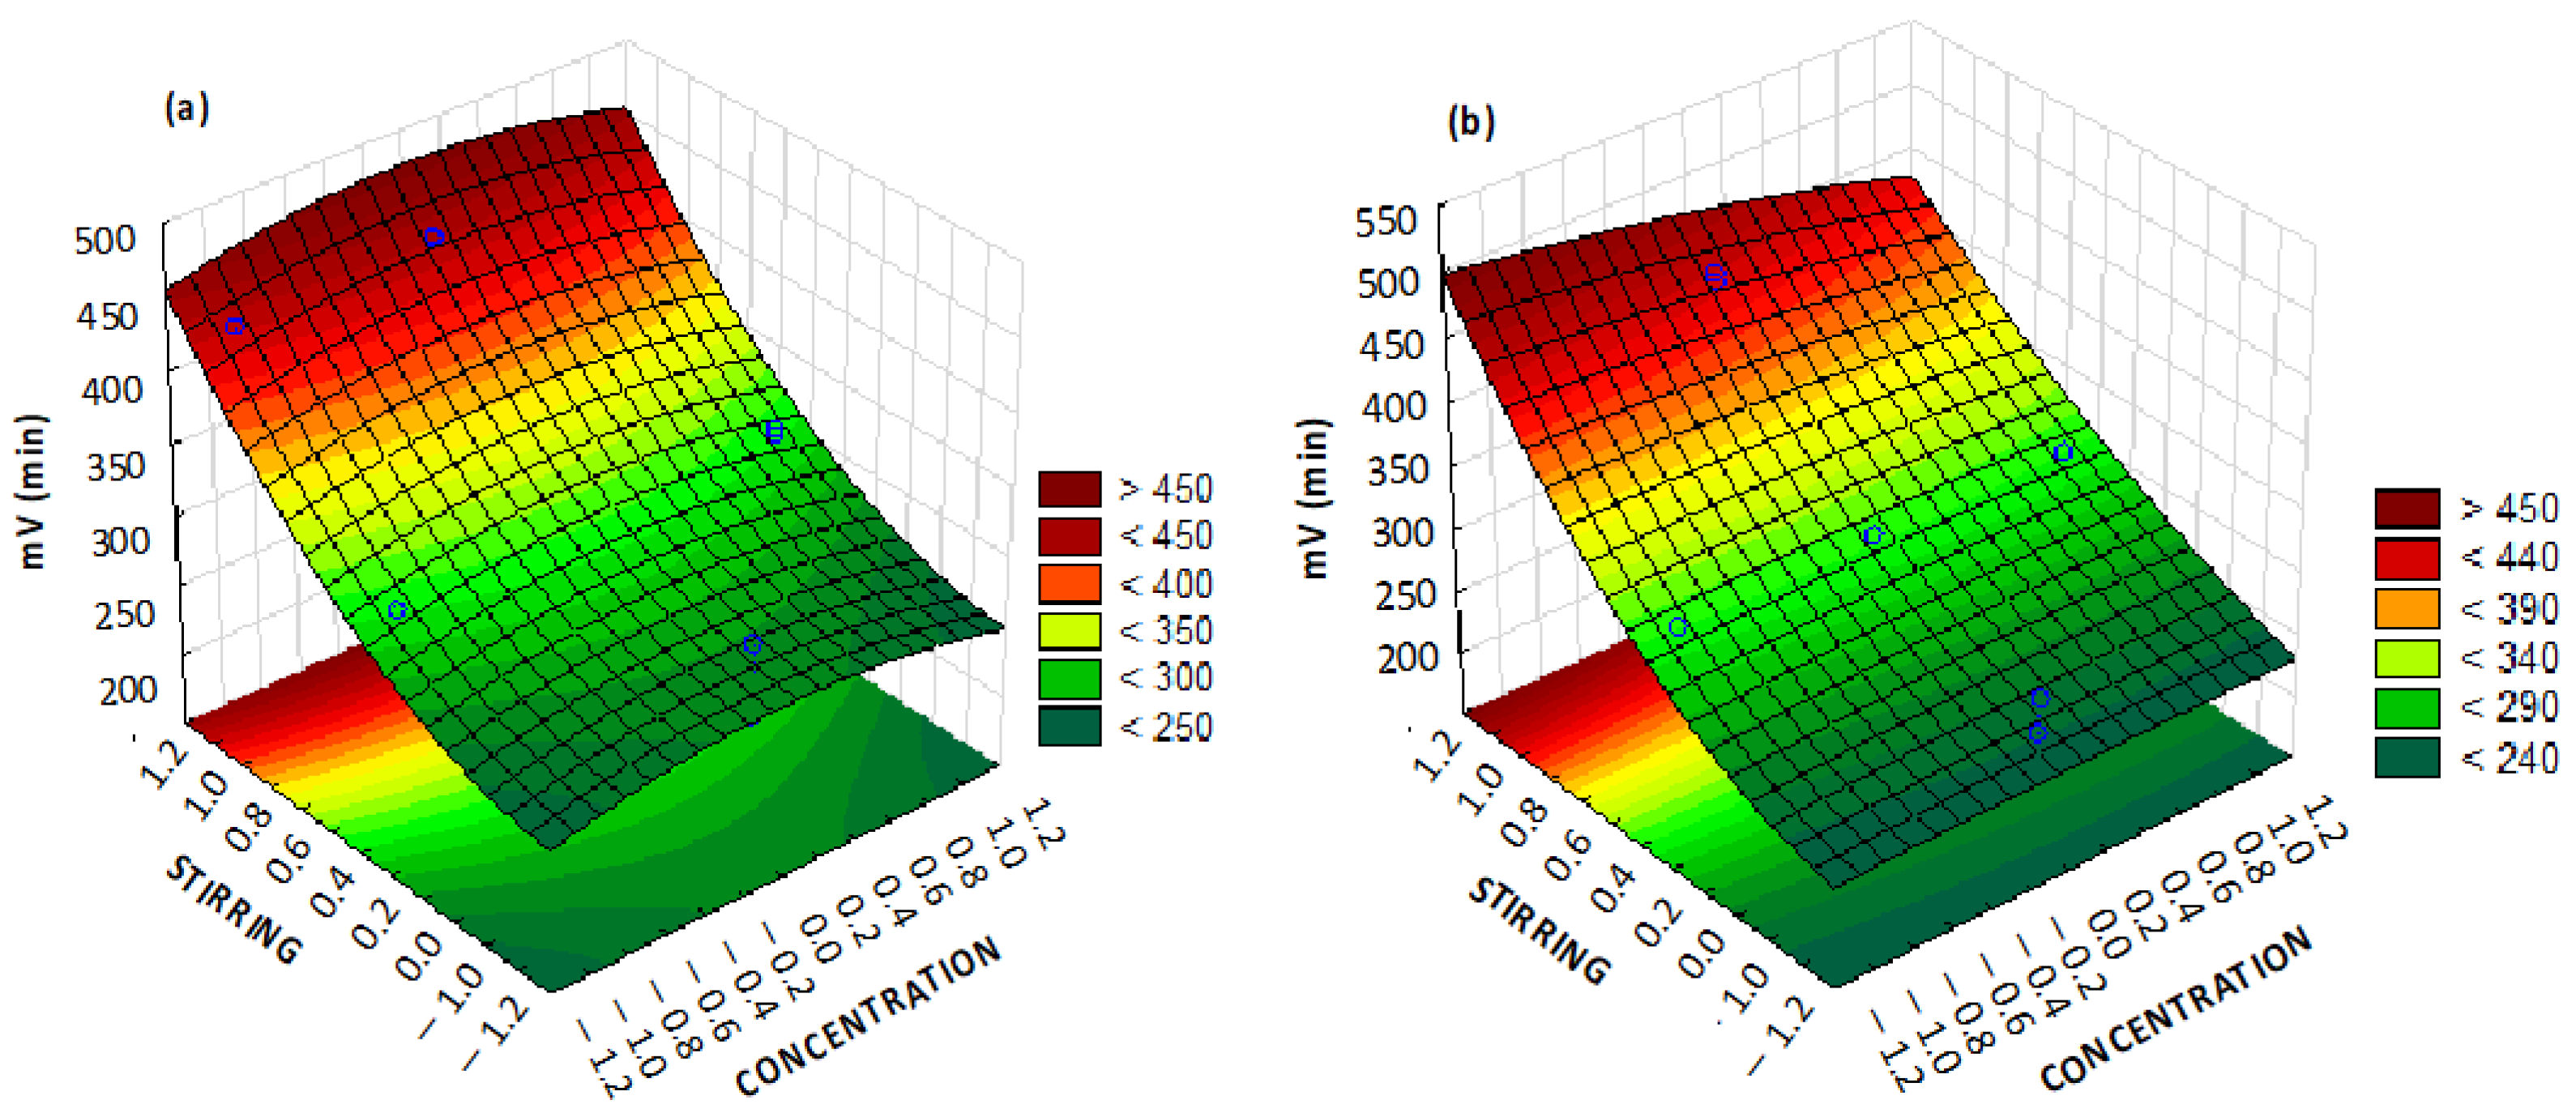
Once the main variables were determined, surface response graphs were generated to determine their magnitude. Surface response graphs play a crucial role in a Box–Behnken design, providing valuable insights into the relationship between multiple variables and the response of a system. These graphs illustrate the behavior of the response surface by depicting contours or three-dimensional plots, enabling scientists to visualize and analyze the interactions between factors within the design space. The utility of surface response graphs lies in their ability to identify optimal settings for the variables, aiding in process optimization and improving product quality. For short times, the model shows its maximum point with 8% NaCl concentration and near-maximum stirring, resulting in approximately 500 mV.
For the analysis of the ten-minute interval, stirring and concentration were used as independent axes (Figure 9a,b), as these two variables were the most important variables at larger times. From 10 to 15 min, stirring appeared as the most important factor, together with the vinasse concentration. When interpreted together with the Pareto diagram, as more time elapsed, stirring became a more influential factor than NaCl addition. With stirring predominating, the response surfaces became less curved. Although the concentration had a greater influence, it was observed that the highest voltage was obtained at its average value (concentration 1:2), yielding approximately 460 mV, which was slightly lower than at shorter time intervals. Finally, after 15 min of the experiment, the model predicted that the target voltage of 500 mV may be obtained (Figure 7d) with maximum stirring and the minimum concentration (1:4). The selection of the minimum concentration was rationalized by the observation that heightened stirring promotes earlier attainment of homogeneity within the solution. Consequently, it is imperative to avoid a dense solution that may induce irregularities in the fluid dynamics.

4. Discussion

The Plackett–Burman and Box–Behnken designs play pivotal roles in experimental design and optimization studies, offering valuable insights into identifying the most influential variables in a system. The Plackett–Burman design efficiently screens numerous factors, aiding in narrowing down key factors that significantly impact the response of interest. By exploring a wide parameter space with minimal experimental runs, it provides valuable insights in the initial stages of research, enhancing our understanding of the system’s behavior.
In contrast, the Box–Behnken design allows for a thorough examination of the response surface, considering both main effects and second-order interactions. This design facilitates the construction of response surface models and process parameter optimization, enabling us to understand complex interactions between multiple variables [22]. It provides valuable information on the curvature, optimal factor levels, and regions of maximum or minimum response, contributing to process optimization, quality improvement and efficient resource allocation [23].
In our study, we employed both the Plackett–Burman and Box–Behnken designs to identify the most influential variables in a microbial fuel cell (MFC) for maximizing its performance and efficiency. Through systematic optimization, we enhanced the power output, increased the conversion efficiency and improved the overall MFC performance. Our findings align with previous research that highlighted the crucial role of these designs in narrowing down critical variables and developing robust models for process optimization.
Among the variables analyzed, the composition of vinasse emerged as a crucial factor in the MFC performance. Excessive microorganism growth during treatment can lead to a decline in MFC activity. To mitigate this issue, previous studies suggested various strategies, such as the addition of a polymer to increase the viscosity [24] or utilizing porous solids to prevent electrolyte sedimentation [25,26,27]. Also, having an electrolyte that may sediment necessitates continuous stirring, which affects MFC yield. Furthermore, the effect of flow velocity on bioelectricity generation should also be considered [28]. These approaches help maintain stable MFC operation and enhance the yield. However, electricity production using MFCs remains a substantial problem for practical implementations owing to the difficulty in balancing the yield with overall system upscaling [29].
Temperature also emerged as a significant factor that affected the MFC energy production. High temperatures were found to negatively impact the MFC performance due to excessive microorganism growth. To optimize the energy production, maintaining MFCs at values close to room temperature was recommended in previous studies [30,31]. Room temperature offers advantages, such as power savings, low solid production and higher treatment efficiency, contributing to sustainable MFC operation [32]. Similarly, Cano et al. [33] found additional implications regarding temperature, as wastewater treated at high values may require a cooling step prior to discharge to avoid negative effects on the natural system.
In contrast, the salt concentration showed the least influence on the MFC process. Surprisingly, experiment 2 conducted with 2% of salt exhibited the highest millivolt values when combined with maximum stirring and medium vinasse dose. Additionally, experiment 4 conducted with the maximum salt concentration, medium vinasse dose and the lowest stirring yielded values comparable to experiment 2. These findings suggest the possibility of expanding MFC applications to saline wastewater without adversely affecting MFC yield. Vijay et al. [33] analyzed saline environments as critical issues to be addressed due to the presence of halophilic bacteria, which alter the composition of the medium and could impact the electrochemical activity. This is an important finding, as yeast presents a higher ability to grow in harsh environments compared with most bacteria [34].
The results highlighted the significance of variables such as the vinasse composition, temperature and salt concentration in influencing MFC operation. Furthermore, by incorporating theoretical frameworks and empirical findings, we advanced our understanding of complex interactions within the MFC system. The use of MFC for wastewater treatment is an area of great potential, which has demonstrated its ability to treat a wide range of contaminants, such as drugs [35], organic removal [36], dyes [37], or contribute to desalination [38] and bioelectricity generation [39,40,41]. These insights not only contribute to the development of sustainable energy technologies but also pave the way for further research on optimizing MFC operation, improving waste treatment processes, and exploring the potential synergies between waste valorization and renewable energy generation.
5. Conclusions

This study highlighted the effects that vinasse concentration, stirring and sodium chloride have on bioelectricity production. Analyses were carried out in a single-chamber microbial fuel cell (MFC) and the screening carried out with Plackett–Burman discarded the effect of the other variables tested, namely, pH, temperature, yeast dose and electrode:solution ratio. Building upon the insights from the Plackett–Burman analysis, the study adopted the Box–Behnken design to explore the upper limits of bioelectricity generation achievable with the three most influential variables: vinasse concentration, stirring and NaCl. The predictive model pointed toward the attainment of 431.1 mV by synergizing an intermediate vinasse concentration (1:3 v/v ratio), stirring and 2% NaCl concentration within the initial 15 min of experimentation. Notably, rapid bioelectricity assessment within the first minute unveiled a potential of up to 437.9 mV, which underscored the importance of yeast and NaCl doses, particularly within brief intervals. These findings illuminate pathways toward more efficient and sustainable energy generation, contributing to the evolving landscape of bioelectrochemical systems.

Author Contributions

Methodology, R.D.-R. and A.S.-G.; investigation, A.C.; writing—original draft preparation, R.D.-R.; writing—review and editing, A.S.-G., E.A. and R.D.-R.; project administration, R.D.-R. and A.S.-G.; funding acquisition, R.D.-R. and A.S.-G. All authors have read and agreed to the published version of the manuscript.

Funding

The authors thank the Defense University Center at the Spanish Naval Academy (CUD-ENM) for all the support provided for this research (Project PICUD-2022-02).

Data Availability Statement

The datasets used and/or analysed during the current study are available from the corresponding author on reasonable request.

Conflicts of Interest

The authors declare no conflict of interest. The funders had no role in the design of the study; in the collection, analyses, or interpretation of data; in the writing of the manuscript; or in the decision to publish the results.

References

  1. Otto, M. Chemometrics. In Statistics and Computer Applications in Analytical Chemistry, 3rd ed.; Wiley-VCH: Weinheim, Germany, 2017; ISBN 978-3-527-34097-2. [Google Scholar]
  2. Isam, M.; Baloo, L.; Kutty, S.R.M.; Yavari, S. Optimisation and modelling of Pb(II) and Cu(II) biosorption onto red algae (Gracilaria changii) by using response surface methodology. Water 2019, 11, 2325. [Google Scholar] [CrossRef]
  3. Devesa-Rey, R.; Vecino, X.; Varela-Alende, J.L.; Barral, M.T.; Cruz, J.M.; Moldes, A.B. Valorization of winery waste vs. the costs of not recycling. Waste Manag. 2011, 31, 2327–2335. [Google Scholar] [CrossRef] [PubMed]
  4. Santos, J.R.F.; Rodrigues, R.P.; Quina, M.J.; Gando-Ferreira, L.M. Recovery of Value-Added Compounds from Winery Wastewater: A Review and Bibliometric Analysis. Water 2023, 15, 1110. [Google Scholar] [CrossRef]
  5. Vecino, X.; Devesa-Rey, R.; Moldes, A.B.; Cruz, J.M. Optimization of batch operating conditions for the decolourization of vinasses using surface response methodology. Microchem. J. 2012, 102, 83–90. [Google Scholar] [CrossRef]
  6. Paradelo, R.; Villada, A.; Devesa-Rey, R.; Moldes, A.B.; Domínguez, M.; Patiño, J.; Barral, M.T. Distribution and availability of trace elements in municipal solid waste composts. J. Environ. Monit. 2011, 13, 201–211. [Google Scholar] [CrossRef]
  7. Devesa, R.; Moldes, A.B.; Díaz-Fierros, F.; Barral, M.T. Extraction study of algal pigments in river bed sediments by applying factorial designs. Talanta 2007, 72, 1546–1551. [Google Scholar] [CrossRef]
  8. Salgado, J.; Rodríguez, N.; Cortés, S.; Domínguez, J.M. Development of Cost-Effective Media to Increase the Economic Potential for Larger-Scale Bioproduction of Natural Food Additives by Lactobacillus rhamnosus, Debaryomyces hansenii, and Aspergillus niger. J. Agric. Food Chem. 2009, 57, 10414–10428. [Google Scholar] [CrossRef]
  9. Paradelo, R.; Moldes, A.B.; Barral, M.T. Treatment of red wine vinasses with non-conventional substrates for removing coloured compounds. Water Sci. Technol. 2009, 59, 1585–1592. [Google Scholar] [CrossRef]
  10. Russo, P.; Berbegal, C.; De Ceglie, C.; Grieco, F.; Spano, G.; Capozzi, V. Pesticide residues and stuck fermentation in wine: New evidences indicate the urgent need of tailored regulations. Fermentation 2019, 5, 23. [Google Scholar] [CrossRef]
  11. Schediwy, M.; Mevissen, M.; Demuth, D.; Kupper, J.; Nägeli, H. New causes of animal poisoining in Switzerland [Neue ursachen von tiervergiftungen in der Schweiz]. Schweiz Arch Tierheilkd 2015, 157, 147–152. [Google Scholar] [CrossRef]
  12. Sciarria, T.P.; Merlino, G.; Scaglia, B.; D’Epifanio, A.; Mecheri, B.; Borin, S.; Licoccia, S.; Adani, F. Electricity generation using white and red wine lees in air cathode microbial fuel cells. J. Power Sources 2015, 274, 393–399. [Google Scholar] [CrossRef]
  13. Penteado, E.D.; Fernandez-Marchante, C.M.; Zaiat, M.; Gonzalez, E.R.; Rodrigo, M.A. Optimization of the performance of a microbial fuel cell using the ratio electrode-surface area / anode-compartment volume. Braz. J. Chem. Eng. 2018, 35, 141–146. [Google Scholar] [CrossRef]
  14. Ottoni, C.A.; Simões, M.F.; Santos, J.G.; Peixoto, L.; Martins, C.R.; Silva, B.P.; Neto, A.O.; Brito, A.G.; Maiorano, A.E. Application of microbial fuel cell technology for vinasse treatment and bioelectricity generation. Biotechnol. Lett. 2019, 41, 107–114. [Google Scholar] [CrossRef] [PubMed]
  15. Penteado, E.D.; Fernandez-Marchante, C.M.; Zaiat, M.; Cañizares, P.; Gonzalez, E.R.; Rodrigo, M.A. Influence of sludge age on the performance of MFC treating winery wastewater. Chemosphere 2016, 151, 163–170. [Google Scholar] [CrossRef] [PubMed]
  16. Liu, T.; Nadaraja, A.V.; Shi, J.; Roberts, D.J. Stable Performance of Microbial Fuel Cell Technology Treating Winery Wastewater Irrespective of Seasonal Variations. J. Environ. Eng. 2021, 147, e0001921. [Google Scholar] [CrossRef]
  17. Plackett, R.L.; Burman, J.P. The design of optimum multifactorial experiments. Biometrika 1946, 33, 305–325. [Google Scholar] [CrossRef]
  18. Devesa-Rey, R.; González-Aller, J.D.; Urréjola, S. Analysis of biomaterials as green coagulants to control suspended solids for surface water treatment. Int. J. Environ. Res. Public Health 2020, 17, 1777. [Google Scholar] [CrossRef]
  19. Box, G.E.P.; Behnken, D.W. Simplex-sum designs—A class of 2nd order rotatable designs derivable of those of 1st order. Ann. Math. Stat. 1960, 31, 838–864. [Google Scholar] [CrossRef]
  20. Ferreira, S.; Ferreira, H.S.; Matos, G.D.; David, J.D.; Brandao, G.C. Box-Behnken design: An alternative for the optimization of analytical methods. Anal. Chim. Acta 2007, 597, 179–186. [Google Scholar] [CrossRef]
  21. Yateh, M.; Lartey-Young, G.; Li, F.; Li, M.; Tang, Y. Application of Response Surface Methodology to Optimize Coagulation Treatment Process of Urban Drinking Water Using Polyaluminium Chloride. Water 2023, 15, 853. [Google Scholar] [CrossRef]
  22. Vecino, X.; Devesa-Rey, R.; Cruz, J.M.; Moldes, A.B. Entrapped peat in alginate beads as green adsorbent for the elimination of dye compounds from vinasses. Water Air Soil Pollut. 2013, 224, 1448. [Google Scholar] [CrossRef]
  23. Vecino, X.; Devesa-Rey, R.; Cruz, J.M.; Moldes, A.B. Study of the physical properties of calcium alginate hydrogel beads containing vineyard pruning waste for dye removal. Carbohyd. Polym. 2015, 115, 129–138. [Google Scholar] [CrossRef]
  24. Luo, S.; Wang, Y.; Pan, W.; Zhao, X.; Wah Leong, K.; Leung, D.Y.C. A breakthrough in the performance and fuel utilization of methanol microfluidic fuel cell via viscous co-flow electrolyte. Energy Convers. Manag. 2023, 290, 117201. [Google Scholar] [CrossRef]
  25. Rethinasabapathy, M.; Lee, J.H.; Roh, K.C.; Kang, S.-M.; Oh, S.Y.; Park, B.; Lee, G.-W.; Cha, Y.L.; Huh, Y.S. Silver grass-derived activated carbon with coexisting micro-, meso- and macropores as excellent bioanodes for microbial colonization and power generation in sustainable microbial fuel cells. Bioresour. Technol. 2020, 300, 122646. [Google Scholar] [CrossRef] [PubMed]
  26. Li, H.; Zhang, L.; Wang, R.; Sun, J.; Qiu, Y.; Liu, S. 3D hierarchical porous carbon foams as high-performance free-standing anodes for microbial fuel cells. EcoMat 2023, 5, e12273. [Google Scholar] [CrossRef]
  27. Sun, J.; Wang, R.; Li, H.; Zhang, L.; Liu, S. Boosting bioelectricity generation using three-dimensional nitrogen-doped macroporous carbons as freestanding anode. Mater. Today Energy 2023, 33, 101273. [Google Scholar] [CrossRef]
  28. Kudier, W.N.; Atta, S.Z.; Majdi, H.S.; Hasan, B.O. Effect of Electrode Surface Enhancement on the Performance of Microbial Fuel Cell Under Flow Conditions. Egyp. J. Chem. 2022, 65, 781–789. [Google Scholar] [CrossRef]
  29. Malik, S.; Kishore, S.; Dhasmana, A.; Kumari, P.; Mitra, T.; Chaudhary, V.; Kumari, R.; Bora, J.; Ranjan, A.; Minkina, T.; et al. A Perspective Review on Microbial Fuel Cells in Treatment and Product Recovery from Wastewater. Water 2023, 15, 316. [Google Scholar] [CrossRef]
  30. Cano, V.; Cano, J.; Nunes, S.C.; Nolasco, M.A. Electricity generation influenced by nitrogen transformations in a microbial fuel cell: Assessment of temperature and external resistance. Renew. Sustain. Energy Rev. 2021, 139, 110590. [Google Scholar] [CrossRef]
  31. Silva-Palacios, F.; Salvador-Salinas, A.; Quezada-Alvarez, M.A.; Rodriguez-Yupanqui, M.; Segundo, R.F.; Renny, N.N.; Cabanillas-Chirinos, L. Bioelectricity generation through Microbial Fuel Cells using Serratia fonticola bacteria and Rhodotorula glutinis yeast. Energy Rep. 2023, 9, 295–301. [Google Scholar] [CrossRef]
  32. Ahn, Y.; Logan, B.E. Effectiveness of domestic wastewater treatment using microbial fuel cells at ambient and mesophilic temperatures. Bioresour. Technol. 2010, 101, 469–475. [Google Scholar] [CrossRef]
  33. Vijay, A.; Ghosh, P.C.; Mukherji, S. Power Generation by Halophilic Bacteria and Assessment of the Effect of Salinity on Performance of a Denitrifying Microbial Fuel Cell. Energies 2023, 16, 877. [Google Scholar] [CrossRef]
  34. Boas, J.V.; Marcon, L.R.C.; Oliveira, V.B.; Simões, M.; Pinto, A.M.F.R. Performance evaluation of a single-chamber microbial fuel cell with Zygosaccharomyces bailii. Bioresour. Technol. Rep. 2023, 23, 101547. [Google Scholar] [CrossRef]
  35. Guo, W.; Chen, Y.; Cui, L.; Xu, N.; Wang, M.; Sun, Y.; Yan, Y. Nano-hydroxyapatite/carbon nanotube: An excellent anode modifying material for improving the power output and diclofenac sodium removal of microbial fuel cells. Bioelectrochemistry 2023, 154, 108523. [Google Scholar] [CrossRef] [PubMed]
  36. Gao, L.; Wei, D.; Ismail, S.; Wang, Z.; El-Baz, A.; Ni, S.-Q. Combination of partial nitrification and microbial fuel cell for simultaneous ammonia reduction, organic removal, and energy recovery. Bioresour. Technol. 2023, 386, 129558. [Google Scholar] [CrossRef]
  37. Sharma, K.; Pandit, S.; Mathuriya, A.S.; Gupta, P.K.; Pant, K.; Jadhav, D.A. Microbial Electrochemical Treatment of Methyl Red Dye Degradation Using Co-Culture Method. Water 2023, 15, 56. [Google Scholar] [CrossRef]
  38. Sibi, R.; Sheelam, A.; Gunaseelan, K.; Jadhav, D.A.; Gangadharan, P. Osmotic microbial fuel cell for sustainable wastewater treatment along with desalination, bio-energy and resource recovery: A critical review. Bioresour. Technol. Rep. 2023, 23, 101540. [Google Scholar] [CrossRef]
  39. Zhang, H.; Hou, D.; Zhang, S.; Cao, X.; Wang, H.; Li, X. Aerobic denitrification is enhanced using biocathode of SMFC in low-organic matter wastewater. Water 2021, 13, 3512. [Google Scholar] [CrossRef]
  40. Samudro, G.; Imai, T.; Hung, Y.-T. Enhancement of power generation and organic removal in double anode chamber designed dual-chamber microbial fuel cell (Dac-dcmfc). Water 2021, 13, 2941. [Google Scholar] [CrossRef]
  41. Mao, Y.; Zhao, Y.; Cotterill, S. Examining Current and Future Applications of Electrocoagulation in Wastewater Treatment. Water 2023, 15, 1455. [Google Scholar] [CrossRef]
Figure 1. Scheme of the cell used in this study, using copper and zinc as cathode and anode and stillage as electrolyte. The data was collected continuously via programming with Arduino.
Water 15 03051 g001
Figure 2. Scheme of the cell used in this study, using copper and zinc as the cathode and anode, respectively, and stillage as the electrolyte. The data was collected continuously via programming with Arduino.
Water 15 03051 g002
Figure 3. (a) Box–Behnken assigns maximum, mean, and minimum values to independent variables to create a space that allows for inferring responses of the dependent variables; (b) results obtained allow for interpreting the conditions to maximize or minimize the response desired.
Water 15 03051 g003
Figure 4. Voltage decline over time for experiment 2.
Water 15 03051 g004
Figure 5. Pareto charts for Plackett–Burman screening, depicting the frequency distribution of the data presented for four time points: 1 min, 5 min, 10 min and 15 min. Red line indicates the significant variables at a 0.05 level.
Water 15 03051 g005
Figure 6. Validation graphs showing predicted vs. observed values for Plackett–Burman screening at 1, 5, 10 and 15 min.
Water 15 03051 g006
Figure 7. Pareto charts for Box–Behnken design, depicting the frequency distribution of the data are presented at four time points: 1 min, 5 min, 10 min and 15 min. Red line indicates the significant variables at a 0.05 level.
Water 15 03051 g007
Figure 8. Validation graphs showing predicted vs. observed values for Box–Behnken design at 1, 5, 10 and 15 min.
Water 15 03051 g008
Figure 9. Surface response obtained, which depicts the influence of concentration and stirring on the millivolts production, with NaCl at its middle value: (a) 10 min and (b) 15 min.
Water 15 03051 g009
Table 1. Placket–Burman design including seven variables and minimum (−1) and maximum (+1) coded values assayed for each.
ABCDEFG
1−11−11−11−1
31−11−1−11−1
2−1111−1−11
5−1−1−111−11
4−11−1−1111
71−1−1111−1
8111−11−11
61−11−1−11−1
Notes: A (concentration); B (pH); C (temperature); D (stirring); E ([NaCl]); F ([yeast]); G (electrode:solution ratio).
Table 2. Box–Behnken design including three variables (A: concentration, D: stirring and E: [NaCl]) and minimum (−1), medium (0) and maximum (+1) coded values assayed for each.
123456789101112131415
A0000−1−111−1−111000
D−11−11−11−110000000
E−1−1110000−11−11000
Table 3. Values in mV obtained for Placket–Burman experiments. Results are expressed as mean values ± coefficient of variation (%).
Exp 1Exp 2Exp 3Exp 4Exp 5Exp 6Exp 7Exp 8
1 min280.1 ± 3.4265.6 ± 3.5150.0 ± 6.0291.3 ± 3.2132.4 ± 3.7195.0 ± 13.5127.6 ± 3.5403.4 ± 5.1
5 min293.6 ± 3.8231.2 ± 11.2129.5 ± 11.6269.1 ± 5.3123.6 ± 5.1193.5 ± 6.4124.9 ± 4.3363.3 ± 7.0
10 min301.9 ± 3.9188.1 ± 27.1119.8 ± 12.9264.3 ± 4.4121.3 ± 4.7188.2 ± 5.8116.1 ± 9.1349.6 ± 6.6
15 min306.9 ± 4.1158.6 ± 37.8113.0 ± 14.3272.6 ± 6.7117.7 ± 6.1183.2 ± 6.5108.4 ± 13.4337.1 ± 7.8
Table 4. Regression coefficients and their statistical significance for variables y1 (1 min), y2 (5 min), y3 (10 min) and y4 (15 min) for the Plackett-Burman screening. Significant coefficients at a p < 0.05 level are marked with an asterisk.
y1py1y2py2y3py3y4py4
(A) Concentration26,584.720.0010 *19,013.480.0013 *14,080.100.023 *11,791.100.019 *
(B) pH1031.260.25260.490.18304.550.39507.050.22
(C) Temperature2374.640.0821628.210.0911195.120.121315.590.098
(D) Stirring18,003.480.028 *16,973.030.022 *22,115.150.010 *27,449.420.012 *
(E) [NaCl]7574.960.0676531.670.0558889.910.039 *9944.030.035 *
(F) [Yeast]13,489.850.043 *10,862.640.039 *8615.910.042 *6328.690.067
(G) Electrode:solution ratio362.210.09355.810.11874.760.0882445.450.14
Table 5. Values in mV obtained for Box–Behnken experiments. Results are expressed as mean values ± coefficient of variation (%).
Exp 1Exp 2Exp 3Exp 4Exp 5Exp 6Exp 7Exp 8
1 min222.8 ± 14.1422.5 ± 1.5392.3 ± 15.8311.7 ± 42.2437.9 ± 20.9424.9 ± 1.5397.6 ± 30.8430.6 ± 1.5
5 min197.3 ± 10.9432.3 ± 2.5260.9 ± 33.4384.6 ± 24.5289.6 ± 35.6425.3 ± 1.6252.3 ± 41.2412.5 ± 3.1
10 min194.3 + 8.5433.6 ± 2.1208.1 ± 33.6411.8 ± 16.2235.7 ± 33.7422.6 ± 1.6213.0 ± 34.2394.4 ± 4.5
15 min189.3 ± 8.2435.8 ± 1.9193.1 ± 31.4414.2 ± 13.3219.1 ± 31.3421.9 ± 1.5204.2 ± 29.6384.3 ± 5.4
Exp 9Exp 10Exp 11Exp 12Exp 13Exp 14Exp 15
1 min373.5 ± 1.7430.6 ± 1.5430.6 ± 1.5430.6 ± 1.5430.6 ± 1.5430.6 ± 1.5430.6 ± 1.5
5 min371.0 ± 1.5412.5 ± 3.1412.5 ± 3.1412.5 ± 13.0412.5 ± 3.1412.5 ± 3.1412.5 ± 3.1
10 min365.0 ± 1.8394.4 ± 4.5394.4 ± 4.5394.4 ± 4.5394.4 ± 4.5394.4 ± 4.5394.4 ± 4.5
15 min361.2 ± 2.2384.3 ± 5.4384.3 ± 5.4384.3 ± 5.4384.3 ± 5.4384.3 ± 5.4384.3 ± 5.4
Table 6. Regression coefficients and their statistical significance for variables y1 (1 min), y2 (5 min), y3 (10 min) and y4 (15 min) for the Box–Behnken design. Significant coefficients at a p < 0.05 level are marked with an asterisk.
y1py1y2py2y3py3y4py4
(1) Concentration (L)65.200.3234.370.9358.710.6278.450.37
Concentration (Q)1773.70 *0.021 *884.270.29957.210.321134.11 *0.049 *
(2) Stirring (L)2968.75 *0.013 *40,481.10 *0.011 *25,412.300.0012 *57,912.47 *0.0010 *
Stirring (Q)20,390.21 *0.0019 *5451.500.0711873.210.043 *2561.06 *0.023 *
(3) NaCl (L)929.29 *0.039 *469.000.41375.610.42114.720.30
NaCl (Q)807.67 *0.044 *863.720.29792.430.31711.000.075
1L by 2L529.000.0669.890.89492.410.096582.980.089
1L by 2Q576.810.061501.490.40375.860.32198.000.21
1Q by 2L4216.83 *0.0090 *29.720.8275.920.784.550.81
1L by 3L231.190.134154.380.61352.860.7647.540.47
1Q by 3L2778.11 *0.014 *1062.600.26501.250.19402.000.12
2L by 3L1891.82 *0.020 *871.800.32252.980.18119.860.16
Disclaimer/Publisher’s Note: The statements, opinions and data contained in all publications are solely those of the individual author(s) and contributor(s) and not of MDPI and/or the editor(s). MDPI and/or the editor(s) disclaim responsibility for any injury to people or property resulting from any ideas, methods, instructions or products referred to in the content.