Article

A New Acidity-Based Approach for Estimating Total Dissolved Solids in Acidic Mining Influenced Water

by
Ana Barroso
1,
Teresa Valente
1,*,
Amélia Paula Marinho Reis
1,2 and
Isabel Margarida H. R. Antunes
1
1
ICT—Institute of Earth Sciences, University of Minho, 4710-057 Braga, Portugal
2
GeoBioSciences, GeoEngineering and GeoTechnologies, University of Aveiro, Campus Universitário de Santiago, 3810-193 Aveiro, Portugal
*
Author to whom correspondence should be addressed.
Water 2023, 15(16), 2995; https://doi.org/10.3390/w15162995
Submission received: 2 July 2023 / Revised: 11 August 2023 / Accepted: 17 August 2023 / Published: 19 August 2023

Abstract

:
In natural waters, total dissolved solids (TDS) are usually estimated from electrical conductivity (EC) by applying a conversion factor (f). However, defining this conversion factor for mining influenced water is more complex since this type of water is highly mineralized and has complex chemical matrices. So, the present work aimed to establish a new conversion factor to estimate TDS from the classic parameters usually analyzed for the hydrochemical characterization of these contaminated waters. A total of 121 mining influenced water samples were collected in three mining areas representing pollution scenarios, such as acidic streams, acidic lagoons, and pit lakes. The parameters analyzed were pH, EC, sulfate, acidity, and TDS. The statistical analysis showed that TDS and acidity are related, with a high and significant correlation (r ≥ 0.964, ρ < 0.001), suggesting that this parameter could be an appropriate indicator to estimate the TDS. Moreover, although acidity analysis also involves laboratory work, the time and effort required are considerably less than the gravimetric determination of TDS. Hierarchical cluster analysis applied to these samples allowed the definition of seven classes, and their specific fmedian was calculated employing TDS/Acidity. Then, seven conversion factors were obtained for mining influenced water based on sulfate concentration and acidity degree.

1. Introduction

Water quality is defined through physical, chemical, and biological parameters. Total dissolved solids (TDS) and electrical conductivity (EC) are two of the physical parameters used in water quality characterization [1]. The TDS is defined as the total dissolved inorganic and organic matter concentration in aqueous solutions [2,3,4]. Electrical conductivity (EC) is the ability of a substance to conduct an electric current when a potential is applied between the electrodes immersed in it [5]. As each ion contributes to the electrical conductivity, these two parameters are expected to be associated with each other. Through this relation between EC and TDS, their determination is considerably distinct in terms of time and expenses. For example, EC analysis is simple, rapid, and precise. Moreover, there is portable equipment for field analysis. On the other hand, TDS, expressed in concentration units (mgL−1), is commonly determined by the gravimetric method, where an accurately measured volume of filtered sample is evaporated and dried at a specific temperature (above 105 °C, often at 180 °C) [2,6]. Consequently, this standard method is time-consuming and expensive compared to the EC analysis. So, to optimize the TDS quantification, other approaches are used, specifically, mathematical correlations between the two parameters. A linear relationship between TDS and EC is typically assumed and often described in the literature by the following formula (Equation (1)) [5,7,8,9,10]:
TDS = f × EC25
where TDS is the total dissolved solids in mgL−1, EC25 is the electrical conductivity in µScm−1 at 25 °C, and f is a conversion factor. Presently, in the equipment of most commercial brands and models, the TDS value is estimated by the former equation with a fixed conversion factor that could be selected between 0.49 and 0.70. However, several authors (e.g., [5,8]) emphasize the need for using a range of different conversion factors, especially in saline waters. Also, ref. [11] notes that the conversion factor increases with water mineralization and depends on factors such as the activity of specific dissolved ions, the average activity of all ions, and ionic strength. This author reviews the relationships obtained for different types of water, including freshwater and strongly mineralized water like brines. Several other authors conclude that the TDS-EC correlation ratio range may be highly variable for different types of natural waters [12].
Therefore, the two parameters have no simple, accepted, and precise relationship. In accordance with [8], using the conversion factor of 0.70 can lead to errors of up to 30% in TDS estimation. Furthermore, it should be noted that the EC is an indirect measurement of dissolved ions, while TDS is a direct measurement of all dissolved solids, ionic or not [13]. This is evident in the work by Atekawana et al. [9], which investigates the correlation between TDS and EC in groundwater samples collected in uncontaminated and hydrocarbon-contaminated locations (Michigan, USA). The TDS was measured by a gravimetric method in the laboratory and the field with an EC meter. The conversion factor used was 0.64, regressed from the TDS vs. EC data. The investigation also showed differences between the two methods, with gravimetric TDS generally higher than TDS estimated using electrical conductivity. For example, in uncontaminated sites, the TDS range was 50 to 560 mgL−1 for the EC-TDS meter and 65 to 550 mgL−1 for the gravimetric method. However, for the contaminated groundwater, the TDS was between 123 and 681 mgL−1 and 150 up to 810 mgL−1 for the EC-TDS meter and gravimetric technique, respectively.
In the same line of research, other authors looked for relationships between these two parameters, resulting in a diversity of possible ratios. For example, ref. [7] determined a ratio of 0.54–0.55 for mountain streams. In turn, ref. [5] defined a range of 0.55–0.75 for natural waters, depending on the major anions. This last author proposes a factor close to 0.55 in carbonate and chloride waters and near or above 0.75 for sulfate-rich waters. According to ref. [13], the TDS estimation results from the application of a factor of 0.50 for seawater (Na-Cl based) and 0.67 for surface and groundwater (carbonate- or sulfate-based, with EC < 2000 µS cm−1). On the other hand, ref. [2] established the relationship between the total dissolved ions (TDI) and EC for around 34,000 samples from rivers, streams, and dams in Queensland (Australia). For these two parameters, respectively, the median ratios obtained with different conductivity ranges were 0.59 and 0.72, showing a normal variability of 0.35 to 1.00 in the EC range of 50–1000 µS cm−1. For wastewater from a food production company, ref. [14] also investigated the relationship between the electrochemical measurement of EC and the TDS. The obtained factor varied considerably, and they only observed a strong affinity for treated samples with EC < 800 µS cm−1. The work of ref. [15], for samples of several hydraulic fracturing fluids (HFFs) from Marcellus gas wells (Pennsylvania), concludes that with an EC range of 10,000 to 75,000 µS cm−1, the TDS can be estimated from EC assuming a factor of 0.70. However, for more concentrated HFFs, a curvilinear relationship (TDS = 27,078e1.05 × 10−5 × EC. R2 = 0.99) is needed to calculate the TDS.
The literature is considerably less extensive regarding the relation of EC and TDS in mining influenced water (MIW), including highly acidic and mineralized water. For MIW [3], analyzing 45 samples showed that the conversion factor varied from 0.25 to 1.34. These authors also suggested that a common factor can result in the wrong estimation of TDS since these waters might change with local, diel, or seasonal variations. By definition, MIW can occur anywhere in the mine resulting from various water–rock interactions associated with mining and metallurgical operations [16]. Depending on such interactions, it can be acidic, circumneutral, or alkaline [17,18]. Usually, it is very heterogeneous and presents a complex matrix, which makes its characterization difficult with conventional methods [19]. Thus, estimation of TDS could be especially difficult and misleading, as EC might not result well in highly concentrated, acidic mine waters.
Different contributions of ions to EC, including the hydrogen in the acidic waters and the interaction between ions, may result in a nonlinear relationship between EC and TDS, especially in the cases of high concentrations and low pH [20,21].
The above considerations and the lack of consensus in establishing this conversion factor are the primary motivations for the present work. This will suggest another approach for TDS estimation in mining influenced water. Therefore, the present work tested acidity instead of EC for TDS estimation. Acidity, which is a chemical parameter typically used to characterize waters, generally corresponds to the sum of the carbonate species dissolved and H+. However, in MIW, acidity is defined not only by the measure of H+ protons available but also by the hydrogen ions resulting from the hydrolysis of the metals. There is enough understanding of acidity, specifically its source, control factors, and influence in the most acidic mine waters [18]. Iron, aluminum, and manganese are these contaminated waters’ major dissolved metals and the principal sources of acidity [22,23]. Therefore, acidity is an appropriate indicator to reflect the dissolved constituents in AMD. So, the main objectives of the present work are: (i) to evaluate the relationship between acidity and TDS and (ii) to replace EC and define a better approach to estimating TDS in acidic mine waters.

2. Methodology

Samples of mine-influenced waters were collected at different sites, which were selected to represent a variety of paragenetic, climate, and environmental conditions. Thus, the methodological approach was supported by a high number of samples, trying to cover the hydrochemical diversity typically observed in mine waters.

2.1. Study Areas

Mine water samples were collected in three abandoned mining areas: São Domingos, Campanario, and Valdarcas (Figure 1). São Domingos and Campanario are old Cu mines that are in the Iberian Pyrite Belt (IPB). The IPB is one of the largest metallogenic provinces in the world, with an extension from the Alentejo region (SW of Portugal) to Seville (SW of Spain) [24,25]. Composed of massive sulfide deposits (VMS) that contain pyrite, sphalerite, chalcopyrite, galena, arsenopyrite, and sulfosalts, the exploitation of metals and sulfides resulted in a highly contaminated region. In these areas, acid mine drainage (AMD) is a common, long-lasting problem [26]. São Domingos mine is in Portugal and is under environmental rehabilitation, while Campanario in Spain is still without any remediation. Valdarcas is a W mine in northern Portugal, associated with a skarn deposit. This deposit has a paragenesis of sulfides (pyrrhotite, pyrite, marcasite, and arsenopyrite), F-apatite, calcite, and calcium silicates [27,28]. The remediation project in this area was completed several years ago (2006–2007). However, the AMD problems in the watercourse that receives leachates from the waste dumps remain [29].

2.2. Water Sampling and Analysis

A total of 121 water samples from the three mining areas were used in the present work. The surface mine waters were collected in streams, acidic lagoons, and pit lakes. Sampling occurred in different periods, during the hydrological years of 2016/2017, 2018/2019, and 2020/2021.
In the São Domingos mine area, 10 water sampling points were established (Figure 1): the pit lake that resulted from the flooding of the open-cut (PAT 2); five acidic lagoons that are abandoned water dams (PAT 3-0, PAT 5, PAT 7, PAT 7 sul, PAT 9), and four points in the AMD stream that receives leachates from the mine wastes (PAT 6, PAT 9-10, PAT 10, PAT 10-11). Only these last four sites have a direct connection [30]. Six sampling points were defined at the Campanario mine (C6–C1; Figure 1), which has a geological context similar to that of the São Domingos mine. This area is characterized as a singular short channel affected by AMD (Campanario stream) from the base of the waste dumps to its confluence with an unpolluted stream [31]. The Valdarcas mine had five sampling sites, two between limestone channels close to the waste dump (V6 and V3) and the others spatially distributed along the watercourse (V4, V9, and V7; Figure 1).
Water samples were collected in plastic bottles (Kartel), previously cleaned with ultrapure water (MilliQ), and stored in cool and dark conditions (at 4 °C) until laboratory analysis. In the field, pH and EC were measured using a multi-parameter instrument—Thermo Scientific Model Orion Star A Series Portable Meter combined with a pH electrode triode (Orion 9107BNM) and conductivity cell (Orion 01310MD). The equipment was calibrated using standard solutions for pH and EC before each analysis.
Acidity, sulfate, and TDS were analyzed in the laboratory. The acidity was obtained by a titration method (Standard method 2310 B) [6], while turbidimetry was used to determine sulfate (Standard method 4500-SO42− E) [6], both within 24 h after the water sampling. In the case of the TDS, the standard method was 2540 C [6]. The samples were dried at 180 °C because this temperature yields values of TDS closer to those obtained through the sum of individual species. Using a vacuum system, each sample was filtrated onto a glass-fiber filter (Sartorius—glass microfiber discs of 47 mm diameter). The filtered solution was transferred to a dish, previously prepared, weighed, and evaporated at 180 °C. This was followed by a cycle of drying-cooling-desiccating-weighing until a constant weight was obtained (<0.5 mg of the mass change between successive measurements). Reagent-grade water (MilliQ) was used in all analytical procedures.
Regarding precision, the standard method (2540 C—Total Dissolved Solids Dried at 180 °C) refers to single-laboratory analyses of 77 samples of a known 293 mgL−1, resulting in a standard deviation of differences of 21.20 mgL−1 [6]. In the present work, the calculated TDS was the mean of three replicates, and the method showed an average relative standard deviation (RSD) of 5%. Although variable, about 80% of the samples showed an RSD of less than 7%. The water determinations were performed at the Laboratory of Water in the Department of Earth Sciences, University of Minho (Portugal).

2.3. Statistical Treatment

Univariate and bivariate statistics, boxplots, and scatterplots were examined. Histograms, Q-Q plots, and the Kolmogoro–Smirnov test were used to check whether the variables under study had a normal distribution. The results indicated the variables did not follow a normal distribution within a 95% significance level. Spearman’s rank correlation coefficients (Spearman’s rho) were calculated to identify relationships between the properties of the mine-impacted waters. A non-parametric correlation coefficient was preferred, as most variables failed the normality test. Hierarchical cluster analysis (HCA) was used to identify relatively homogeneous groups of samples based on their hydrochemical properties, namely the EC, sulfate concentration, and total acidity. In the performed HCA, the selected cluster method was Ward’s method for cluster membership. The Euclidean distance was used as the similarity measure. Overall, this approach seemed appropriate for exploring patterns in hydrochemical data. Several studies (e.g., [26,32]) available from the literature have obtained reliable results using a similar approach. Univariate and bivariate statistics, boxplots, scatterplots, the Kolmogorov–Smirnov test, and HCA analysis were performed using the IBM SPSS (v. 28) software.

3. Results and Discussion

3.1. General Properties and Relationships in Mine Water

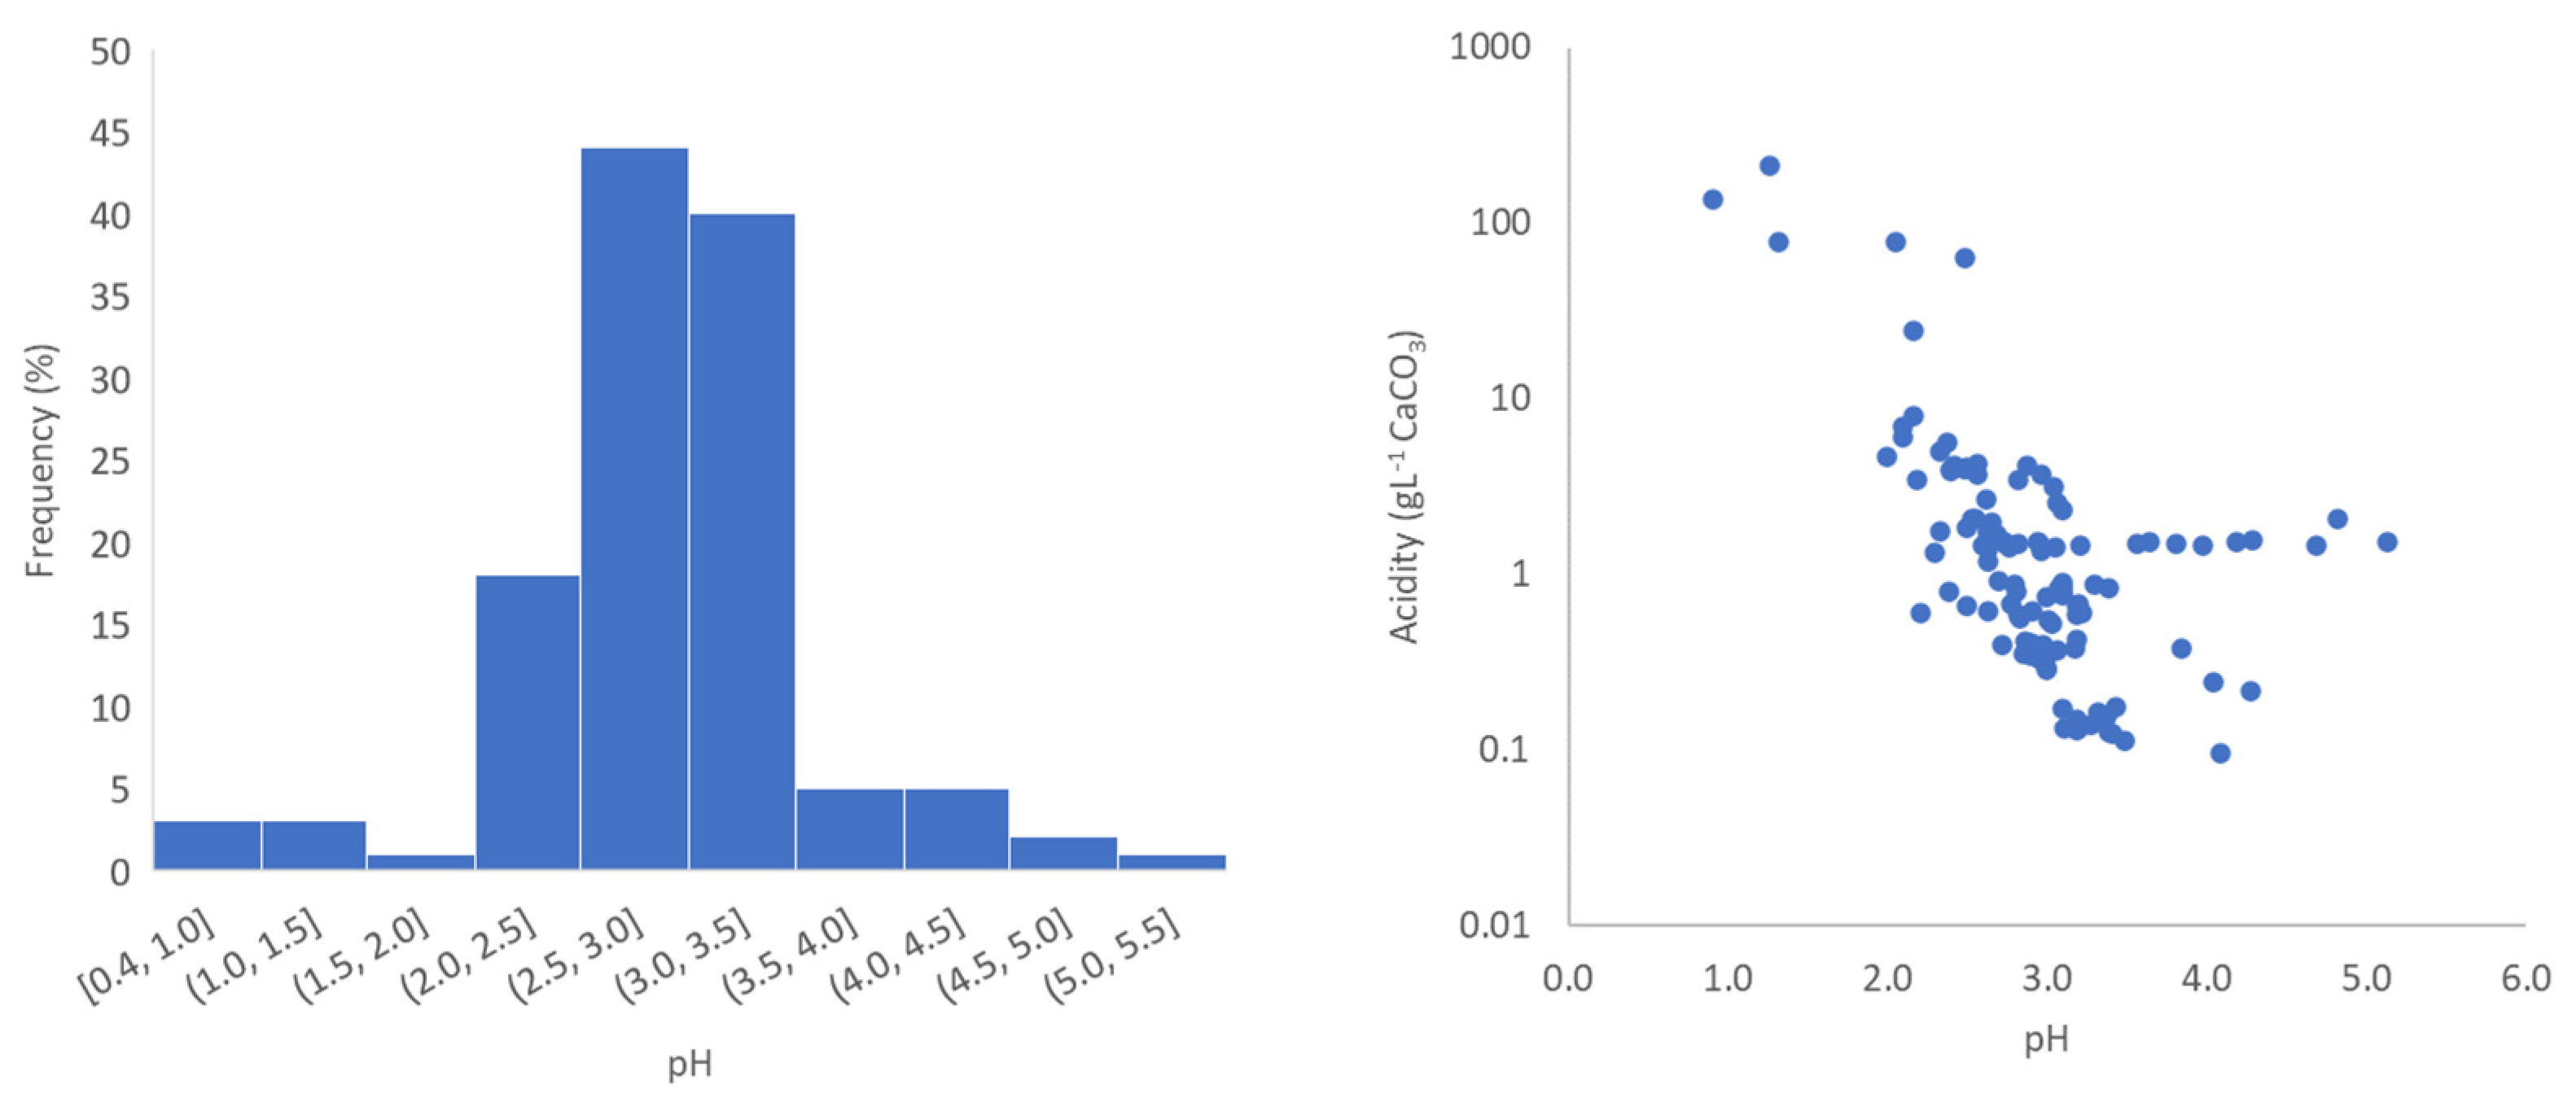
Table 1 represents the statistical summary of the 121 samples of mine-influenced waters. The pH was in the acidic range, but the samples exhibited high variability, between 0.44 and 5.00. Accordingly, all water samples presented acidity, reporting a maximum of 429.250 gL−1 CaCO3.
Most pH measurements were closer to 3.0 (2.5–3.5), but reasonable frequencies were found for lower values (Figure 2-left). The acidic nature was even more apparent when considering the high total acidity values. This last parameter provides supplemental information to pH, as it reflects the contribution of metals (mainly iron, aluminum, and manganese) to acidity [22]. Figure 2-right shows that even samples with higher pH had high acidity (>1 gL−1 CaCO3) and that in the narrow pH range of around 3.0, there was a large dispersion of acidity concentrations, varying from about 0.100 to higher than 100.000 gL−1 CaCO3.
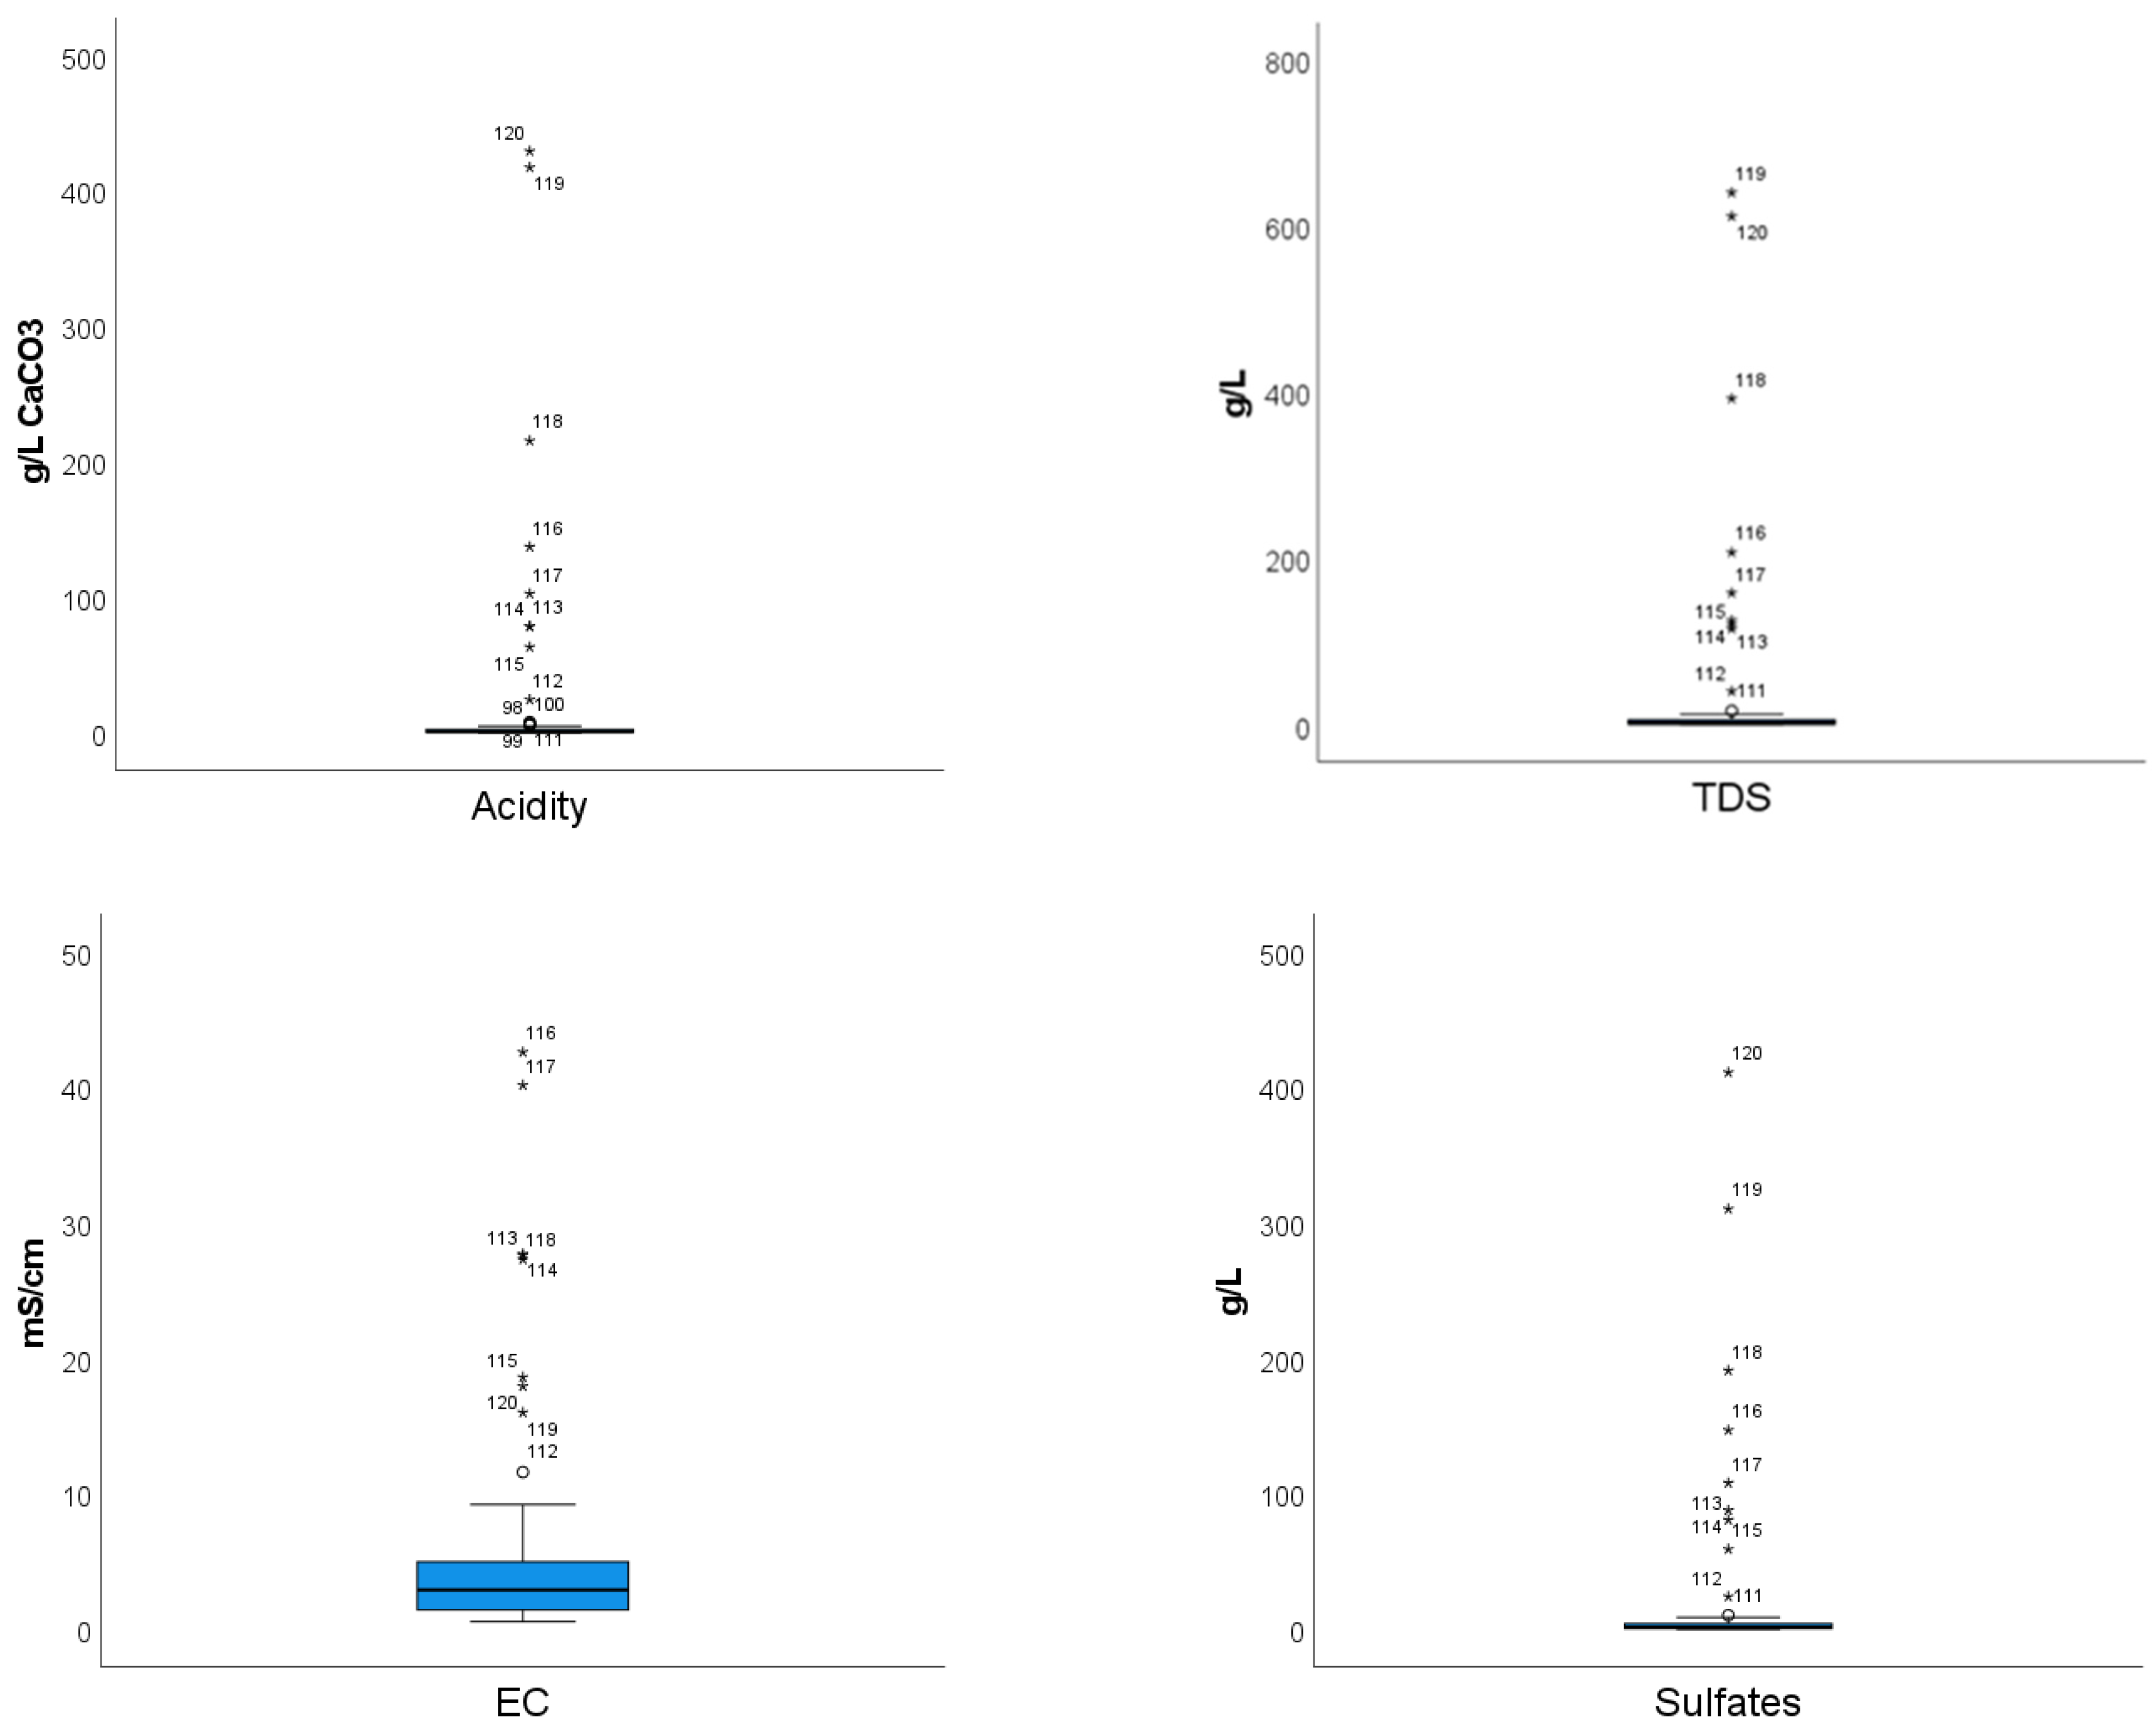
Sulfate, in the range of 0.153 to 410.601 gL−1, and EC (0.412 to 43.710 mS cm−1) emphasized the occurrence of typical scenarios of AMD in the three mining areas. Finally, TDS analyzed in the laboratory varied from 0.296 to 640.086 gL−1, with an average concentration of 23.475 gL−1. The difference observed between the TDS analyzed in the laboratory and the value estimated from the electrical conductivity (with a conversion factor of 0.49) is noteworthy. In general, the estimated TDS value was considerably lower than the value obtained by gravimetric analysis. Only three samples had an estimated TDS value above the TDS determined in the laboratory (Table S1 in Supplementary Materials). In addition, the statistical summary and the boxplots of Figure 3 highlight the variability of the samples. The high standard deviation in most parameters revealed the variability of conditions in the three mining areas expressed in the hydrochemistry. There was also a large difference between the mean and the median, which the presence of especially discriminated samples could explain. This is another characteristic of MIW, where microenvironments with extreme physical-chemical and ecological properties are common.
When treating the analytical results for this type of water, there is often a temptation to disregard values that would be considered anomalous in a statistical condensation analysis. However, in “extreme” environments, such as those of MIW, the “abnormality” has its meaning. In this case, the values considered “abnormal” in typical neutral freshwaters in pristine water bodies should form an integral part of the base knowledge. Such values may represent critical situations insofar as they are characteristically the expression of phenomena that are intended to be interpreted. Moreover, they can have more considerable environmental relevance. They could represent contamination peaks, or on the contrary, because they correspond to dilution situations or any other impact mitigation process. The type of analysis to which the data are submitted controls the degree of information that can be extracted.
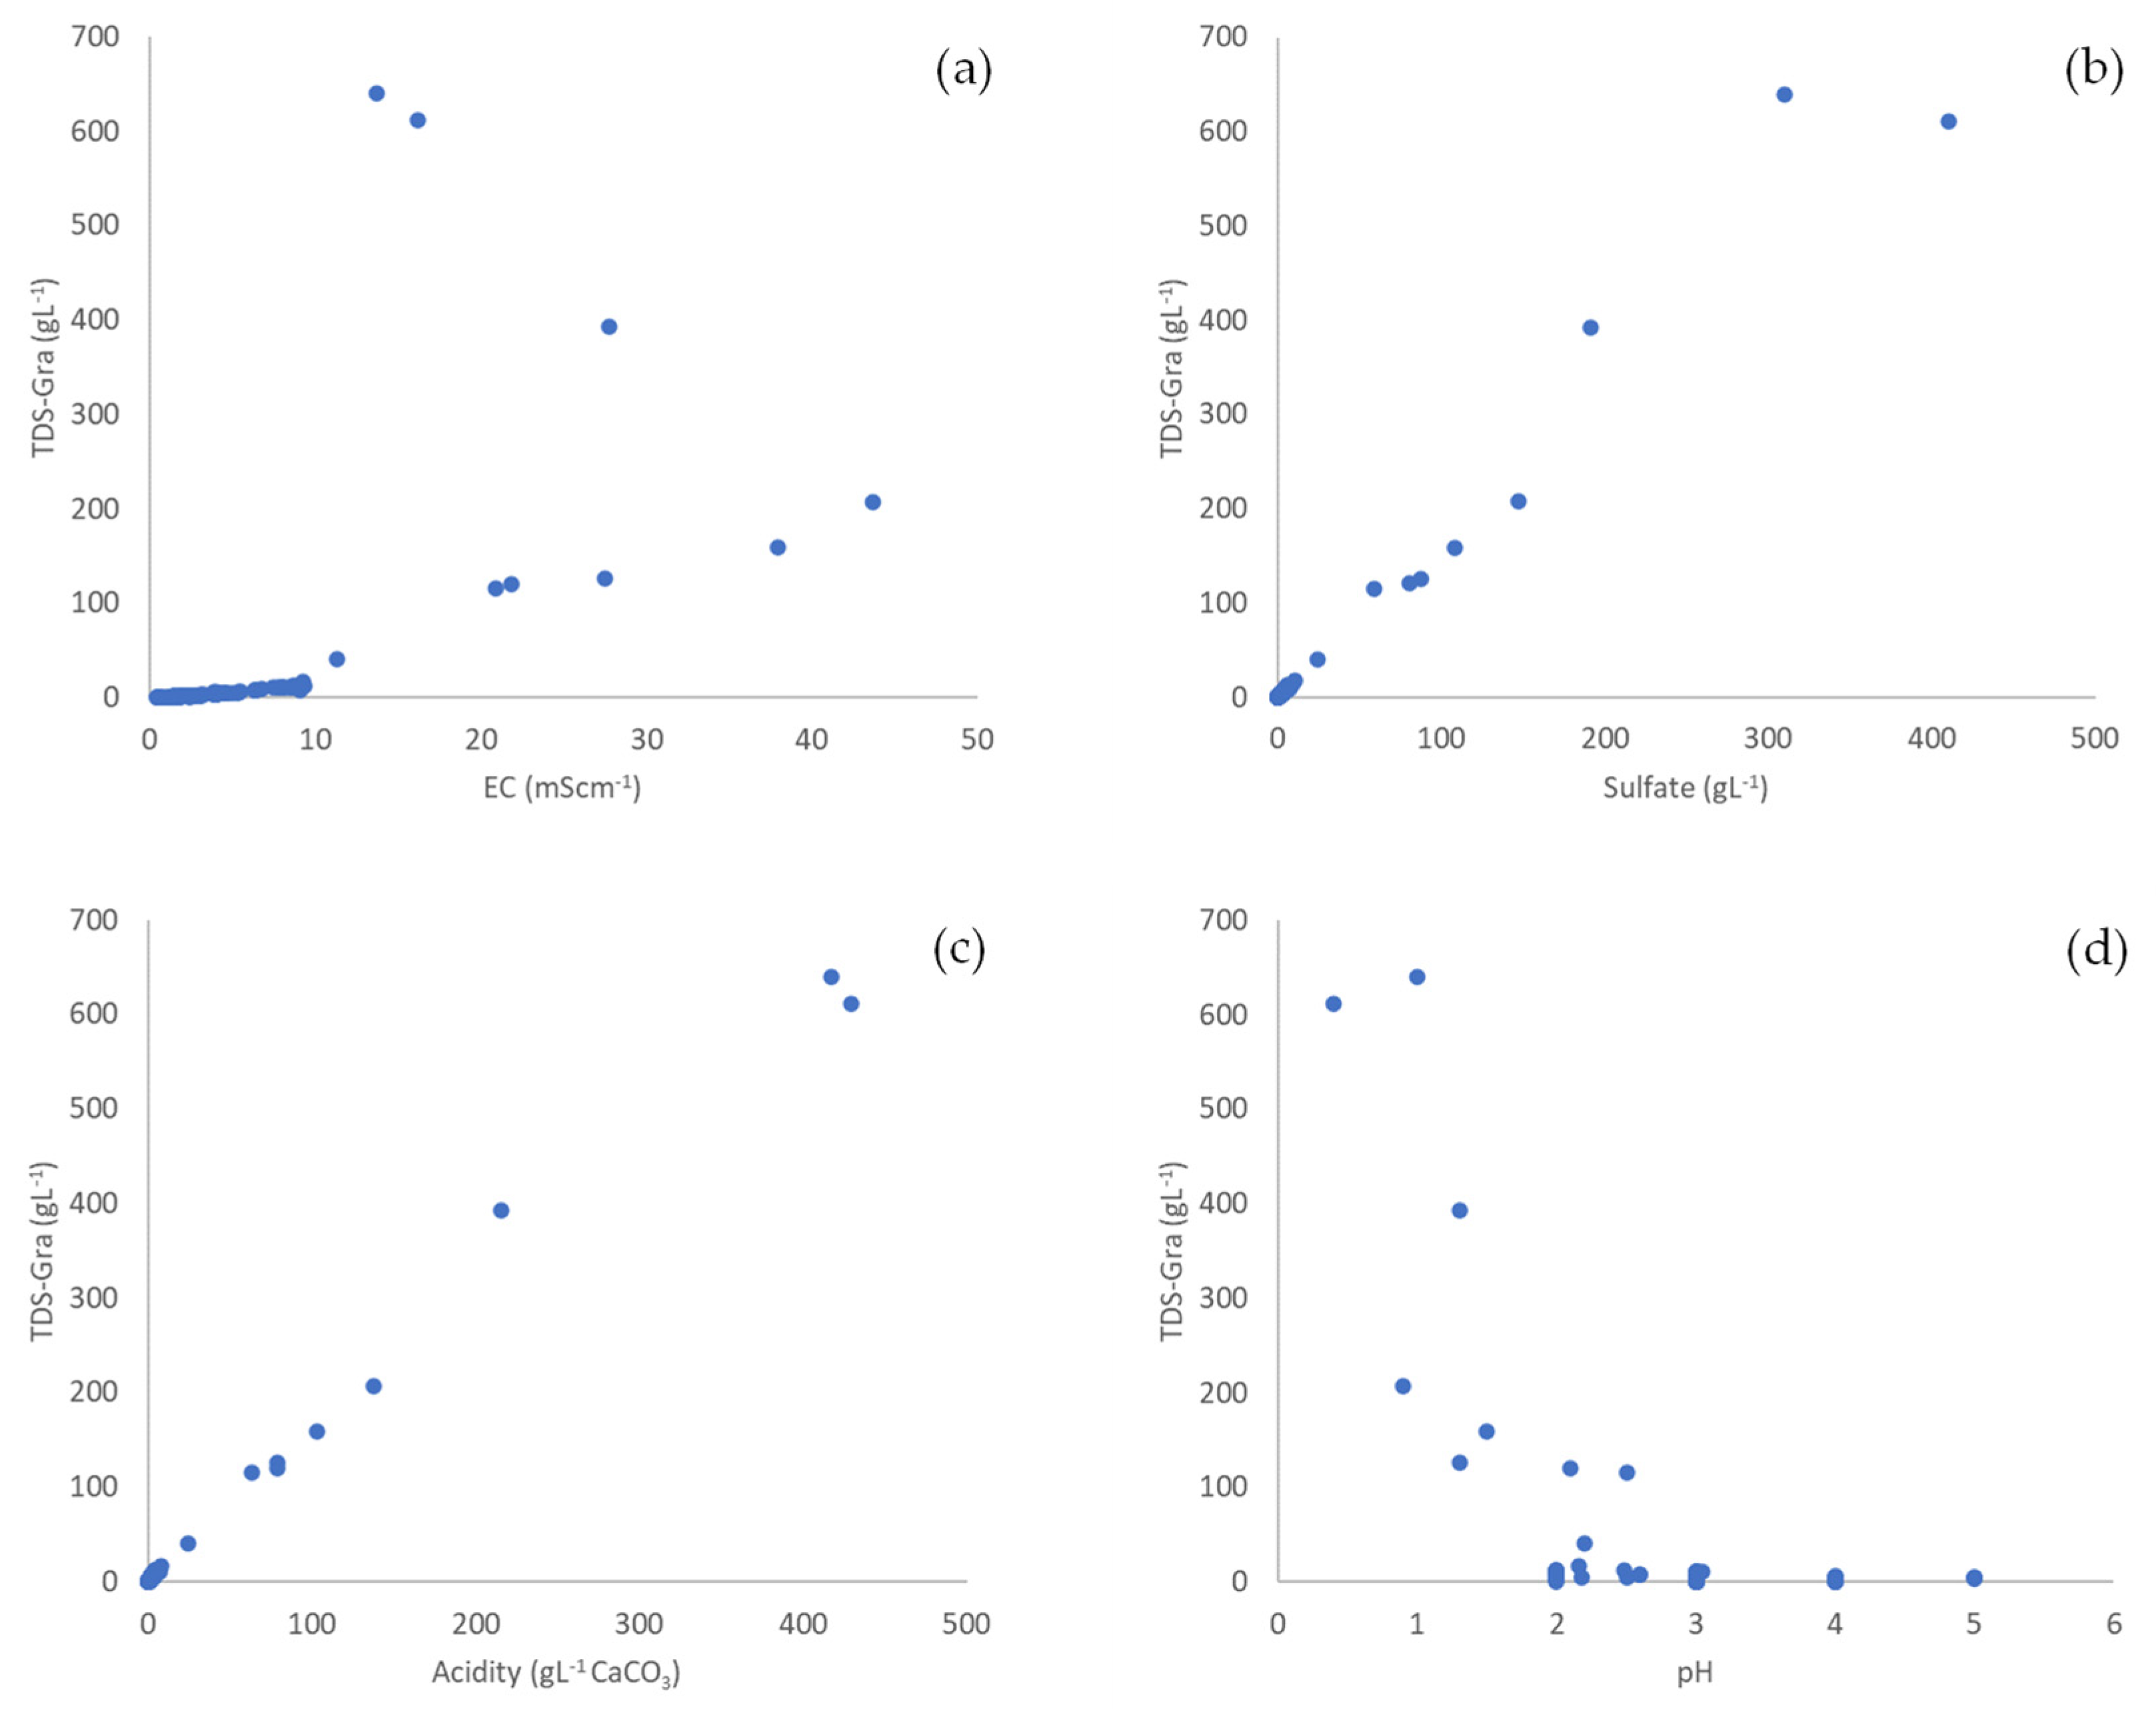
Table 2 shows the Spearman correlation coefficients for the measured parameters. Though a higher correlation was observed between TDS and EC (0.978), the value observed for Spearman correlation with acidity was not disregarded (r > 0.964, ρ < 0.001). This can be explained by the high concentration of metals [27], as elements such as Fe, Mn, and Al should be an essential source of acidity in these effluents. On the other hand, dispersion diagrams (Figure 4) suggest a non-linear relationship of TDS with EC, sulfate, and pH. The highest TDS values are responsible for the behavior between TDS and EC observed in the dispersion diagrams. The effect of lower EC values for very high TDS concentrations, related to the increasing interaction of the ions, might be the main limitation of using EC for TDS estimation in such complex matrixes.
Thus, this approach is proposed for acidic mining influenced waters due to the presence of metals, such as Fe and Mn, as well as other alkaline and earth alkaline ions dissolved from host rocks in such acidic environments. Together with H+ and sulfate, these are the main contributors to TDS. Therefore, under neutral and alkaline conditions in the presence of a different dominant anion (e.g., chloride), another approach should be investigated.
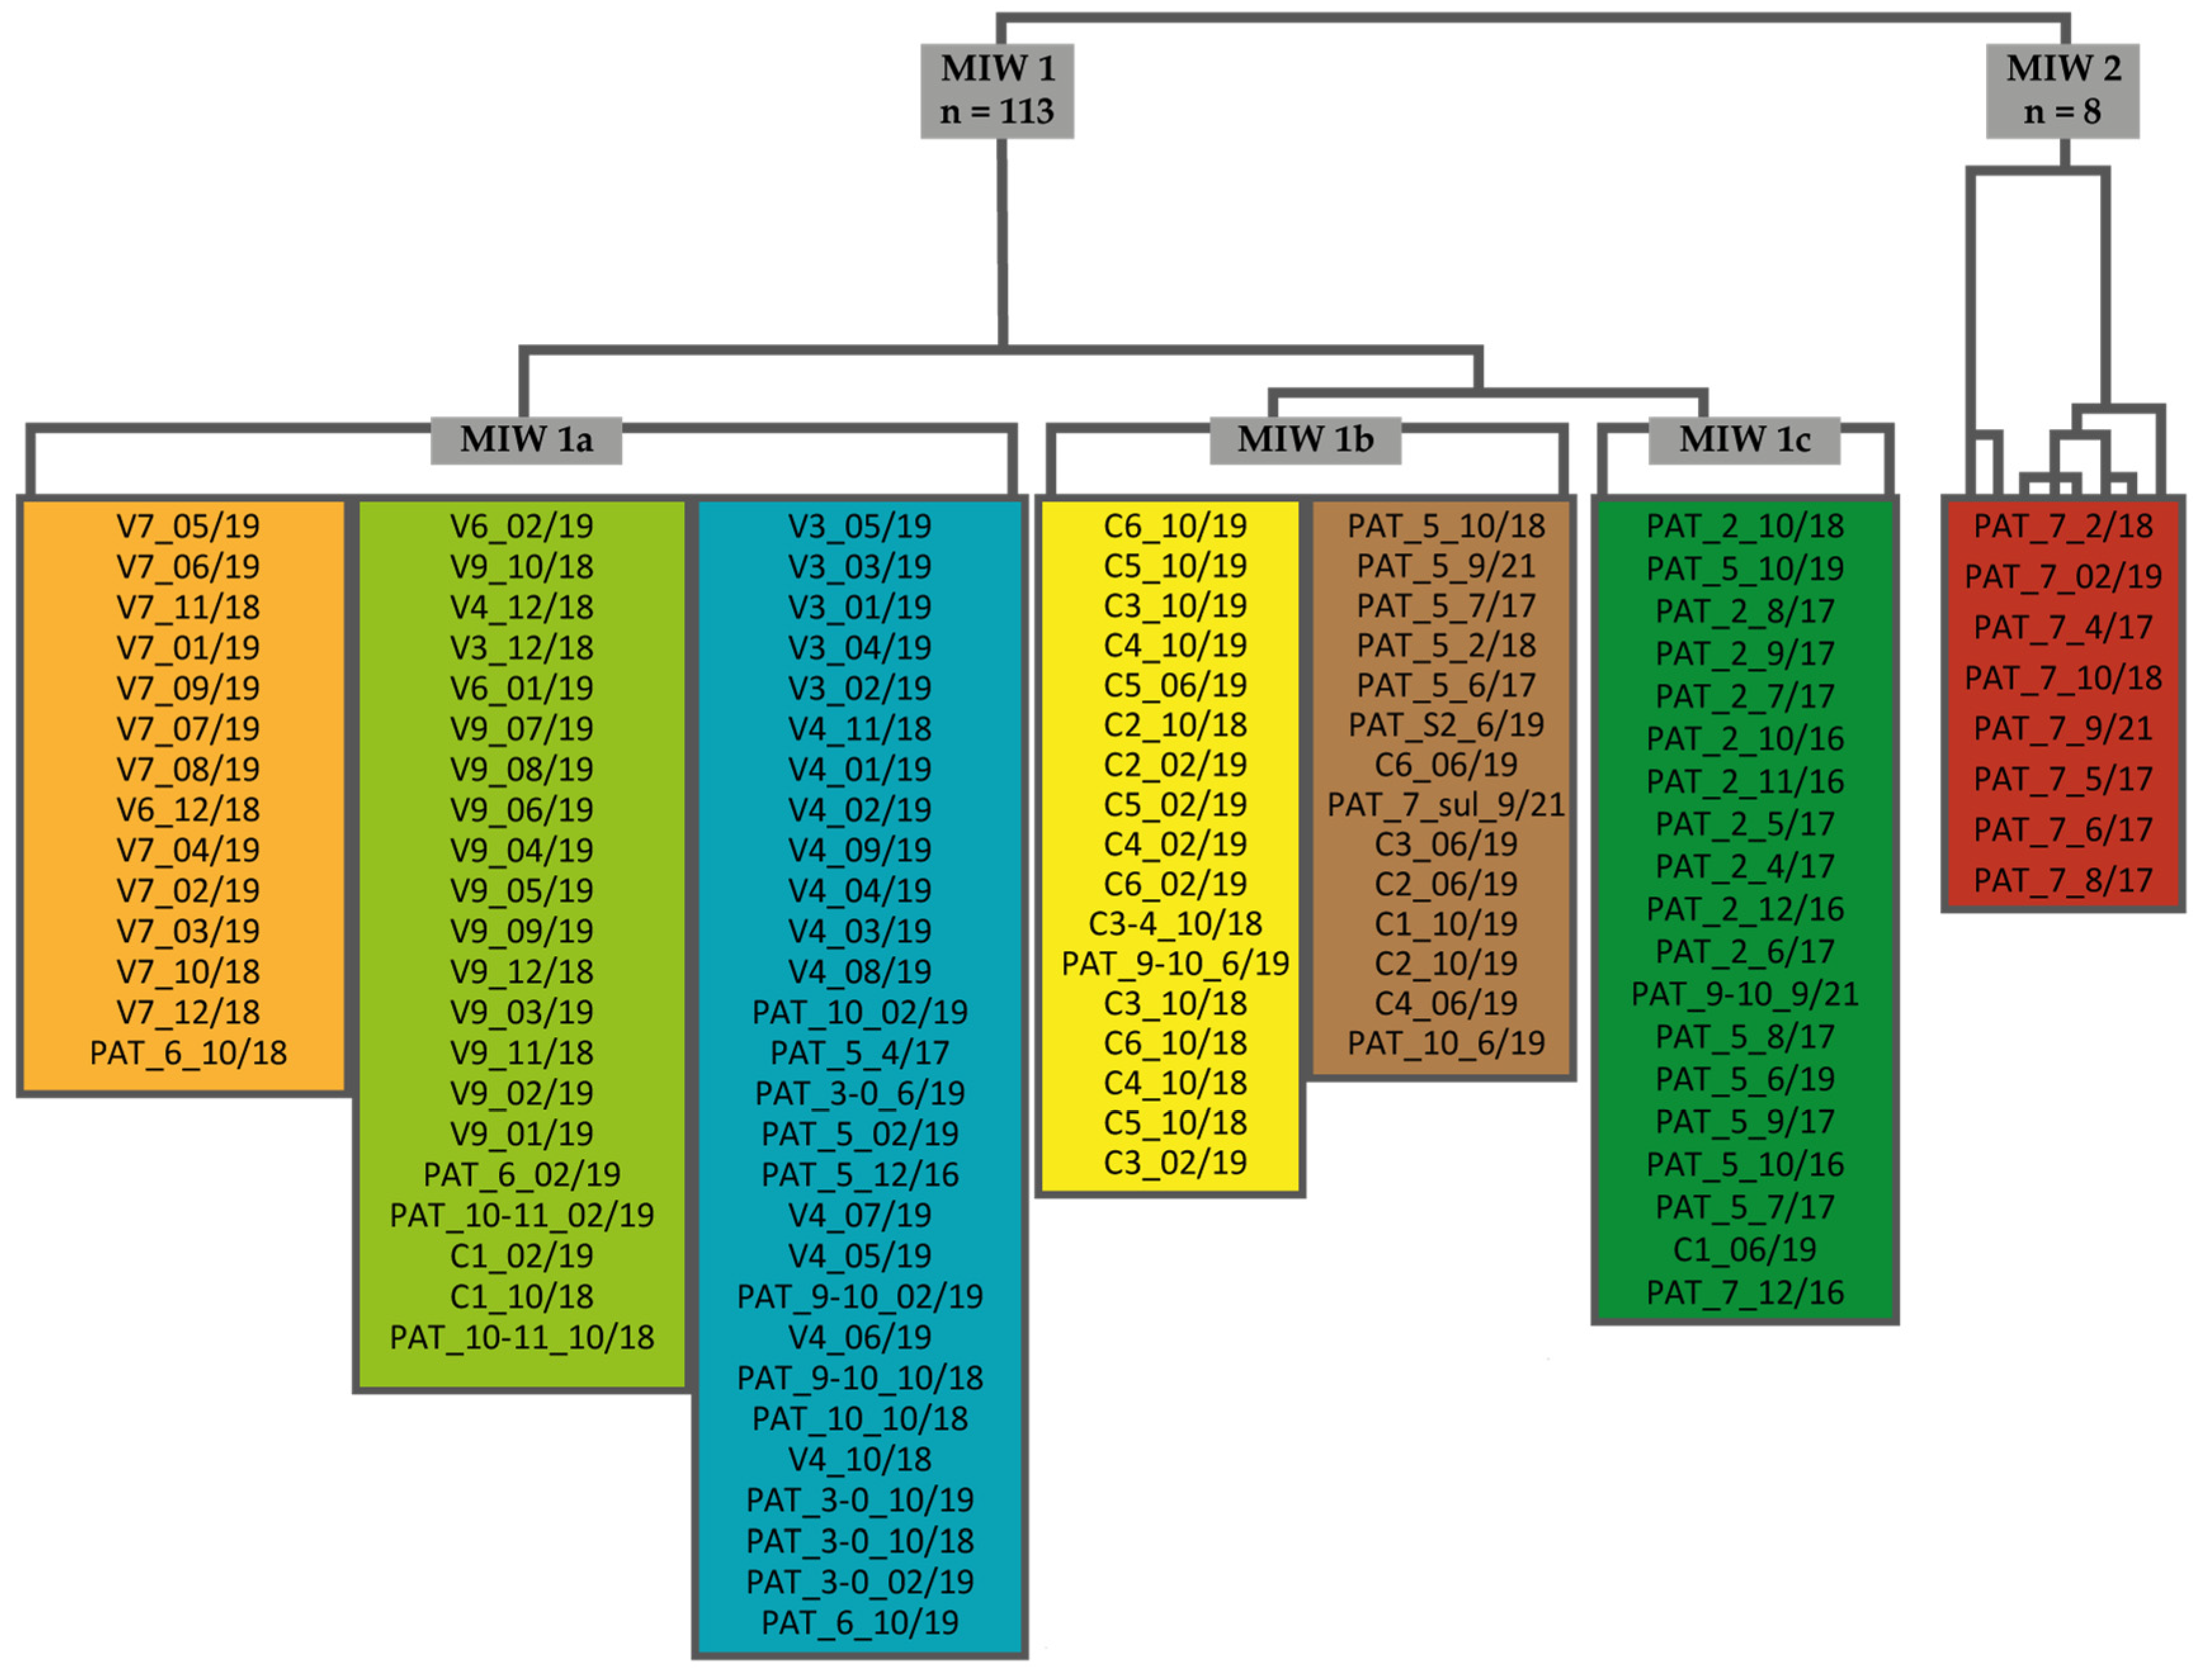
Hierarchical cluster analysis was performed to identify similarities between the water samples based on their hydrochemical characteristics. The output of the statistical treatment performed for the 121 samples is presented in the Supplementary Materials Figure S1. From the top to the base of the dendrogram (Figure S1), the MIW was ordered according to the measured parameters (acidity, sulfate concentration, and EC). Figure 5 shows a simplified scheme of the dendrogram, indicating the seven classes defined based on the range of these parameters.
Two groups were revealed: the first one (MIW1) comprised a major part of the samples analyzed (n = 113) except for eight samples that represented the other group (MIW2). The group MIW1 contains three subgroups (MIW1a, MIW1b, and MIW1c) (Figure 5), which include samples from the three mining areas (Valdarcas, Campanario, and São Domingos). In the MIW1a group are the samples collected in the Valdarcas mine (orange, green, and blue class, Figure 5), where contamination problems remain, even after environmental rehabilitation. These classes agree with the AMD environments previously modeled by ref. [27] for the Valdarcas mining area: V7 (orange class at the top, Figure 5) that was defined as lower contaminated water due to the distance from the waste dump, and V3459 (green and blue class, Figure 5) that was classified as an intermediate environment in the main effluent channel, because of the variations in hydraulic, ecological, and geochemical conditions along the stream. The samples collected in V6, which should represent the V216 environment in work by ref. [27], are distributed between the orange and green classes. It should be noted that V6 had low representation because the lack of water only allowed the collection of three samples. In this group (MIW1a), beyond the Valdarcas samples sequence, some samples from São Domingos and two from Campanario were also distributed into the three classes. Specifically, a few samples from São Domingos composed the end of the blue class (Figure 5), characterized by intermediate contamination points, where the fluctuations in the pluvial regimen, runoff conditions, or water residence time in the waste dump influenced the hydrochemical characteristics.
In the middle of the dendrogram, the MIW1b group (Figure 5) was represented by the samples collected in the Campanario mine, and two classes were defined (yellow and brown classes, Figure 5). This area is a singular environment where the water sampling points show high similarity even when the distance to the focus of contamination increases. As mentioned above, the effect of iron hydrolysis is consistent along the watercourse since the stream only has a 200 m length. At the end of the MIW1 group, there was the MIW1c group represented by one class (dark green class, Figure 5). The dark green class was composed mainly of samples collected in PAT 2 and PAT 5, which are a pit lake (PAT 2) and an acidic lagoon (PAT 5) from the São Domingos area. These sites are the most problematic due to the constantly exposed leachates from reactive and very fine waste dumps [30].
Finally, MIW2 had the samples collected at the sampling point PAT 7 (São Domingos mine) (red class, Figure 5). These samples were highly affected by mining contamination because this site (PAT 7) is an acidic lagoon of leachates from reactive and very fine wastes [33], located around the oldest metallurgical treatment facilities at São Domingos mine. Overall, some water samples from the three mining areas were dispersed in the classes mentioned, showing these waters’ heterogeneity and temporal variations.

3.2. Conversion Factors

Considering the abovementioned importance of acidity in the characterization of these waters and the results in Figure 4, acidity was the parameter used to establish a conversion factor (f) to estimate TDS in MIW waters instead of EC. So, the f was calculated by using the following equation:
TDS = f × Acidity
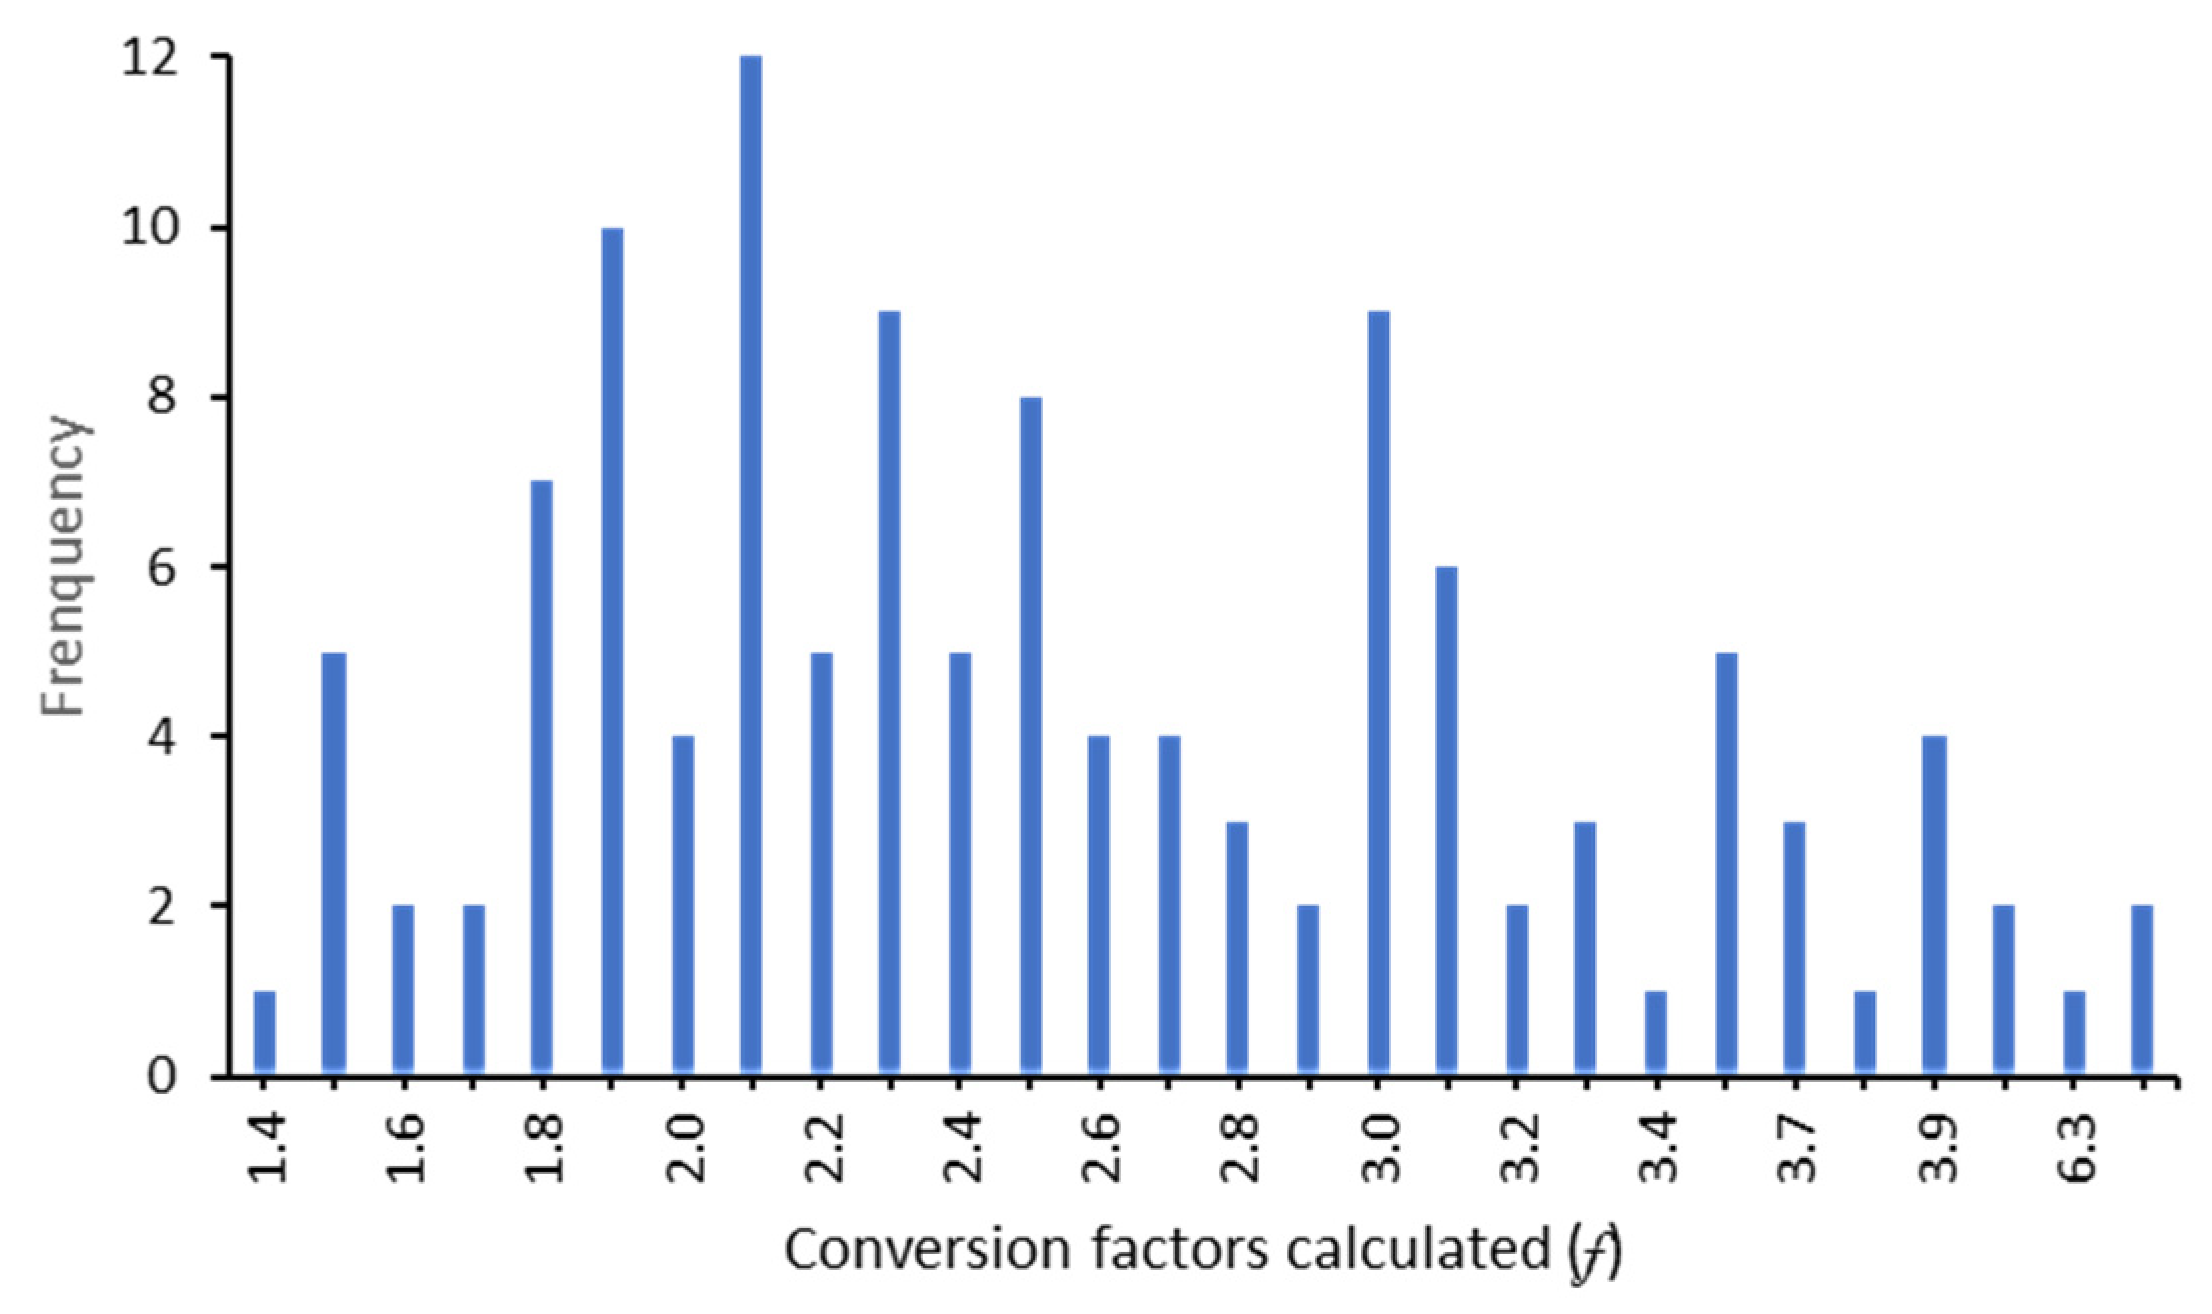
The conversion factor (f) was calculated for each water sample. The calculated factors showed a bimodal distribution, ranging from 1.4 to 7.2 and a higher frequency between 1.5 to 2.7 (Figure 6).
Then, using the color classes mentioned above (Figure 5), an fmedian was calculated and defined as the f to be used for TDS estimation when MIW has similar characteristics, representing distinct contamination scenarios (Table 3). All seven classes defined had a different conversion factor (Table 3).
So, according to the sulfate concentration and acidity of these waters, the proposed f is:
  • 2.5 for very low MIW contamination, with very low sulfate (<0.250 gL−1) and acidity (<0.200 gL−1 of CaCO3);
  • 2.7 for low MIW contamination, characterized by low sulfate (<0.800 gL−1) and acidity (<0.525 gL−1 of CaCO3);
  • 2.1 for moderate MIW contamination, with sulfate concentration between 0.700 and 2.000 gL−1and acidity of 0.400 to 1.600 gL−1 of CaCO3;
  • 3.3 for MIW contamination, with sulfate concentration range of 2.250 to 3.300 gL−1and acidity of 1.300 to 1.600 gL−1 of CaCO3;
  • 2.3 for high MIW contamination, with high sulfate (2.250 to 5.200 gL−1) and acidity (1.400 to 4.300 gL−1 of CaCO3);
  • 2.9 for very high MIW contamination, with sulfate concentration between 4.700 and 10.400 gL−1 and acidity of 2.000 to 8.000 gL−1 of CaCO3;
  • and, for extreme MIW contamination, rich in sulfate (>24.000 gL−1) and very acidic (>24.400 gL−1 of CaCO3), the f is around 1.5.
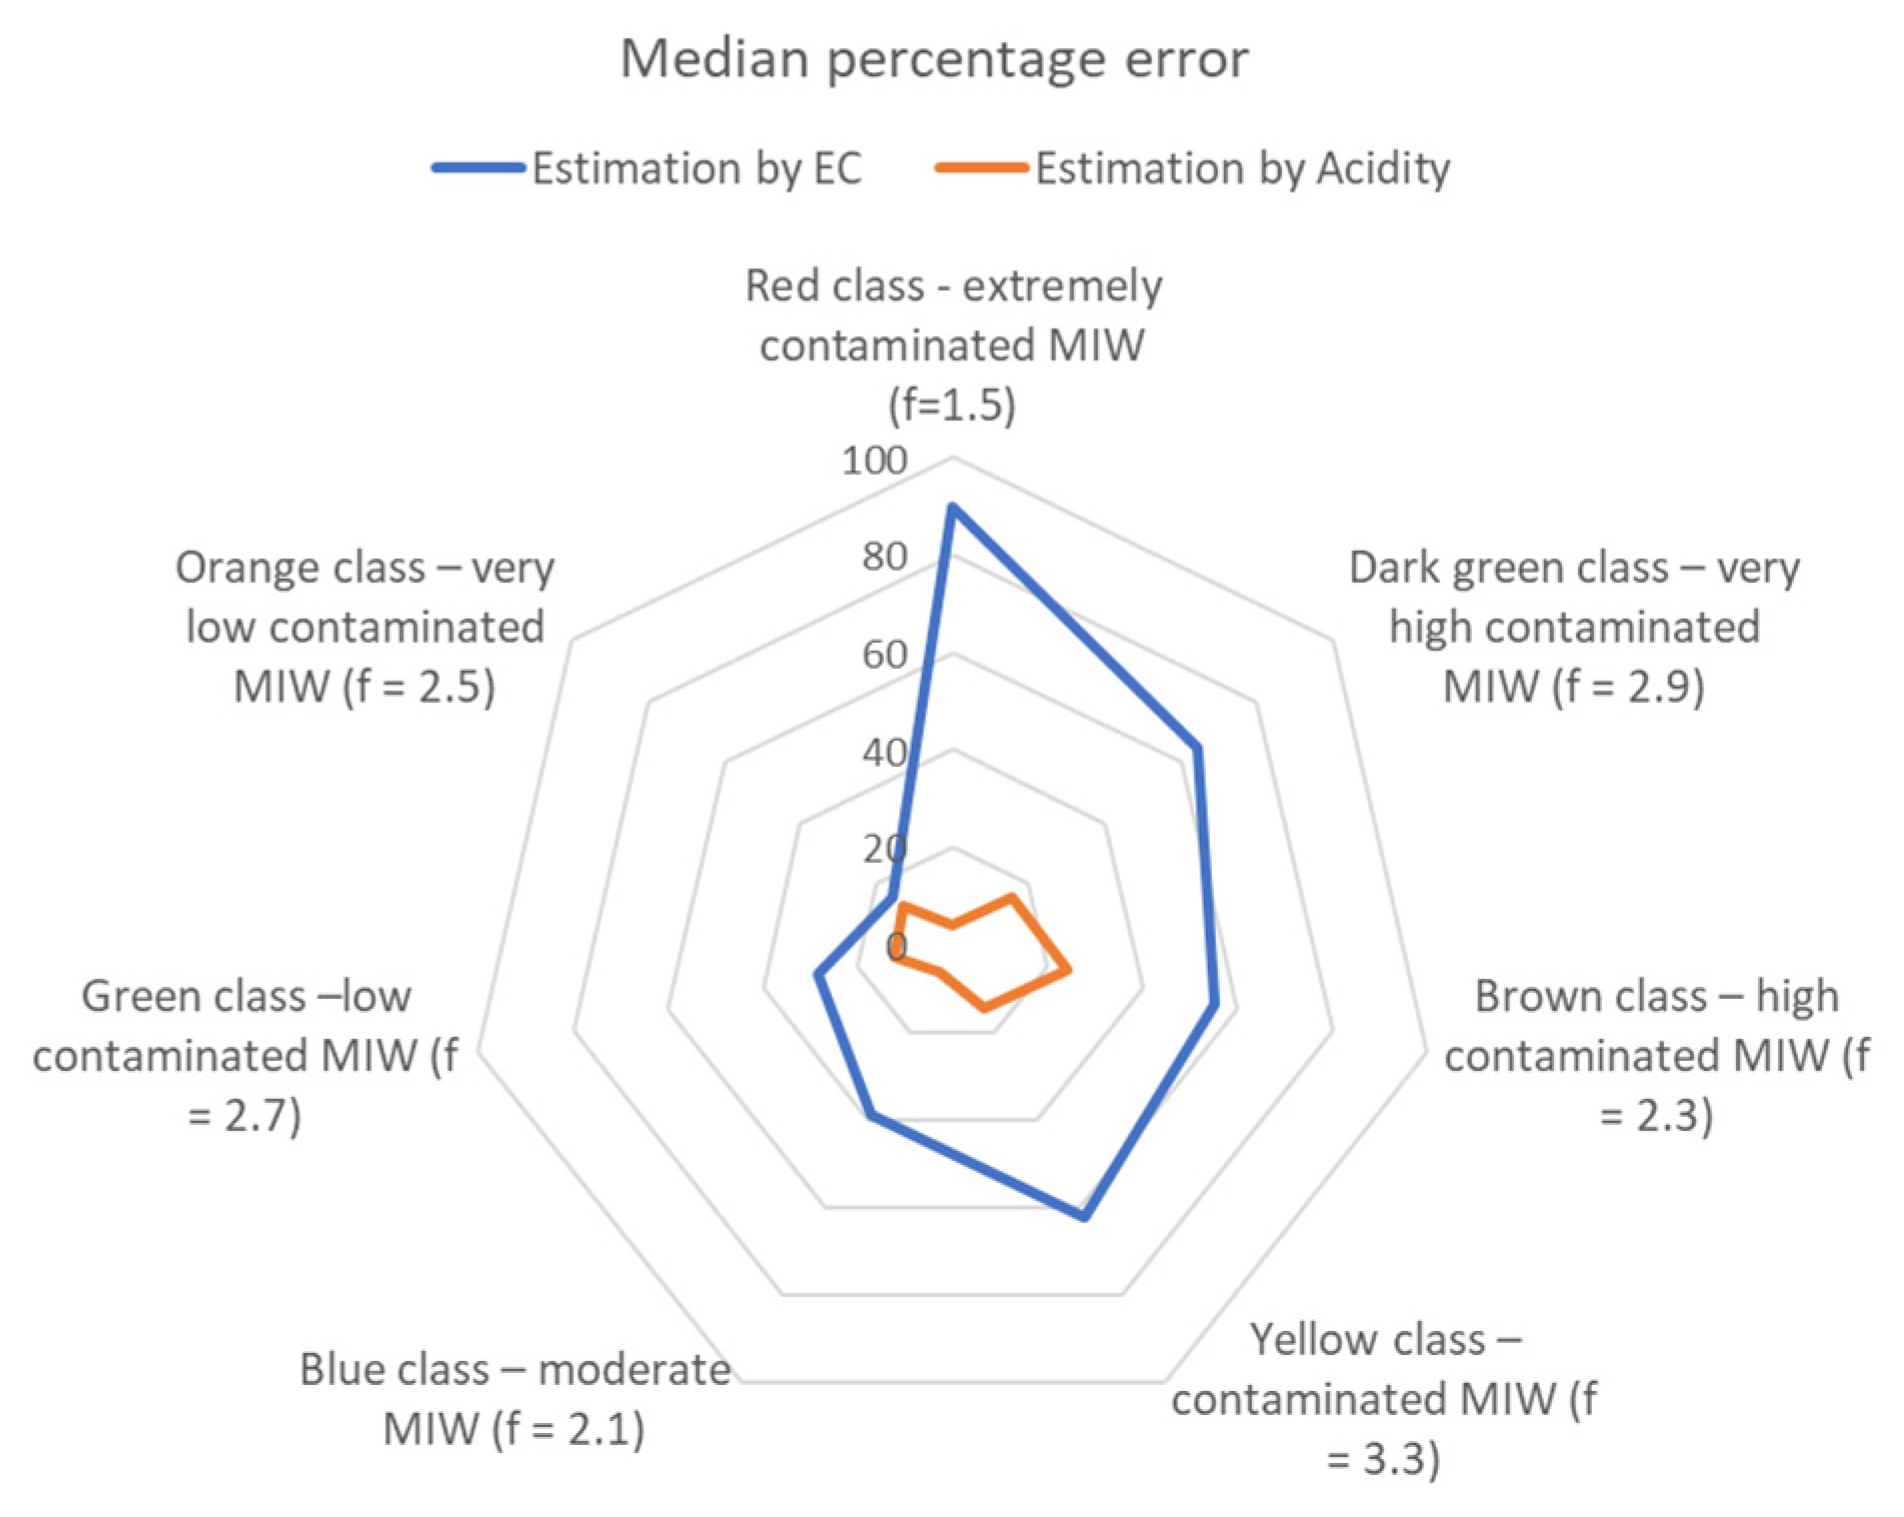
The radial graph of Figure 7 shows the median percentage error of the estimated TDS approaches, for each class. The precision of the conventional estimation based on the EC decreases for the more contaminated water classes. Thus, this representation highlights the advantage of using acidity for estimating TDS.

4. Conclusions

Total dissolved solids (TDS) have applications in a variety of research areas, such as geochemistry, hydrology, and environmental sciences. In environmental monitoring and remediation processes in mining areas, the characterization of waters and effluents requires the determination of TDS and other parameters (like pH, acidity, sulfate, and EC) to evaluate the water contamination degree. Specifically, acidity is an imperative parameter that should be used in monitoring processes for MIW. Due to the time-consuming laboratory effort for gravimetric analysis of TDS, this parameter is often estimated from EC measurements. However, there is no accepted conversion factor, especially in the case of the most contaminated and acidic MIW. Therefore, this study presented correlations of the TDS as a function of acidity for 121 samples. Thus, a conversation factor (f) was calculated for TDS estimation from acidity, depending on the contamination degree, ranging from 3.3 to 1.5 for extremely contaminated MIW. The results confirmed that a standard conversion factor might not work well for these types of waters, which are affected by a full range of conditions (such as paragenetic, climate, and environmental). Therefore, as reported by ref. [3], the present work also recommends that a site-specific conversion factor needs to be established to achieve accurate TDS estimations. Considering its quality as an indicator of contamination, acidity appears as the appropriate parameter to estimate TDS in MIW. Still, the approach also requires different conversion factors for various degrees of mining contamination.
The comparison of percentage error between conventional estimation through EC and the proposed method through acidity highlights the weakness of the first due to higher median error for each class. The precision of the estimation through EC decreases with the increase in contamination degree of the MIW. Even considering its limitation, this new conversion factor could be proposed as a methodological approach for a more expeditious and accurate estimation of total dissolved solids in mining areas.

Supplementary Materials

The following supporting information can be downloaded at: https://www.mdpi.com/article/10.3390/w15162995/s1, Figure S1: Dendrogram of the HCA using Ward’s method, with the identification of the seven classes defined.; Table S1: Physical-chemical parameters measured for the 121 mine-influenced waters, with the respective class and conversion factor (f) defined according to the HCA.

Author Contributions

Conceptualization, A.B., T.V., A.P.M.R. and I.M.H.R.A.; Methodology, A.B. and T.V.; Validation, T.V., A.P.M.R. and I.M.H.R.A.; Formal analysis, A.P.M.R.; Investigation, A.B., T.V. and I.M.H.R.A.; Writing—original draft, A.B., T.V., A.P.M.R. and I.M.H.R.A.; Supervision, T.V., A.P.M.R. and I.M.H.R.A. All authors have read and agreed to the published version of the manuscript.

Funding

This research was funded by FCT (Fundação para a Ciência e a Tecnologia, Portugal) by the research fellowship under the ICT-UMinho (Institute of Earth Sciences, pole of University of Minho) supported by FCT, I.P. with reference UI/BD/151330/2021. This work was also co-funded by FCT through projects UIDB/04683/2020, UIDP/04683/2020, and Nano-MINENV 029259 (PTDC/CTA-AMB/29259/2017).

Data Availability Statement

Not applicable.

Acknowledgments

The authors express thanks to the three anonymous reviewers for their contributions.

Conflicts of Interest

The authors declare no conflict of interest.

References

  1. Omer, N.H. Water quality parameters. In Water Quality—Science, Assessments and Policy; IntechOpen: London, UK, 2019; Volume 18, pp. 1–34. [Google Scholar]
  2. McNeil, V.H.; Cox, M.E. Relationship between conductivity and analysed composition in a large set of natural surface-water samples, Queensland, Australia. Environ. Geol. 2000, 39, 1325–1333. [Google Scholar] [CrossRef]
  3. Hubert, E.; Wolkersdorfer, C. Establishing a conversion factor between electrical conductivity and total dissolved solids in South African mine waters. Water SA 2015, 41, 490–500. [Google Scholar] [CrossRef]
  4. Rebello, L.R.B.; Siepman, T.; Drexler, S. Correlations between TDS and electrical conductivity for high-salinity for-mation brines characteristic of South Atlantic pre-salt basins. Water SA 2020, 46, 602–609. [Google Scholar]
  5. Hem, J.D. Study and Interpretation of the Chemical Characteristics of Natural Water; Department of the Interior, US Geological Survey: Reston, CA, USA, 1985; 2254, p. 263.
  6. APHA Standard Methods for the Examination of Water and Wastewater, 20th ed.; American Public Health Association, American Water Works Association, Water Environment Federation: Washington, DC, USA, 2012.
  7. Singh, T.; Kalra, Y.P. Specific conductance method for in situ estimation of total dissolved solids. J. Am. Water Work. Assoc. 1975, 67, 99–100. [Google Scholar] [CrossRef]
  8. Walton, N.R.G. Electrical Conductivity and Total Dissolved Solids—What is Their Precise Relationship? Desalination 1989, 72, 275–292. [Google Scholar] [CrossRef]
  9. Atekwana, E.A.; Atekwana, E.A.; Rowe, R.S.; Werkema, D.D., Jr.; Legall, F.D. The relationship of total dissolved solids measurements to bulk electrical conductivity in an aquifer contaminated with hydrocarbon. J. Appl. Geophys. 2004, 56, 281–294. [Google Scholar] [CrossRef]
  10. Marandi, A.; Polikarpus, M.; Jõeleht, A. A new approach for describing the relationship between electrical con-ductivity and major anion concentration in natural waters. Appl. Geochem. 2013, 38, 103–109. [Google Scholar] [CrossRef]
  11. Rusydi, A.F. Correlation between conductivity and total dissolved solid in various type of water: A review. IOP Conf. Ser. Earth Environ. Sci. 2018, 118, 012019. [Google Scholar] [CrossRef]
  12. Thirumalini, S.; Joseph, K. Correlation between Electrical Conductivity and Total Dissolved Solids in Natural Waters. Malays. J. Sci. 2009, 28, 55–61. [Google Scholar] [CrossRef]
  13. Weiner, E.R. Applications of Environmental Aquatic Chemistry—A Practical Guide; CRC Press: Boca Raton, FL, USA, 2010. [Google Scholar]
  14. Ali, N.S.; Mo, K.; Kim, M. A case study on the relationship between conductivity and dissolved solids to evaluate the potential for reuse of reclaimed industrial wastewater. KSCE J. Civ. Eng. 2012, 16, 708–713. [Google Scholar] [CrossRef]
  15. Taylor, M.; Elliott, H.A.; Navitsky, L.O. Relationship between total dissolved solids and electrical conductivity in Marcellus hydraulic fracturing fluids. Water Sci. Technol. 2018, 77, 1998–2004. [Google Scholar] [CrossRef] [PubMed]
  16. Wolkersdorfer, C. Mine Water Treatment—Active and Passive Methods; Springer: Berlin/Heidelberg, Germany, 2022; p. 328. ISBN 978-3-662-65770-6. [Google Scholar] [CrossRef]
  17. Nordstrom, D.K.; Alpers, C. Negative pH, efflorescent mineralogy, and consequences for environmental restoration at the Iron Mountain Superfund site, California. Proc. Natl. Acad. Sci. USA 1999, 96, 3455–3462. [Google Scholar] [CrossRef] [PubMed]
  18. Nordstrom, D.K. Mine Waters: Acidic to Circmneutral. Elements 2011, 7, 393–398. [Google Scholar] [CrossRef]
  19. Wolkersdorfer, C.; Nordstrom, D.K.; Beckie, R.D.; Cicerone, D.S.; Elliot, T.; Edraki, M.; Valente, T.; França, S.C.; Kumar, P.; Oyarzún Lucero, R.A.; et al. Guidance for the Integrated Use of Hydrological, Geochemical, and Isotopic Tools in Mining Operations. Mine Water Environ. 2020, 39, 204–228. [Google Scholar] [CrossRef]
  20. Fink, C.G. Chemical Composition versus Electrical Conductivity. Phys. Chem. 1917, 21, 32–36. [Google Scholar] [CrossRef]
  21. Appelo, C.; Postma, D. Geochemistry, Groundwater and Pollution, 2nd ed.; Balkema: Rotterdam, The Netherlands, 2005; p. 649. ISBN 04 1536 428 0. [Google Scholar] [CrossRef]
  22. Hedin, R.S.; Watzlaf, G.R. The effects of anoxic limestone drains on mine water chemistry. J. Am. Soc. Min. Reclam. 1994, 6, 185–194. [Google Scholar] [CrossRef]
  23. Langmuir, D. Aqueous Environmental Geochemistry; Prentice Hall: Upper Saddle River, NJ, USA, 1997; p. 600. ISBN 0-02-367412-1. [Google Scholar]
  24. Barriga, F.J.A.S. Metallogenesis in the Iberian Pyrite Belt. In Premesozoic Geology of Iberia; Dallmeyer, R.D., Martinez-Garcia, E., Eds.; Springer: Berlin/Heidelberg, Germany; New York, NY, USA, 1990; pp. 369–379. [Google Scholar] [CrossRef]
  25. Inverno, C.; Diez-Montes, A.; Rosa, C.; García-Crespo, J.; Matos, J.; García-Lobón, J.L.; Carvalho, J.; Bellido, F.; Caste-llo-Branco, J.M.; Ayala, C.; et al. Introduction and geological setting of the Iberian Pyrite Belt. In 3D, 4D and Predictive Modelling of Major Mineral Belts in Europe; Weihed, P., Ed.; Springer: Berlin/Heidelberg, Germany, 2015; Volume 9, pp. 191–208. [Google Scholar] [CrossRef]
  26. Gomes, P.; Valente, T.M.; Pereira, P. Addressing quality and usability of surface water bodies in semi-arid regions with mining influences. Environ. Process. 2018, 5, 707–725. [Google Scholar] [CrossRef]
  27. Valente, T.M.; Gomes, C.L. Fuzzy modelling of acid mine drainage environments using geochemical, ecological and mineralogical indicators. Environ. Geol. 2009, 57, 653. [Google Scholar] [CrossRef]
  28. Valente, T.M.; Gomes, C.L. Occurrence, properties and pollution potential of environmental minerals in acid mine drainage. Sci. Total Environ. 2009, 407, 1135–1152. [Google Scholar] [CrossRef]
  29. Alves, R.C.; Valente, T.M.F.; Braga, M.A.; Gomes, C.L. Mineralogical composition and metals retention in the fine-fraction streambed precipitates of on AMD affected system. In Proceedings of the International Mine Water Association Congress-IMWA, Aachen, Germany, 4–11 September 2011; ISBN 9781618393050. [Google Scholar]
  30. Gomes, P.; Valente, T.; Geraldo, D.; Ribeiro, C. Photosynthetic pigments in acid mine drainage: Seasonal patterns and associations with stressful abiotic characteristics. Chemosphere 2020, 239, 124774. [Google Scholar] [CrossRef] [PubMed]
  31. Lobo, A.; Valente, T.; de la Torre, M.L.; Grande, J.A.; Santisteban, M.; Salmerón, I.; Sánchez Requena, J. Spatial behavior of acid mine drainage in a peculiar stream: Physical-chemical evolution from the source until the temporarily receptor in the Iberian Pyrite Belt. In Proceedings of the Energy and Environment Knowledge Week, Toledo, Spain, 30–31 October 2014; ISBN 978-84-697-1162-0. [Google Scholar]
  32. Egbueri, J.C. Groundwater quality assessment using pollution index of groundwater (PIG), ecological risk index (ERI) and hierarchical cluster analysis (HCA): A case study. Groundw. Sustain. Dev. 2020, 10, 100292. [Google Scholar] [CrossRef]
  33. Gomes, P.; Valente, T.; Albuquerque, T.; Henriques, R.; Flor-Arnau, N.; Pamplona, J.; Macías, F. Algae in acid mine drainage and relationships with pollutants in a degraded mining ecosystem. Minerals 2021, 11, 110. [Google Scholar] [CrossRef]
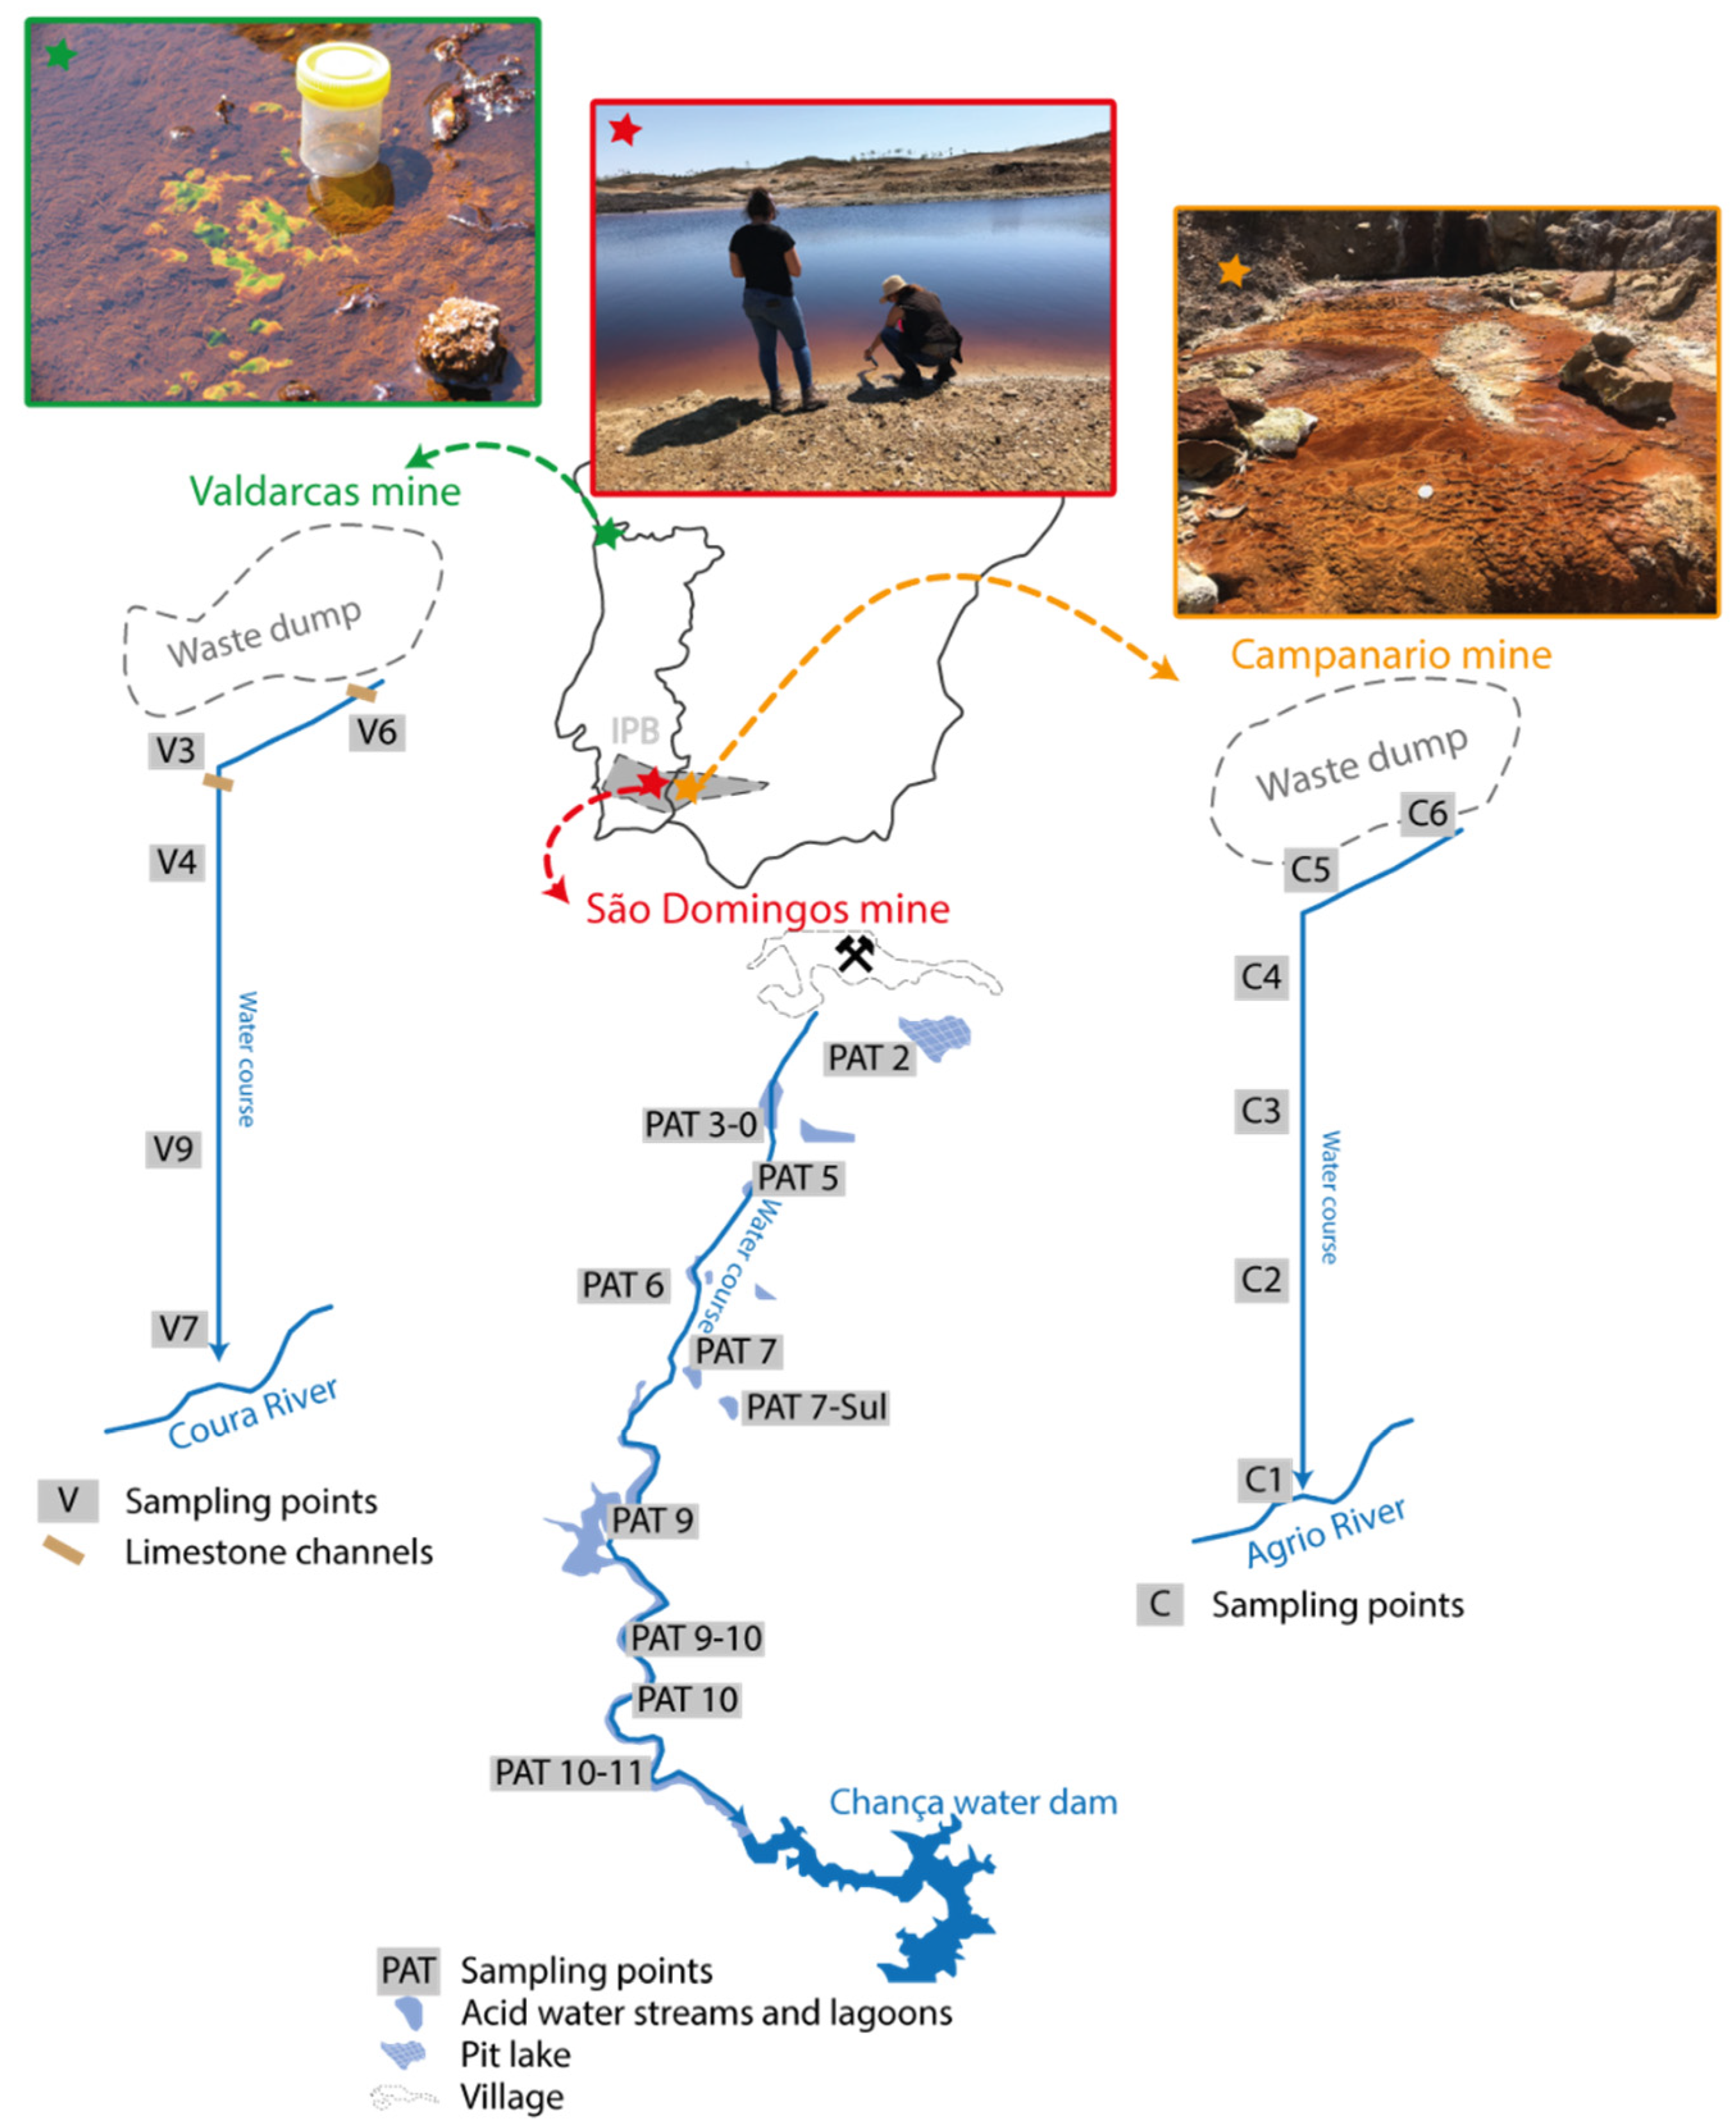
Figure 1. Study sites and sampling points of each mining area in Portugal and Spain.
Water 15 02995 g001
Figure 2. pH histogram (left) and the relation between pH and total acidity (right) for n = 121.
Water 15 02995 g002
Figure 3. Boxplots of the statistical parameters obtained for the 121 water samples. The boxplots show the interquartile range (box in blue), median (thick line inside the box), minimum and maximum (whiskers), outliers (black dots), and extreme cases (black asterisks) of individual variables.
Water 15 02995 g003
Figure 4. Graphical representation of the dispersion relationship: (a) TDS vs. EC, (b) TDS vs. Sulfate, (c) TDS vs. Acidity, and (d) TDS vs. pH.
Water 15 02995 g004
Figure 5. Simplified scheme of the dendrogram of the HCA using Ward’s method.
Water 15 02995 g005
Figure 6. Distribution of the conversion factors calculated.
Water 15 02995 g006
Figure 7. Radial representation of the median percentage error of estimation of TDS through EC and acidity.
Water 15 02995 g007
Table 1. Statistical data for the mine water samples analyzed.
pHTDS–Gra
(g L−1)
TDS–est
(g L−1)
EC
(mS cm−1)
Sulfate
(g L−1)
Acidity
(g L−1 of CaCO3)
Minimum0.442960.2760.4120.1530.096
Maximum4.82640.08620.85043.71041.0601429.250
Mean2.9023.4752.5074.96313.80614.172
Median2.922.4141.4133.0521.3891.180
Standard deviation0.7090.3583.5126.66352.29159.430
Notes: Total number of water samples = 121; EC—electrical conductivity; TDS–Gra = total dissolved solids analyzed by gravimetry; TDS–est = total dissolved solids estimated from EC (conversion factor 0.49).
Table 2. Spearman correlation matrix for measured parameters.
pHTDSECSulfateAcidity
pH1
TDS−0.599 *1
ρ < 0.001
EC−0.652 *0.978 *1
ρ < 0.001ρ < 0.001
Sulfate−0.624 *0.981 *0.984 *1
ρ < 0.001ρ < 0.001ρ < 0.001
Acidity−0.637 *0.964 *0.971 *0.973 *1
ρ < 0.001ρ < 0.001ρ < 0.001ρ < 0.001
Note: * Correlation is significant at the 0.01 level (2-tailed).
Table 3. Conversion factor (f) calculated using TDS and acidity for the analyzed water; CE in mScm−1; sulfate in gL−1; acidity in gL−1 CaCO3.
Orange Class f = 2.5
pHCESulfateAcidity
Median30.5640.2100.143
Range[3.0–4.0][0.412–0.872][0.153–0.247][0.096–0.173]
Green Class f = 2.7
pHCESulfateAcidity
Median31.3020.5530.325
Range[3.0–4.0][1.091–1.565][0.380–0.731][0.113–0.525]
Blue Class f = 2.1
pHCESulfateAcidity
Median32.2361.0340.754
Range[2.0–3.0][1.751–3.291][0.762–1.969][0.406–1.605]
Yellow Class f = 3.3
pHCESulfateAcidity
Median33.9482.6751.500
Range[3.0–5.0][3.848–4.189][2.255–3.265][1.360–1.560]
Brown Class f = 2.3
pHCESulfateAcidity
Median34.5793.3241.954
Range[2.0–5.0][3.856–6.330][2.244–5.152][1.405–4.305]
Dark green Class f = 2.9
pHCESulfateAcidity
Median2.38.3066.1584.128
Range[2.0–3.0][6.330–9.298][4.742–10.399][2.080–7.935]
Red Class f = 1.5
pHCESulfateAcidity
Median1.321.830107.962102.700
Range[0.4–2.5][11.320–43.710][24.075–410.601][24.438–429.250]
Disclaimer/Publisher’s Note: The statements, opinions and data contained in all publications are solely those of the individual author(s) and contributor(s) and not of MDPI and/or the editor(s). MDPI and/or the editor(s) disclaim responsibility for any injury to people or property resulting from any ideas, methods, instructions or products referred to in the content.