1. Introduction
The major task of water distribution networks (WDNs) is to reliably supply water in sufficient quantity and quality with the most efficient utilization of financial funds (i.e., minimum costs) at the same time [
1]. While the reliability of a WDN can be interpreted as the probability that it operates in a satisfactory state under normal conditions, the resilience of a WDN indicates the system reserve under unexpected and critical conditions [
2]. The oversizing of capacities favors resilience, but at the same time, it is costly, and the water quality performance due to stagnation is negatively impacted [
3].
Further, such systems are usually grown over decades and have an organic and complex structure [
4]. The complex hydraulic interactions of different components is no trivial problem to solve.
Due to the complexity in design and operation of WDNs, and to ensure a reliable and resilient level of service with minimum costs at the same time, multi-objective design approaches are used which are usually solved with evolutionary algorithms [
5]. These approaches are well investigated and described in the literature [
6,
7]. However, research on real all-pipe models is rare in this regard due to the large decision space, as for large WDNs the decision space increases exponentially. When considering multiple objectives (e.g., resilience, costs, and water quality) for complex, large (real) WDNs with several thousand decision variables, evolutionary algorithms are practically infeasible to apply due to the limitations in computation time. However, due to data availability (geographic information system and digital twins), the trend in modeling is going towards all-pipe models. Therefore, there is a need for fast approximations for solving such multi-objective design problems.
The topology of WDNs can be modeled as mathematical graphs. With complex network analysis (CNA), such mathematical graphs can be analyzed very computationally for efficiency, and therefore, such approaches are especially suitable for analyzing large spatial transport networks [
8,
9,
10,
11,
12,
13]. Recently, based on CNA, a highly efficient approach for the Pareto-optimal design (i.e., minimizing costs and maximizing resilience) of WDNs was developed [
14]. Based on topological features and a customized graph measure for the demand distribution (demand edge betweenness centrality), a graph-based multi-objective design approach was developed, which outperformed the results of an evolutionary algorithm in some areas of the Pareto-front regarding the quality of solutions and especially computation time (factor 10
5 faster). That approach is particularly suitable to solve problems with an extremely large decision space in acceptable time [
14]. However, when comparing the design solutions from the graph-based optimization with those from evolutionary algorithm, for design solutions with a high level of resilience, the graph-based method is outperformed. However, in that region of the Pareto-front (high resilience and high costs), water quality issues arise due to the low flow velocities. But water quality analysis is even more computationally intensive for large-scale WDN. Recently, based on CNA, a highly efficient surrogate method for assessing water quality in large WDNs was developed (2.4 × 10
5 times faster than extended period simulation Epanet2) [
15]. Therein, the edges in the graph of the WDS are weighted based on the residence time in the pipes. Based on shortest path analysis, pattern correction, and topological correction functions (network dispersion), good estimates for nodal water age values were obtained.
In this paper, the approaches based on CNA, the (1) two-objective optimization model [
14] including a hybrid approach for considering topography in graph designs [
16] and (2) the graph-based water quality model [
15], are combined in a novel graph framework for the optimization of WDNs, which is especially suitable for complex, large (real) WDNs. Pareto-optimal design solutions (minimum costs versus maximum resilience) are evaluated regarding the exceedance of a threshold for water age. Therewith, technically unsuitable solutions are excluded from the Pareto-front. For a toy example, the three different approaches are presented in detail, including the applicability of combining these very computationally efficient, novel approaches. The applicability of this very computationally efficient, novel approach is shown on real case studies with 4000 decision variables for which the results can be obtained within only few seconds of computation time.
2. Materials and Methods
In this work, a graph-based approach is used (
Section 2.1) for optimizing WDNs with two contradicting objectives: minimal costs versus maximum resilience. The approach involves identifying a Pareto-front of optimal design solutions, solely considering network topology and demand distribution, which allows for a trade-off between the two objectives. However, especially for least-cost designs, the topography (i.e., the height difference between sources and sinks) plays an important role. Therefore, a hybrid approach is implemented (
Section 2.2), which identifies pressure deficits based on hydraulic simulations and modifies the graph measures in order to obtain designs that fulfill minimal pressure requirements. Subsequently, using a graph-based water quality approach (
Section 2.3), design solutions are identified that exceed a water quality threshold, specifically the maximum water age. This approach allows the evaluation of the quality of the design solutions obtained from the Pareto-front and selects those that meet the water quality requirements. The graph-based procedures are step-by-step shown on a small toy example, and the applicability to a large real case study is shown. Finally, the obtained solutions for the large case study are compared with design solution based on an evolutionary algorithm [
17] for which extended period simulations with Epanet2 for water quality assessment are performed to exclude infeasible solutions from a water quality perspective.
2.1. Graph-Based Multi-Objective Design with Demand Edge Betweenness Centrality
A WDN can be modeled as mathematical graph, which can be analyzed computationally for efficiency with CNA. A graph consists of a set of vertices (e.g., nodes), which can be interlinked with links (e.g., pipes). The adjacency matrix, which is a symmetric matrix of the number of nodes, describes if there is a link between two vertices. If there is a connection between vertices i and j, the matrix element aij = 1, otherwise aij = 0. Each link/edge k in the graph can have a weight wk. Often unweighted graphs (wk = 1) or the Euclidean distance (i.e., pipe length Lk) is used. But also, other weights can be used, e.g., mimicking hydraulic or water quality behavior, such as friction losses or residence time in an edge.
The shortest path, σi,j, is the path between two vertices, i and j, where the path length (i.e., the sum of edge weights) is minimal.
The edge betweenness centrality (EBC) of a graph counts how often an edge is part of σ
i,j when connecting all possible node pairs. For a WDN, each node has to be connected to at least one source node, therefore counting the shortest paths of σ
S,j from all the demand nodes to the source node S can be an indicator for required transport capacity [
18]. However, instead of simply counting the number of shortest paths going through an edge, the nodal demand d
j can be used to weigh the EBC counts along σ
S,j. This then gives an estimate of ideal/design flows. This customized EBC measure is denoted ‘demand edge betweenness centrality’ (EBC
Q) [
14].
When EBCQ is used for the design of a WDN, only the pipe length Lk is available as edge weight, as no other hydraulic characteristics are known before the design process. When we consider all edges, which are part of a shortest path from all demand nodes to a source node (all edges with EBCQ > 0), this set of edges is called the shortest path tree, and the remaining elements are the co-tree.
In
Figure 1, for the toy example, EBC
Q values are determined. Based on the EBC
Q values, the diameters (DN
k) for each pipe (k) can be determined with a continuity equation, a flow velocity (v
design), and commercially available diameter classes (DN
available):
Sitzenfrei, Wang, Kapelan, and Savić [
14] showed, that the when considering different values for v
design in the described design process, Pareto-optimal design solutions can be obtained (minimal pipe costs versus maximum resilience according to [
19]), which partly outperforms designs from optimization with an evolutionary algorithm. For the proposed CNA design procedure itself, no hydraulic simulations are required, only to check the pressure threshold afterwards (e.g., minimal pressure of 30 m under design load), and a hydraulic simulation run is needed [
20].
Further, comparison of these design solutions to those obtained by evolutionary algorithms showed that a very relevant part of the Pareto front (around the knee bend) can be determined with the CNA approach. However, design solutions close to the least cost design cannot compete with those from evolutionary algorithms. The reason for that is that for the assessment of the performance of WDNs, there are more important parameters than just the network topology and the demand distribution. Specifically, the height differences between the sources and the demand nodes are of utmost importance when determining the least-cost design of a WDN. However, in classical graph-based approaches, only network topology is considered and solely CNA-based methods are not able to consider the topography.
2.2. Hybrid Demand Edge Betweenness Centrality and Least Cost Designs
To overcome the lack of design solutions close to the least-cost design, a hybrid approach was developed, where low-cost design solutions were evaluated with a hydraulic solver, and subsequently, the demand edge betweenness centrality distribution was iteratively altered for nodes with pressure deficits [
16].
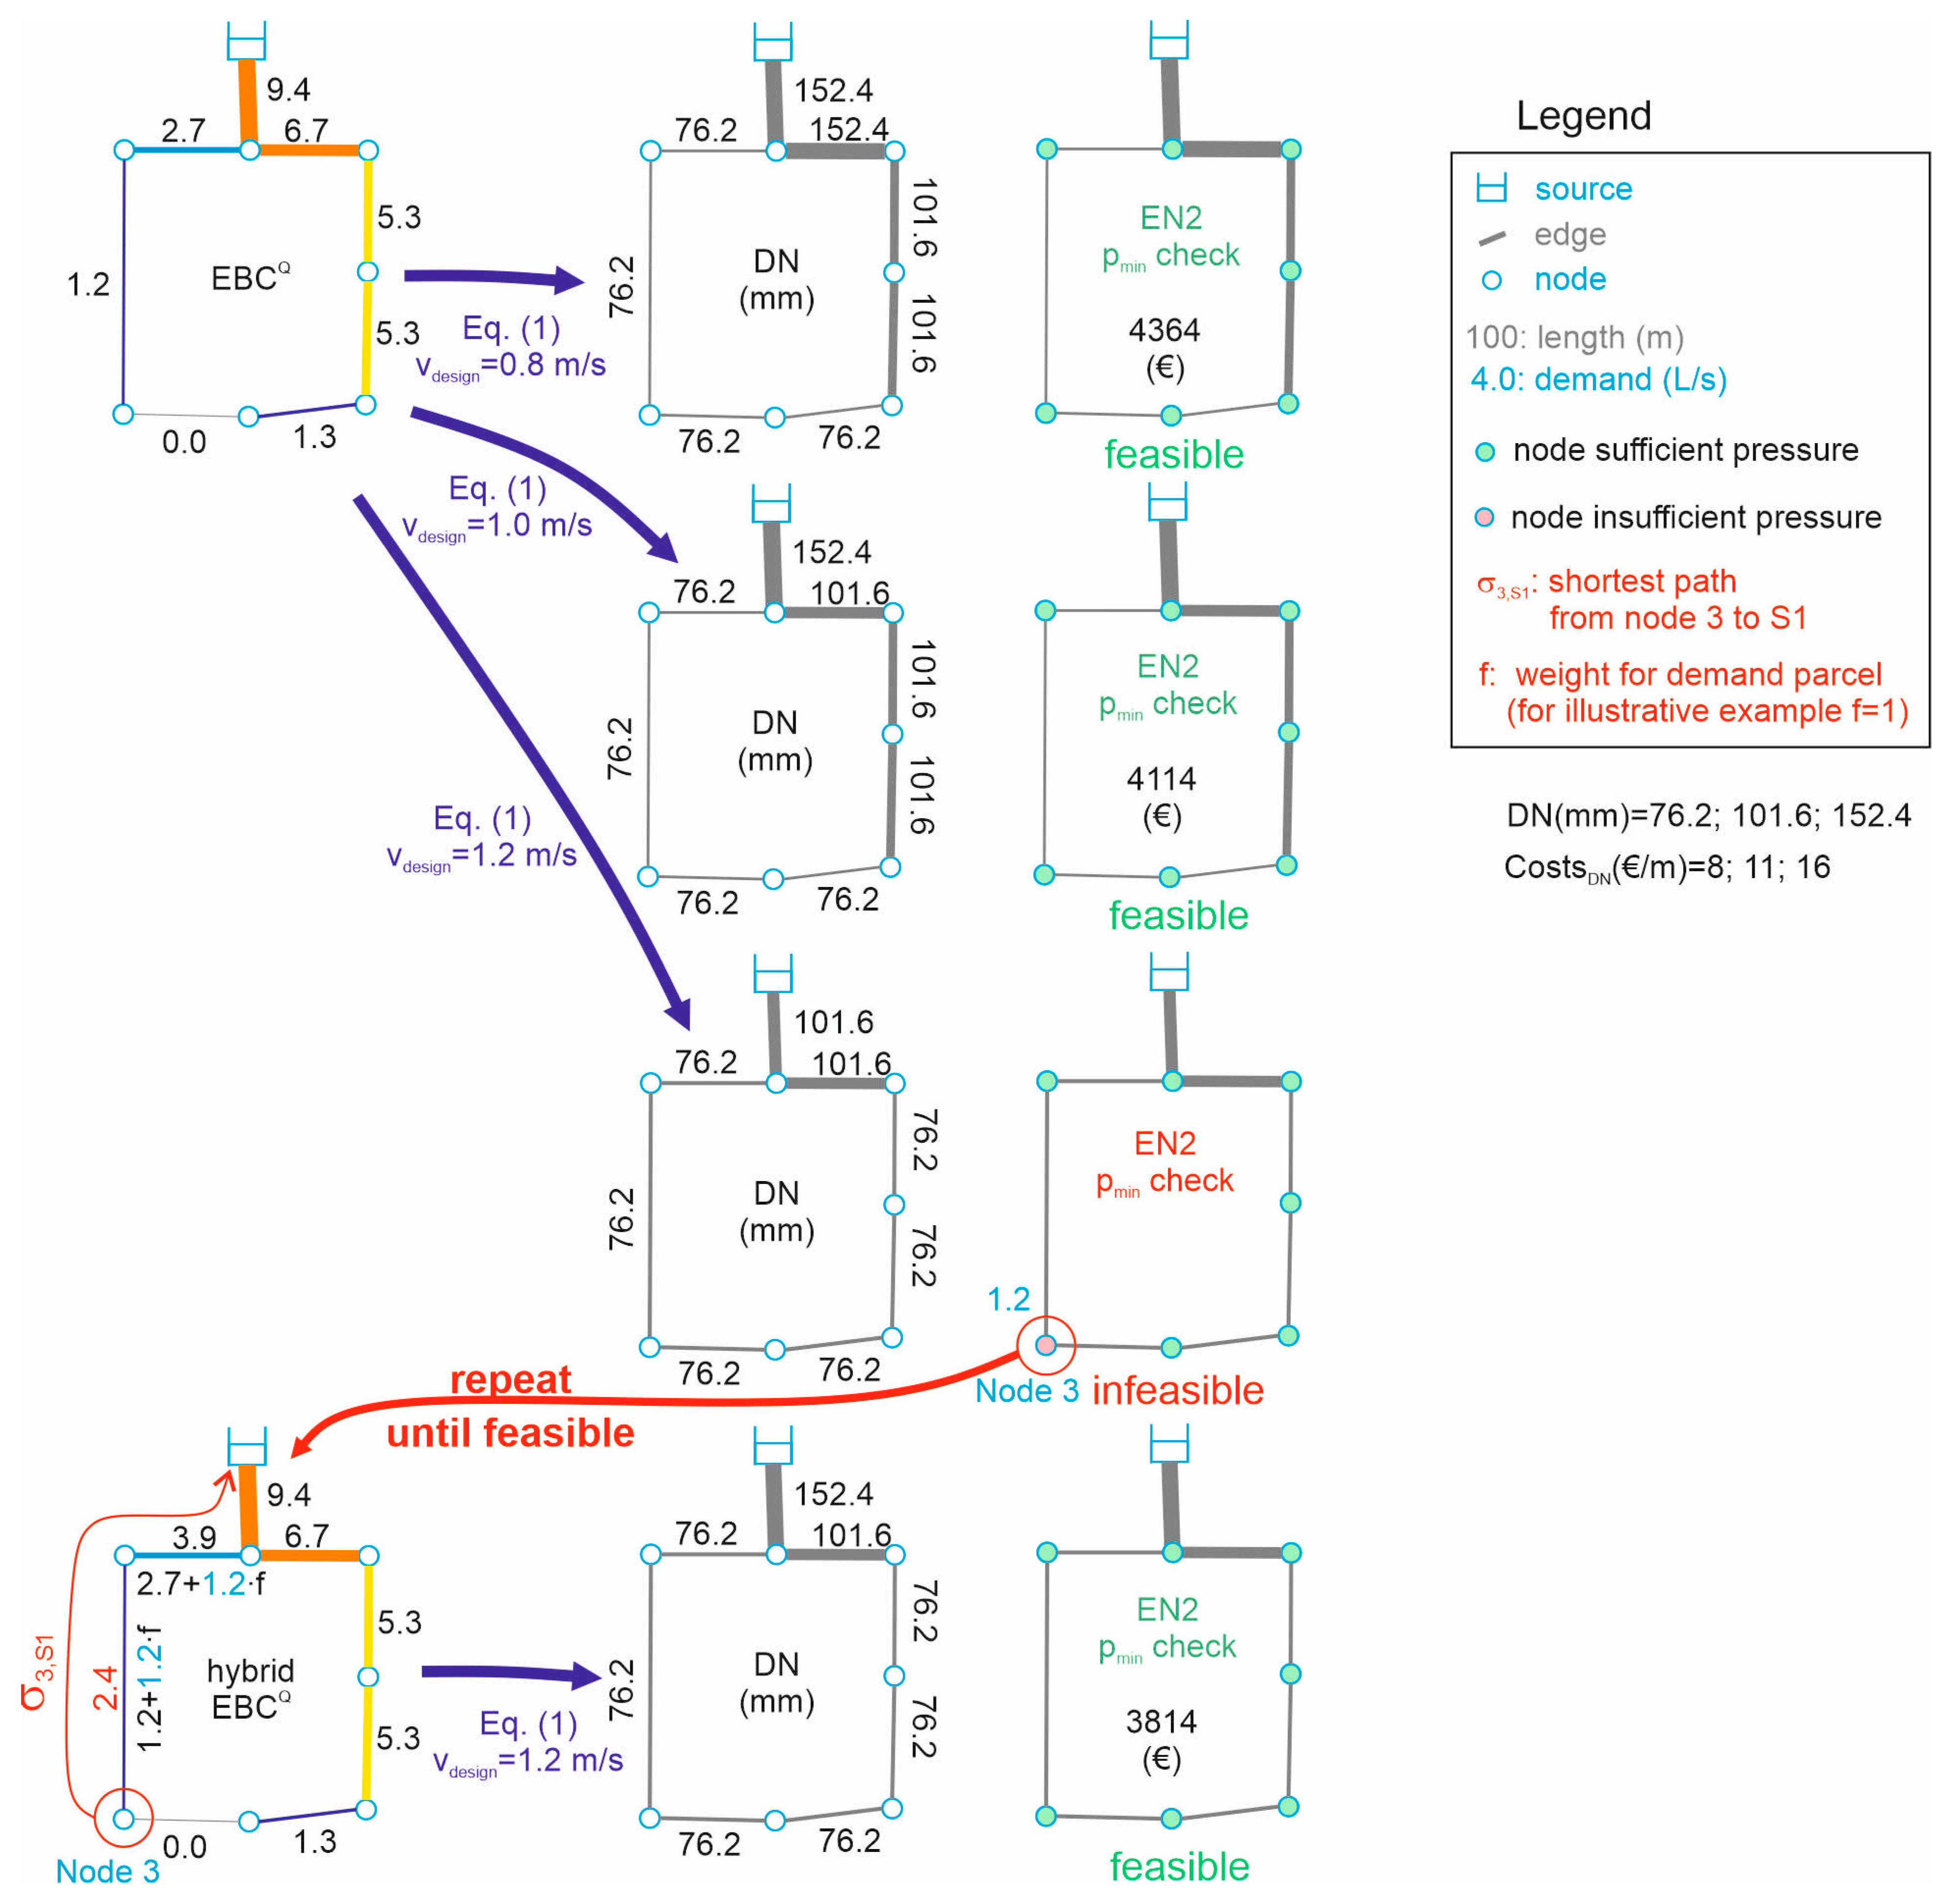
For the toy example, in
Figure 2, it is shown how to determine hybrid EBC
Q. The initial EBC
Q distribution is similar to
Figure 1. When now applying the continuity equation (Equation (1)) with a design velocity (v
design) of, e.g., 0.8 m/s, the required diameters can be determined. When using a set of available discrete pipe diameters (e.g., 76.2, 101.6, and 152.4 mm) and corresponding costs per one-meter pipe (EUR 8, 11, and 16/m), the diameters can be determined for all pipes (rounding up to the nearest available discrete diameter), and the total construction costs can be determined. For different values for v
design, the diameters can be determined, starting with the lowest v
design, it is then increased stepwise (0.8, 1.0, to 1.2 m/s). When the pressure distribution is checked with Epanet2 (EN2), pressure deficits can be determined (e.g., ≤30 m). If there are no pressure deficits, the design solution is technically feasible, and the next (higher) design velocity is evaluated. If there are pressure deficits present in that design, it is technically infeasible, subsequently these solutions are enhanced to meet the pressure criterion.
To improve the design solutions experiencing pressure deficits, the nodes with pressure deficits (e.g., node 3 in the toy example) are determined with Epanet2. This is followed by determining the shortest path to the closest source node (σ3,S1). Along that path, a fraction (f) of the demand of the node with pressure deficit is added to the EBCQ (i.e., 1.2 L/s in the example with f = 1) to (slightly) increase the flow capacity from the source to that node. The design procedure is repeated, and the pressures are determined again with the new (hybrid) EBCQ values. This procedure is repeated until there are no pressure deficits in the system. In the next step, the design velocity is further increased and, if necessary, pressure deficits are again addressed by iteratively using the proposed hybrid approach.
2.3. Water Quality Assessment with Complex Network Analysis
For water quality assessment with CNA, the shortest path analysis is used again [
15]. This time, as an edge weight, residence times in the edges are considered. The shortest paths can then be interpreted as minimal residence time of water during the transport from a source to a demand node (i.e., water age or travel time in the WDN). In order to avoid additional hydraulic simulations, the hydraulic simulation results from the resilience assessment (see
Section 2.1) with the design load (Q
design) are used. To account that, for water age simulation, the average demand load is decisive (Q
avg), the flow velocities from the resilience assessment are reduced by a factor (f
V) describing the ration between design and average demand (Q
avg = f
v Q
design). In principal, there could be changes in the flow regime with different load cases, but Sitzenfrei [
15] showed that for typical WDNs with that assumption, neglectable errors regarding the flow velocities are obtained.
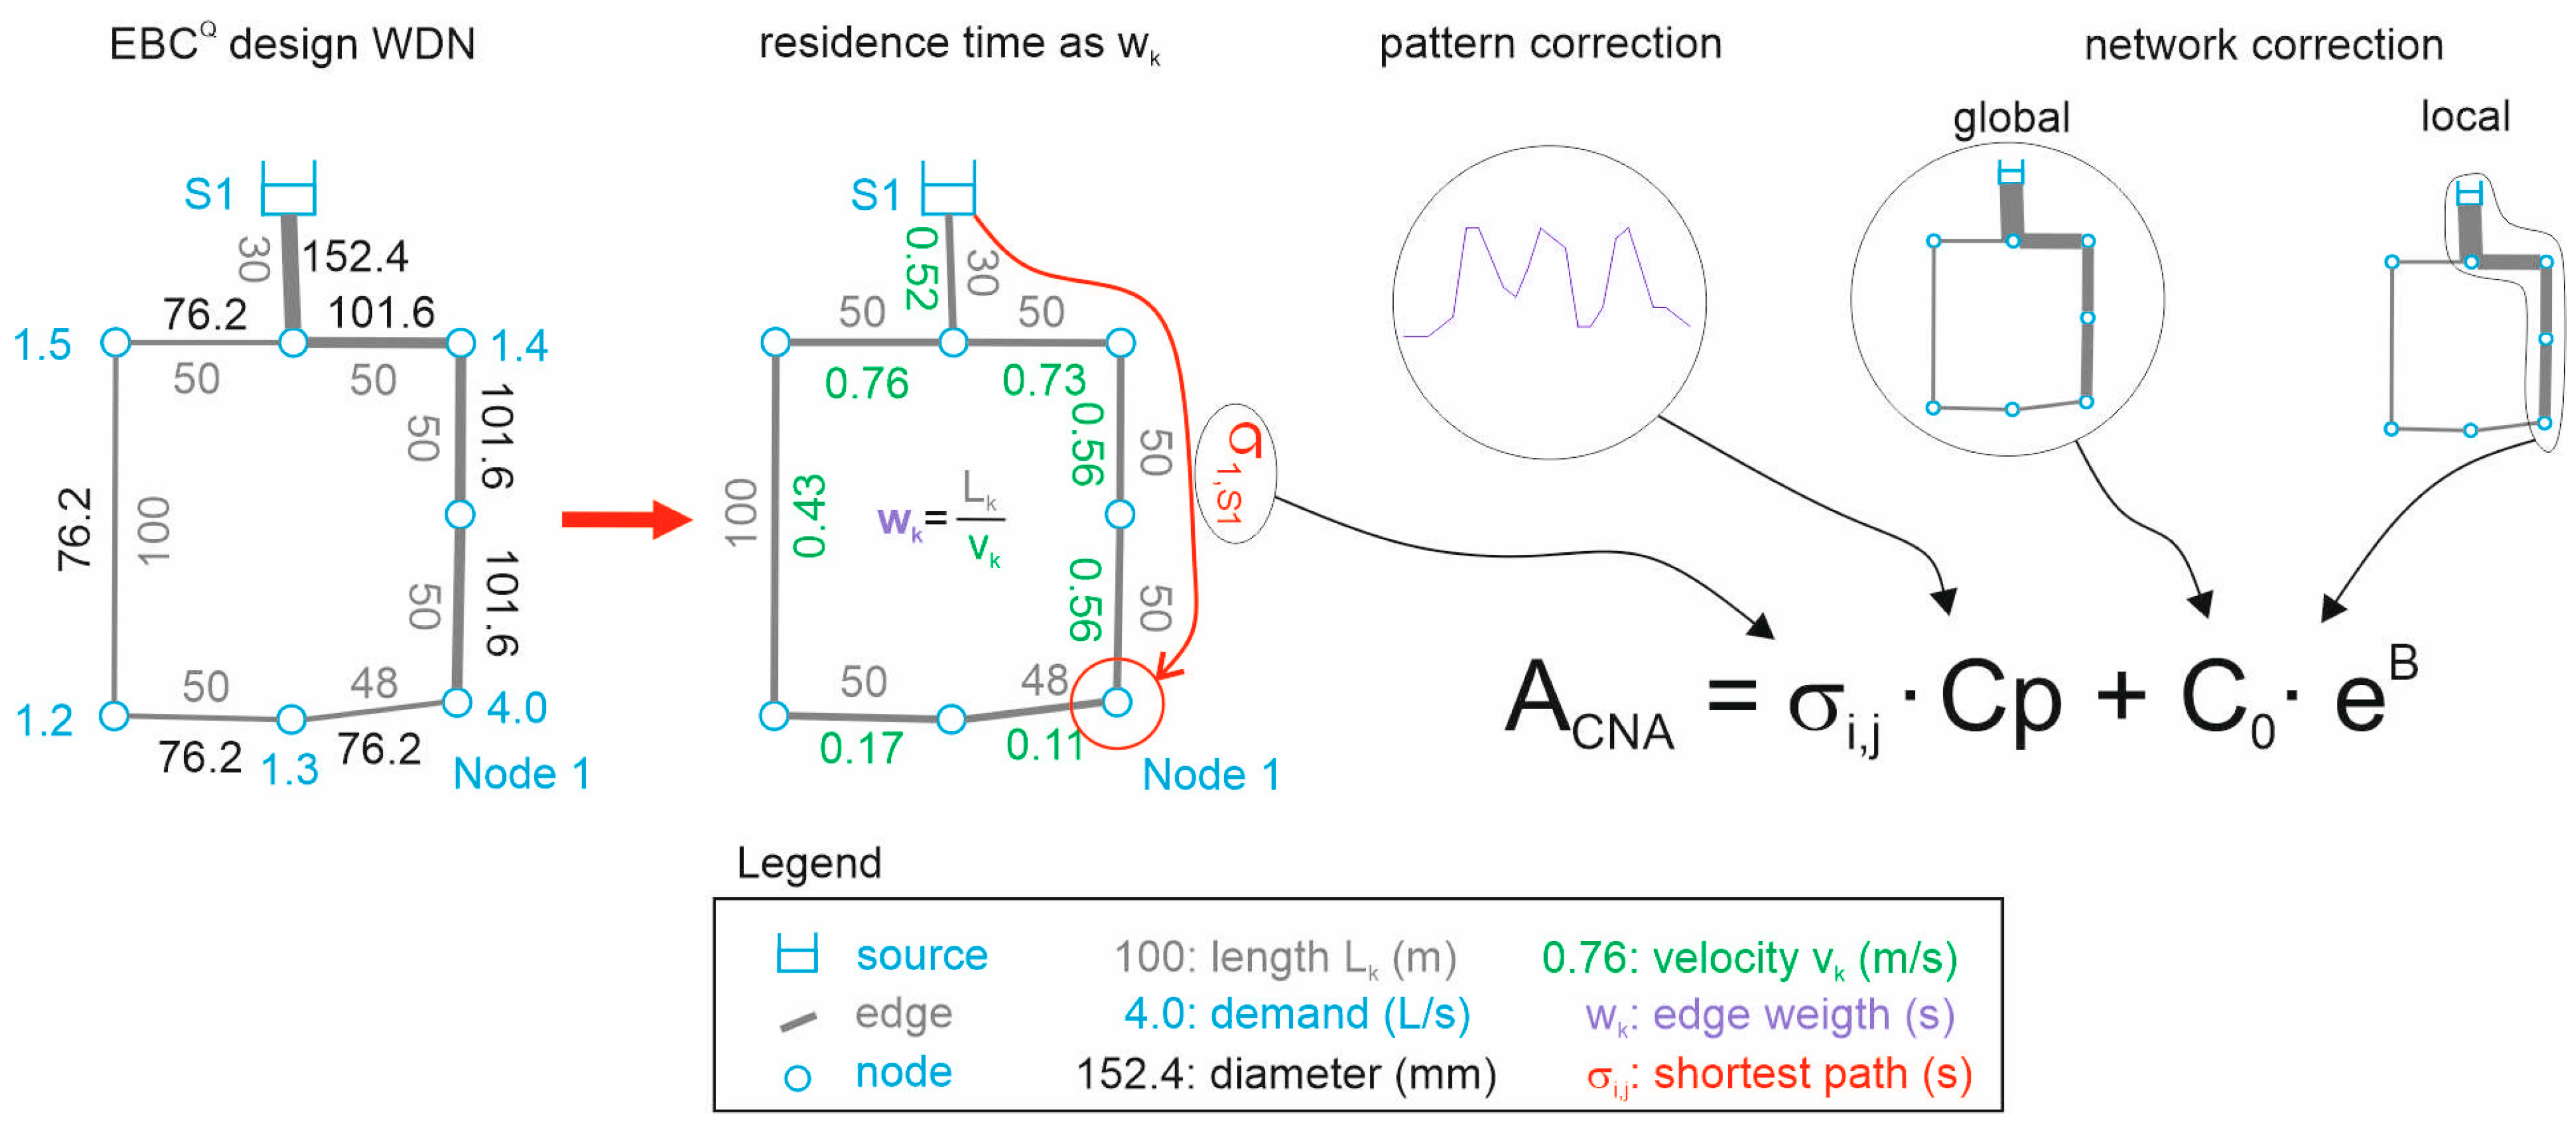
In
Figure 3, the concept of water quality assessment with CNA is shown and described in Equations (2)–(4). The determined values of σ
i,j for water age are basically similar to a hydraulic snapshot simulation, where only edges in the shortest path tree are considered in the model. To account for extended period simulations (i.e., 24 different hourly values for a diurnal demand pattern for multiple days), time consideration can be assumed in a simple way [
15], and a vector for pattern correction (C
p) can be determined based on the hourly pattern multipliers Cp
i (see Equation (3)).
It can be considered that the flow is not only in the shortest path tree, and corrections based on the network topology can be applied. For small WDNs, the so-called network dispersion is low, and good results can already be determined with C
0 = 0. However, with increasing network size, the network dispersion gets more important [
15] and should be calibrated with simulation results of water quality of the investigated network. As global network correction, the fraction of flow in the co-tree (alternative flow, 0 ≤ Q
alt ≤ 1) and the mean node degree (mD) of the WDN were identified to describe the global network dispersion [
15]. Q
alt is the sum of flows in edges outside the shortest path tree divided by the sum of flows in the shortest path tree. Q
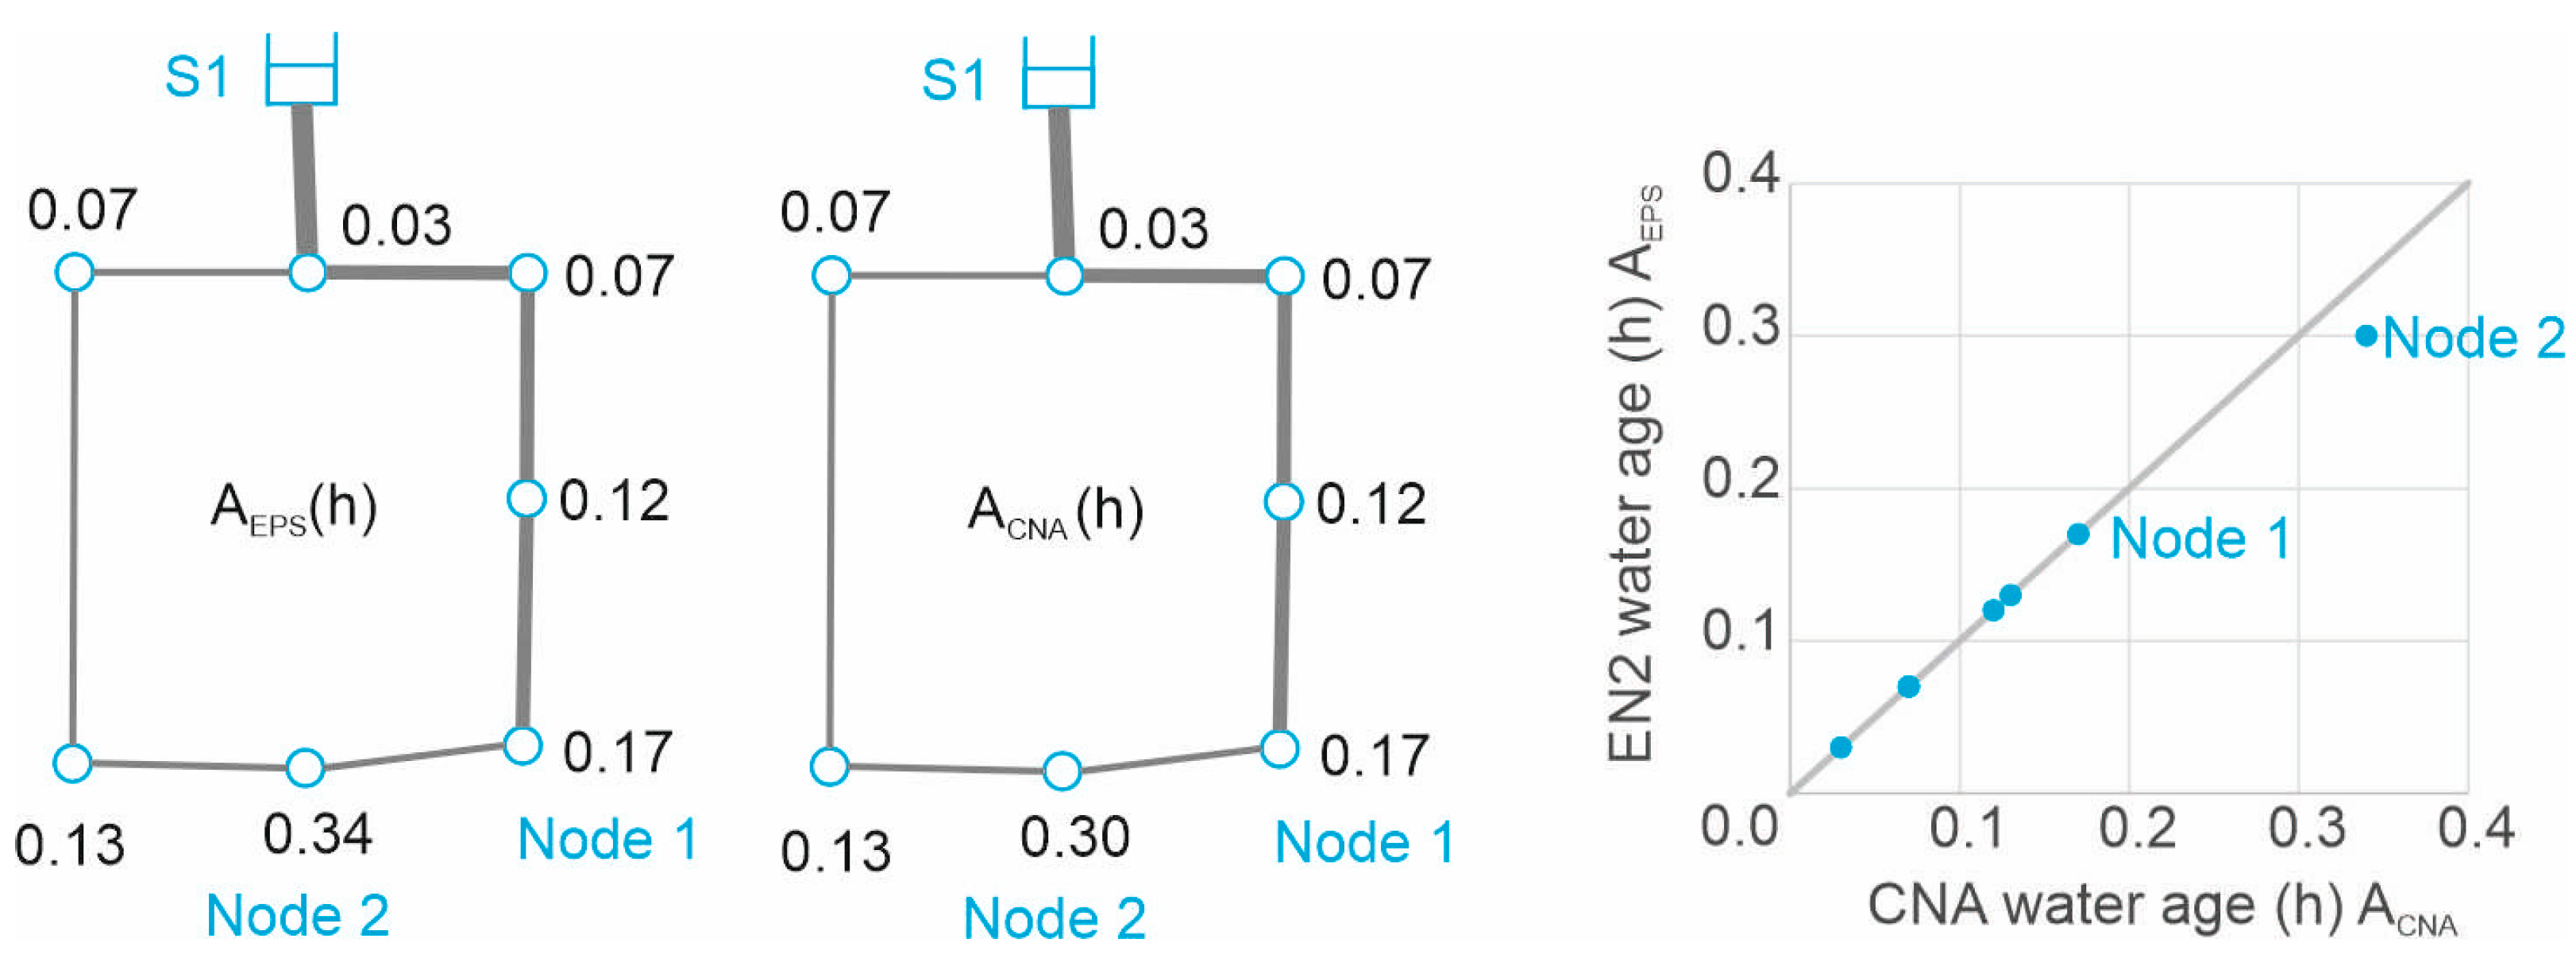
alt can also be determined based on hydraulic simulation results from the resilience assessment. For the toy example in
Figure 4, Q
alt can be determined with 0.026 (flow outside the shortest path tree 0.78 divided by the sum of all edge flows 30.34).
The node degree describes the number of edges connected to a node, and mD is the average number of edges connected to a node in the network. Hwang and Lansey [
21] evaluated 26 WDNs and determined an average mD of 2.44 and a standard deviation of ±0.38. Giustolisi et al. [
22] evaluated another set of 22 WDNs and determined an average mD of 2.27 and a standard deviation of ±0.12. For the toy example in
Figure 3, obtaining mD = 2 = (1 + 3 + 2 + 2 + 2 + 2 + 2 + 2)/8.
As local network correction, the flow lengths from the source to each demand node were determined (denoted mixL) and used. In the toy example in
Figure 3, mixL for Node 1 equals to 0.180 km. For an in-depth understanding, the number of mixing nodes in this flow paths were also investigated (denoted number mixing nodes) with CNA., e.g., for the toy example in
Figure 3, the number of mixing nodes along the shortest path (minimal residence time) in the flow path to Node 2 was 4.
Based on these different correction terms, from the shortest path values of σ
i,j the water age based on CNA can be determined (A
CNA).The entire procedure, systematic testing with hundreds of different designs and network topologies, and validation of the graph-based water quality model can be found in [
15]. For the toy example with f
V = 0.5, C
p = constant = 1 and C
0 = 0, the results of CNA for determining water quality are in
Figure 5, compared to an extended period simulation (1 h with 1 min water quality time step) with Epanet2 (A
EPS).
The computational efforts for assessment of water quality in a large WDN (4021 pipes and 3558 nodes) of the graph-based model was determined 4.2 × 10
−6 less than with an extended period simulation with Epanet2 [
15]. However, this computational efficiency can even be further enhanced because in the graph model of the water quality has not been determined for all nodes, e.g., often only a few nodes in the WDN are decisive for water quality problems. These decisive nodes could be determined before the optimization task (with the graph-based model or as a hybrid approach with extended period simulation with Epanet2) and, subsequently in the course of optimization, the water quality of only these decisive nodes can be determined with the graph model.
2.4. Case Study and Optimal Design Solutions
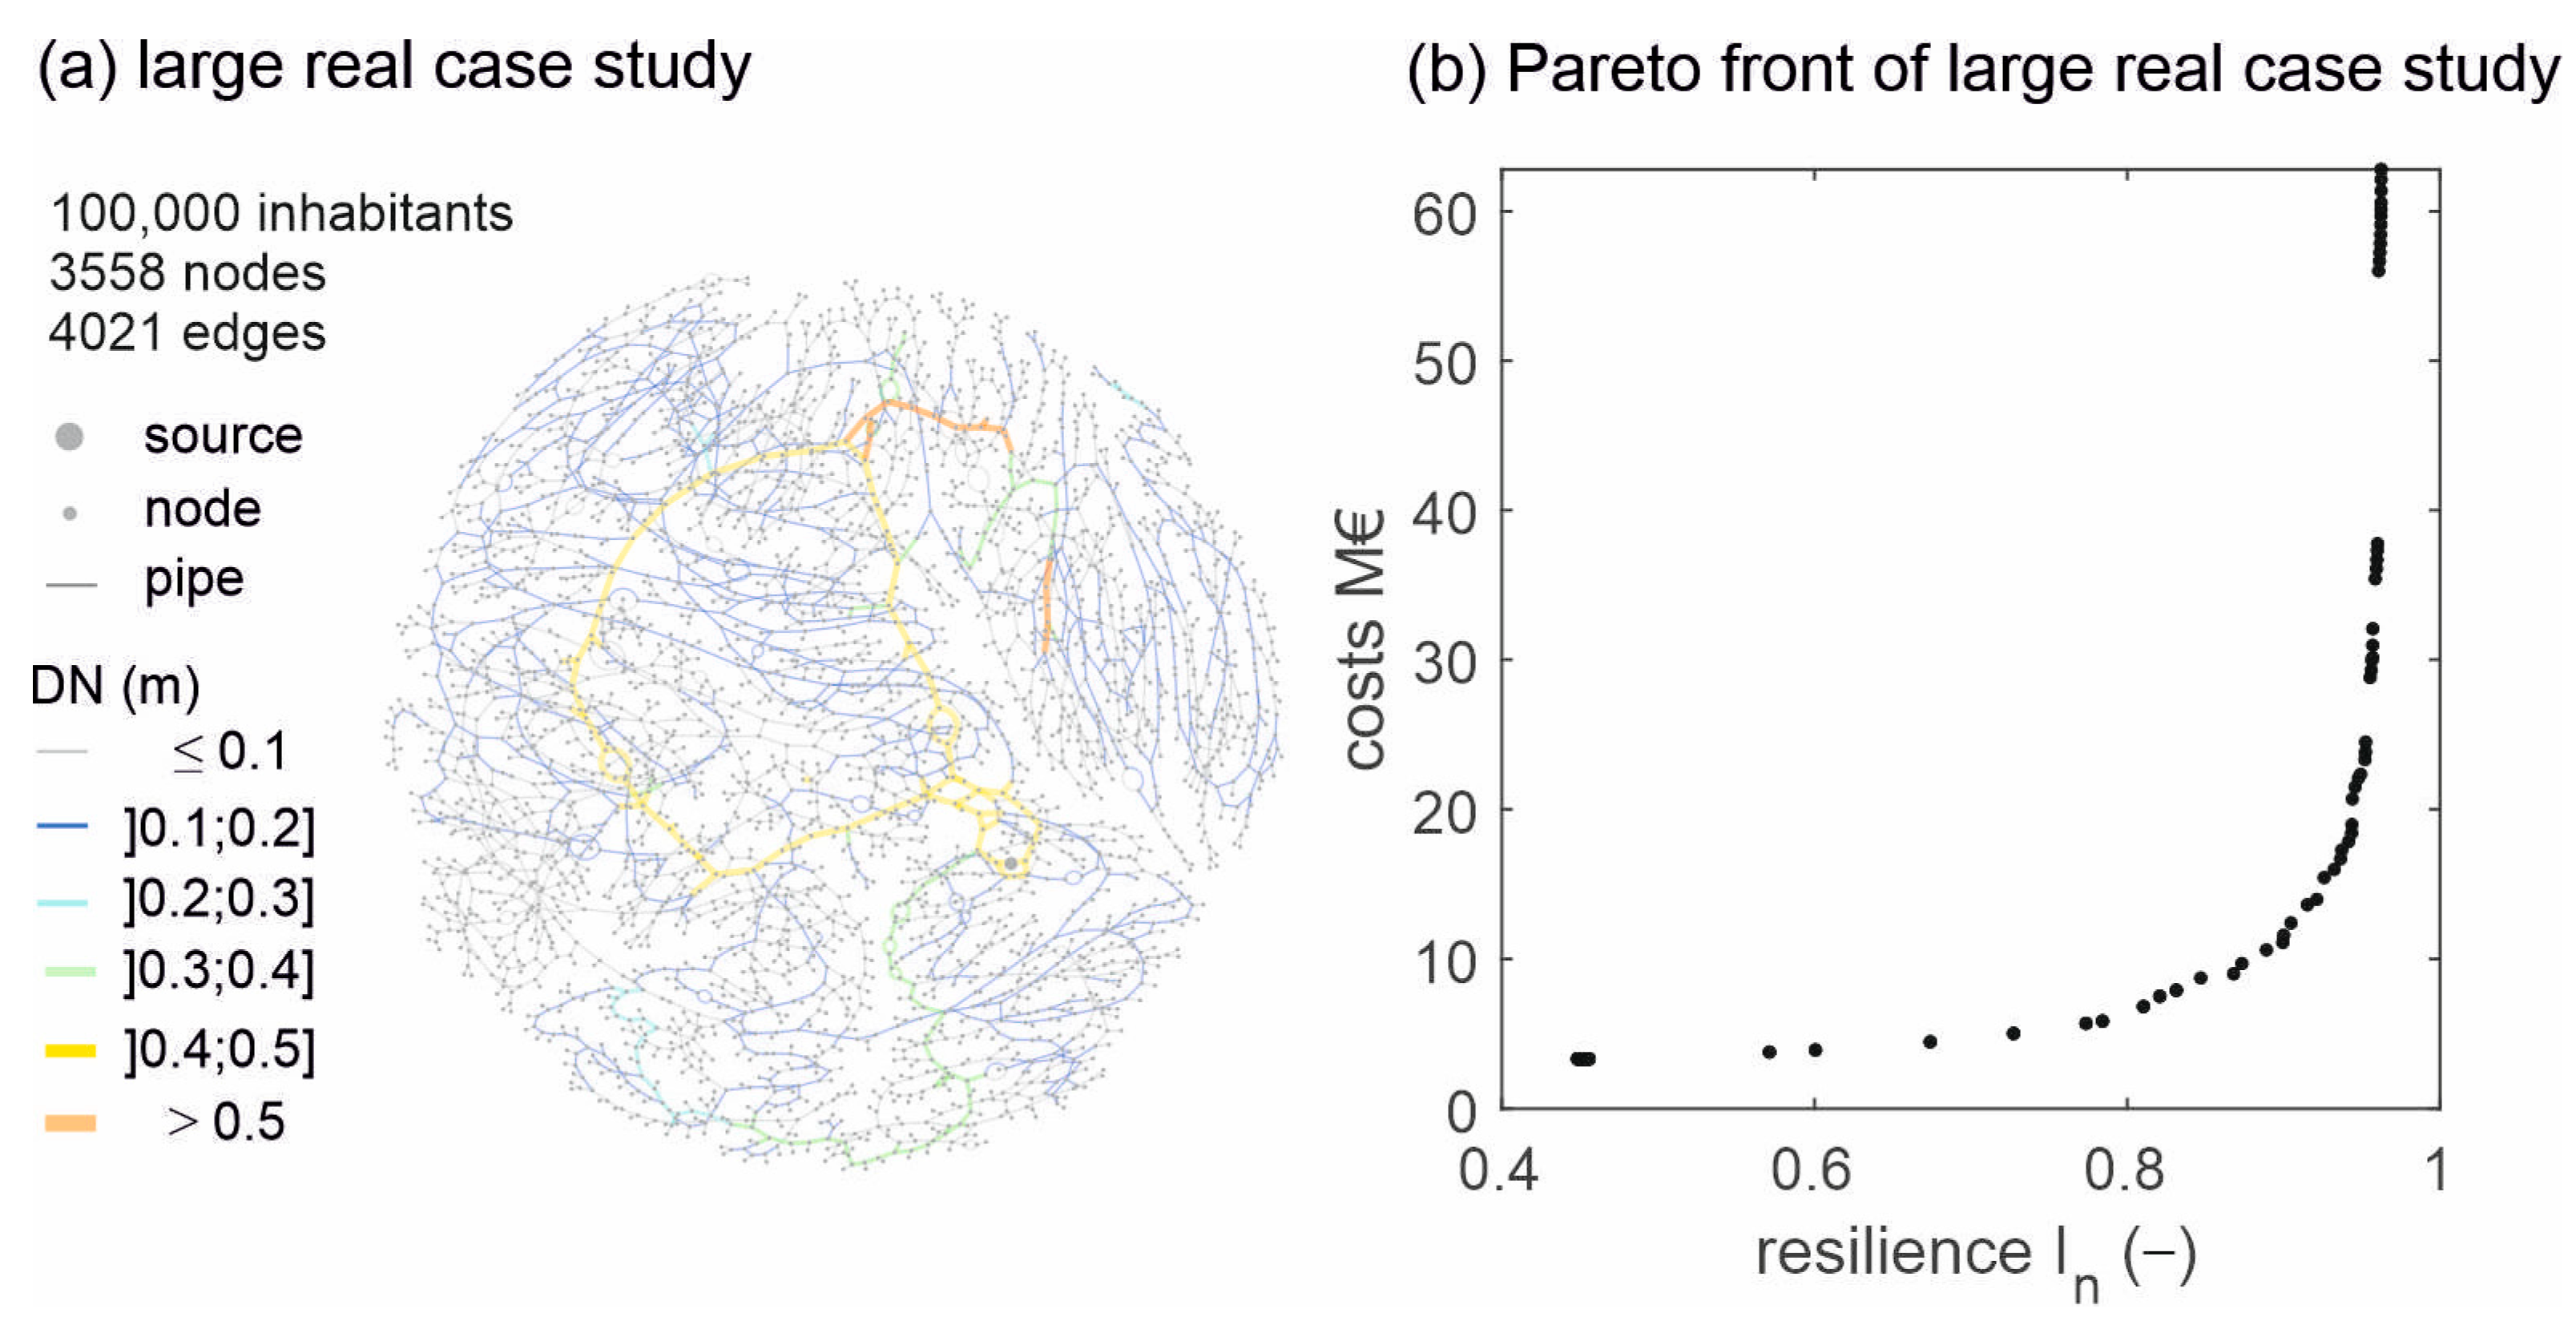
As a case study, a large real case from an Alpine area was used. Due to data protection issues, the real layout cannot be shown here. However, an anonymized layout is shown in
Figure 6. In the anonymization process, the hydraulics were fully preserved (same height differences and same pipe lengths), and only the visual representation was changed. The case study served approximately 100,000 inhabitants with one single source. The WDN model had 3558 nodes and 4021 edges, and therefore, decision variables. The mean node degree was 2.26 and according to Hwang and Lansey [
21], and the WDN was a distribution branch network with a branching index of 0.71 and an average diameter of 162.27 mm. The Pareto-front in
Figure 6b was taken from Sitzenfrei et al. [
23] and was determined GALAXY [
17] which is based on an state-of-the-art NSGA-II algorithm for two-objective design. A population size of 100 was used, and 300,000 generations were simulated (in total, 30 Mio number function evaluations (NFE)). The computation time on a desktop computer (Intel
® Core™ i5–6500 CPU @ 3.2 GHz, Mountain View, CA, USA) was 24 weeks.
For extended period simulations for water quality assessment in Epanet2, a water quality time step Δt = 1 min and a total simulation time of 10 days is used. Extended period simulations are performed for all design solutions obtained with EBCQ and hybrid EBCQ for comparison. To determine the impact of numerical dispersion, Δt is also varied between 60 min, 15 min, 5 min, and 1 min.
3. Results
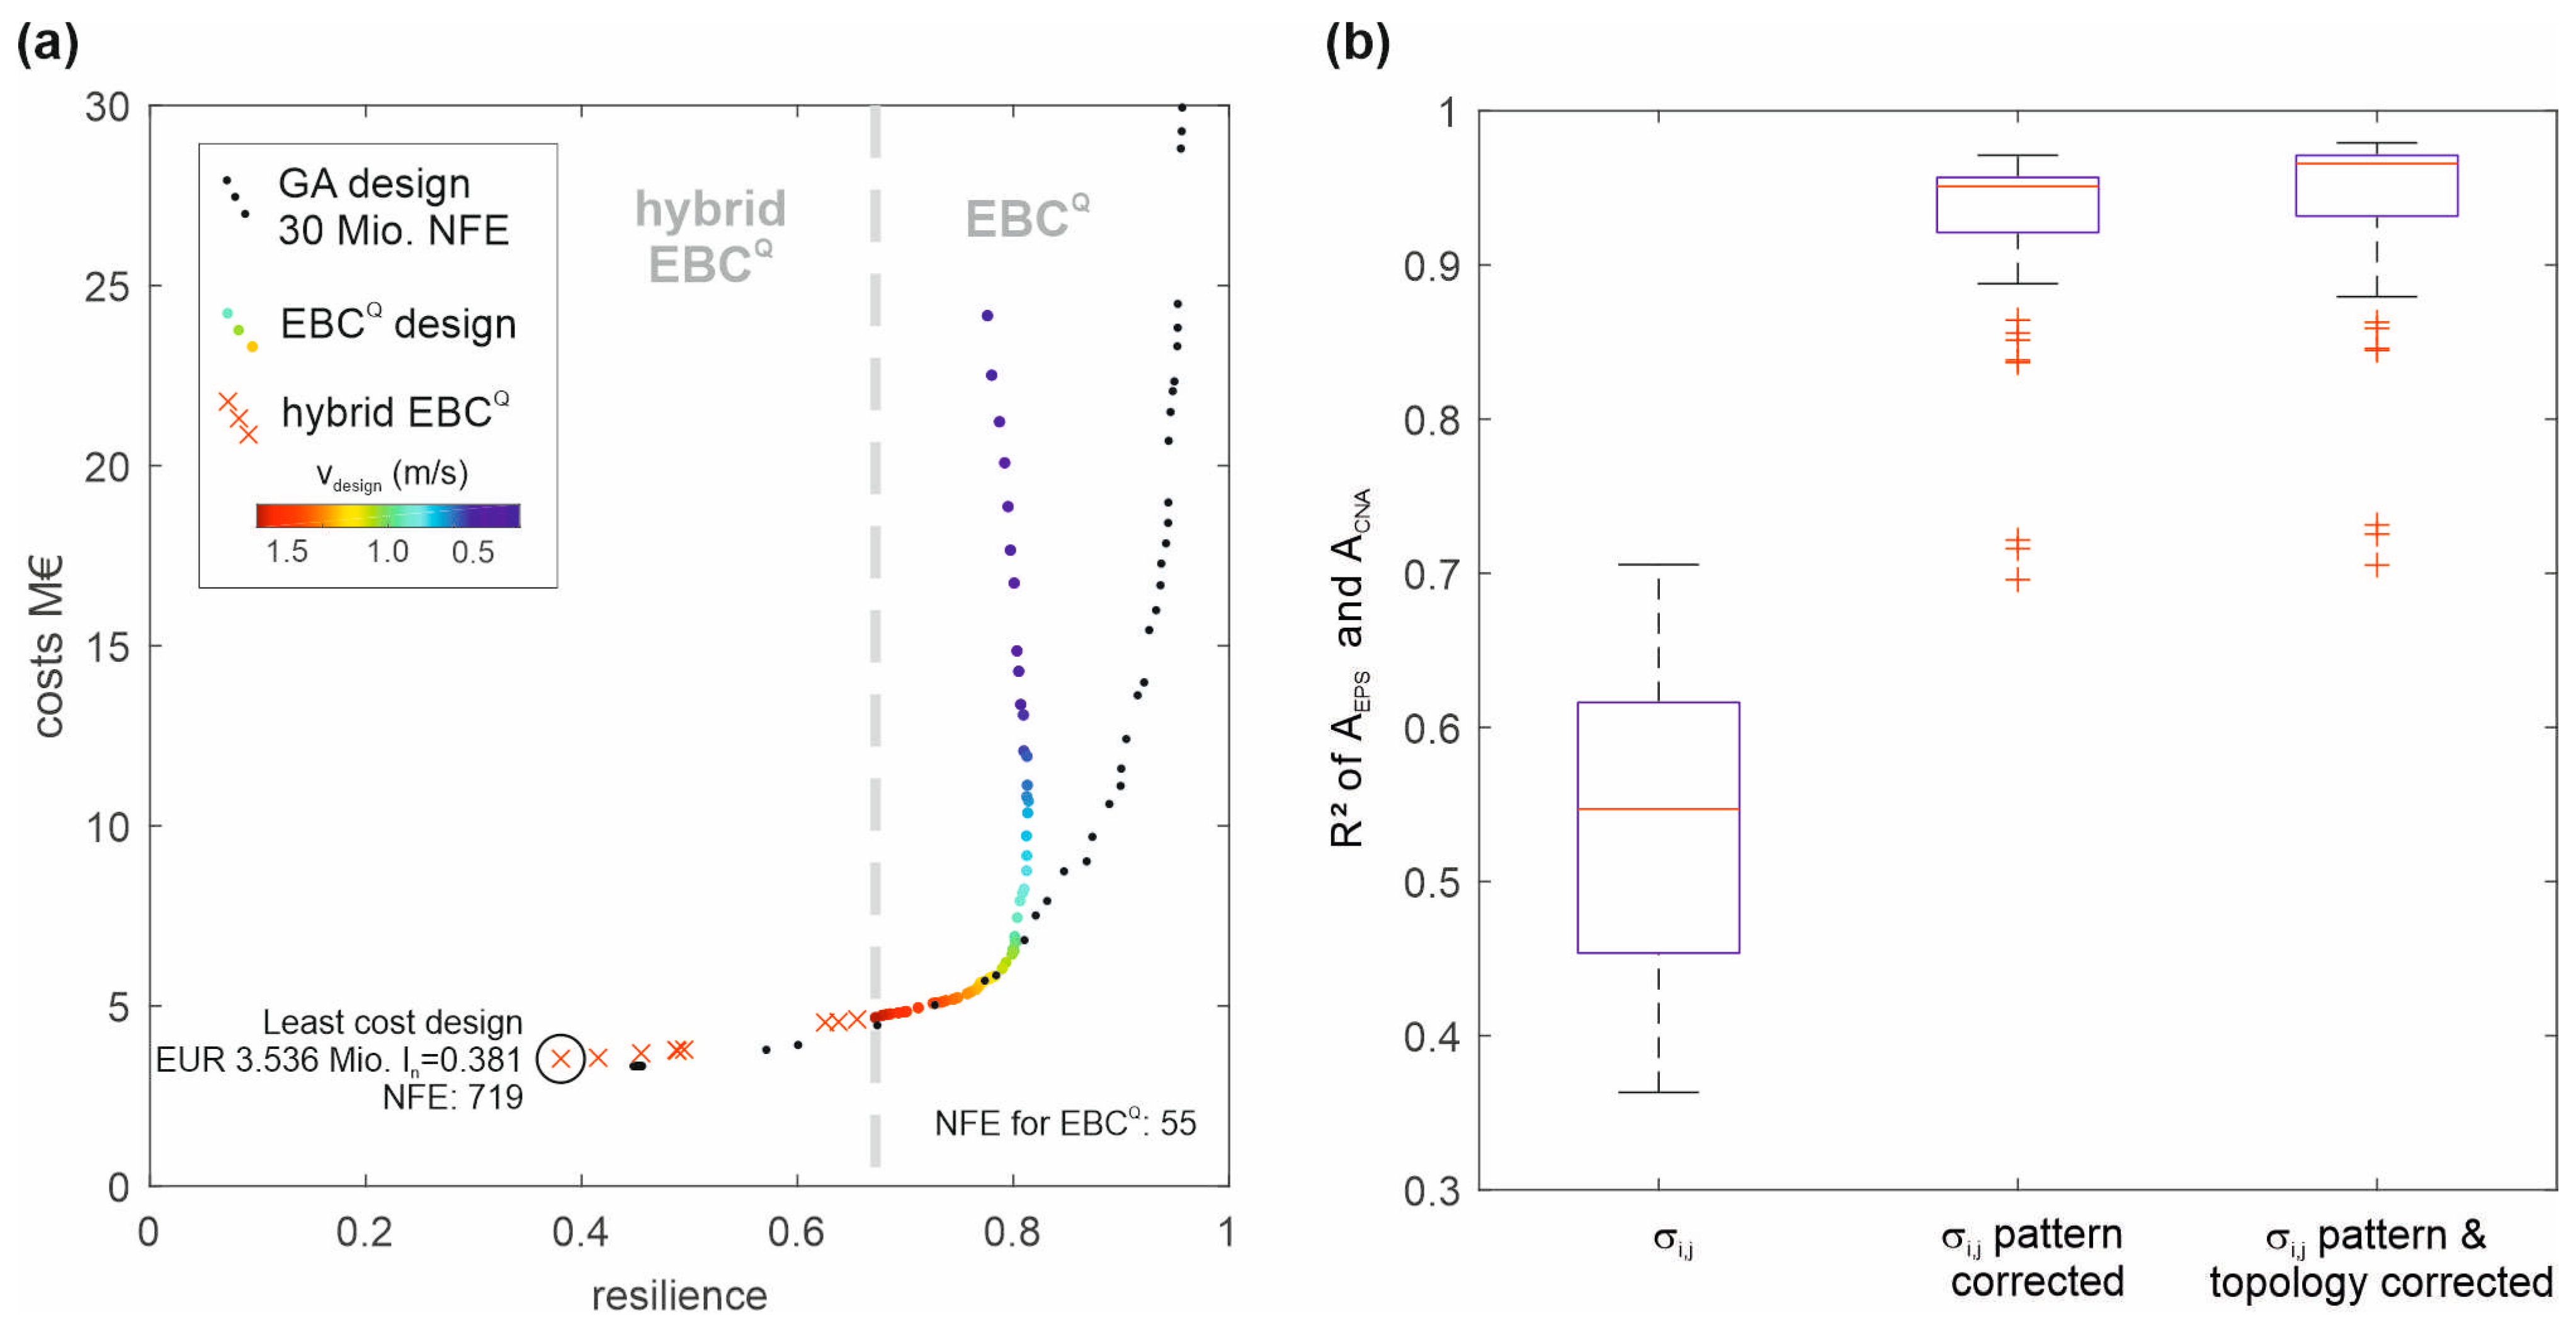
First, the design solutions from EBC
Q and hybrid EBC
Q design are compared with the design solutions obtained with GALAXY. For better visibility, the figure only shows the costs up to values of EUR 30 M, because the maximum cost provided by EBC
Q is around EUR 25 M, and as shown late on, design solutions with higher costs have insufficient water quality performance. In
Figure 7a, the colored dots are design solutions determined with EBC
Q. Design solutions from EBC
Q above EUR 10 M (v
design < 0.5 m/s) are dominated by design solutions with higher velocities. This is due to the fact that the resilience indicator used in this work not only considers hydraulic excess pressure but also the uniformity of diameters connected to a node [
19]. This basically favors solutions, where the same diameters are connected to one node. With another resilience indicator focusing on the hydraulic performance (e.g., [
2]), this effect would not be observed. However, solutions starting from EUR 10 M exceed water quality requirements, therefore investigations on this area of the Pareto-front are not intensified.
The design based on EBCQ produces solutions with the minimal resilience of 0.65. Solutions below that value are more and more driven by topography and less by topology. For obtaining the design solutions with EBCQ, for each design solution, one single hydraulic simulation run was required to determine the resilience value. Therefore, in total, 55 NFE (number of function evaluations) were required for that part of the Pareto-front. However, when comparing these results (especially the knee bend) with those obtained with the genetic algorithm (GA) with 30 Mio NFE, excellent results were obtained.
The hybrid EBCQ solutions produce design solutions with lower costs. However, more NFE were required due to the iterative nature of the procedure. For the first design solution (In = 0.6257, EUR 4.54 M), 3 additional NFE were required, while for the least-cost design (In = 0.3808, EUR 3.5363 M), 719 NFE were required in total. Although the results obtained with hybrid EBCQ in general improved the results of the CNA approach, the results obtained with the GA are still slightly better (but with tremendously more computational costs).
The accuracy of the graph-based water quality model for the different assessment steps is shown in
Figure 7b. Therein, the design solutions obtained with the graph-based design (EBC
Q and hybrid EBC
Q from
Figure 7a) are assessed with extended period simulation with Epanet2. The obtained water ages (A
EPS) are then compared with the results obtained with graph-based water quality analysis (A
CNA) by calculating the coefficient of determination (R
2). With the plain shortest path analysis (σ
i,j) with residence time as edge weights, useful solutions can be obtained (R
2 up to 0.71), but in median the results are less convincing (median R
2 = 0.55). However, by applying the pattern correction to σ
i,j, the results can be significantly improved (median R
2 = 0.95, maximum R
2 = 0.97). Furthermore, with the topology correction, the improvement is even more (median R
2 = 0.97, maximum R
2 = 0.98). Note that the investigated design solutions represent a wide range of different hydraulic designs with highly varying flow velocities, and the CNA based approach is capable to produce valuable results.
The proposed graph-based water quality model has the advantage of very fast execution time compared to extended period simulations (EPS) with Epanet2 but with less accuracy. In general, depending on the smallest network elements (pipes), the water quality time step Δt should be chosen in Epanet2. One could now argue, that a larger Δt could be used in order to also ensure a short computation time with a potentially acceptable loss of accuracy. Therefore, for one design solution from the EBCQ designs, the impact of Δt sizes was investigated. The potential loss of accuracy with a larger Δt, can be interpreted as numerical dispersion.
In
Figure 8a, the water ages obtained for different Δt (60 min, 15 min, 5 min, and 1 min) are presented. The boxplots represent the calculated nodal water ages based on all demand nodes in the system. One can see, how different sizes of Δt have an impact on the results of the water age simulations. However, the smallest nodal values for all solutions are close to zero, while there is a significant difference in the maximum water ages. Therefore, in
Figure 8b, the nodal water ages for the different sizes of Δt are evaluated depending on the number of mixing nodes from the source to the demand nodes. In Epanet2, at each node, the inflows are flow weighted averaged. If there is a water age between two specific time steps, the next larger water age is used based on Δt. The maximum number of mixing nodes in the investigated WDN is 51, meaning for the furthest distant node, a water parcel in σ
i,j with the shortest residence time passes through 51 nodes, where it is potentially mixed with flows from the co-tree. Due to the rounding up to the next Δt, the water age is usually overestimated with increasing Δt. That effect is clearly shown in
Figure 8b, where the x-axis represents the number of mixing nodes for reaching each demand and on the y-axis, with the ΔAge (h)—which is different between the current A
EPS (Δt > 1 min) and A
EPS determined with Δt = 1 min. For each Δt, the slope k of the linear regression is shown. For example, with Δt = 1 h, an average of 1.72 h is additionally added for each mixing node. For the case study, the over-estimation of water age for 1 h of water quality time step is up to approximately 100 h, 15 min up to 20 h, and for 5 min up to 7 h, respectively. This analysis highlights the importance of using a small enough Δt for water quality analysis with Epanet2. Furthermore, it demonstrates that with larger Δt values, only partly usable results are obtained.
In
Table 1, for one design solution from the EBC
Q design (see also
Figure 8a), the statistical differences in nodal water age and the computation times are shown. The graph-based method has by far the shortest computation time, and compared to the results with Δt = 1 min, the best accuracy of the solution (median difference −0.19 h).
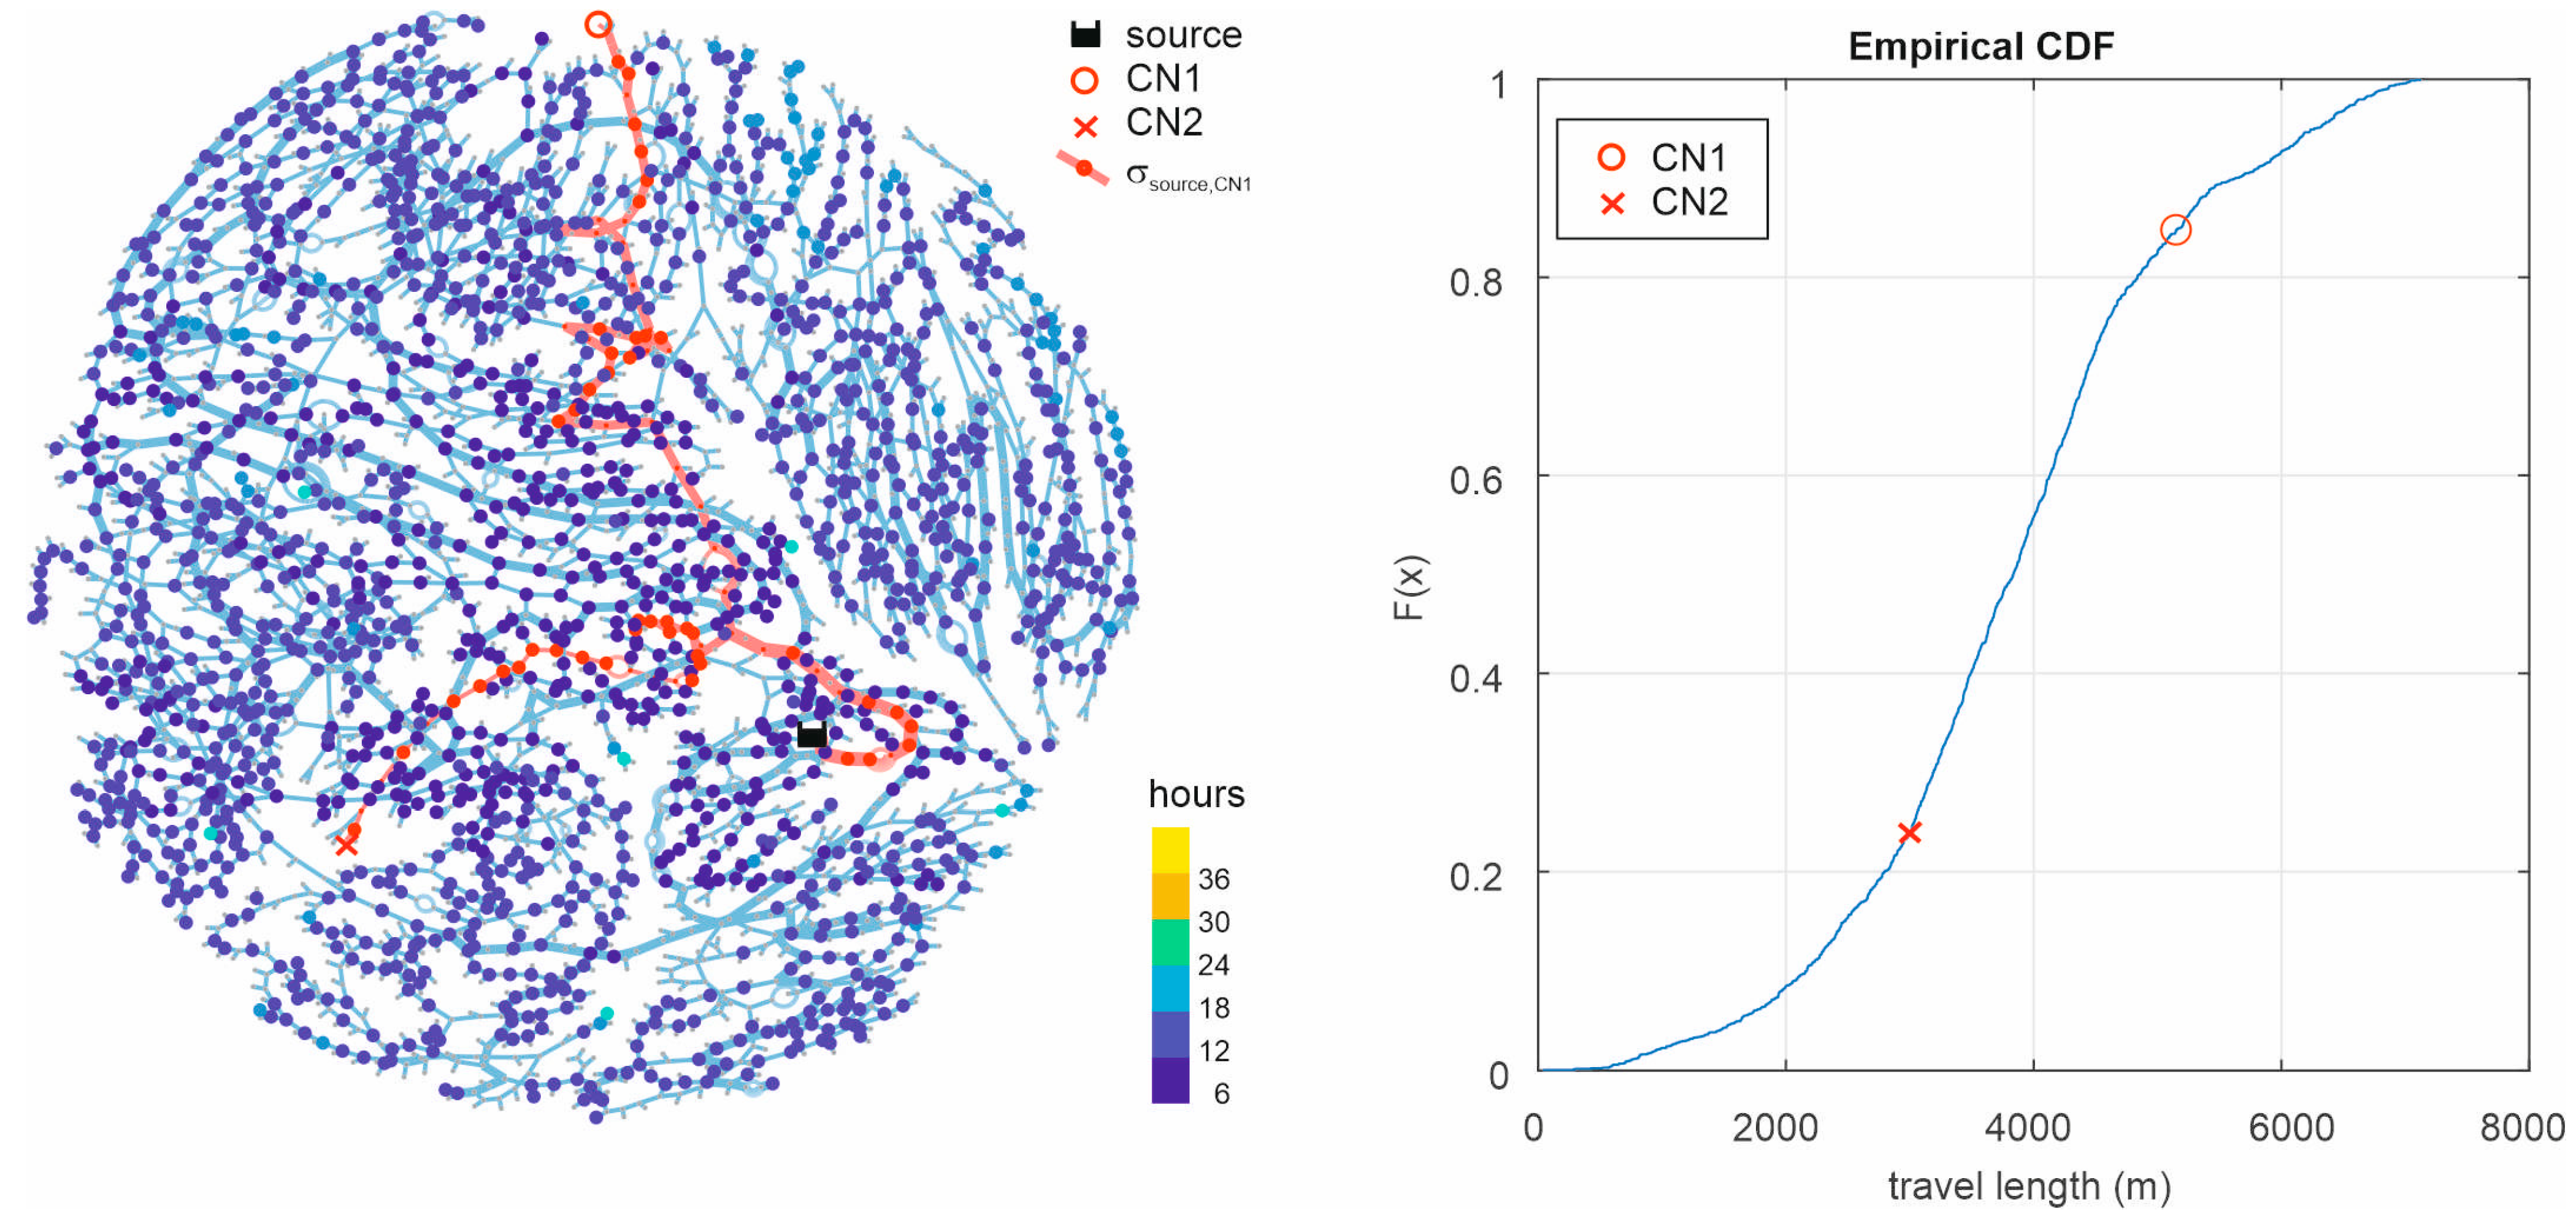
As outlined before, a further advantage of the graph-based approach is that only the water quality of a few nodes can be determined, avoiding even more computational efforts. Therefore, the decisive nodes for water quality performance are determined. This can be done with extended period simulation with Epanet2 or the graph-based model. The two controlling nodes (CN1 and CN2) are determined with a threshold of a water age exceeding 36 h with A
CNA. In the left of
Figure 9, the flow paths of CN1 and CN2 from the source are highlighted in red. In the right of
Figure 9, the cumulative distribution function of all travel path lengths is presented, ranging from 0 m to 7480 m; however, the two controlling nodes CN1 and CN2 have significantly less travel path length than the maximum path length, namely 5150 m and 3010 m, respectively (red markers in the right of
Figure 9). This underpins the importance of considering the actual flow regime.
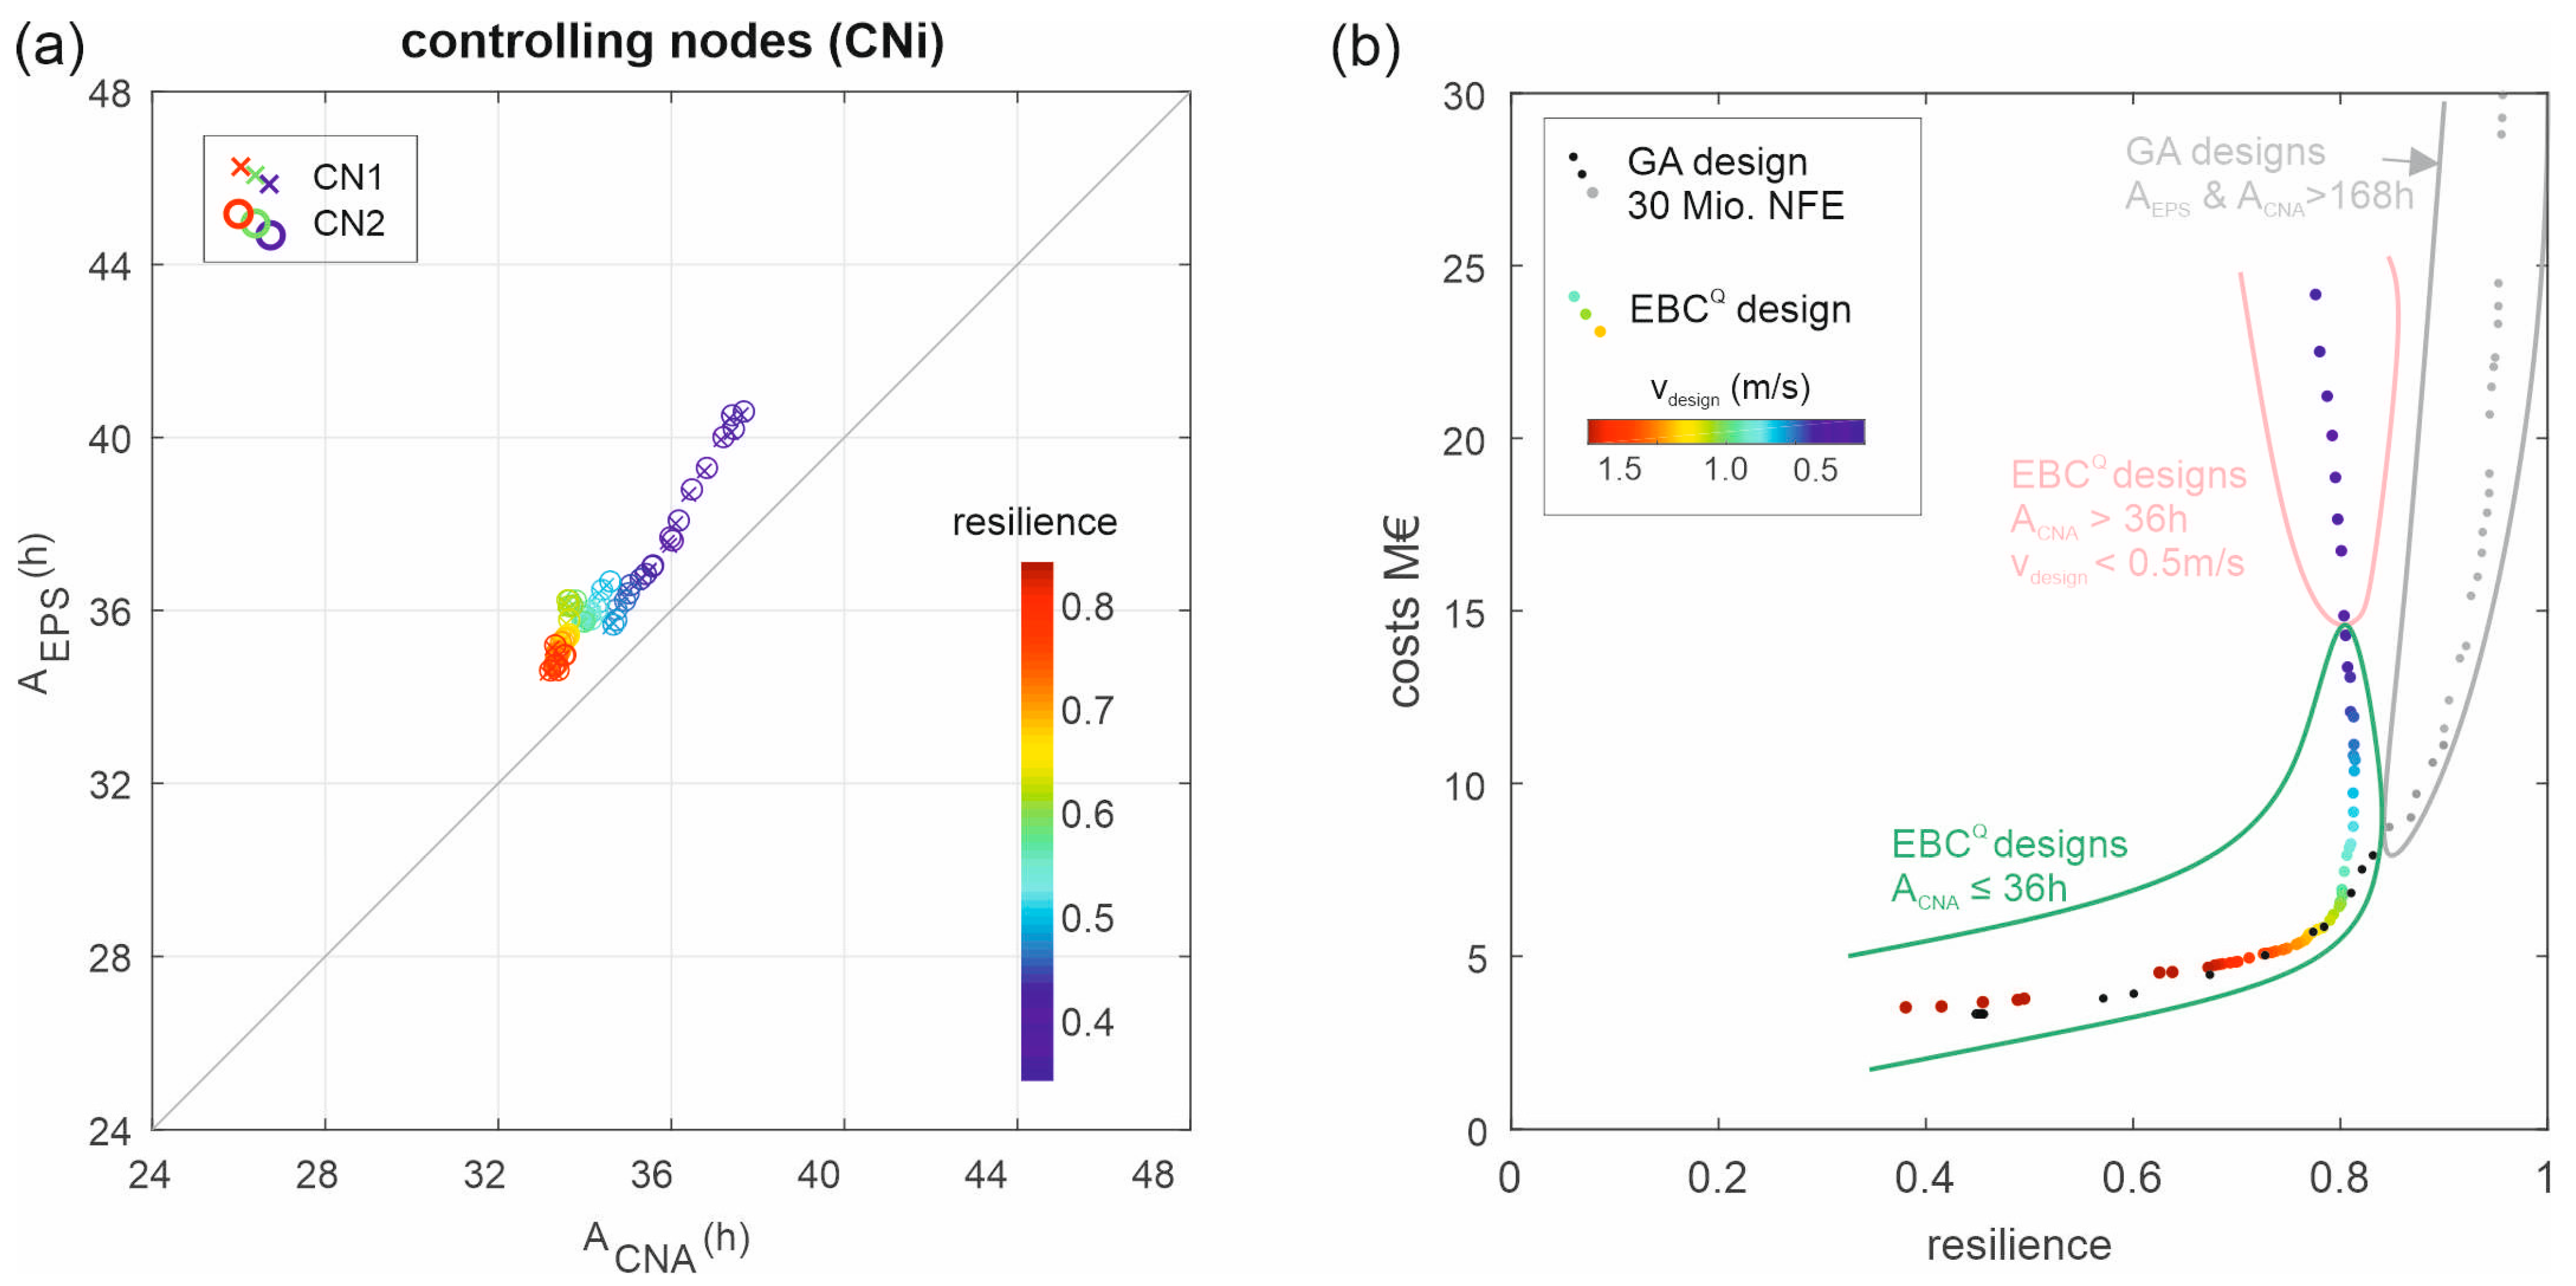
For the controlling nodes CN1 and CN2, in
Figure 10 the water ages obtained with the graph-based method (A
CNA) and the extended period simulation with Epanet2 (A
EPS) for all design solutions are shown. The colors are according to the obtained resilience values. One can see, that with decreasing resilience values (from blue to red marker colors), the maximum water age in the controlling nodes also decreases. But, it can be observed that A
CNA slightly underestimates the water age when comparing it to A
EPS. However, this underestimation could be compensated by, e.g., using a safety factor for the threshold for A
EBC (to be on the safe side). Following the suggestion by [
15], C
0 = 0.1 was used as parameter value for network correction. Also, the network correction/dispersion could be increased in the graph-based water quality model to potentially improve the results, but this would require more investigations. As a threshold for sufficient water age in the graph-based designs in this work, 36 h based on A
CNA is used.
In a last step, the obtained Pareto-front for minimizing costs and maximizing resilience from the graph-based design method is compared with results obtained with GALAXY. For the graph-based designs, the water quality is also assessed with the graph-based water quality model, and design solutions with a nodal water age exceeding 36 h are identified. For the design solutions obtained with GALAXY (population size 100 and 300,000 generations result in NFE of 30 Mio.), an EPS over 10 days with a water quality time step Δt = 1 min is performed for the final design solutions. Note that in Sitzenfrei [
15], it was shown that when checking the water quality constraints for design solutions from GALAXY with the graph-based water quality model, it produces almost identical results with EPS as with Epanet2.
When we now compare the obtained design solutions from the graph-based design procedure (colored dots) with design solutions form GALAXY (black and grey dots) in
Figure 10b, it can be observed that for some regions of the Pareto-front, good results can be obtained with both methods. However, when looking at the water quality performance, one can see that the solutions with a high resilience value from GALAXY, all have a very large water age (>168 h) (grey dots). When using the resilience metric according to Prasad and Park [
19], the high resilient solutions are driven by the uniformity factor, which favors similar sized pipe diameters connected to a node. This results in large capacities all over the WDN. Such design solutions with almost uniformly distributed high capacity cannot be obtained with the graph-based design (so far, but it will be tackled in future work). However, when looking at the graph-based design solutions with costs above EUR 15 Mio., the maximum water age is still close to 36 h while for the design solution from GALAXY above EUR 8 Mio., 168 h and more are obtained.
Finally, when comparing the design solutions of the EBCQ design with the remaining part of the pareto front obtained with GALAXY (black dots), very good solutions are obtained with the proposed graph-based framework.
The investigated WDN is a distribution branch network [
21] with a common structure for all-pipe models. For more grid like structures, the proposed approach is applicable for determining low-cost solutions (i.e., below the knee bend in the Pareto-front) as these design solutions are mainly driven by shortest paths, and the water age is also mainly driven by this main distribution paths. For design solutions with higher resilience values, there is expected to be a higher discrepancy with design solutions from meta-heuristics and also in terms of accuracy of the graph water quality model. However, more investigations are required in this regard.
The proposed method was shown for a single-source-fed WDN. However, multi-source WDNs can be decomposed with graph theory as well. Sitzenfrei, Wang, Kapelan, and Savic [
23] proposed a decomposition method based on shortest path analysis. Therein, from all sources, the shortest paths to all demand nodes were determined. With an assumed maximum friction loss in a pipe (e.g., 1 m/km), the head losses if that node would be supplied from each specific source were determined. These head losses for each node are then subtracted from the water levels of the corresponding source (e.g., with four sources, four possible supply pressures can be determined). The supply from the source with the highest possible supply pressure is then assigned to that node, i.e., the WDN is decomposed to supply areas. In Hajibabaei et al. [
24] the sensitivity of the assumed maximum friction losses was determined for different case studies, and for 1 m/km, the best results were obtained also for the high resilient solutions.
4. Summary and Conclusions
This paper introduced a novel graph framework for optimizing water distribution networks (WDNs) by combining for WDN customized approaches based on complex network analysis. The first approach, presented in [
10], is a two-objective optimization model that was enhanced using a hybrid method for considering topography in graph designs [
12]. The second approach, described in [
11], is a graph-based water quality model which is capable of assessing water quality with significantly less computational effort than traditional approaches. The main objective of this framework is to find Pareto-optimal design solutions for WDNs, particularly for those that are complex and large in scale. These solutions strike a balance between minimizing costs and maximizing resilience, with a specific focus on controlling water age below a threshold. By considering this threshold, technically unsuitable solutions are filtered out from the Pareto-front, ensuring that only viable options are considered. The entire procedure is outlined in a toy example, and the applicability and effectiveness of this novel framework is shown with a real large case study. Remarkably, the proposed method delivers results within a few seconds of computation time, highlighting its practicality and computational efficiency.
With the proposed graph-based methods, very fast approximate results for multi-objective optimization can be obtained. The fast execution times enables an implementation in, e.g., hydraulic simulation software, where a fast and user-friendly pre-assessment is needed or any kind of application where many scenarios need to be investigated (e.g., deep uncertainty analysis, future developments, etc.). Further, the graph-design procedure can serve as a global search method for multi-objective optimization, which is then further improved by a local search algorithm based on an evolutionary algorithm.
The graph-based water quality model also enables other further applications. For example, in the course of multi-objective optimization (e.g., with GALAXY), an additional constraint could be implemented excluding design solutions, which are (by far) exceeding a water age threshold. By that, the search space is also reduced, potentially improving also the computation time of the evolutionary algorithm.
In summary, this paper presents a novel graph framework that integrates complex network analysis approaches to optimize WDNs. The results obtained through real case studies illustrate the applicability and efficiency of this approach in addressing the challenges associated with complex, large-scale WDNs.

