1. Introduction
The term “oyster reef” refers to a biological reef system formed by a large number of oysters growing on the surface of a hard substrate, which is widely distributed in temperate estuaries and coastal areas. It has important ecological functions, such as purifying water, providing a habitat for fish, preventing shore erosion, and carbon sequestration [
1,
2,
3]. Over the past 100 years, the global distribution area of oyster reefs has decreased by about 85%, due to overfishing, environmental pollution, and disease immersion, which has changed the structure and function of nearshore aquatic ecosystems, exacerbated eutrophication and harmful algal blooms, and seriously threatened the maintenance of the population and resource replenishment of important economic fish in estuaries and coastal areas [
4,
5]. In order to revive the oyster industry, restore the habitat of oyster reefs, and provide their ecological service value, a series of oyster reef restoration projects have been undertaken by the federal government and many states along the Atlantic and Gulf coasts of the United States since the 1950s [
1,
4,
6], such as 98 oyster reefs built at 28 sites on the east coast of South Carolina. Practice has shown that the artificial restoration of oyster reefs has played an important ecological role in the marine ecological environment [
7,
8,
9]. Oyster reefs can significantly increase regional biodiversity and biomass. Philine [
10] compared the density of fish and invertebrates in oyster reef, seagrass, and salt marsh habitats in the Gulf of Mexico, and analyzed the effect of improving different biological densities. The results pointed to an obvious role for the oyster reef as a stone crab habitat. Leon et al. [
11] showed that oyster reef restoration provided refuge and a habitat for fish and invertebrates. The study examined the difference between the oyster reef habitat and exposed sediment habitat, and reported that oyster reefs showed a significantly greater abundance and biomass, and that the spring and autumn samples tended to have higher abundance and biomass values than those in summer. In natural environments, oyster reefs are distributed at the forefront of shorelines, and are the first to receive the impact of waves, with wave breaking also occurring here first. Oyster reefs, which are much smaller in scale than coral reefs, have a different morphology. The buried oyster reefs found in the bays and tidal waterways of Texas and Florida on the southeast coast of the United States are among the largest, with a length of 8 to 10 km, 150 m wide, and 4 m thick, and the oyster reefs are distributed near the shoreline, with a large slope at the outer margin [
12].
Oysters are harvested or farmed for consumption around the world and, in recent years, they have also been used as coastal protection facilities. Along the east coast of the USA, loose oyster shells from oyster farms have been placed on the coast for protection and, after oysters settle and grow into reef-like structures, they can be recommended as breakwaters, known as ‘living breakwaters’ [
13,
14,
15]. Storm waves break on these structures, thereby protecting the shoreline and salt marsh ecosystems on the landward side. The conditions for wave breaking at the forefront of oyster reefs are similar to those for beaches. On beaches, wave breaking occurs when the following equation is satisfied [
16]:
where
H represents the wave height at the point of the wave breaking,
h is the water depth at the breaking point,
C1 and
C2 are two parameters related to the slope,
g is the gravity acceleration, and
T is the mean wave period. In the absence of wave breaking, energy dissipation is also significant, as waves propagate into oyster reefs. In field experiments conducted by Chowdhury et al. [
17], the artificially bred oyster reefs located in the lower intertidal zone protruded 0.6 m above the bed, and they were able to effectively dissipate waves. Wiberg et al. [
18] installed multiple oyster reefs in the intertidal zone, with an average water depth of 0.9–1.3 m. The top elevation of the reefs was placed 0.3–0.5 m below the mean water level, and the maximum width of the reefs did not exceed 5 m. After waves generated by localized winds passed over the reefs, the wave height decreased to varying degrees, with the strongest dissipation near the mean water level, reaching 30% to 50%. The significant reduction in wave energy in such a narrow field indicated that oyster reefs could indeed act as breakwaters in appropriate water-depth conditions. There are many oyster reefs in the United States that are used for coastal protection purposes. In the mid-20th century, in order to deal with the resource failure caused by overfishing, the target of restoring the ecosystem service function was applied to the oyster reefs [
19]. Their wave-breaking characteristics are commonly used in ecological restoration projects, for protecting landscapes and salt marshes at tidal beaches [
14].
Currently, the SWAN (Simulating Waves Nearshore) software has been widely used for the numerical simulation of nearshore wave distributions. For example, Booij et al., introduced the numerical model SWAN for computing wave conditions in shallow water flow, and proposed a new approach to integrating this model with hydrodynamic circulation models on a curvilinear–linear grid, conducting initial experiments [
20]. Similarly, Huang et al., utilized the third-generation wave model SWAN to examine the impact of wind input parameterization on wave estimation under hurricane conditions, and they discussed the main parameter sensitivities, using the Gulf of Mexico as a case study [
21].
There are about 100 species in the oyster family, with nearly 20 species found along the coast of China [
22]. Among them, Crassostrea Arkansas (Fujita), known as the bivalve giant oyster, is a mollusk with adaptability to a wide range of temperature, salinity, and pH values. Crassostrea gigas Thunberg is also adapted to environments with low salinity, and it grows in the low-tide-level region, The length of an oyster shell in the Holocene Oyster Reef in Dawu Village, Bohai Bay, can reach more than 60 cm [
23]. Currently, research on the wave-dissipation performance of oyster reefs is mostly focused on laboratory experiments and small-scale numerical models, using computational fluid dynamics (CFD). Limited research has been conducted on the wave-dissipation effects of oyster reefs on a larger spatial scale. Therefore, this study used Simulating Waves Nearshore (SWAN) to simulate the wave-dissipation effects of oyster reefs, to explore the dissipation effects of oyster reefs, and provide a scientific basis for the laying of oyster reefs on the muddy coast of China.
2. Materials and Methods
2.1. SWAN Model
SWAN is one of the third-generation numerical models that is publicly available for wave simulation. The model uses a balance equation based on the principle of wave-action conservation as the model’s governing equation. In addition to the physical mechanisms shared by third-generation wave models, the SWAN model also incorporates the most advanced formulas from the WAM model (Wave Model). The SWAN model fully considers various needs in the shallow-water simulation, and introduces new considerations into the source term treatment and numerical calculation, making it an extension of the third-generation wave numerical model. Moreover, in the finite-difference discrete format, the full implicitness used in the SWAN model makes it unconditionally stable, allowing for flexibility in the selection of the spatial grid and time step, without restrictions [
24,
25,
26].
(1) The governing equations:
The third generation of wave models is based on the wave spectrum or energy density E(σ, θ), where the wave energy is distributed at frequency σ and propagation direction θ. Typically, wave models determine the wave energy density N(, t, σ, θ) = E/σ, which varies with space and time t, and is conserved when considering wave propagation; however, E is not conserved.
In spherical coordinates, the wave action balance equation can be expressed as:
In the equation, (λ, ϕ) denotes longitude and latitude, and θ represents the clockwise wave direction along the geographic position, pointing eastward. The left-hand side of the equation represents the dynamic term, where the first item is the temporal variation in the wave energy, the second item is the propagation of the wave energy in the two-dimensional space, and the group velocity, which is expressed as , can be calculated by the dispersion relation. The third and fourth items represent the refraction effects of the water depth and current velocity, where and are the propagation speeds in the spectral space (σ, θ). The term on the right of the equation represents the source/dissipation items.
(2) Source and Dissipation:
The total source items of
comprise six components, which represent the input of the energy, the propagation, and the dissipation, according to the physical mechanisms of wave generation and development. The basic equation can be expressed as:
where
,
, and
represent the wind energy input, nonlinear wave–wave interaction, and wave energy dissipation components, respectively. The wave energy dissipation components comprise white capping, bottom friction, and wave breaking.
2.2. Study Area and Model Setup
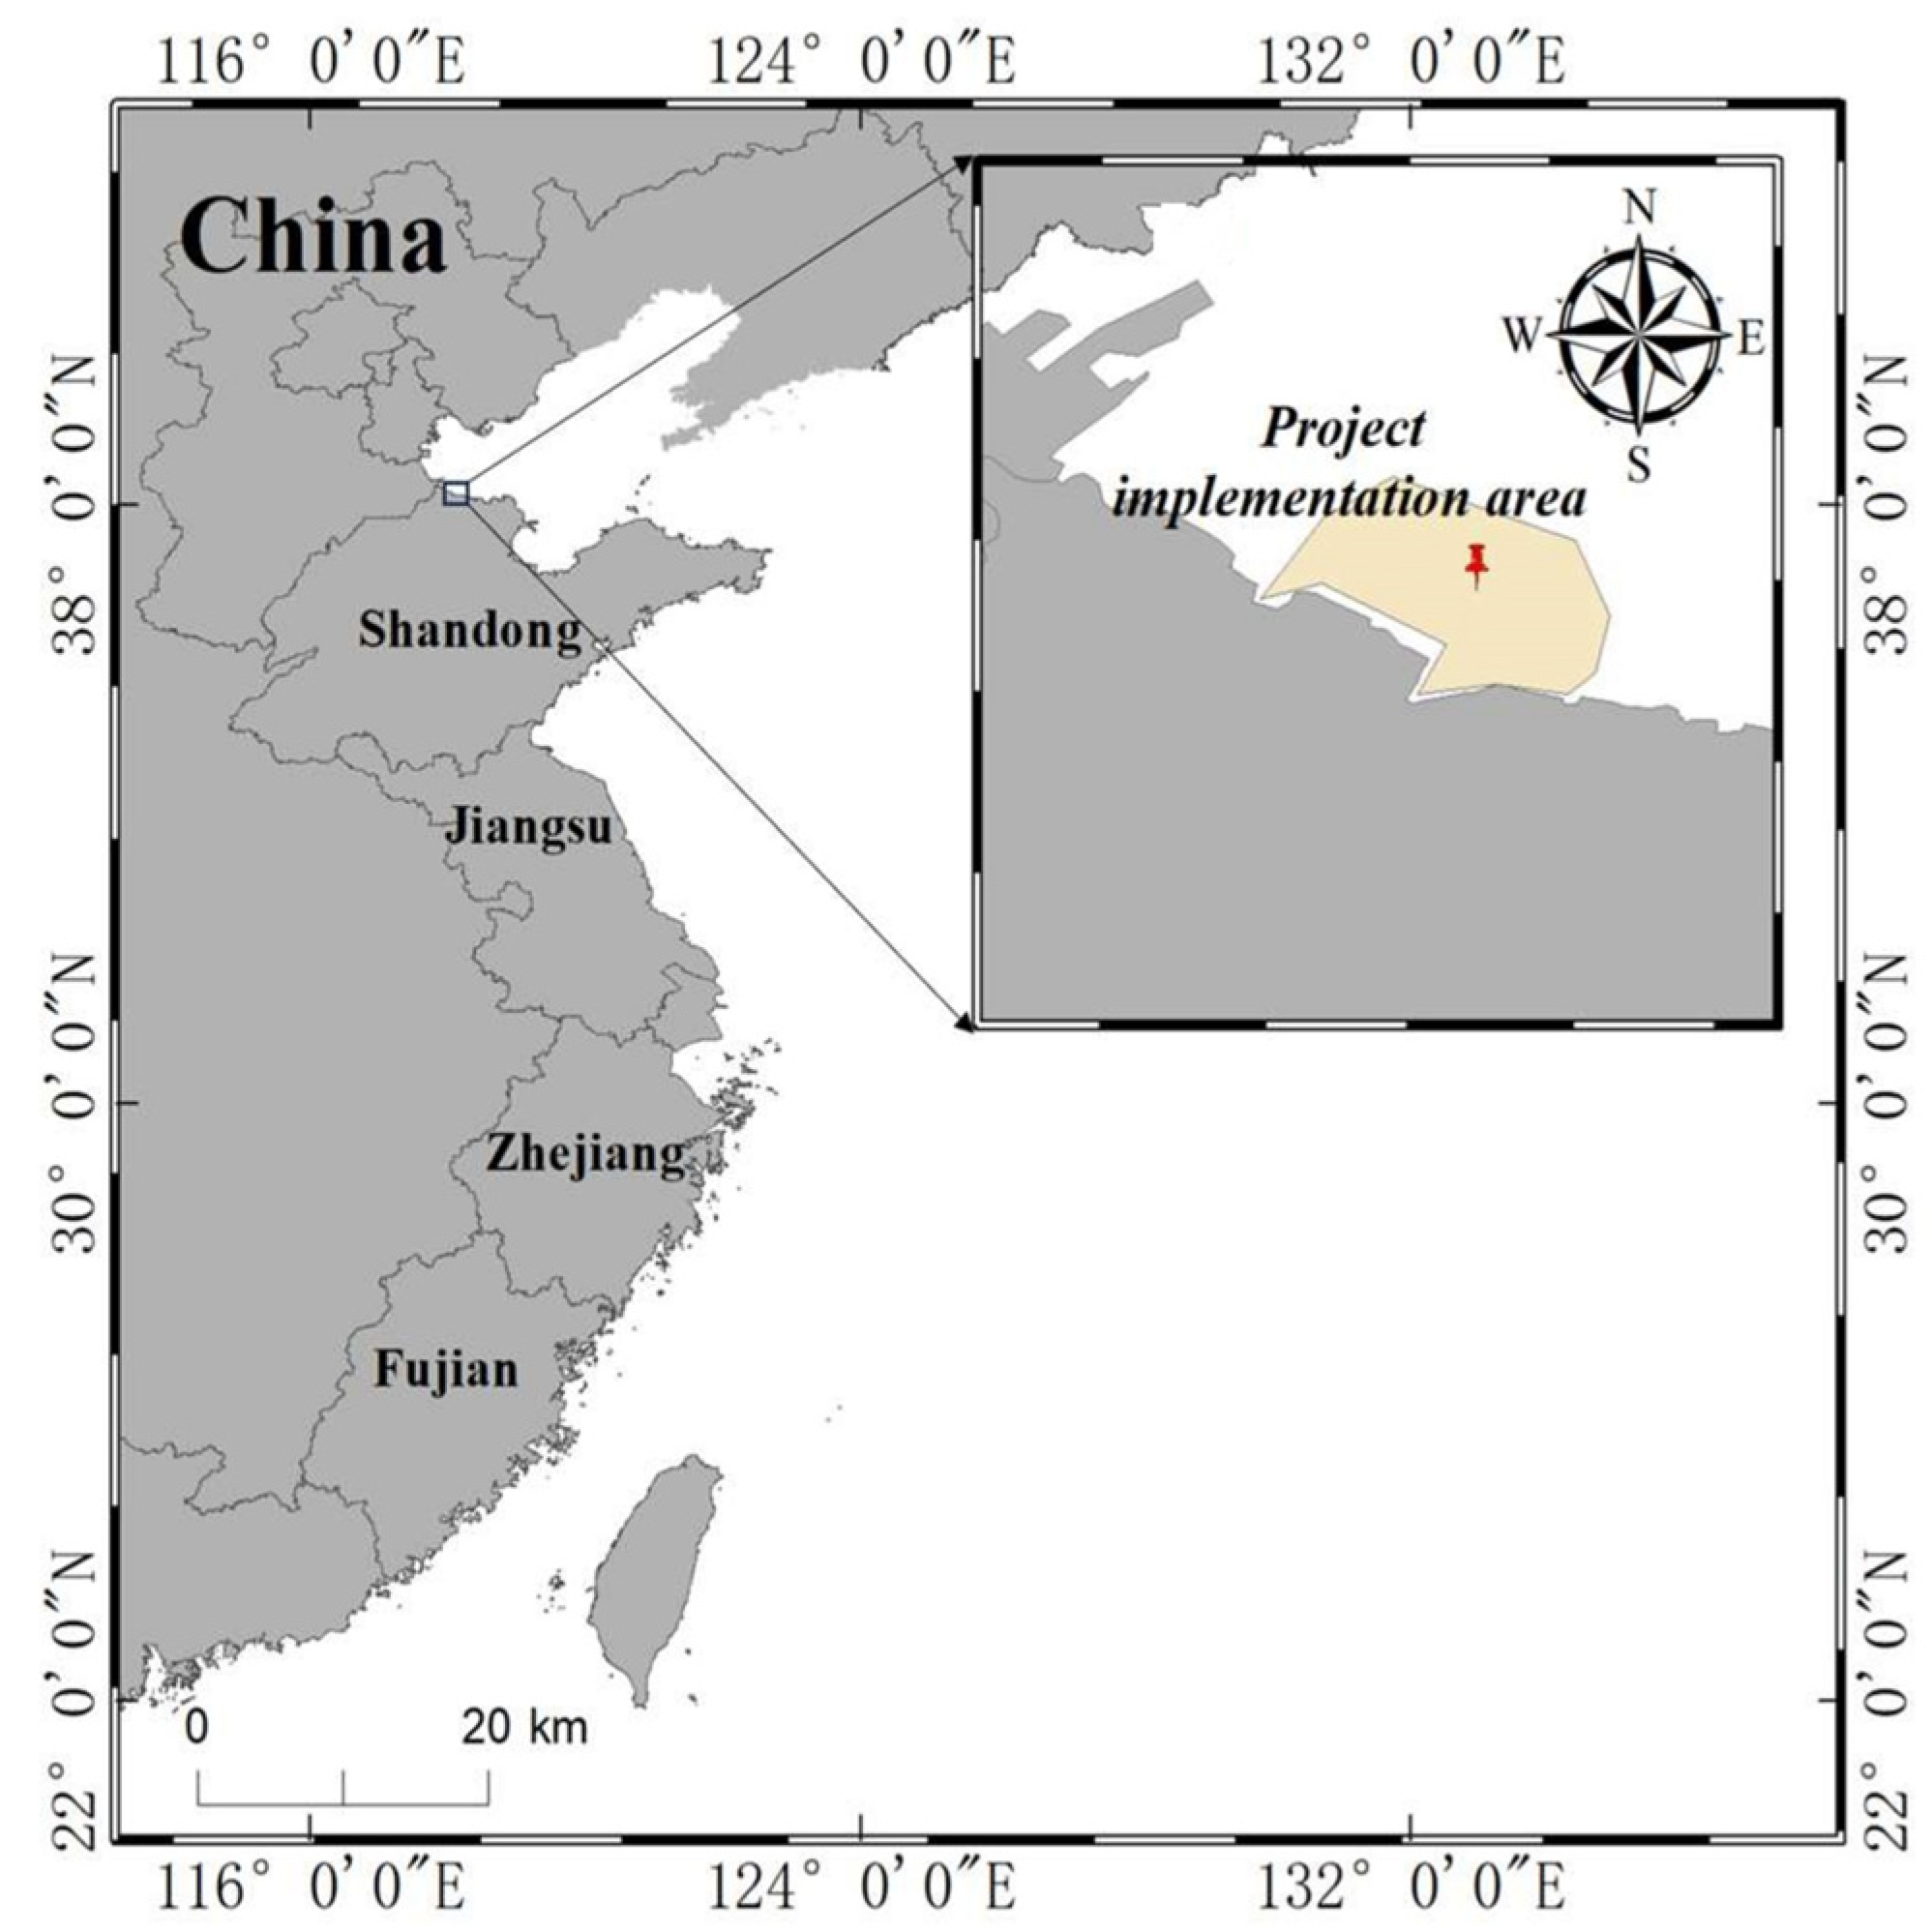
2.2.1. Study Area
The study area is located in the northern coastal region of Zhanhua District, Binzhou City, Shandong Province, China, covering the sea area from the Tao’er River estuary to the Chaohe River estuary, with a total area of approximately 3924 hm
2. The project aimed to restore the marine ecosystem, including the wetland restoration of 3760 hm
2, by opening up water exchange channels and dismantling embankments, and through control of the invasive species Spartina alterniflora over an area of approximately 366.17 hm
2, a salt marsh restoration of about 271 hm
2, and an oyster reef restoration of about 30 hm
2. The research area is shown in
Figure 1.
The difference in the water level, tide, waves, and other marine environment conditions to the height and weight of the oyster reef, and the attachment of the oysters, have an important influence; this rehabilitation work of the oyster reef is located on the outside, vulnerable to waves and storm surge disasters. Therefore, a reasonable oyster reef layout, form, and structure can create a good living environment for oysters and, at the same time, can provide a habitat and bait field.
2.2.2. The Layout of the Oyster Reef
The type of artificial oyster reef used in this case is the “hollow-structured oyster reef”, which is characterized by having voids or cavities in its structure. These voids or cavities can be accessed by oysters or other organisms, providing an additional habitat and shelter. This design increases the surface area and complexity of the oyster reef, promoting the aggregation of more marine life, and the development of the ecosystem. The hollow-structured oyster reef affects waves in multiple ways, including wave attenuation, scattering, and refraction, as well as providing coastal protection, and facilitating sediment deposition.
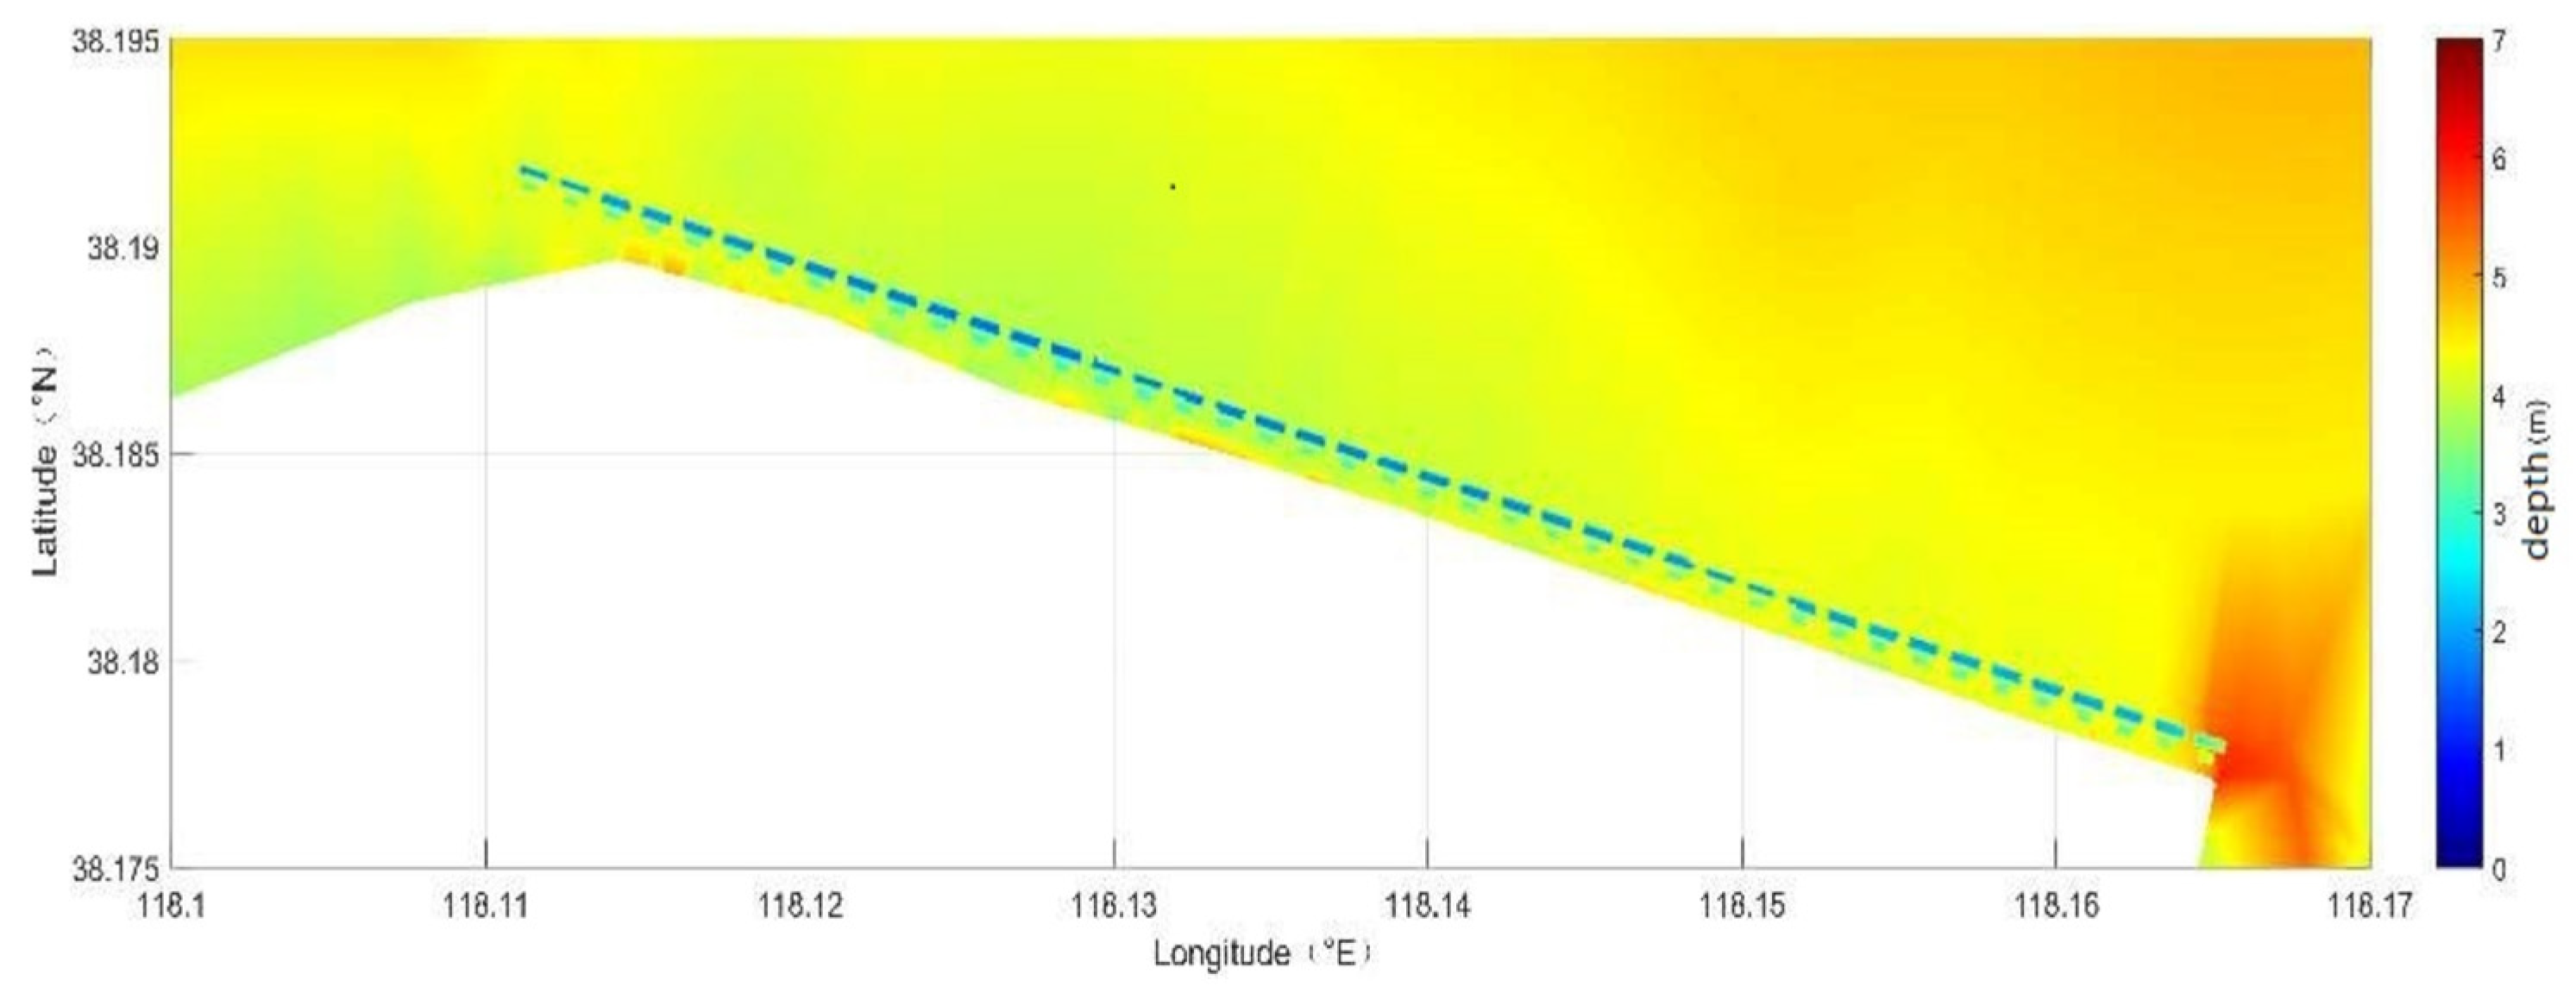
In this study, oyster reefs were designed in two rows. A row of oyster reefs was 40 m long and 20 m wide, with a reef elevation of 0.0 m above the mean water level. They were arranged at the −3.15 m isometric line, and the distance between each reef was 20 m along the coastal line direction, named reef B. At 20 m from Oyster Reef B, along the vertical shoreline direction, was Oyster Reef A, which was 80 m long and 20 m wide, and the elevation was 1.0 m above the mean water level. Oyster Reef A was arranged at the −3.45 m isometric line, and the distance between each reef was 40 m. The oyster reef should not be placed too far from the shoreline, to ensure its wave attenuation effect. The distance between the two oyster reefs should be moderate, considering the layout and arrangement of the oyster reefs. It is recommended that the reefs are placed at the depths of −1.0 m and −1.3 m, where the nearshore depth contours are almost parallel to the shoreline, both benefiting the landscape, and adhering to natural laws and design requirements. The layout of this project is shown in
Figure 2 and
Figure 3. The numerical model was modified in accordance with the project design, which resulted in changes in the topography and water depth after the oyster reefs were installed, as shown in
Figure 3. According to the literature, the presence of oyster reefs increased the bottom friction coefficient, except for causing the shallow water effect. Based on the research of Filipot [
27], the numerical model used a bottom friction parameter of kn = 0.5 m in the oyster reef area, while the default value of kn = 0.05 m was used in other areas.
2.2.3. Model Setup
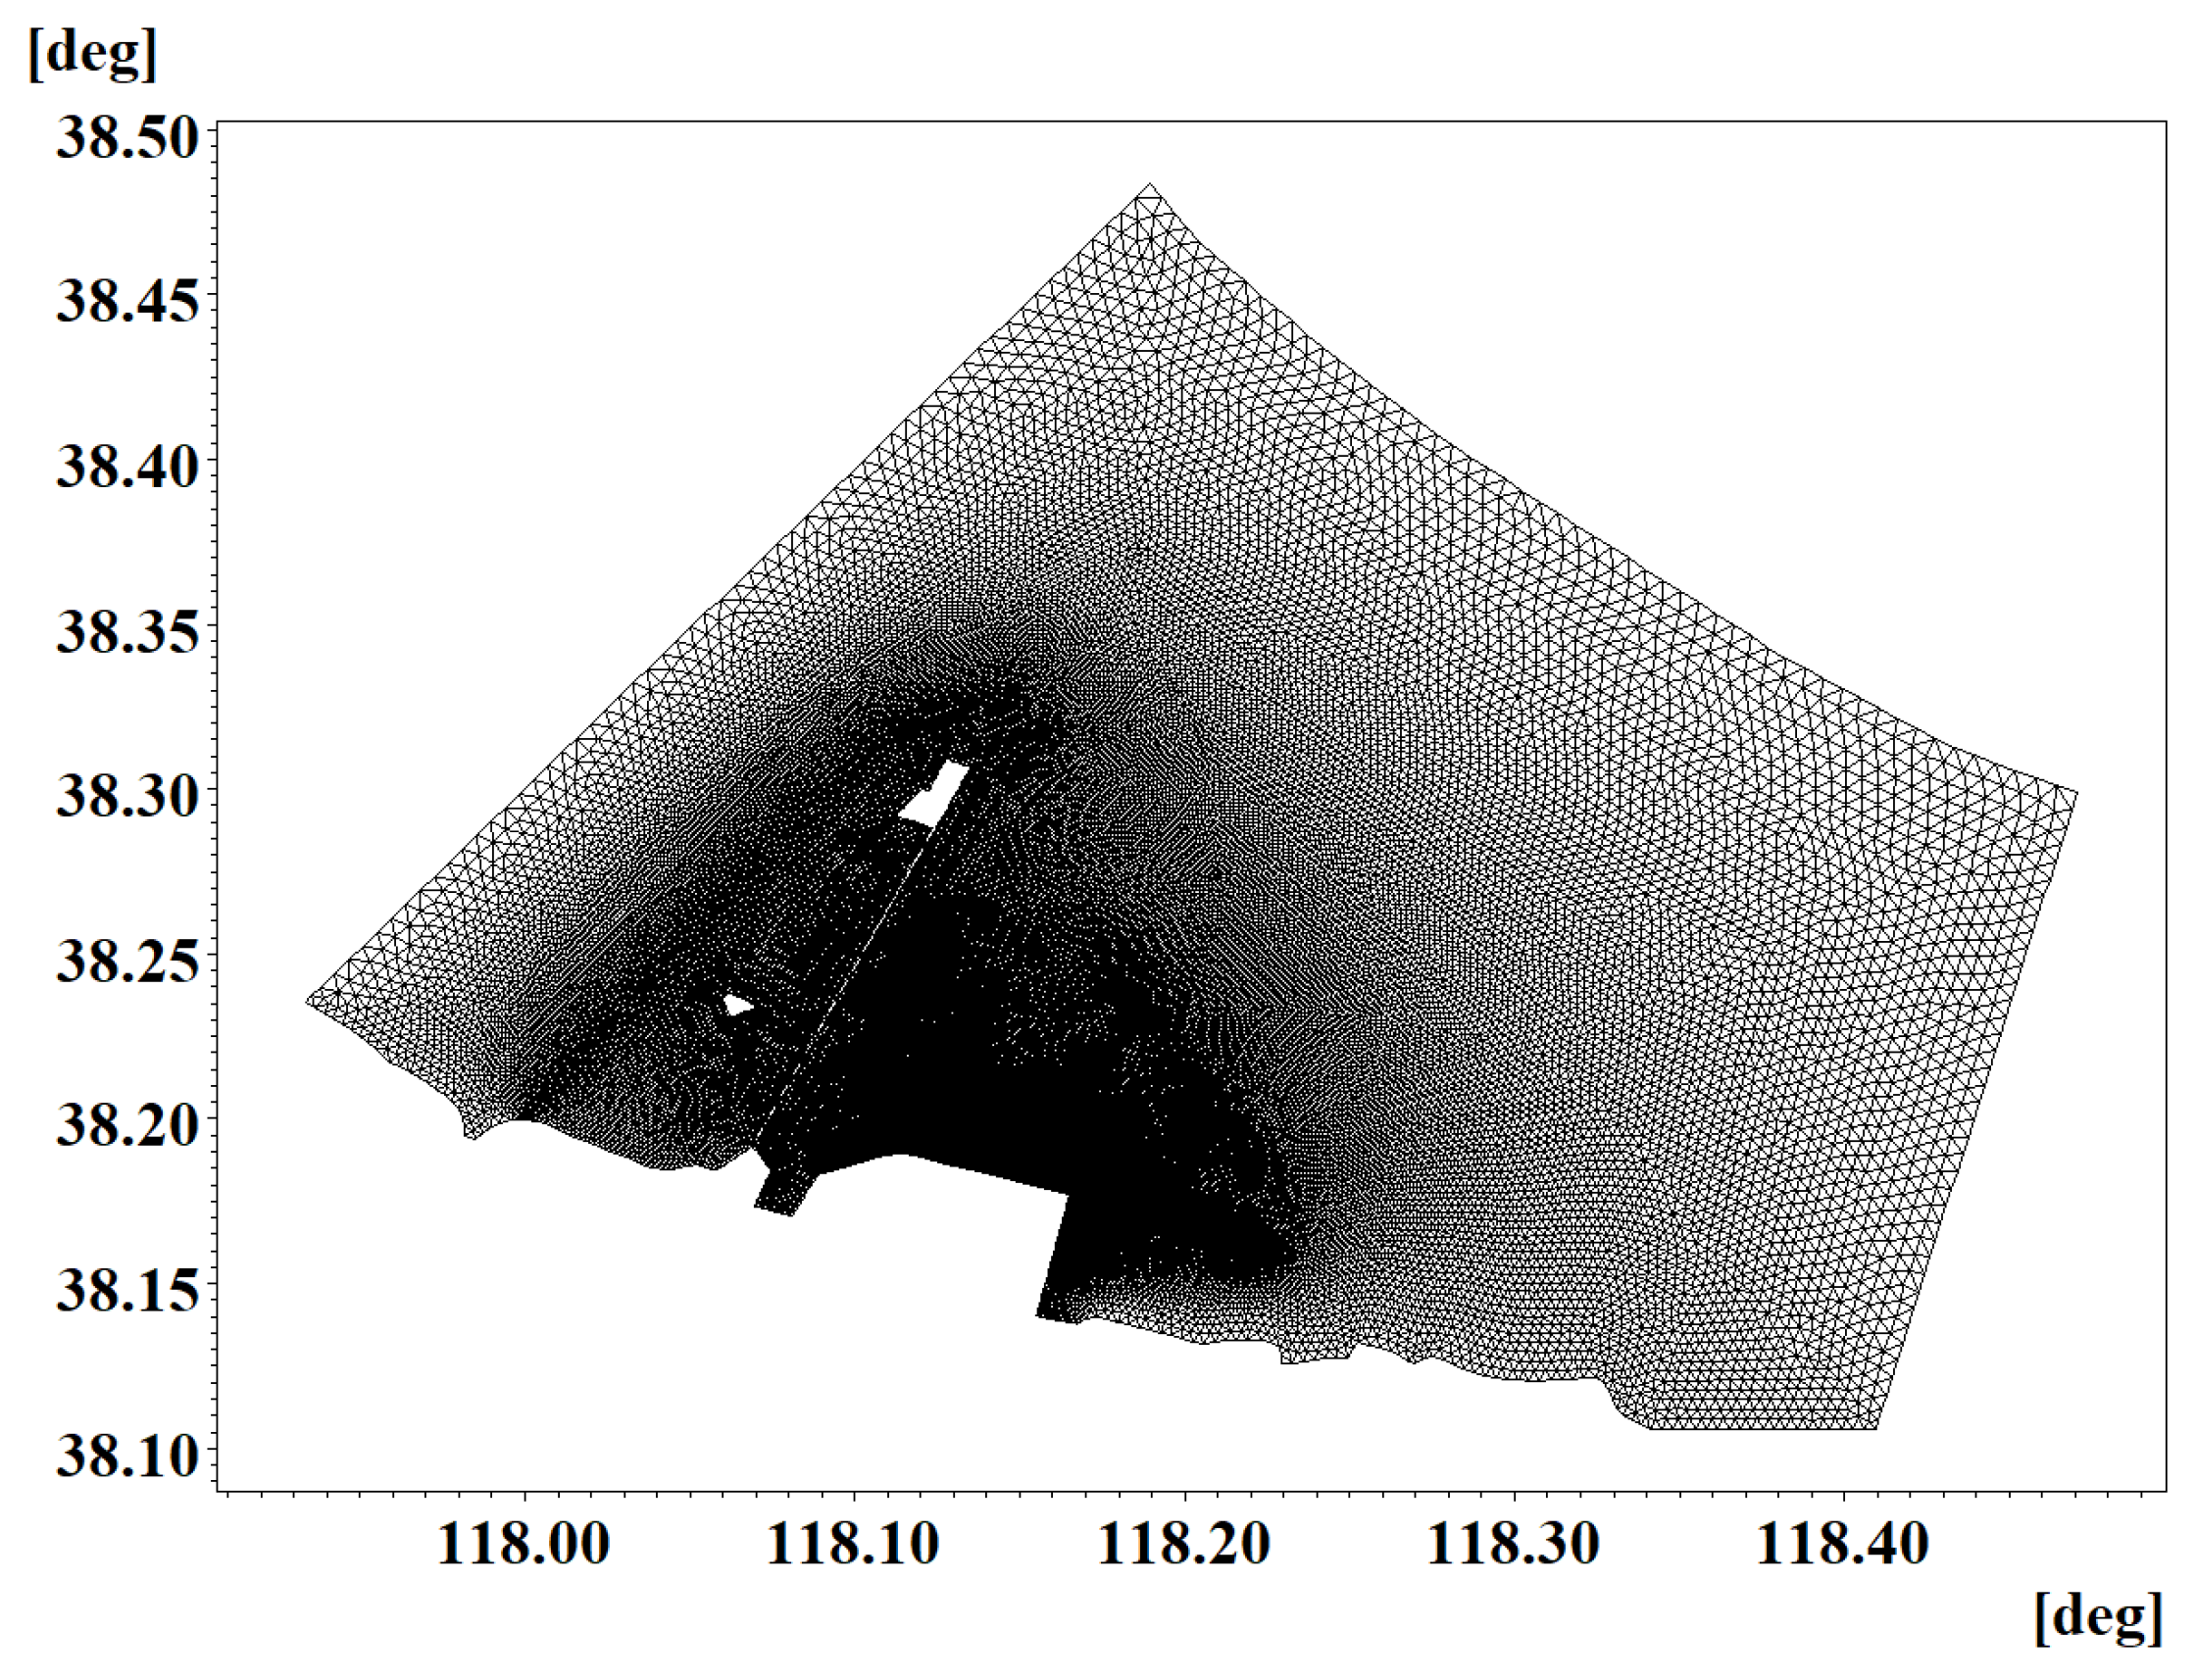
In order to accurately simulate the calculation of the waves in the study area, the impact of the incoming swell from offshore was considered. The simulated area was set as 117.9~118.5° E and 38.1~38.5° N. The open boundary and calculation area can be seen in
Figure 4.
The SWAN model was used to calculate the research area, which covered the nearshore area of the Binzhou oyster reef restoration project, and could fully simulate the wave changes during strong winds. Local encryption was carried out in the oyster reef layout area, which could simulate the refined wave characteristics of the project sea area. The horizontal triangular mesh grid had a total number of 154,048 with 48,053 grid nodes and a uniform grid transition resolution. In terms of horizontal grid allocation, the oyster reef deployment area was encrypted, with a resolution of about 5 m; it has a resolution of about 1 km in the model open boundary, and the grid uniformly transitions from the encryption area to the open boundary area. For the model water depth, electronic bathy grams and the measured water depth were used in this paper. Different bathygrams were converted to a uniform datum plane by the control points. The calculation time of the model was set to 20 min, and the output time of the model was set to 1 h. The model adopts the JONSWAP spectrum, and the spectral peak factor was adopted as the default value, which is 3.3. The common calculation formula is used to consider the four-wave interaction of the waves. The specific model physical process settings are shown in
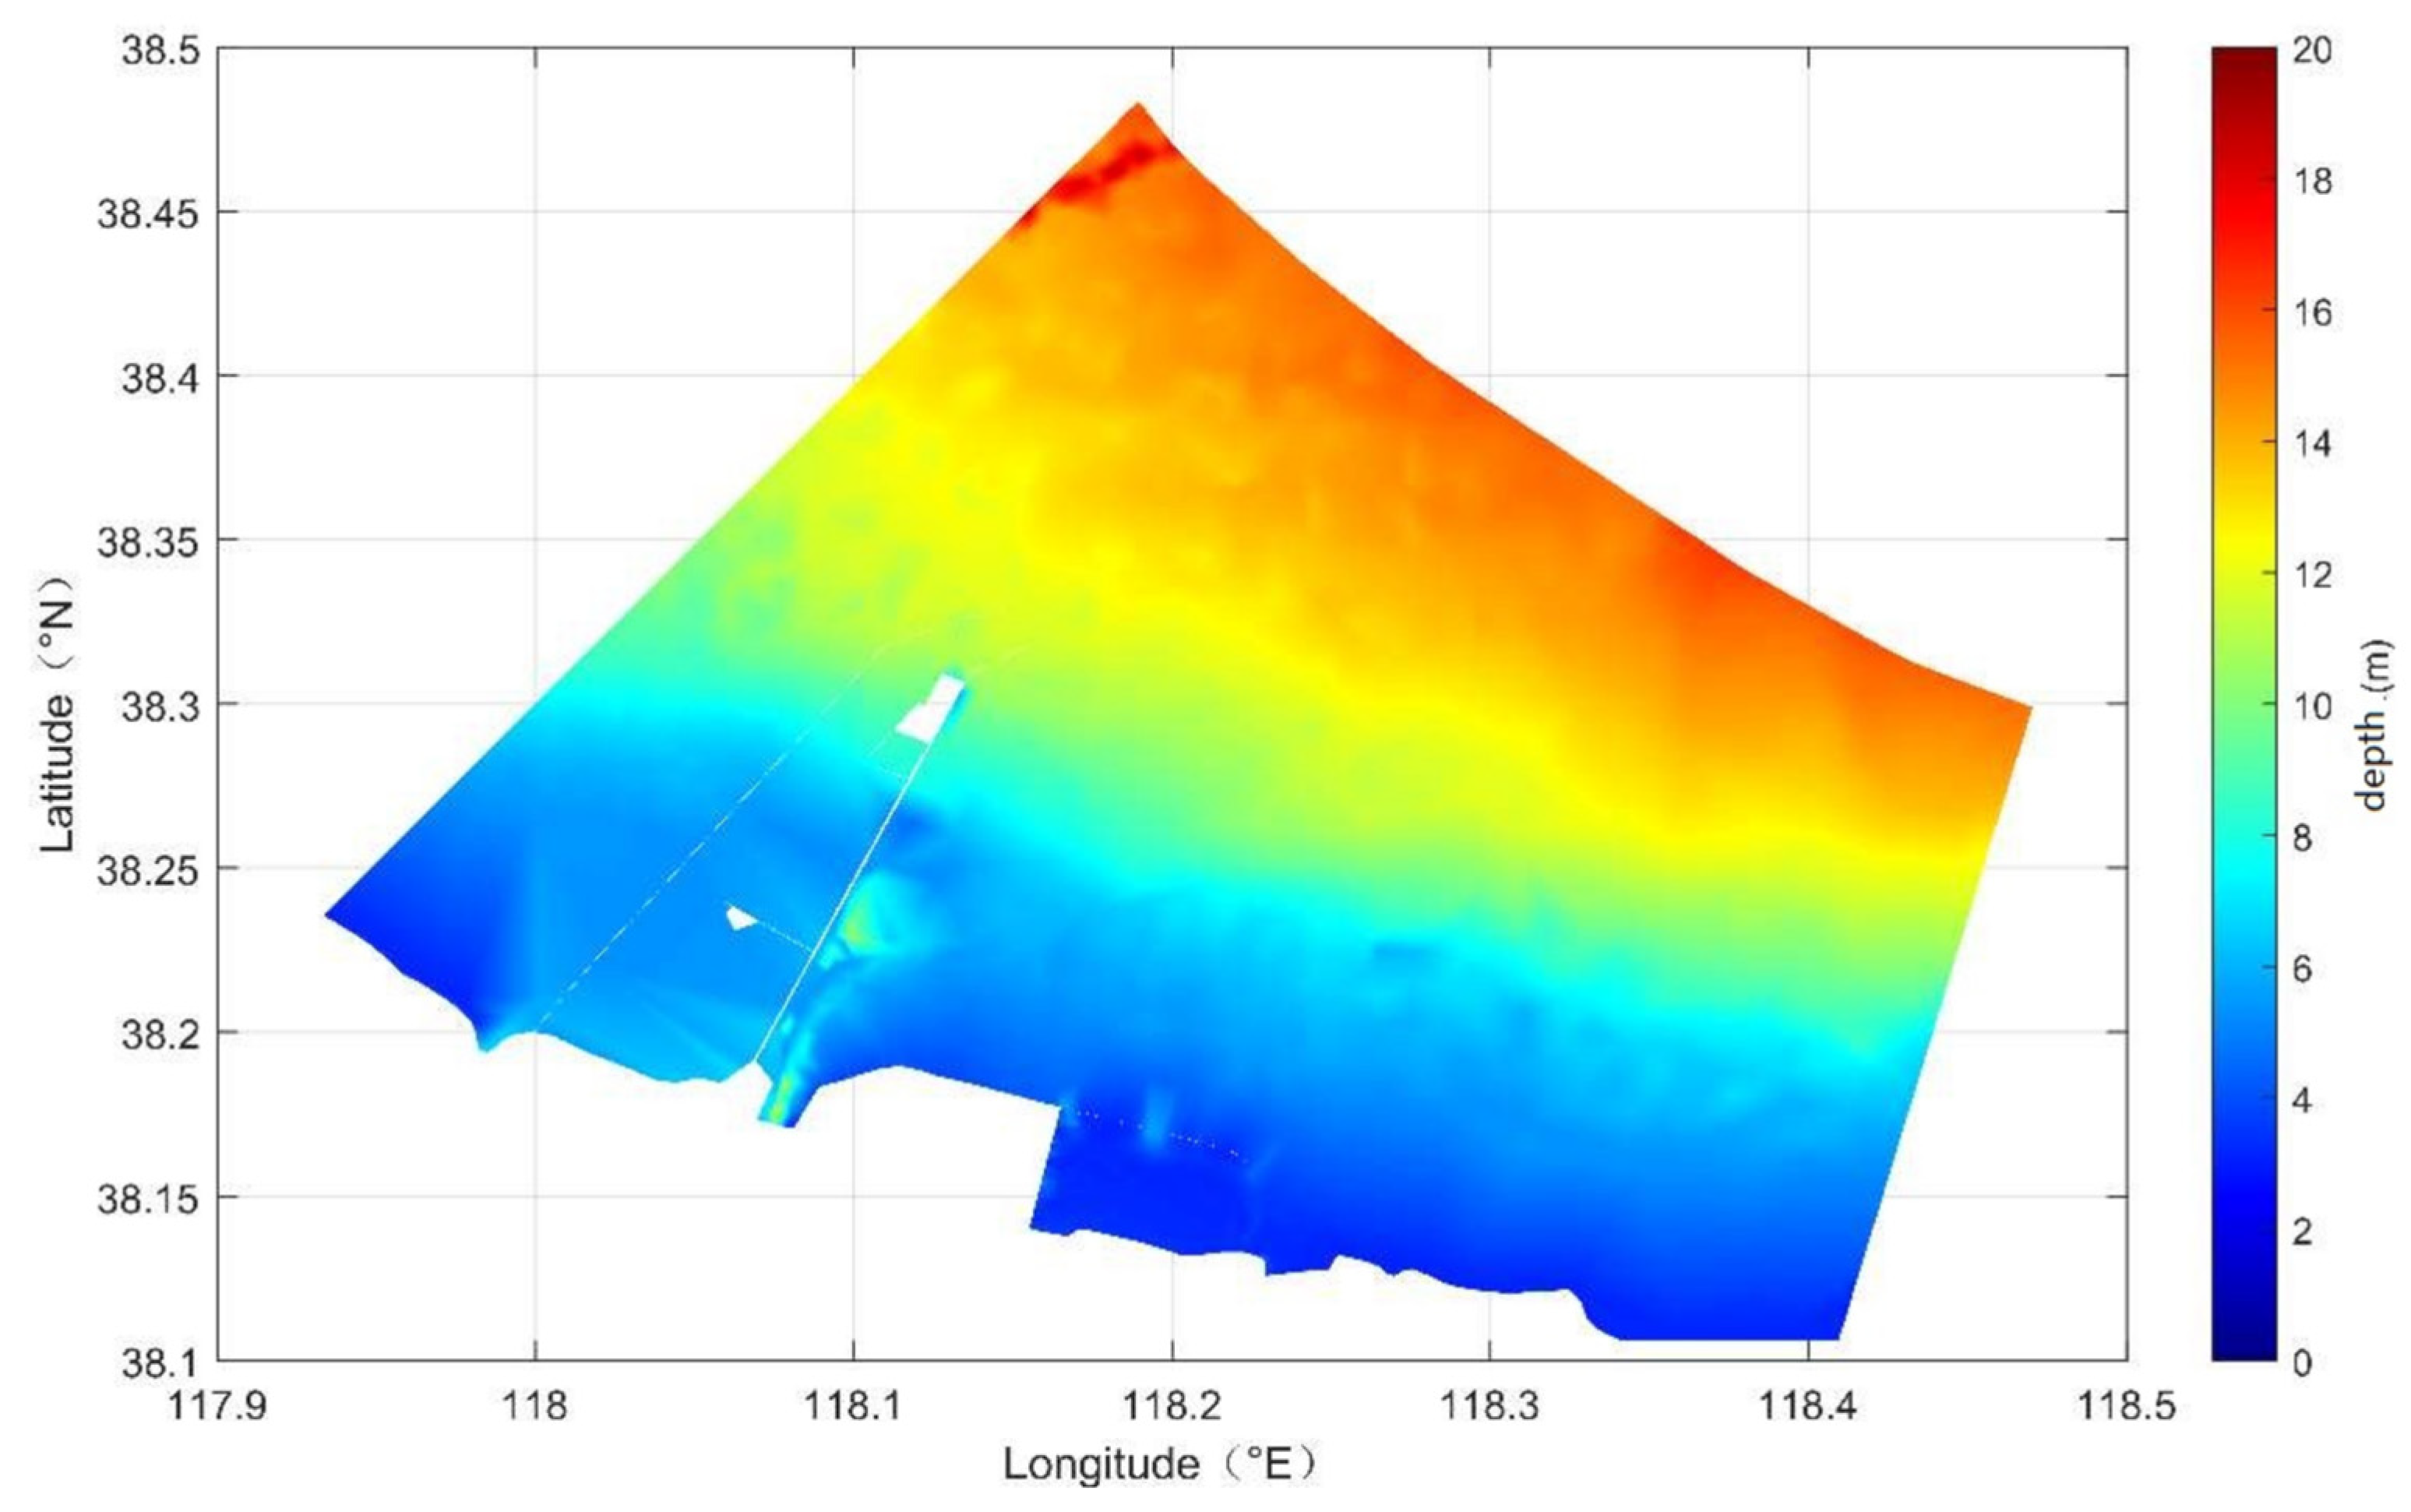
Table 1. The distribution of water depth is illustrated in
Figure 5.
This numerical module used the wave data of the 1990–2020 year released by the European Center for Medium-Range Weather Forecast (ECMWF) to obtain the wave elements at the isobath of −13 m outside the project, which were used as the wave conditions for the model open boundary. Considering the obstruction effect of the left-side embankment in the project area, the wave calculation only considered seven directions, and they were NW, NNW, N, NNE, NE, ENE, and E. According to the Chinese standards, the wave conditions used in this study were the wave height and mean wave period, with the 100-year return period, which were calculated using the P-III method, and the results are shown in
Table 2. In the calculation, this paper considered the effects of an extreme value. According to the investigation, historically, there has been no abnormal wave phenomenon caused by typhoons or cold waves and strong wind in this sea area, so the calculation of the wave elements is quite reasonable. As can be seen from
Table 2, the wave heights with a 100-year return period in the study area were all above 3 m, and the maximum value happened in the NE direction, with a value of 5.46 m; the second one was in the ENE direction, with the value of 4.93 m; and the minimum one was in the E direction, with the value of 3.16 m. The mean periods with the 100-year return period were all above 6 s, and the maximum value occurred in the NE direction, with the value of 8.32 s; the second-highest value occurred in the NNE direction, with the value of 8.23 s; and the minimum value was 6.43 s, and occurred in the NNW direction.
During the propagation process, waves undergo wave reflection when they encounter an oyster reef. In our research, we took into account previous studies on wave propagation and reflection from structures, to optimize the model parameters [
30,
31]. The wind field was driven by the ERA5 wind field, which is the fifth-generation atmospheric reanalysis of the global climate by ECMWF. The applicability in Chinese water was verified, and the results showed that the ERA5 performed well in the deep-water area of China, but the topography in the shallow-water area varied greatly from the actual terrain used in the model; especially in the presence of small islands, it did not perform well [
32,
33,
34]. For this study area, there are no surrounding islands, and the zone with −13 m depth is far away from the research area; therefore, the ERA5 wave data can be used as the open boundary condition.
2.3. Calculation of Wave-Dissipation Rate
The boundary conditions once in 100 years were used to calculate the effect of the oyster reef under an extremely high water level (EHL, 3.13 m), and the designed high water level (DHL, 1.57 m), and the values of EHL and DHL were obtained using the measured water-level data from the Binzhou station. According to the “Guidelines for Coastal Zone Ecological Disaster Reduction and Restoration Techniques-Part Six: Oyster Reefs”, effective wave heights at offshore and onshore points in two oyster reef zones were selected from the model. Equation (4) was used to calculate the wave-dissipation rate, to evaluate the disaster reduction effect of the oyster reef.
—The wave-dissipation rate.
—The effective wave height on the offshore-side edge (offshore point) of the oyster reef area (unit: m).
—The effective wave height on the onshore-side edge (onshore point) of the oyster reef area (unit: m).
3. Result
3.1. The Wave-Dissipation Effect of Oyster Reefs under EHL Conditions
Under EHL conditions, and with a wave-return period of 100 years in seven directions, the wave-dissipation effects of oyster reefs are shown in
Table 3. As can be seen from the table, in the case of an extremely high water level, we only considered the wave-dissipation rate of different oyster reefs. The dissipation effect of oyster reefs under combined A and B was not considered. Therefore, there was no successive dissipation of waves through oyster reefs A and B.
Oyster Reef A and Oyster Reef B were separated by 20 m, and the height of A was 1 m higher than that of B. Due to the shallow-water effect, the wave height in different directions was attenuated from over 3 m to less than 1 m, and even the wave height in the NNW direction was only 0.575 m. The attenuation of the waves in this area itself is more serious, mainly because the slope of the Binzhou sea area is relatively slow, and the waves can be continuously broken along the water depth.
Under EHL conditions, it can be seen from the results that, in the process of wave transmission from deep water to shallow water, the wave in Oyster Reef A was the same as that in front of Oyster Reef B, which proved that the wave was not affected by the shallow water under this condition. That is to say, under EHL conditions, the waves in the seven directions did not break before oyster Reefs A and B, and the reduction in the waves after passing through the oyster reef was completely caused by the shallow-water effect and the bottom friction caused by the oyster reef.
The results indicated that oyster reefs had a significant wave-dissipation effect under extreme high-water-level conditions, with a wave-height dissipation rate of 8% to 21% in seven directions of waves. Specifically, the wave-dissipation effects of oyster reefs on waves from the ENE, NE, and NNE directions were more significant compared to other wave directions. However, the wave-dissipation effects on waves from the NNW and NW directions were slightly worse.
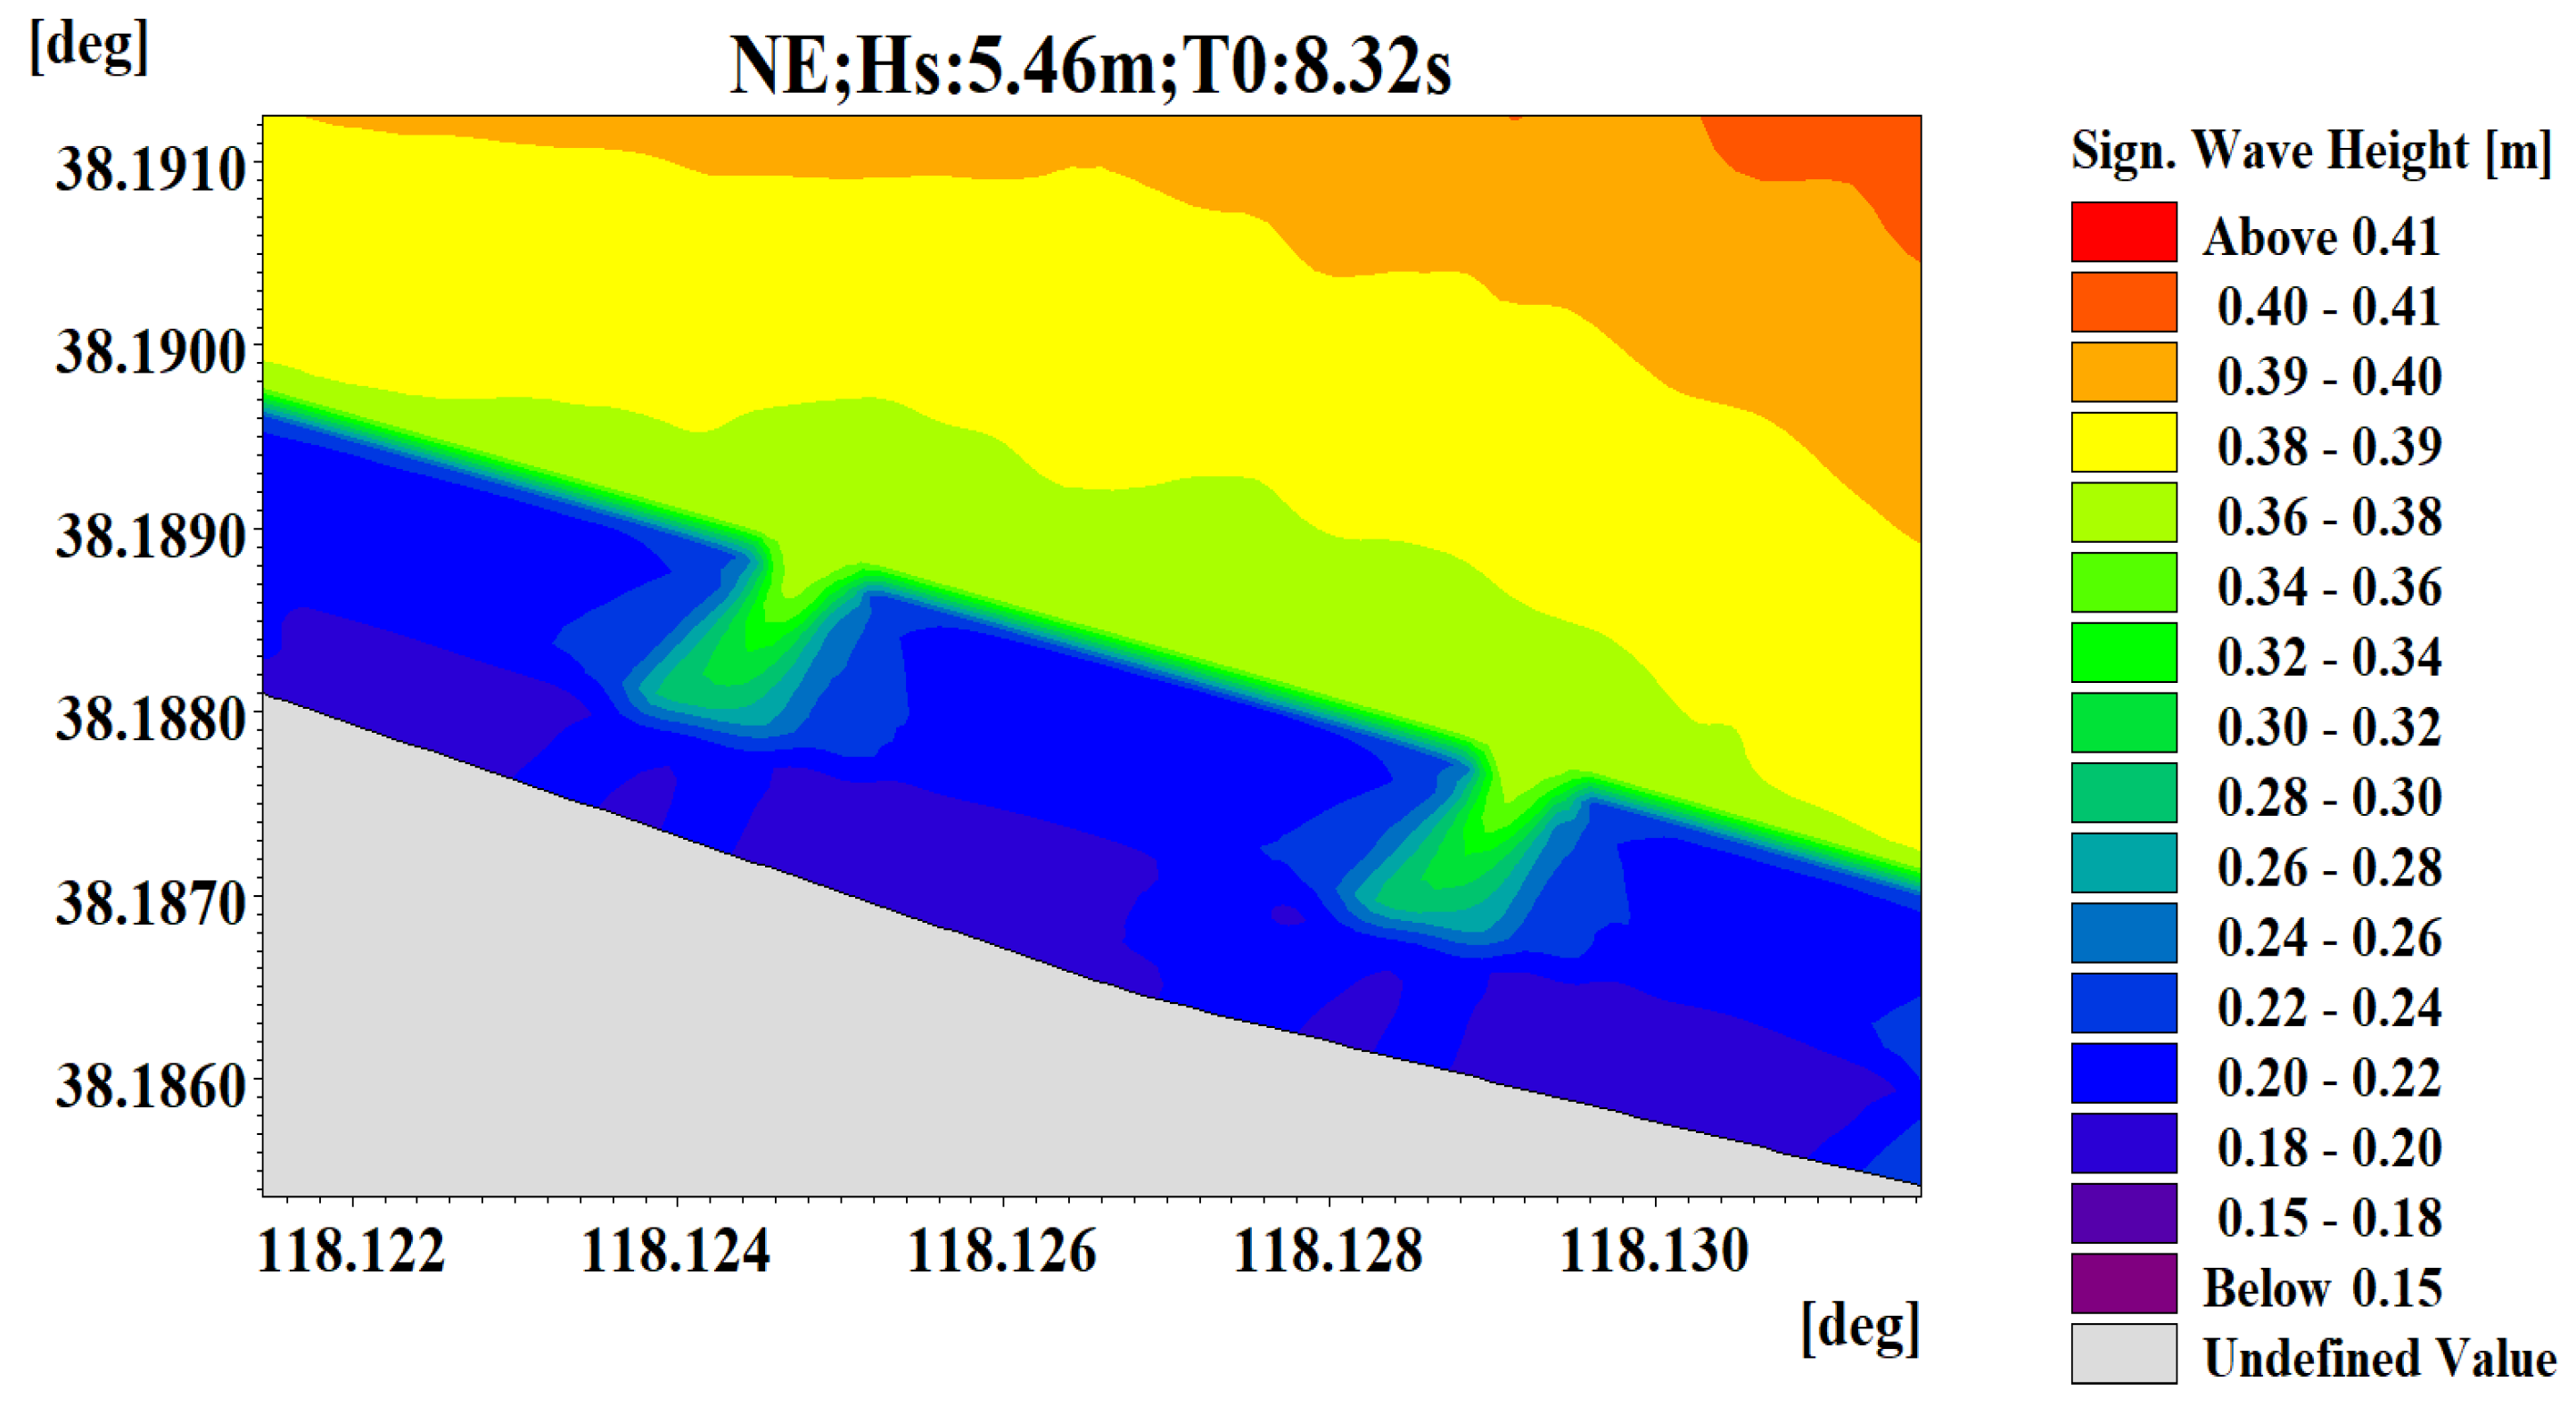
Figure 6 and
Figure 7 show the wave distribution near oyster reefs under extreme high-water-level (EHL) conditions, with the wave boundary conditions incident from the N direction with H
s of 3.2 m and T
0 of 7.13 s, and the incident from the NE direction with H
s of 5.46 m and T
0 of 8.32 s, respectively. In the figures, it can be observed that, as waves propagate from the deep-water region to the shallow-water region where the oyster reefs are located, the wave motion is hindered by the presence of the oyster reefs.
When waves encounter the front edge of the first layer of the oyster reefs, some wave energy is reflected back, forming reflected waves. Simultaneously, the remaining waves continue to propagate forward, but their height decreases due to the obstruction caused by the oyster reefs. As the waves pass through the second layer of oyster reefs, they encounter further resistance, leading to a continuous reduction in wave height.
Under the boundary conditions of the N direction with Hs of 3.2 m and T0 of 7.13 s, the significant wave heights are approximately 0.4 m in front of the first layer of the oyster reefs, 0.36 m behind the first layer, and 0.35 m behind the second layer. The wave attenuation rate for the first layer of the oyster reefs is approximately 10% and, for the second layer, it is approximately 2%. Under the boundary conditions of the NE direction with Hs of 5.46 m and T0 of 8.32 s, the significant wave heights are approximately 0.64 m in front of the first layer of oyster reefs, 0.56 m behind the first layer, and 0.52 m behind the second layer. The wave attenuation rate for the first layer of the oyster reefs is approximately 12.5% and, for the second layer, it is approximately 7%.
3.2. Wave-Dissipation Effect of Oyster Reefs Designed at DHL
Under DHL conditions, and with a wave-return period of 100 years in seven directions, the wave-dissipation effects of oyster reefs are shown in
Table 4. As can be seen from the table, in the case of DHL conditions, we also only considered the wave-dissipation rate of different oyster reefs. The dissipation effect of oyster reefs under combined A and B was not considered. Under DHL conditions, it can be seen from the results that, in the process of wave transmission from deep water to shallow water, the wave in Oyster Reef A was higher than that in front of Oyster Reef B, which proved that the wave was affected by the shallow water under this condition. The calculation showed that, under the designed water-level condition, during the wave propagation from the deep water to the shallow water, the wave height at B was reduced by 0.95~6.94% less than the wave height at A.
The wave-dissipation effect of oyster reefs under a 100-year return period in seven directions under DHL conditions is shown in
Table 4. From the results, the wave-dissipation effect of the oyster reefs was more significant under waves in seven directions after they had been deployed under high-water-level conditions, and the wave-height dissipation rate could reach 42~65%. Specifically, the wave-dissipation effect of the oyster reefs deployed in accordance with the design text was more significant for waves coming from the ENE, NE, N, and NNE directions than for waves coming from other directions. The effect on waves coming from the E, NNW, and NW directions was slightly worse.
Based on the SWAN numerical simulation, the wave-height dissipation rate of the oyster reefs after deployment was simulated according to the engineering design in the conditions of EHL and DHL. The experimental results showed that, after the deployment of oyster reefs in extreme high-water-level conditions, they can produce a wave-dissipation effect, with a wave-dissipation rate between 8% and 21%. Significant wave-dissipation effects can be produced under the designed high-water-level conditions, with a wave-height dissipation rate of 42% to 65%. Among them, the wave-dissipation effect of oyster reefs was more significant for waves coming from the ENE, NE, N, and NNE directions.
Figure 8 and
Figure 9 display the wave distribution near oyster reefs under the designed high-water-level (DHL) conditions, with wave boundary conditions incident from the N direction with H
s of 3.2 m and T
0 of 7.13 s, and incident from the NE direction with H
s of 5.46 m and T
0 of 8.32 s, respectively. From the figures, it can be observed that the wave-dissipation process is similar to the EHL conditions, as waves propagate from the deep-water region to the shallow-water region where the oyster reefs are located.
Under the boundary conditions of the N direction with Hs of 3.2 m and T0 of 7.13 s, the significant wave heights are approximately 0.26 m in front of the first layer of the oyster reefs, 0.19 m behind the first layer, and 0.18 m behind the second layer. The wave-attenuation rate for the first layer of oyster reefs is approximately 26% and, for the second layer, it is about 5.2%. Under the boundary conditions of the NE direction with Hs of 5.46 m and T0 of 8.32 s, the significant wave heights are approximately 0.37 m in front of the first layer of the oyster reefs, 0.21 m behind the first layer, and 0.19 m behind the second layer. The wave-attenuation rate for the first layer of the oyster reefs is approximately 43% and, for the second layer, it is about 9.5%.
4. Discussion and Conclusions
In coastal ecosystems, perforated oyster reefs have a greater ecological impact, compared to other types of oyster reefs. When waves encounter oyster reefs, the complex three-dimensional structure of the reefs acts as a natural buffer, dissipating the wave energy and reducing the wave height. This wave-attenuation effect brings multiple ecological benefits. Firstly, it helps protect coastal areas from erosion and storm surges, safeguarding valuable habitats, such as nearby shorelines, marshes, and seagrass beds. Additionally, the reduction in wave energy allows fine suspended sediments to settle, enhancing water clarity and improving light penetration. As a result, abundant underwater aquatic plant growth occurs within and around oyster reefs, providing vital habitats and nursery grounds for various marine species. Moreover, the wave attenuation provided by oyster reefs also reduces the pressure on seagrass blades caused by waves, promoting seagrass growth and stability, and thereby benefiting nearby seagrass beds. Therefore, studying the wave-attenuation effects of perforated oyster reefs is of significant importance in enhancing the resilience and productivity of coastal ecosystems, making them a crucial component in maintaining ecological balance and biodiversity under wave disturbances.
After the wave enters the reef, the wave-energy dissipation is mainly the bottom friction, followed by the wave fragmentation. For similar large coral reefs, the friction resistance coefficient caused by the bed microtopography can reach 0.3 magnitude, and 80% of the wave energy can be dissipated under normal weather [
33]. Wiberg et al. [
18] studied four oyster reefs in the shallow sea-bay system, and found that oyster reefs could effectively reduce wave energy, with the wave height varying by less than 10% for water depths greater than 1.5 m. The wave-energy reduction rate was about 42–44% in large wind and waves (>0.03 m) [
34]. Chowdhurv et al. [
17] showed that artificial oyster reefs were arranged in the lower intertidal zone, with the bottom bed above 0.6 m, which could effectively block waves with wave height less than 0.5 m. Wiberg et al. [
18] arranged oyster reefs at an average water depth of 0.9–1.3 m, and an average water level below 0.3–0.5 m. The result showed that the wave-height decay was fastest near the average water level, up to 30–50%. The results obtained in this manuscript are in general agreement with the above-mentioned studies.
Based on the SWAN numerical simulation, the wave-height dissipation rate of oyster reefs after deployment was simulated, according to the engineering design, under the conditions of EHL and DHL. The experimental results showed that, after the deployment of oyster reefs in extreme high-water-level conditions, they can produce a wave-dissipation effect, with a wave-dissipation rate between 8% and 21%. Significant wave-dissipation effects can be produced under the designed high-water-level conditions, with a wave-height dissipation rate of 42% to 65%. Among them, the wave-dissipation effect of oyster reefs was more significant for waves coming from the ENE, NE, N, and NNE directions.
To investigate the oyster reef in coastal ecological protection engineering, this paper adopts the SWAN numerical model to study its blocking effect on waves; however, it has certain limitations, because the grid-scale setting in SWAN was 5 m; therefore, there is not much of a computing grid on the oyster reef, which means that the waves are not clearly reflected with the change in the oyster reef. In future studies, CFD numerical model and physical model experiments can be combined, to analyze the performance and mechanism of the oyster reef on wave dissipation.
In this study, we investigated the wave-dissipation effect of oyster reefs, and explored possible dissipation mechanisms. We referred to the dissipation mechanisms of seismic waves in porous and saturated media, specifically the wave-induced fluid flow (WIFF) mechanism. The frictional dissipation mechanism in seismic wave propagation has been extensively studied in porous media. When seismic waves pass through porous media, the relative movement between solid grains and pore water converts seismic energy into heat, known as the WIFF mechanism (e.g., Bouchaala et al., 2012 and 2019). WIFF has been identified as a primary dissipation mechanism in the propagation and attenuation of seismic waves in porous media [
35,
36].
In our study, oyster reefs, as a unique type of porous medium, also experience wave-energy propagation and dissipation. While the physical processes of seismic and water waves differ, referencing the WIFF mechanism can aid in better understanding the wave-dissipation phenomenon in oyster reefs. Specifically, we can consider oyster reefs as porous media, composed of solid oyster shells and pore water. Using the analogy of seismic wave propagation in subsurface media, we can attempt to apply the WIFF mechanism to describe the energy conversion and dissipation processes of waves in oyster reefs.
However, it is essential to note that oyster reefs constitute complex ecosystems, and their internal structures and physical properties may differ from those of subsurface porous media. Therefore, when applying the WIFF mechanism to study wave dissipation in oyster reefs, we must acknowledge the existence of uncertainties and limitations. Future research can further delve into wave-dissipation mechanisms in oyster reefs, combining field observations and numerical simulations to develop more precise dissipation models, tailored to the characteristics of oyster reefs.
In conclusion, referencing the dissipation mechanisms of seismic waves in porous and saturated media has a significant guiding significance for understanding the wave- dissipation effect in oyster reefs. Drawing from the WIFF mechanism, we can provide a more comprehensive physical explanation of wave-dissipation processes in oyster reefs. Nevertheless, it is crucial to address research limitations when applying the WIFF mechanism in practical applications, and to seek more accurate dissipation models. This exploration will offer new perspectives and insights into our understanding of oyster reef ecosystems.


