

Multi-Parameter Algorithms of Remote Sensing Reflectance, Absorption and Backscattering for Coastal Waters of the Southern Baltic Sea Applied to Pomeranian Lakes
 ,
,  ,
,  ,
,  , and
, and
Abstract
1. Introduction
2. Materials and Methods
2.1. Multi-Parameter Algorithms of Rrs(λi), a(λi) and bb(λi)
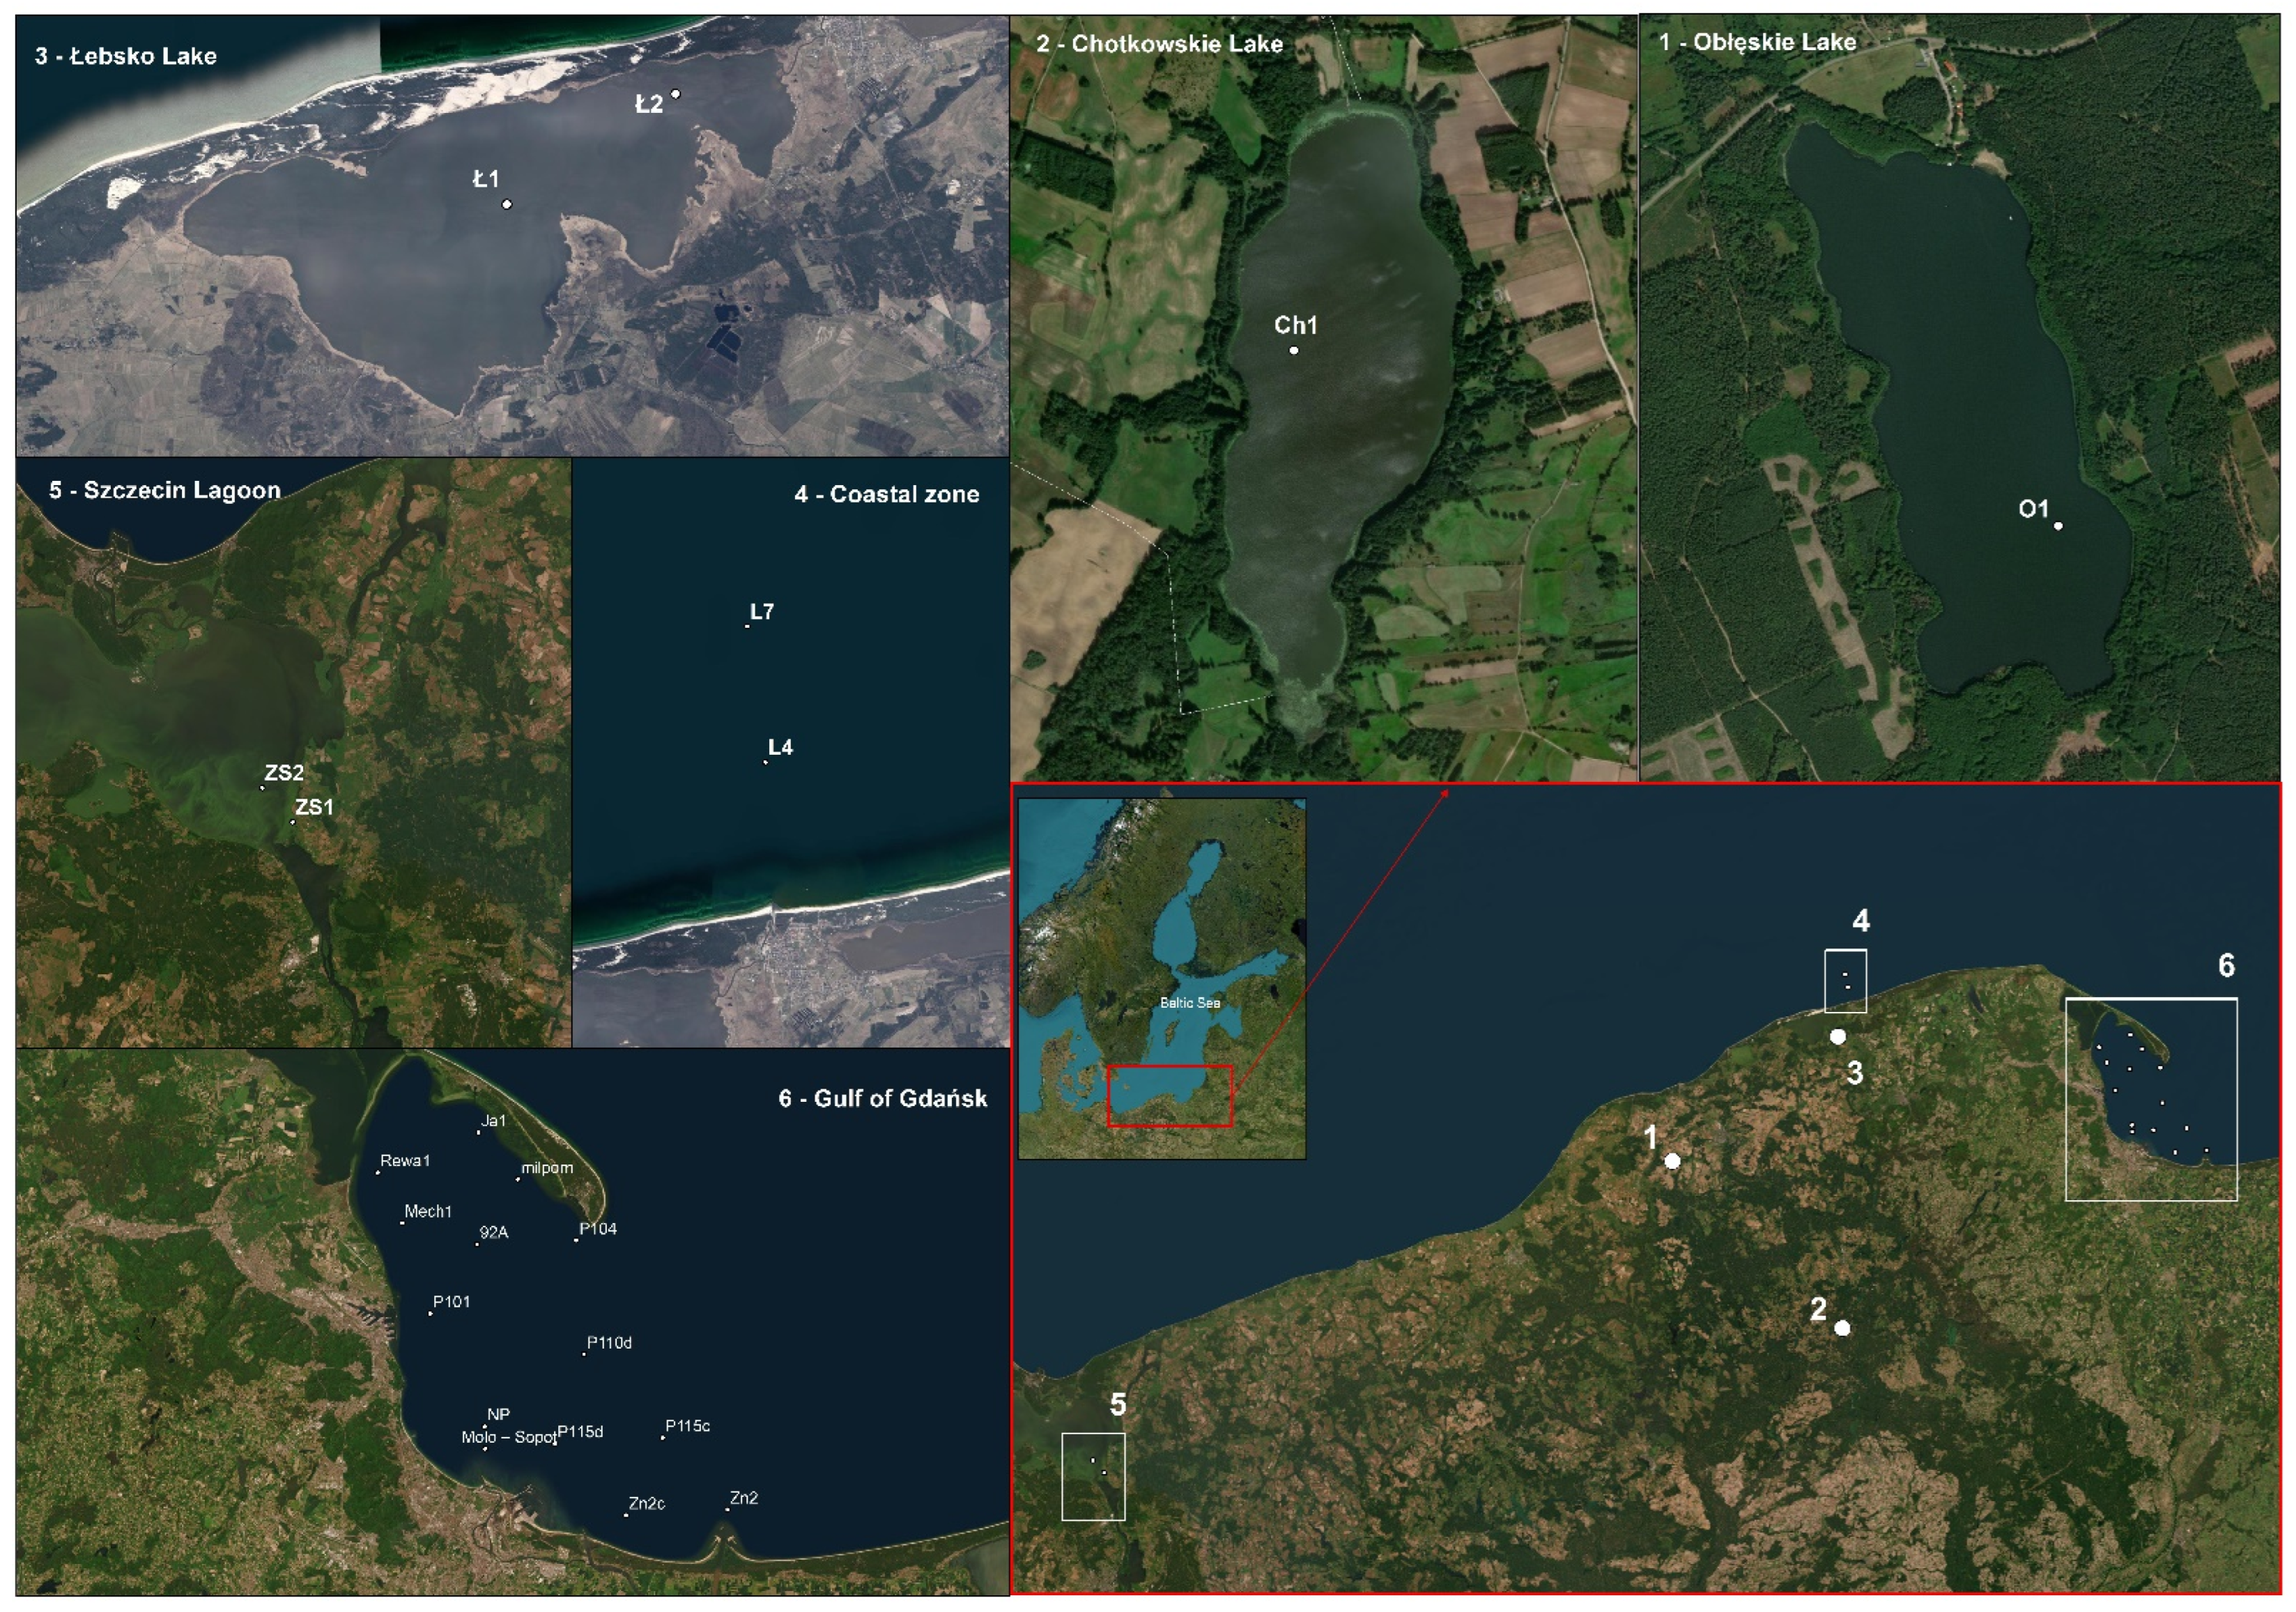
2.2. Study Area
2.3. Data Acquisition and Processing
3. Results
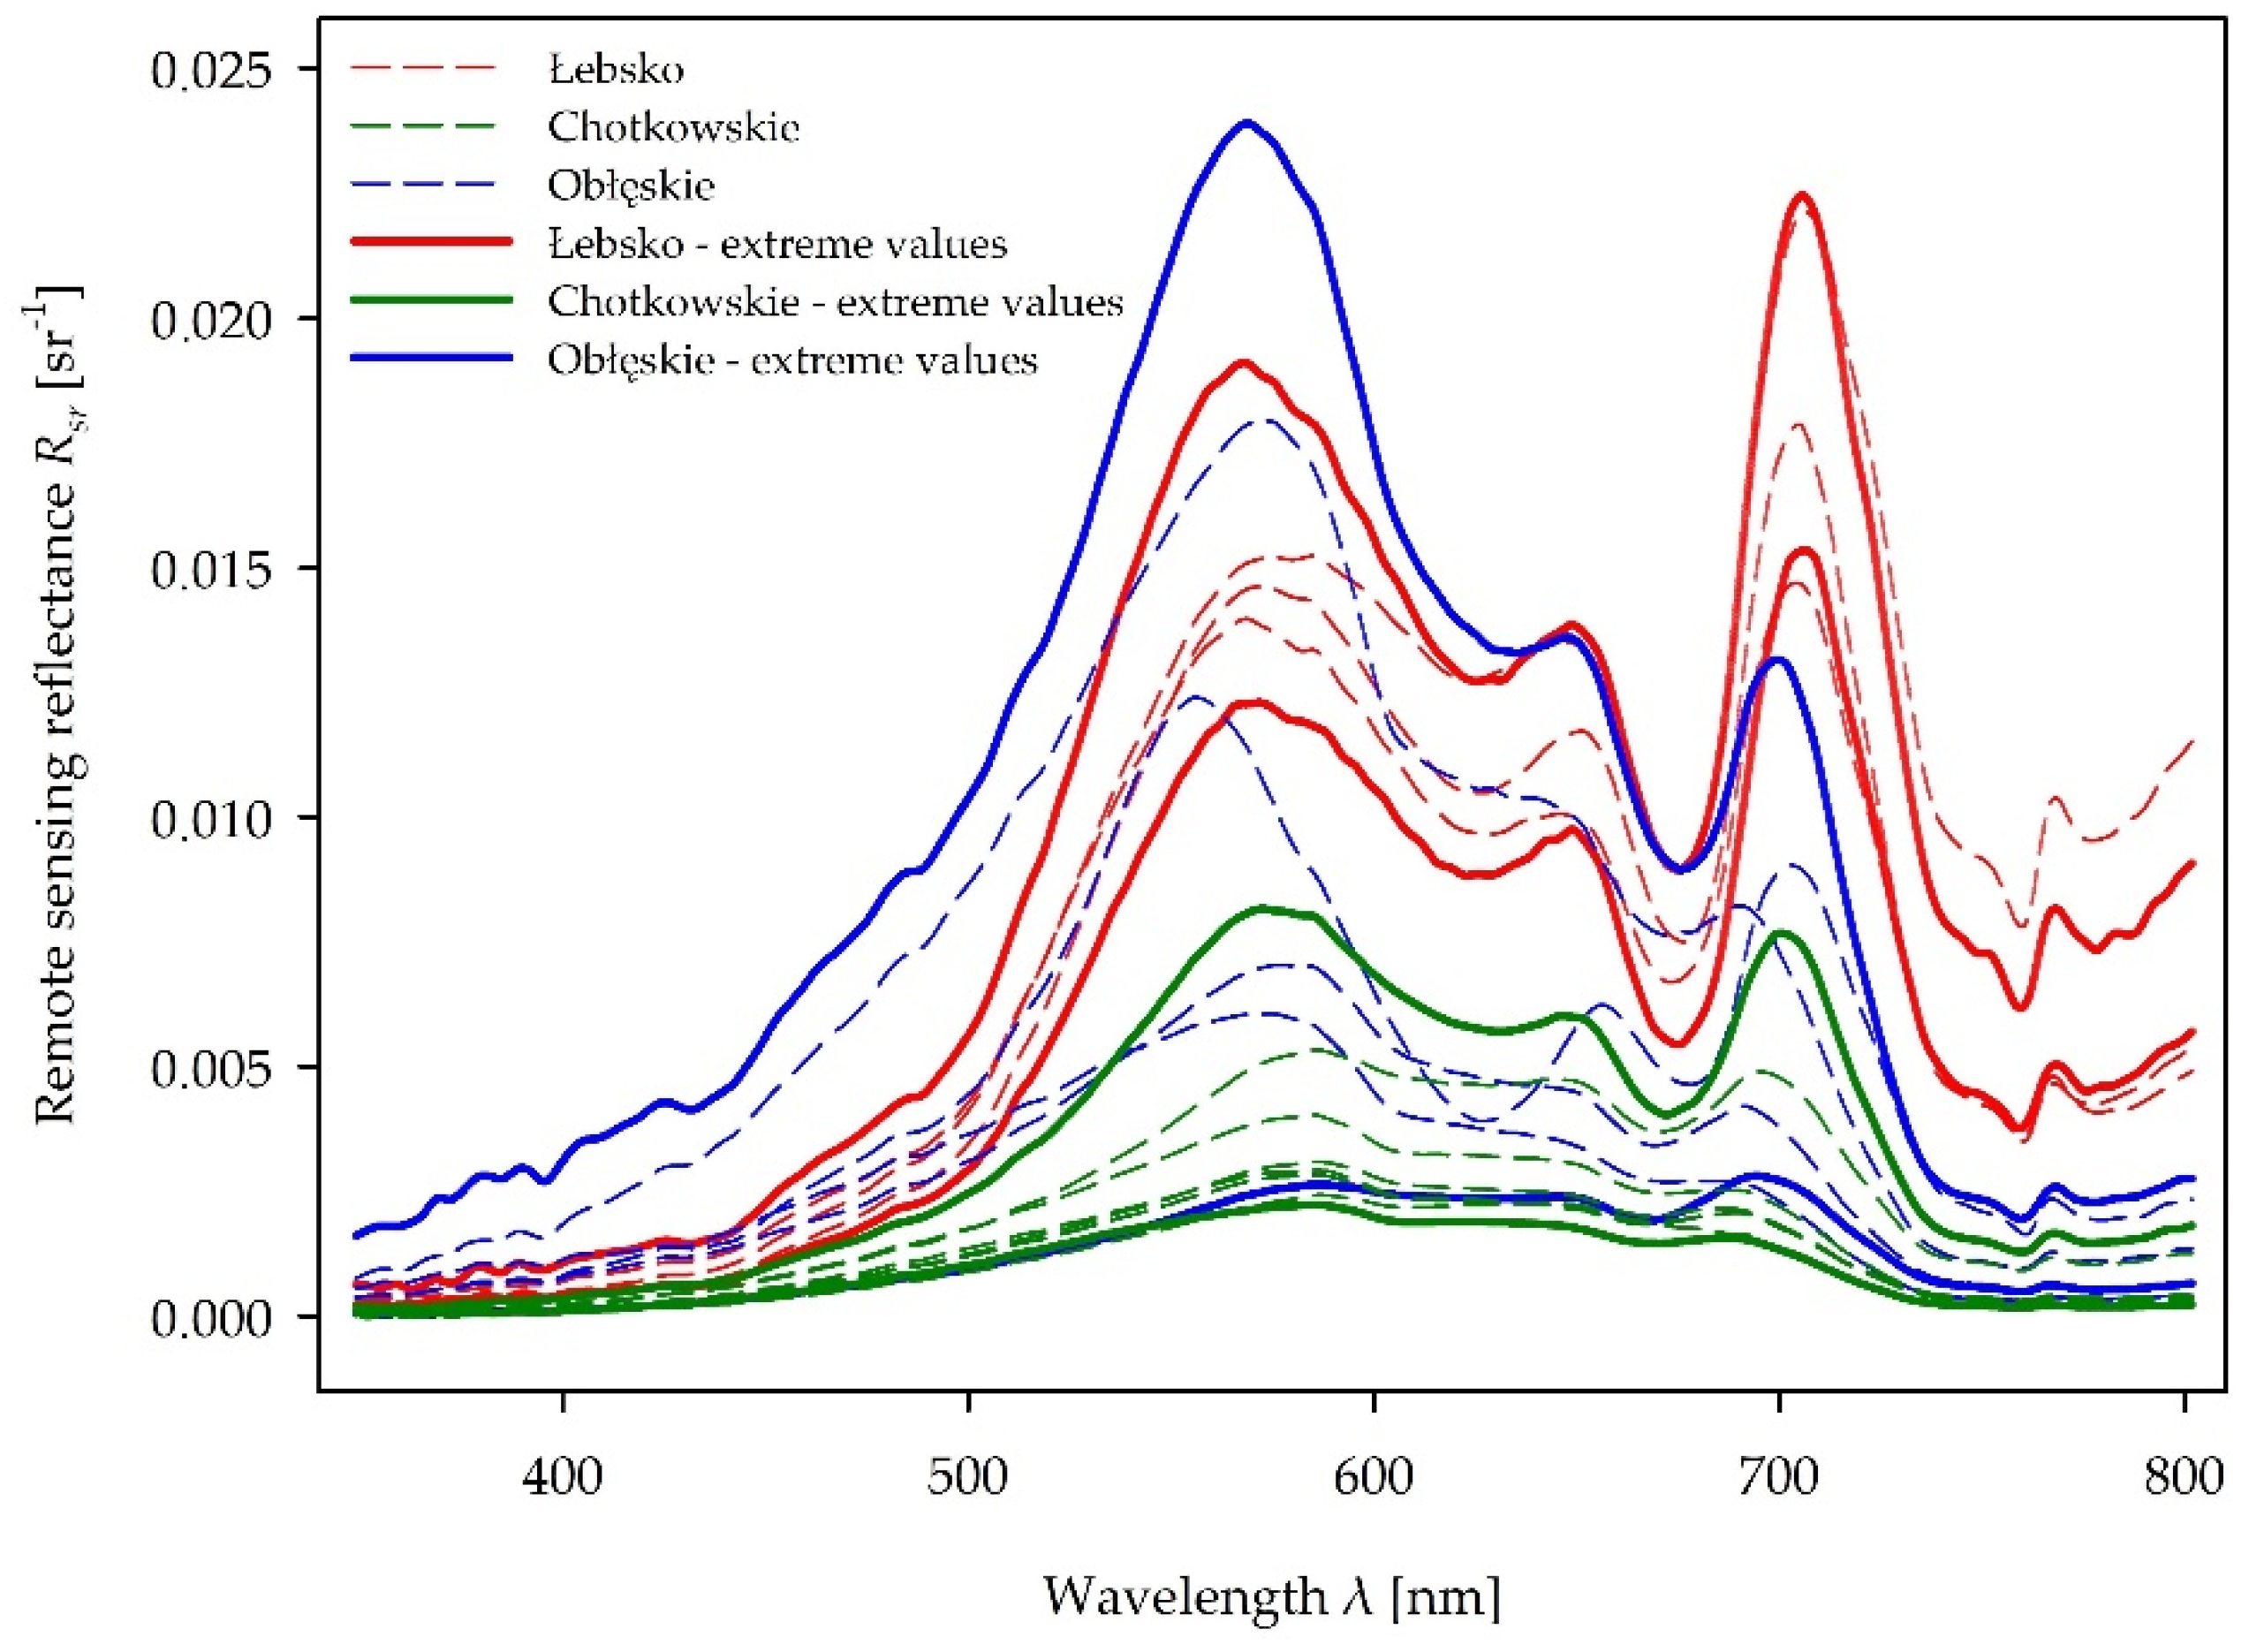
3.1. Remote Sensing Reflectance Rrs Estimated for the Lakes of the Pomeranian Lake District
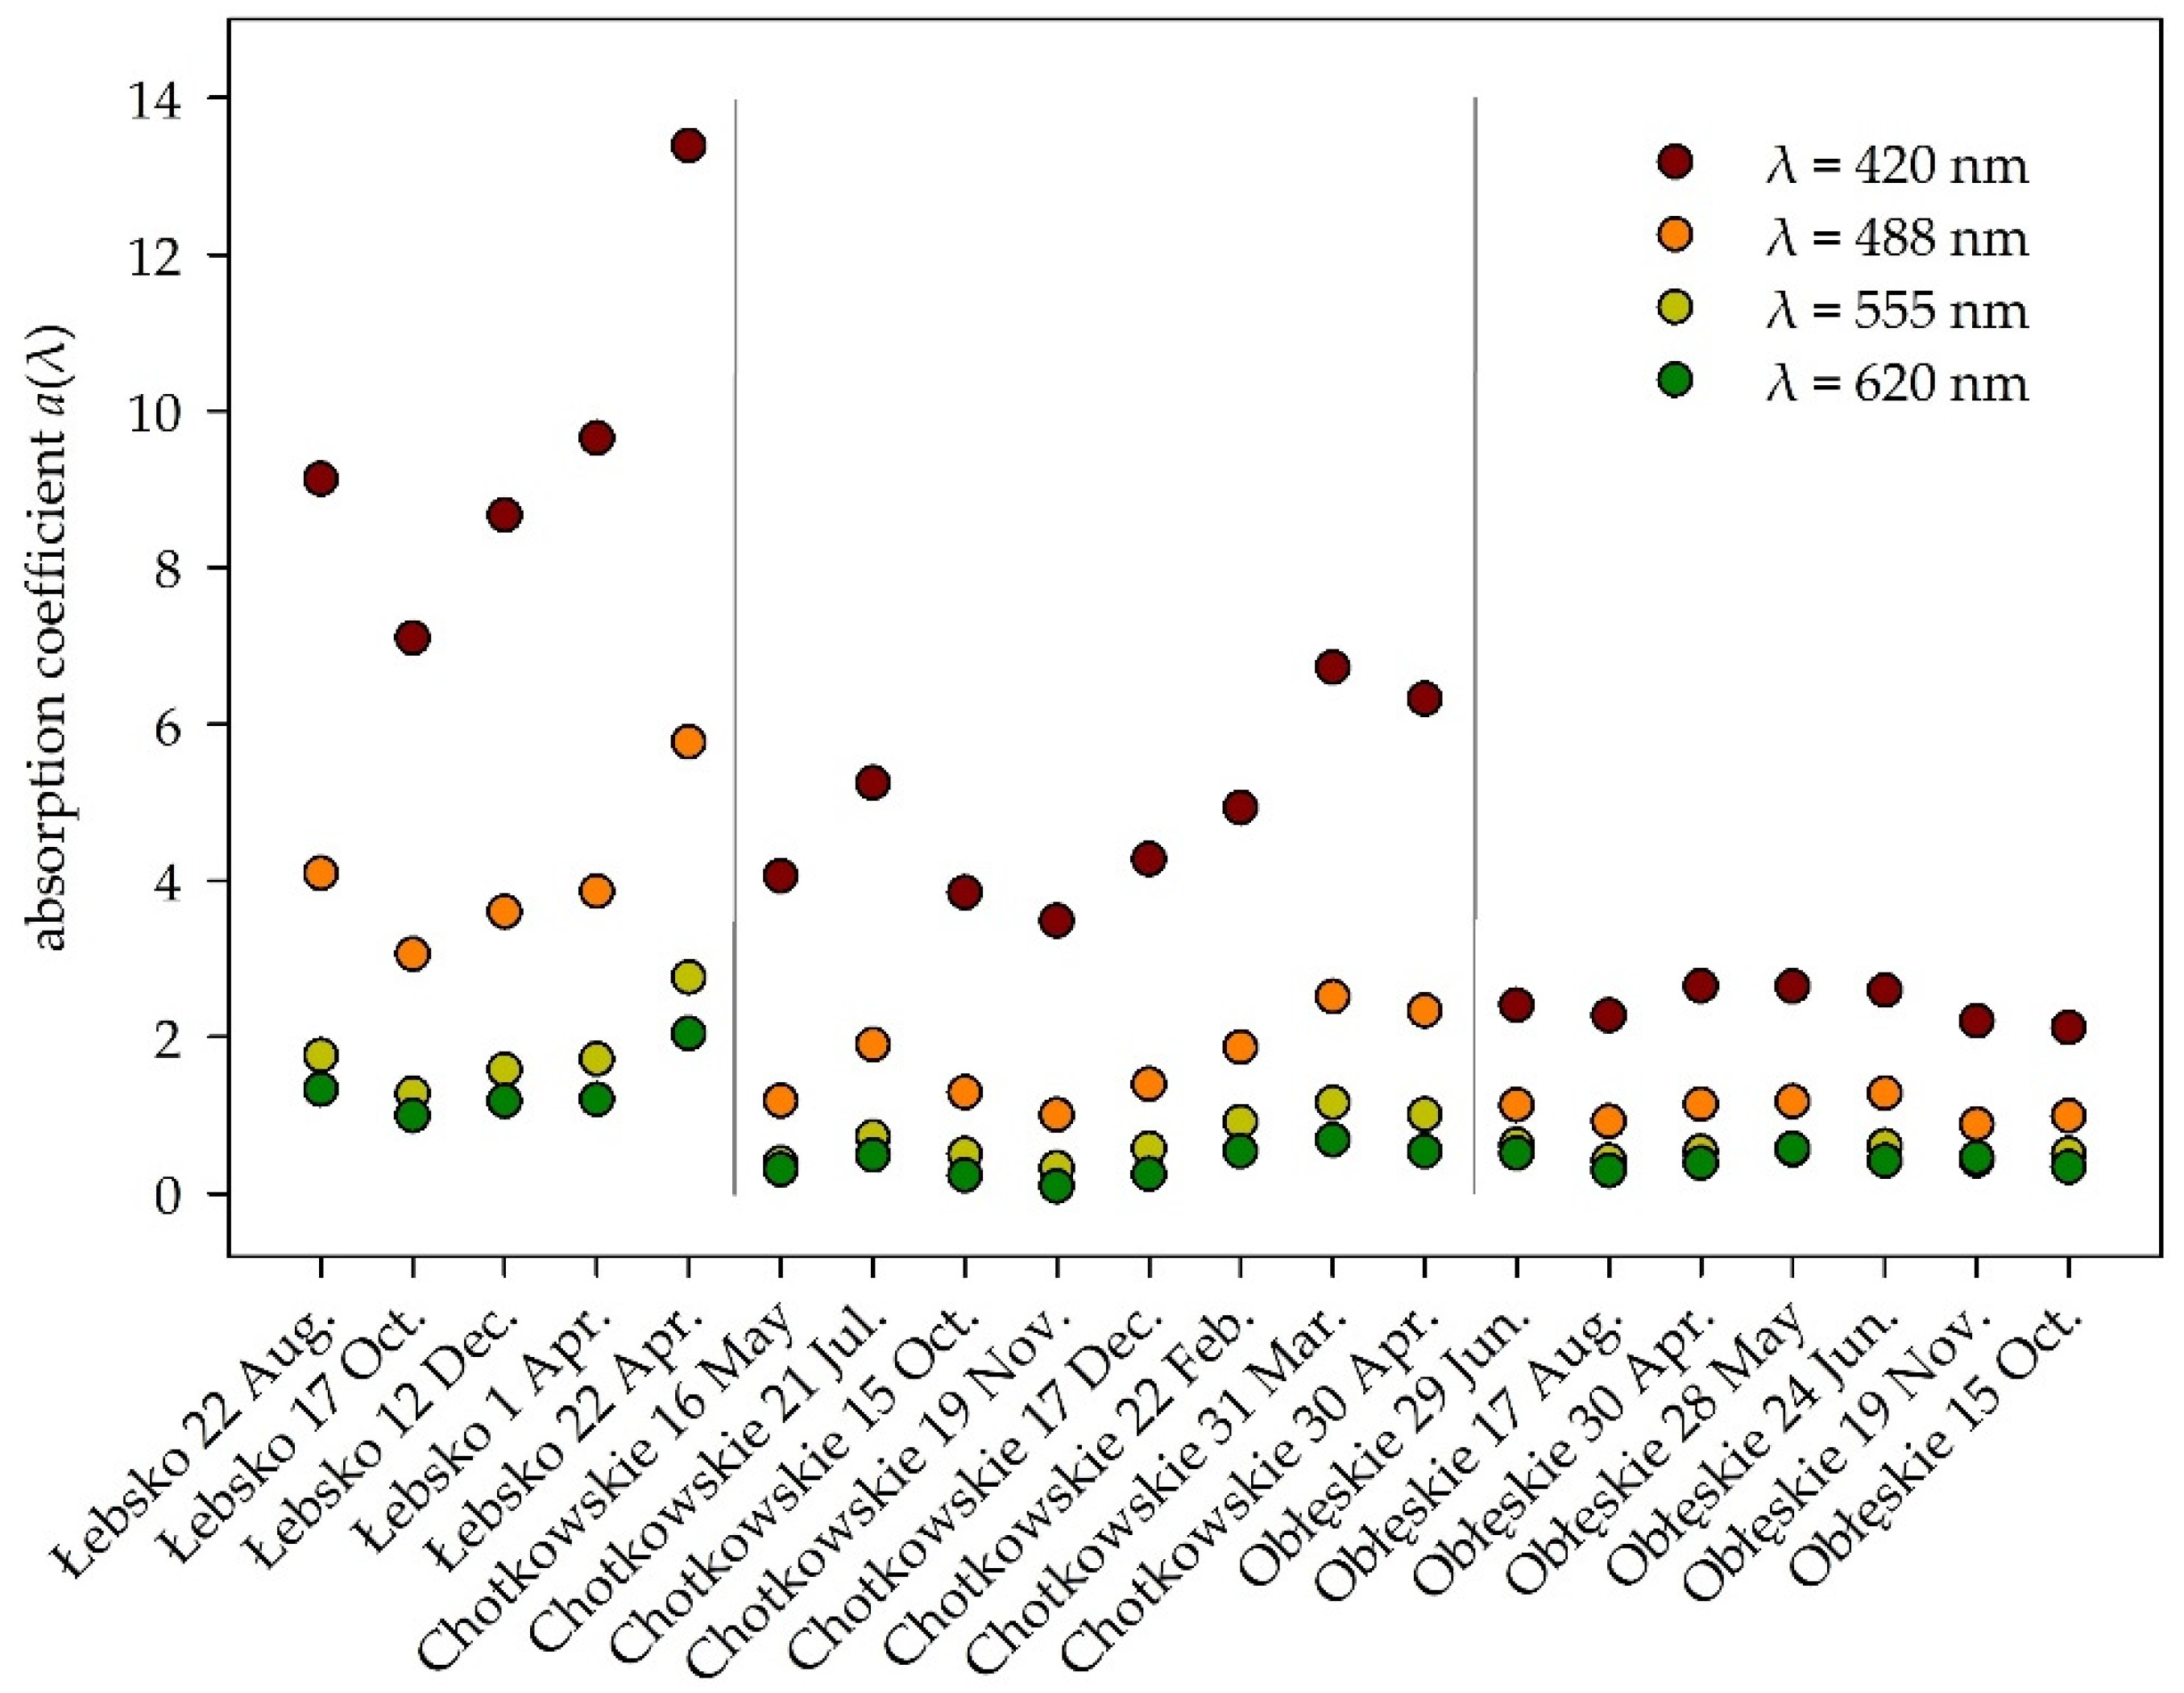
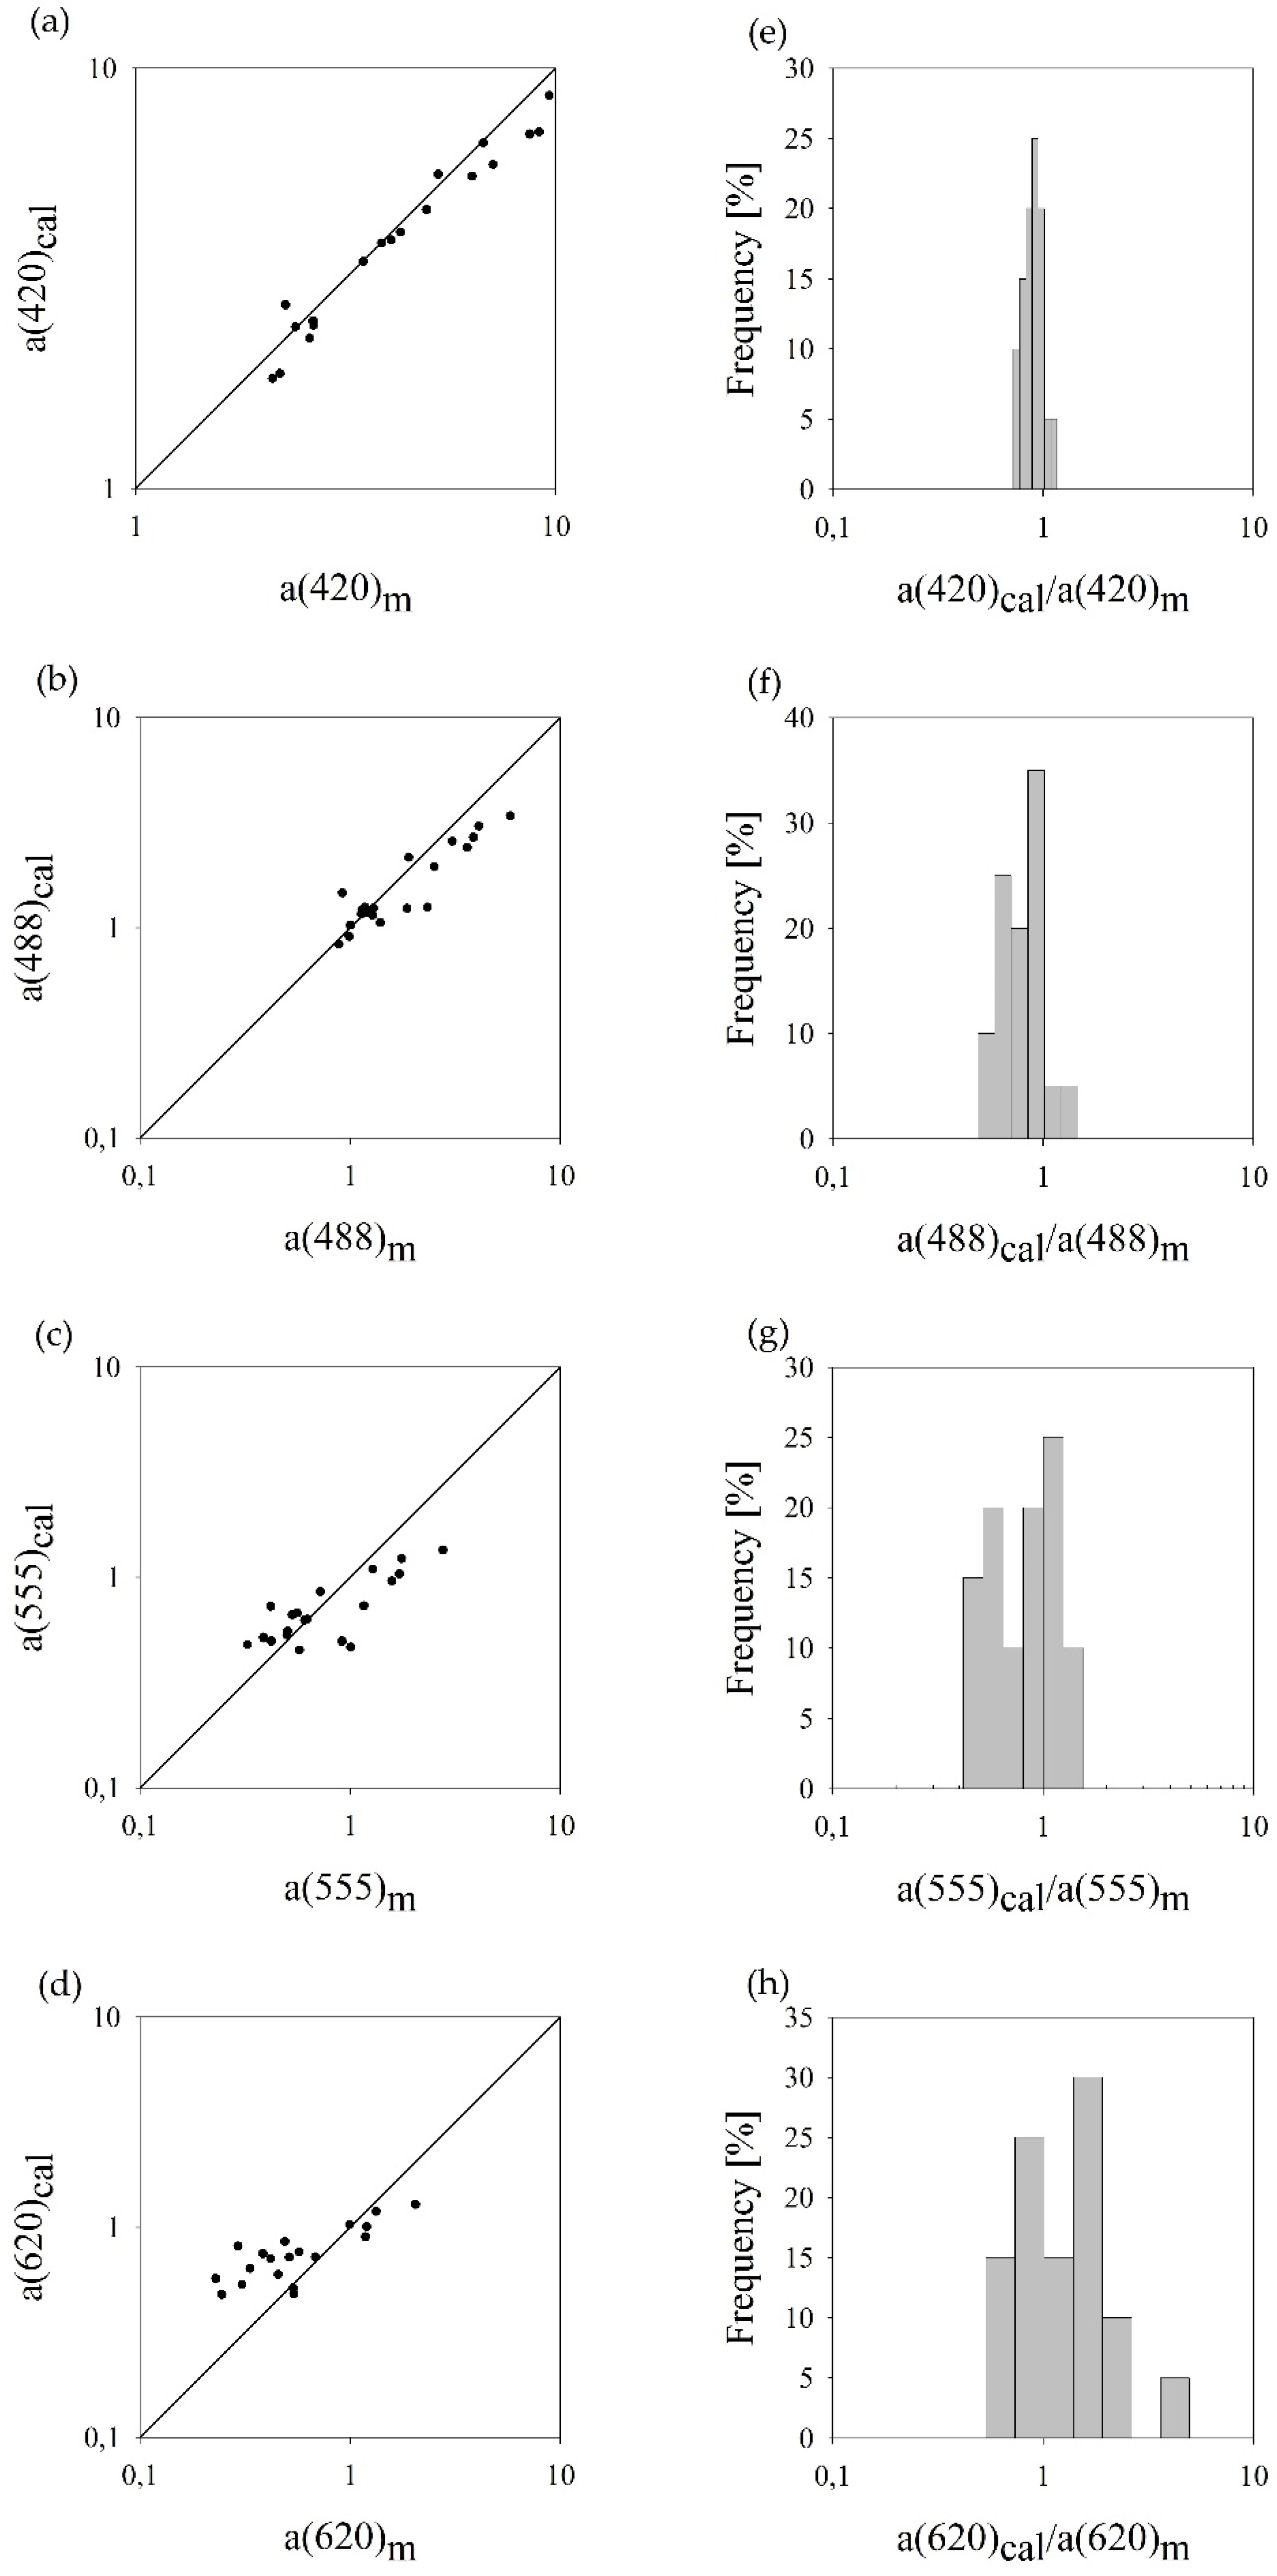
3.2. Absorption Coefficients Estimated for the Lakes of the Pomeranian Lake District
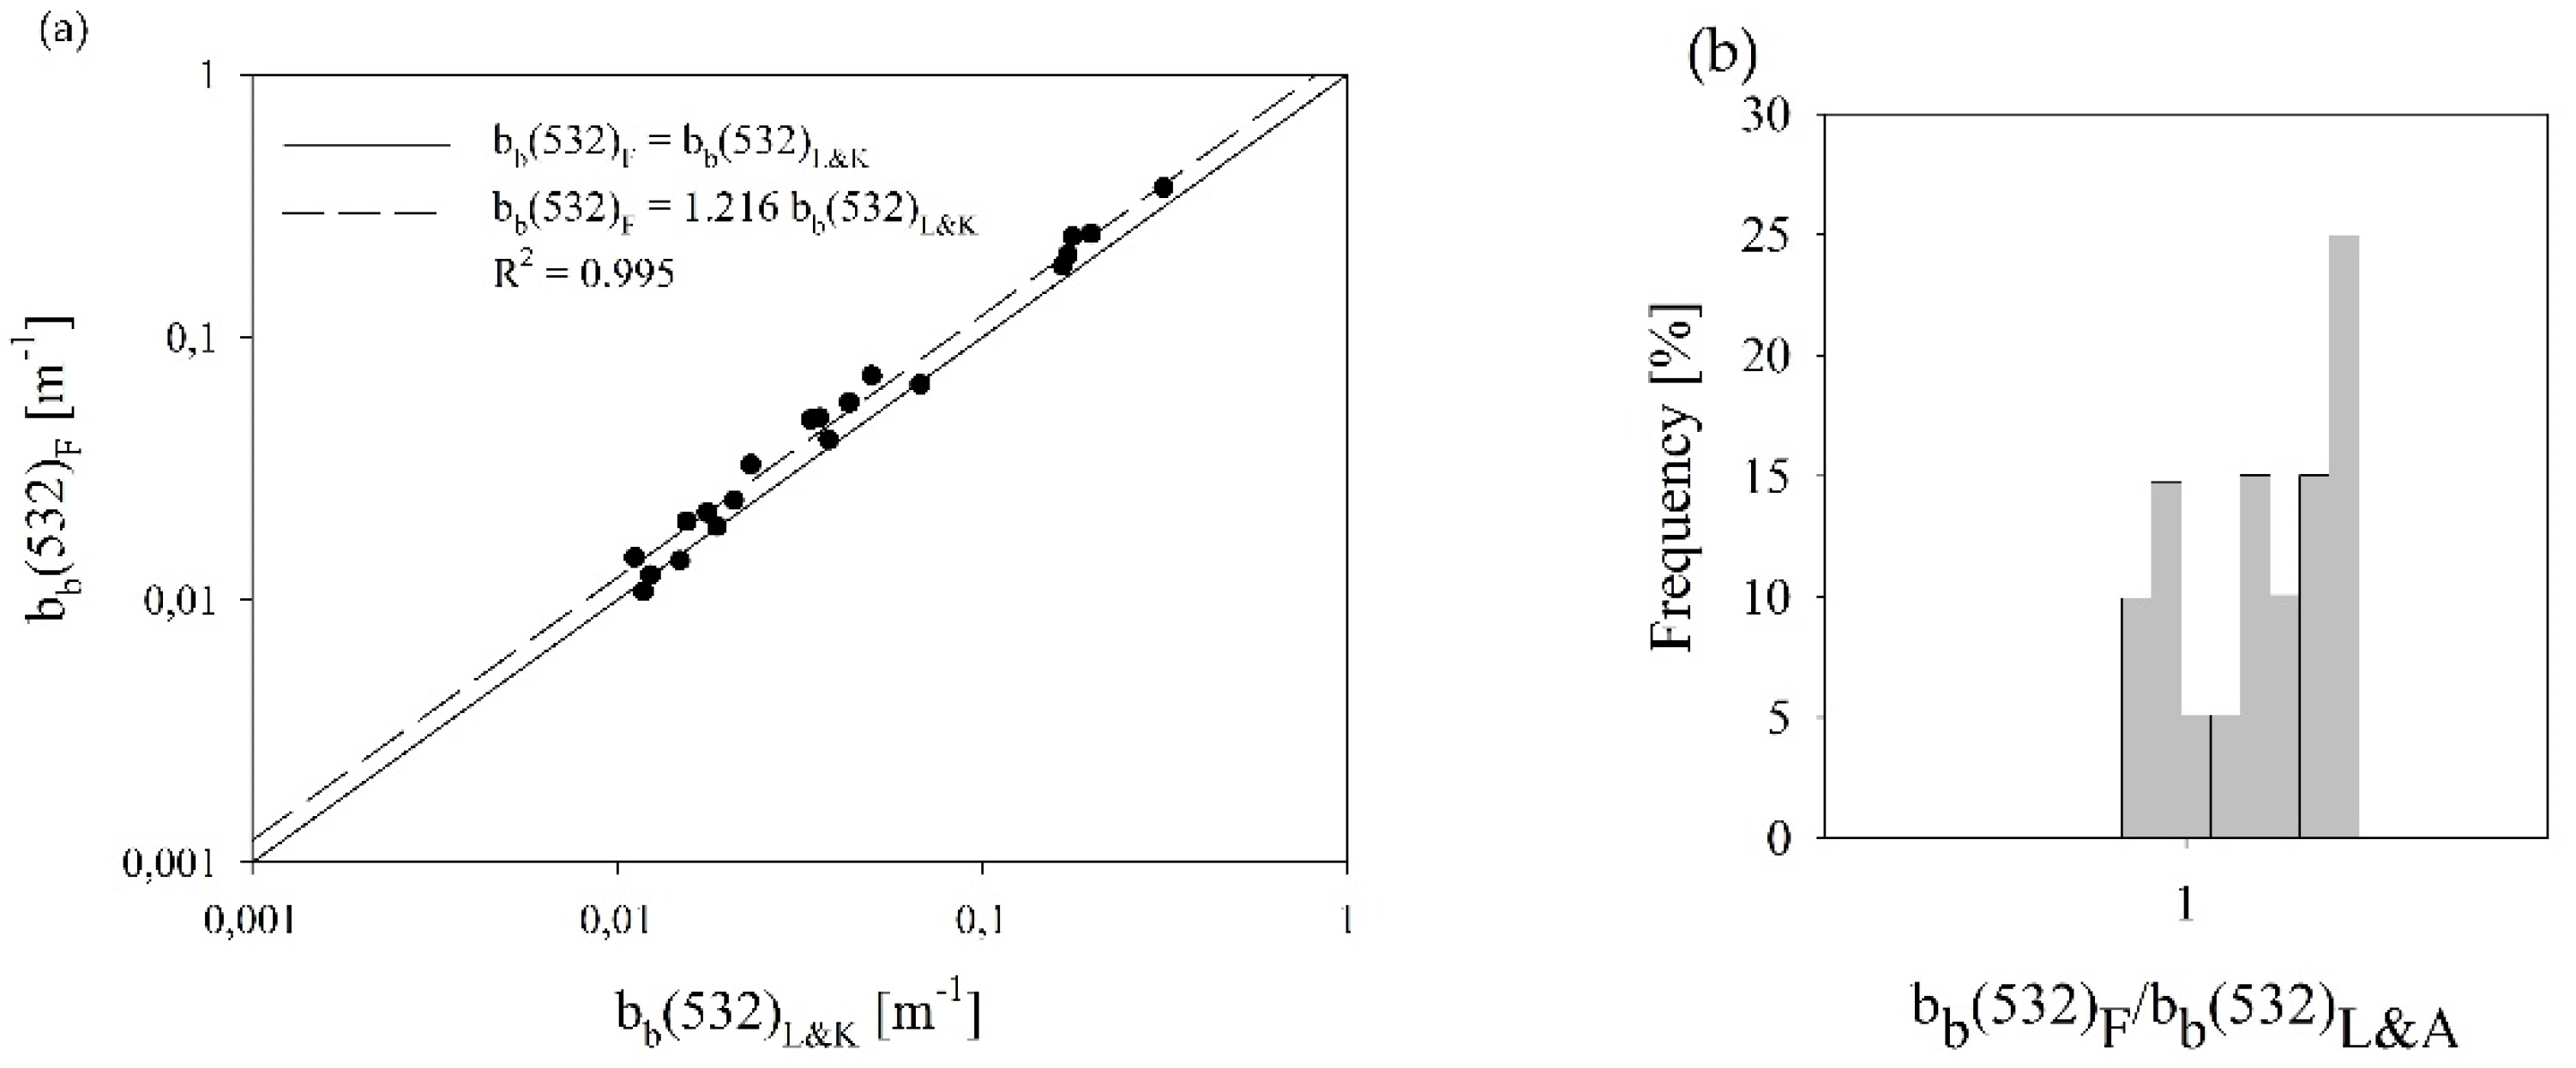
3.3. Backscatttering Coefficient Comparison between Two Algorithms
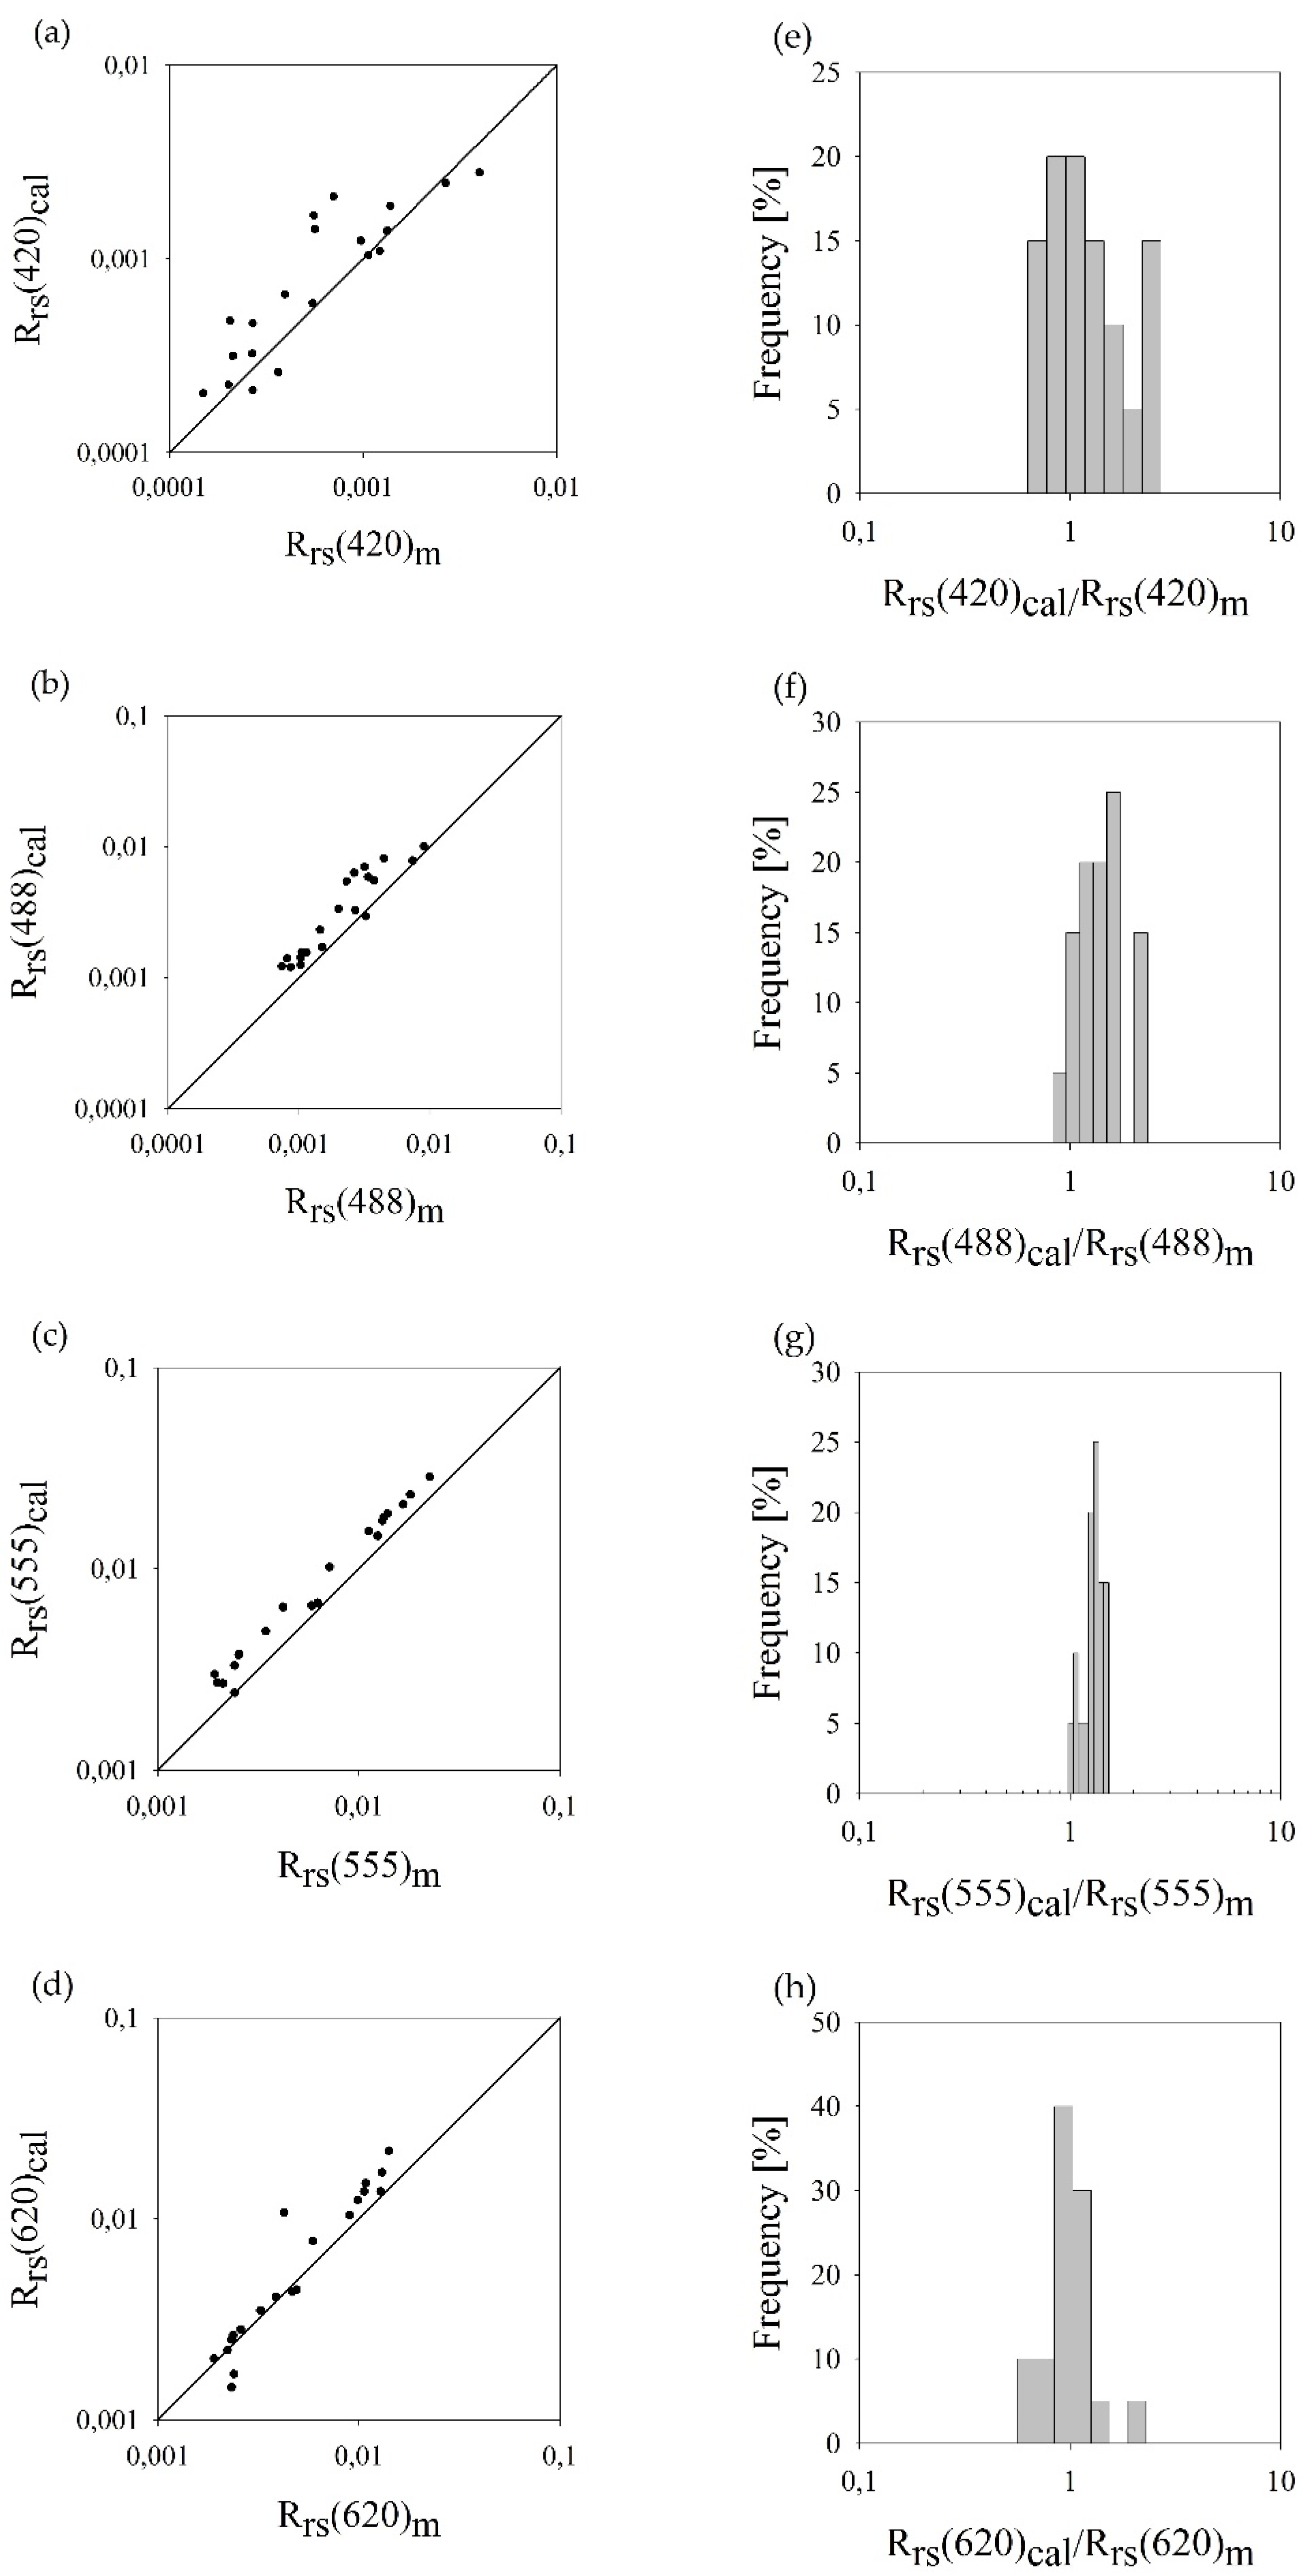
- A relative mean error of 19.89%;
- A root mean square error of 16.76%;
- A mean logarithmic error of 18.74%;
- A standard error factor x of 1.15;
- A statistical logarithmic error of 15.45% and of 13.38%.
4. Discussion
4.1. Performance of the Rrs Model in Lakes
4.2. Performance of the Absorption Model in Lakes
4.3. Performance of the Backscattering Model in Lakes
5. Conclusions
Author Contributions
Funding
Data Availability Statement
Acknowledgments
Conflicts of Interest
References
- Morel, A.; Prieur, L. Analysis of variations in ocean color. Limnol. Oceanogr. 1977, 22, 709–722. [Google Scholar] [CrossRef]
- Gordon, H.R.; Morel, A. Remote Assessment of Ocean Color for Interpretation of Satellite Visible Imagery, A Review; Springer: New York, NY, USA, 1983; p. 114. [Google Scholar]
- Morel, A. Optical modeling of the upper ocean in relation to its biogenous matter content (Case I waters). J. Geophys. Res. 1988, 93, 10749–10768. [Google Scholar] [CrossRef]
- Mobley, C.D. Light and Water: Radiative Transfer in Natural Waters; Academic Press: Cambridge, MA, USA, 1994. [Google Scholar]
- Dera, J. Marine Physics; PWN: Warszawa, Poland, 2003; pp. 1–514. [Google Scholar]
- Haule, K.; Toczek, H.; Borzycka, K.; Darecki, M. Influence of Dispersed Oil on the Remote Sensing Reflectance—Field Experiment in the Baltic Sea. Sensors 2021, 21, 5733. [Google Scholar] [CrossRef] [PubMed]
- Lednicka, B.; Kubacka, M.; Freda, W.; Haule, K.; Dembska, G.; Galer-Tatarowicz, K.; Pazikowska-Sapota, G. Water Turbidity and Suspended Particulate Matter Concentration at Dredged Material Dumping Sites in the Southern Baltic. Sensors 2022, 22, 8049. [Google Scholar] [CrossRef]
- Kaczmarek, S.; Woźniak, B. The application of the optical classification of waters in the Baltic Sea (Case 2 waters). Oceanologia 1995, 37, 285–297. [Google Scholar]
- Haule, K.; Freda, W. Remote Sensing of Dispersed Oil Pollution in the Ocean—The Role of Chlorophyll Concentration. Sensors 2021, 21, 3387. [Google Scholar] [CrossRef]
- Boniewicz-Szmyt, K.; Grzegorczyk, M.; Pogorzelski, S.; Rochowski, P. Photosynthetic signatures of microbial colonies covering submerged hard surfaces as novel trophic status indicators: Baltic Sea studies. Oceanologia 2023, 65, 194–201. [Google Scholar] [CrossRef]
- Baszanowska, E.; Otremba, Z. Detection of Oil in Seawater Based on the Fluorometric Index during the Winter Season in the Baltic Sea—The Case of the Gulf of Gdansk. Sensors 2022, 22, 6014. [Google Scholar] [CrossRef]
- Williamson, C.E.; Saros, J.E.; Vincent, W.F.; Smol, J.P. Lakes and reservoirs as sentinels, integrators, and regulators of climate change. Limnol. Oceanogr. 2009, 54, 2273–2282. [Google Scholar] [CrossRef]
- Tranvik, L.J.; Downing, J.A.; Cotner, J.B.; Loiselle, S.A.; Striegl, R.G.; Ballatore, T.J.; Dillon, P.; Finlay, K.; Fortino, K.; Knoll, L.B.; et al. Lakes and impoundments as regulators of carbon cycling and climate. Limnol. Oceanogr. 2009, 54, 2298–2314. [Google Scholar] [CrossRef]
- Ficek, D. The Bio-Optical Properties of Pomeranian Lakes and Their Comparison with the Properties of Other Lakes and the Baltic; Institute of Oceanology Polish Academy of Sciences: Sopot, Poland, 2013; pp. 1–351. [Google Scholar]
- Deutsch, E.S.; Cardille, J.A.; Koll-Egyed, T.; Fortin, M.-J. Landsat 8 Lake Water Clarity Empirical Algorithms: Large-Scale Calibration and Validation Using Government and Citizen Science Data from across Canada. Remote Sens. 2021, 13, 1257. [Google Scholar] [CrossRef]
- Soomets, T.; Uudeberg, K.; Jakovels, D.; Brauns, A.; Zagars, M.; Kutser, T. Validation and Comparison of Water Quality Products in Baltic Lakes Using Sentinel-2 MSI and Sentinel-3 OLCI Data. Sensors 2020, 20, 742. [Google Scholar] [CrossRef]
- Ogashawara, I.; Mishra, D.R.; Gitelson, A.A. Remote Sensing of Inland Waters: Background and Current State-of-the-Art. In Bio-Optical Modeling and Remote Sensing of Inland Waters; Mishra, D.R., Ogashawara, I., Gitelson, A.A., Eds.; Elsevier Inc.: Amsterdam, The Netherlands, 2017; pp. 1–24. [Google Scholar]
- Miller, R.L.; Del Castillo, C.E.; McKee, B.A. Remote Sensing of Coastal Aquatic Environments; Springer: Dordrecht, The Netherlands, 2010; pp. 1–346. [Google Scholar]
- Lednicka, B.; Otremba, Z.; Piskozub, J. Light Penetrating the Seawater Column as the Indicator of Oil Suspension-Monte Carlo Modelling for the Case of the Southern Baltic Sea. Sensors 2023, 23, 1175. [Google Scholar] [CrossRef] [PubMed]
- Seegers, B.N.; Werdell, P.J.; Vandermeulen, R.A.; Salls, W.; Stumpf, R.P.; Schaeffer, B.A.; Owens, T.J.; Bailey, S.W.; Scott, J.P.; Lofti, K.A. Satellites for long-term monitoring of inland US lakes: The MERIS time series and application for chlorophyll-a. Remote Sens. Environ. 2021, 266, 112665. [Google Scholar] [CrossRef]
- IOCCG. Synergy between Ocean Colour and Biogeochemical/Ecosystem Models; Dutkiewicz, S., Ed.; IOCCG Report Series, No. 19; International Ocean Colour Coordinating Group: Dartmouth, NS, Canada, 2020. [Google Scholar] [CrossRef]
- Lednicka, B.; Kubacka, M. Semi-empirical model of remote-sensing reflectance for chosen areas of the southern Baltic. Sensors 2022, 22, 1105. [Google Scholar] [CrossRef]
- Gordon, H.R.; Brown, O.B.; Evans, R.H.; Brown, J.W.; Smith, R.C.; Baker, K.S.; Clark, D.K. A semianalytic radiance model of ocean color. J. Geophys. Res. 1988, 93, 10909–10924. [Google Scholar] [CrossRef]
- Carder, K.L.; Chen, F.R.; Lee, Z.P.; Hawes, S.K.; Kamykowski, D. Semi-analytic Moderate-Resolution Imaging Spectrometer algorithms for chlorophyll a and absorption with bio-optical domains based on nitrate-depletion temperatures. J. Geophys. Res. 1999, 104, 5403–5422. [Google Scholar] [CrossRef]
- Maritorena, S.; Siegel, D.A.; Peterson, A. Optimization of a semi-analytical ocean color model for global scale applications. Appl. Opt. 2002, 41, 2705–2714. [Google Scholar] [CrossRef]
- Majchrowski, R.; Stoń-Egiert, J.; Ostrowska, M.; Woźniak, B.; Ficek, D.; Lednicka, B.; Dera, J. Remote sensing of vertical phytoplankton pigment distributions in the Baltic: New mathematical expressions. Part 2: Accessory pigment distribution. Oceanologia 2007, 49, 491–511. [Google Scholar]
- Woźniak, S.B.; Meler, J.; Lednicka, B.; Zdun, A.; Stoń-Egiert, J. Inherent optical properties of suspended particulate matter in the southern Baltic Sea. Oceanologia 2011, 53, 691–729. [Google Scholar]
- Meler, J.; Kowalczuk, P.; Ostrowska, M.; Ficek, D.; Zabłocka, M.; Zdun, A. Parameterization of the light absorption properties of chromophoric dissolved organic matter in the Baltic Sea and Pomeranian lakes. Ocean. Sci. 2016, 12, 1013–1032. [Google Scholar] [CrossRef]
- Wang, G.; Lee, Z.; Mouw, C. Multi-Spectral Remote Sensing of Phytoplankton Pigment Absorption Properties in Cyanobacteria Bloom Waters: A Regional Example in the Western Basin of Lake Erie. Remote Sens. 2017, 9, 1309. [Google Scholar] [CrossRef]
- Odermatt, D.; Gitelson, A.; Brando, V.E.; Schaepman, M. Review of constituent retrieval in optically deep and complex waters from satellite imagery. Remote Sens. Environ. 2012, 118, 116–126. [Google Scholar] [CrossRef]
- Malthus, T.J.; Lehmann, E.; Ho, X.; Botha, E.; Anstee, J. Implementation of a satellite based inland water algal bloom alerting system using analysis ready data. Remote Sens. 2019, 11, 2954. [Google Scholar] [CrossRef]
- Sagan, V.; Peterson, K.T.; Maimaitijiang, M.; Sidike, P.; Sloan, J.; Greeling, B.A.; Maalouf, S.; Adams, C. Monitoring inland water quality using remote sensing: Potential and limitations of spectral indices, bio-optical simulations, machine learning, and cloud computing. Earth-Sci. Rev. 2020, 205, 103187. [Google Scholar] [CrossRef]
- Bresciani, M.; Giardino, C.; Fabbretto, A.; Pellegrino, A.; Mangano, S.; Free, G.; Pinardi, M. Application of New Hyperspectral Sensors in the Remote Sensing of Aquatic Ecosystem Health: Exploiting PRISMA and DESIS for Four Italian Lakes. Resources 2022, 11, 8. [Google Scholar] [CrossRef]
- Jiang, H.; Liu, Y.; Lu, J. A new algorithm for monitoring backflow from river to lake (BRL) using satellite images: A case of Poyang Lake, China. Water 2021, 13, 1166. [Google Scholar] [CrossRef]
- Morel, A. Optical properties of pure water and pure sea water. In Optical Aspects of Oceanography; Jerlov, N.G., Nielsen, E.S., Eds.; Academic Pres: New York, NY, USA, 1974; pp. 1–24. [Google Scholar]
- Smith, R.C.; Baker, K.S. Optical properties of the clearest natural waters (200–800 nm). Appl. Opt. 1981, 20, 177–184. [Google Scholar] [CrossRef]
- Baranowski, D.; Chlost, I. Baltic Coastal Zone. J. Ecol. Prot. Coastline 2009, 13, 109–119. [Google Scholar]
- Ficek, D.; Zapadka, T.; Dera, J. Remote sensing reflectance of Pomeranian lakes and the Baltic. Oceanologia 2011, 53, 959–970. [Google Scholar] [CrossRef]
- Pápista, É.; Ács, É.; Böddi, B. Chlorophyll-a determination with ethanol—A critical test. Hydrobiologia 2002, 485, 191–198. [Google Scholar] [CrossRef]
- Woźniak, S.B.; Darecki, M.; Zabłocka, M.; Burska, D.; Dera, J. New simple statistical formulas for estimating surface concentrations of suspended particulate matter (SPM) and particulate organic carbon (POC) from remote-sensing reflectance in the southernBaltic Sea. Oceanologia 2016, 58, 161–175. [Google Scholar] [CrossRef]
- Stoń, J.; Kosakowska, A. Phytoplankton pigments designation—An application of RP-HPLC in qualitative and quantitative analysis. J. Appl. Phycol. 2002, 14, 205–210. [Google Scholar] [CrossRef]
- Kowalczuk, P. The absorption of yellow substance in the Baltic Sea. Oceanologia 2002, 44, 287–288. [Google Scholar]
- Nima, C.; Frette, Ø.; Hamre, B.; Stamnes, J.J.; Chen, Y.C.; Sørensen, K.; Norli, M.; Lu, D.; Xing, Q.; Muyimbwa, D.; et al. CDOM Absorption Properties of Natural Water Bodies along Extreme Environmental Gradients. Water 2019, 11, 1988. [Google Scholar] [CrossRef]
- Morel, A.; Gentili, B. Diffuse reflectance of oceanic waters. III. Implication of bidirectionality for the remote-sensing problem. Appl. Opt. 1996, 35, 4850–4862. [Google Scholar] [CrossRef]
- Zhang, Y.; Liu, M.; Qin, B.; van der Woerd, H.J.; Li, J.; Li, Y. Modeling Remote-Sensing Reflectance and Retrieving Chlorophyll-a Concentration in Extremely Turbid Case-2 Waters (Lake Taihu, China). IEEE Trans. Geosci. Remote Sens. 2009, 47, 1937–1948. [Google Scholar] [CrossRef]
- Woźniak, B.; Dera, J. Light Absorption in Sea Water; Springer: New York, NY, USA, 2007; pp. 1–452. [Google Scholar]
- Saiyidah Munirah, M.H.; Jafar-Sidik, M.; Nurzaliah, A.; Chen, C.-A.; Robert, J.W.B.; Suffian, I.; Noir, P.P. Dynamics of absorption properties of CDOM and its composition in Likas estuary, North Borneo, Malaysia. Oceanologia 2022, 64, 583–594. [Google Scholar]
- Xue, K.; Ma, R.; Wang, D.; Shen, M. Optical Classification of the Remote Sensing Reflectance and Its Application in Deriving the Specific Phytoplankton Absorption in Optically Complex Lakes. Remote Sens. 2019, 11, 184. [Google Scholar] [CrossRef]
- Effler, S.W.; Peng, F.; O’Donnell, D.M.; Strait, C. The backscattering coefficient and its components in the Great Lakes: A review and synthesis. J. Great Lakes Res. 2013, 39, 108–122. [Google Scholar] [CrossRef]
- Guofeng, W.; Lijuan, C.; Hongtao, D.; Teng, F.; Yaolin, L. Absorption and backscattering coefficients and their relations to water constituents of Poyang Lake, China. Appl. Opt. 2011, 50, 6358–6368. [Google Scholar]
- Kutser, T.; Hiire, M.; Metsamaa, L.; Vahtmäe, E.; Paavel, B.; Aps, R. Field measurements of spectral backscattering coefficient of the Baltic Sea and boreal lakes. Boreal Environ. Res. 2009, 14, 305–312. [Google Scholar]


| λi | 420 | 488 | 555 | 620 |
|---|---|---|---|---|
| B1 | 0.009 | 0.006 | 0.005 | 0.004 |
| B2 | 0.911 | 0.891 | 0.935 | 0.881 |
| B3 | 0.337 | 0.827 | 0.977 | 1.230 |
| O1 | 0.077 | 0.624 | 1.037 | 1.488 |
| O2 | 1.006 | 1.077 | 1.072 | 1.136 |
| O3 | 0.132 | 0.485 | 0.689 | 0.794 |
| D1 | 0.057 | 0.035 | 0.022 | 0.015 |
| D2 | 0.807 | 0.762 | 0.646 | 0.592 |
| D3 | 0.750 | 0.903 | 1.157 | 1.542 |
| P1 | 0.041 | 0.022 | 0.011 | 0.007 |
| P2 | 0.827 | 0.820 | 0.815 | 0.926 |
| P3 | 0.493 | 0.824 | 0.257 | 0.261 |
| bbw | 0.0023 | 0.0012 | 0.0007 | 0.0004 |
| aw | 0.0045 | 0.0147 | 0.0596 | 0.2755 |
| f/Q | 0.07 | 0.10 | 0.12 | 0.13 |
| Arithmetic Statistic of Rrs(λ) [%] | Rrs(420) | Rrs(488) | Rrs(555) | Rrs(620) | |
|---|---|---|---|---|---|
| Relative mean error | 45.41 | 54.96 | 32.74 | 17.42 | |
| RMSE—root mean square error of ε | 71.34 | 41.84 | 14.77 | 38.72 | |
| Logarithmic Statistic of Rrs(λ) [%] | Rrs(420) | Rrs(488) | Rrs(555) | Rrs(620) | |
| Mean logarithmic error | 31.58 | 49.86 | 31.92 | 12.61 | |
| Standard error factor | 1.56 | 1.30 | 1.12 | 1.33 | |
| Statistical logarithmic errors | 56.25 | 30.27 | 12.25 | 33.21 | |
| −36.00 | −23.24 | −10.91 | −24.93 | ||
| where: Xi,m—measured values of Rrs(λi); Xi,cal—estimated values of Rrs(λi), | |||||
| Arithmetic Statistic of a(λ) [%] | a(420) | a(488) | a(555) | a(620) | |
|---|---|---|---|---|---|
| Relative mean error | −7.49 | −10.35 | −3.66 | 65.97 | |
| RMSE—root mean square error of ε | 10.65 | 23.92 | 35.63 | 11.07 | |
| Logarithmic Statistic of a(λ) [%] | a(420) | a(488) | a(555) | a(620) | |
| Mean logarithmic error | −8.05 | −13.14 | −10.08 | 42.82 | |
| Standard error factor | 1.12 | 1.29 | 1.48 | 1.69 | |
| Statistical logarithmic errors | 29.19 | 47.51 | 69.26 | 33.21 | |
| −22.59 | −32.21 | −40.92 | −24.93 | ||
| where: Xi,m—measured values of a(λi); Xi,cal—estimated values of a(λi), | |||||
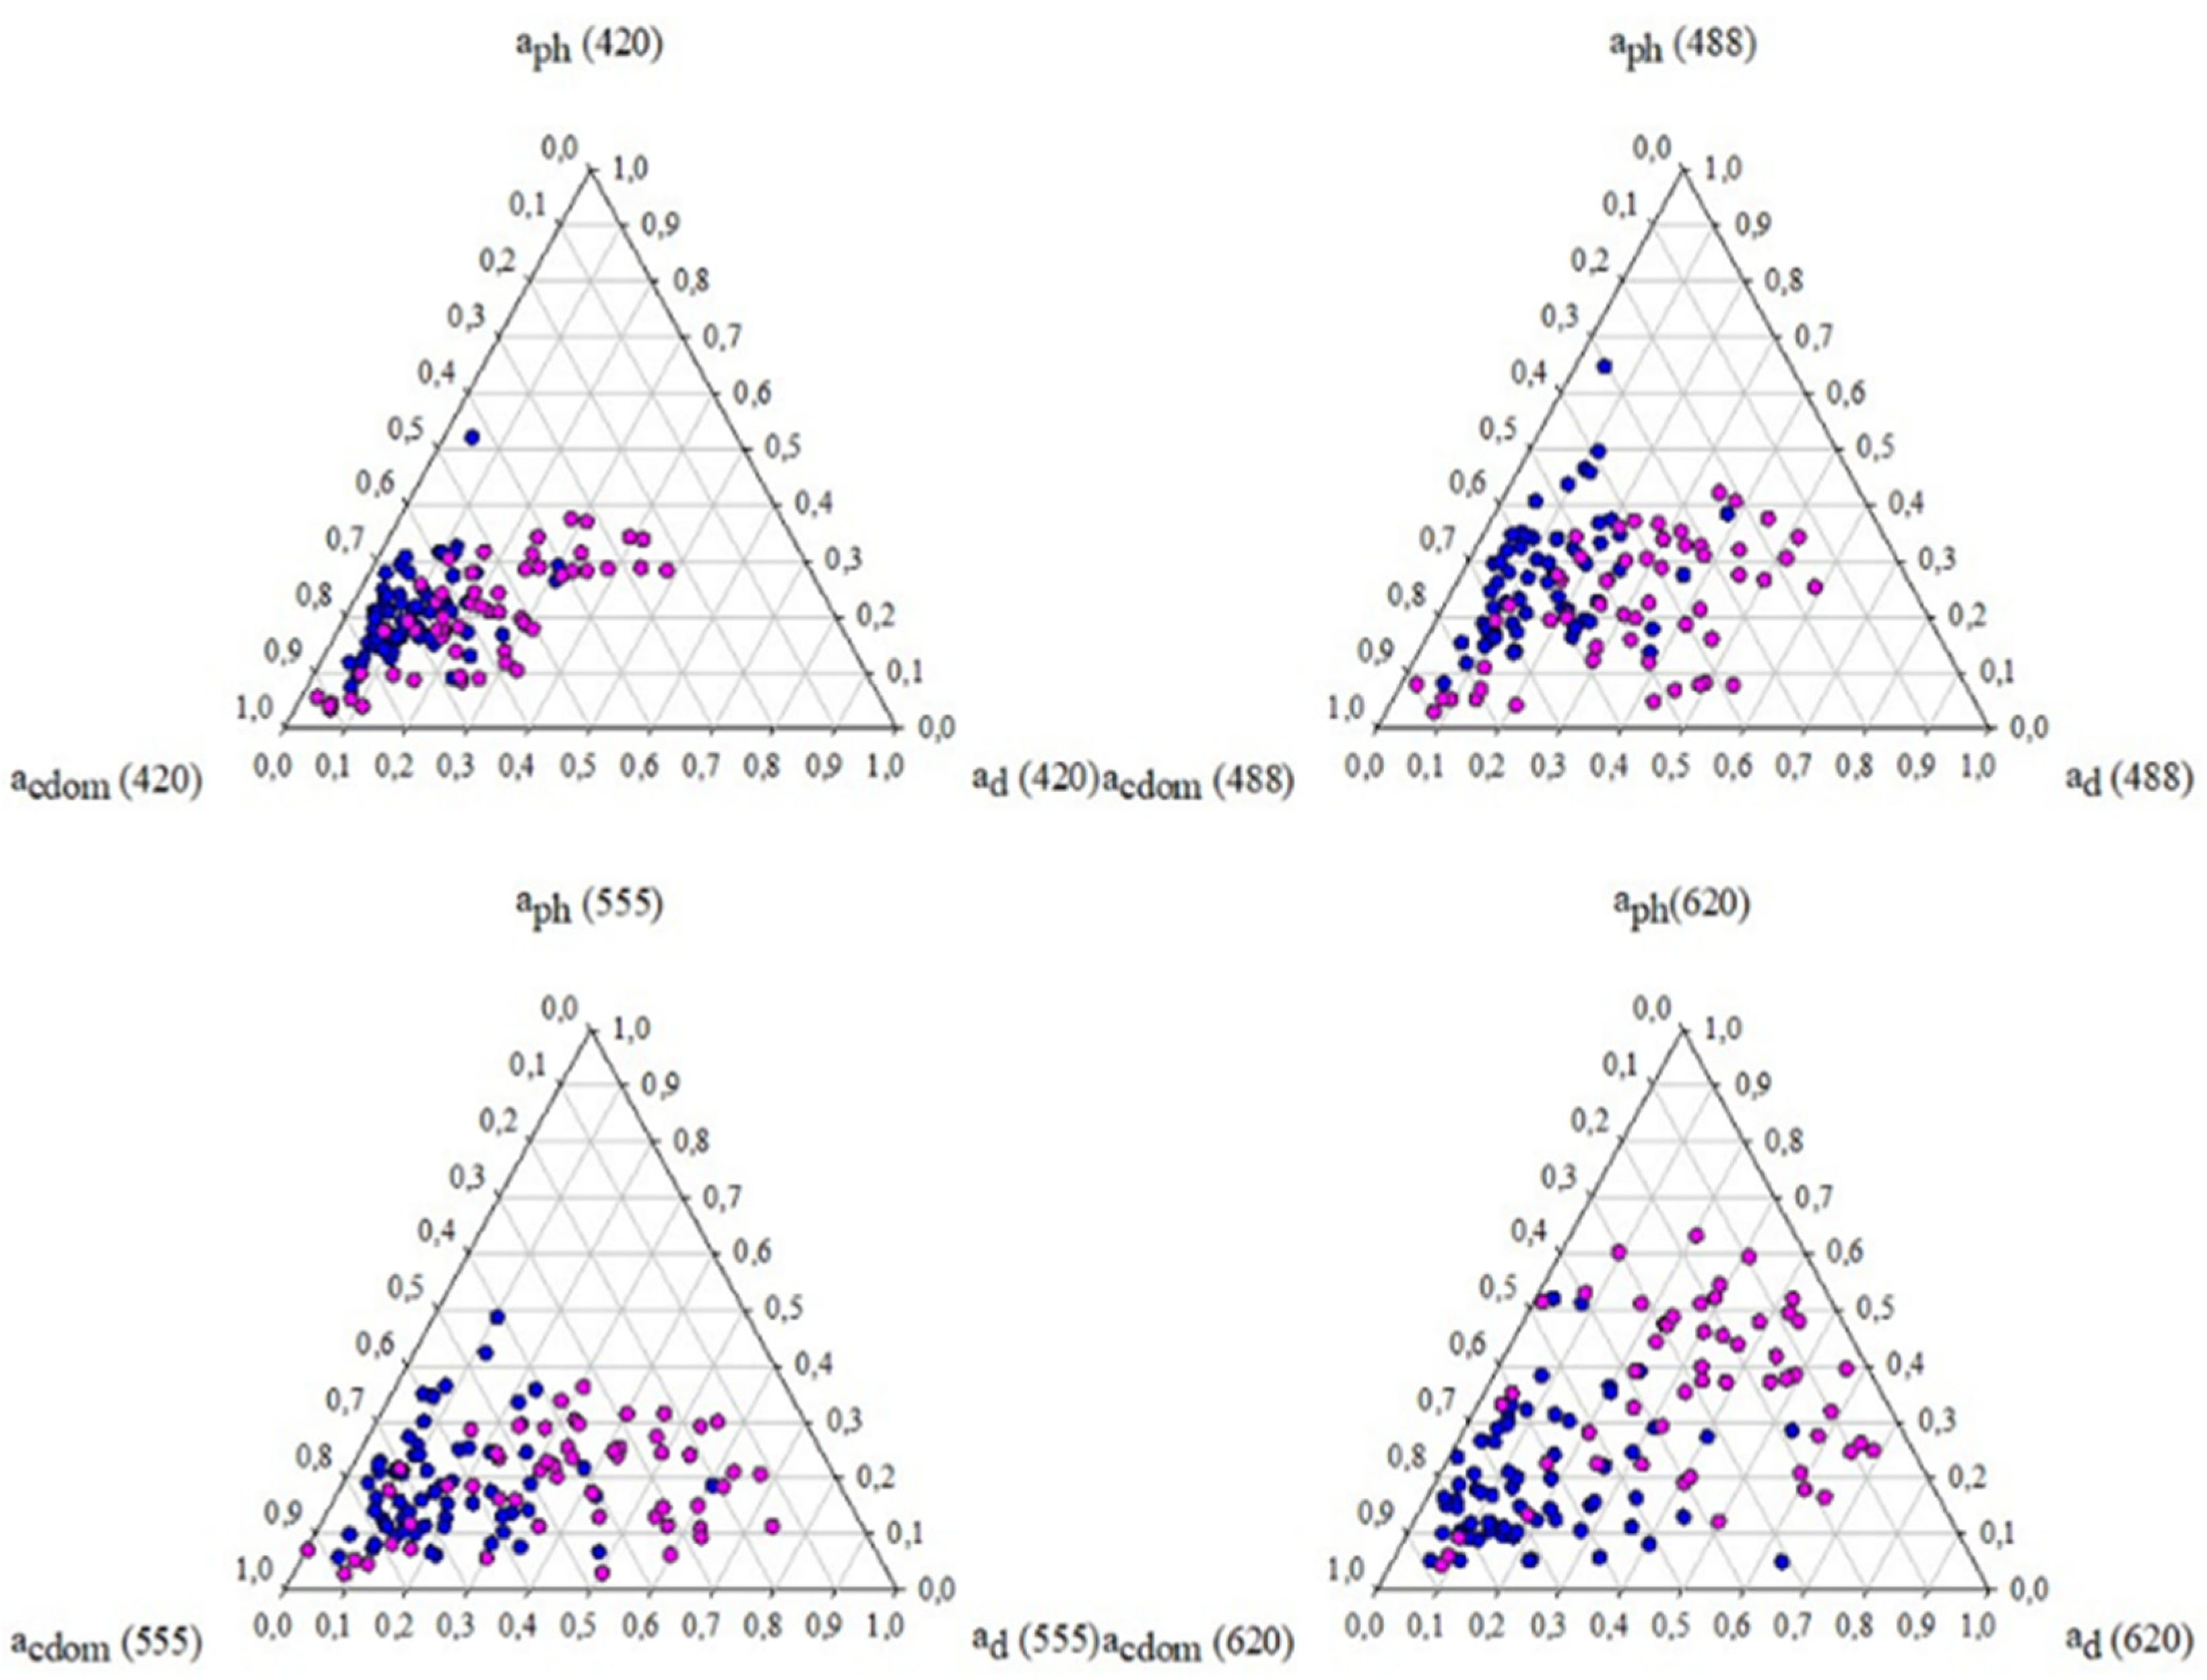
| Lakes | λ = 420 nm | λ = 488 nm | λ = 555 nm | λ = 620 nm |
| aph(λ) [%] | 20 | 22 | 19 | 35 |
| ad(λ) [%] | 22 | 31 | 37 | 33 |
| aCDOM(λ) [%] | 58 | 47 | 44 | 32 |
| Coastal Waters | λ = 420 nm | λ = 488 nm | λ = 555 nm | λ = 620 nm |
| aph(λ) [%] | 20 | 27 | 18 | 19 |
| ad(λ) [%] | 12 | 15 | 17 | 17 |
| aCDOM(λ) [%] | 68 | 58 | 65 | 64 |
Disclaimer/Publisher’s Note: The statements, opinions and data contained in all publications are solely those of the individual author(s) and contributor(s) and not of MDPI and/or the editor(s). MDPI and/or the editor(s) disclaim responsibility for any injury to people or property resulting from any ideas, methods, instructions or products referred to in the content. |
© 2023 by the authors. Licensee MDPI, Basel, Switzerland. This article is an open access article distributed under the terms and conditions of the Creative Commons Attribution (CC BY) license (https://creativecommons.org/licenses/by/4.0/).
Share and Cite
Lednicka, B.; Kubacka, M.; Freda, W.; Haule, K.; Ficek, D.; Sokólski, M. Multi-Parameter Algorithms of Remote Sensing Reflectance, Absorption and Backscattering for Coastal Waters of the Southern Baltic Sea Applied to Pomeranian Lakes. Water 2023, 15, 2843. https://doi.org/10.3390/w15152843
Lednicka B, Kubacka M, Freda W, Haule K, Ficek D, Sokólski M. Multi-Parameter Algorithms of Remote Sensing Reflectance, Absorption and Backscattering for Coastal Waters of the Southern Baltic Sea Applied to Pomeranian Lakes. Water. 2023; 15(15):2843. https://doi.org/10.3390/w15152843
Chicago/Turabian StyleLednicka, Barbara, Maria Kubacka, Włodzimierz Freda, Kamila Haule, Dariusz Ficek, and Maciej Sokólski. 2023. "Multi-Parameter Algorithms of Remote Sensing Reflectance, Absorption and Backscattering for Coastal Waters of the Southern Baltic Sea Applied to Pomeranian Lakes" Water 15, no. 15: 2843. https://doi.org/10.3390/w15152843
APA StyleLednicka, B., Kubacka, M., Freda, W., Haule, K., Ficek, D., & Sokólski, M. (2023). Multi-Parameter Algorithms of Remote Sensing Reflectance, Absorption and Backscattering for Coastal Waters of the Southern Baltic Sea Applied to Pomeranian Lakes. Water, 15(15), 2843. https://doi.org/10.3390/w15152843