Abstract
A hydrodynamic-water quality model was established using MIKE21 to analyze the distribution of total nitrogen (TN) and total phosphorus (TP) in the wetland sediments of Liaohe Estuary National Wetland Park. The purpose of this model is to investigate the spatial and temporal variation patterns in wetland sediments and the distribution of pollutant contents. The research determines the applicability of this model in accurately predicting these patterns. The simulated contour map of the water quality concentration displays significant variation characteristics and reflects the actual concentration of pollutants in the wetland sediment of the Liaohe Estuary, proving the coupled model to be reasonable and accurate. The water quality simulation results indicate that water flowing through the wetland aids in purifying pollutants in the sediment, and the purification effect is more significant during the flood season. The MIKE21 model’s treatment reveals that the content of TN in wetland sediments decreases from southwest to northeast in the surface layer, following the flow direction of surface water. As the depth increases, the content of TN also decreases, with the bottom layer showing a decrease from southwest to northeast. The TP in wetland sediments receives surface water runoff and diffuses from upstream to downstream. The content of TP gradually decreases with increasing depth.
1. Introduction
Wetlands are a unique and complex natural environment that results from the interaction between land and water. Alongside forests and oceans, wetlands are considered one of the three major natural ecological protection systems in the world, according to scholars. Often referred to as “the kidneys of the Earth”, wetlands play a vital role in supporting biodiversity and providing essential services to humanity. Wetlands are essential for regulating the climate, conserving water, protecting biological diversity, and providing resources for human production and life []. They are capable of storing Earth’s precipitation, driving surface water runoff, and replenishing groundwater []. Wetlands support a highly diverse biological community and provide a wide range of ecosystem services, including water purification, flood mitigation, and climate regulation []. Wetland sediment plays a crucial role in the plant–soil–water interaction within wetlands. The pollutant holding capacity of an entire wetland is closely linked to the amount of pollutants present in the sediment. Additionally, TN and TP, found in the sediment, are crucial elements for plant growth and act as significant regulators of plant decomposition rates, contributing to ecological balance []. Monitoring and analyzing the distribution of pollutants in the sediments of the Liaohe Estuary wetlands is crucial for providing scientific evidence and technical support to protect the ecological environment of the basin and enhance the water quality and ecology in the region. In the context of large-scale and complex water movements, relying solely on physical models to study the laws of water movement is no longer sufficient to meet the calculation requirements. After extensive research and a comparison of various models, including literature reviews and field research, it was determined that MIKE21 has a broad range of applications for water quality analysis, such as Gong Xueliang et al. [], Li Xiaojuan et al. [], and Long, Yuannan et al. [], who applied MIKE21 to simulate water quality. This study aims to enhance the accuracy of sediment TN and TP dynamic distribution simulations by utilizing the MIKE21FM and Ecolab modules to establish a hydrodynamic and water quality coupling model of Liaohe Estuary, as compared to conventional methods.
1.1. Location and Hydrological Description
This study was conducted at the Liaohe Estuarine Wetland (40.83–41.33° N, 121.5–122.0° E), which is located southwest of Liaoning province and north of the Bohai Sea. This wetland is a composition delta formed by Daliao River, Liao River, and Daling River, with a total area of 3.0 × 10⁵ hm2. The Liaohe Estuarine Delta is the largest warm temperate coastal wetland in China []. It is adjacent to Anshan City, to the east and northeast; Yingkou City, across the Daliaohe River, to the southeast; and Jinzhou City, to the west and northwest. In the basin area, surface water and groundwater combine to form a pool. The quaternary groundwater in this region is predominantly saline. Groundwater recharge primarily occurs through precipitation, surface water infiltration, and upstream groundwater runoff. However, under natural conditions, the increment of groundwater is minimal. Groundwater runoff in the area flows from north to south, with a slope of 0.2%. The groundwater level is generally high and approaches the surface during the flood season, which easily causes seasonal waterlogging and secondary salinization.
1.2. Climate and Topography
The wetland shows a coastal sub-humid warm temperate continental monsoon climate [], which is affected by the monsoon and has little rain and multi-wind in spring []. The annual mean temperature is 8.6 °C, with an annual precipitation of 631 mm, and the estimated annual evapotranspiration is 1548 mm []. The average summer temperature in the study area is 24.7 °C, which is 1.1 °C higher than the corresponding period in previous years (23.6 °C). There were 28 precipitation days during the summer. Out of these, 19 sampling results were obtained, and no instances of acid rain were recorded. The total effective precipitation of the 19 times was 223.1 mm, and the weighted average pH of the seasonal precipitation was 6.45, which was slightly acidic. The monthly average K value of the conductivity of precipitation is 54.47 μs/cm, indicating general cleanliness for the precipitation.
1.3. Topography and Landforms
The Liaohe Estuary Wetland is characterized by low-lying and flat terrain, with an average ground elevation ranging between 2–4 m. The highest elevation is 18.2 m (located in the northern part of Dahuang Township, Panshan County), while the lowest elevation is 0.4 m (located in the Shuangtaizi Estuary). It is an alluvial plain that extends into the sea. The coastal zone in the southwest of the plain is a swamp area with an altitude of 1.7–3 m. The topography is high in the north and low in the south. At an altitude of 2–5 m, the entire area is covered by quaternary sediments, and the river deposits are of accumulation topography. The study area has a relatively simple and visible terrain characterized by abundant water bodies and the absence of mountains. The entire depositional area is covered with quaternary erosional deposits, which are formed by early river erosion and accumulation. In Northeast China, specifically at the mouths of the Liaohe River, Daling River, and other downstream tributaries, the deposits are influenced by sea erosion and deposition. These deposits primarily consist of fine-grained materials, such as silty sub-clay, sub-clay, sub-sand, chalk, and fine sand.
2. Methods
2.1. Materials and Methods
For the sediment collection, three sites were randomly chosen near the 16 sampling sites. The sampling sites were divided into two groups: 8 sites located near the river and 8 sites located farther away from the river. A soil auger (80 cm in length and 10 cm in diameter) was used to collect samples from each of the three sites at five different depths: 0–10 cm (surface layer), 10–20 cm, 20–30 cm, 30–40 cm, and 40–50 cm (bottom layer). The samples were then mixed and bagged separately and taken back to the laboratory for preservation. In 2020, samples were collected in May (before the main flood season), July (during the main flood season), and September (after the main flood season). A total of 240 sediment samples were collected, with one collection per period. Figure 1 displays the sampling points.
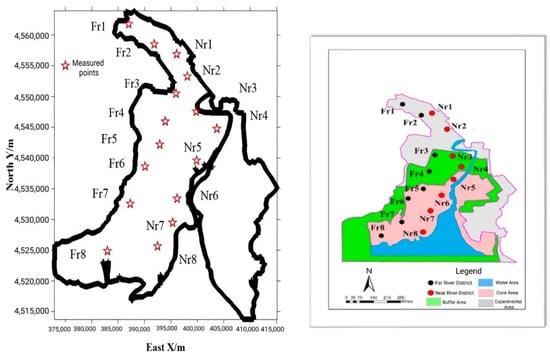
Figure 1.
Sampling points in Panjin City.
The samples were air-dried in a dry, dark, and ventilated laboratory setting without any additional treatment. Once the air-drying process was completed, impurities were eliminated in preparation for the subsequent crushing process. The samples were then screened using a 100 mesh (0.152 mm) sieve. Total phosphorus (TP) was measured using the national standard analysis method (GB8937-88), which employs the sodium hydroxide fusion–molybdenum–antimony colorimetric technique. After a study comparing several common methods for measuring the TP, Wei, LH suggested that the molybdenum–antimony colorimetric method offers sensitivity, simplicity in operation, accuracy, and ease of mastery. This method is applicable to the determination of TP in general soils []. By comparing the methods proposed by different scholars for the determination of TN, it was finally decided that this TN determination was carried out by the Kjeldahl digestion method (HJ717-2014) [,]. Total nitrogen (TN) was quantified using the Kjeldahl digestion method (HJ717-2014). The following chemicals were used: concentrated sulfuric acid, mixed accelerator, sodium hydroxide solution, boric acid absorption solution, HCL standard solution, and methyl red-bromocresol green mixed indicator.
2.2. Principles and Modeling Methods of Hydrodynamic and Water Quality Models
MIKE21 is a two-dimensional mathematical model developed by the Danish Hydrodynamics Institute (DHI) [,,,,,]; MIKE21 is a part of MIKE ZERO, a comprehensive estuary simulation. Modeling systems for coastal waters and marine hydraulics and hydraulics-related phenomena [] can be used to simulate the currents, waves, water quality and sediment in rivers, lakes, oceans, and bays. MIKE21 has made significant contributions to various application developments in the country, including the south-to-north water diversion project, Dianchi Lake eutrophication control and the Haisuzhou River control project []. The water quality module (ECOLab) can be used for water quality simulations, water quality predictions, water environment impact assessments, water environment restoration, water environment planning, etc. []. In the two-dimensional model, MIKE21 is also a component of the hydrodynamic and water quality model software system, which is widely used and continuously improved in actual engineering projects.
2.2.1. MIKE21 Hydrodynamic Module
During the model simulation, the chase method was utilized to solve the equation matrix. The distribution of the different items in the x- and y-directions within the cross grid is shown in Figure 2.
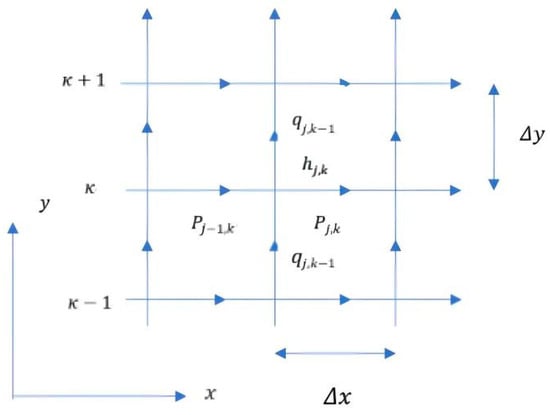
Figure 2.
Difference grid in x- and y-spaces.
The momentum and mass equations of the discrete hydrodynamic model can be solved using the alternating direction implicit method (ADI), and the mass conservation equations in the x- and y-directions are as follows:
Original format:
The momentum equation has the same formula form in the x- and y-directions.
When solving equations numerically, there are several methods available, including the finite difference method, finite element method, and finite volume method. These techniques can all be utilized to calculate two-dimensional hydrodynamic numerical simulations; however, the most appropriate method will depend on the specific research object being studied. After research, the finite volume method was finally used for the simulation calculation, and at the same time, unstructured grids were used. According to the terrain characteristics of the study area, a hybrid grid form of triangles and quadrilaterals was selected. This approach proved to be effective in processing complex boundaries and improving the overall accuracy of the results. Figure 3 shows a two-dimensional topographic map of the study area.
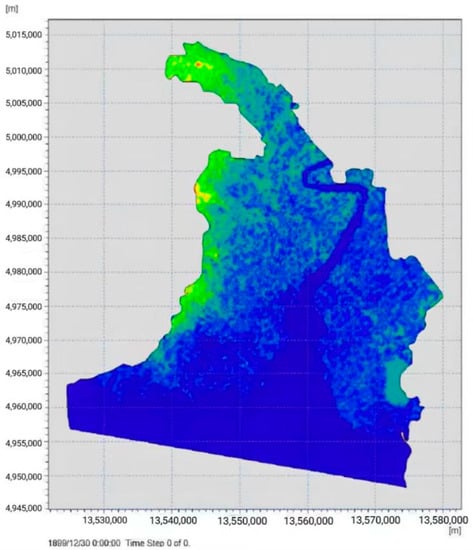
Figure 3.
Two-dimensional topographic map of the study area.
2.2.2. MIKE21 Water Quality Module
DHI has developed a new water quality and ecology simulation tool called ECO lab, which builds upon the traditional water quality model. By coupling ECO lab with the convection-diffusion module, it enables the numerical simulation of various water ecosystems. Its flow chart is shown in Figure 4.
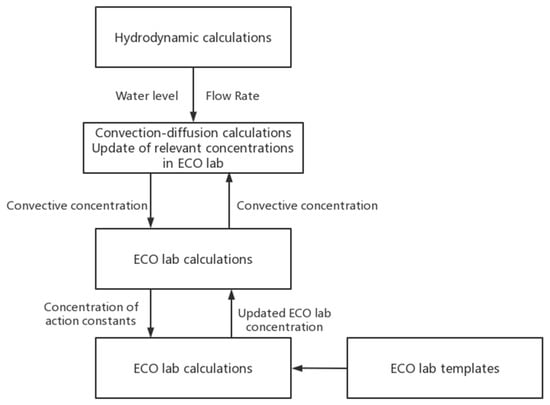
Figure 4.
Data flow in hydrodynamic model.
ECO lab’s ecological numerical simulation laboratory can describe ecological and environmental problems, such as water eutrophication, as well as environmental problems, such as water quality. The ECO lab module can be composed of a mathematical description or a set of differential equations. The mathematical description includes six forms: state variables, constants, forces, auxiliary variables, processes, and derived results.
When a process influences a variable or when multiple variables interact with each other, it is common to solve it by coupling a differential equation system.
The transmission equation form is:
In the formula, ADC is the concentration change rate.
The process of copying and reflecting the changes of substances in water bodies is as follows:
In the formula, c represents the concentration of the state variable, and n represents the number of state variable processes involved.
2.3. Hydrodynamic and Water Quality Model Simulation
2.3.1. Hydrodynamic Numerical Simulation
The simulation was conducted using the grid file and two-dimensional topographic file generated during the establishment of the hydrodynamic model—the simulation period covered 31 days, starting from 00:00 on 1 May 2018 and ending at 00:00 on 1 June 2019. The time step length was set at 3600 s, with a total of 744 steps. At time t = 0, the flow velocity is 0, and the water level is 0.24 m. The open boundary is located upstream of the intersection of Raoyang River and Shuangtaizi River. The upper boundary is determined by the measured flow at Zhangmingjia Water Level Station, while the lower boundary is set by the water level of the downstream Sandaogou. The water level boundary is established based on the measured water level using the base level of the Yellow Sea.
The parameter correction of the hydrodynamic model primarily focuses on river roughness, which directly impacts the accuracy of the calculations. Initially, the water level is computed assuming a certain roughness value. Then, the roughness is adjusted successively to minimize the error between the calculated water level and the measured value at the point, ensuring full alignment of the water level process line. The final results indicate a roughness value of 0.015 for the Zhangmingjia River section and 0.008 for the Shuangtaizi Estuary section. The details are presented in Table 1. Figure 5 illustrates a 2D topographic map of the study area. Table 2 then details the relevant parameters of the model.

Table 1.
Initial water level set at roughness calibration results.
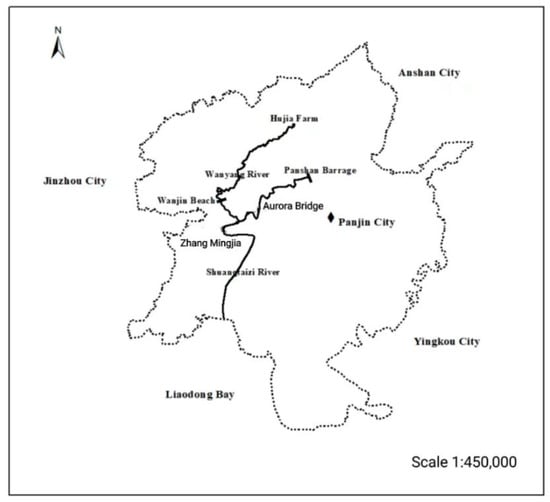
Figure 5.
Geographical locations of Shuangtaizi River and Raoyang River.
Table 2.
Model parameters.
Model verification. After calibrating the model parameters, the model was verified, involving comparing the measured water level at Zhangmingjia Station with the simulated water level. This comparison was conducted to assess the accuracy and reliability of the model.
Figure 6 shows a comparison between the measured water level at the site and the simulated water level in the hydrodynamic simulation. The trends of both are similar, which indicates that the simulation results are reliable and credible. Using statistical methods to calculate the mean error, we found that the average error is within 15%, which meets the error requirement. Overall, the model’s calculation results are quite satisfactory, with most of the computed values aligning with the measured values. This confirms that the hydrodynamic model we have developed performs well and can serve as a reliable basis for the water quality model.
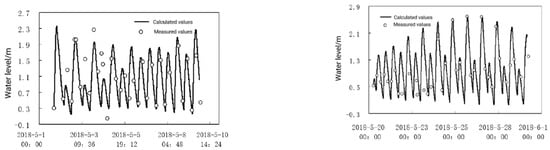
Figure 6.
Water level verification results of Zhangmingjia Station.
2.3.2. Numerical Simulation of Water Quality
The MIKE21 software’s water quality module was used to conduct a numerical simulation of wetland sediment water quality. The simulation range, grid system, and simulation time period were set to match those of the hydrodynamic model used for the initial conditions. At time t = 0, the water quality index was initialized as the average of the monitored values. The boundary conditions were configured in a way that the flow velocity and concentration values at the closed boundary were both 0. The time series generated by the measured concentration on the open boundary were used as the upstream and downstream boundary conditions. Regarding the model’s parameters, in the hydrodynamic-based ecological model, it was crucial to consider the diffusion and degradation of pollutants during the migration process. The diffusion coefficient was determined by establishing a linear relationship between the grid velocity and the diffusion coefficient. On the other hand, the degradation coefficient was obtained via the prototype observation method, yielding TN and TP values of 0.01495 mg/d and 0.04212 mg/d, respectively.
The calibration result of the model was that the horizontal and vertical diffusion coefficients were 5 m2/s, and the total attenuation coefficient of TN was 0.0116 mg/day.
For the model’s verification, after calibrating the model parameters, we proceeded to verify the model by comparing the actual monitoring data of TN and TP at each sampling point on 31 May 2018 with the model data. The verification result can be seen in Figure 7 and Figure 8.
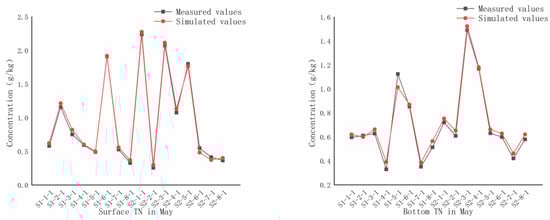
Figure 7.
Comparison of measured and simulated TN contents in surface sediments in May, July, and September.
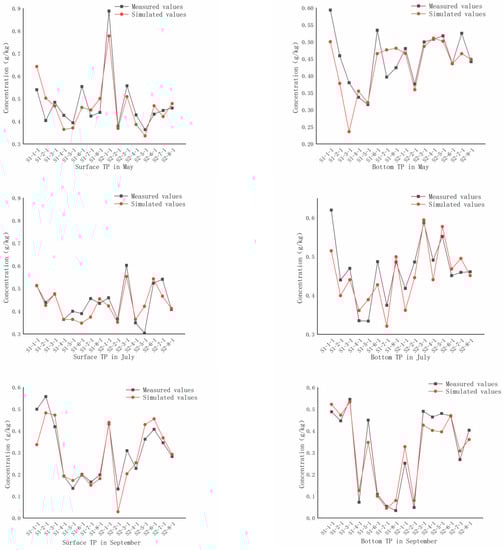
Figure 8.
Comparison of measured and simulated TP contents in surface sediments in May, July, and September.
3. Results and Discussion
This order value simulation obtained the concentration changes of TN in different spatial ranges and depths, as shown in Figure 9a–f and Figure 10a–f.
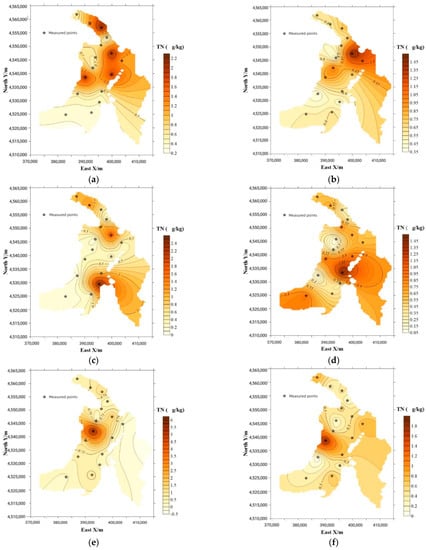
Figure 9.
Spatial distribution of TN content in sediments of Liaohe Estuary Wetland. (a) Surface concentration in May; (b) bottom layer concentration in May; (c) surface concentration in July; (d) bottom layer concentration in July; (e) surface concentration in September; (f) bottom layer concentration in September.
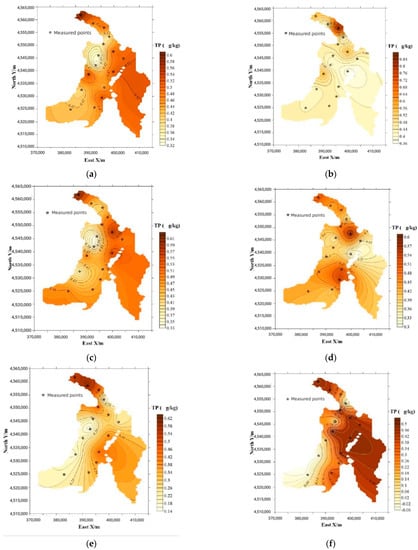
Figure 10.
Spatial distribution of TP content in sediments of Liaohe Estuary Wetland. (a) Surface concentration in May; (b) bottom layer concentration in May; (c) surface concentration in July; (d) bottom layer concentration in July; (e) surface concentration in September; (f) bottom layer concentration in September.
The analysis of the TN content in the surface layer of the Liaohe Estuary Wetland sediments, as depicted in Figure 9, revealed a downstream diffusion trend before the main flood and during the flood season, indicating the significant influence of runoff. The mechanisms behind this trend have been the subject of scrutiny by numerous scholars, such as You Wei, who examined the effects of hydrodynamics on pollutant changes [], and Wang Yanhai et al., who investigated the impact of runoff on water quality characteristics []. These studies have contributed to the understanding of the fundamental drivers of these phenomena.
Furthermore, the results indicate that after the flood season in September, the TN content is primarily concentrated in the upstream far-river area. This trend may be attributed to the influence of agricultural activities in the upstream area, which have been identified as significant drivers of sediment content, such as TN and TP. Wu et al. [] and Liu et al. [] have previously highlighted the role of agricultural production in shaping the content of TN and TP in sediments. The study highlights the importance of taking into account the full scope of agricultural practices and their potential effects on water quality and sediment content, especially in areas upstream, in order to develop effective environmental protection measures.
The investigation found that during the September flood season, the TN content in the bottom layer of sediments increased significantly downstream, likely due to the accumulation of the TN affected by runoff. The higher content observed in July may be due to the sedimentation process. The concentration of TN in the bottom layer after the flood season remained concentrated in the far-river area, which was consistent with the distribution pattern observed in the surface layer. These findings are significant for understanding the spatial and temporal dynamics of the TN content in wetland sediments.
As depicted in Figure 10, the analysis of the TP content in the surface layer of the sediment of Liaohe Estuary revealed that it was predominantly concentrated in the upstream area of Liaohe Estuary, pre-May flood and post-September flood. However, during the July flood, the TP content spread to the downstream area due to the runoff of surface water. This implies that the flood-induced runoff of surface water had a diffusion effect on the distribution of the TP content. These observations are consistent with the work of Hao, Jin et al. [], who suggested that water–sand movement and submerged exchanges are significant factors that influence the distribution of the TP content along the course, in addition to anthropogenic factors.
The study found that the TP content in the bottom layer of Liaohe wetland sediments was stable before the May flood and during the July flood. However, after the September flood, there was a significant accumulation of TP downstream and near the estuary. This indicates that a considerable amount of TP pollutants was transported downstream and deposited in the sediment during the July flood. The findings are consistent with Han CN’s proposal that, during the physical transport of TP, some of the particulate phosphorus is stored in the subaqueous sediments by accompanying the particulate matter with sedimentation []. This suggests that sedimentation plays an important role in the accumulation of TP in wetland sediments.
The study indicates that the concentration of TP pollutants in sediments decreases with depth, emphasizing the importance of depth in the purification effect of sediments on TP. These findings highlight the crucial role of sediment depth in reducing TP pollution in the Liaohe Estuary Wetland. This is consistent with previous studies, such as the research conducted by Ding et al. []. Additionally, Zhou et al. [], Jiang et al. [], and Pang et al. [] have also confirmed the influence of sediment depth on the reduction of TP contents. The study contributes to the existing knowledge on the influence of sediment depth on TP purification and reinforces the crucial role of sediments in mitigating TP pollution.
The interdependence between the hydrodynamic model and the water quality model is paramount. The former captures the flow velocity changes, while the latter simulates the water quality changes. The hydrodynamic model provides boundary conditions for the water quality model, ensuring accurate predictions of water quality concentrations. In turn, the water quality model generates concentration changes that reflect the actual situation and changes in flow velocity. For instance, areas with high or abrupt changes in flow velocity experience less sedimentation of pollutants, resulting in lower concentrations of pollutants in the water body. Conversely, areas with a low flow velocity or gradual changes in the flow velocity experience significant sedimentation of pollutants, resulting in a significant increase in the water quality concentration. Therefore, the accurate unification of flow velocity changes and concentration changes is crucial to harnessing the full potential of the hydrodynamic-water quality coupling model, which can significantly guide the operation and management of related water conservancy projects.
4. Conclusions
In the same area, the distribution of concentrations at different time points was as follows: the TN content of organic salts in the far-river area was highest in September, followed by May and July. On the other hand, the TP content was highest in May, followed by July and September. In the near-river area, both the TN and TP contents were similar, with the highest concentrations observed in May, followed by July and September. The study conducted on the Liaoning Estuary found a significant difference between the surface and bottom sediment layers in terms of the TN and TP contents during the same time period. The bottom layer showed lower TN and TP contents compared to the surface layer. This suggests that the sediments have the potential to aid in the degradation of TN and TP through sedimentation. This study indicates that changes in the sediment content over time may be attributed to changes in the runoff patterns, as well as potential agricultural activities.
In order to accurately map and analyze wetland sediments, we utilized the MIKE21 model software. This software was chosen for its ability to adjust and set various parameters to construct the model effectively. A two-dimensional unsteady hydrodynamic model of wetland sediments was established using MIKE21, and the simulation data were verified using measured data to ensure the accuracy of the model. The hydrodynamic model was utilized to analyze the variation in hydraulic elements at different times. The simulation results were then compared to the measured results, and the credibility of the model was established, as both sets of results exhibited the same trend. The study confirmed the reliability of the water quality model under hydrodynamic conditions by comparing the measured concentration value with the simulated concentration value and found the trend to be consistent. The numerical simulation proved to be a valuable tool for predicting changes in water quality and the overall water situation in wetlands, particularly in complex water environments.
Author Contributions
Conceptualization, X.L. and Y.D.; methodology, X.L.; software, Y.D.; validation, Q.L. and Y.D.; formal analysis, Y.W.; investigation, Q.L.; resources, H.Z., X.X. and J.L.; data curation, Y.D.; writing—original draft preparation, X.L. and Y.D.; writing—review and editing, X.L., Q.L. and Y.D.; visualization, X.L.; supervision, Y.W.; project administration, H.Z., X.X. and J.L. All authors have read and agreed to the published version of the manuscript.
Funding
(1) Natural Science Foundation of Liaoning Province in China, 20170540807; (2) Cultivation Plan for Youth Agricultural Science and Technology Innovative Talents of Liaoning Province in China, 2015048; (3) The Subject of Economic and Social Development of Liaoning Province in China, 2020lslktyb-079; (4) Research of Educational Reform in Shenyang Agricultural University (2022-124).
Data Availability Statement
Data is available on request from the authors. The data that support the findings of this study are available from the corresponding author (X.L.) upon reasonable request.
Conflicts of Interest
The authors declare no conflict of interest.
References
- Lu, S.J.; Si, J.H.; Qi, Y.; Wang, Z.Q. Distribution Characteristics of TOC, TN and TP in the Wetland Sediments of Longbao Lake in the San-Jiang Head Wate. Acta Geophys. 2017, 64, 2417–2486. [Google Scholar]
- Wu, C.C. Application Study of Mike11 in the Taste Tidal Section of Shuangtaizi River in Panjin; Ocean University of China: Qingdao, China, 2012. [Google Scholar]
- Costanza, R.; d’Arge, R.; de Groot, R.; Farber, S.; Grasso, M.; Hannon, B.; Limburg, K.; Naeem, S.; O’Neill, R.V.; Paruelo, J.; et al. The value of the world’s ecosystem services and natural capital. Nature 1997, 387, 253–260. [Google Scholar] [CrossRef]
- Li, Z.; Tian, D.; Wang, B.; Wang, J.; Wang, S.; Chen, H.Y.H.; Xu, X.; Wang, C.; He, N.; Niu, S. Microbes drive global soil nitrogen mineralization and availability. Glob. Change Biol. 2019, 25, 1078–1088. [Google Scholar] [CrossRef]
- Gong, X.L.; Sun, R.; Lu, C.X.; Sun, X.l. Simulation of water quality response of the upper lake in Nansi Lake based on MIKE21. China Rural. Water Hydropower 2019, 36, 70–76+82. [Google Scholar]
- Li, X.J.; Huang, M.T.; Wang, R.H. Numerical Simulation of Donghu Lake Hydrodynamics and Water Quality Based on Remote Sensing and MIKE 21. ISPRS Int. J. Geo-Inf. 2020, 9, 94. [Google Scholar] [CrossRef]
- Long, Y.N.; Wu, C.S.; Jiang, C.B.; Hu, S.X.; Liu, Y.Z. Simulating the Impacts of an Upstream Dam on Pollutant Transport: A Case Study on the Xiangjiang River, China. Water 2017, 8, 516. [Google Scholar] [CrossRef]
- Li, T.T.; Hu, H.; Li, Z.Y.; Zhang, J.Y.; Li, D. The Impact of Irrigation on Bacterial Community Composition and Diversity in Liaohe Estuary Wetland. J. Ocean. Univ. China 2018, 17, 855–863. [Google Scholar] [CrossRef]
- Zhang, Y.; Zheng, X.; Wu, C. Experimental study of evapotranspiration from phragmites australis wetland in Liaohe Estuary. Adv. Water Sci. 2011, 22, 352–358. [Google Scholar]
- Jin-Ling, S.; Miao, L.; Chun-Lin, L.I.; Hu, Y.M.; Wu, Y.L.; Liu, C. Design of sponge city and its inspiration to landscape ecology: A case of Liaodong Bay area of Panjin City, Northeast China. Chin. J. Appl. Ecol. 2017, 28, 975–982. [Google Scholar]
- Du, J.; Song, K. Validation of global evapotranspiration product (MOD16) using flux tower data from Panjin Coastal Wetland, Northeast China. Chin. Geogr. Sci. 2018, 28, 420–429. [Google Scholar] [CrossRef]
- Wei, L.H. A comparative study of sample decomposition and colorimetric methods in the determination of total phosphorus in soils. J. Liaoning Agric. Coll. 2009, 11. [Google Scholar]
- Li, Y.Q.; Chen, L.; Zhao, J.F. Comparison of methods for the determination of total soil nitrogen. Guangzhou Environ. Sci. 2006, 21, 28–29. [Google Scholar]
- Zhang, X.X.; Lv, S.J. Determination of total nitrogen in soil by modified Kjeldahl metho. Agric. Technol. 2018, 38, 13–14. [Google Scholar]
- DHI. ECO LAB—Short Scientific Description; DHI: Hørsholm, Denmark, 2011. [Google Scholar]
- DHI. ECO LAB—User Guide; DHI: Hørsholm, Denmark, 2011. [Google Scholar]
- DHI. Dhi Eutrophication Model 1-ECO Lab Template Scientific Description; DHI: Hørsholm, Denmark, 2011. [Google Scholar]
- DHI. Dhi Eutrophication Model 1-Including Sediment and Benthic Vegetation ECO Lab Template Scientific Description; DHI: Hørsholm, Denmark, 2011. [Google Scholar]
- DHI. Dhi Eutrophication Model 2-ECO Lab Template Scientific Description; DHI: Hørsholm, Denmark, 2011. [Google Scholar]
- DHI. Xenobiotics Template-ECO Lab Scientific Description; DHI: Hørsholm, Denmark, 2011. [Google Scholar]
- Rudman, M. Volume-tracking methods for interfacial flow calculations. Int. J. Numer. Methods Fluids 1997, 24, 671–691. [Google Scholar] [CrossRef]
- Zheng, R.Y. Water Quality Simulation and Evaluation of Longbao River in Wanzhou District Based on MIKE Model; Chongqing Jiaotong University: Chongqing, China, 2020. [Google Scholar]
- Changjun, Z.; Qinag, L.; Feng, Y.; Hao, W. Reduction of Waste Water in Erhai Lake Based on MIKE21 Hydrodynamic and Water Quality Model. Sci. World J. 2013, 2013, 958506. [Google Scholar] [CrossRef]
- You, W. Numerical simulation of water exchange in Lvdao Lake, Rongcheng City, Weihai. Pearl River 2017, 38, 64–72. [Google Scholar]
- Wang, X.H.; Lai, Q.Y.; Du, J.Y. Analysis on rainfall runoff Water quality characteristics of different underlying surfaces in Ningbo City. Environ. Eng. 2016, 34, 312–316. [Google Scholar]
- Wu, Y.H.; Liu, J.Z.; Shen, R.F.; Fu, B. Mitigation of nonpoint source pollution in rural areas: From control to synergies of multi ecosystem services. Sci. Total Environ. 2017, 607, 1376–1380. [Google Scholar] [CrossRef]
- Liu, D.D.; Bai, L.; Qiao, Q.; Zhang, Y.; Li, X.; Zhao, R.; Liu, J. Anthropogenic total phosphorus emissions to the Tuojiang River Basin, China. J. Clean. Prod. 2021, 294, 126325. [Google Scholar] [CrossRef]
- Hao, Y.F.; Jin, G.Q. Spatial and temporal distribution of typical pollutants in the main stream of Huaihe River. J. Hohai Univ. 2020, 48, 291–299. [Google Scholar]
- Han, C.N. Transport and Transformation Characteristics of Phosphorus in Three Gorges Reservoir and Its Influence Mechanism; Elsevier: Beijing, China, 2018. [Google Scholar]
- Ding, S.L.; Han, J.H. A study on the vertical distribution of total nitrogen and total phosphorus in OCT wetlands. Guangzhou Chem. Ind. 2020, 48, 155–156+176. [Google Scholar]
- Zhou, Y.T.; Chen, X.H.; Li, L.Q. Total nitrogen and total phosphorus in sediment based on vertical distribution and sorption-desorption characteristics Baiyangdian dredging depth. Environ. Sci. 2021, 42, 4781–4788. [Google Scholar]
- Jiang, X.; Wang, Q.J.; Wang, S.H.; Jin, X.C.; Li, Y.F. Characteristics anaiysis of the adsorption/desorption of nitrogen and phosphorus in the sediments of Taihu Lake. Environ. Sci. 2011, 32, 1285–1291. [Google Scholar]
- Pang, Y.; Jin, X.C.; Wang, S.R.; Meng, F.D.; Zhou, X.N. Characters of phosphorus sorption in sediment of shallow lakes in the middle and lower reaches of the Yangtze River: Sorption isothems and adsorption desorption equilibrium mass concentration. Res. Environ. Sci. 2004, 17, 18–23. [Google Scholar]
Disclaimer/Publisher’s Note: The statements, opinions and data contained in all publications are solely those of the individual author(s) and contributor(s) and not of MDPI and/or the editor(s). MDPI and/or the editor(s) disclaim responsibility for any injury to people or property resulting from any ideas, methods, instructions or products referred to in the content. |
© 2023 by the authors. Licensee MDPI, Basel, Switzerland. This article is an open access article distributed under the terms and conditions of the Creative Commons Attribution (CC BY) license (https://creativecommons.org/licenses/by/4.0/).