Risk Evaluation of Ice Flood Disaster in the Upper Heilongjiang River Based on Catastrophe Theory
Abstract
1. Introduction
2. Materials and Methods
2.1. Catastrophe Evaluation Method
- Non-complementary criterion.
- 2.
- Complementary criterion.
- 3.
- Over-threshold complementary criterion.
2.2. Data Preprocessing
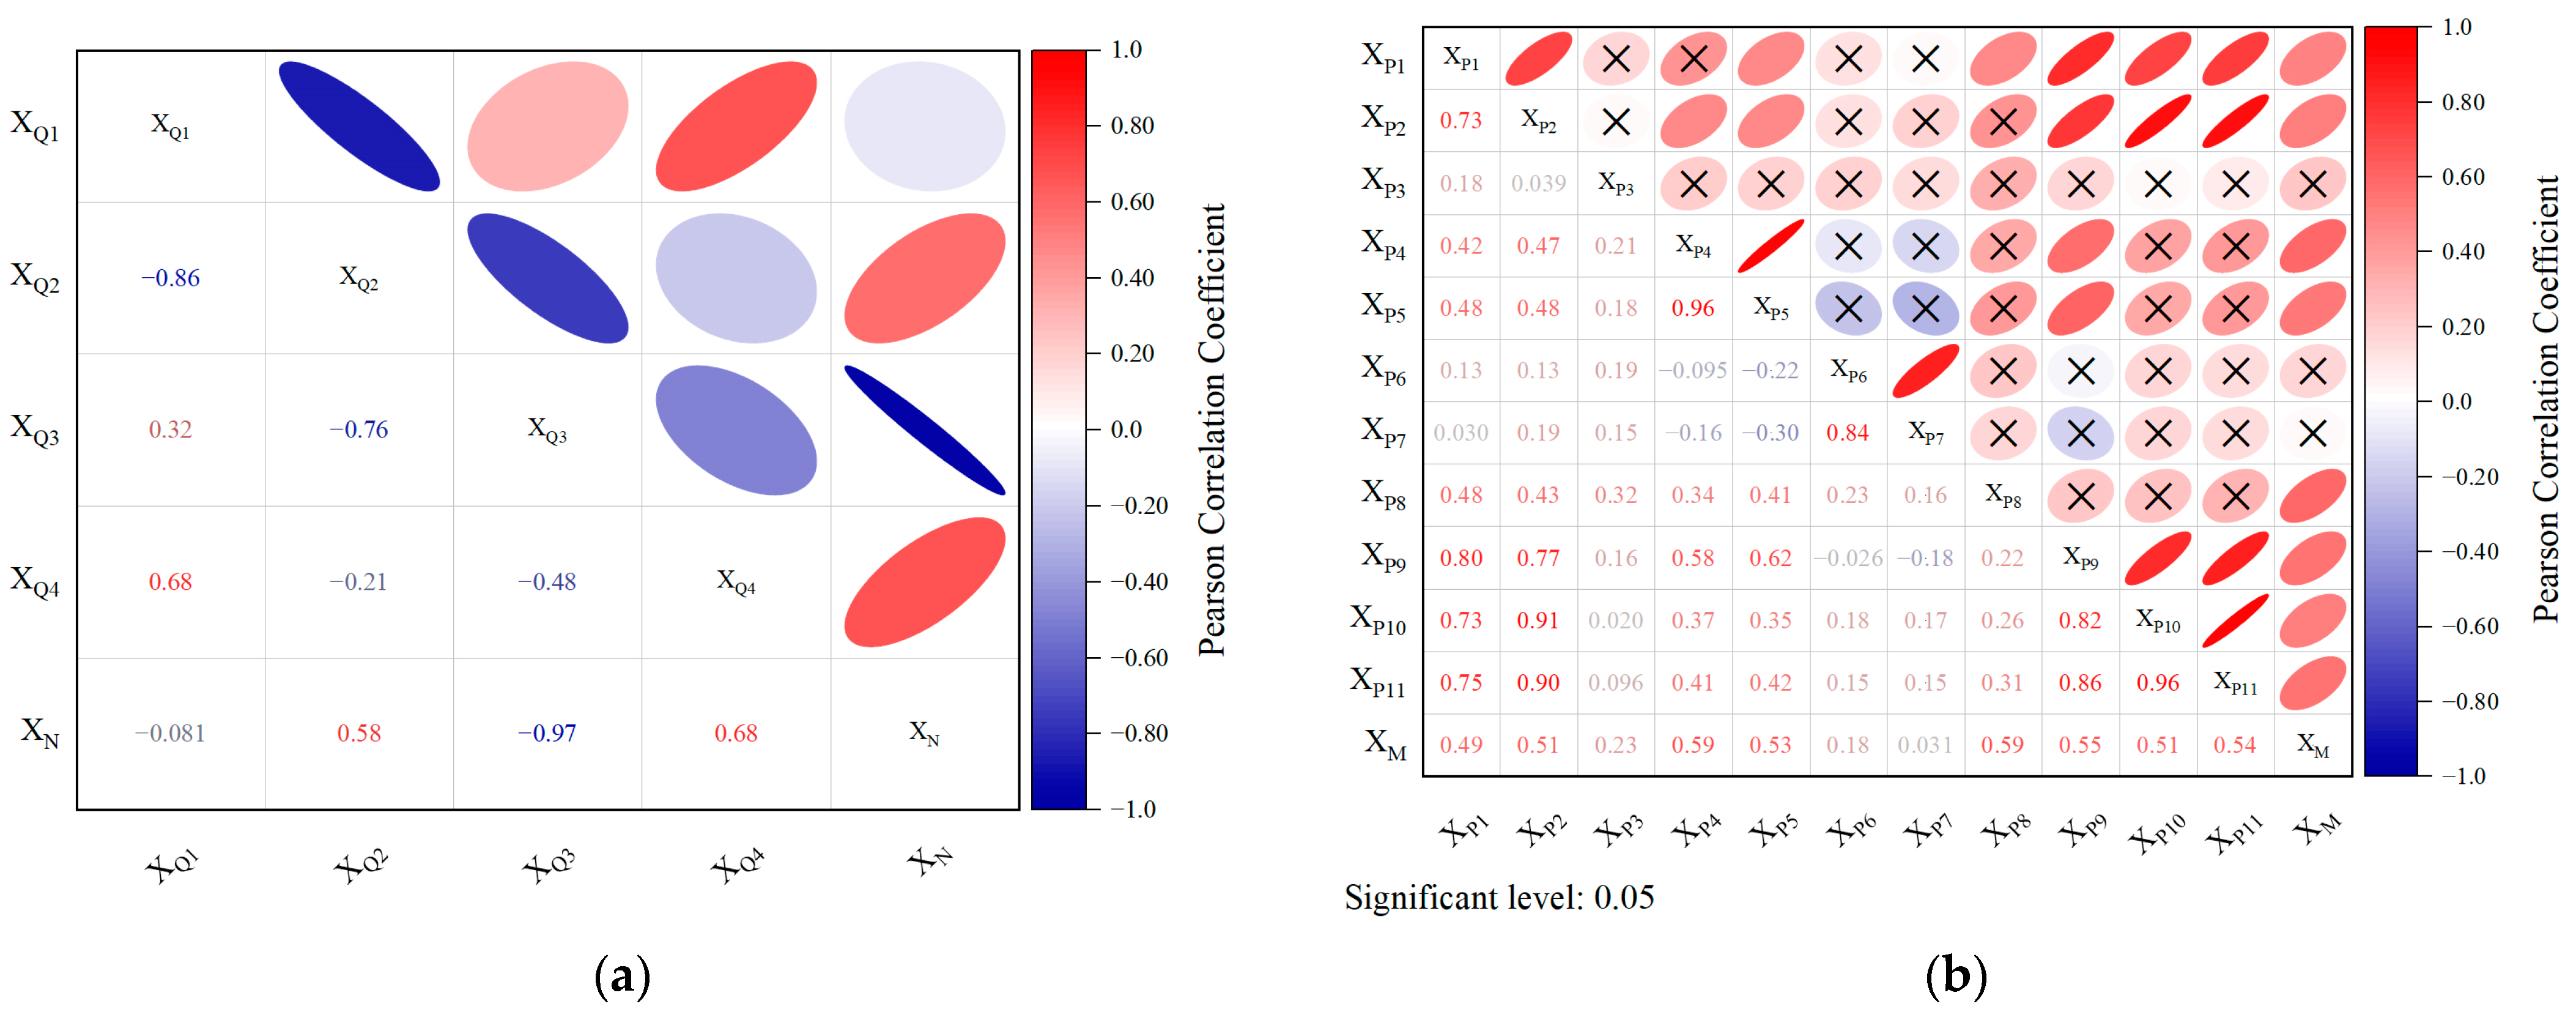
2.3. Pearson Correlation Coefficient
- STEP 1: Determine the constraints of Pearson correlation:
- -
- There is a linear relationship between the two variables;
- -
- The variables are continuous variables;
- -
- The variables are normally distributed, and the binary distribution is also normally distributed;
- -
- The two variables are independent.
- STEP 2: Calculate the Pearson correlation coefficient between and . The Pearson correlation coefficient is represented by the symbol “r” and takes values between −1 and 1. The coefficient is calculated based on the covariance between the two variables and the product of their standard deviations. The formulation of the correlation coefficient can be described as follows:
- -
- If “r” is close to 1, it indicates a strong positive linear relationship, meaning that as one variable increases, the other variable also tends to increase;
- -
- If “r” is close to −1, it indicates a strong negative linear relationship, meaning that as one variable increases, the other variable tends to decrease;
- -
- If “r” is close to 0, it indicates a weak or no linear relationship between the variables.
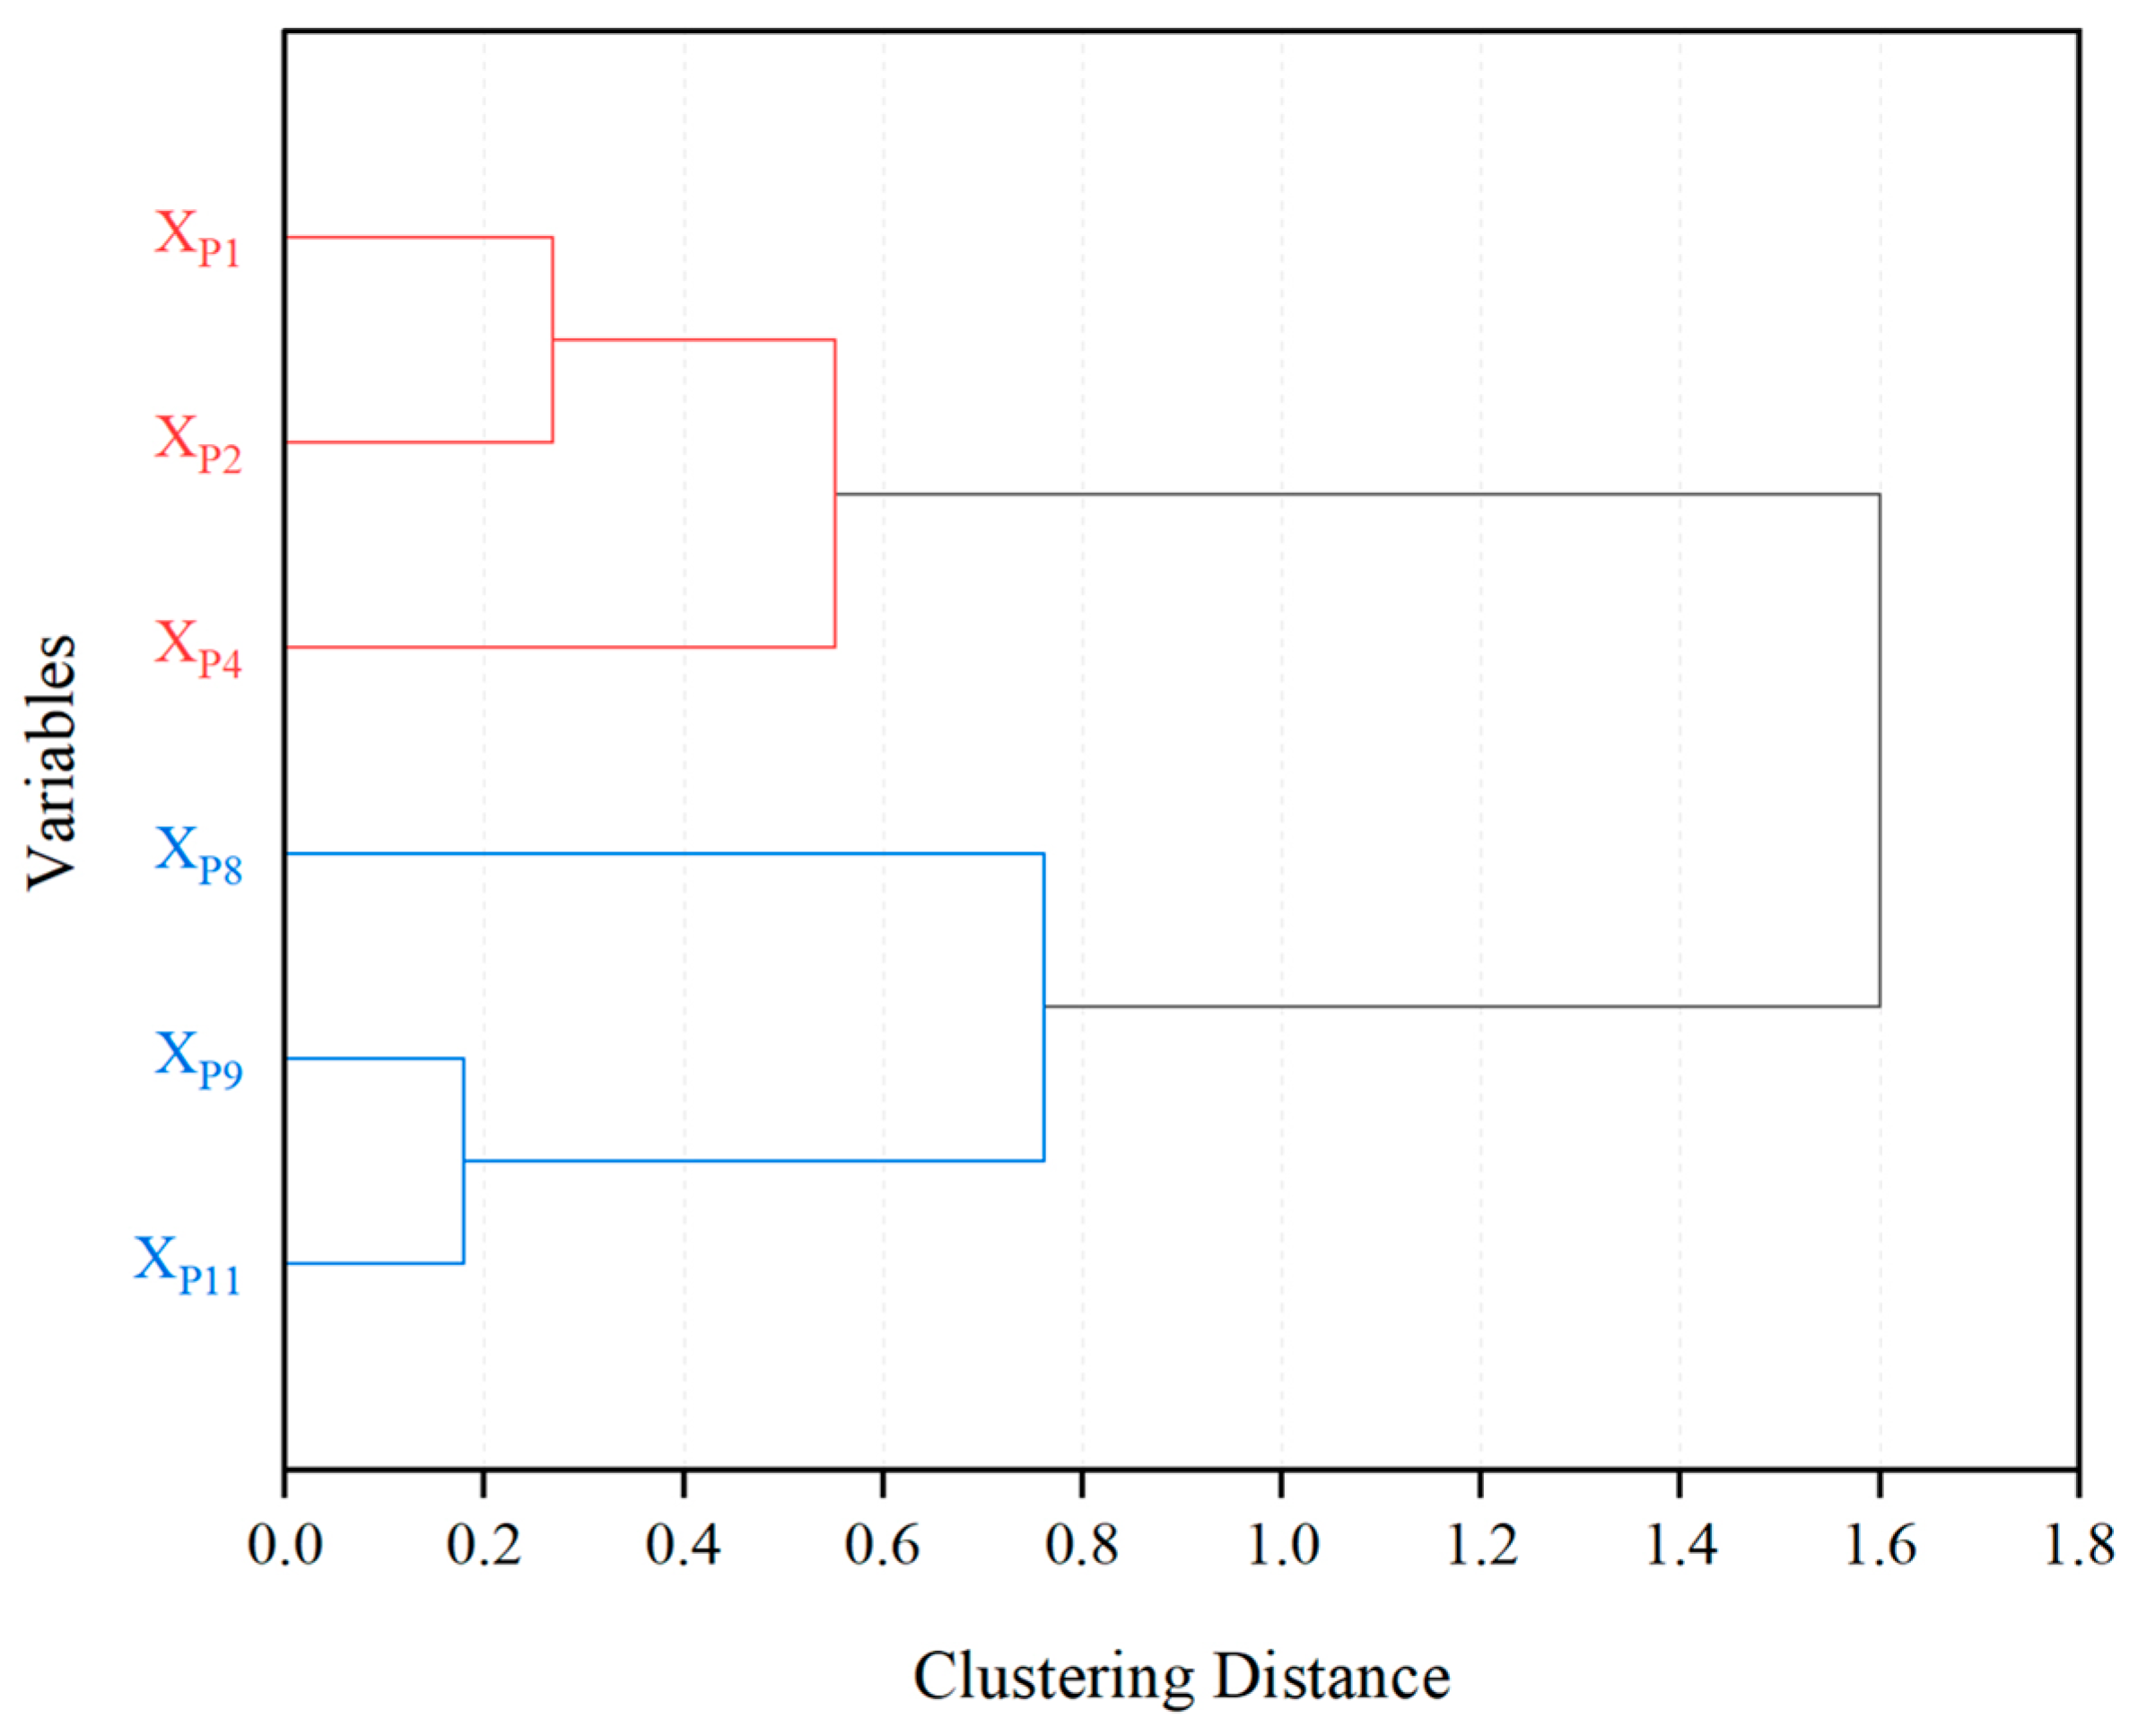
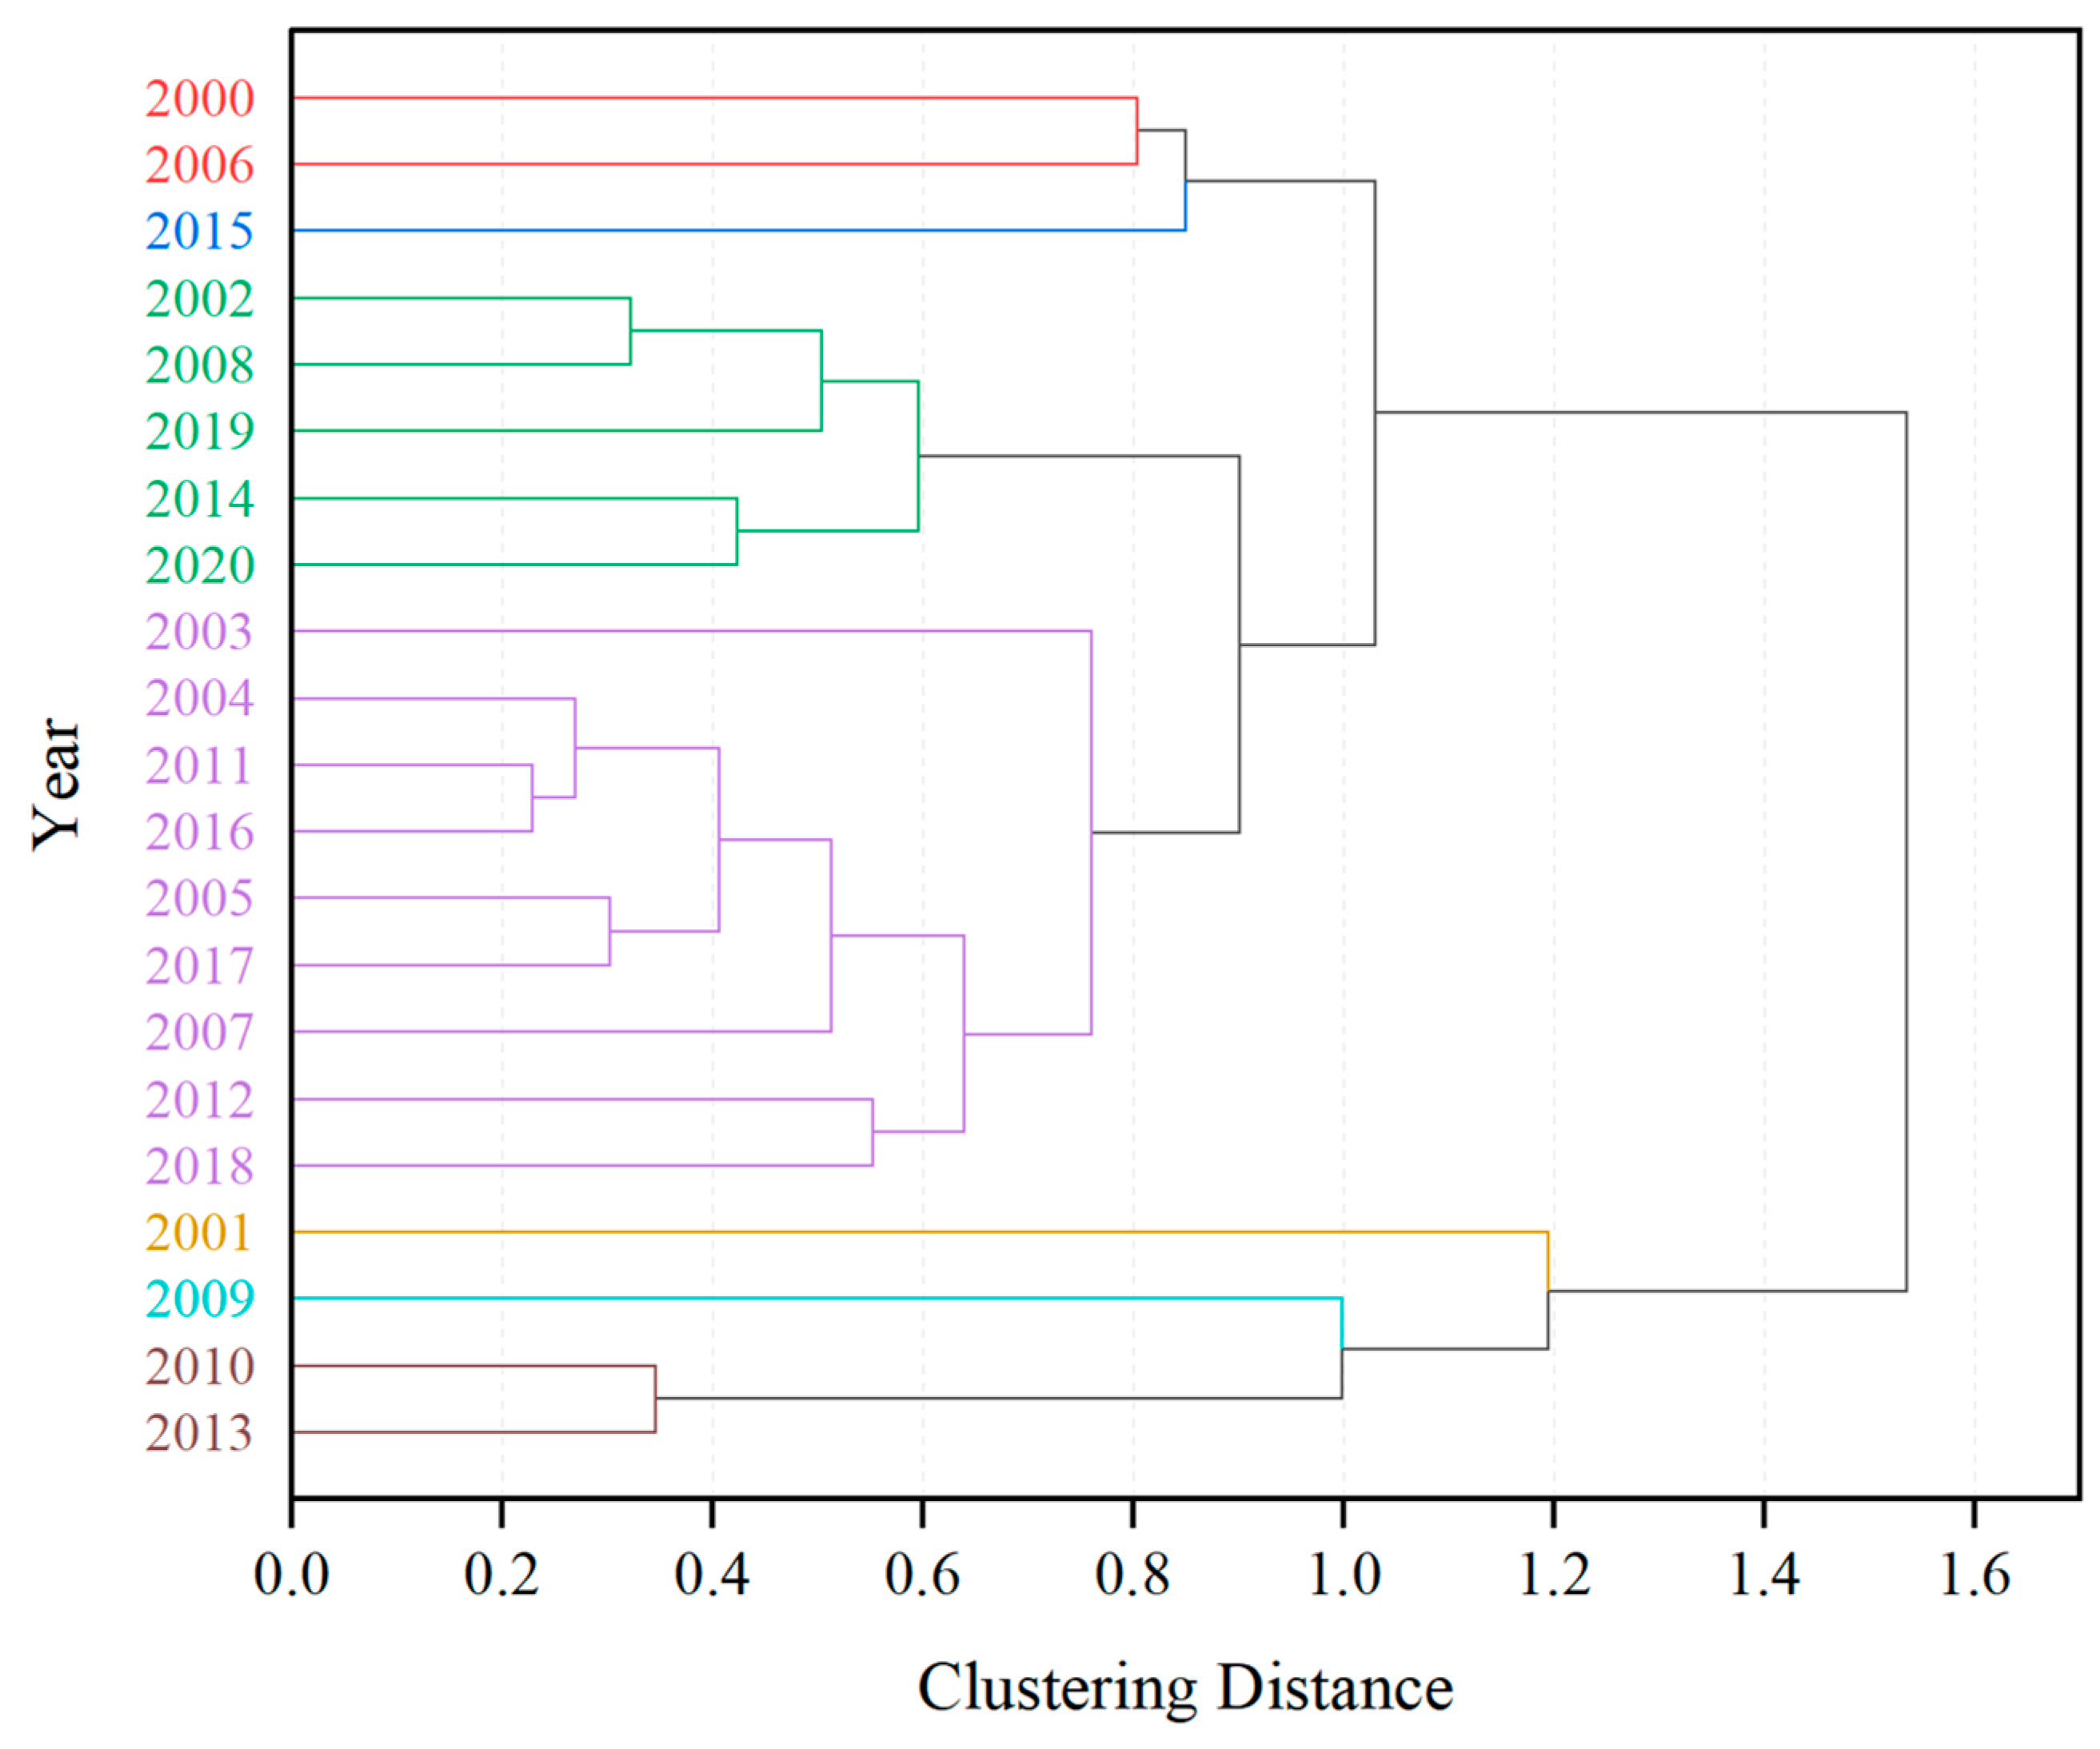
2.4. Hierarchical Cluster Analysis
2.5. Fuzzy Comprehensive Evaluation Method
- STEP 1: Assuming that there are n years to be evaluated to form a sample set, and based on the eigenvalues of m indicators, the eigenvalue matrix of ice flood risk to be evaluated can be expressed as Equation (6):
- STEP 2: Construct the index weight set.
- STEP 3: Establishing the fuzzy comprehensive evaluation model.
3. Ice Flood Risk Evaluation
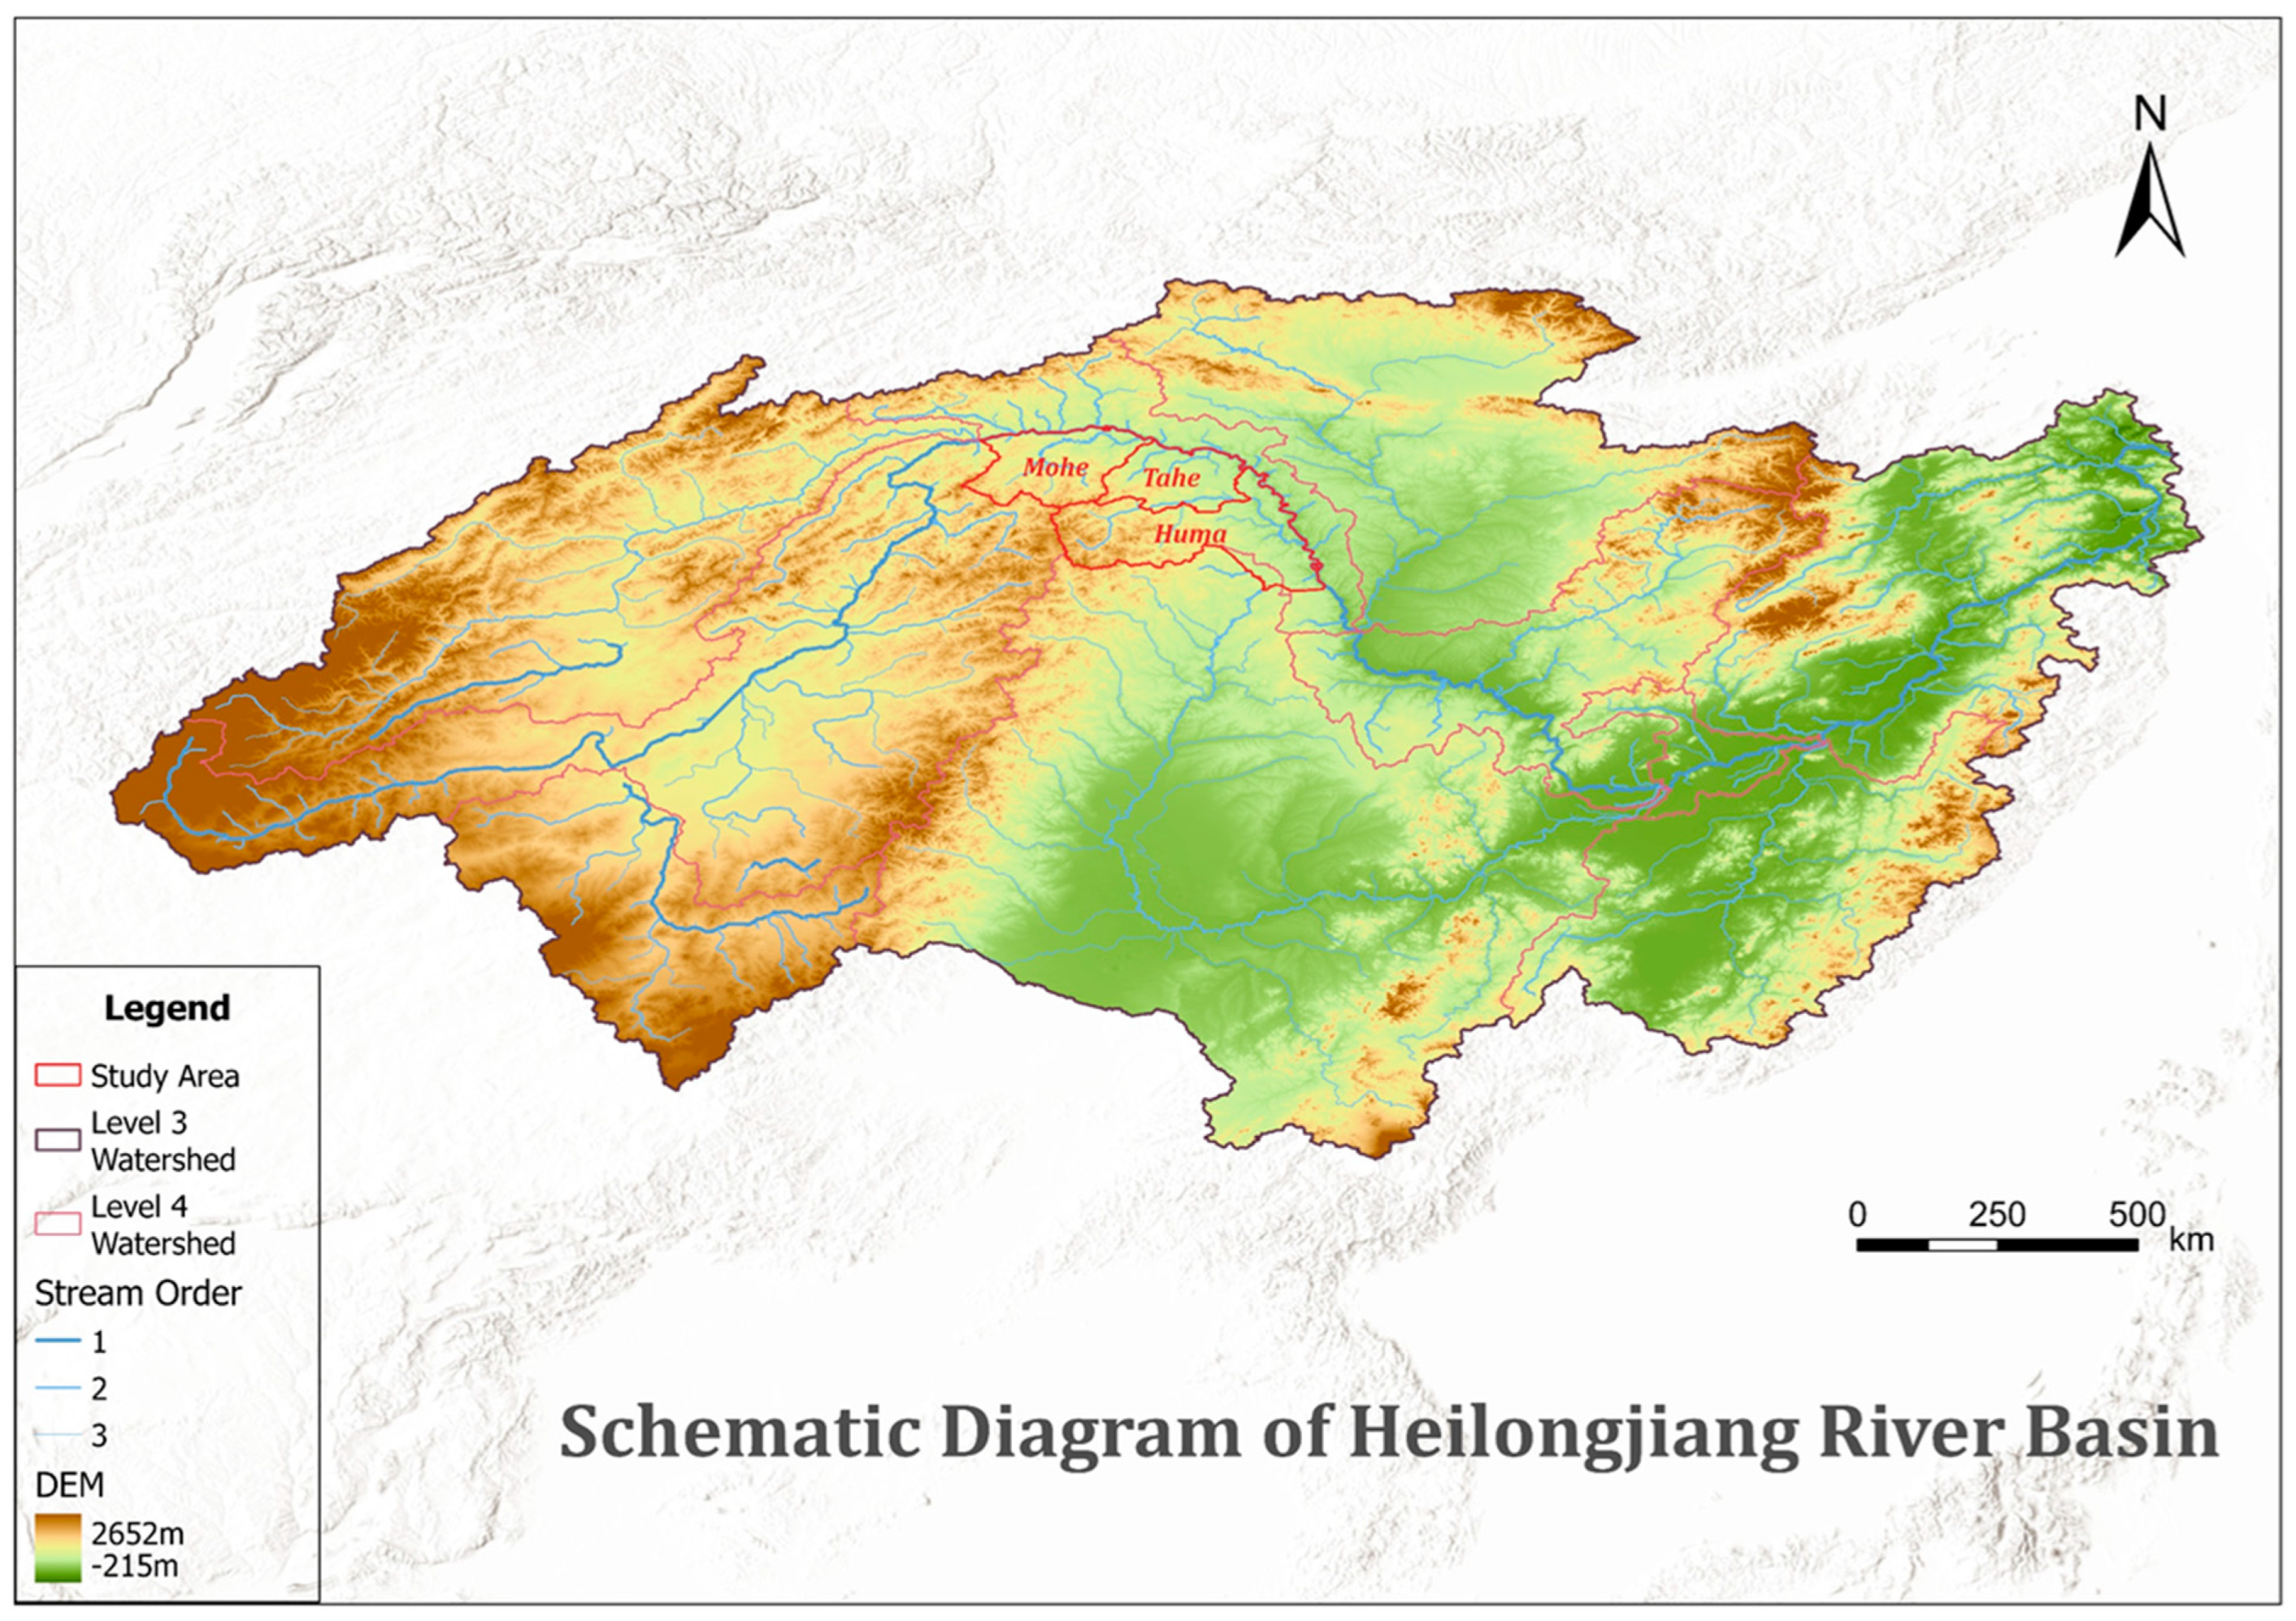
3.1. Study Area Overview
3.2. Analysis of Ice Flood Risk
3.3. Data Acquisition and Processing
4. Results and Discussion
4.1. Construct the Ice Flood Risk Evaluation Index System
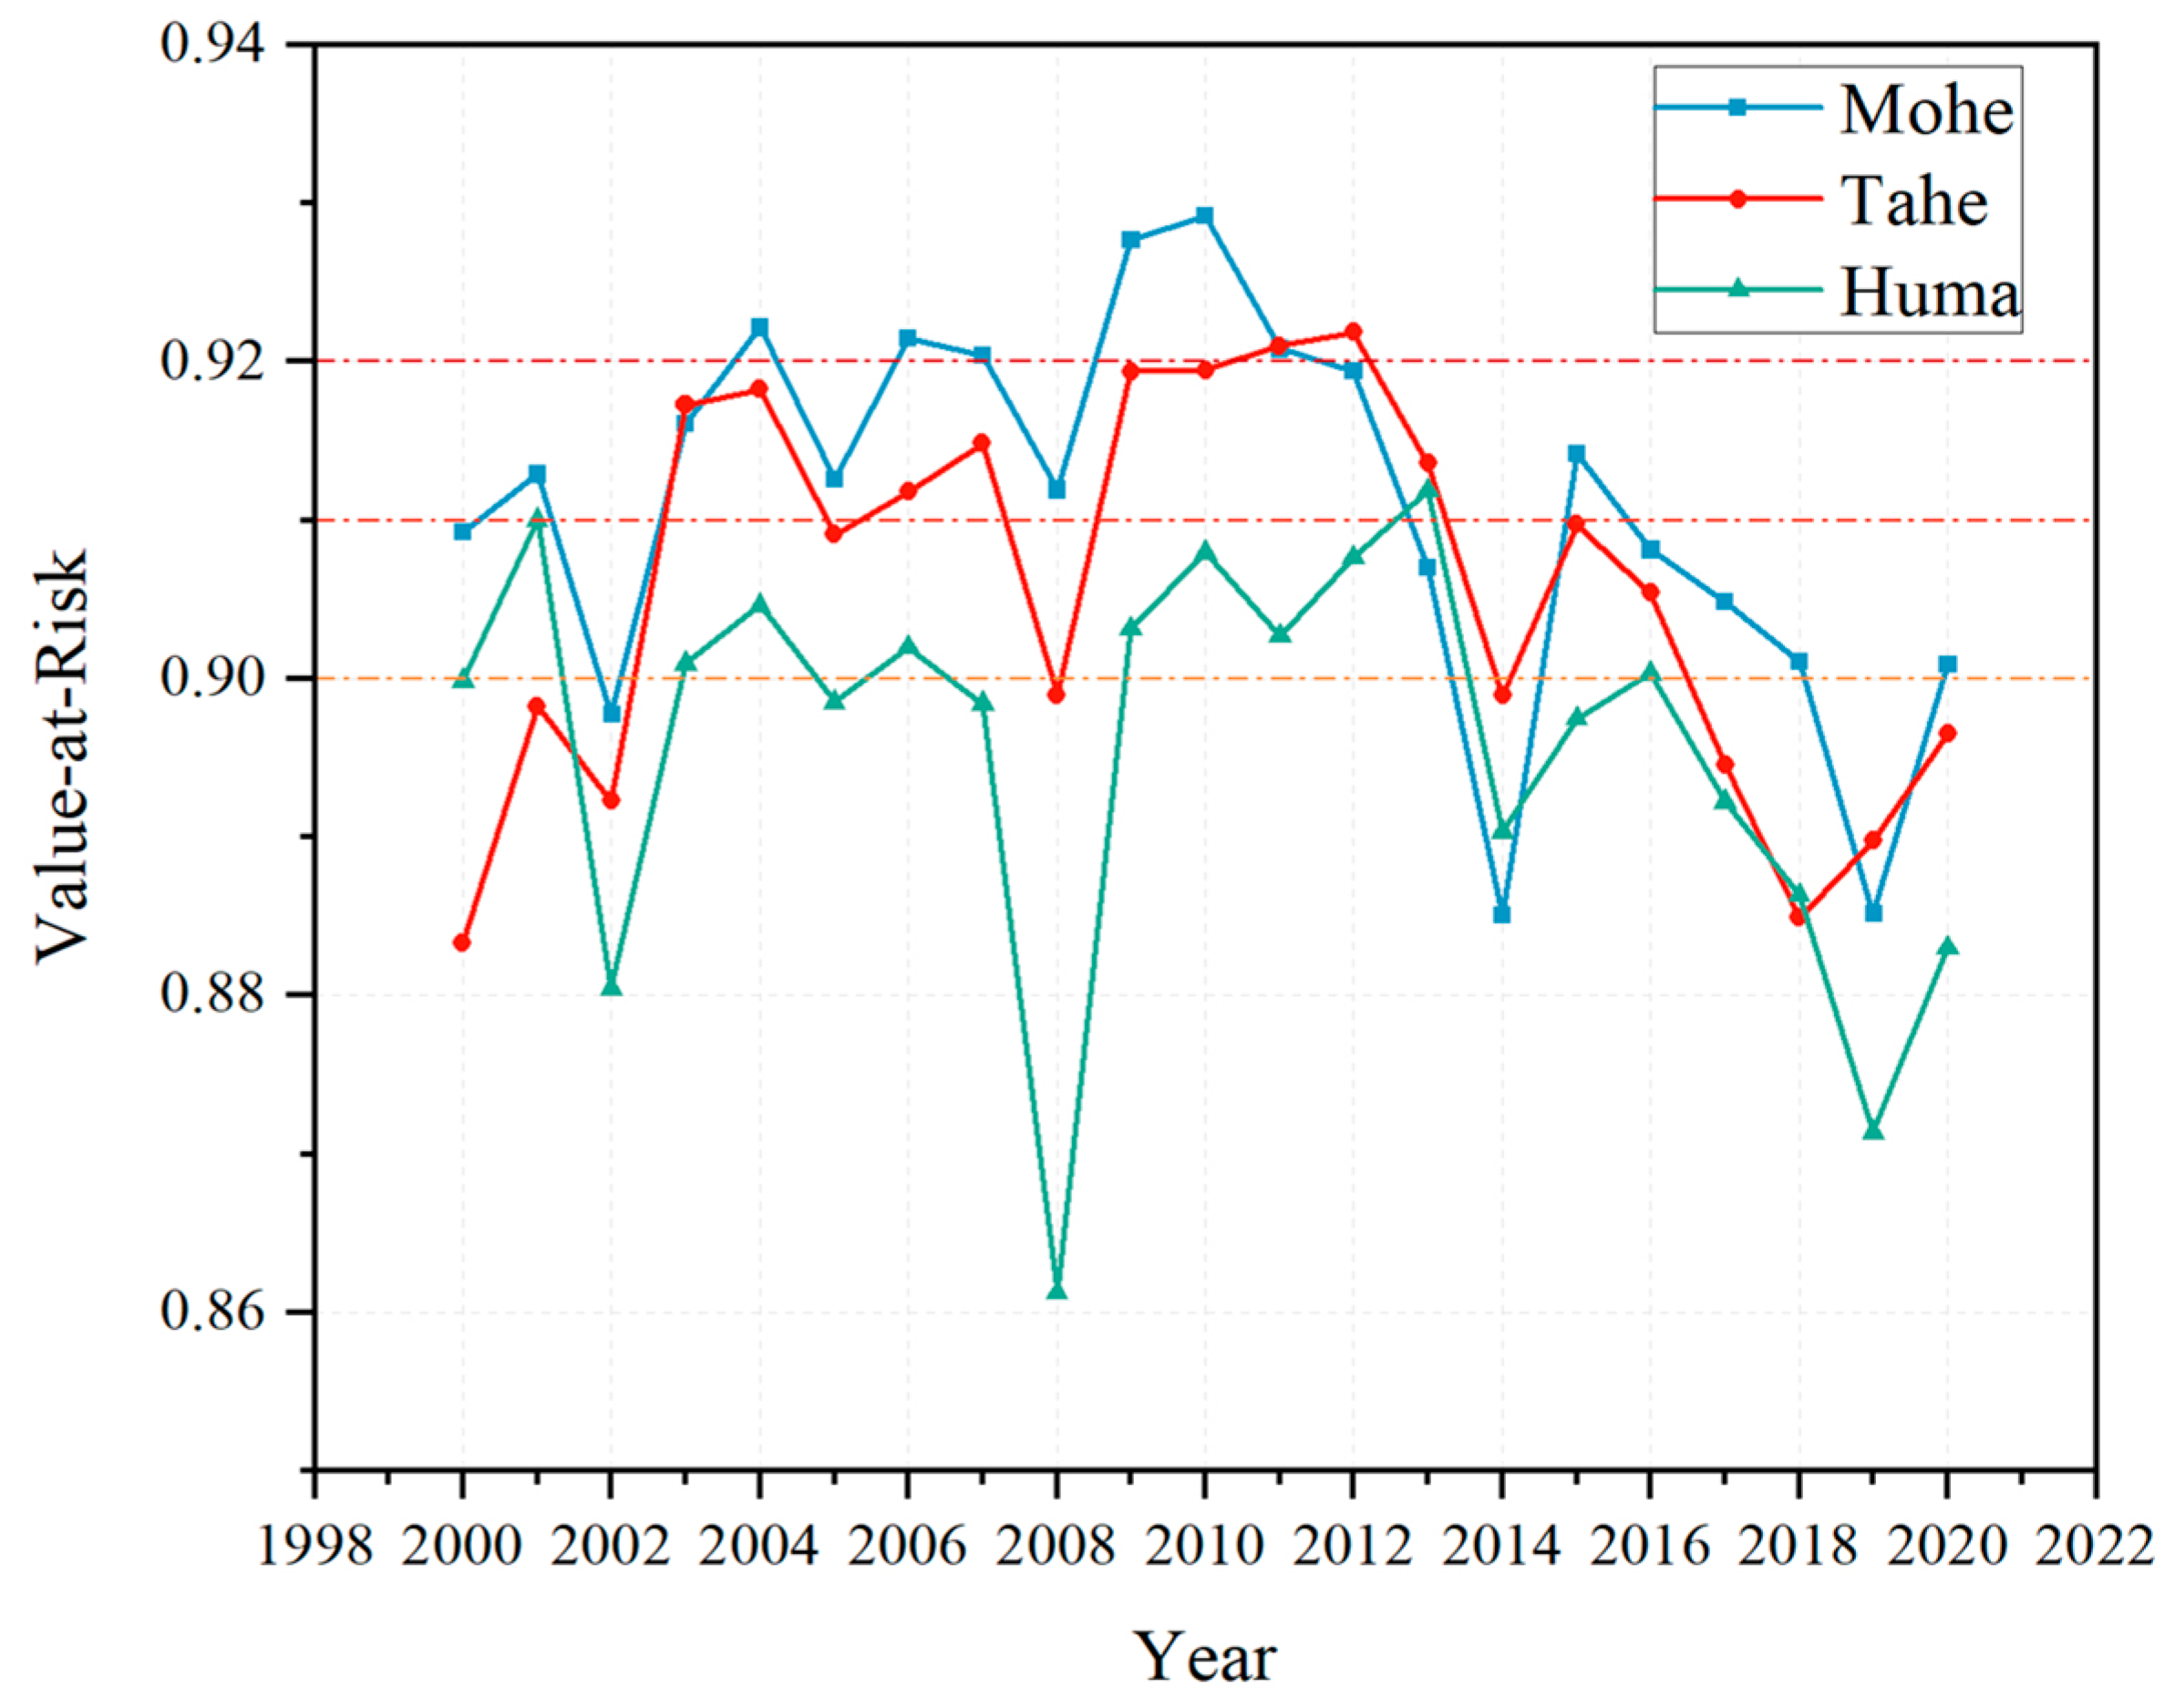
4.2. Ice Flood Risk Evaluation Results and Grade Classification
4.3. Results Analysis
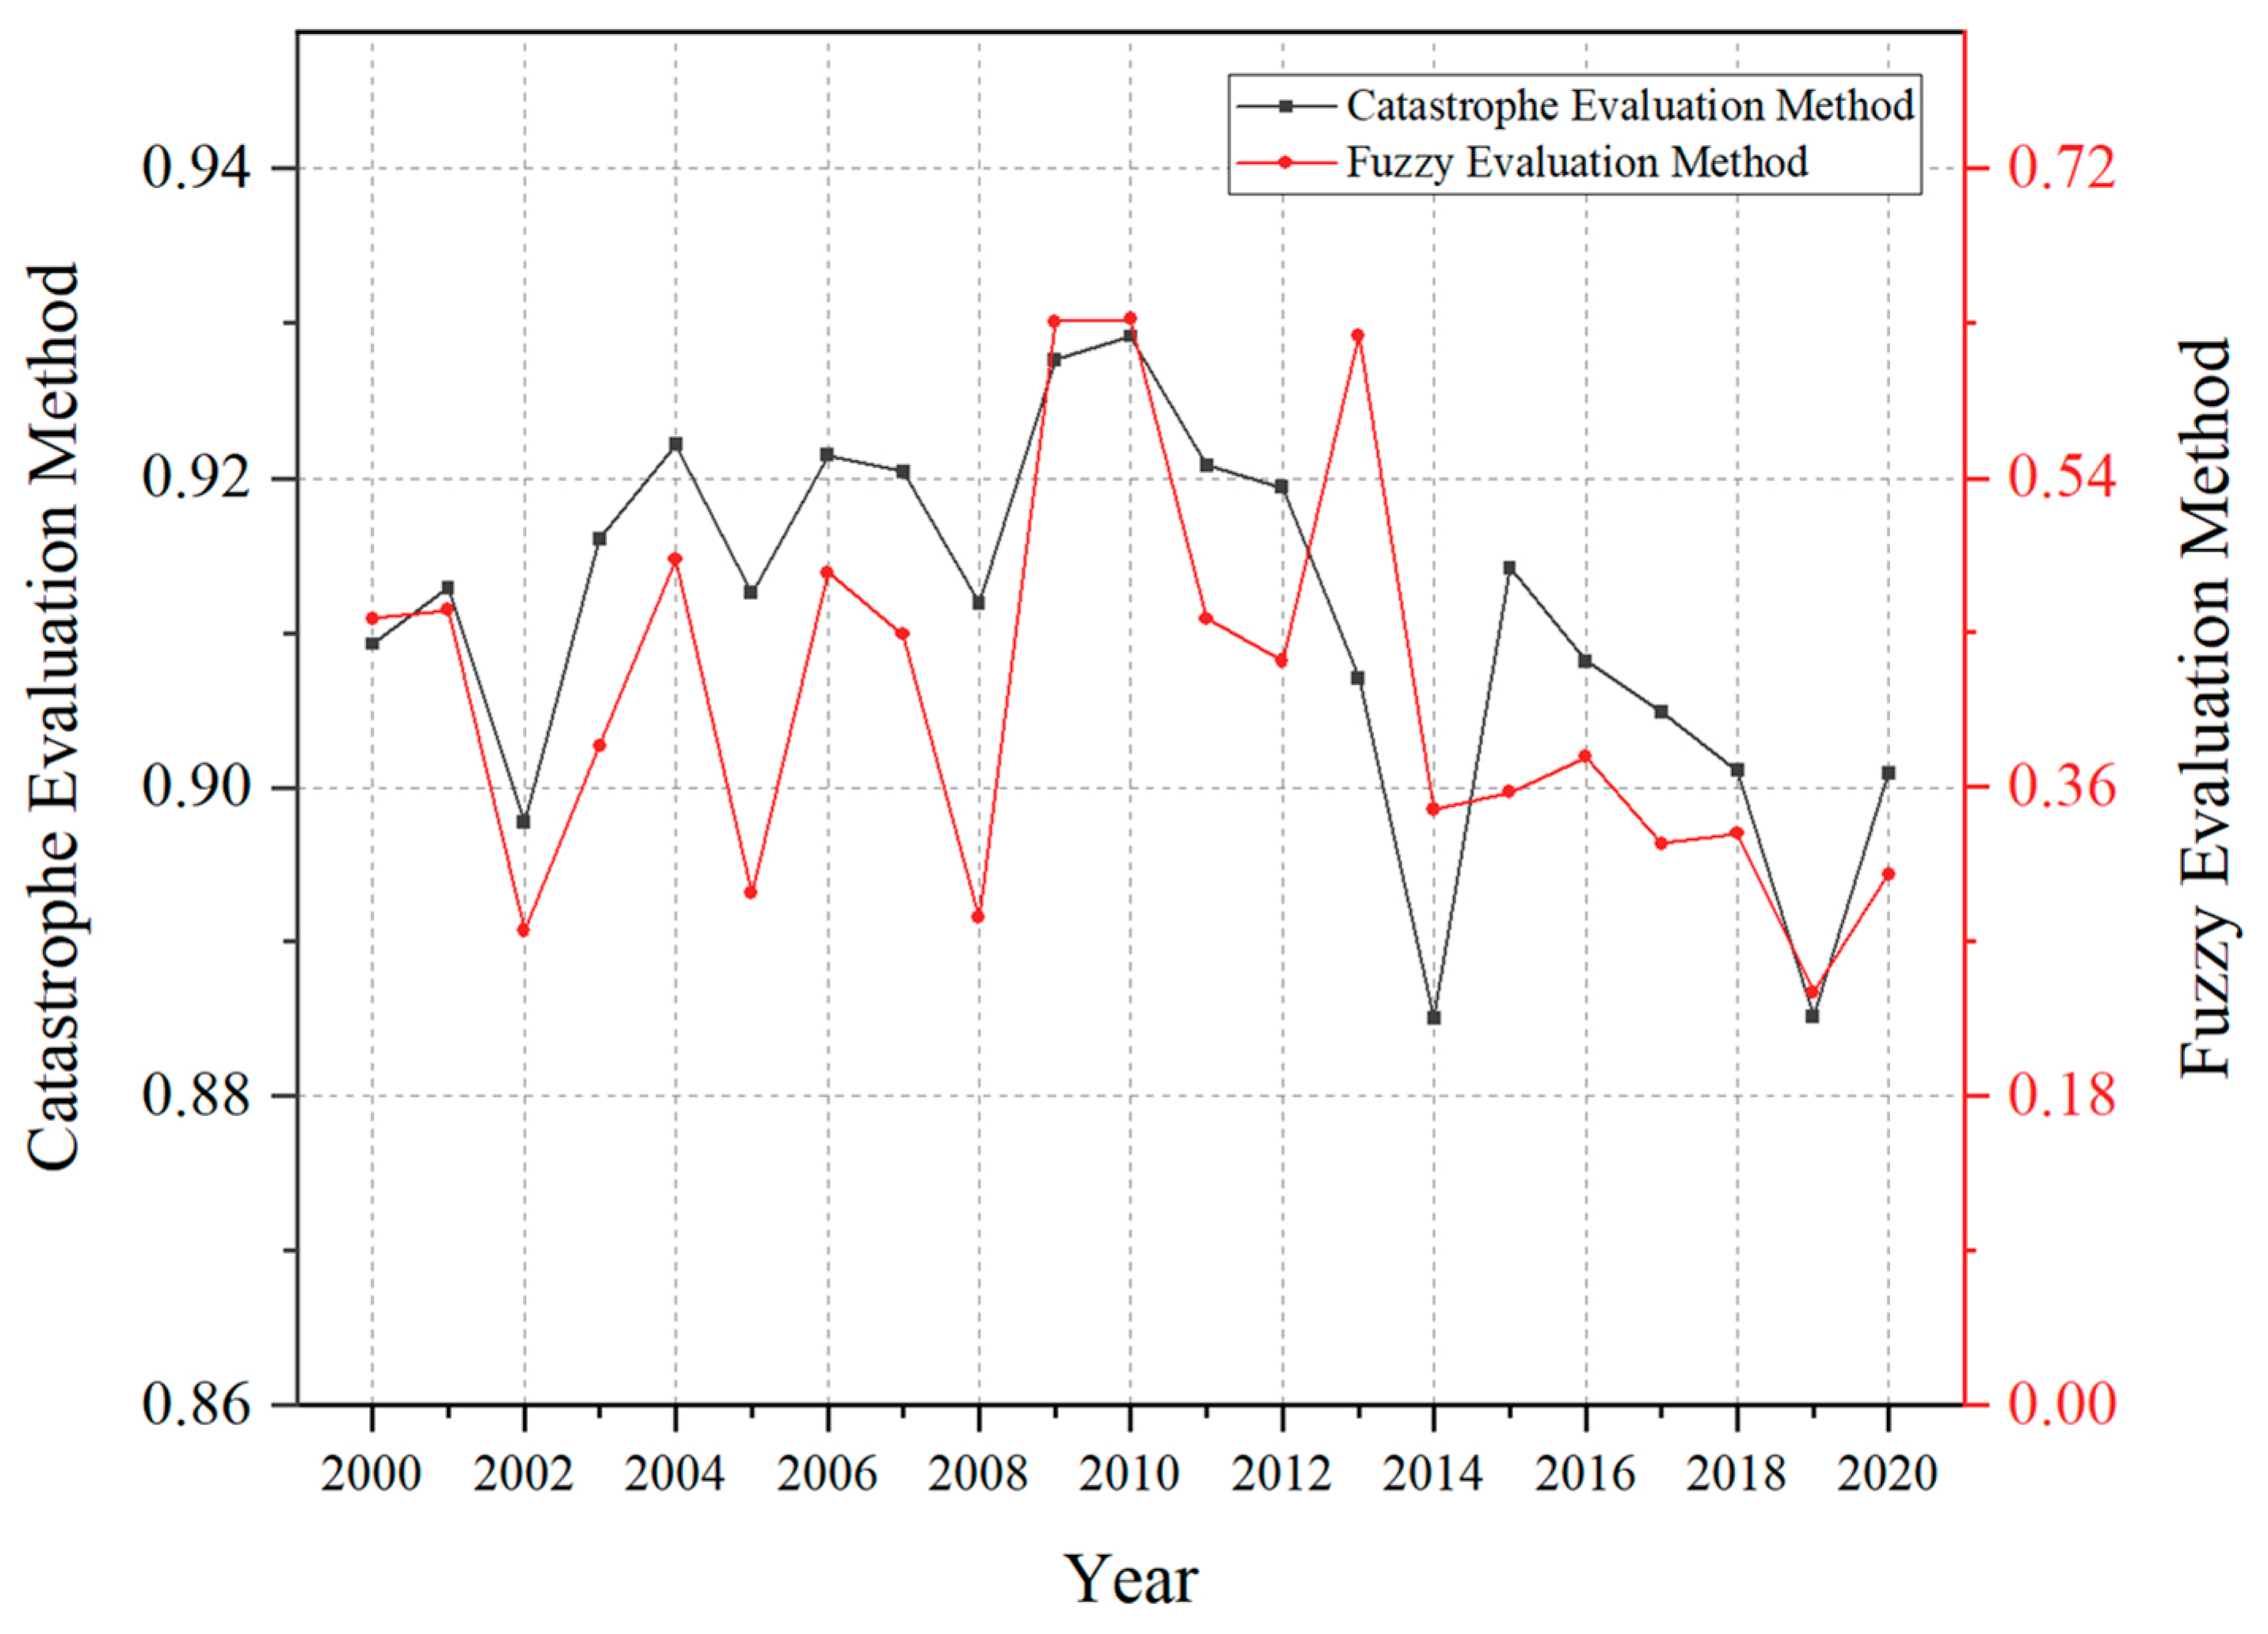
4.4. Accuracy Evaluation
5. Conclusions and Future Prospective
- Problems such as insufficient selection of indicators due to the difficulty of data accessibility may have some influence on the results of the ice flood disaster risk evaluation. However, as the construction and enhancement of the big data platform progress, it will be possible to include a wider range of indicators to enhance the ice flood disaster risk evaluation system. This improvement will contribute to more accurate and reliable results in the future.
- Using the entropy weight method, in the fuzzy comprehensive evaluation method, to determine the weight of the index may result in distorted evaluation outcomes due to inaccuracies in some of the weights. In future research, we plan to explore alternative weighting techniques or enhanced fuzzy theory to obtain more robust and desirable conclusions. By doing so, we aim to address the limitations and potential distortions associated with the entropy weight method and improve the overall accuracy and reliability of our evaluations.
Author Contributions
Funding
Data Availability Statement
Conflicts of Interest
References
- Das, A.; Reed, M.; Lindenschmidt, K.-E. Sustainable ice-jam flood management for socio-economic and socio-ecological systems. Water 2018, 10, 135. [Google Scholar] [CrossRef]
- Lindenschmidt, K.-E.; Rokaya, P. A stochastic hydraulic modelling approach to determining the probable maximum staging of ice-jam floods. J. Environ. Inform. 2019, 34, 45–54. [Google Scholar] [CrossRef]
- Beltaos, S. River Ice Jams; Water Resources Publications, LLC.: Highlands Ranch, CO, USA, 1995; ISBN 978-0-918334-87-9. [Google Scholar]
- Xu, X.; Xu, S.; Sun, G.; Ying, Y.; Li, Z. Experimental study on nitrobenzene distribution in cold river water. Water Resour. Prot. 2009, 25, 67–69+73. (In Chinese) [Google Scholar]
- Nadeem, H.; Imran, M.; Saleem, S.; Rafiq, Z.; Batool, A.; Mehmood, K.; Pervaiz, M.; Hussain, S.; Saeed, Z.; Younas, U. GO-Ag-NPs as a promising agent for biomedical, catalytic, electrochemical detection and water treatment technologies; a comprehensive review. Z. Phys. Chem. 2023. [Google Scholar] [CrossRef]
- Beltaos, S. Progress in the study and management of river ice jams. Cold Reg. Sci. Technol. 2008, 51, 2–19. [Google Scholar] [CrossRef]
- Williams, B.; Das, A.; Luo, B.; Lindenschmidt, K.-E. An ice jam flood hazard assessment of a lowland river and its terminus inland delta. Nat. Hazards 2021, 105, 2799–2817. [Google Scholar] [CrossRef]
- Kovachis, N.; Burrell, B.C.; Huokuna, M.; Beltaos, S.; Turcotte, B.; Jasek, M. Ice-jam flood delineation: Challenges and research needs. Can. Water Resour. J. 2017, 42, 258–268. [Google Scholar] [CrossRef]
- Song, C.; Zhu, X.; Han, H.; Lin, L.; Yao, Z. The influence of riverway characteristics on the generation and dissipation of ice dam in the upper reaches of Heilongjiang River. J. Hydraul. Eng. 2020, 51, 1256–1266. (In Chinese) [Google Scholar] [CrossRef]
- Beltaos, S.; Prowse, T.; Bonsal, B.; MacKay, R.; Romolo, L.; Pietroniro, A.; Toth, B. Climatic effects on ice-jam flooding of the Peace-Athabasca Delta. Hydrol. Process. 2006, 20, 4031–4050. [Google Scholar] [CrossRef]
- Turcotte, B.; Morse, B.; Pelchat, G. Impact of climate change on the frequency of dynamic breakup events and on the risk of ice-jam floods in Quebec, Canada. Water 2020, 12, 2891. [Google Scholar] [CrossRef]
- Kusatov, K.I.; Ammosov, A.P.; Kornilova, Z.G.; Shpakova, R.N. Anthropogenic factor of ice jamming and spring breakup flooding on the Lena River. Russ. Meteorol. Hydrol. 2012, 37, 392–396. [Google Scholar] [CrossRef]
- Das, A.; Lindenschmidt, K.-E. Modelling climatic impacts on ice-jam floods: A review of current models, modelling capabilities, challenges, and future prospects. Environ. Rev. 2021, 29, 378–390. [Google Scholar] [CrossRef]
- Lindenschmidt, K.-E.; Huokuna, M.; Burrell, B.C.; Beltaos, S. Lessons learned from past ice-jam floods concerning the challenges of flood mapping. Int. J. River Basin Manag. 2018, 16, 457–468. [Google Scholar] [CrossRef]
- Das, A.; Lindenschmidt, K.-E. Current status and advancement suggestions of ice-jam flood hazard and risk assessment. Environ. Rev. 2020, 28, 373–379. [Google Scholar] [CrossRef]
- Burrell, B.C.; Huokuna, M.; Beltaos, S.; Kovachis, N.; Turcotte, B.; Jasek, M. Flood hazard and risk delineation of ice-related floods: Present status and outlook. In Proceedings of the CGU HS Committee on River Ice Processes and the Environment 18th Workshop on the Hydraulics of Ice Covered Rivers, Quebec City, QC, Canada, 18–20 August 2015. [Google Scholar]
- Lindenschmidt, K.-E. River Ice Processes and Ice Flood Forecasting: A Guide for Practitioners and Students; Springer: New York, NY, USA, 2020; ISBN 978-3-030-28678-1. [Google Scholar]
- Turcotte, B.; Alfredsen, K.; Beltaos, S.; Burrell, B.C. Ice-related floods and flood delineation along streams and small rivers. In Proceedings of the CGU HS Committee on River Ice Processes and the Environment 19th Workshop on the Hydraulics of Ice Covered Rivers, Whitehorse, YT, Canada, 10–12 July 2017. [Google Scholar]
- Beltaos, S.; Burrell, B.C. Hydrotechnical advances in Canadian river ice science and engineering during the past 35 years. Can. J. Civil Eng. 2015, 42, 583–591. [Google Scholar] [CrossRef]
- Beltaos, S. Distributed function analysis of ice jam flood frequency. Cold Reg. Sci. Technol. 2012, 71, 1–10. [Google Scholar] [CrossRef]
- Lindenschmidt, K.-E. RIVICE-A non-proprietary, open-source, one-dimensional river-ice model. Water 2017, 9, 314. [Google Scholar] [CrossRef]
- Warren, S.; Puestow, T.; Richard, M.; Khan, A.A.; Khayer, M.; Lindenschmidt, K.-E. Near Real-time ice-related flood hazard assessment of the Exploits River in Newfoundland, Canada. In Proceedings of the CGU HS Committee on River Ice Processes and the Environment 19th Workshop on the Hydraulics of Ice Covered Rivers, Whitehorse, YT, Canada, 10–12 July 2017. [Google Scholar]
- Guo, X.; Wang, T.; Fu, H.; Guo, Y.; Li, J. Ice-jam forecasting during river breakup based on neural network theory. J. Cold Reg. Eng. 2018, 32, 04018010. [Google Scholar] [CrossRef]
- Mahabir, C.; Hicks, F.E.; Robichaud, C.; Fayek, A.R. Forecasting breakup water levels at Fort McMurray, Alberta, using multiple linear regression. Can. J. Civil Eng. 2006, 33, 1227–1238. [Google Scholar] [CrossRef]
- Mahabir, C.; Hicks, F.; Fayek, A.R. Neuro-fuzzy river ice breakup forecasting system. Cold Reg. Sci. Technol. 2006, 46, 100–112. [Google Scholar] [CrossRef]
- Mahabir, C.; Hicks, F.E.; Fayek, A.R. Transferability of a neuro-fuzzy river ice jam flood forecasting model. Cold Reg. Sci. Technol. 2007, 48, 188–201. [Google Scholar] [CrossRef]
- Wu, C.; Wei, Y.; Jin, J.; Huang, Q.; Zhou, Y.; Liu, L. Comprehensive evaluation of ice disaster risk of the Ningxia–Inner Mongolia Reach in the upper Yellow River. Nat. Hazards 2015, 75, 179–197. [Google Scholar] [CrossRef]
- Luo, D. Risk evaluation of ice-jam disasters using gray systems theory: The case of Ningxia-Inner Mongolia reaches of the Yellow River. Nat. Hazards 2014, 71, 1419–1431. [Google Scholar] [CrossRef]
- Lindenschmidt, K.-E.; Das, A.; Rokaya, P.; Chu, T. Ice-jam flood risk assessment and mapping. Hydrol. Process. 2016, 30, 3754–3769. [Google Scholar] [CrossRef]
- Schanze, J.; Zeman, E.; Marsalek, J. Flood Risk Management: Hazards, Vulnerability and Mitigation Measures; Springer: New York, NY, USA, 2006; ISBN 1-4020-4597-2. [Google Scholar]
- Carrivick, J.L.; Tweed, F.S. A global assessment of the societal impacts of glacier outburst floods. Glob. Planet. Chang. 2016, 144, 1–16. [Google Scholar] [CrossRef]
- Thom, R. Stabilité structurelle et morphogenèse. Poetics 1974, 3, 7–19. (In French) [Google Scholar] [CrossRef]
- Zhang, H.; Yu, J.; Du, C.; Xia, J.; Wang, X. Assessing risks from groundwater exploitation and utilization: Case study of the Shanghai megacity, China. Water 2019, 11, 1775. [Google Scholar] [CrossRef]
- Singh, L.K.; Jha, M.K.; Chowdary, V.M. Application of catastrophe theory to spatial analysis of groundwater potential in a sub-humid tropical region: A hybrid approach. Geocarto Int. 2022, 37, 700–719. [Google Scholar] [CrossRef]
- Rafi, M.N.; Imran, M.; Nadeem, H.A.; Abbas, A.; Pervaiz, M.; Khan, W.; Ullah, S.; Hussain, S.; Saeed, Z. Comparative influence of biochar and doped biochar with Si-NPs on the growth and anti-oxidant potential of Brassica rapa L. under cd toxicity. Silicon 2022, 14, 11699–11714. [Google Scholar] [CrossRef]
- Reghunath, R.; Sreedhara Murthy, T.R.; Raghavan, B.R. The utility of multivariate statistical techniques in hydrogeochemical studies: An example from Karnataka, India. Water Res. 2002, 36, 2437–2442. [Google Scholar] [CrossRef] [PubMed]
- Mahlknecht, J.; Steinich, B.; Navarro de León, I. Groundwater chemistry and mass transfers in the Independence aquifer, central Mexico, by using multivariate statistics and mass-balance models. Environ. Geol. 2004, 45, 781–795. [Google Scholar] [CrossRef]
- Voudouris, K.; Panagopoulos, A.; Koumantakis, J. Multivariate statistical analysis in the assessment of hydrochemistry of the northern Korinthia prefecture alluvial aquifer system (Peloponnese, Greece). Nat. Resour. Res. 2000, 9, 135–146. [Google Scholar] [CrossRef]
- Hussein, M.T. Hydrochemical evaluation of groundwater in the Blue Nile Basin, eastern Sudan, using conventional and multivariate techniques. Hydrogeol. J. 2004, 12, 144–158. [Google Scholar] [CrossRef]
- Bonifacio, A.; Beleites, C.; Sergo, V. Application of R-mode analysis to Raman maps: A different way of looking at vibrational hyperspectral data. Anal. Bioanal. Chem. 2015, 407, 1089–1095. [Google Scholar] [CrossRef] [PubMed]
- Suvedha, M.; Gurugnanam, B.; Suganya, M.; Vasudevan, S. Multivariate statistical analysis of geochemical data of groundwater in Veeranam catchment area, Tamil Nadu. J. Geol. Soc. India 2009, 74, 573–578. [Google Scholar] [CrossRef]
- Yang, W.; Xu, K.; Lian, J.; Bin, L.; Ma, C. Multiple flood vulnerability assessment approach based on fuzzy comprehensive evaluation method and coordinated development degree model. J. Environ. Manag. 2018, 213, 440–450. [Google Scholar] [CrossRef]
- Zou, Q.; Zhou, J.; Zhou, C.; Song, L.; Guo, J.; Yang, X. Flood disaster risk analysis based on variable fuzzy sets theory. Trans. Chin. Soc. Agri. Eng. 2012, 28, 126–132. (In Chinese) [Google Scholar]
- Wang, T.; Liu, Z.; Guo, X.; Fu, H.; Liu, W. Prediction of breakup ice jam with Artificial Neural Networks. J. Hydraul. Eng. 2017, 48, 1355–1362. (In Chinese) [Google Scholar] [CrossRef]
- Sun, W.; Trevor, B. Multiple model combination methods for annual maximum water level prediction during river ice breakup. Hydrol. Process. 2018, 32, 421–435. [Google Scholar] [CrossRef]
- Lindenschmidt, K.-E.; Alfredsen, K.; Carstensen, D.; Choryński, A.; Gustafsson, D.; Halicki, M.; Hentschel, B.; Karjalainen, N.; Kögel, M.; Kolerski, T.; et al. Assessing and mitigating ice-jam flood hazards and risks: A European perspective. Water 2022, 15, 76. [Google Scholar] [CrossRef]
- Wang, X.; Qu, Z.; Tian, F.; Wang, Y.; Yuan, X.; Xu, K. Ice-jam flood hazard risk assessment under simulated levee breaches using the random forest algorithm. Nat. Hazards 2023, 115, 331–355. [Google Scholar] [CrossRef]
- Wang, T.; Guo, X.; Fu, H.; Guo, Y.; Peng, X.; Wu, Y.; Li, J.; Xia, Y. Effects of water depth and ice thickness on ice cover blasting for ice jam flood prevention: A case study on the Heilong River, China. Water 2018, 10, 700. [Google Scholar] [CrossRef]
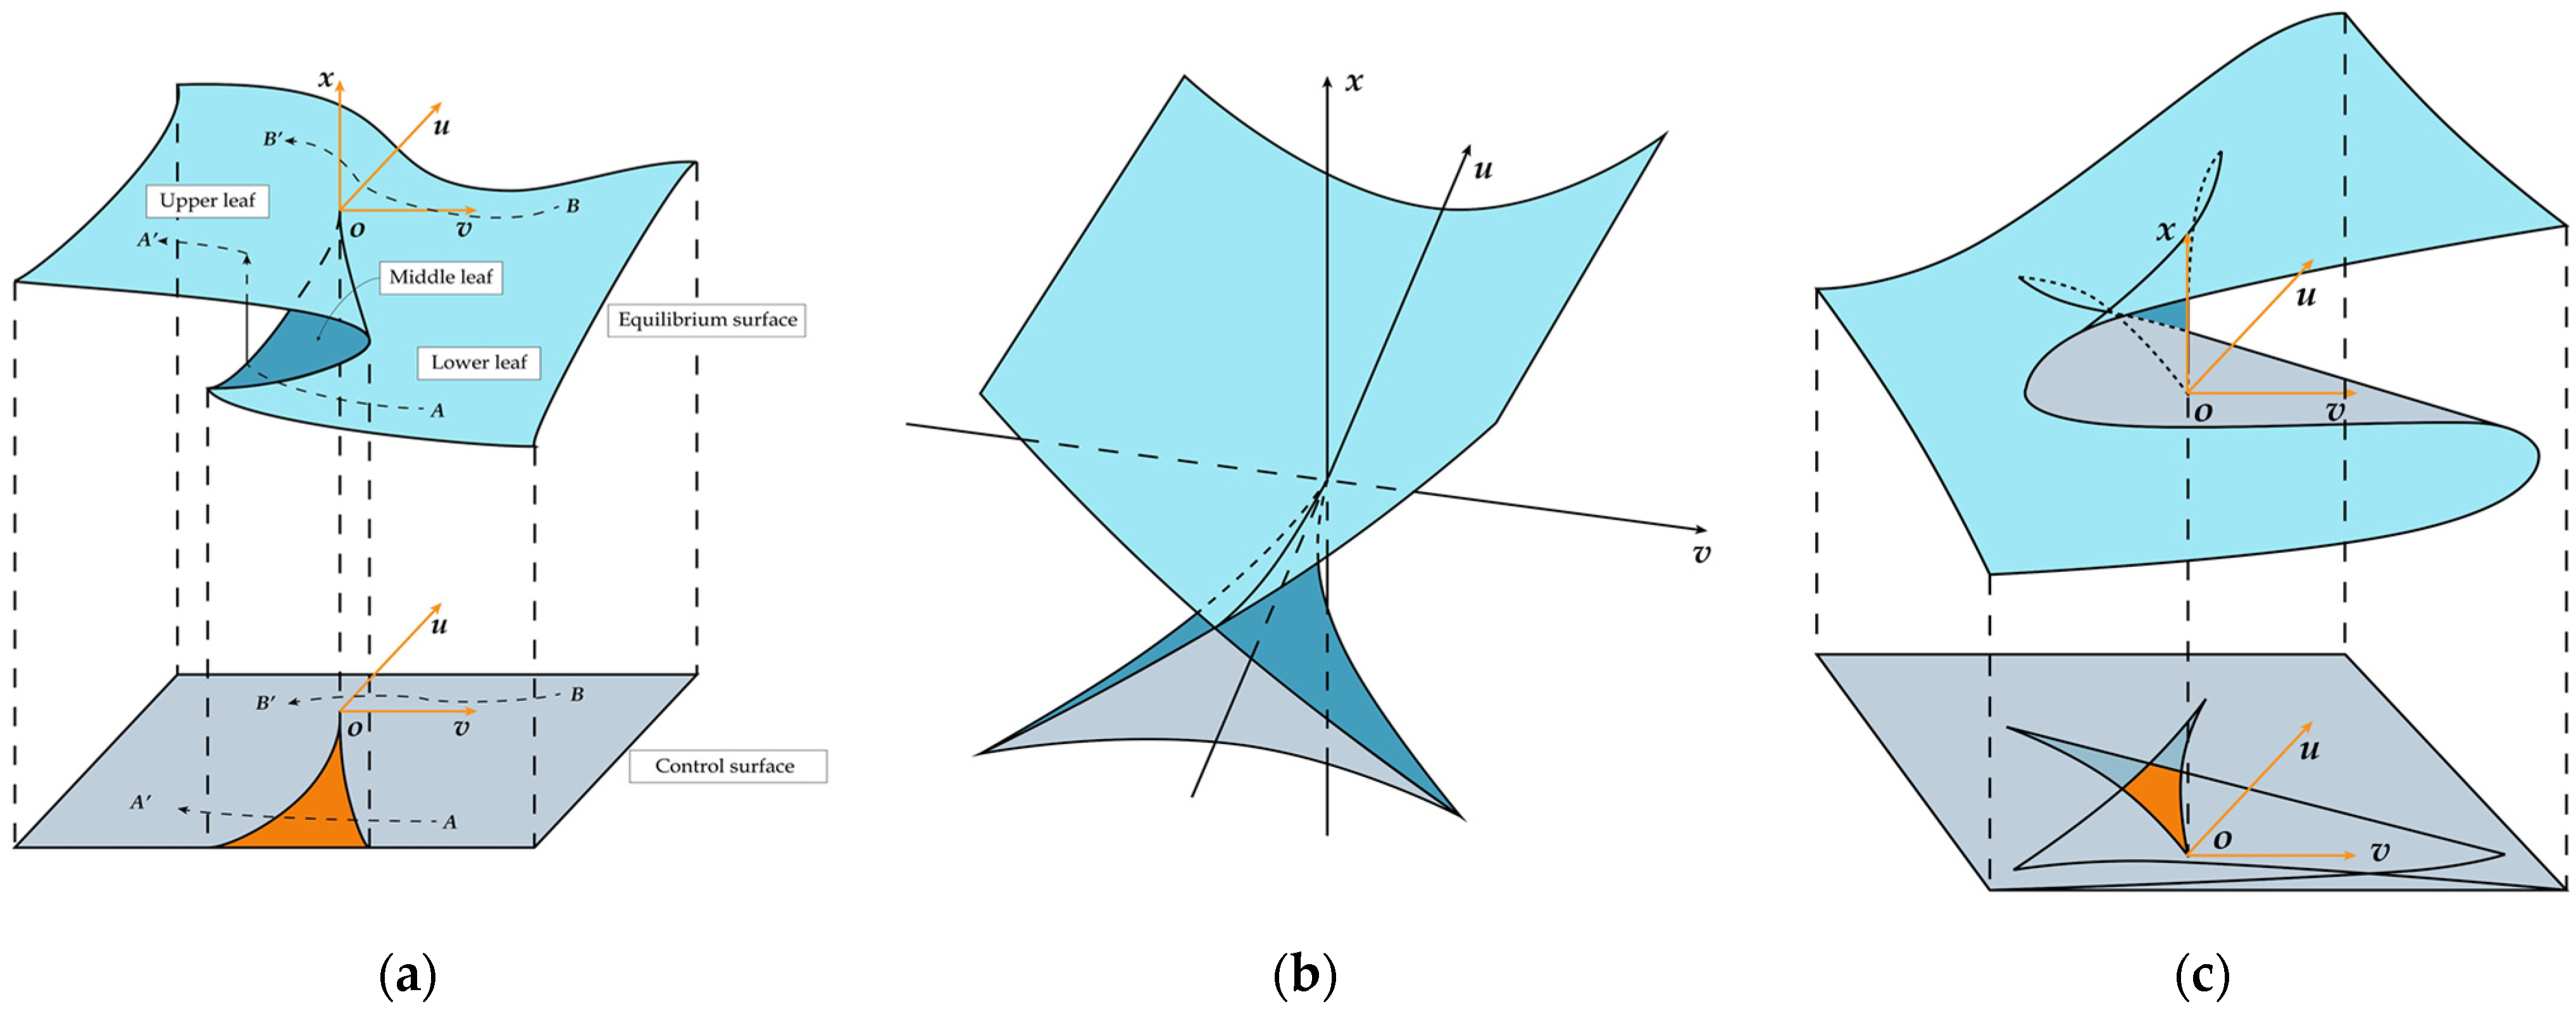
| Category | Potential Function | Normalization Formula |
|---|---|---|
| Cusp | ||
| Swallowtail | ||
| Butterfly |
| Criterion Layer | Index Layer | Indicator Nature | Unit |
|---|---|---|---|
| Hazard-inducing Environment | River length (XQ1) | (+) | km |
| River gradient (XQ2) | (+) | − | |
| Meander coefficient (XQ3) | (+) | − | |
| Width-to-narrow ratio of sudden contraction in the river channel (XQ4) | (+) | − | |
| Hazard Factor | Upstream average temperature from October to March (XP1) | (−) | °C |
| Local average temperature from October to March (XP2) | (−) | °C | |
| Upstream cumulative precipitation from November to March (XP3) | (−) | mm | |
| Average temperature from April 1 to 20 (XP4) | (+) | °C | |
| Average high temperature from April 1 to 20 (XP5) | (+) | °C | |
| Upstream cumulative insolation from April 1 to 20 (XP6) | (+) | h | |
| Local cumulative insolation from April 1 to 20 (XP7) | (+) | h | |
| Snow depth on April 1(XP8) | (+) | mm | |
| Upstream average ice thickness in March (XP9) | (+) | m | |
| Local average ice thickness in March (XP10) | (+) | m | |
| Downstream average ice thickness in March (XP11) | (+) | m | |
| Hazard-bearing Body | Population density (XR1) | (+) | people per km2 |
| Primary industry value-added ratio (XR2) | (+) | − | |
| GDP per capita coefficient (XR3) | (+) | − | |
| Anti-icing Capability | Number of hospital beds per capita (XS1) | (−) | sheet per people |
| Resident deposit amount coefficient (XS2) | (−) | − | |
| Local fiscal general budget revenue coefficient (XS3) | (−) | − | |
| Auxiliary Parameters | Ice flood hazard coefficient (XM) | (+) | m·d |
| Frequency of ice flood (XN) | (+) | times |
| Target Layer | Criterion Layer | Index Layer | Pearson Correlation Coefficient | Whether to Retain | Clustering Category | Indicator Layer | ||
|---|---|---|---|---|---|---|---|---|
| Correlation | Significant Level | |||||||
| Comprehensive Risk Situation of Ice Flood (A) | Hazard-inducing Environment (B1) | XQ1 | −0.08 | 0.949 | N | |||
| XQ2 | 0.58 | 0.609 | Y | 1 | C3 | |||
| XQ3 | −0.97 | 0.154 | Y | 1 | C2 | |||
| XQ4 | 0.68 | 0.526 | Y | 1 | C1 | |||
| Hazard Factor (B2) | Climatic Elements (C4) | XP1 | 0.49 | 0.025 | Y | 2 | D3 | |
| XP2 | 0.51 | 0.019 | Y | 2 | D2 | |||
| XP3 | 0.23 | 0.307 | N | |||||
| XP4 | 0.59 | 0.005 | Y | 2 | D1 | |||
| XP5 | 0.53 | 0.013 | N | |||||
| XP6 | 0.18 | 0.438 | N | |||||
| XP7 | 0.03 | 0.893 | N | |||||
| Hydrological Elements (C5) | XP8 | 0.59 | 0.005 | Y | 3 | D4 | ||
| XP9 | 0.55 | 0.010 | Y | 3 | D5 | |||
| XP10 | 0.51 | 0.018 | N | |||||
| XP11 | 0.54 | 0.011 | Y | 3 | D6 | |||
| Hazard-bearing Body (B3) | XR1 | Y | 4 | C6 | ||||
| XR2 | Y | 4 | C7 | |||||
| XR3 | Y | 4 | C8 | |||||
| Anti-icing Capability (B4) | XS1 | Y | 5 | C9 | ||||
| XS2 | Y | 5 | C10 | |||||
| XS3 | Y | 5 | C11 | |||||
| Clustering Group | Year | Clustering Distance | Mohe | Tahe | Huma | |||
|---|---|---|---|---|---|---|---|---|
| Value | Rating | Value | Rating | Value | Rating | |||
| 1 | 2000 | 0.804 | 0.909 | Moderate | 0.883 | Low | 0.900 | Moderate |
| 2 | 2015 | 0.850 | 0.914 | High | 0.910 | High | 0.897 | Low |
| 3 | 2008 | 0.322 | 0.912 | High | 0.899 | Low | 0.861 | Low |
| 4 | 2011 | 0.229 | 0.921 | Critical | 0.921 | Critical | 0.903 | Moderate |
| 5 | 2001 | 1.195 | 0.913 | High | 0.898 | Low | 0.910 | High |
| 6 | 2009 | 0.998 | 0.928 | Critical | 0.919 | High | 0.903 | Moderate |
| 7 | 2010 | 0.346 | 0.929 | Critical | 0.919 | High | 0.908 | Moderate |
| Typical Years and Regions | Evaluation Results (A) | Grading Results | ||
|---|---|---|---|---|
| Year | Region | Range | Grade | |
| 2010 | Mohe | 0.929 | 0.92~1 | I |
| 2011 | Mohe | 0.921 | ||
| 2010 | Tahe | 0.920 | 0.91~0.92 | II |
| 2001 | Huma | 0.910 | ||
| 2000 | Mohe | 0.909 | 0.90~0.91 | III |
| 2000 | Huma | 0.900 | ||
| 2008 | Tahe | 0.899 | 0~0.90 | IV |
| 2008 | Huma | 0.861 | ||
| Year | Catastrophe Evaluation Method | Fuzzy Evaluation Method | ||
|---|---|---|---|---|
| Value-at-Risk | Level | Value-at-Risk | Level | |
| 2010 | 0.929 | 1 | 0.632 | 1 |
| 2009 | 0.928 | 2 | 0.631 | 2 |
| 2011 | 0.921 | 3 | 0.458 | 3 |
| 2015 | 0.914 | 4 | 0.357 | 6 |
| 2001 | 0.913 | 5 | 0.463 | 4 |
| 2008 | 0.912 | 6 | 0.284 | 7 |
| 2000 | 0.909 | 7 | 0.458 | 5 |
Disclaimer/Publisher’s Note: The statements, opinions and data contained in all publications are solely those of the individual author(s) and contributor(s) and not of MDPI and/or the editor(s). MDPI and/or the editor(s) disclaim responsibility for any injury to people or property resulting from any ideas, methods, instructions or products referred to in the content. |
© 2023 by the authors. Licensee MDPI, Basel, Switzerland. This article is an open access article distributed under the terms and conditions of the Creative Commons Attribution (CC BY) license (https://creativecommons.org/licenses/by/4.0/).
Share and Cite
Li, Y.; Han, H.; Sun, Y.; Xiao, X.; Liao, H.; Liu, X.; Wang, E. Risk Evaluation of Ice Flood Disaster in the Upper Heilongjiang River Based on Catastrophe Theory. Water 2023, 15, 2724. https://doi.org/10.3390/w15152724
Li Y, Han H, Sun Y, Xiao X, Liao H, Liu X, Wang E. Risk Evaluation of Ice Flood Disaster in the Upper Heilongjiang River Based on Catastrophe Theory. Water. 2023; 15(15):2724. https://doi.org/10.3390/w15152724
Chicago/Turabian StyleLi, Yu, Hongwei Han, Yonghe Sun, Xingtao Xiao, Houchu Liao, Xingchao Liu, and Enliang Wang. 2023. "Risk Evaluation of Ice Flood Disaster in the Upper Heilongjiang River Based on Catastrophe Theory" Water 15, no. 15: 2724. https://doi.org/10.3390/w15152724
APA StyleLi, Y., Han, H., Sun, Y., Xiao, X., Liao, H., Liu, X., & Wang, E. (2023). Risk Evaluation of Ice Flood Disaster in the Upper Heilongjiang River Based on Catastrophe Theory. Water, 15(15), 2724. https://doi.org/10.3390/w15152724


