Article

Observations of Snow–Slush–Snow Ice Transformation and Properties of Brash Ice in Ship Channels

1
Department of Civil, Environmental and Natural Resources Engineering, Structural and Fire Engineering, Building Materials, Luleå University of Technology, 97187 Luleå, Sweden
2
TotalEnergies SE, 92400 Paris, France
3
Formerly TOTAL SA, 92400 Paris, France
*
Author to whom correspondence should be addressed.
Water 2023, 15(13), 2360; https://doi.org/10.3390/w15132360
Submission received: 16 May 2023 / Revised: 19 June 2023 / Accepted: 19 June 2023 / Published: 26 June 2023
(This article belongs to the Special Issue Cold Regions Ice/Snow Actions in Hydrology, Ecology and Engineering)

Abstract

:
The thickness and properties of brash ice are usually compared with the properties of the surrounding level ice. The differences between these ice types are important to understand since the consolidated brash ice layer is typically assumed to have the same properties as level ice. Therefore, significant effort in the measurement campaign during the winters of 2020–2021, 2021–2022, and 2023 was made to develop a better understanding of the full-scale brash ice channel development. The channels were located near the shore in the Bay of Bothnia, Luleå, Sweden. The main parameters investigated were the snow, slush, and total ice thicknesses, including ice formed from freezing water and from freezing slush as well as the ice microstructure and strength. To our knowledge, this is the first paper to report the influence of snow in brash ice channels. It was observed that a significant amount of snow covered the brash ice channels between the ship passages. After each ship passage, the snow was submerged and formed slush-filled voids, which thereafter transformed into snow ice (SI) clusters frozen together with columnar ice. The SI content in the brash ice and side ridges was estimated from image analyses. The analyses showed that the snow ice content was 73% in level ice in the vicinity of the ship channel, 58% in the side ridges of the channel, and 21% in the middle of the test channel, whereas in the main channel, the SI contents were 54%, 43%, and 41% in each location, respectively.

1. Introduction

Navigation in fast ice usually occurs in the same ship track by ice breakers and vessels without ice-breaking capabilities [1]. Frequently navigated ship channels are filled with broken ice pieces called brash ice. During navigation, fragments of the brash ice pieces are expelled sideways to form piles of broken ice under the level ice on both sides of a channel, and these side piles are typically called side ridges. The shapes, sizes, and total ice volumes of the broken ice depend on meteorological parameters such as freezing cumulative air temperatures [2,3,4], the frequencies and speeds of navigation, vessel geometries, and ice strengths [5,6].
The physical and mechanical brash ice properties are often presumed to be similar to level ice properties, for example, when estimating the growth of brash ice (e.g., density) or when simulating a vessel’s performance in broken or consolidated brash ice (e.g., ice strength). These assumptions may not be accurate for all situations, and only a few studies have reported full-scale measurements on brash ice properties, e.g., [7,8]. In addition to the most studied effects such as air temperature and frequency of navigation, other effects, including radiation or snowfall, may also influence the brash ice development in ship channels [9,10].
The incoming snow has a dual effect on the ice growth. Firstly, snow has low conductivity and insulates the surface of ice from the atmosphere, thus decreasing the ice growth rate [11]. Secondly, snow transforms to slush when submerged, which freezes to snow–ice [12,13,14].
Natural flooding of the ice’s surface occurs when two main conditions are met. Firstly, the snow mass exceeds the buoyancy of the ice, and, secondly, thermal or mechanical cracks are present [15,16,17]. During flooding, the bottom of the snow submerges below the water level, forming a fully saturated slush layer. Capillary pressure will force some water to rise in the snow pores and form a partly saturated slush layer above the water level [18,19,20,21]. Slush is a mix of fresh or saline water, snow melt, and snow crystals, which have water- and air-filled pores. Slush freezes into snow ice, which has granular equiaxed crystals on a random direction of the c-axis [22].
There are some results on natural snow–slush–snow ice phase changes in the case of level ice [23,24], and, to our knowledge, the effect of snow on deformed ice, particularly in brash ice formed in frequently navigated ship channels, has not been previously addressed [8]. In comparison to fast sea ice, river and lake ice is not always exposed to mechanical deformation; the level ice adjacent to ship channels is exposed to frequent mechanical breaking during navigation. Thus, the cracks formed after each passage can enhance the flooding of adjacent level ice and increase the thickness of the level ice.
The main objective of this study was to develop a better understanding and investigate the influence of incoming snow on the properties of level ice adjacent to ship channels, as well as its contribution to the formation of brash ice and side ridges. This is a descriptive article that aims to further the insight into the processes related to brash ice formation and growth in ship channels, as well as to better understand the impact of navigation on the surrounding level ice. To our knowledge, this is the first paper to report the influence of snow ice in brash ice channels. Different research activities, including field observations and measurements in four different channels, were conducted during three consecutive winters in the fast sea ice in the Bay of Bothnia. These activities provided insight into different aspects of brash ice formation and development, as well as into snow–slush–snow ice transformation phenomena in level ice and brash ice channels. Image analyses of brash ice, ridge ice, and level ice microstructures were carried out to investigate and determine their properties and differences in snow–ice contents. The microstructures, microporosities, and strengths of the ice from the channel and level ice were analyzed and compared. The following chapter details the field investigations, laboratory measurements, and analytical methods applied. The results and analysis are divided into two chapters. The first one (Section 3) discusses the snow–slush–snow ice transformation process in level ice adjacent to the ship channels, and the second chapter (Section 4) investigates and discusses the snow contribution in the ship channels. Finally, the main results and impacts of the paper are summarized in the conclusions.

2. Measurements and Methods

The following subsections present the research location, the in situ research activities, and the laboratory as well as analytical methods that were applied to estimate the snow ice content for different ice types.

2.1. Study Site

This research was carried out in the Bay of Bothnia in the Swedish coastal fast ice between the Icebreaker and Luleå ports, Luleå, Sweden. The Bay of Bothnia consists of brackish water, and, in this particular location, the ice salinity measured in the winter season was zero due to the Luleå River discharge. Luleå Airport’s weather station is located approximately 3 km from the research site; see Figure 1.
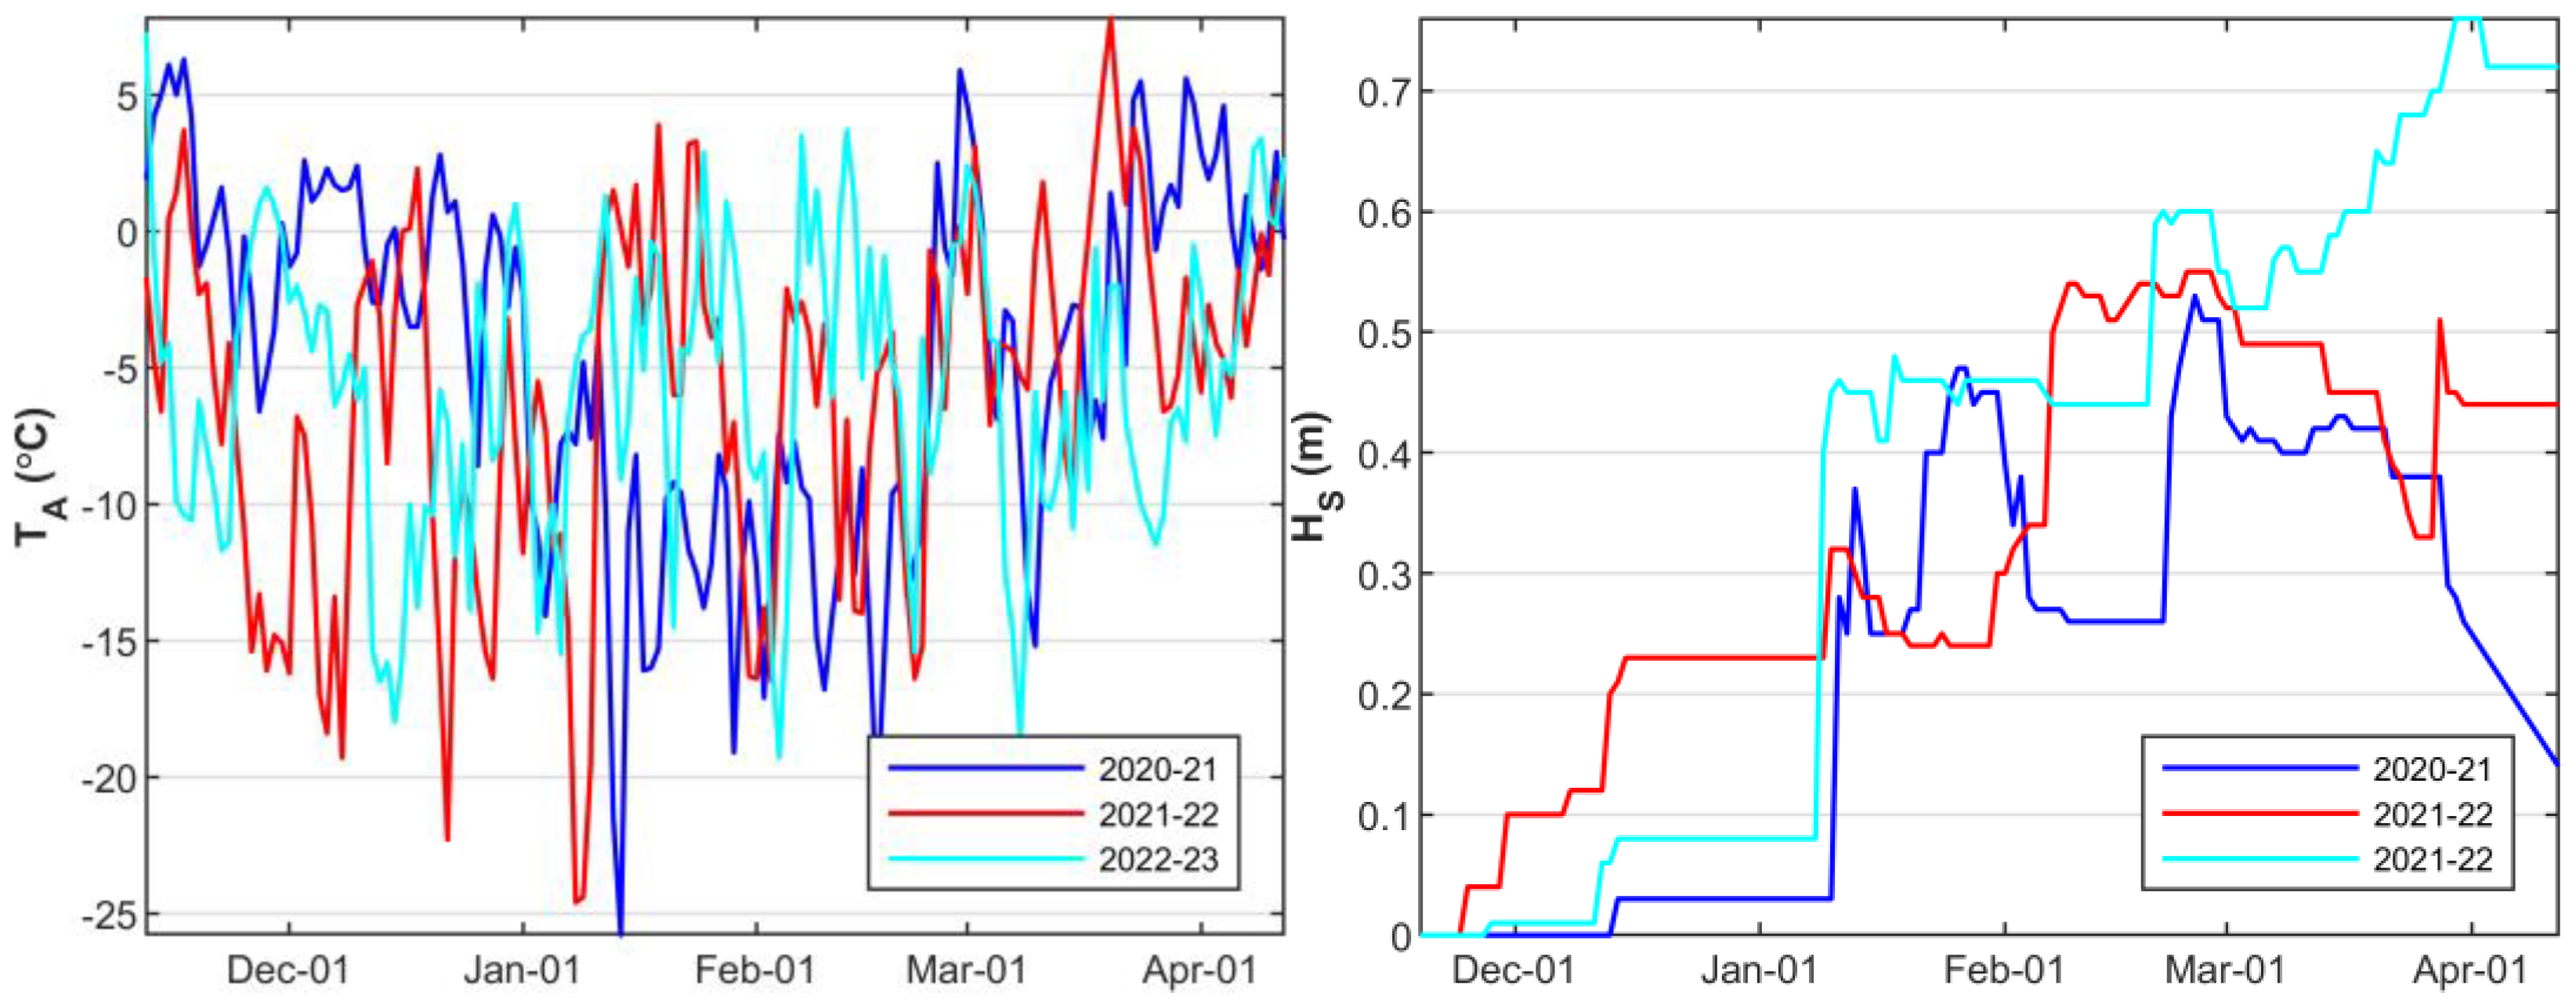
A channel was created and maintained by Tug Viscaria to be used exclusively for research purposes for two consecutive winters: January–March 2021 and December 2021–March 2022. These channels were located 200 m from the shoreline and are referred to throughout the paper as the test channels TCh01 and TCh02. Another frequently navigated channel, which is established yearly and used by icebreakers and merchant vessels, was located 400 m from the shore and 200 m apart from the test channels. We refer to it as the main channel (MCh), and the brash ice properties from the main channel were studied during 2021 and 2023. Meteorological data, including the air temperature, shortwave radiation, precipitation, snowfall, humidity, and wind, were continuously recorded by the meteorological weather station of SMHI (Swedish Meteorological and Hydrological Institute) in Luleå Airport. The air temperatures and snow thicknesses for the winters 2020–2021, 2021–2022, and 2022–2023 are presented in Figure 2.

2.2. Field Site

The field study was divided into four main activities: (1) observations of the test channels’ development instantly after each ship passage through images and video recordings; (2) cross-section measurements of the test channels (TCh01 and TCh02); (3) thickness measurements of the unbroken level ice in the shoreside of the test channels; and (4) mechanical and material property analyses of cores sampled from level ice, brash ice, and side ridges from the first test channel; and the main channels during 2021 and 2023 were investigated in LTU’s cold laboratory.

2.2.1. Observation in the Test Channel

The first field activity included brash ice surface and underwater morphology observations after each ship passage in test channels. A GoPro camera was used for underwater observations and recordings. These observations provided insights into the different factors that influence brash ice formation and growth.

2.2.2. Brash Ice Thickness Measurements

The thicknesses of brash ice, side ridges, and level ice up to a distance of 10 m from the channel edge were measured along the cross-section of the channel using a ruler stick with a protrusion in the end. Holes were drilled every 1 m along the cross-section using an auger drill with a diameter of 50 mm. Table 1 summarizes the number of ship passages, dates, and times when the cross-section measurements were carried out. This article discusses only the results of level ice measurements from the vicinity of TCh01. The cross-section results are further analyzed and will be reported in two companion articles. The first article will discuss the brash ice macroporosities and piece size distributions from three brash ice channels located in Luleå. The second article will validate various models for brash ice growth.

2.2.3. Level Ice Measurements

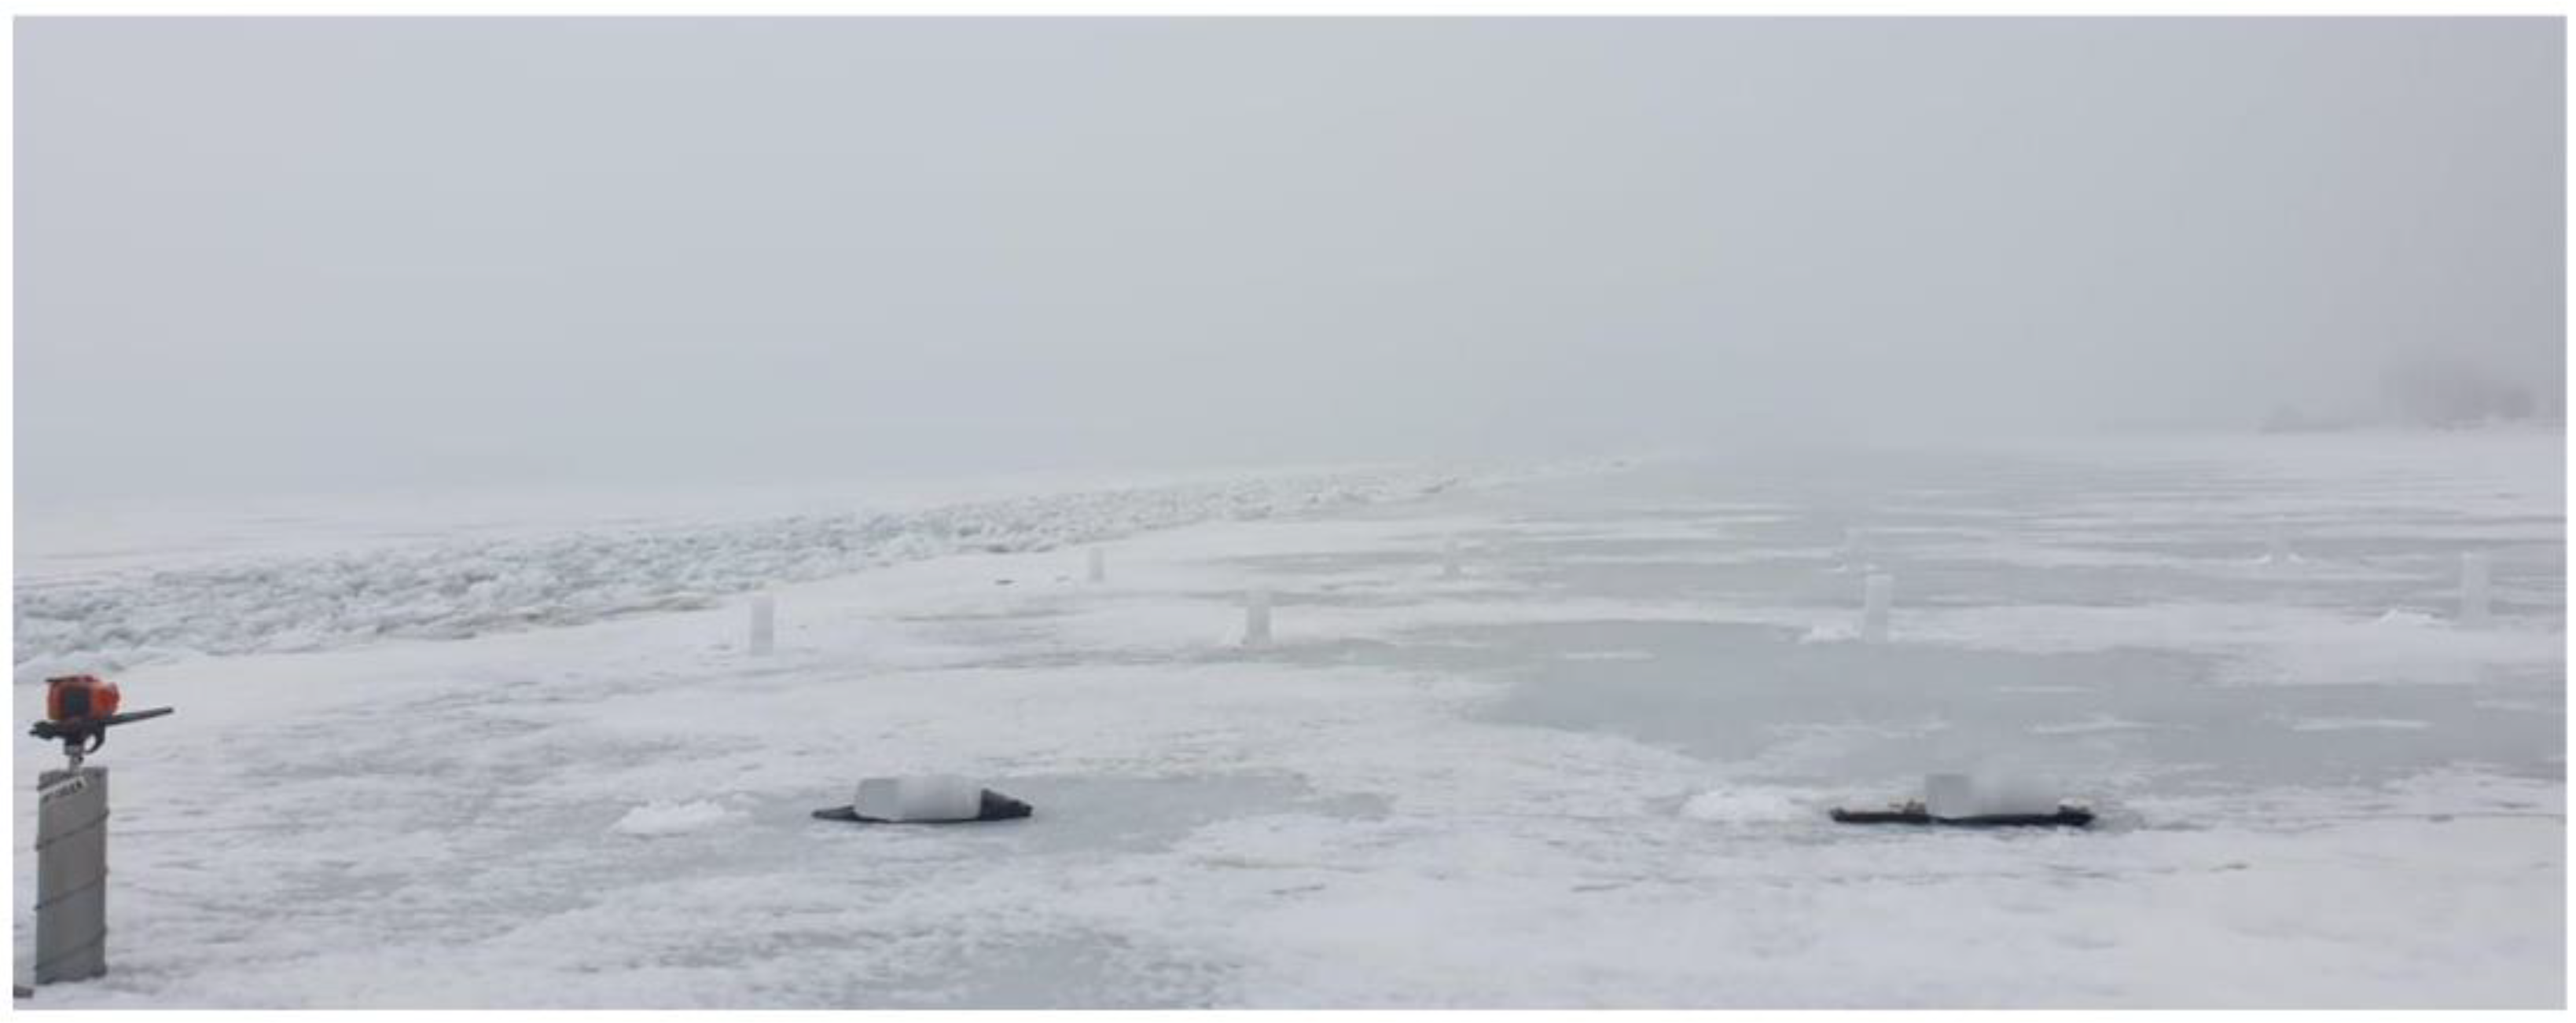
The thicknesses of the level ice on the shoreside of channels TCh01 and TCh02 were measured in two consecutive winters: February–April 2021 and December 2021–April 2022; see Table 1. During the first winter, the level ice thickness measurements were placed in a grid of 30 m along the channel’s length and 20 m towards the shore, starting from a minimum distance of 5 m from the channel edge. Approximately 15 cores were drilled each time, as shown in Figure 3. In the second winter, the measurements were carried out in a grid of 60 m along the channel’s length and 40 m towards the shore. Twelve cores were drilled each time.
On-site measurements included the snow thickness, followed by drilling an ice core of 200 mm in diameter. The snow ice, congelation ice, and total level ice thicknesses were investigated and recorded for each core. In addition, the freeboard, slush, and ice thicknesses were measured from all drilled holes. The thickness measurements were carried out with a millimeter-scale ruler. The measurement technique’s error was below 5 mm, whereas discrepancies could be present due to spatial thickness variations in slush, snow, or ice. This field study aimed to detect any possible slush formation due to flooding or melting and its subsequent freezing to snow ice.

2.2.4. Brash Ice and Level Ice Cores

The final group of activities involved sampling ice cores to investigate and analyze the fractions of snow ice and congelation ice. Two brash ice cores were sampled from TCh01 on the 8 February 2021, and two side ridge cores were sampled on the 23 March 2021. On the 6 March 2021, five cores were sampled at different locations along half of the cross-section of TCh01. The first core was drilled in the middle of the channel, the second was drilled between the mid-channel and the edge, the third core was drilled at the edge of the channel, and the fourth was drilled in the ridge between the edge and the level ice. The fifth core was drilled in the level ice near the ship channel.
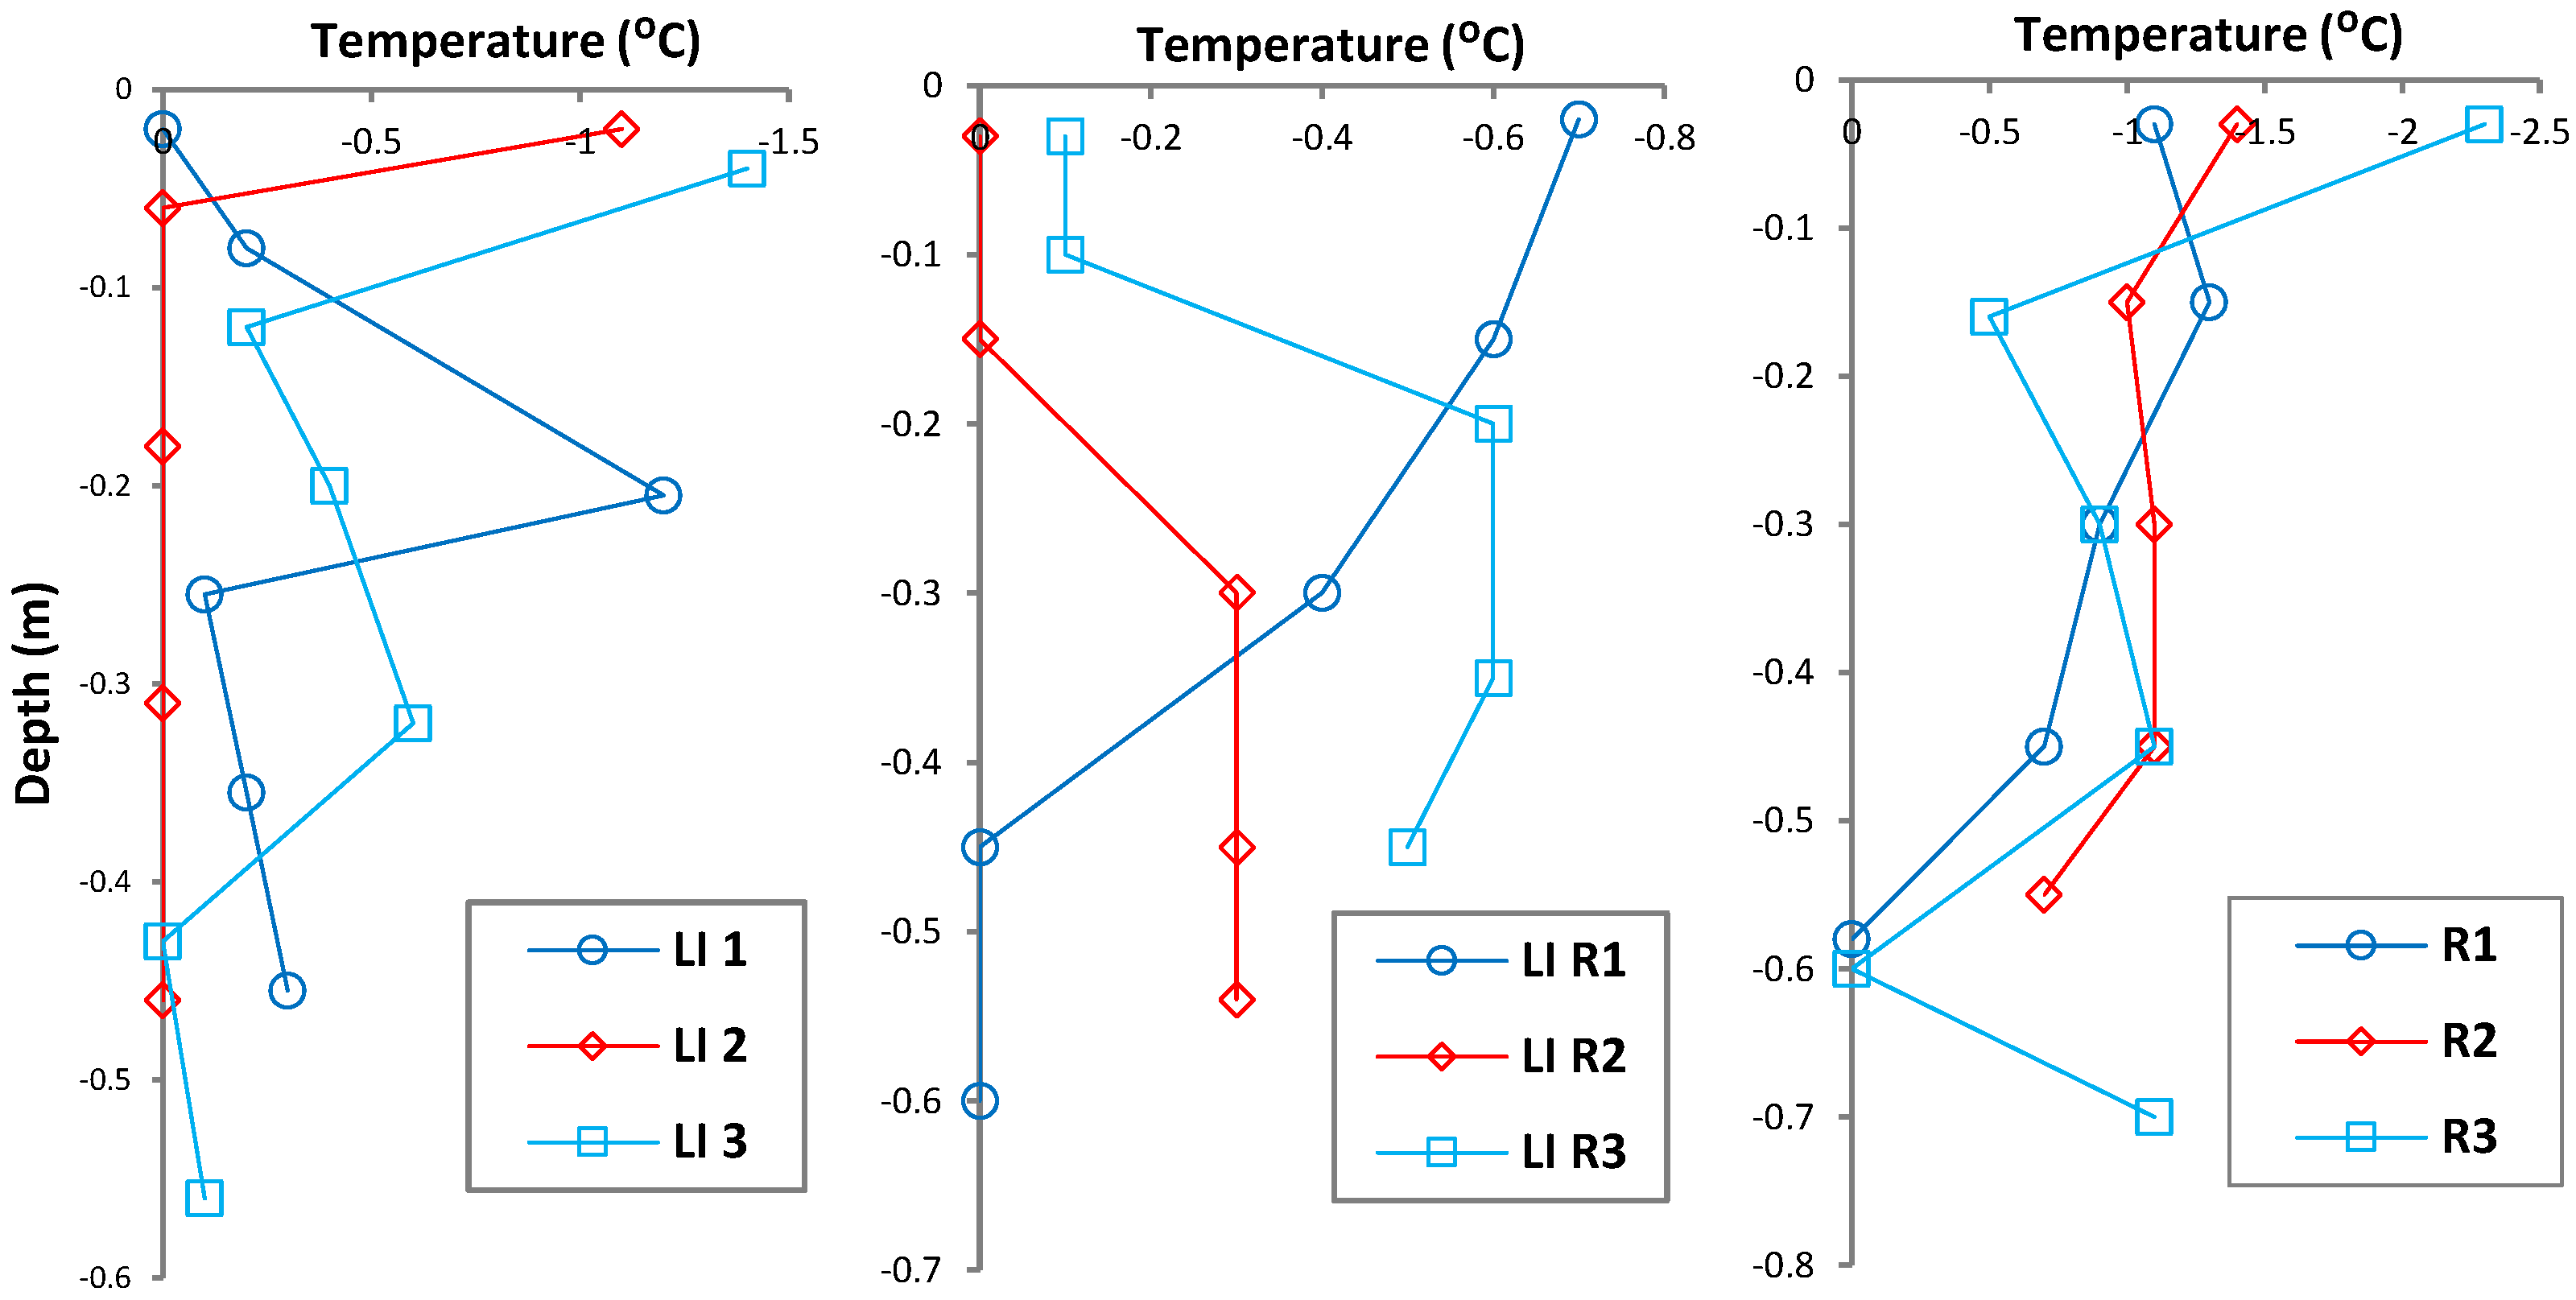
On the 7 March 2021, nine cores were drilled between the test and main channels, aiming to observe the thickness of snow ice between the two channels. Additionally, cores were sampled along the side ridge of the main channel. Three cores were sampled in the level ice (LI) between the test and main channels, three cores were sampled in the vicinity of the ridge, and the remaining three cores were sampled along the ridge of the main channel. In each position, the samples were spaced 6 m apart from each other and equidistant from the edge of the main channel. Immediately after sampling, holes were drilled through the thickness of each ice core, and a calibrated thermocouple was used to measure the ice temperature. The temperature profiles of these nine cores are shown in Figure 4.
In addition, 10 cores were sampled along half the cross-section of the main channel on the 25th and 26th of February 2023. The cores were transported to Luleå University of Technology and stored in a freezing box with a constant temperature of −20 °C. They were investigated in the cold laboratory during the summer of 2021 and the spring of 2023.

2.3. Methods

This section describes the methods used to determine the ice sample’s snow ice content, microporosity, density, and uniaxial compressive strength.

2.3.1. Snow Ice Content

Thin ice sections ranging from 2 to 10 mm were observed under cross-polarized light as well as against dark and bright backgrounds using plain transmitted light. The crystal structure of ice can be identified under cross-polarized light, whereas the pores and pore sizes can be observed against a dark or bright background [25]. A total of 28 cores from the test and main channels were analyzed to determine the quantity of granular ice (snow ice) based on their microstructure. In the case of level ice cores, the thickness ratios between snow−ice and the total core thickness were used to quantify both snow−ice and columnar ice. Snow−ice (SI) resulting from the freezing wet snow (slush) is opaque compared to the transparent ice formed by freezing water [25]. Different terms are used to characterize ice formed from freezing, such as columnar ice, which refers to its crystallinity; congelation ice, which refers to freshwater ice [22]; and clear ice, which refers to the transparency of freshwater ice with low porosity. The notation CI is used for all these terms.
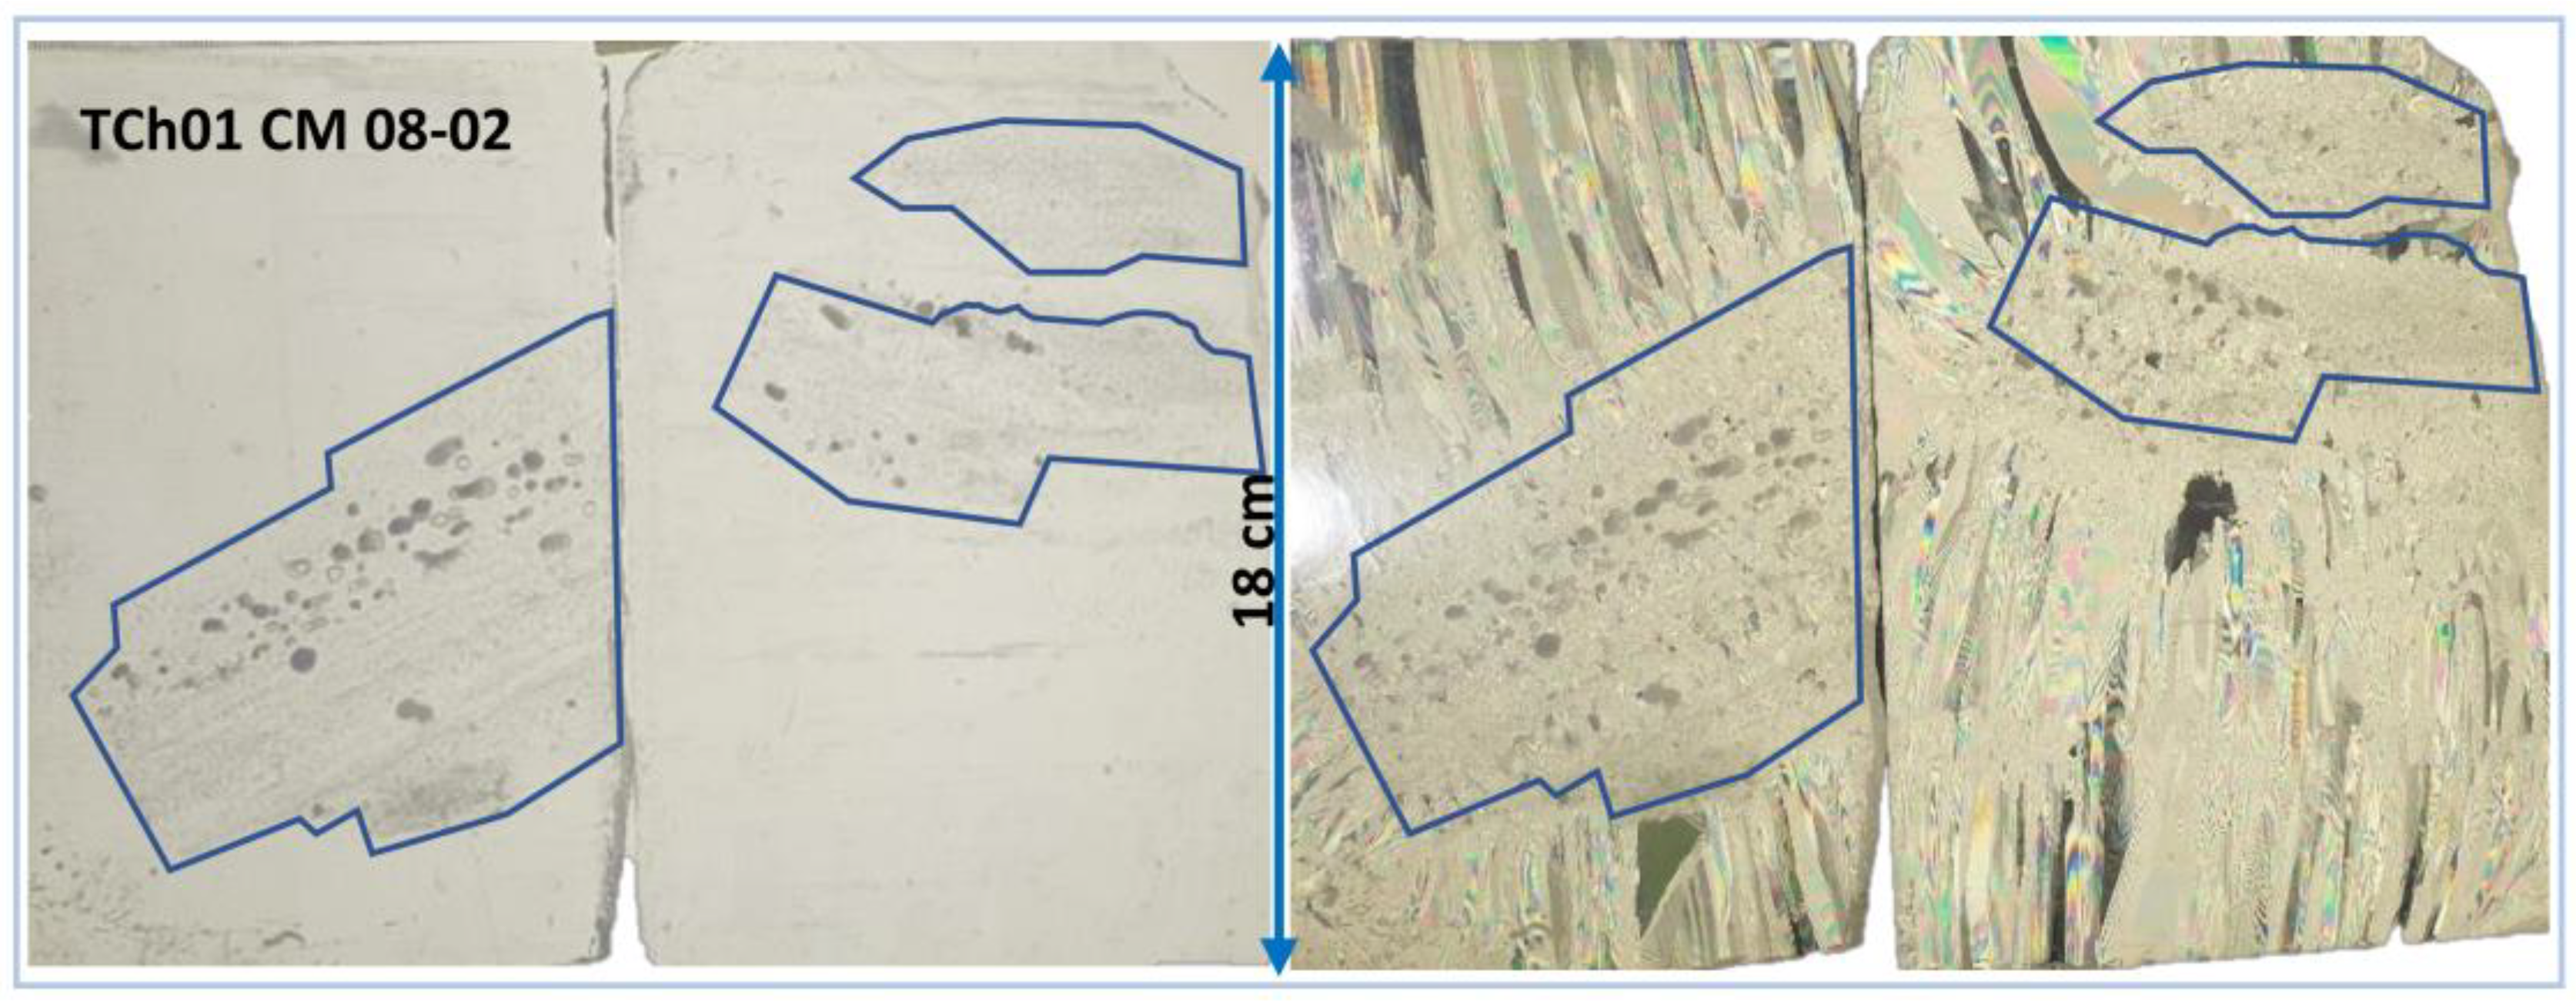
The SI could not be accurately estimated as a ratio of thicknesses in the ridge and brash ice samples due to their mixed characteristics. Instead, thin sections of ice were used to quantify the snow−ice content. Images of thin sections recorded under cross-polarized light, and under dark and bright backgrounds, were analyzed with ImageJ software. The boundaries of the thin ice sections and the boundaries of the snow−ice clusters were manually marked, and their surface areas were examined by the software. The SI content was calculated by determining the ratio between the surface area of the SI and the total surface area of the thin ice section. When analyzing images captured under cross-polarized light, snow ice was identified by its fine granular crystals [22]. On the other hand, for images captured with a dark and bright background, snow ice was distinguished by its fine round air pores [26]. Figure 5 provides an example of image analysis, showing a thin ice section from the channel’s middle photographed under plain-transmitted light and cross-polarized light. Trapped round air micropores, as depicted in Figure 5, typically form when slush freezes to snow ice and indicate the presence of SI. Transparent ice with a low pore concentration, as seen in Figure 5, can be defined as CI.

2.3.2. Physical and Mechanical Properties

Cylindric samples with maximum sizes of 70 mm in diameter and 170 mm in length were horizontally sampled from the 200 mm ice cores. The volume (V) of each cylinder was determined using the measured length and diameter. The densities of the cylindrical samples were calculated using the volume–mass method [27]. The microporosity (p) of each cylinder, with a volume V and a measured mass mm, was estimated by comparing the measured and the theoretical mass (mth) assuming zero salinity and a density (ρpi) of pure ice equal to 917 kg m−3 [28].
p = 1 ( m m V ρ pi )
A total of 23 cylinders from TCh01 and 22 cylinders from MCh 2021 were subjected to unconfined uniaxial compressive strength tests at nominal strain rates of 10−3 s−1. Additionally, 32 cylinders from MCh 2023 were tested at nominal strain rates equal to 10−4 s−1. The setup for the unconfined uniaxial compression tests and the calibration of the deformation system were previously described in [8,29]. Immediately after carrying out the compressive strength tests, the temperature of each ice cylinder was measured using a calibrated thermocouple.

3. Level Ice Results and Discussion

Observations and results from the snow–slush–snow ice transformation in level ice adjacent to the test channels are presented and discussed in the following sub-sections.

3.1. Flooding of Level Ice

Earlier studies have indicated that natural flooding does not occur if the ice does not have thermal or mechanical cracks or high porosity, even if the snow cover is thick enough to allow the water to rise at the snow/ice interface [15,16,17,30]. However, the flooding of the level ice adjacent to ship channels was influenced by both the cracks formed from the ship passages and the water pushed onto the ice during each ship passage. In the first channel (TCh01), instances of flooding were observed after the second, third, fourth, seventh, and eight BEs.
Figure 6 illustrates a set of photographs that clearly demonstrate the formation of slush on the level ice next to TCh02. For example, the first and second images show that a 9 cm snow layer transformed into a slush layer with 3 cm of slush below the water level and the snow thickness significantly decreased after the slush froze into SI. In TCh01, after the second BE, the submerged slush layer was 5 cm, and the slush formed above the water level due to capillarity was 3 cm, resulting in a total slush thickness of 8 cm. Previous laboratory studies have indicated that the capillarity is influenced by the snow permeability, crystal size, and snow density [21,31]. It was found that the capillarity increase was higher for fine pores composed of high-density snow and small round crystals [19].
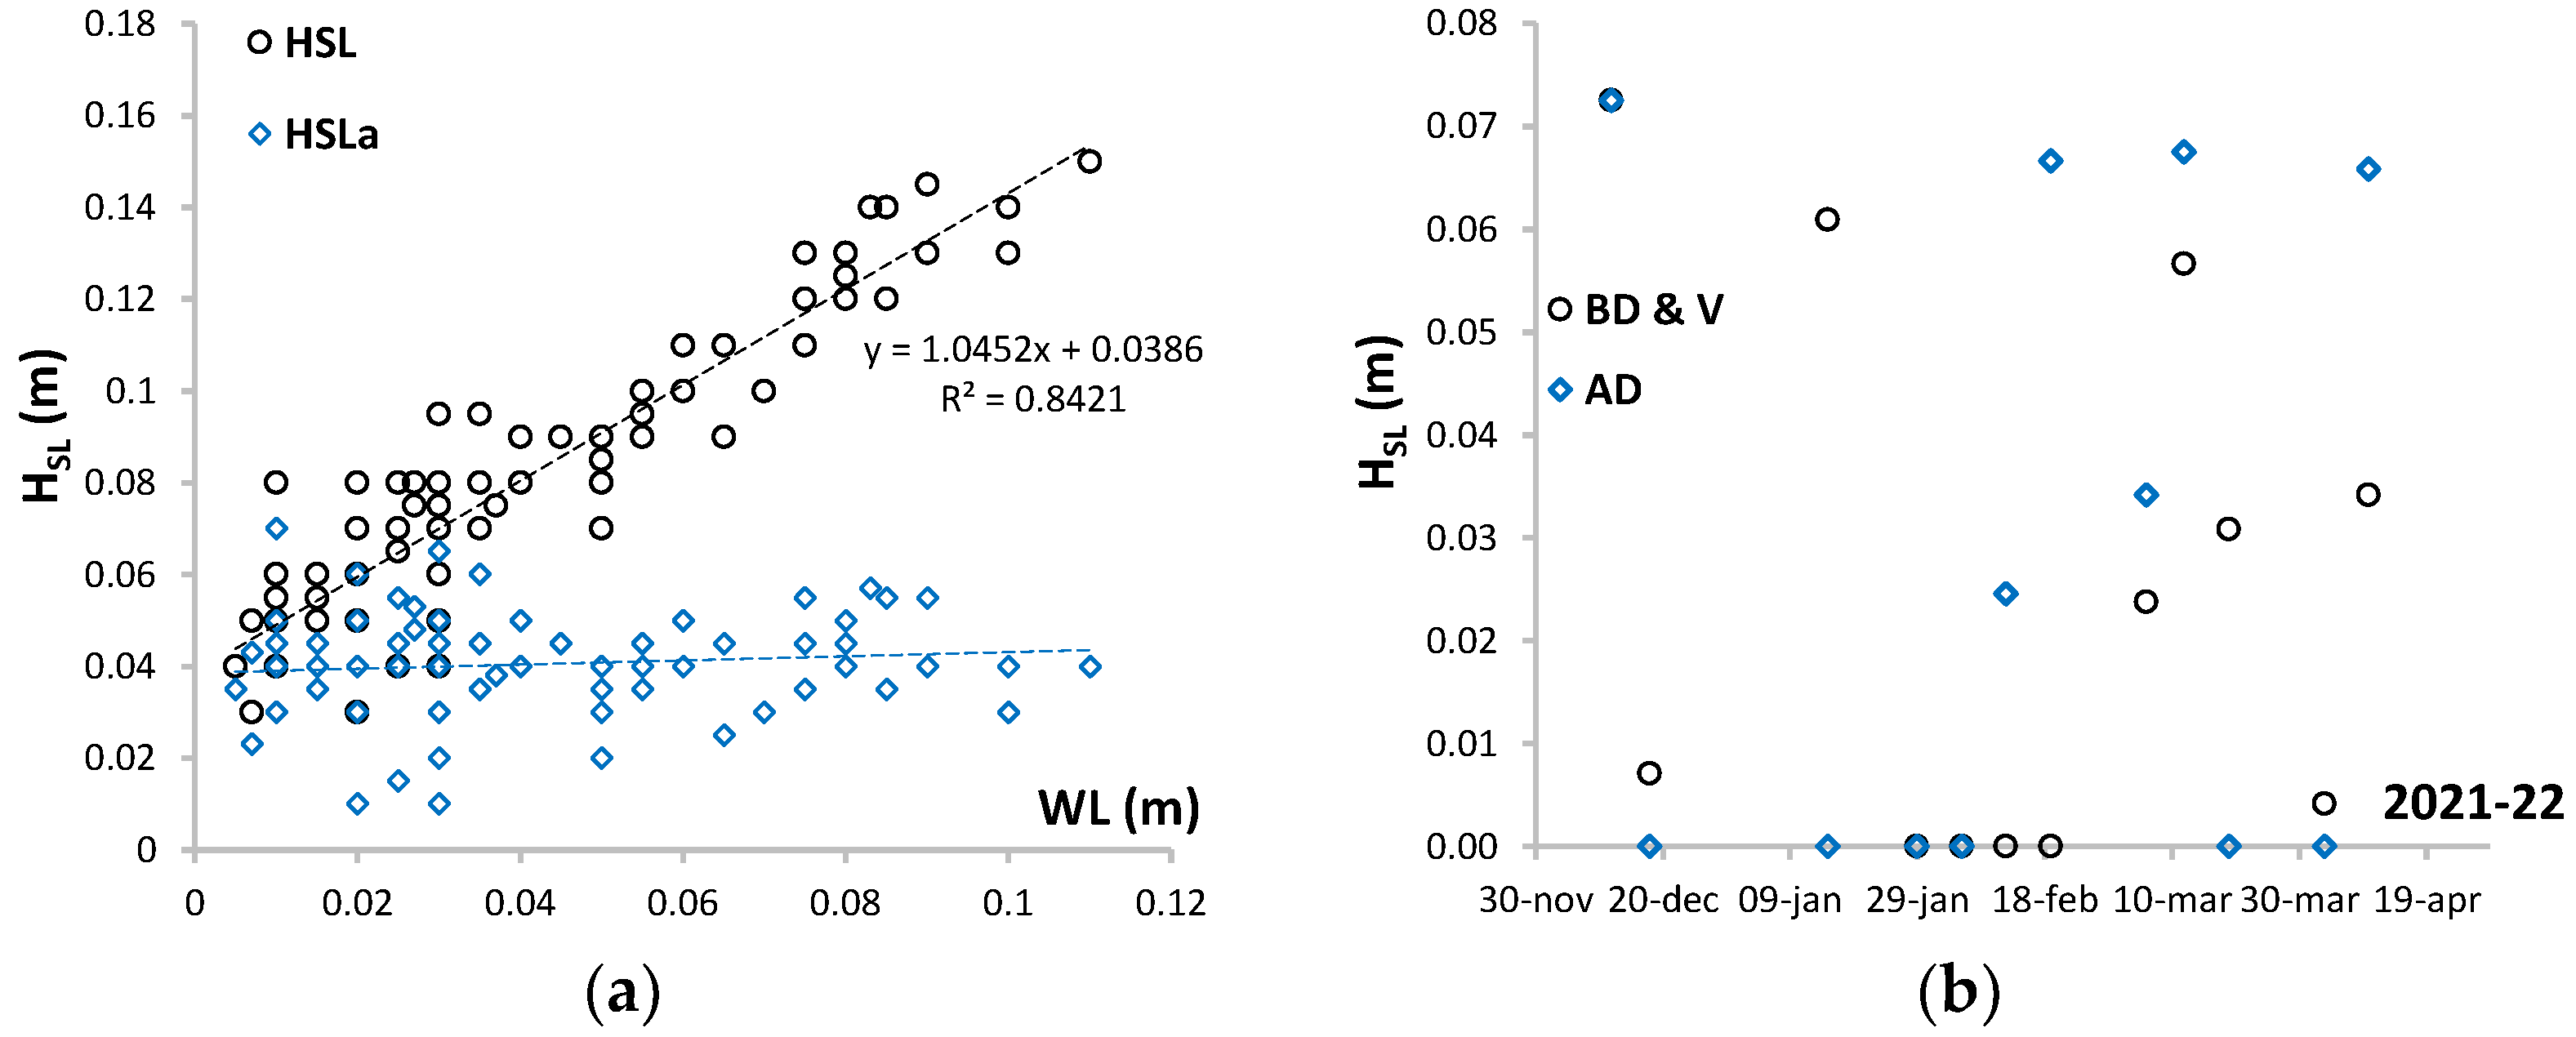
Figure 7a shows the measurements of the individual slush thicknesses on the level ice near and adjacent to both ship channels (TCh01 and TCh02). This graph aims to illustrate the potential for slush formation and the action of capillarity. The total thickness of slush (HSL) and the thickness of slush above the water level (HSLa) are plotted against the water level on top of the ice (WL), which, in this case, is positive if the ice is flooded and the freeboard (FB) or ice top is negative (underwater). The increase in HSL correlates well with the increase in WL, as shown by the linear regression function. However, there is no correlation between HSLa, formed due to capillarity, and the WL. On average, HSla was 4 cm with a standard deviation of 1.2 cm. The scatter in the data may be attributed to measurement errors, such as measuring the slush thicknesses before reaching equilibrium between WL and HSLa.
The saturation of snow above the water level differs from the submerged snow and varies depending on the height of the capillarity rise [19]. As a result, the slush below and above the water line has different physical properties. It is also anticipated that the freezing of slush above and below the water line will form snow–ice with different porosities and densities [12].
Figure 7b differentiates between the sum of the slush layer before drilling, including unfrozen slush voids measured during drilling (BD), and the total slush formed after drilling (AD). In TCh02, average slush layer thicknesses of 7 cm, 6 cm, and 6 cm were measured on the adjacent level ice after the first, fifth, and tenth BEs. These slush thickness values specifically refer to the slush layer observed on level ice before drilling or to unfrozen slush voids measured after drilling. After the eighth and ninth BEs, additional slush was formed on level ice after drilling compared to the slush naturally formed before drilling. This suggests that snow mass and ice buoyancy were not in equilibrium, even in the presence of mechanical cracks. One reason could be the rapid freezing of the cracks compared to reaching an equilibrium between the ice buoyancy and snow mass. Additionally, the speed at which flooding progresses spatially at the snow/ice interface may be another factor [20].
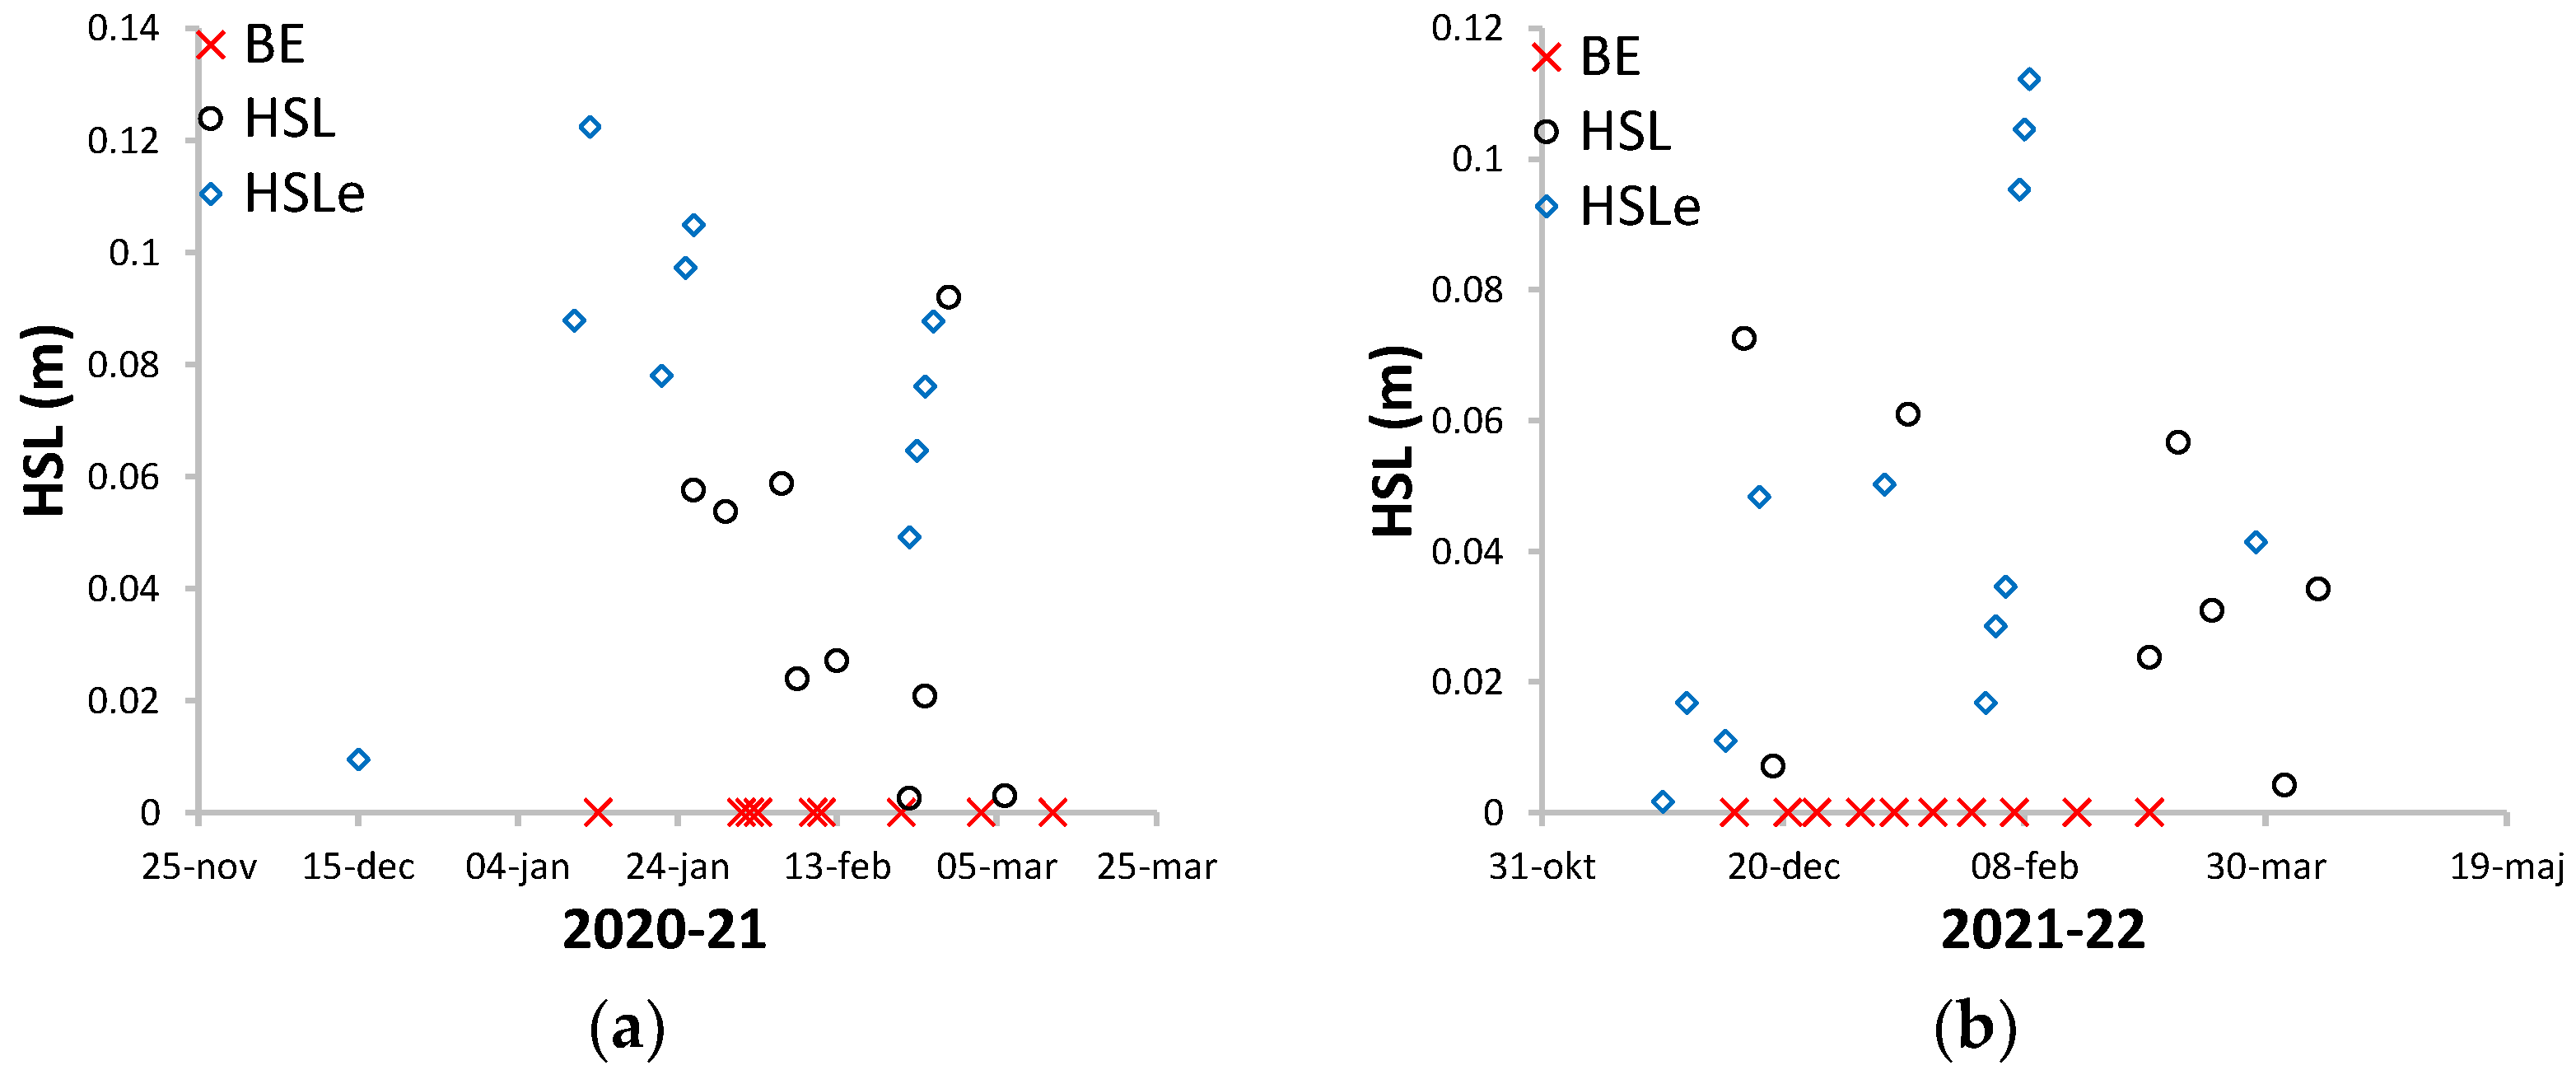
The mass balance calculations between snow mass and ice buoyancy identified four flooding occasions in the first winter, which lasted from one to several days; see Figure 8. Two of these flooding events coincided with the measured slush thickness, occurring between the first and second BEs and after the seventh BE. Slush was also measured after the fifth, sixth, and eight BE, even though flooding was not detected in the buoyancy calculations. Seven flooding instances were detected in the second winter. According to the model, the sixth flooding event following the seventh ship passage lasted for 10 days and resulted in an 11 cm-thick slush layer.

3.2. Snow–Slush–Snow Ice Transformation

The measured snow thicknesses in both winters did not comply with the land snow thickness measured by SMHI, which was assumed to represent the incoming snowfall. Figure 9 illustrates the development of the difference between the measured snow thicknesses on level ice and the land snow thickness (ΔHS = HS SMHI–HSm) over time. Several factors were observed that could contribute to this difference. Firstly, the varying wind actions on the measurement locations may lead to the redistribution of snow, causing uneven snow thickness compared to the original snowfall position [32]. However, no extreme wind actions such as dune formations were observed in this study location. Secondly, the flooding of the snow/ice interface can result in partial melting of snow due to the water temperature being slightly above the freezing point. Consequently, snowmelt and slush formation can create a snow–ice layer with a reduced thickness compared to the submerged snow thickness. Lastly, superimposed ice can form at the snow/ice interface during spring when the snow melts due to incoming radiation during the day and refreezes at night. Rain precipitation can also form superimposed ice. We observed the melting of 7 cm of snow and the formation of 3.5 cm of superimposed ice after March 20th (TCh01). Previous studies on fast sea ice in Svalbard have reported a lower superimposed ice thickness, such as 23 cm of snow transformed to 6 cm of ice [33]. In the Baltic Sea, 15 cm of snow transformed into 7 cm of ice [34]. This literature result is consistent with our observations.
During the first winter, the SI measurements were taken after snow melting had already occurred, as indicated by a decrease in ΔHS, as the snow was melting on both land and ice. Snow ice reached its maximum thickness (38 cm) on the 27th of March and thereafter started to melt. In the second winter, the ΔHS remained higher than the HSI until the melting of snow and SI began after the 3rd of April.
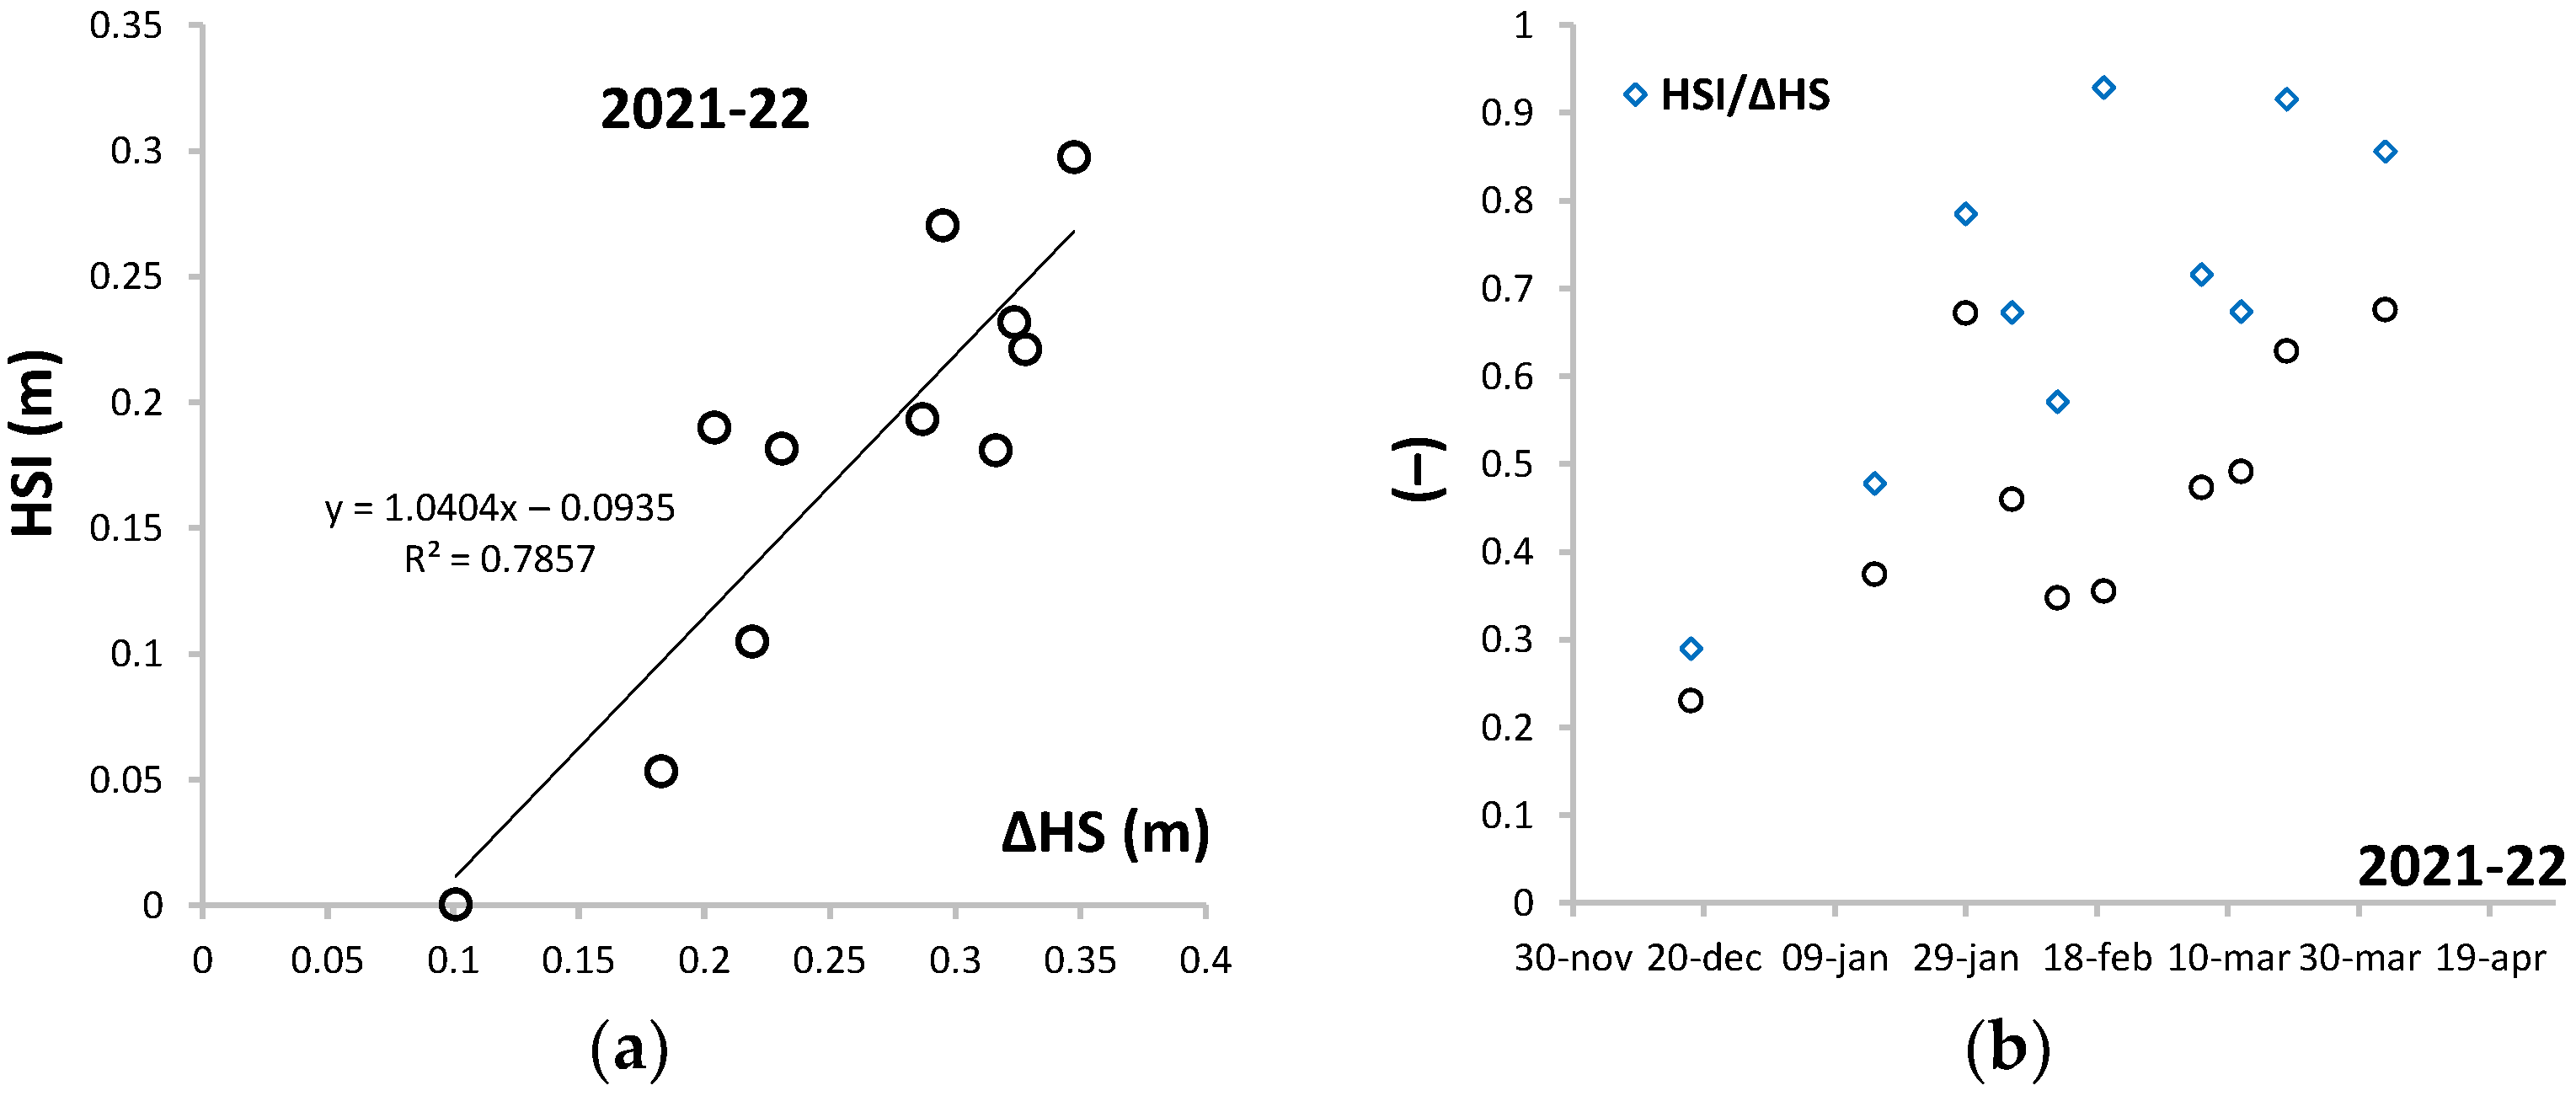
Figure 10a illustrates the relationship between the snow–ice thickness and the reduction in the snow thickness (ΔHS). The slope of regression line, 0.09, indicates that from the total snow thickness reduction, about 9 cm of snow did not transform into snow–ice. Figure 10b shows that on average, 70% of ΔHS and 50% of the incoming snowfall transformed into snow–ice. The remaining part of snow either melted when submerged or was blown away by the wind. However, these processes were not investigated in this study. A previous study on snow–ice formation on lake ice reported similar results [24], whereas another study on lake ice showed that a third of the initial snow layer transformed into snow–ice [23].
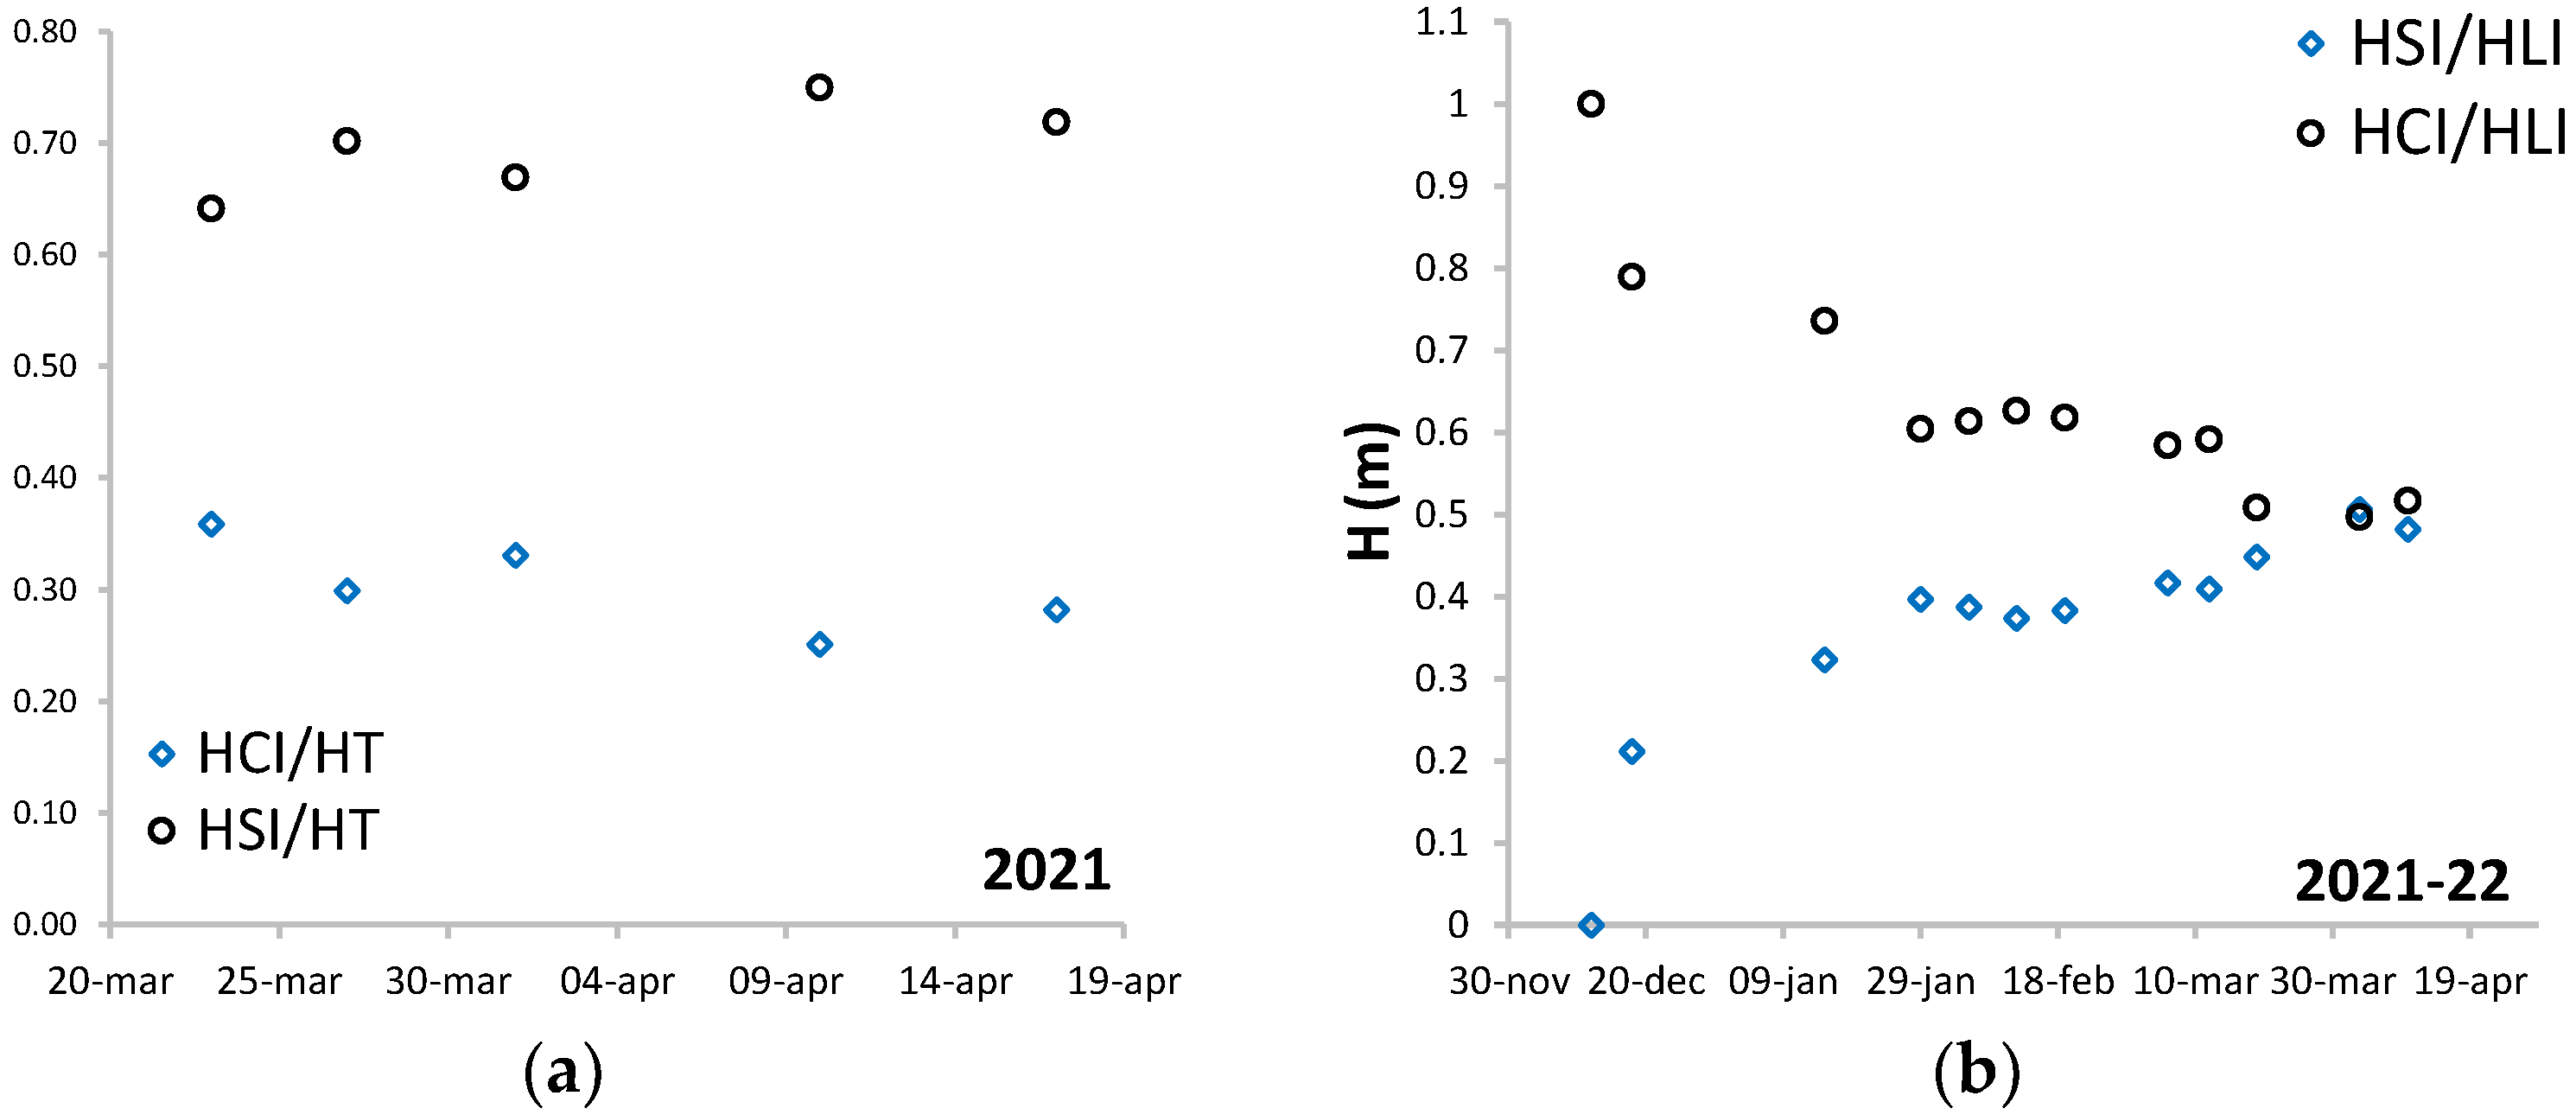
In the first winter, the measured thickness of SI was twice the CI, with a maximum measured thicknesses of 38 and 19 cm, respectively. The SI fraction ranged from 64 to 75% of the total level ice thickness on 10 April 2021, as shown in Figure 11a. In the second winter, the SI fraction reached 50% of the total level ice thickness on April 3rd, as shown in Figure 11b. Previous studies on snow ice formation in lakes in Finland have reported SI content ranging between 10 and 43% during the winters of 1993–1999 [23], and between 30 and 50% in the winters of 2009–2012 [16].

4. Brash Ice Results and Discussion

In this section, we present and analyze a series of photographs that exemplify the snow’s influence on the formation of the brash ice channel. Furthermore, we examine the snow ice content, the brash ice growth history, and physical and mechanical properties associated with it.

4.1. Snow–Slush–Snow Ice Transformation

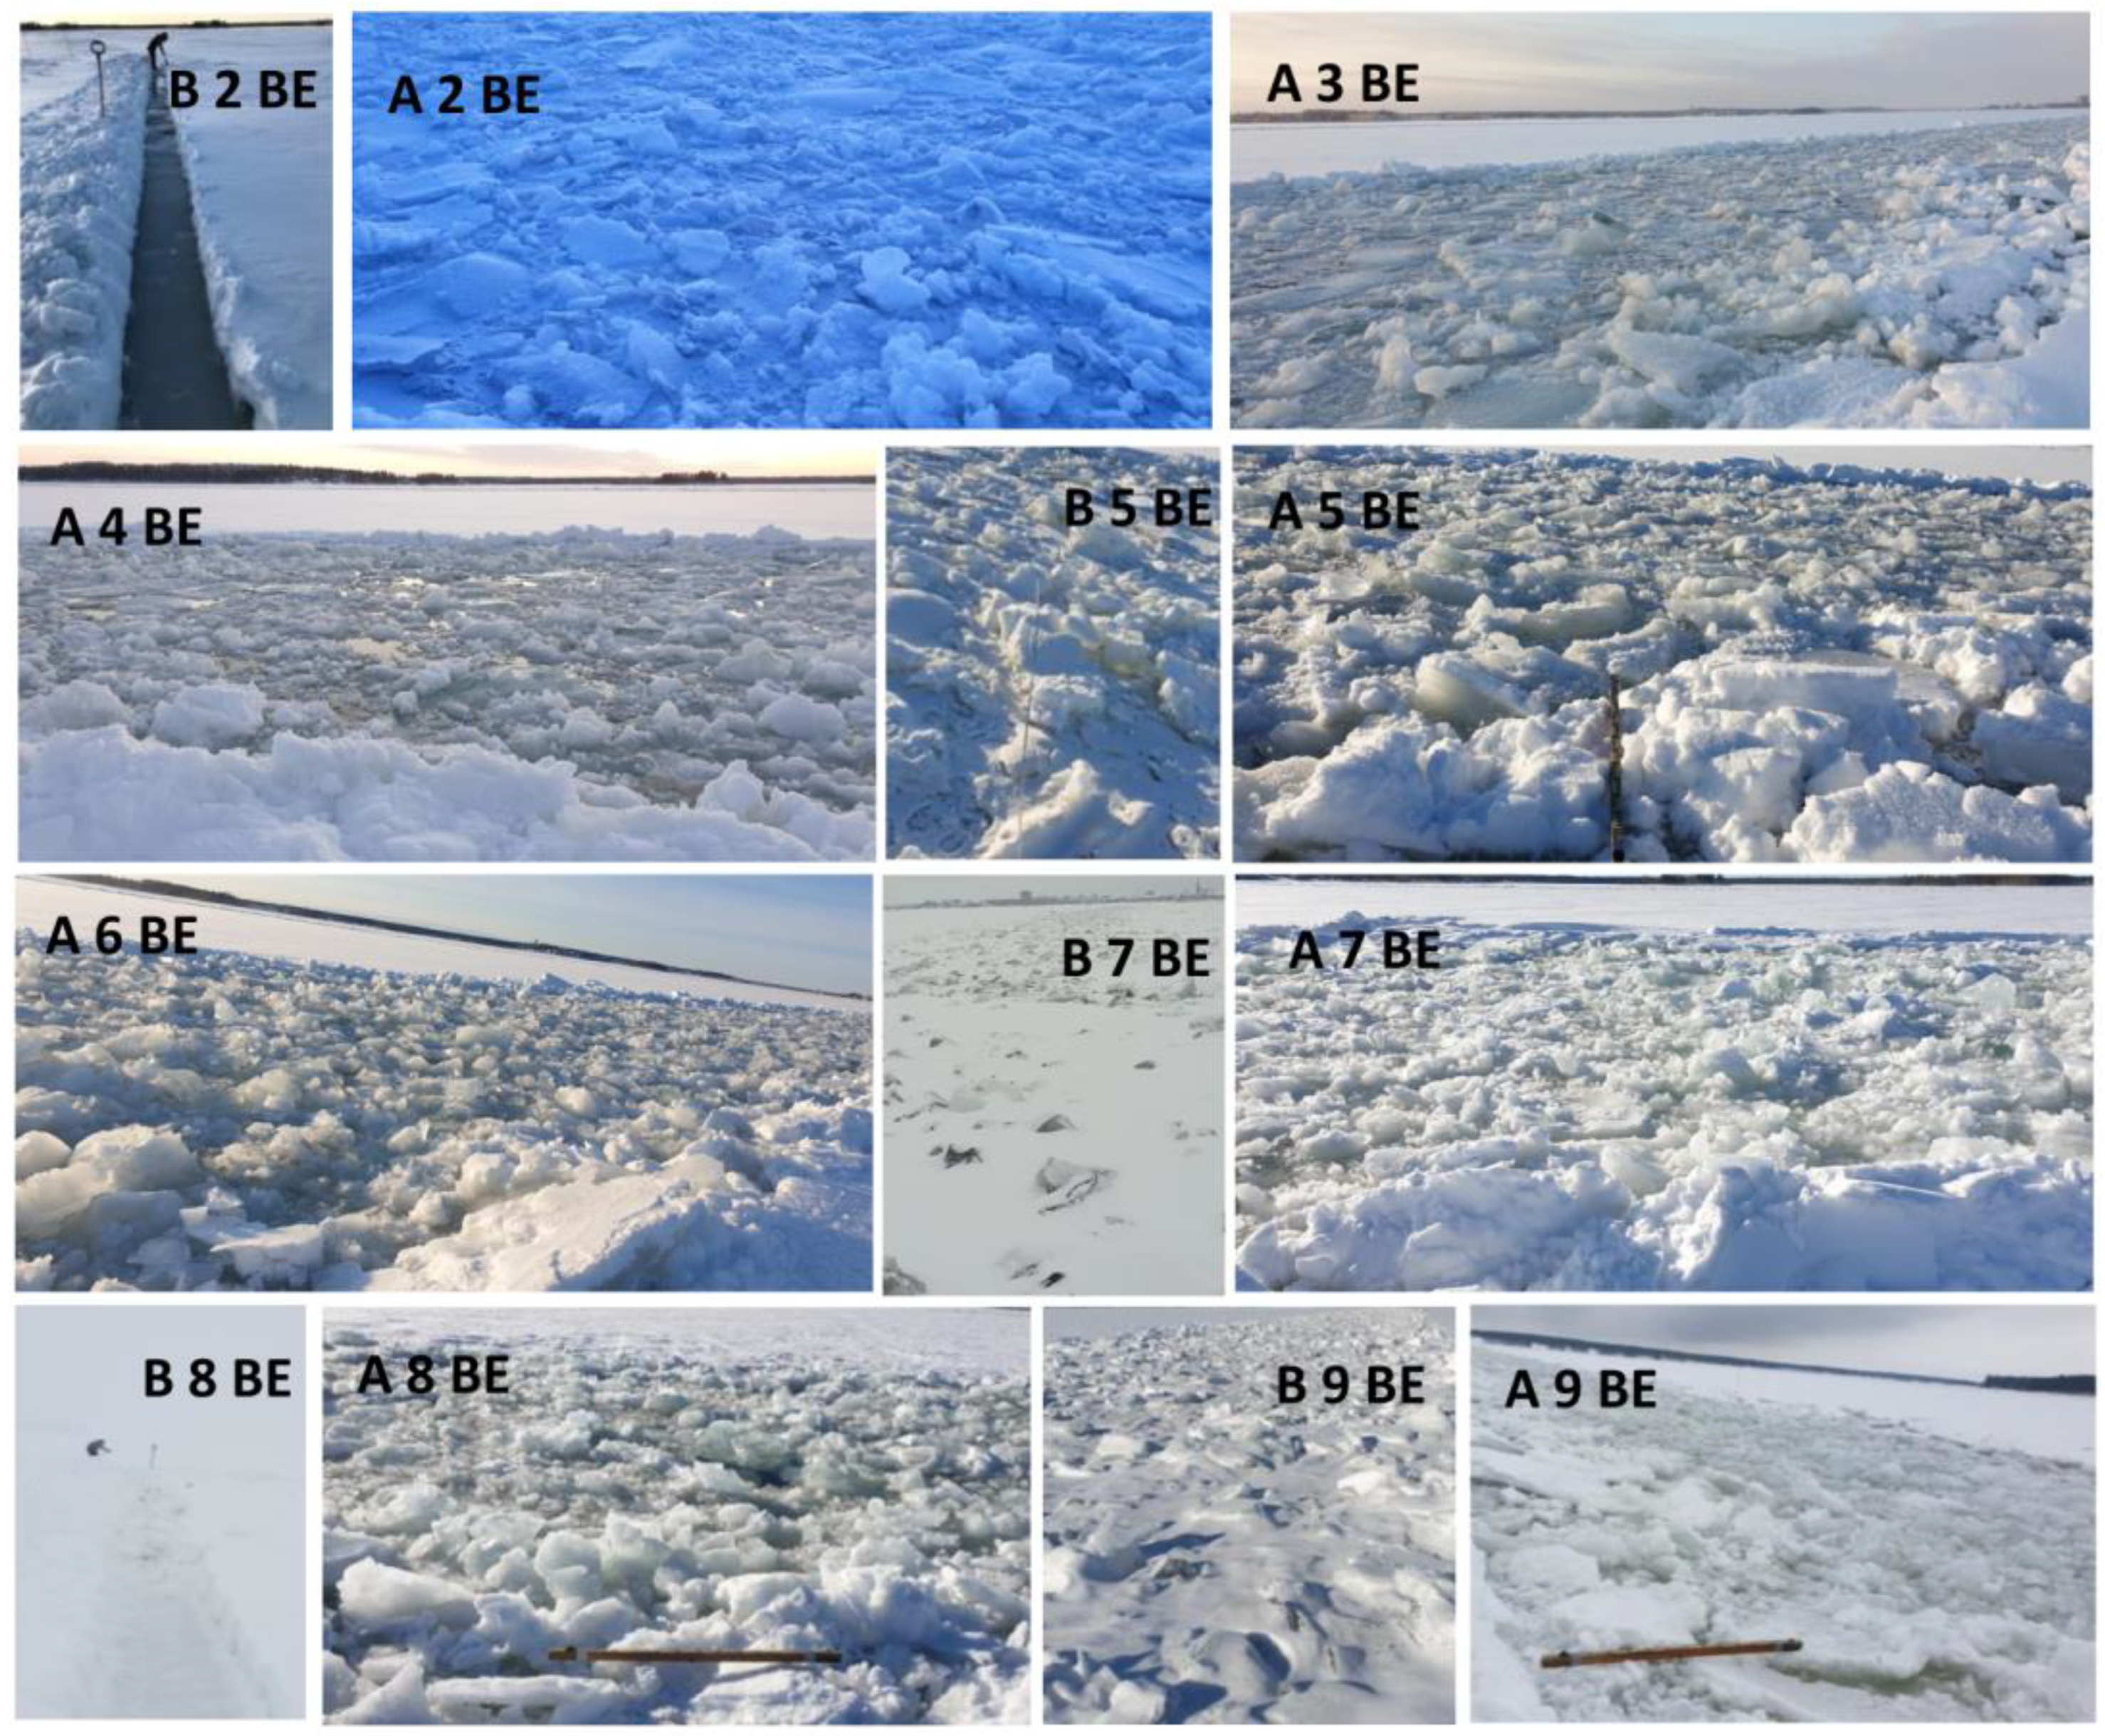
A series of photographs from TCh02 are used to illustrate and discuss the development and transition in the test channels throughout an increasing number of breaking events, as shown in Figure 12. Various snow-related phenomena were observed, including snow accumulation between ship passages, snow submergence between ice pieces, and snow compression at the edges of the channel. The average snow thickness on the cross-section of the channel (HS BI), excluding the snow accumulated on the side ridges, the snow accumulated on level ice in the vicinity of the test channel (HS LIv), and the average snow thickness on the adjacent level ice (HS LIa), were measured from one to several days before any breaking event. The results of these measurements are summarized in Table 2.
In the first channel (TCh01), the average thickness of snow submerged in the channel during any breaking event varied from 1 to 29 cm. Despite receiving a significant amount of snowfall after the seventh BE, as much as 29 cm, the surface of the channel after the eighth BE was filled with both slush and open water pools. During the eighth ship passage, the slush appeared to be in a lower content compared to the slush observed after the seventh or ninth BEs. This reduction in the slush content was likely due to melting caused by air temperatures above 0 °C.
In TCh02, the first breaking event occurred on the 10th of December. After the ship’s passage, the channel was predominantly filled with slush and water and the broken ice pieces were not visible on the surface of the channel, as shown in Figure 12. The channel was snow covered before the third, fifth, eighth, ninth, and tenth BEs. After the eighth BE, there was a significant accumulation of snow that acted as insulation and slowed the freezing of the channel, despite low air temperatures.

4.2. Snow-Ice in the Ship Channels

A series of photographs captured from the surface and underwater in the ship channels after different breaking events are illustrated in Figure 13 and Figure 14. These images demonstrate that the brash ice pieces within the channel and along its edges consisted of both congelation ice and snow ice. Additionally, the images reveal submerged slush and snow clusters that were partly submerged and partly above the water line. This indicates the role of snow in the ice formation, as it transforms into slush and subsequently freezes to snow–ice. Similar types of snow–ice clusters were previously observed in a brash ice channel with similar characteristics and specifications [35]. The SI pieces merged into a cohesive layer of brash ice as water froze in between. For distances of several centimeters between the brash ice pieces the ice grew in a lateral direction, see Figure 13c. This lateral growth is likely initially driven by the internal heat stored within the ice pieces, as previously hypothesized for the pressure ridge consolidation [36,37]. The earlier models of brash ice growth neglected this lateral growth [9,38,39].
Figure 14 displays a series of underwater photographs captured on the edge of TCh01. The figures show that instantly after the submergence, the original ice blocks can consist of CI and SI. However, as CI grows around the original ice blocks, it becomes challenging to discern the interface between SI and CI from underwater images. Clusters of submerged snow ice frozen together with CI are evident in Figure 14a,c. Figure 14a illustrates ice crystal clusters in the form of slush, which were also previously observed and reported by [35]. Snow ice originating from submerged level ice is given in Figure 14b,d.

4.3. The History of Brash Ice Formation

The microstructure of ice depends on the ice development process and can indicate different formation phenomena. In the current section, the brash ice microstructure is analyzed and the history of the brash ice formation is discussed.

4.3.1. Ship Channel (TCh01)

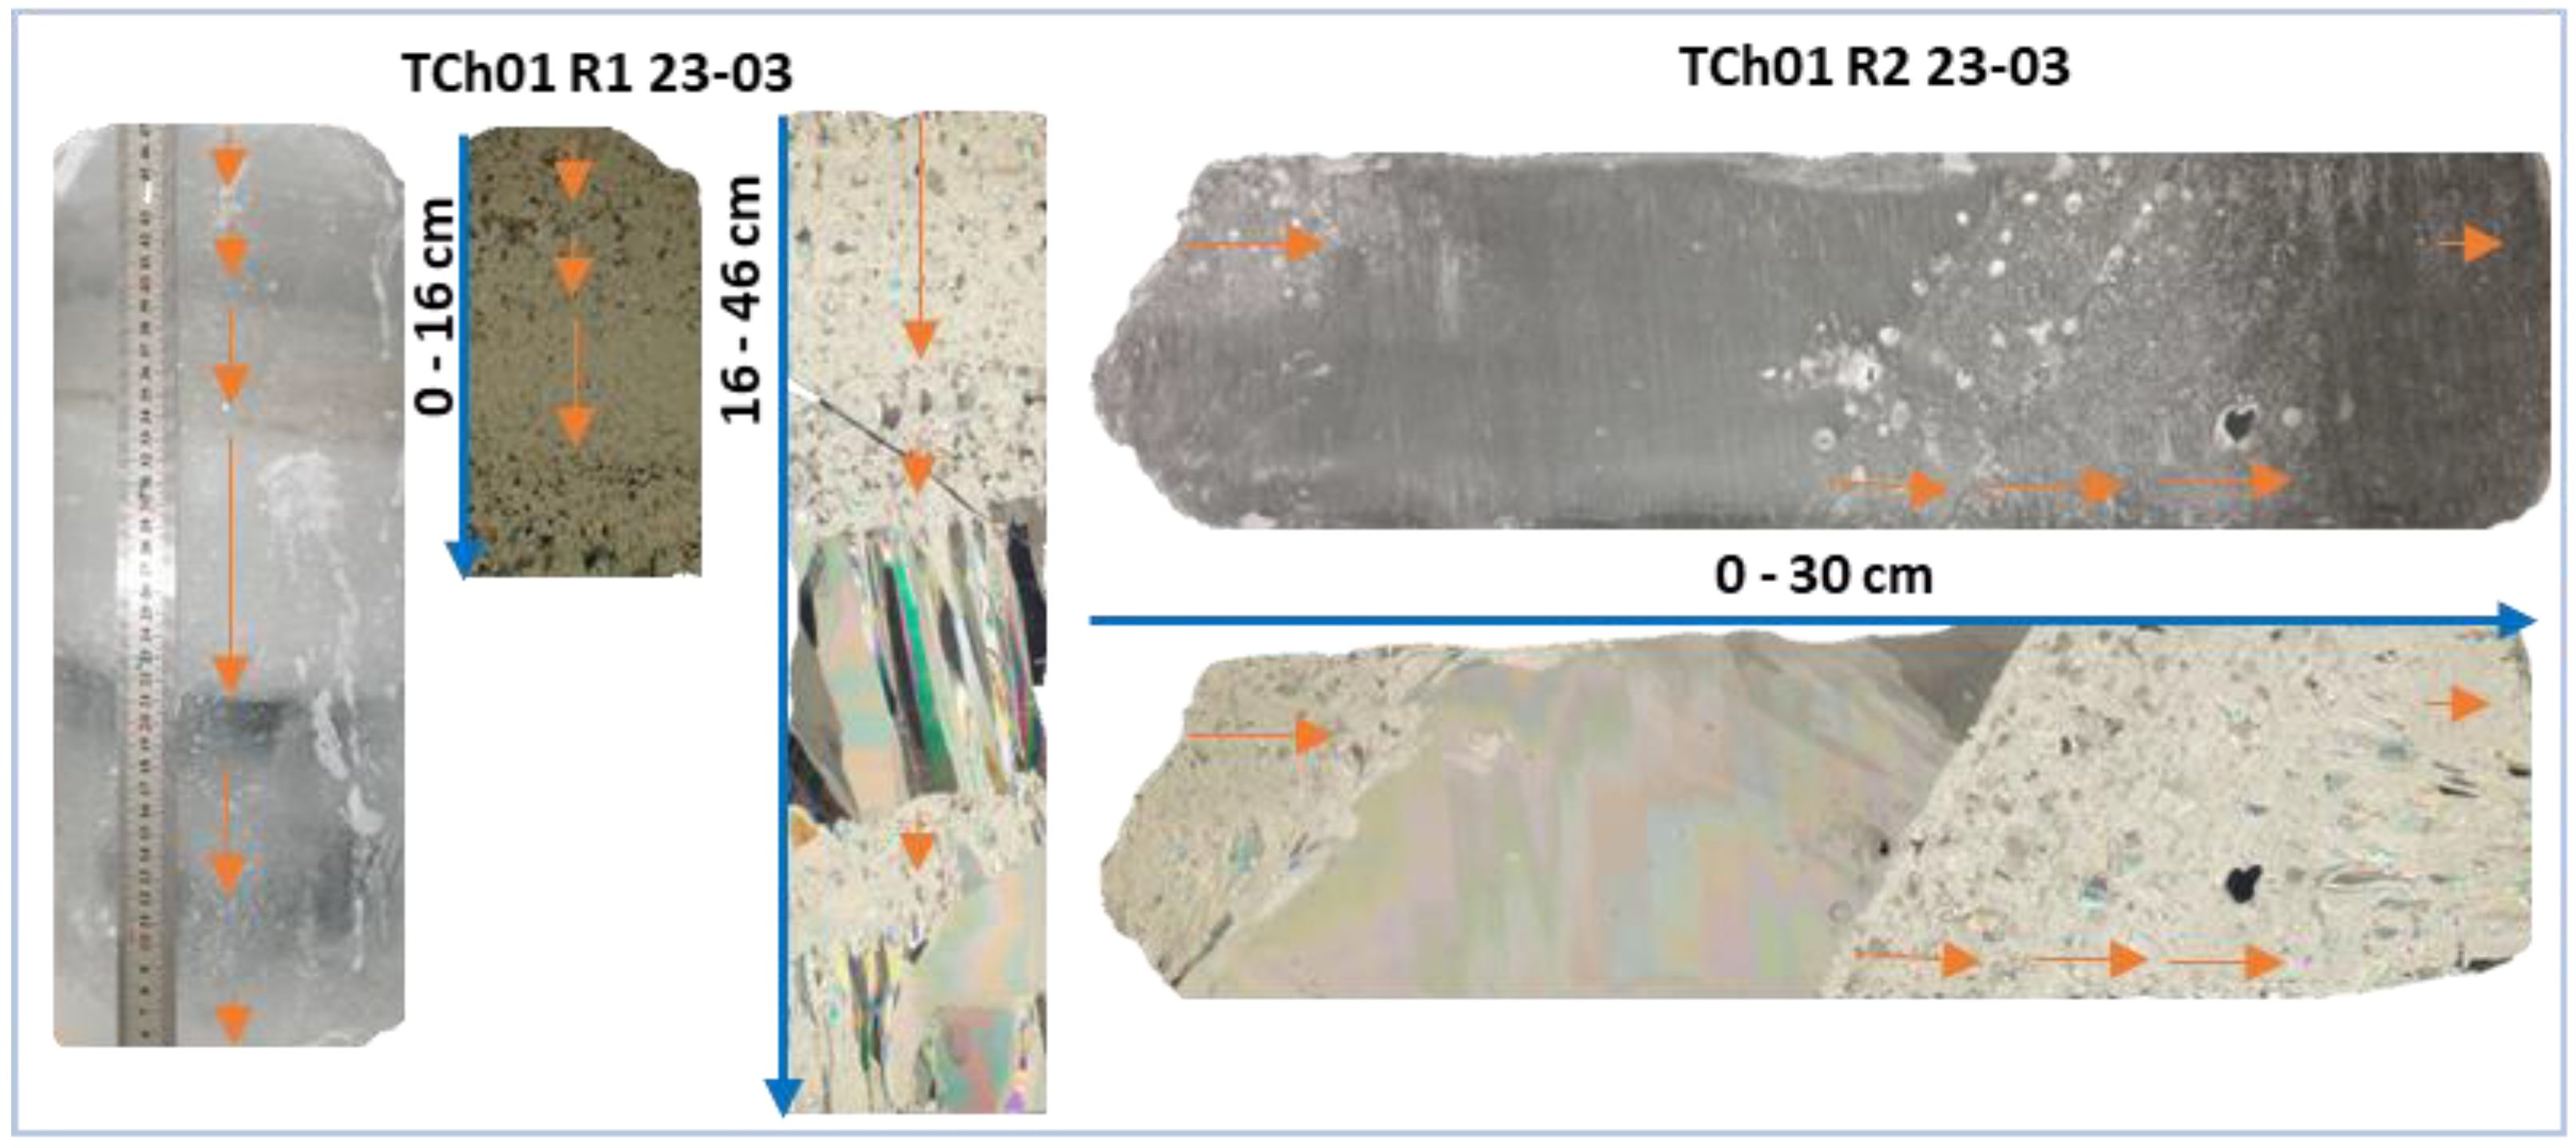
Figure 15 presents the microstructure of two cores sampled from the side ridge of the first channel (TCh01) denoted as R1 and R2. The top of the first core consists of approximately 26 cm of snow−ice. The snow−ice having different layers distinguished by the transitional zones may indicate various stages of snow−ice formation. The SI on the CI of the first core may have been formed during four separate flooding occasions, as indicated by the buoyancy estimations detecting four flooding occasions. In addition, two SI clusters were mixed with CI. In Figure 15, the SI layers or clusters are highlighted with orange arrows, and the spaces between them represent either a transition zone or thicker layers of CI. The second core initially consisted of SI, followed by CI with horizontal growth directions, which is common growth pattern observed in lake ice [40]. Similar big columnar crystals were earlier observed in a similar brash ice channel type and may be attributed to a slow growth rate [35].
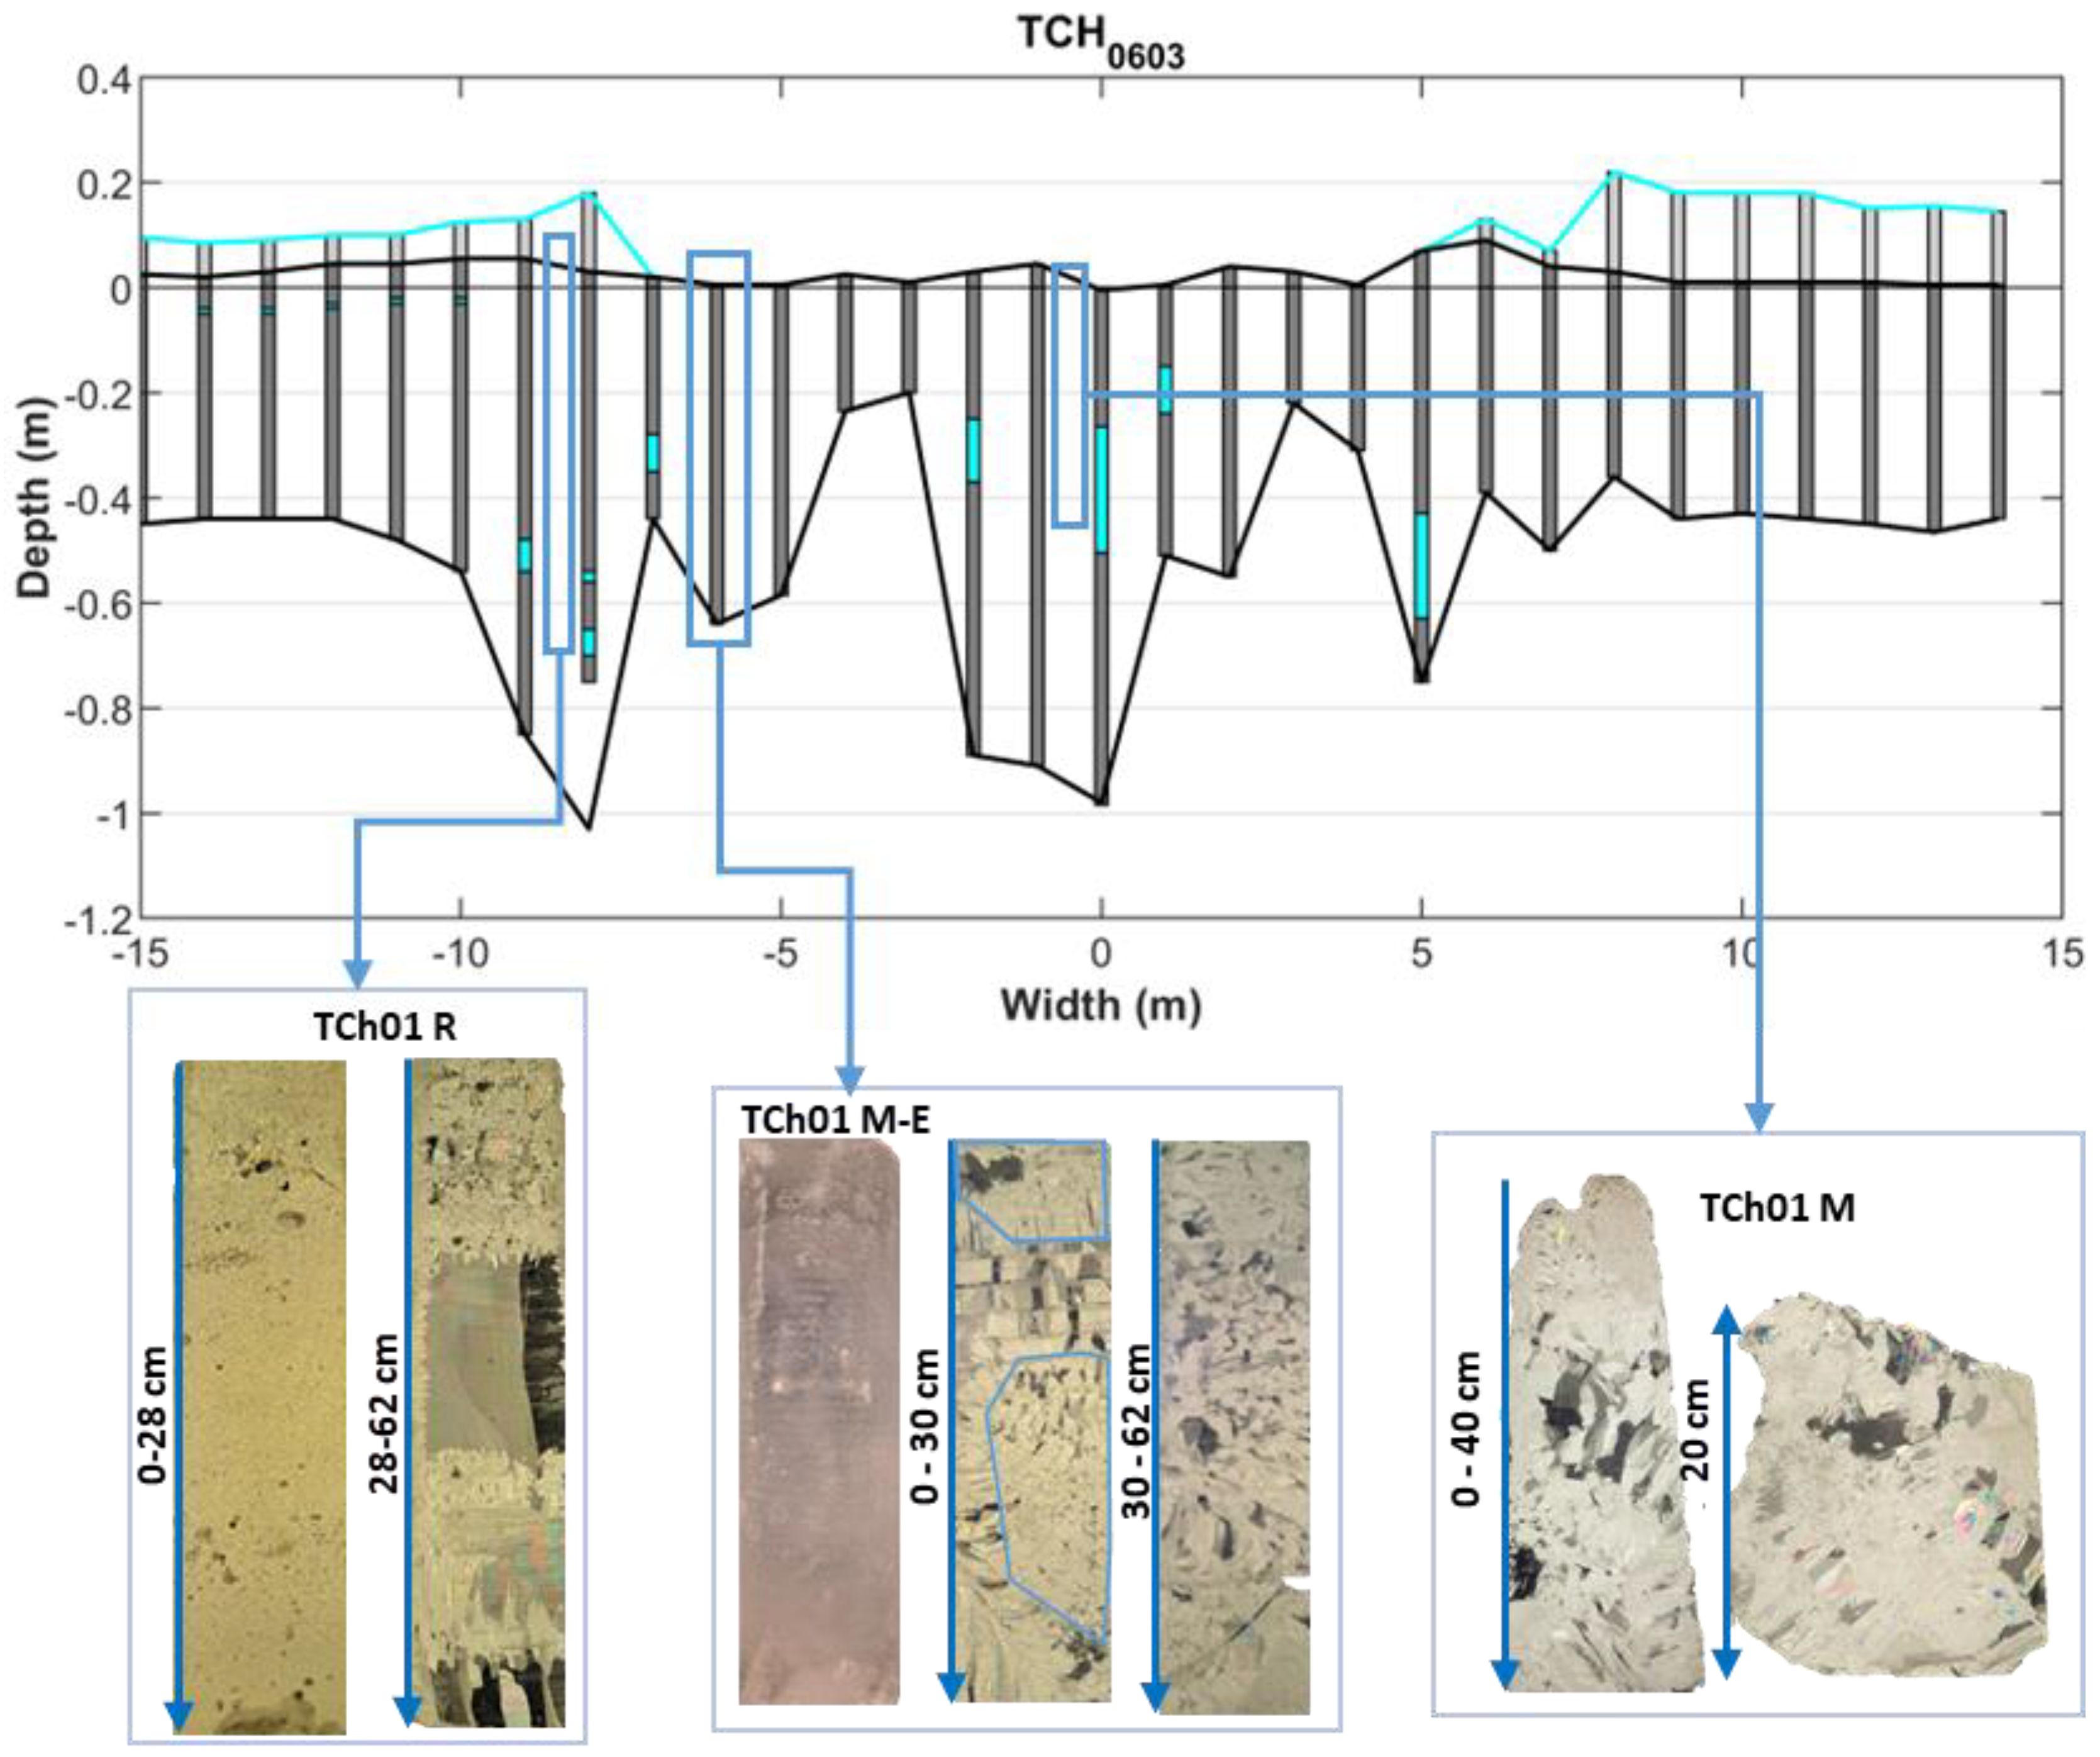
Figure 16 shows the cross-section profile of TCh01 on 6 March 2021, along with the microstructure of three ice cores sampled on the same day. TCh01 (R) was sampled at the side ridge, TCh01 (M−E) was sampled between the mid-channel and the edge, and TCh01 (M) was sampled from the middle of the brash ice channel. Both brash ice cores, measuring 40 cm and 62 cm in thickness, consisted of SI clusters mixed with congelation ice. The random orientations and varying crystal sizes of CI were a result of the frequent freezing and breaking processes. An attempt was made to identify the boundaries between different merged brash ice pieces in the first 30 cm of the middle−edge core by considering the direction of the crystal growth. The presumed boundaries are shown with solid blue lines. However, it is harder to analyze and define the boundaries between ice pieces from the second brash ice core, as the CI fraction is higher, with inconsistent growth directions, which ultimately indicates the presence of small brash ice pieces that have been frozen together. Previous studies on other deformed ice structures have also observed and reported similar mixed granular and columnar crystalline structures [8,29,41,42].

4.3.2. Main Channel (MCh2021)

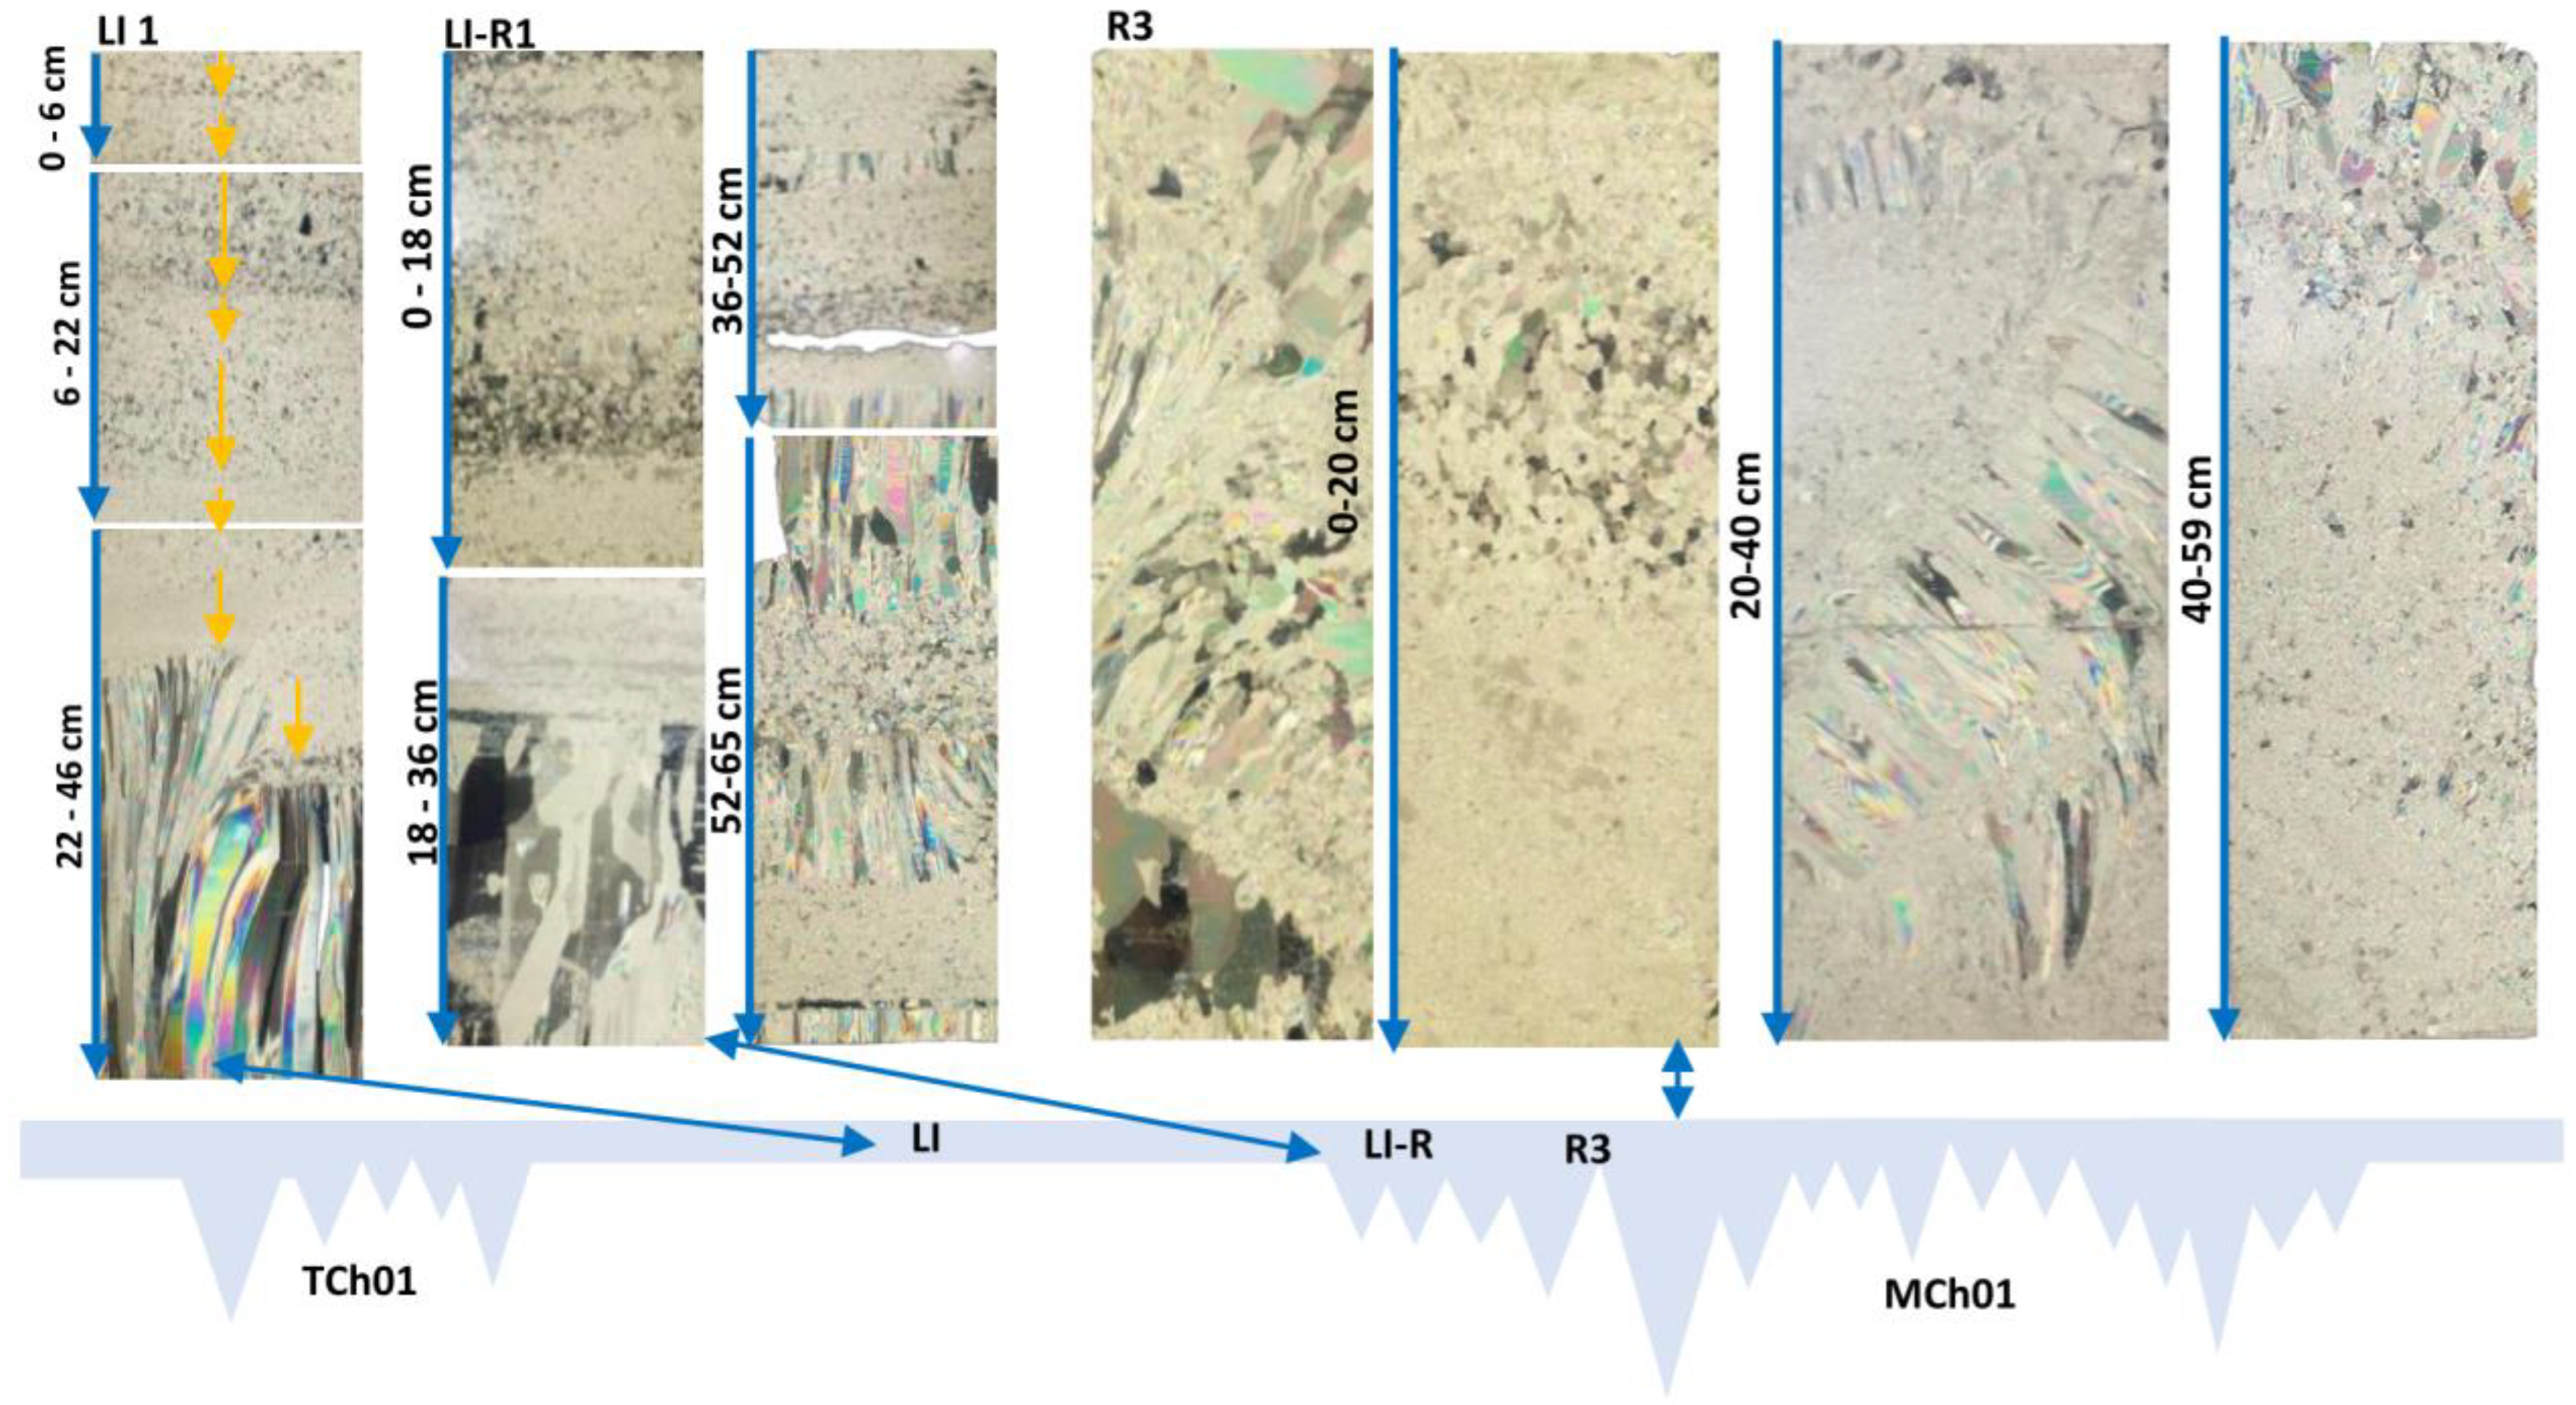
Nine cores were sampled on 7 March 2021: three cores in the level ice (LI) between the test and main channels, three cores at the very beginning of the ridge (LI-R), and three additional cores at the side ridges (R). The distance between LI-R and R was 8 m. The sampling positions and the microstructure of one core from each position are illustrated in Figure 17.
The level ice cores sampled between the two channels consisted of CI with vertically elongated crystals, similar to freshwater ice seeded by granular ice [43]. A thick layer of SI had formed due to extensive flooding, made possible by mechanical cracks formed at each ship passage in both channels. Eight different SI layers were identified, suggesting eight flooding incidents during the winter season. The orange arrows in the level ice microstructure distinguish the different SI layers, see Figure 17. However, the presence of eight layers may also indicate four flooding scenarios. This hypothesis is supported by the capillarity rise above slush after each flooding event, resulting in two SI layers from one flooding [12,19]. This can be explained by considering that the slush below and above the water line have different porosities and ice crystal concentrations, leading to distinguishable microstructures and SI characteristics. A detailed laboratory study is required to fully understood this process. The mass balance calculations of snow load and ice buoyancy identified four possible flooding events.
The ice core sampled at the beginning of the ridge (LI R1) consisted of a layered structure of SI and CI. Surprisingly, the submerged SI layers were homogenous, but at different depths. Approximately 23 cm of SI had formed on top of CI, originating from surface flooding. The subsequent 32 cm of CI has formed from bottom growth. This two-layered structure is believed to be the original level ice. However, beneath this formation, there was likely a brash ice piece consisting of 4 cm of SI, followed by 1 cm of CI, 6 cm of SI, and a macropore of 1 cm. This pore suggests the presence of a new ice block that had been displaced by the ship passages and consolidated beneath the level ice.
This ice block consisted of about 7 cm of CI, followed by 2 cm of SI, 5 cm of CI, 2 cm of SI, and, finally, 1 cm of CI. This structure suggests the freezing of two ice pieces, originating from the same parental level ice. Once the ice pieces merged, the bottom of the ice grew by 1 cm. Considering the presence of a macropore between the LI and the ice piece beneath it, the bottom ice growth was probably driven by the heat stored in ice at the time of submergence. Thus, in this sampling position, the vicinity of the side ridge had three layers of consolidated broken ice.
The microstructure of R3, sampled from the ridge of the main channel, does not represent the entire thickness of the ridge but only the top part that could be cored. This core consisted mainly of a mixed microstructure of granular and columnar ice. The lateral growth of CI observed from 0 to 40 cm illustrates the consolidation of brash ice pieces. Additionally, two different thin sections of the first 20 cm show the horizontal variations in the microstructure of the ridge.

4.4. Brash Ice Physical and Mechanical Properties

The snow ice content, uniaxial compressive strength, microporosity, and density results are discussed in the following subsections.

4.4.1. Test and Main Channels (2021)

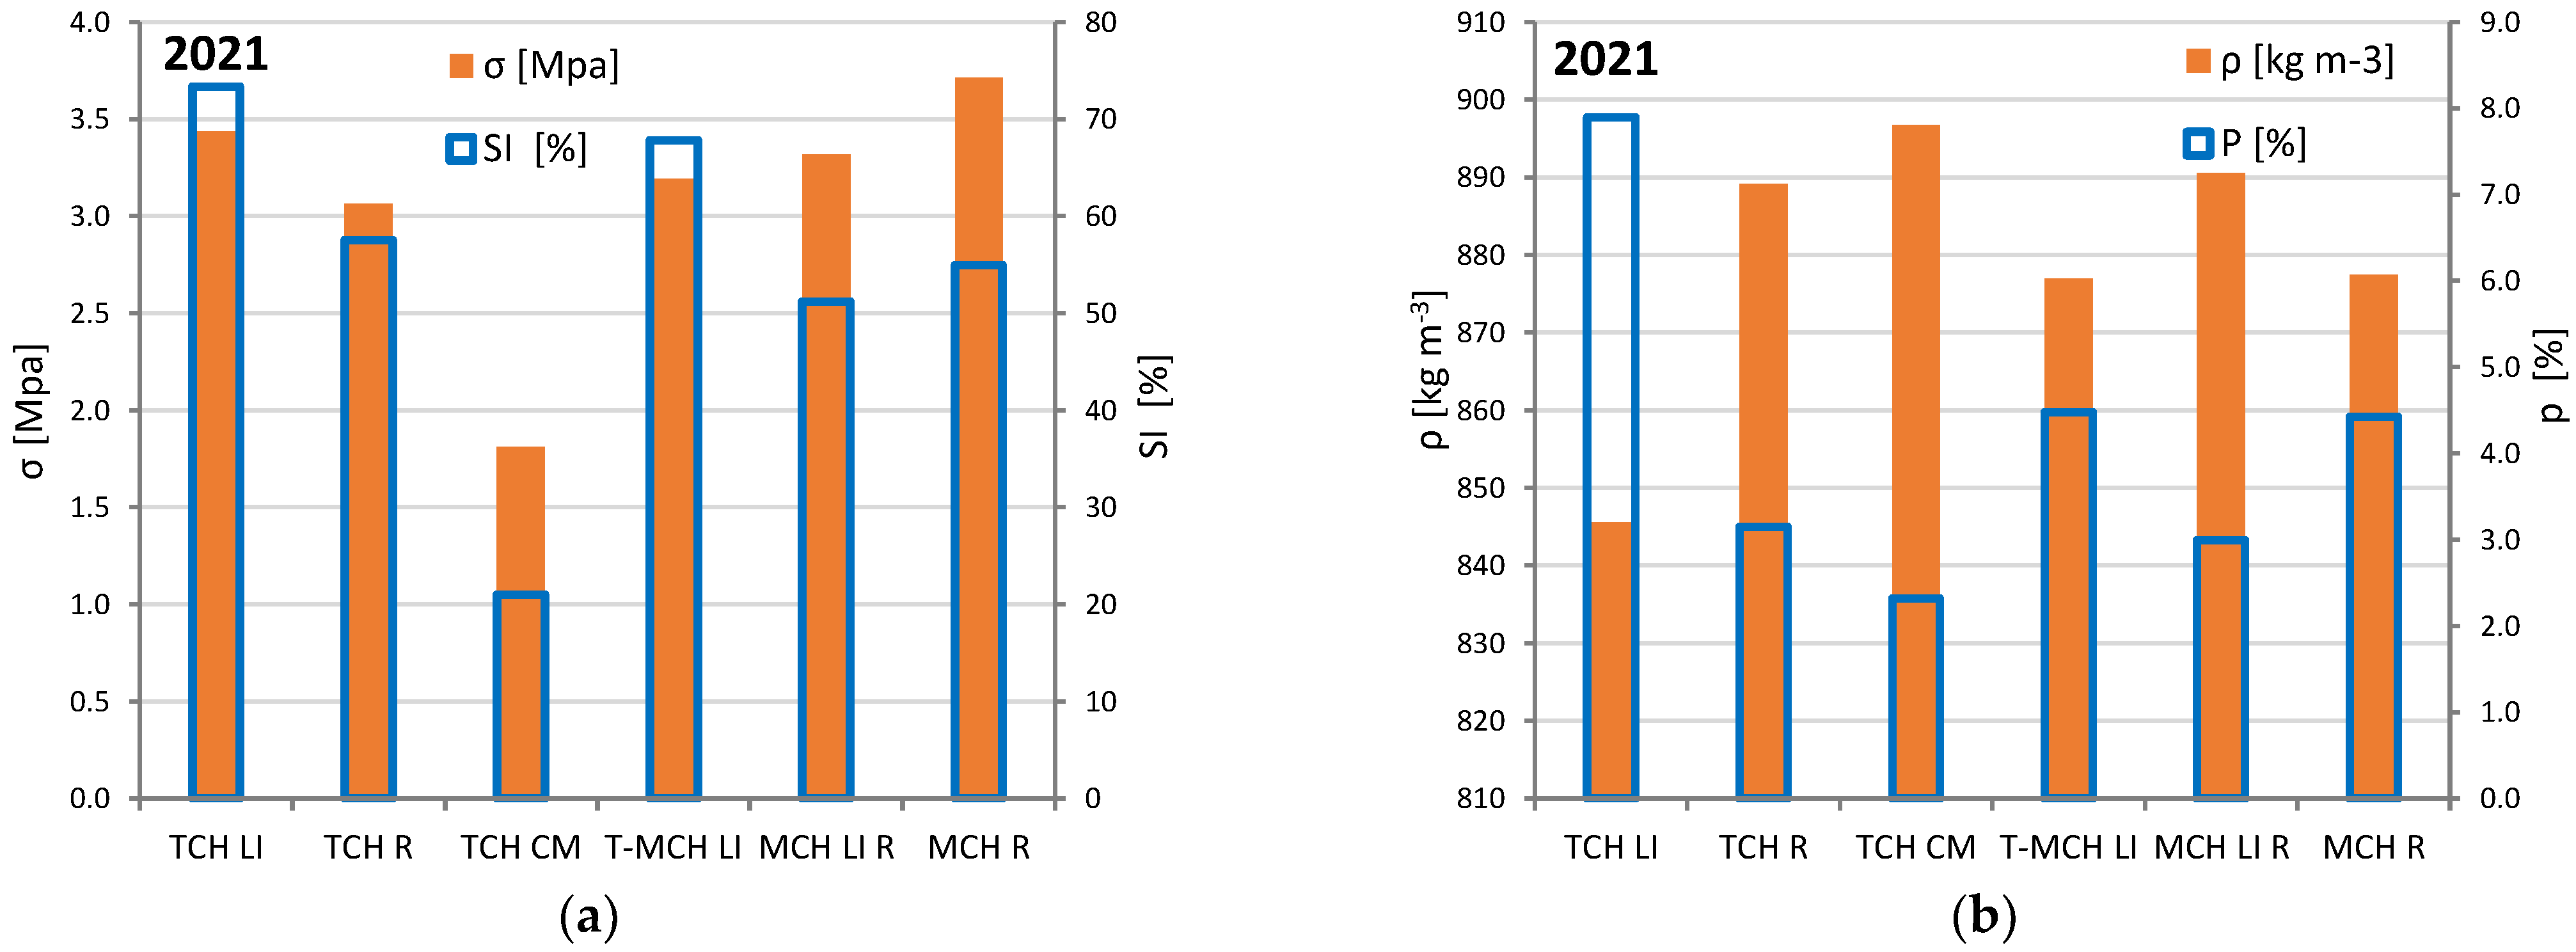
Level ice in the vicinity of TCh01 had the highest SI content, equal to 73%. This core had an average microporosity of 8% and a density of 846 kg m−3; see Figure 18. The lowest SI content of approximately 21% was found in the channel’s middle, accompanied by a density of 897 kg m−3 and a porosity of 2.3%. It is likely that a part of the submerged snow melted or displaced sideways, resulting in lower SI content in the channel compared to the ridge and the adjacent level ice.
The SI fraction in the ridges consists of both snow ice clusters formed in the channel and displaced under the level ice, as well as SI formed on the surface from flooding. However, the proportion of SI was lower in the ridge compared to the adjacent level ice, with values of 58% for the TCh and 53% for MCh. This difference in SI content between the ridges and level ice may be attributed to snow melting in the side ridges due to water being pushed sideways during each ship passage.
During the compressive tests, the temperature of the ice cylinders varied from −5 to −12 °C, with an average value of −8 °C. The brash ice samples taken from the middle of TCh01 displayed the lowest strength (1.8 MPa), whereas the ridge samples from the main channel exhibited the highest strength. This can be attributed to the continuous breaking of brash ice, resulting in weaker freezing bonds between brash pieces compared to ridge structures. The ridge structures, being less affected by breaking, are exposed to a longer freezing period, thus resulting in stronger bonds. It has been previously observed that the bonding between two ice pieces depends on factors such as the freezing time, thickness, shape, temperature of the ice blocks, and surrounding medium [44,45,46,47].
On average, the compressive strength in the horizontal direction for level ice and ridges varied from 3 to 4 MPa for a strain rate of 10−3 s−1, see Figure 18. All the ice samples exhibited brittle behavior. A previous study showed that deformed ice with a mixed microstructure, loaded horizontal has higher strength compared to pure columnar or granular ice [29]. This finding may also explain the difference in strength between samples of brash ice and ridge samples.

4.4.2. Main Channels 2023

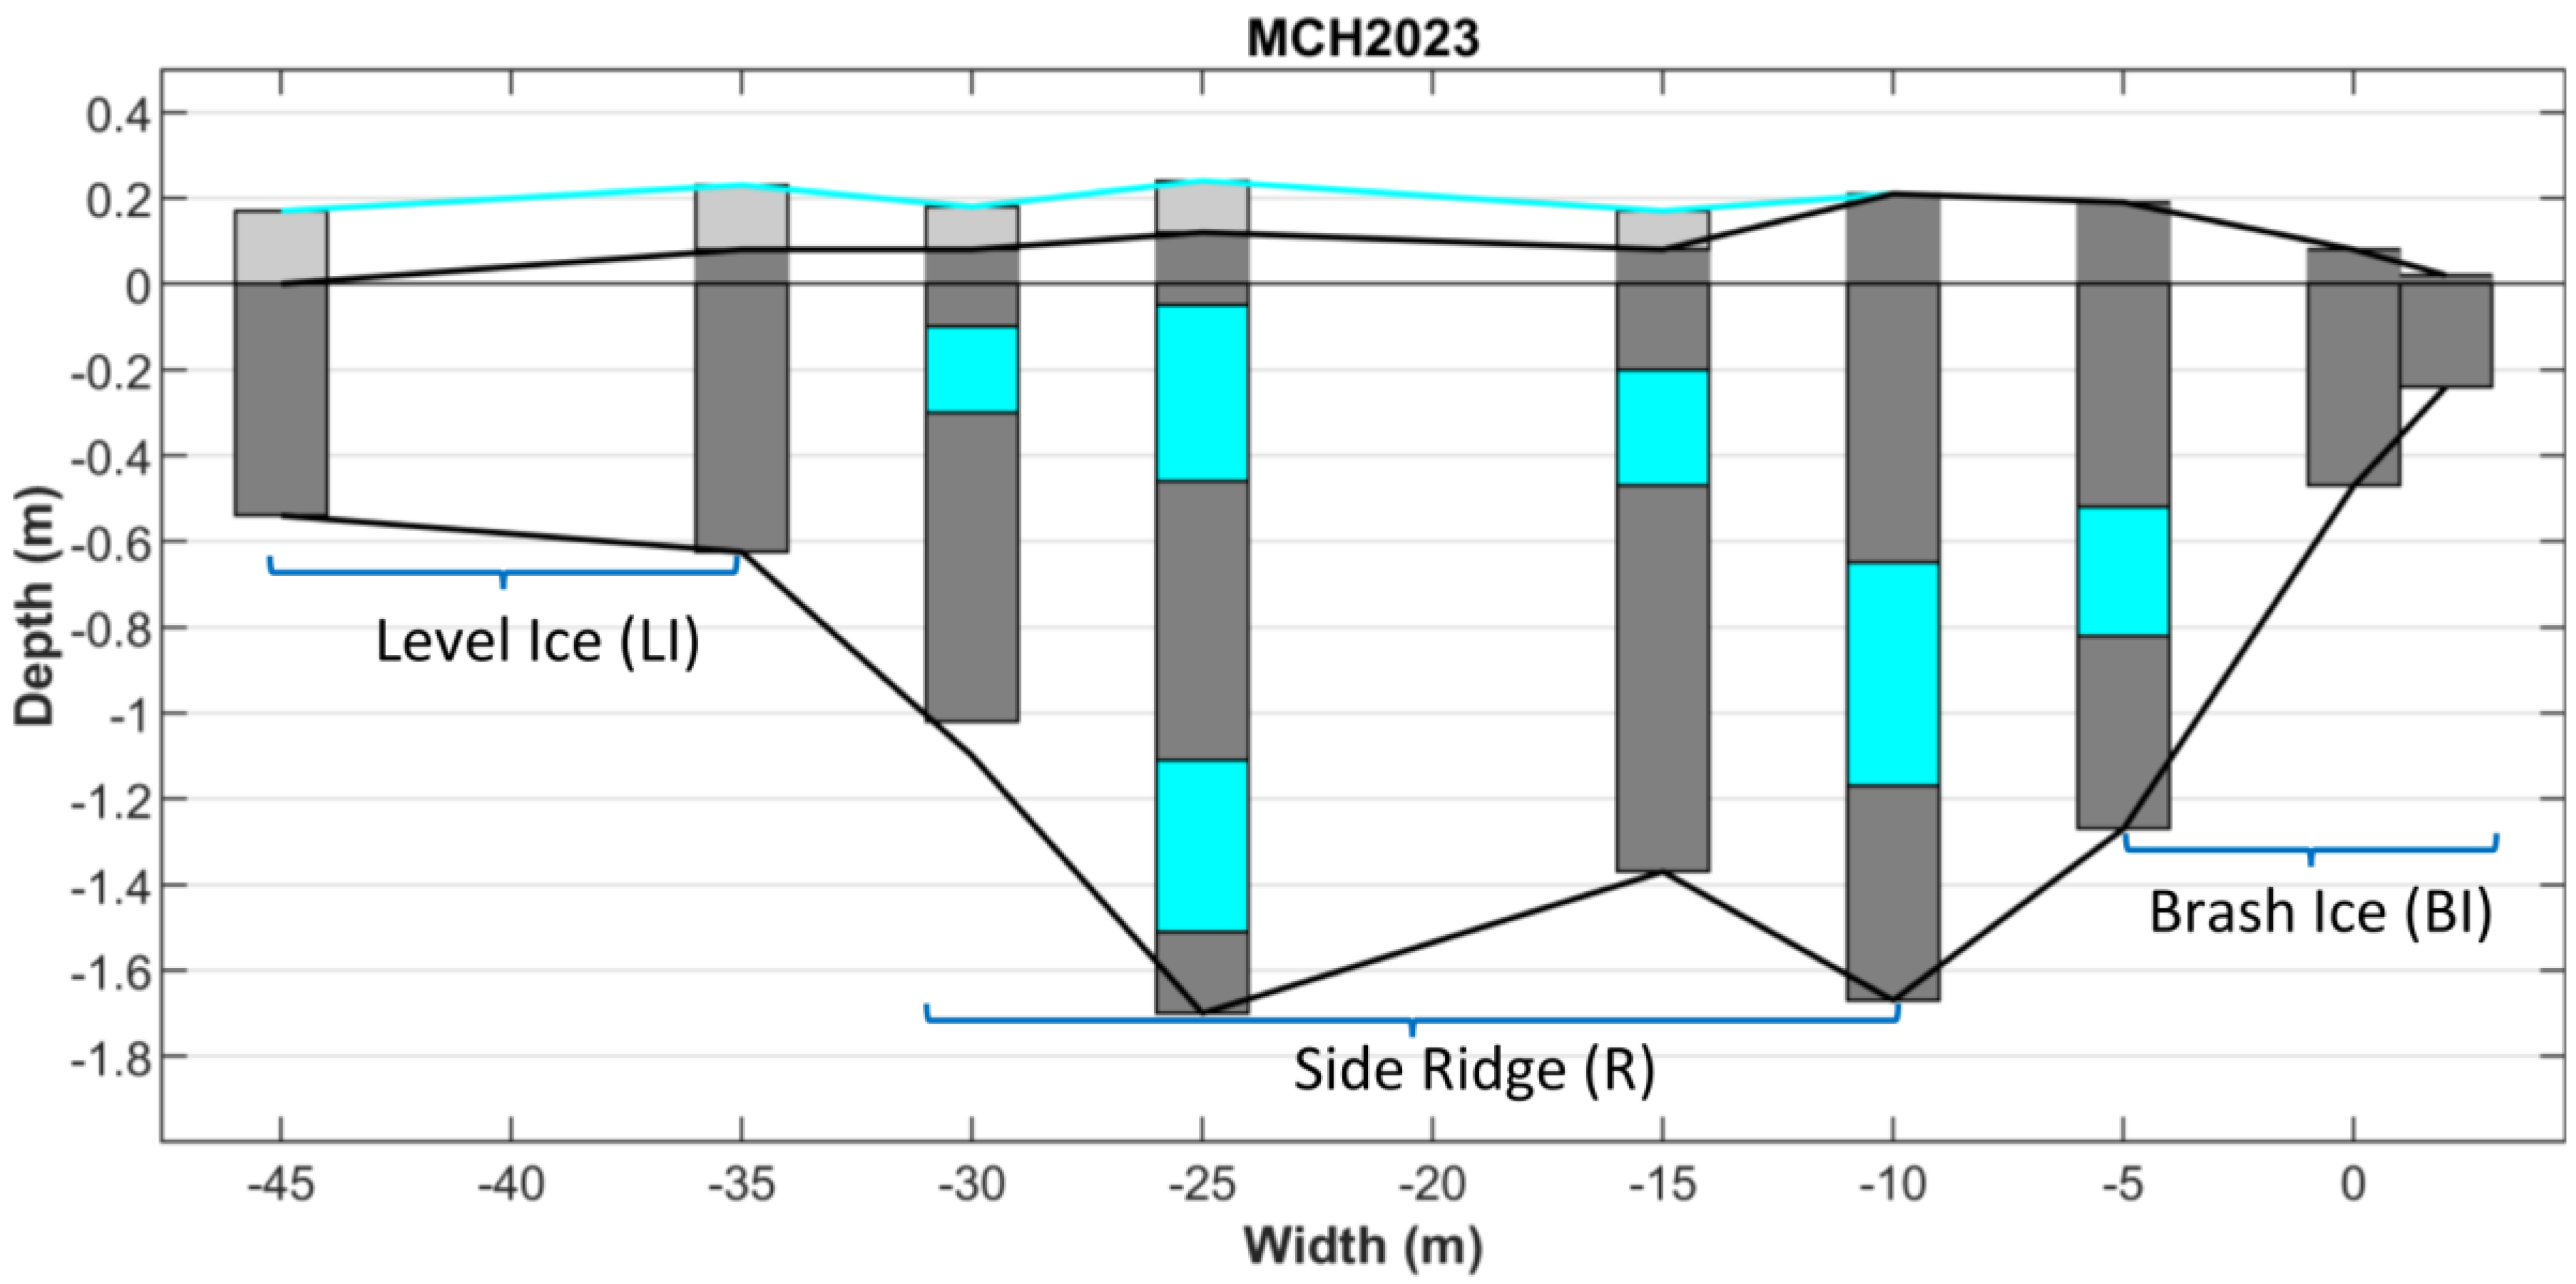
The thicknesses of level ice, side ridge, and brash ice were measured in February 2023 along the half-cross-section profile of the main channel. The results are shown in Figure 19, where the dark grey bars represent the thicknesses of ice pieces, and the cyan bars in between show the water- or slush-filled macropores. It should be noted that only the top layer of the brash ice was cored in the positions where the macropores were present, limiting the results to the properties of this specific layer. During uniaxial compressive tests, the ice temperature varied between −6 °C and −10 °C with an average value of −8.2 °C. Table 3 summarizes the results.
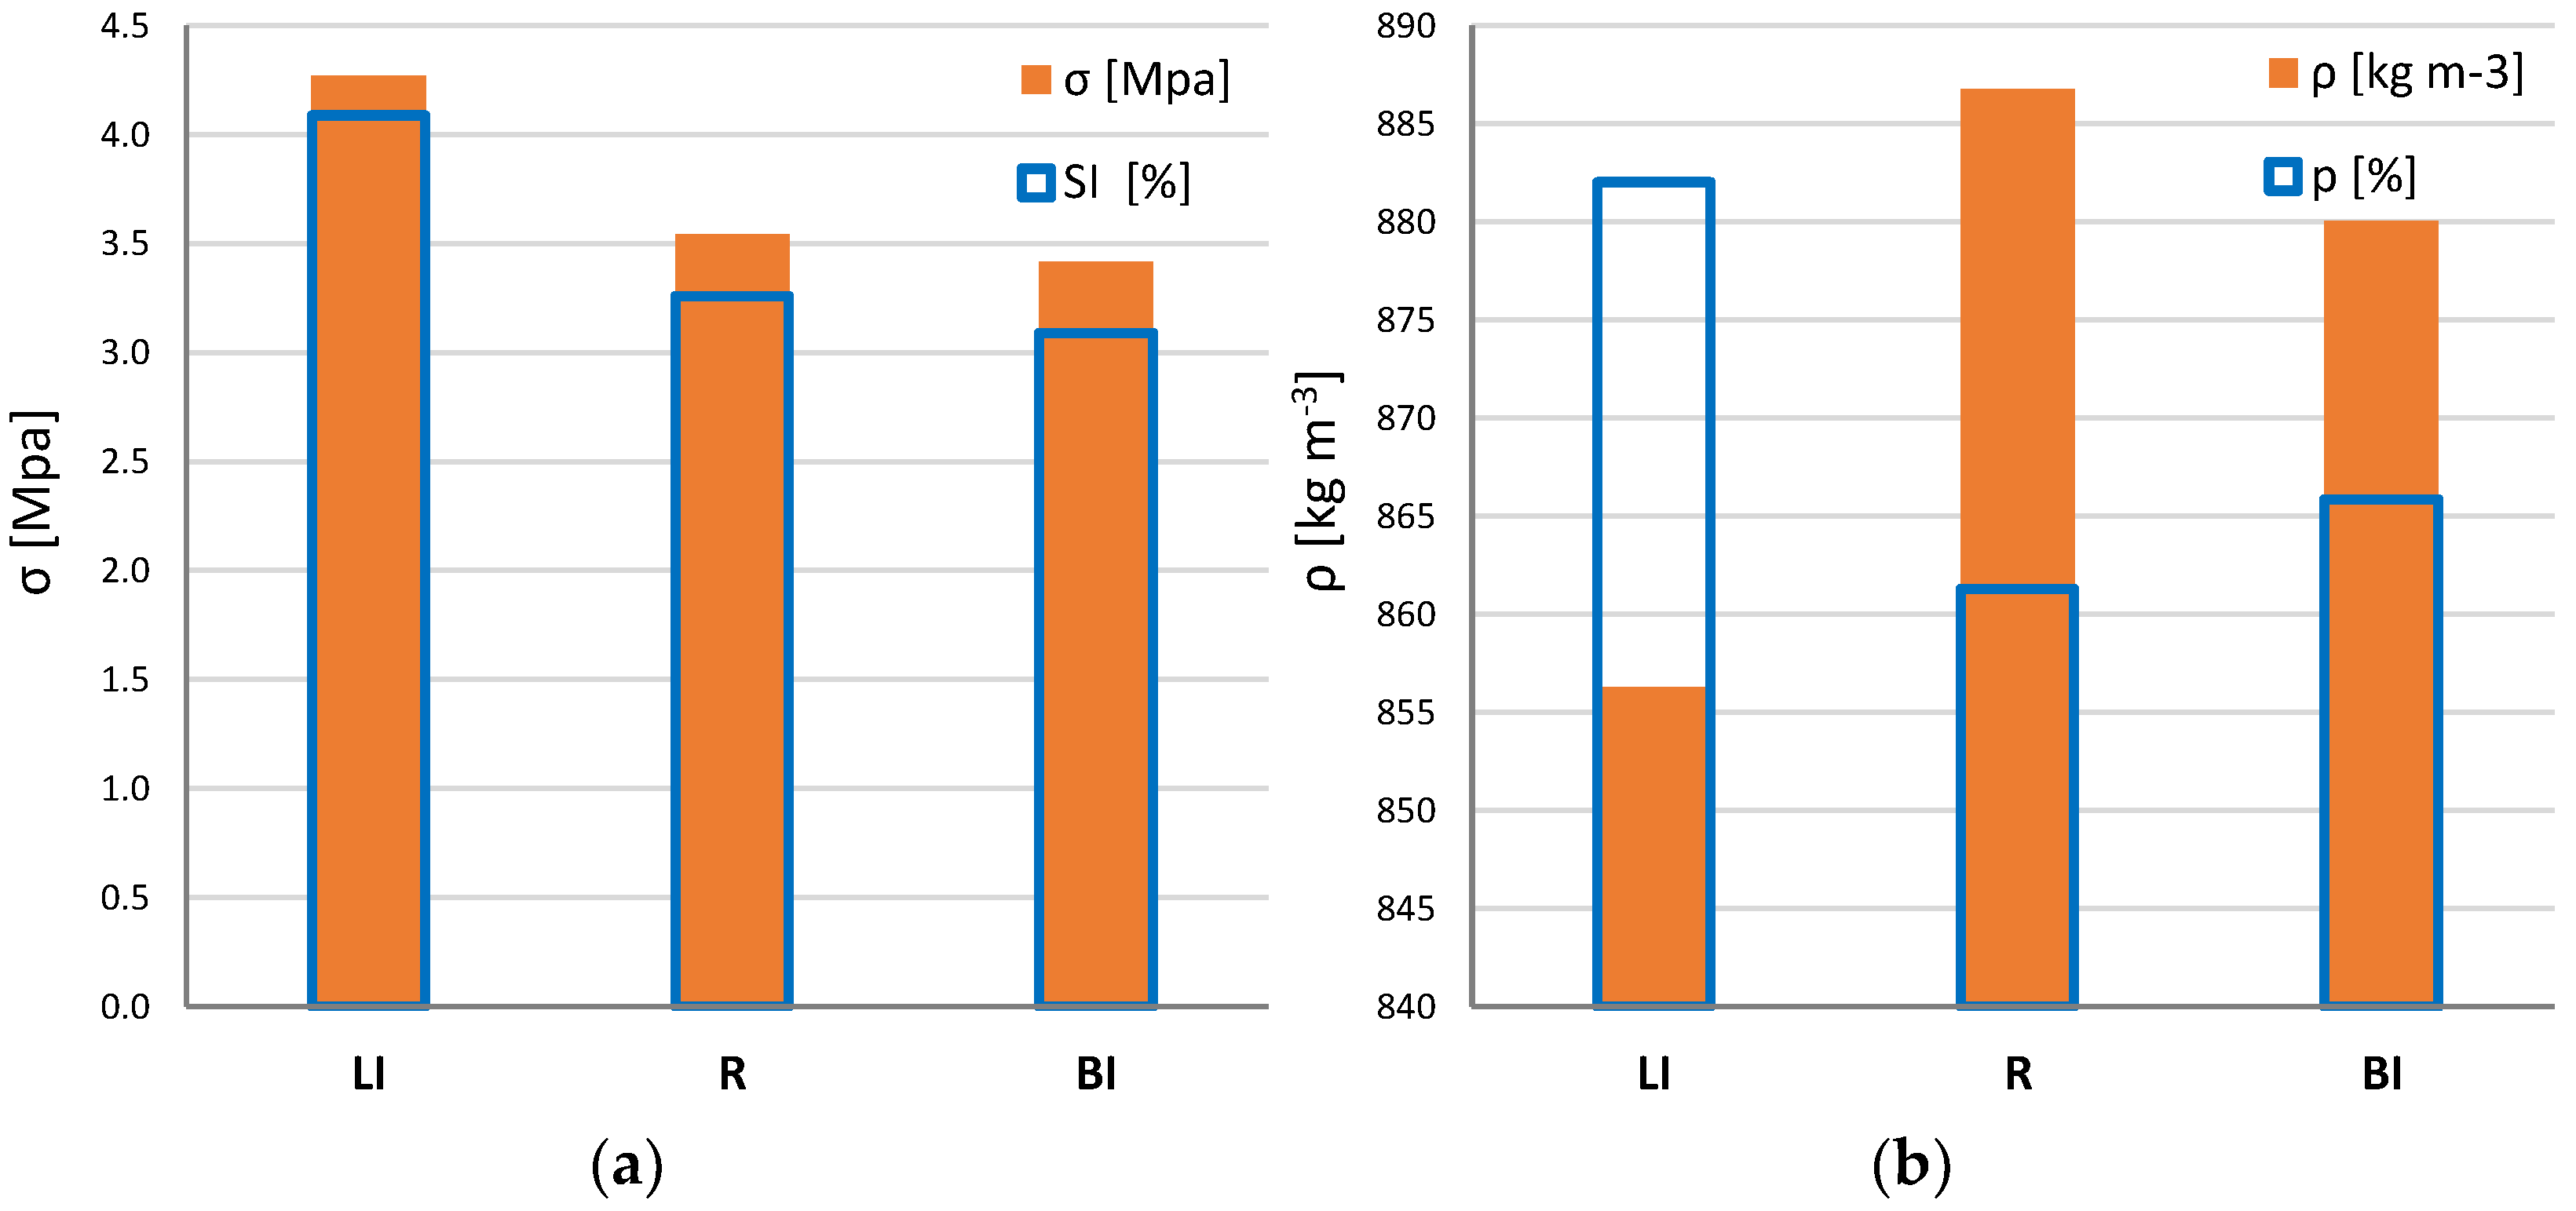
This channel was not always navigated only in the mid position; the side ridges were often broken by ice breakers. However, based on field observations, the last passages before the measurement were carried out in the middle of the channel. Assuming that the main channel was predominantly navigated in the middle (20 m), we have categorized the local results into three main categories: level ice (LI), ridge (R), and brash ice (BI), as shown in Figure 19. The completely solidified ice in the vicinity of the channel was classified as level ice, while the ice between the mid-channel and level ice were considered part of the ridge. The average compressive strength, snow ice content, density, and microporosity for each ice group are illustrated in Figure 20. The snow ice content and compressive strength slightly decreased in the following order: level ice–ridge–brash ice. Similar trends were also yielded in the test and main channels sampled in 2021 discussed in the previous section.
The average snow ice content was found to be 54%, 43%, and 41% for LI, R, and BI, respectively. The lowest density (0.78 kg m−3) and highest microporosity (15%) were recorded in the side ridge, whereas the highest density (0.91 kg m−3) and lowest microporosity (0.85%) were recorded in level ice samples consisting only of columnar ice. The horizontal compressive strength varied from 2 MPa to 5.7 MPa for LI, 2 MPa to 5.3 MPa for R, and 1.2 MPa to 4 MPa for BI locations. Except for the pure columnar ice samples from the LI cores, all the other samples with a pure snow ice or mixed microstructure showed ductile behavior. In a previous study conducted on a test channel type with lower navigation activity, the average horizontal strength of brash ice and level ice from the same location was between 4 and 6 MPa for a similar strain rate of 10−4 s−1, with most of the samples displaying a ductile behavior [35]. In January 2013, the average compressive strength of brash ice was 4.3 MPa, whereas the average compressive strength of level ice was 6.2 MPa.
Different results were reported for the average strength of brash ice sampled from a refrozen ship channel in the Bay of Bothnia, Finland [8]. The compressive strength of brash ice at a strain rate of 10−4 s−1 was 4.2 MPa, which is relatively similar to the current test results. However, at a strain rate of 10−3 s−1, the average strength was 6.3 MPa [8], which was higher than the results obtained from the test and main channel discussed in the previous section (ranging from 2 to 4 MPa). Similar trends in compressive strengths for the same strain rates reported for the refrozen brash ice in [8] were also reported for pressure ridges located in the Barents Sea [29].

5. Conclusions

This study focused on four main research activities carried out on fast sea ice in the winters of 2020–2023. Two ship channels were specifically created for research purposes and maintained by an ice-breaking tug of Luleå port. Thickness measurements were carried out in the channel’s cross-section and adjacent level ice, together with visual observations of the channel’s development instantly after each ship’s passage. Cores of level ice, brash ice, and ridges were collected from both the test channel (TCh01) and an existing frequently navigated channel (MCh). These cores were further analyzed in LTU’s cold laboratory during the summer of 2021 and spring of 2023. The main conclusions of this study are:
  • Four flooding events were estimated to have occurred in the ice adjacent to TCh01. The snow ice microstructure from the level ice in the vicinity of the channel indicated these flooding events as it consisted of four snow–ice layers. However, the ice sampled between the test and main channels had eight different snow ice layers. This difference can be attributed to two possible causes. Firstly, the MCh was navigated more frequently than TCh01, which can cause additional flooding incidents. Secondly, considering that the slush formed from capillary action has different properties than those from four flooding events, eight snow–ice layers could be formed.
  • The total slush thickness measured on level ice adjacent to the ship channels increased linearly with the water level, whereas the slush thickness formed due to capillarity showed no correlation with the water level and had an average thickness of 4 cm. In the second winter, approximately 50% of the incoming snowfall transformed into slush. About 70% of the difference between the measured and incoming snowfall transformed into snow–ice. The rest of the snow (30%) was displaced by the wind or melted when the snow submerged in water. The thickness of snow–ice measured on the level ice adjacent to the first channel was twice as thick as the columnar ice, whereas in the second winter, the snow–ice fraction reached 50% of the total ice thickness.
  • After each ship passage, the snow that accumulated on the channel became submerged and formed a slush layer. Snow–ice clusters between ice blocks were frozen together with columnar ice.
  • During 2021, the snow–ice content was found to be higher in the vicinity of the test channel, reaching 73%. In contrast, the snow ice content was lower in the ridges, measuring 58%, and significantly lower in the middle of the channel, where it was 21%. During winter 2023, the snow ice content was 54% in the vicinity of the main channel, 43% in the ridge, and 41% in the mid-channel. This indicates the melting of snow when submerged in the channel but also some melting of snow on the side ridges due to water being pushed sideways during the ship passages.
  • In winter 2021, the brash ice samples exhibited the lowest strength while the ridge samples from the MCh had the highest strength. Similarly, in winter 2023, the brash ice had the lowest compressive strength, while the level ice in the vicinity of the channel exhibited the highest compressive strength. This difference in strength can be attributed to the weaker bonds between brash pieces compared to the side ridges or level ice, which were exposed to a longer consolidation time. On average, the compressive strength of level ice and ridges ranged from 3 to 4 MPa for a strain rate of 10−3 s−1, and from 3 and 5 MPa for a strain rate of 10−4 s−1. Meanwhile, the brash ice cores had average compressive strengths of 1.8 and 3.4 MPa for strain rates of 10−3 and 10−4 s−1, respectively.

Author Contributions

V.Z.: conceptualization, project administration, investigation, data curation, formal analysis, methodology, visualization, data analysis, writing—original draft. R.B.: conceptualization, project administration, investigation, funding acquisition, methodology, writing—review and editing. K.R.: conceptualization, project administration, methodology, supervision, writing—review and editing. J.N.: investigation, methodology, writing—review and editing. A.C.: funding acquisition, project administration, supervision. All authors have read and agreed to the published version of the manuscript.

Funding

This research was supported financially by TotalEnergies SE, Luleå University of Technology, Kolarctic CBC, and operational support by Luleå port.

Data Availability Statement

All data are available upon request.

Acknowledgments

The authors would like to acknowledge the financial support from Total Energies SE, Kolarctic CBC, and Luleå University of Technology. We are also thankful for the operational support we received from Luleå port and in particular the tug masters for maintaining two brash ice channels.

Conflicts of Interest

The authors declare no conflict of interest.

References

  1. Juva, M.; Riska, K. On the power requirement in the Finnish-Swedish ice class rules. In Winter Navigation Research Board 53; Helsinki University of Technology: Helsinki, Finland, 2002. [Google Scholar]
  2. Greisman, P. Brash Ice Behavior; Report No. USCG-D-30-81; U.S. Coast Guard Research and Development Center: New London, CT, USA, 1981. [Google Scholar]
  3. Sandkvist, J. Observed Growth of Brash Ice in Ships’ Tracks; Research Report; Series A No. 42; Division of Water Resources Engineering, Luleå University of Technology: Luleå, Sweden, 1980. [Google Scholar]
  4. Sandkvist, J. Brash Ice Behaviour in Frequent Ship Channels. Licentiate Thesis, Series A No. 139. Division of Water Resources Engineering, Luleå University of Technology, Luleå, Sweden, 1986. [Google Scholar]
  5. Kitazawa, T.; Ettema, R. Resistance to ship-hull motion through brash ice. Cold Reg. Sci. Technol. 1985, 10, 219–234. [Google Scholar] [CrossRef]
  6. Ettema, R.; Schaefer, J.A.; Huang, H.P. Ice-tank data on brash-ice loads against barges. J. Cold Reg. Sci. Technol. 1998, 12, 153–161. [Google Scholar]
  7. Bonath, V.; Zhaka, V.; Sand, B. Field Measurements on the Behavior of Brash Ice. In Proceedings of the International Conference on Port and Ocean Engineering Under Arctic Conditions, Delft, The Netherlands, 9–13 June 2019. [Google Scholar]
  8. Zhaka, V.; Bonath, V.; Sand, B.; Cwirzen, A. Physical and Mechanical Properties of Ice from a Refrozen Ship Channel Ice in the Bay of Bothnia. In Proceedings of the 25th International Symposium on Ice, Trondheim, Norway, 23–25 November 2020. [Google Scholar]
  9. Riska, K.; Bridges, R.; Shumovskiy, S.; Thomas, C.; Coche, E.; Bonath, V.; Tobie, A.; Chomatas, K.; Caloba Duarte de Oliveira, R. Brash ice growth model—Development and validation. Cold Reg. Sci. Technol. 2019, 15, 30–41. [Google Scholar] [CrossRef]
  10. Zhaka, V.; Bridges, R.; Riska, K.; Cwirzen, A. A review of level ice and brash ice growth models. J. Glaciol. 2022, 68, 685–704. [Google Scholar] [CrossRef]
  11. Andres, D.D.; Van der Vinne, P.G. Calibration of ice growth models for bare and snow covered conditions: A summary of experimental data from a small prairie pond. In Proceedings of the 11th Workshop on River Ice: River Ice Processes within a Changing Environment, CGU HS Committe on River Ice Proccesses and the Environment (CRIPE), Ottawa, ON, Canada, 14–16 May 2001. [Google Scholar]
  12. Ager, B.H. Studies on the density of naturally and artificially formed fresh-water ice. J. Glaciol. 1962, 4, 207–214. [Google Scholar] [CrossRef] [Green Version]
  13. Leppäranta, M. A growth model for black ice, snow ice and snow thickness in subarctic basins. Hydrol. Res. 1983, 14, 59–70. [Google Scholar] [CrossRef]
  14. Leppäranta, M. A review of analytical models of sea-ice growth. Atmos. Ocean 1993, 31, 123–138. [Google Scholar] [CrossRef]
  15. Saloranta, T.M. Modeling the evolution of snow, snow ice and ice in the Baltic Sea. Tellus A: Dyn. Meteorol. Oceanogr. 2000, 52, 93–108. [Google Scholar]
  16. Cheng, B.; Vihma, T.; Rontu, L.; Kontu, A.; Pour, H.K.; Duguay, C.; Pulliainen, J. Evolution of snow and ice temperature, thickness and energy balance in Lake Orajärvi, northern Finland. Tellus A: Dyn. Meteorol. Oceanogr. 2014, 66, 21564. [Google Scholar]
  17. Ashton, G.D. River and lake ice thickening, thinning, and snow ice formation. Cold Reg. Sci. Technol. 2011, 68, 3–19. [Google Scholar] [CrossRef]
  18. Knight, C.A. Formation of slush on floating ice. Cold Reg. Sci. Technol. 1988, 15, 33–38. [Google Scholar] [CrossRef]
  19. Coléou, C.; Xu, K.; Lesaffre, B.; Brzoska, J.B. Capillary rise in snow. Hydrol. Process. 1999, 13, 1721–1732. [Google Scholar] [CrossRef]
  20. Colbeck, S.C. An analysis of water flow in dry snow. Water Resour. Res. 1976, 12, 523–527. [Google Scholar] [CrossRef]
  21. Colbeck, S.C. The physical aspects of water flow through snow. Adv. Hydrosci. 1978, 11, 165–206. [Google Scholar]
  22. Ashton, G.D. River and Lake Ice Engineering; Water Resources Publications: Littleon, CO, USA, 1986; U.S. Library of Congress Catalogue Number: 86–50681.
  23. Leppäranta, M.; Kosloff, P. The structure and thickness of lake Pääjärvi ice. Geophysica 2000, 36, 233–248. [Google Scholar]
  24. Ohata, Y.; Toyota, T.; Shiraiwa, T. Lake ice formation processes and thickness evolution at Lake Abashiri, Hokkaido, Japan. J. Glaciol. 2016, 62, 563–578. [Google Scholar] [CrossRef] [Green Version]
  25. Light, B.; Maykut, G.A.; Grenfell, T.C. Effects of temperature on the microstructure of first-year Arctic sea ice. J. Geophys. Res. Oceans 2003, 108, 3051. [Google Scholar] [CrossRef]
  26. Gow, A.J.; Langston, D. Growth History of Lake Ice in Relation to Its Stratigraphic, Crystalline and Mechanical Structure (No. 77); Department of Defense, Army, Corps of Engineers, Cold Regions Research and Engineering Laboratory: Hanover, HN, USA, 1977; pp. 1–29. [Google Scholar]
  27. Timco, G.W.; Frederking, R.M.W. A review of sea ice density. Cold Reg. Sci. Technol. 1996, 24, 1–6. [Google Scholar] [CrossRef]
  28. Cox, G.; Weeks, W. Equations for Determining the Gas and Brine Volumes in Sea-Ice Samples. J. Glaciol. 1983, 29, 306–316. [Google Scholar] [CrossRef] [Green Version]
  29. Bonath, V.; Edeskär, T.; Lintzén, N.; Fransson, L.; Cwirzen, A. Properties of ice from first-year ridges in the Barents Sea and Fram Strait. Cold Reg. Sci. Technol. 2019, 168, 102890. [Google Scholar] [CrossRef]
  30. Maksym, T.; Jeffries, M.O. A one-dimensional percolation model of flooding and snow ice formation on Antarctic sea ice. J. Geophys. Res. Ocean. 2000, 105, 26313–26331. [Google Scholar] [CrossRef]
  31. Jordan, R.E.; Hardy, J.P.; Perron, F.E., Jr.; Fisk, D.J. Air permeability and capillary rise as measures of the pore structure of snow: An experimental and theoretical study. Hydrol. Process. 1999, 13, 1733–1753. [Google Scholar] [CrossRef]
  32. Hiemstra, C.A.; Liston, G.E.; Reiners, W.A. Observing, modelling, and validating snow redistribution by wind in a Wyoming upper treeline landscape. Ecol. Modell. 2006, 197, 35–51. [Google Scholar] [CrossRef]
  33. Nicolaus, M.; Haas, C.; Bareiss, J. Observations of superimposed ice formation at melt-onset on fast ice on Kongsfjorden, Svalbard. Phys. Chem. Earth 2003, 28, 1241–1248. [Google Scholar] [CrossRef] [Green Version]
  34. Granskog, M.A.; Vihma, T.; Pirazzini, R.; Cheng, B. Superimposed ice formation and surface energy fluxes on sea ice during the spring melt-freeze period in the Baltic Sea. J. Glaciol. 2006, 52, 119–127. [Google Scholar] [CrossRef] [Green Version]
  35. Bonath, V.; Fransson, L. Isförhållanden inom Luleå Hamnbassäng; Research Report; Luleå University of Technology: Luleå, Sweden, 2013; p. 87. ISSN 1402-1528. [Google Scholar]
  36. Chen, X.; Høyland, K.V. Laboratory work on heat transfer in submerged ice, theory, experimental setup and results. In Proceedings of the 23rd IAHR International Symposium on Ice, Ann Arbor, MI, USA, 31 May–3 June 2016. [Google Scholar]
  37. Chen, X.; Høyland, K.V.; Ji, S. Laboratory tests to investigate the initial phase of ice ridge consolidation. Cold Reg. Sci. Technol. 2020, 176, 103093. [Google Scholar] [CrossRef]
  38. Huang, H.P. Ice formation in frequently transited navigation channels. Ph.D. Thesis, The University of Iowa, Iowa City, IA, USA, 1988. [Google Scholar]
  39. Ettema, R.; Huang, H.P. Ice Formation in Frequently Transited Navigation Channels; Special Report 90–40; U.S. Army Corps of Engineers, Cold Regions Research & Engineering Laboratory: Hanover, HN, USA, 1990; pp. 1–120. [Google Scholar]
  40. Gow, A.J. Orientation textures in ice sheets of quietly frozen lakes. J. Cryst. Growth 1986, 74, 247–258. [Google Scholar] [CrossRef]
  41. Høyland, K.V. Morphology and small-scale strength of ridges in the North-western Barents Sea. Cold Reg. Sci. Technol. 2007, 48, 169–187. [Google Scholar] [CrossRef]
  42. Bonath, V.; Petrich, C.; Sand, B.; Fransson, L.; Cwirzen, A. Morphology, internal structure, and formation of ice ridges in the sea around Svalbard. Cold Reg. Sci. Technol. 2018, 155, 263–279. [Google Scholar] [CrossRef] [Green Version]
  43. Cole, D.M. The microstructure of ice and its influence on mechanical properties. Eng. Fract. Mech. 2001, 68, 1797–1822. [Google Scholar] [CrossRef]
  44. Ettema, R.; Schaefer, J. A Experiments on freeze-bonding between ice blocks in floating ice rubble. J. Glaciol. 1986, 32, 397–403. [Google Scholar] [CrossRef] [Green Version]
  45. Urroz, G.E.; Ettema, R. Simple-shear box experiments with floating ice rubble. Simple-shear box experiments with floating ice rubble. Cold Reg. Sci. Technol. 1987, 14, 185–199. [Google Scholar] [CrossRef]
  46. Ida Mari, B.; Høyland, K.V. Confined Compression Tests on Saline and Fresh Freeze-Bonds. In Proceedings of the International Conference on Port and Ocean Engineering under Arctic Conditions, Trondheim, Norway, 14–18 June 2015. [Google Scholar]
  47. Boroojerdi, M.T.; Bailey, E.; Taylor, R. Experimental study of the effect of submersion time on the strength development of freeze bonds. Cold Reg. Sci. Technol. 2020, 172, 102986. [Google Scholar] [CrossRef]
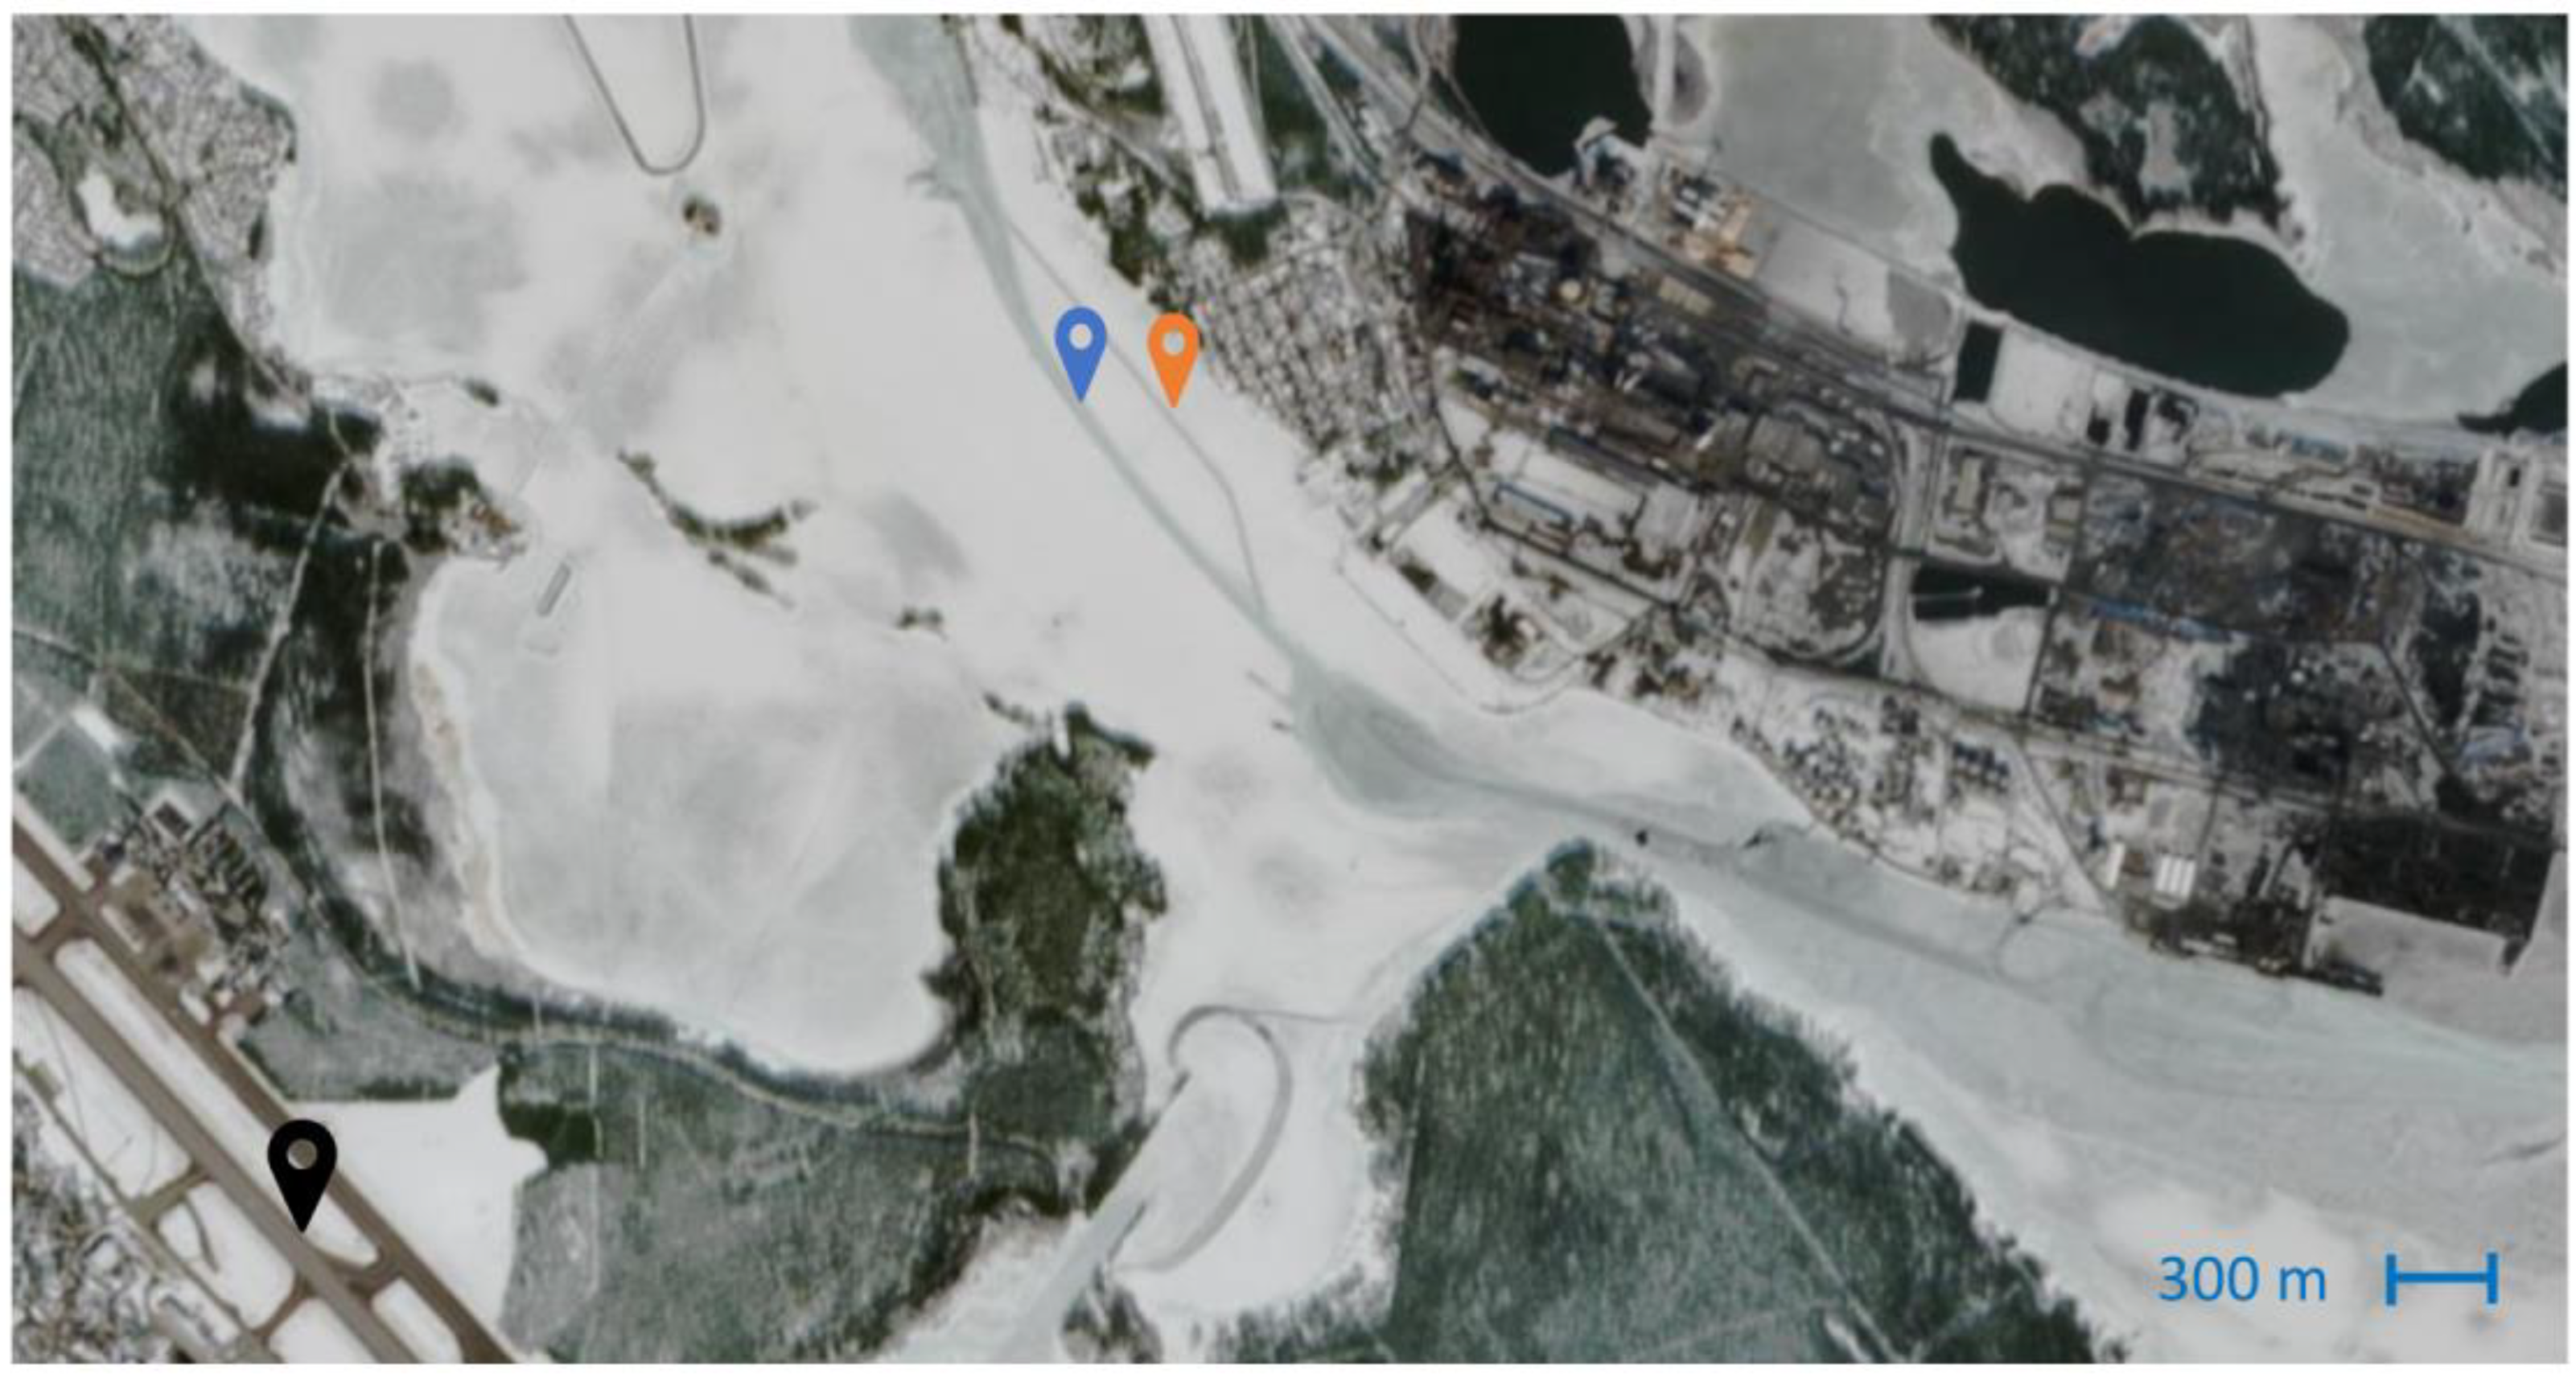
Figure 1. The locations of the research site. The test (TCh) and main channels (MCh) are shown with orange and blue location markers, and the SMHI meteorological station at Luleå Airport is shown with a black location marker. Modified optical (Sentinel) satellite image.
Water 15 02360 g001
Figure 2. Air temperatures (TA in °C), and snow thicknesses (HS in m) were recorded at the SMHIs weather station in Luleå.
Water 15 02360 g002
Figure 3. The study location for the investigation level ice was adjacent to the test channel (TCh01 27 March 2021), where cores were examined from a test grid, starting approximately 5 m from the channel edge, and extending up to 30 m towards the shoreline. Cores were also collected along the channel direction for a distance of 30 m. The spacing between cores was 5 m.
Water 15 02360 g003
Figure 4. Temperature profiles of the ice cores were sampled on the main channel on 7 March 2021. “LI” indicates level ice samples between the test and main channels; “LI R” indicates the cores from the vicinity of the main channel’s ridge; the ridge cores are denoted with “R”. Three ice cores were sampled at each location, spaced 6 m from each other (numbers 1–3).
Water 15 02360 g004
Figure 5. Microstructure of brash ice sampled in the middle of the test channel (TCh01) on 8 February 2021 under plain transmitted light and cross-polarized light. The surface area of snow ice is underlined with a solid blue line.
Water 15 02360 g005
Figure 6. The level ice in the vicinity and adjacent to the channel (TCh02) was flooded after the ship passages. A 1 BE shows the adjacent level ice flooded instantly after the first ship passage, whereas B 2 BE shows the level ice before the second ship passage, with the slush frozen to snow ice.
Water 15 02360 g006
Figure 7. (a) The total slush thickness (HSL) and the slush thickness formed above the water line (HSLa) are plotted against the water level (WL). (b) The plot shows the slush thickness before drilling or slush thickness in voids (BD and V) and the slush thickness after drilling (AD).
Water 15 02360 g007
Figure 8. The measured and estimated slush thicknesses were obtained (HSL and HSLe) from the mass balance equation between snow load and ice buoyancy for TCh01 (a) and TCh02 (b). The time of the breaking events (BE) is illustrated with red crosses.
Water 15 02360 g008
Figure 9. The difference in the snow thickness (ΔHS) between the incoming snow thickness (HS SMHI) and measured snow thickness on ice (HSm) during the first (a) and the second winters (b).
Water 15 02360 g009
Figure 10. (a) The difference (ΔHS) in the incoming (HS SMHI) and measured (HS) snow thicknesses vs. the measured snow ice thickness (HSI); (b) the time-dependent ratios of HSI/ΔHS and HSI/HS SMHI.
Water 15 02360 g010
Figure 11. Congelation ice (CI) and snow ice (SI) fractions of total level ice adjacent to the ship channels TCh01 (a) and TCh02 (b).
Water 15 02360 g011
Figure 12. An overview of the ship channel (TCh02) development with breaking events (BE). The notation “B 2 BE” implies before the second breaking event and “A 1 BE” refers to after the first breaking event.
Water 15 02360 g012
Figure 13. A set of photographs illustrating snow–ice (SI), congelation ice (CI), and slush on the surface of the first channel (TCh01). The orange arrow highlights the SI, and the blue arrow highlights the CI. In the first and second figures (a,b) pools of submerged slush between pieces are present, whereas lateral growth is also evident in the last image (c).
Water 15 02360 g013
Figure 14. Sub-surface images were recorded at 30 cm depth in the side ridge of TCh01 after the sixth BE (a,b); after the ninth BE (c,d).
Water 15 02360 g014
Figure 15. The microstructure of two cores (R1 and R2) sampled on the side ridge of TCh01 on 23 March 2021. The orange arrows distinguish different snow ice layers, and the blue arrows indicate the thickness of the thin sections.
Water 15 02360 g015
Figure 16. Cross-section profile of the first channel TCh01 measured on 06/03/2021, including the microstructure, and the location of three cores sampled in TCh01. R indicates the side ridge sample, M−E is the sample between the middle and the edge of the channel, and M indicates the middle of the channel.
Water 15 02360 g016
Figure 17. The microstructure of three cores sampled: (1) in the level ice (LI 1) between two channels (TCh01 and MCh01), (2) in the vicinity of the ridge (LI R1), and (3) in the ridge (R3). A scheme of both channels and the coring locations are given below the microstructure images.
Water 15 02360 g017
Figure 18. (a) The average compressive strength (σ in MPa) and the average snow ice content (SI in %). (b) The average microporosity (p in%) and ice density (ρ in kg m−3). Samples from the level ice in the vicinity of the ship channel are denoted as TCH LI; the brash ice cores are denoted with TCH M, and the ridge samples with TCH R. T-MCH LI indicates level ice samples between TCH and MCH; MCH LI R and MCH R indicate samples from the ridge vicinity and the ridge in the main channel.
Water 15 02360 g018
Figure 19. Half-cross-section profile of the main channel was measured on 25/26–02/2023. Each measurement represents the location where the ice cores were sampled. The thickness of each ice core was equal to the ice thickness until the first water void, as shown in this cross-section.
Water 15 02360 g019
Figure 20. (a) The average compressive strength (σ in MPa) and the average snow ice content (SI in %). (b) The average microporosity (p in %) and ice density (ρ in kg m−3). LI, R, and BI imply level ice, side ridges, and brash ice.
Water 15 02360 g020
Table 1. The date and time of the breaking events and field measurement.
Test Chanel #01
BEBE DateBE TimeCross-Section MeasurementsLevel Ice Measurements
12021-01-1423:002021-01-23/26/30-
22021-02-0110:00--
32021-02-0207:00--
42021-02-0312:002021-02-06/08-
52021-02-1021:00--
62021-02-1111:002021-02-13/15/20-
72021-02-2110:002021-02-22/242021-02-27
82021-03-0323:002021-03-05/06/09/10-
92021-03-1220:302021-03-15/17/182021-03/04-13/23/27/01/10
Test Chanel #02
12021-12-1021:30-2021-12-12/18
22021-12-2117:302021-12-23/27-
32021-12-2716:30--
42022-01-0505:002022-01-11-
52022-01-1210:302022-01-162022-01-15
62022-01-2000:002022-01-22-
72022-01-2808:302022-02-012022-01/02-29/05
82022-02-0609:452022-02-162022-02-12/19
92022-02-1918:002022-02-23-
102022-03-0605:002022-03-092022-03/04-06/12/19/03/10
Table 2. The date and time of the breaking events and field measurement.
Test Chanel #01
Nr. BEHS BI (cm)HS SR (cm)HS LIv (cm)
2141616
511615
7141816
8293429
95169
Test Chanel #02
2- -
3467
55119
6096
7011
8555
9141818
1062823
Table 3. The width in m shows the locations where the ice cores were sampled along the brash ice channel’s cross-section. The width zero represents the channel’s middle and “−45 m” is the position of the level of ice adjacent to the channel. The core thicknesses, average snow ice content, compressive strength, standard deviation of the compressive strength, density, and microporosity of the ice cores in the sampling location are noted as HT, SI, σ, Std, ρ, and P, respectively.
Width (m)HT (m)SI (%)σ (Mpa)Std (Mpa)ρ (kg m−3)p (%)
−450.5344.45.20.4883.13.8
−350.564.53.30.9829.59.6
−250.48/0.5034.84.60.5882.93.8
−150.3545.62.80.2891.22.9
−100.6550.03.21.1886.23.5
−50.2/0.2333.52.81.2872.84.9
00.55/0.2448.94.10.7887.43.3
Disclaimer/Publisher’s Note: The statements, opinions and data contained in all publications are solely those of the individual author(s) and contributor(s) and not of MDPI and/or the editor(s). MDPI and/or the editor(s) disclaim responsibility for any injury to people or property resulting from any ideas, methods, instructions or products referred to in the content.