
Large Uncertainties in CO2 Water–Air Outgassing Estimation with Gas Exchange Coefficient KT for a Large Lowland River

Abstract
:1. Introduction
2. Methodology
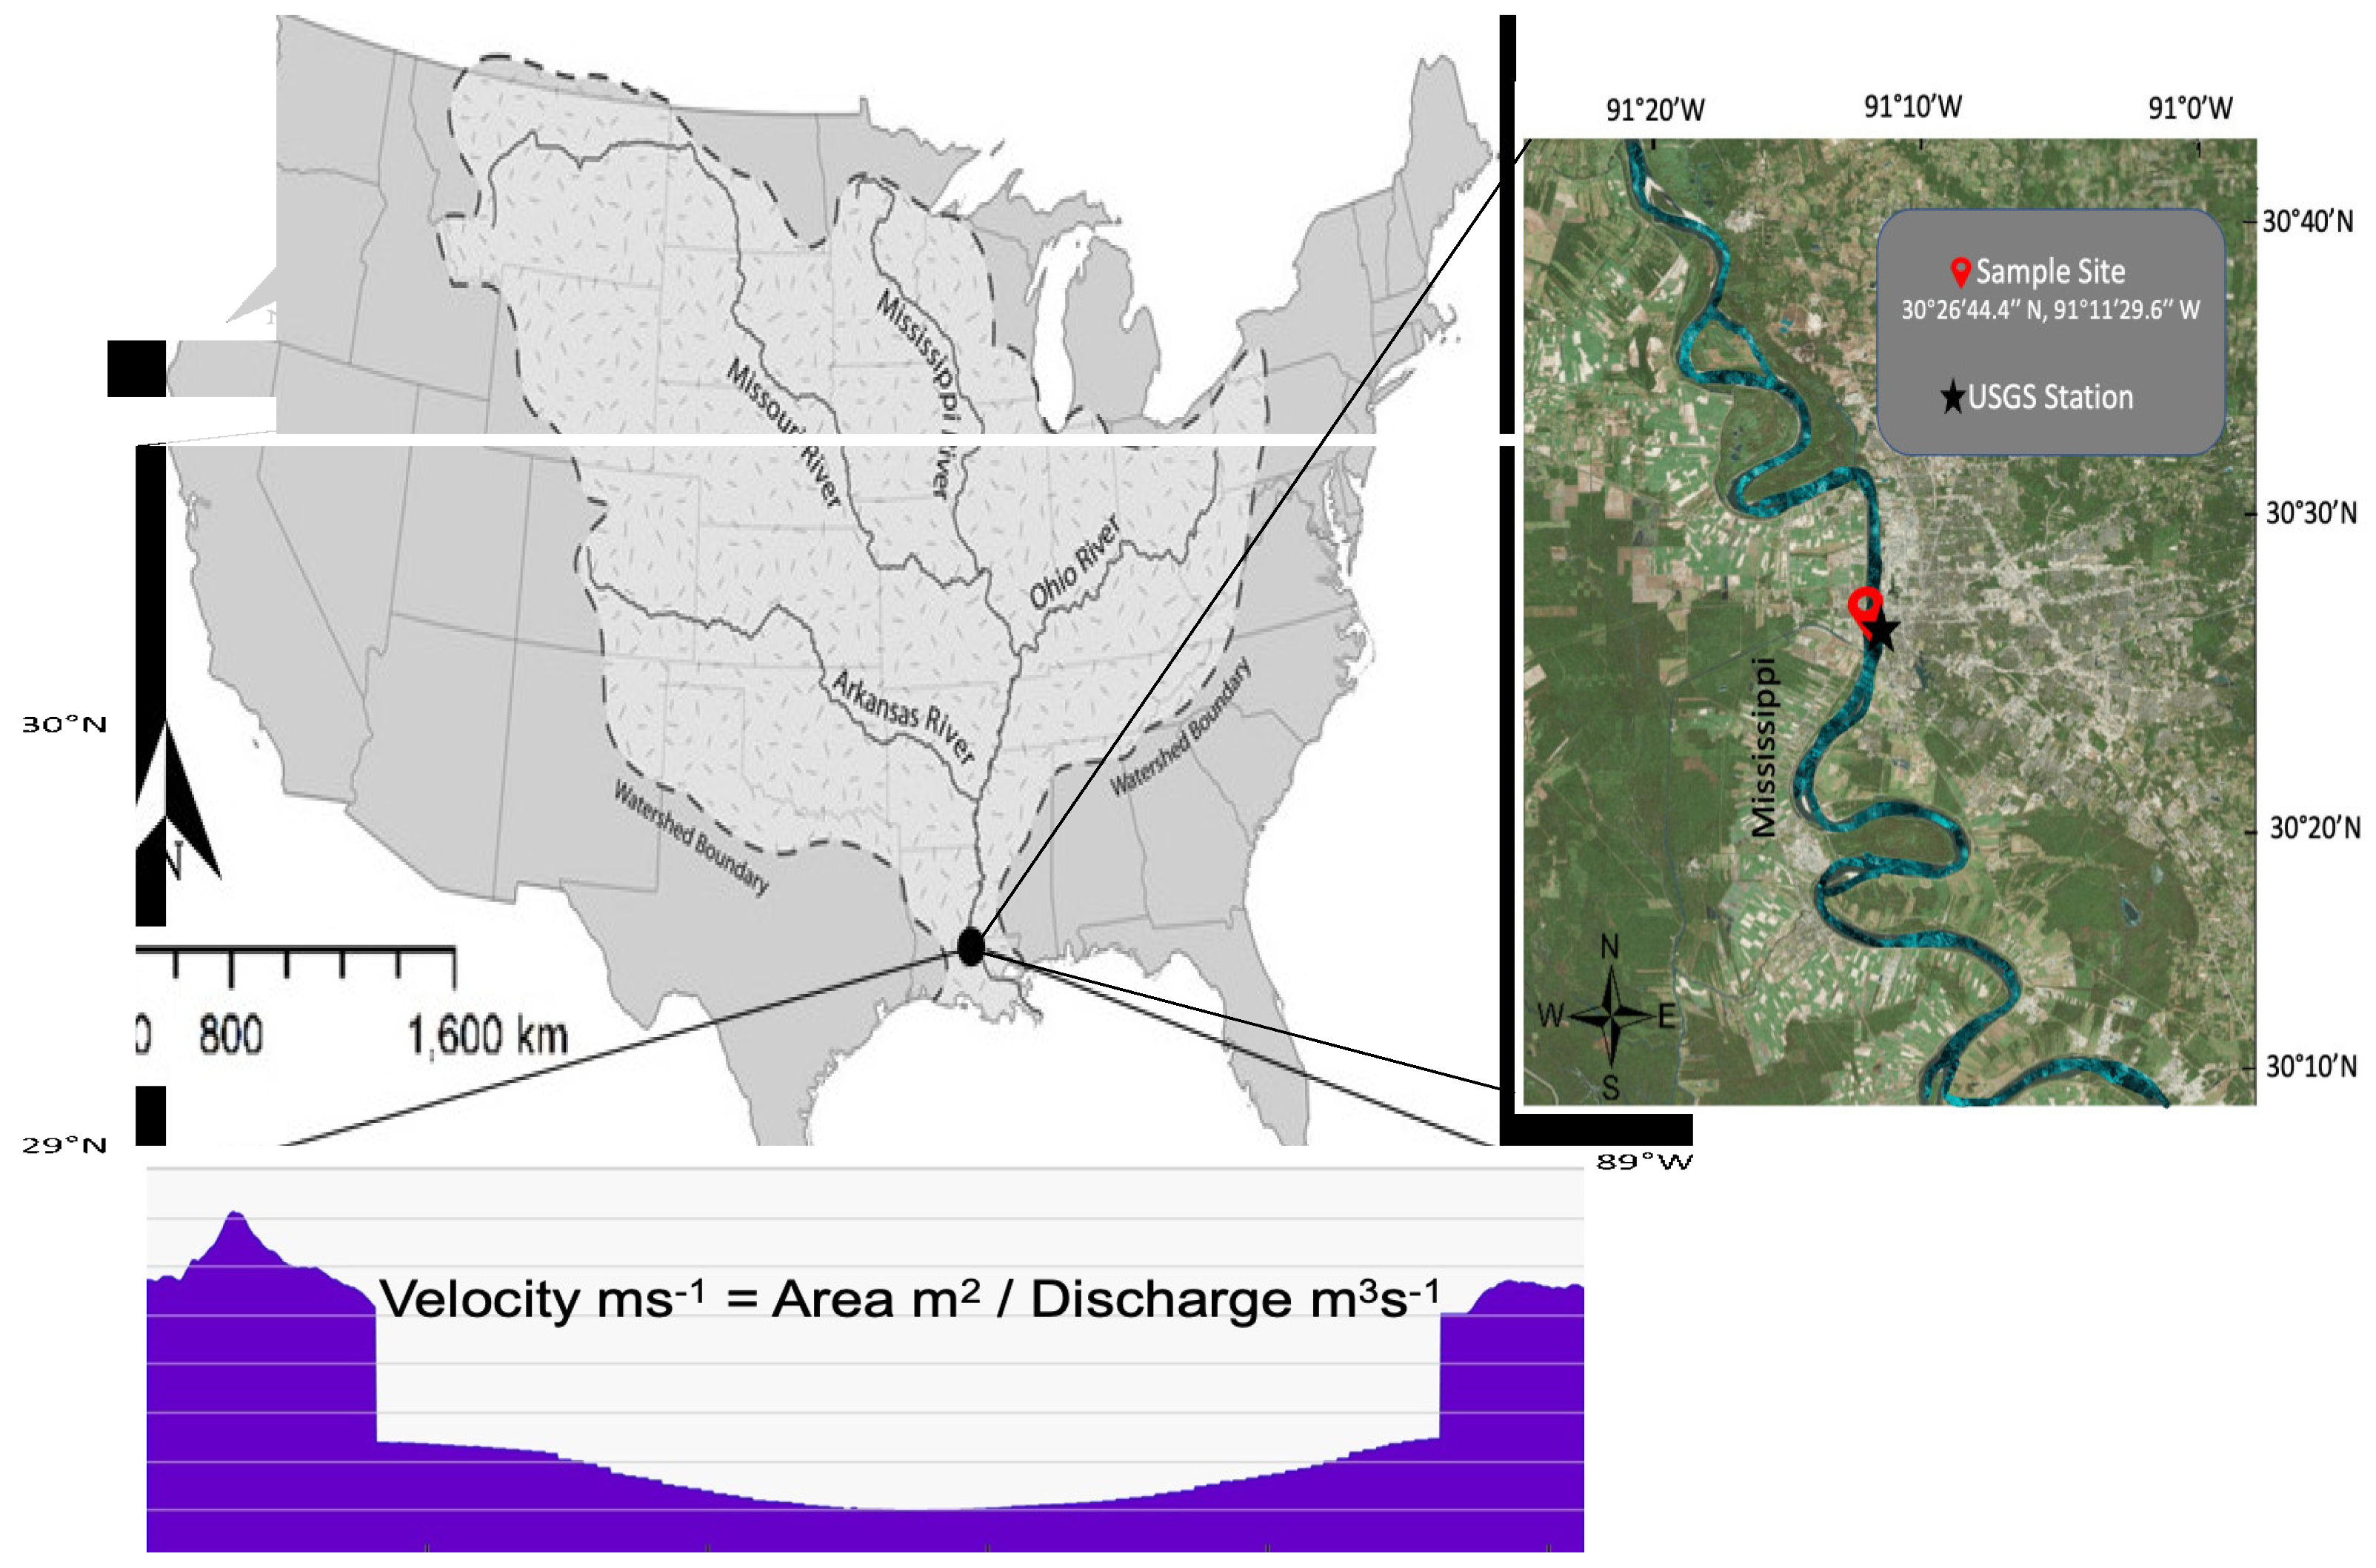
2.1. Study Site
2.2. Data Collection
2.3. Estimations of Gas Exchange Coefficient KT
2.4. Statistical Analysis
3. Results
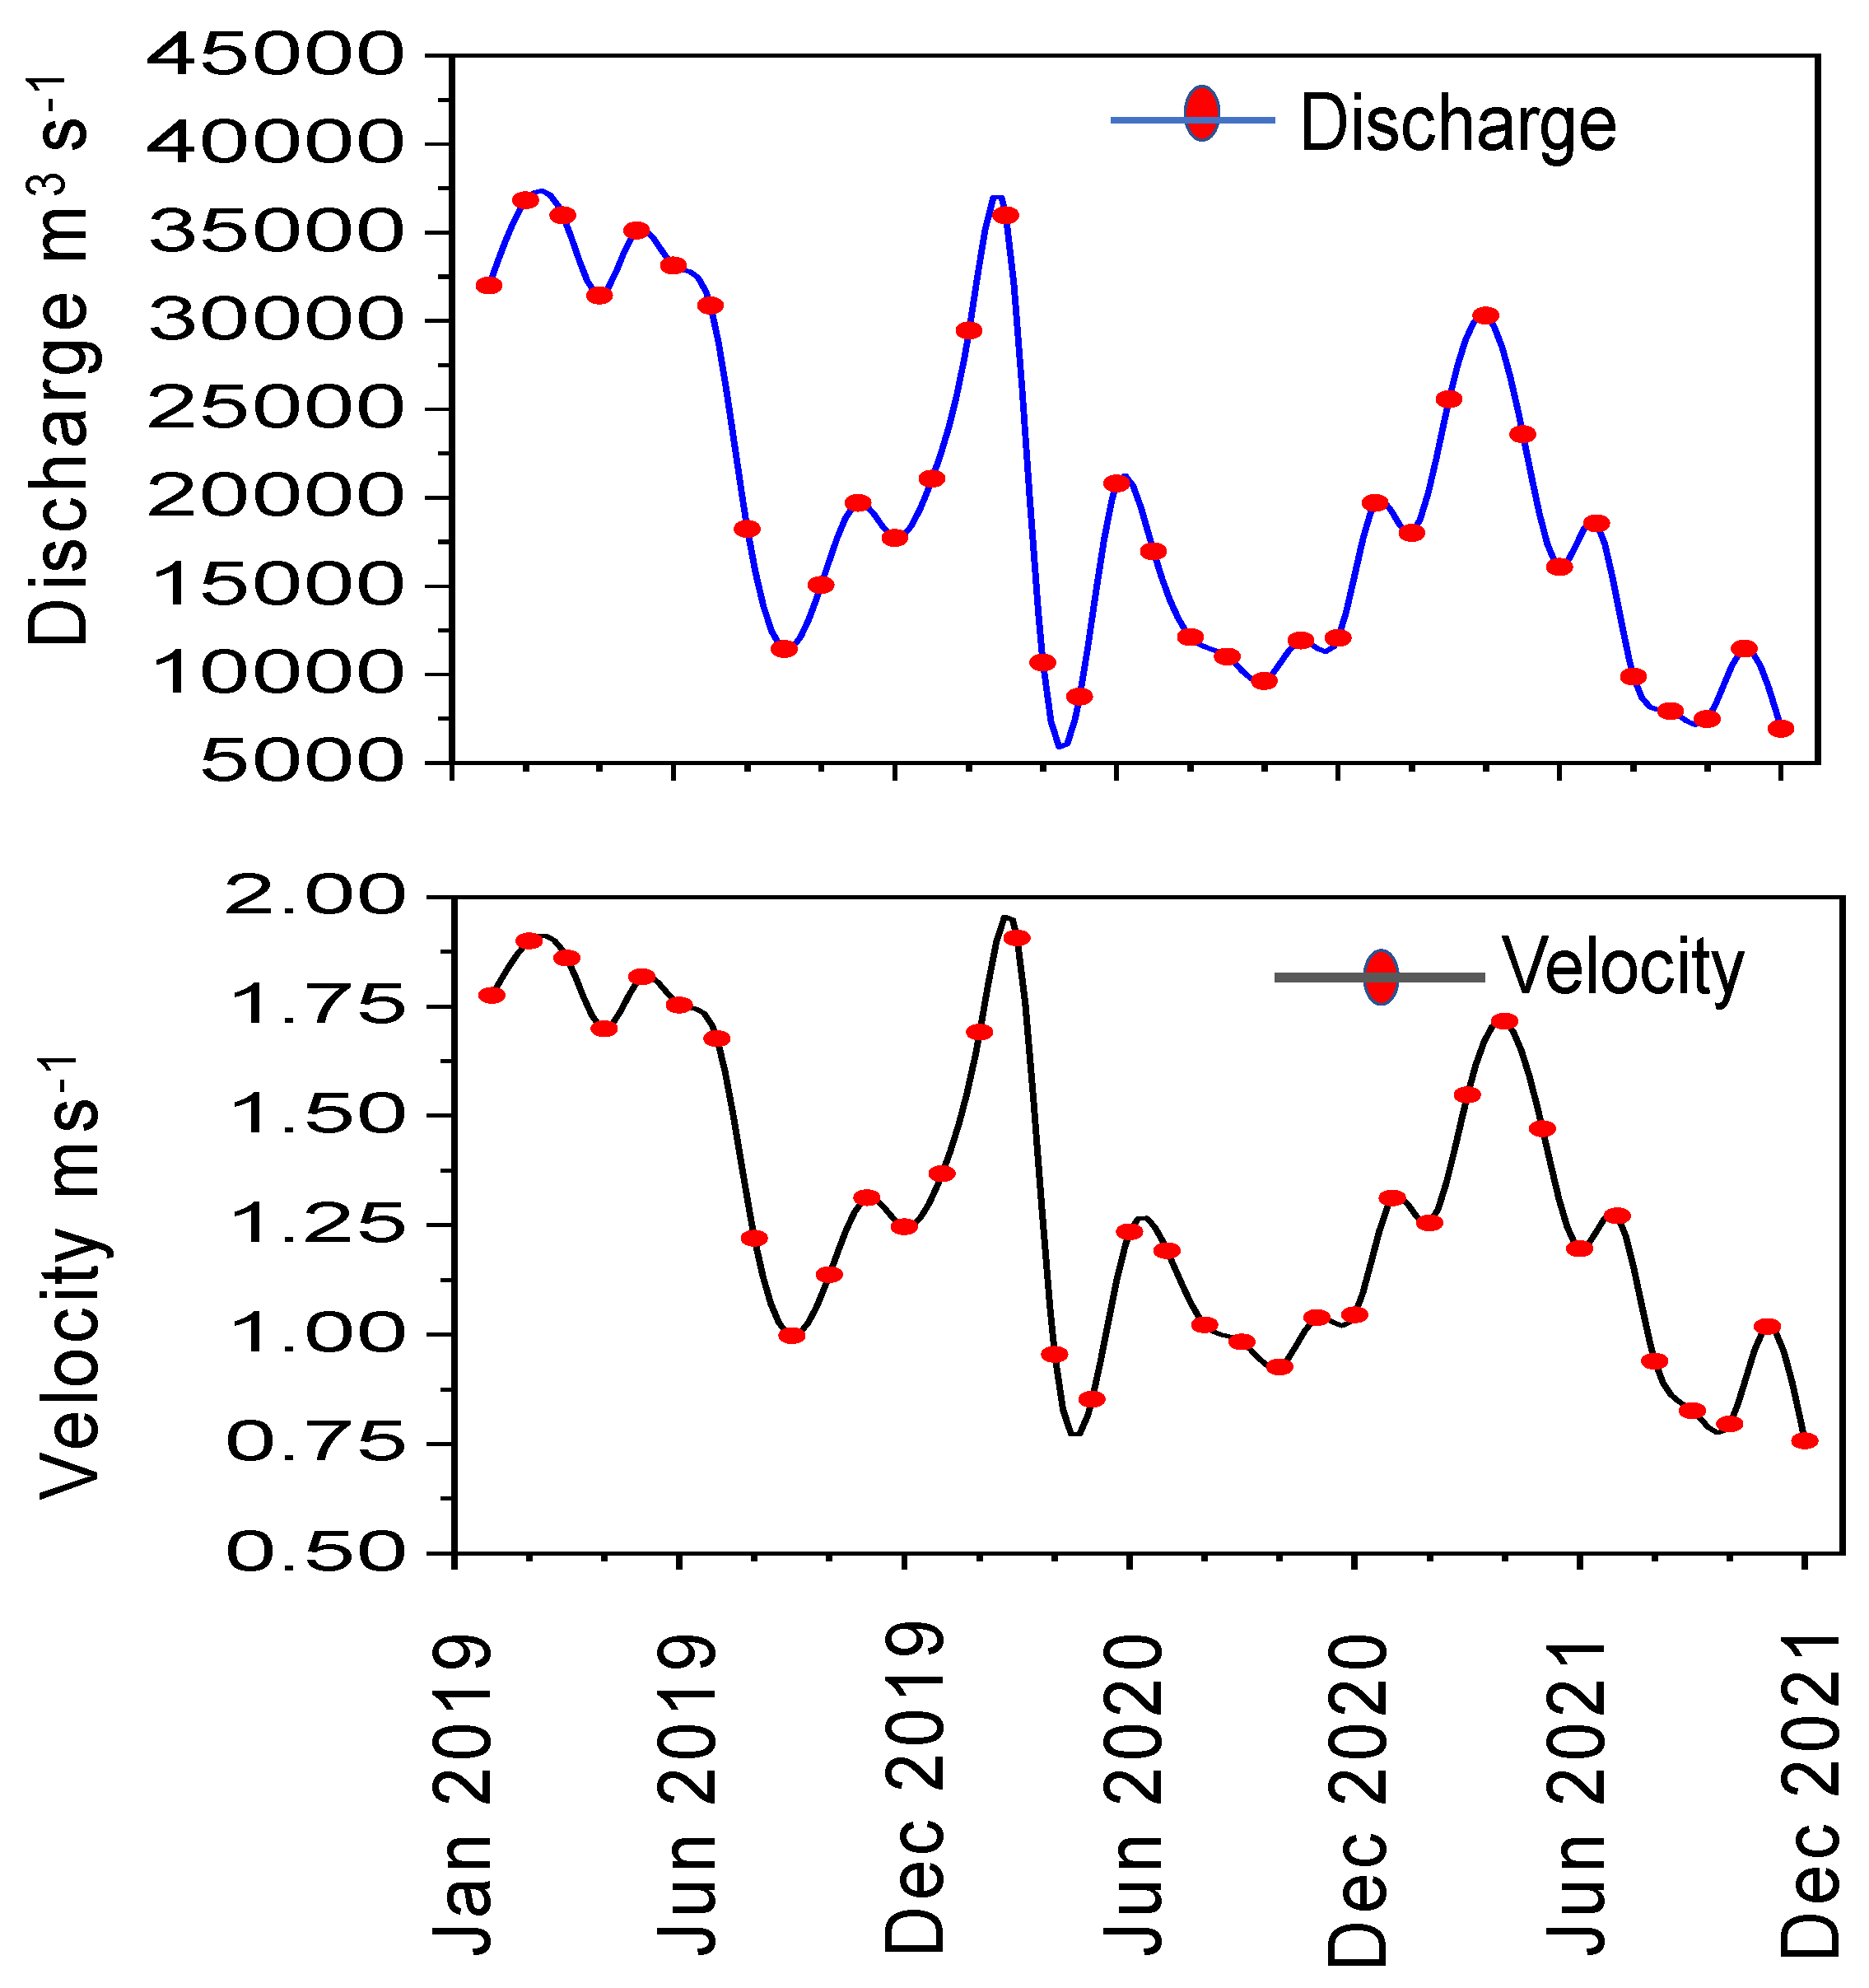
3.1. River Conditions
3.2. Differences in Estimated KT Values
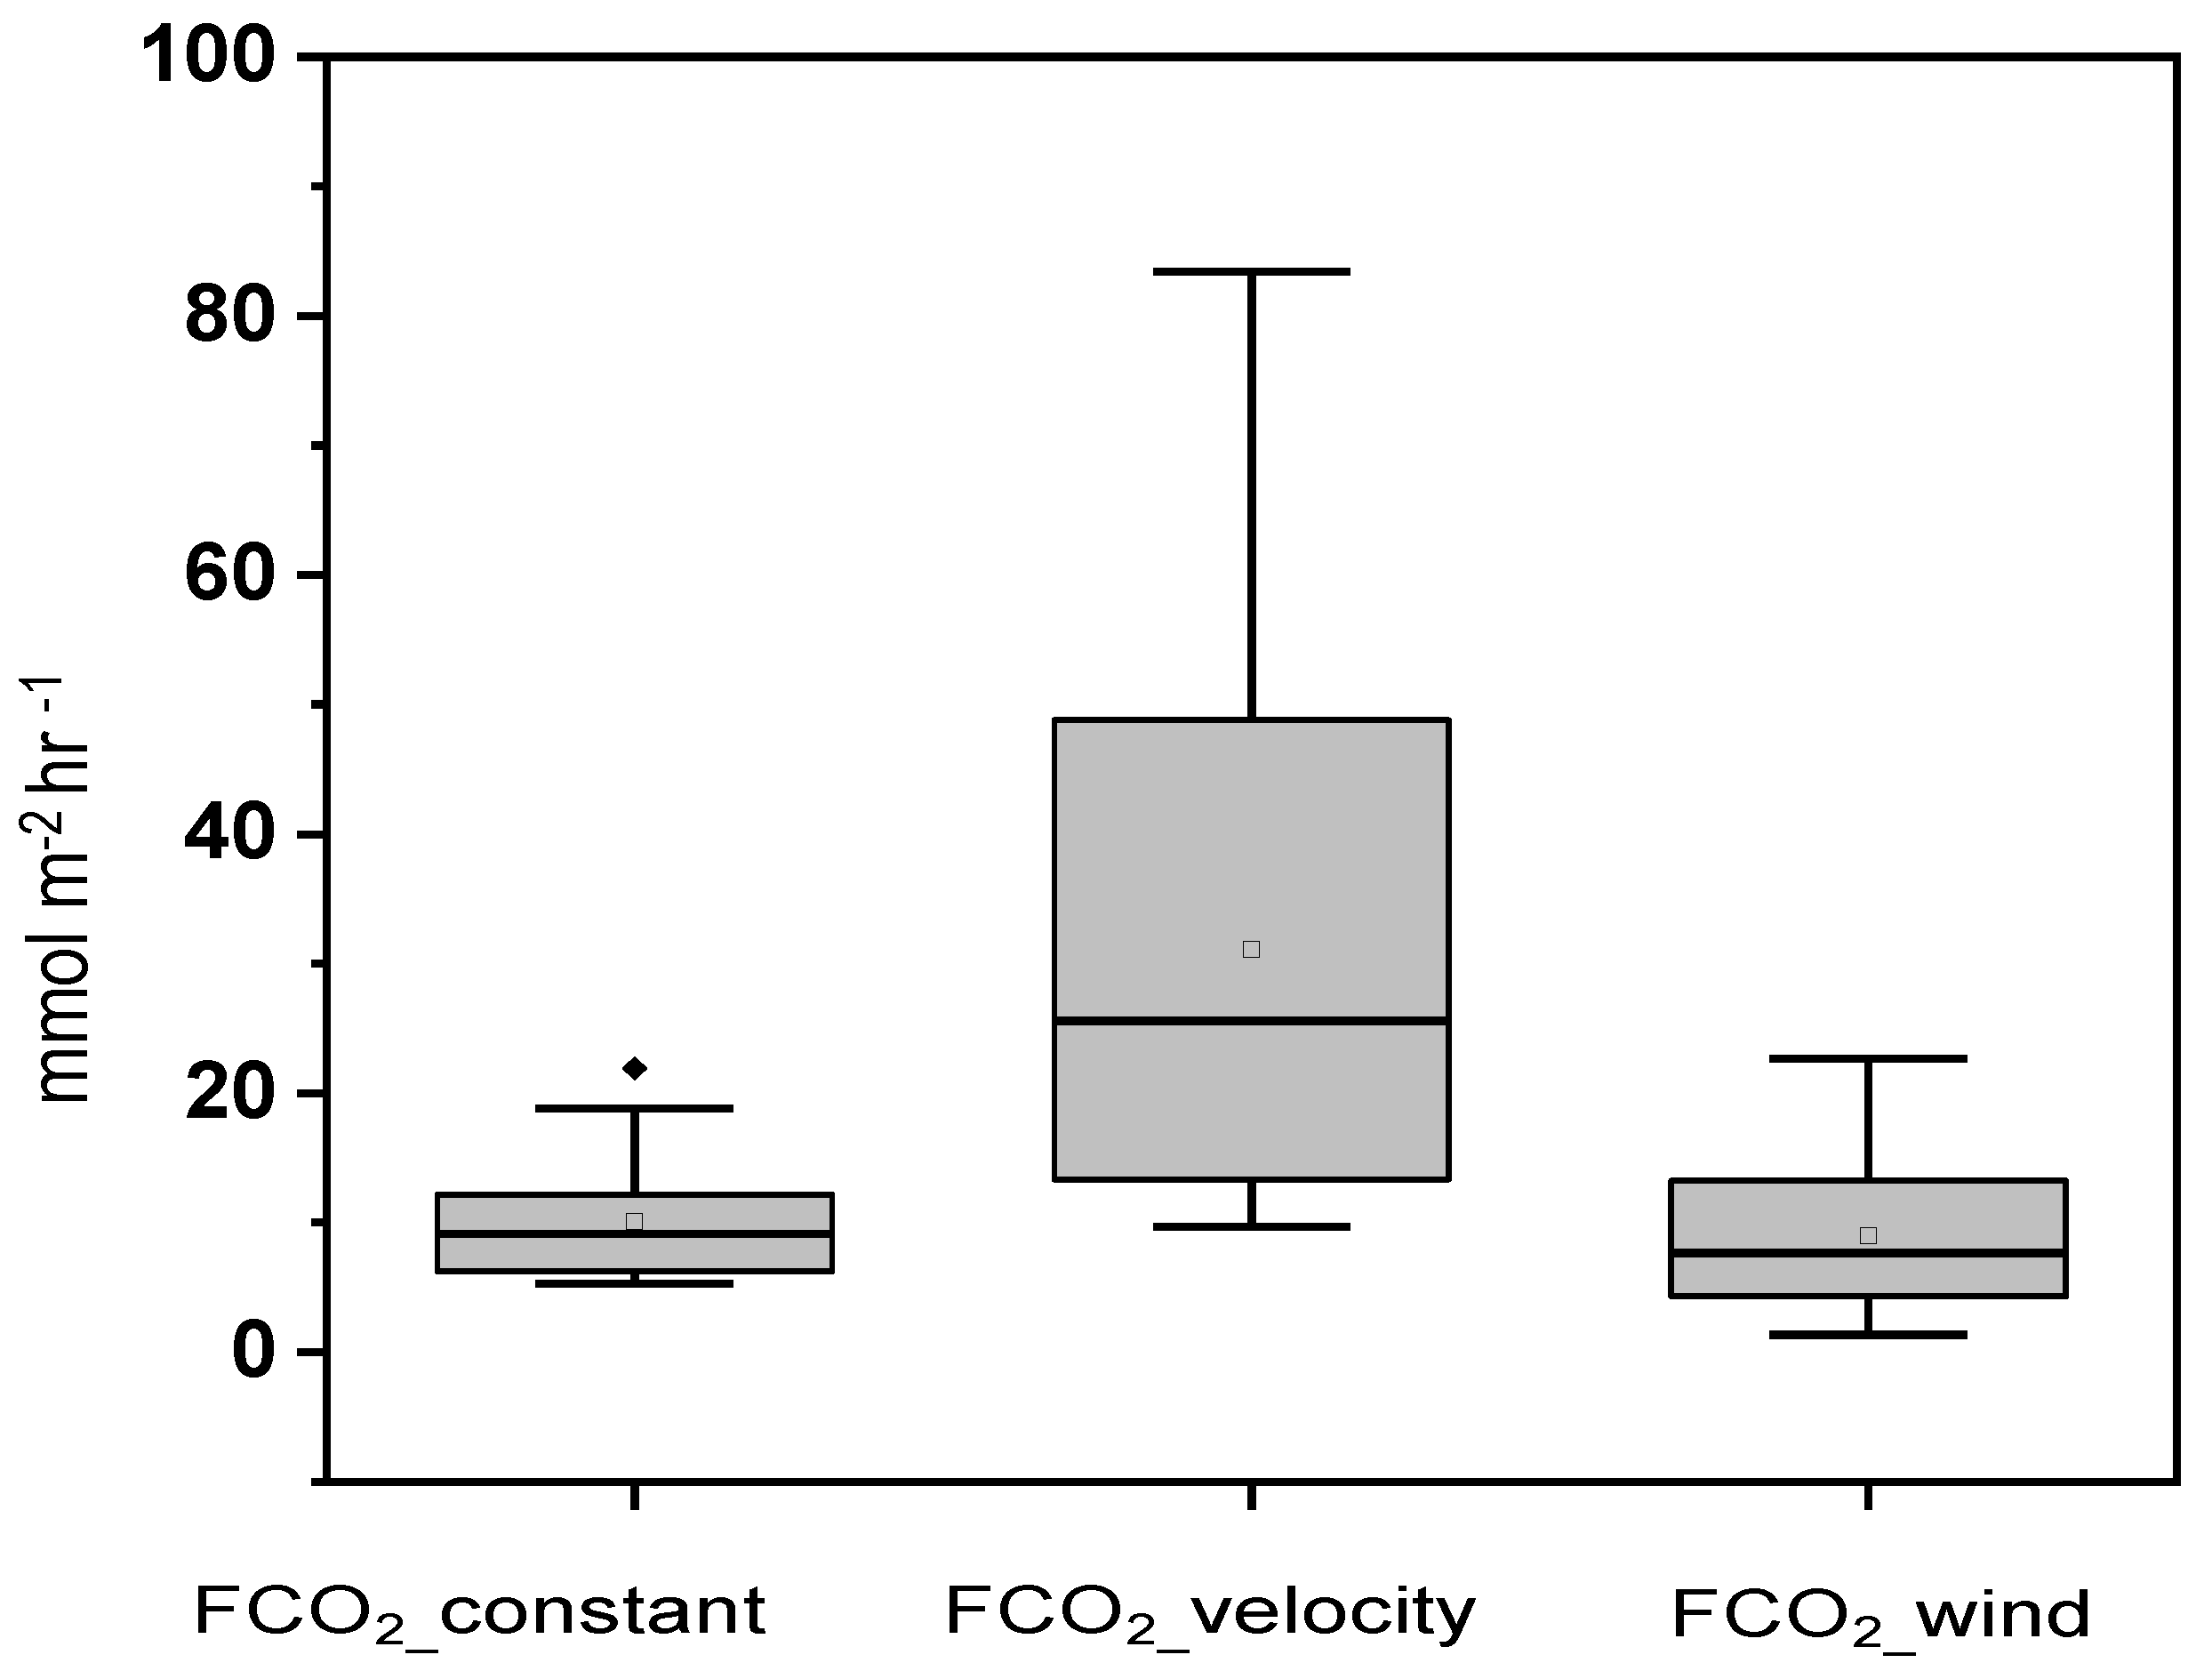
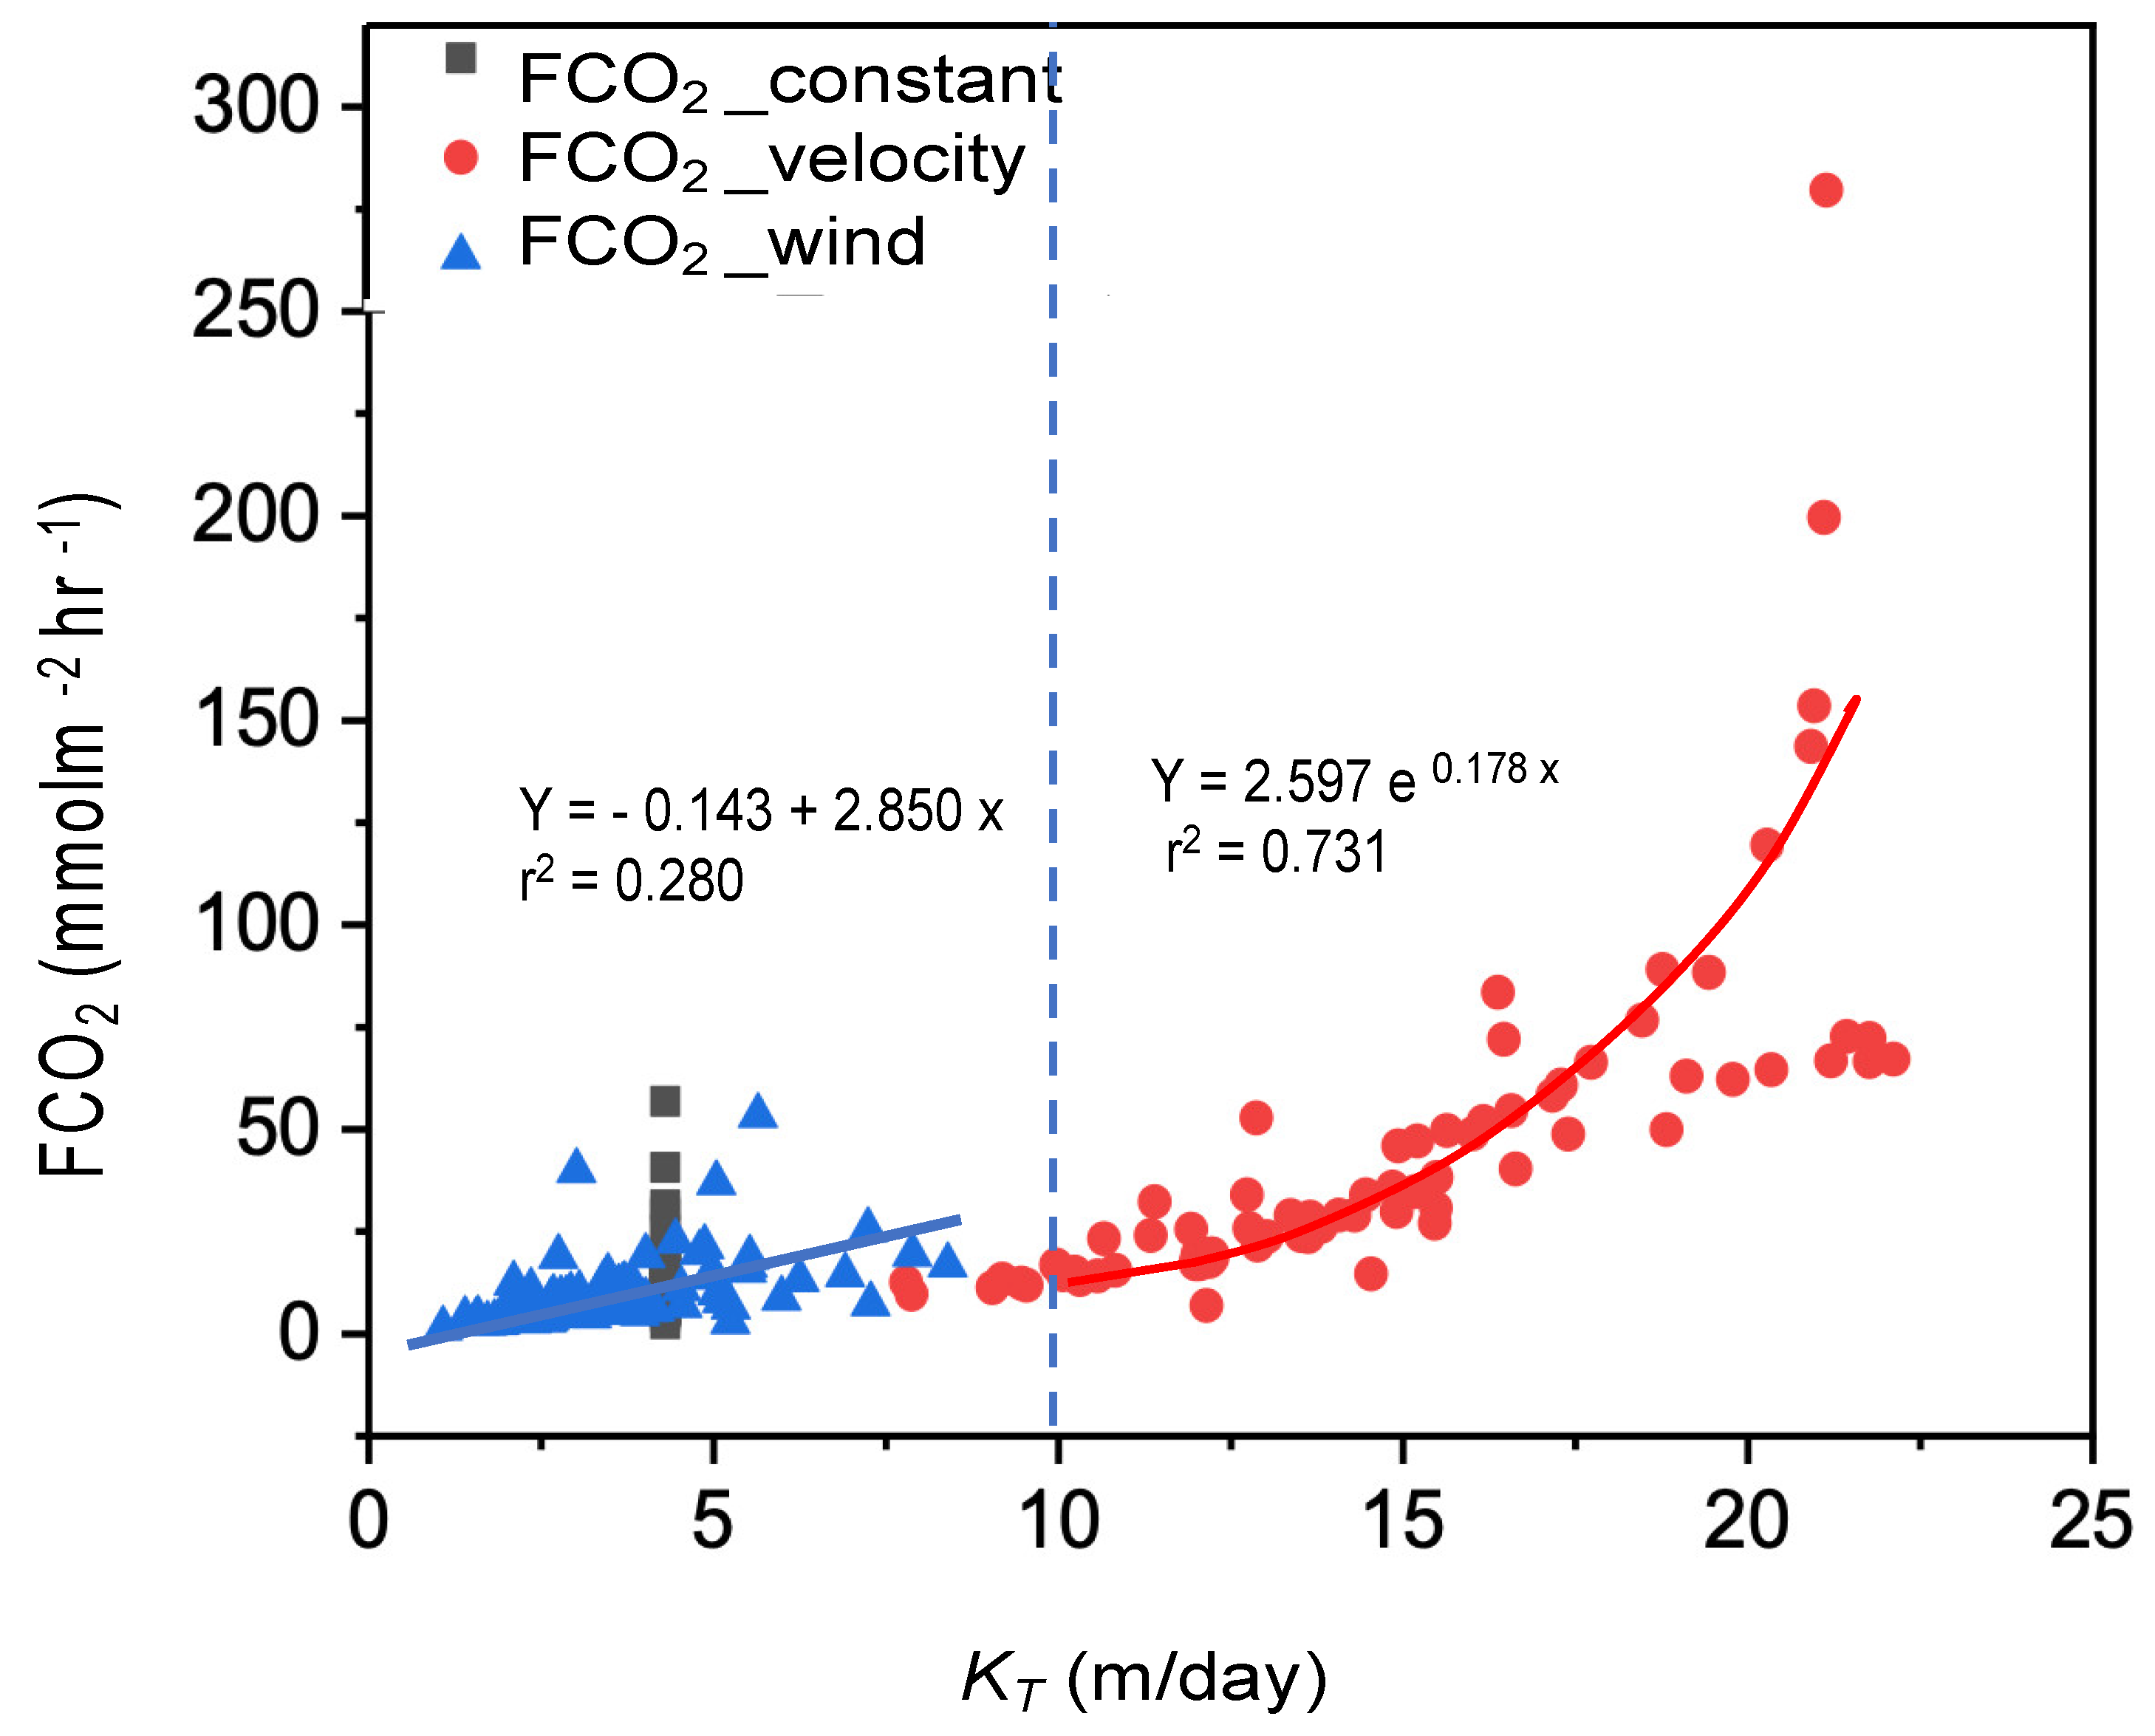
3.3. CO2 Outgassing (FCO2) Estimation with Velocity-Based and Wind-Based KT
4. Discussion
4.1. Variability in Velocity-Based Estimation of KT
4.2. Marginal Effect of Wind Speed on KT Estimation
4.3. KT and FCO2 Differences with Previous Studies
4.4. Limitations and Future Implications
5. Conclusions
Author Contributions
Funding
Data Availability Statement
Acknowledgments
Conflicts of Interest
References
- Richey, J.E.; Melack, J.M.; Aufdenkampe, A.K.; Ballester, V.M.; Hess, L.L. Outgassing from Amazonian rivers and wetlands as a large tropical source of atmospheric CO2. Nature 2002, 416, 617–620. [Google Scholar] [CrossRef] [PubMed]
- Butman, D.; Raymond, P.A. Significant efflux of carbon dioxide from streams and rivers in the United States. Nat. Geosci. 2011, 4, 839–842. [Google Scholar] [CrossRef]
- Li, S.; Luo, J.; Wu, D.; Xu, Y.J. Carbon and nutrients as indictors of daily fluctuations of pCO2 and CO2 flux in a river draining a rapidly urbanizing area. Ecol. Indic. 2020, 109, 105821. [Google Scholar] [CrossRef]
- Reiman, J.H.; Xu, Y.J. Diel Variability of pCO2 and CO2 Outgassing from the Lower Mississippi River: Implications for Riverine CO2 Outgassing Estimation. Water 2019, 11, 43. [Google Scholar] [CrossRef] [Green Version]
- Cole, J.J.; Caraco, N.F. Carbon in catchments: Connecting terrestrial carbon losses with aquatic metabolism. Mar. Freshw. Res. 2001, 52, 101–110. [Google Scholar] [CrossRef] [Green Version]
- Raymond, P.A.; Hartmann, J.; Lauerwald, R.; Sobek, S.; McDonald, C.; Hoover, M.; Butman, D.; Striegl, R.; Mayorga, E.; Humborg, C.; et al. Global carbon dioxide emissions from inland waters. Nature 2013, 503, 355–359. [Google Scholar] [CrossRef] [Green Version]
- Alin, S.R.; Rasera, M.d.F.F.L.; Salimon, C.I.; Richey, J.E.; Holtgrieve, G.W.; Krusche, A.V.; Snidvongs, A. Physical controls on carbon dioxide transfer velocity and flux in low-gradient river systems and implications for regional carbon budgets. J. Geophys. Res. Atmos. 2011, 116. [Google Scholar] [CrossRef]
- Raymond, P.A.; Saiers, J.E.; Sobczak, W.V. Hydrological and biogeochemical controls on watershed dissolved organic matter transport: Pulse-shunt concept. Ecology 2016, 97, 5–16. [Google Scholar] [CrossRef] [Green Version]
- Raymond, P.A.; Oh, N.-H.; Turner, R.E.; Broussard, W. Anthropogenically enhanced fluxes of water and carbon from the Mississippi River. Nature 2008, 451, 449–452. [Google Scholar] [CrossRef] [Green Version]
- Zhang, L.; Xu, Y.J.; Li, S. Source and quality of dissolved organic matter in streams are reflective to land use/land cover, climate seasonality and pCO2. Environ. Res. 2023, 216, 114608. [Google Scholar] [CrossRef]
- Abril, G.; Bouillon, S.; Darchambeau, F.; Teodoru, C.R.; Marwick, T.R.; Tamooh, F.; Omengo, F.O.; Geeraert, N.; Deirmendjian, L.; Polsenaere, P.; et al. Technical Note: Large overestimation of pCO2 calculated from pH and alkalinity in acidic, organic-rich freshwaters. Biogeosciences 2015, 12, 67–78. [Google Scholar] [CrossRef] [Green Version]
- Li, S.; Lu, X.; He, M.; Zhou, Y.; Li, L.; Ziegler, A.D. Daily CO2 partial pressure and CO2 outgassing in the upper Yangtze River basin: A case study of the Longchuan River, China. J. Hydrol. 2012, 466–467, 141–150. [Google Scholar] [CrossRef]
- Wang, J.; Zhou, Y.; Zhou, L.; Zhang, Y.; Qin, B.; Spencer, R.G.M.; Brookes, J.D.; Jeppesen, E.; Weyhenmeyer, G.A.; Wu, F. Urbanization in developing countries overrides catchment productivity in fueling inland water CO 2 emissions. Glob. Chang. Biol. 2023, 29, 1–4. [Google Scholar] [CrossRef]
- Zhang, W.; Li, H.; Xiao, Q.; Li, X. Urban rivers are hotspots of riverine greenhouse gas (N2O, CH4, CO2) emissions in the mixed-landscape chaohu lake basin. Water Res. 2021, 189, 116624. [Google Scholar] [CrossRef]
- Reiman, J.; Xu, Y.J. Dissolved carbon export and CO2 outgassing from the lower Mississippi River–Implications of future river carbon fluxes. J. Hydrol. 2019, 578, 124093. [Google Scholar] [CrossRef]
- Rasera, M.d.F.F.L.; Ballester, M.V.R.; Krusche, A.V.; Salimon, C.; Montebelo, L.A.; Alin, S.R.; Victoria, R.L.; Richey, J.E. Estimating the Surface Area of Small Rivers in the Southwestern Amazon and Their Role in CO2 Outgassing. Earth Interact. 2008, 12, 1–16. [Google Scholar] [CrossRef]
- Xu, Y.J.; DelDuco, E.M. Unravelling the Relative Contribution of Dissolved Carbon by the Red River to the Atchafalaya River. Water 2017, 9, 871. [Google Scholar] [CrossRef] [Green Version]
- Tang, W.; Xu, Y.J.; Ni, M.; Li, S. Land use and hydrological factors control concentrations and diffusive fluxes of riverine dissolved carbon dioxide and methane in low-order streams. Water Res. 2023, 231, 119615. [Google Scholar] [CrossRef]
- Bianchi, T.S.; Filley, T.; Dria, K.; Hatcher, P.G. Temporal variability in sources of dissolved organic carbon in the lower Mississippi river. Geochim. et Cosmochim. Acta 2004, 68, 959–967. [Google Scholar] [CrossRef]
- Dubois, K.D.; Lee, D.; Veizer, J. Isotopic constraints on alkalinity, dissolved organic carbon, and atmospheric carbon dioxide fluxes in the Mississippi River. J. Geophys. Res. Biogeosciences 2010, 115, 90. [Google Scholar] [CrossRef]
- Cai, Y.; Guo, L.; Wang, X.; Aiken, G. Abundance, stable isotopic composition, and export fluxes of DOC, POC, and DIC from the Lower Mississippi River during 2006–2008. J. Geophys. Res. Biogeosciences 2015, 120, 2273–2288. [Google Scholar] [CrossRef] [Green Version]
- Ren, W.; Tian, H.; Cai, W.-J.; Lohrenz, S.E.; Hopkinson, C.S.; Huang, W.-J.; Yang, J.; Tao, B.; Pan, S.; He, R. Century-long increasing trend and variability of dissolved organic carbon export from the Mississippi River basin driven by natural and anthropogenic forcing. Glob. Biogeochem. Cycles 2016, 30, 1288–1299. [Google Scholar] [CrossRef] [Green Version]
- Cai, W.-J.; Wang, Y. The chemistry, fluxes, and sources of carbon dioxide in the estuarine waters of the Satilla and Altamaha Rivers, Georgia. Limnol. Oceanogr. 1998, 43, 657–668. [Google Scholar] [CrossRef]
- Tans, P.; Keeling, R. National Oceanic and Atmospheric Administration Earth System Research Laboratory Global Monitoring Division (NOAA-ESRL). 2021. Available online: https://scholar.google.com/scholar?hl=en&as_sdt=0%2C19&q=Tans%2C+P.%2C+Keeling%2C+R.%2C+2021.+National+Ocean-ic+and+Atmospheric+Administration%2FEarth+System+Research+Laboratory-Global+Monitoring+Division+%28ESRL%2FGMD%29+Mauna+Loa+CO2+records+annual+mean+data.&btnG= (accessed on 22 May 2023).
- Weiss, R. Carbon dioxide in water and seawater: The solubility of a non-ideal gas. Mar. Chem. 1974, 2, 203–215. [Google Scholar] [CrossRef]
- Tang, W.; Xu, Y.J.; Ma, Y.; Maher, D.T.; Li, S. Hot spot of CH4 production and diffusive flux in rivers with high urbanization. Water Res. 2021, 204, 117624. [Google Scholar] [CrossRef] [PubMed]
- Wang, C.; Xv, Y.; Li, S.; Li, X. Interconnected River–Lake Project Decreased CO2 and CH4 Emission from Urban Rivers. Water 2023, 15, 1986. [Google Scholar] [CrossRef]
- Xu, Y.; Xu, Z. Carbon dioxide degassing and lateral dissolved carbon export during the unprecedented 2019 Mississippi river mega flood–Implications for large river carbon transport under future climate. J. Hydrol. 2022, 614, 128650. [Google Scholar] [CrossRef]
- Potter, L.; Xu, Y.J. Variability of Carbon Export in the Lower Mississippi River during an Extreme Cold and Warm Year. Water 2022, 14, 3044. [Google Scholar] [CrossRef]
- Rasera, M.d.F.F.L.; Krusche, A.V.; Richey, J.E.; Ballester, M.V.R.; Victória, R.L. Spatial and temporal variability of pCO2 and CO2 efflux in seven Amazonian Rivers. Biogeochemistry 2013, 116, 241–259. [Google Scholar] [CrossRef]
- Borges, A.V.; Vanderborght, J.-P.; Schiettecatte, L.-S.; Gazeau, F.; Ferrón-Smith, S.; Delille, B.; Frankignoulle, M. Variability of the gas transfer velocity of CO2 in a macrotidal estuary (the Scheldt). Estuaries 2004, 27, 593–603. [Google Scholar] [CrossRef] [Green Version]
- Raymond, P.A.; Cole, J.J. Gas Exchange in Rivers and Estuaries: Choosing a Gas Transfer Velocity. Estuaries 2001, 24, 312–317. [Google Scholar] [CrossRef]
- Li, S.; Mao, R.; Ma, Y.; Sarma, V.V.S.S. Gas transfer velocities of CO2 in subtropical monsoonal climate streams and small rivers. Biogeosciences 2019, 16, 681–693. [Google Scholar] [CrossRef] [Green Version]
- Wanninkhof, R.; McGillis, W.R. A cubic relationship between air-sea CO2 exchange and wind speed. Geophys. Res. Lett. 1999, 26, 1889–1892. [Google Scholar] [CrossRef]
- Joshi, S.; Xu, Y.J. Assessment of Suspended Sand Availability under Different Flow Conditions of the Lowermost Mississippi River at Tarbert Landing during 1973–2013. Water 2015, 7, 7022–7044. [Google Scholar] [CrossRef] [Green Version]
- Rosen, T.; Xu, Y.J. A Hydrograph-Based Sediment Availability Assessment: Implications for Mississippi River Sediment Diversion. Water 2014, 6, 564–583. [Google Scholar] [CrossRef] [Green Version]
- Xu, Z.; Xu, Y.J. A Deterministic Model for Predicting Hourly Dissolved Oxygen Change: Development and Application to a Shallow Eutrophic Lake. Water 2016, 8, 41. [Google Scholar] [CrossRef] [Green Version]
- Wang, B.; Xu, Y.J. Decadal-Scale Riverbed Deformation and Sand Budget of the Last 500 km of the Mississippi River: Insights into Natural and River Engineering Effects on a Large Alluvial River. J. Geophys. Res. Earth Surf. 2018, 123, 874–890. [Google Scholar] [CrossRef]
- Wanninkhof, R. Relationship between wind speed and gas exchange over the ocean revisited. Limnol. Oceanogr. Methods 2014, 12, 351–362. [Google Scholar] [CrossRef]
- Ran, L.; Lu, X.X.; Yang, H.; Li, L.; Yu, R.; Sun, H.; Han, J. CO2outgassing from the Yellow River network and its implications for riverine carbon cycle. J. Geophys. Res. Biogeosciences 2015, 120, 1334–1347. [Google Scholar] [CrossRef]
- Raymond, P.A.; Zappa, C.J.; Butman, D.; Bott, T.L.; Potter, J.; Mulholland, P.; Laursen, A.E.; McDowell, W.H.; Newbold, D. Scaling the gas transfer velocity and hydraulic geometry in streams and small rivers. Limnol. Oceanogr. Fluids Environ. 2012, 2, 41–53. [Google Scholar] [CrossRef]
- Wanninkhof, R. Relationship between wind speed and gas exchange over the ocean. J. Geophys. Res. Atmos. 1992, 97, 7373–7382. [Google Scholar] [CrossRef] [Green Version]


| Low | Action | Intermediate | High | Peak | |
|---|---|---|---|---|---|
| Flow Stage (m) | <9.8 | 9.8–12.1 | 12.1–14.6 | 14.6–16.8 | >16.8 |
| Discharge Range (m3 s−1) | <13,000 | 13,000–18,000 | 18,000–25,000 | 25,000–32,000 | >32,000 |
| Constant | Velocity-Based | Wind-Based | ||
|---|---|---|---|---|
| K600 | Min | 9.67 | 1.07 | |
| (m/day) | Max | 19.33 | 7.89 | |
| Mean ± SD | 14.34 ± 3.70 | 3.81 ± 1.50 | ||
| KT | Min | 4.3 | 7.80 | 0.77 |
| (m/day) | Max | 4.3 | 22.11 | 8.40 |
| Mean ± SD | 4.3 | 14.61 ± 3.76 | 3.65 ± 1.60 |
| Constant | Velocity-Based | Wind-Based | ||
|---|---|---|---|---|
| FCO2 | Min | 2.42 | 6.8 | 1.32 |
| (mmol m−2 h−1) | Max | 56.87 | 280 | 53.40 |
| Mean ± SD | 11.64 ± 8.15 | 44.36 ± 43 | 10.05 ± 8.65 |
| Differences | Lower | Upper | p | |
|---|---|---|---|---|
| FCO2_velocity-FCO2_constant | 32.71 | 23.15 | 42.27 | p < 0.05 |
| FCO2_wind-FCO2_constant | −1.59 | −11.15 | 7.97 | p > 0.05 |
| FCO2_wind-FCO2_velocity | −34.30 | −43.86 | −24.74 | p < 0.05 |
| Study Period | Q | pCO2 | FCO2 | KT | References |
|---|---|---|---|---|---|
| km3 yr−1 | μatm | g C m 2 yr −1 | m/day | ||
| 2019–2021 | 637 | 2139 ± 1454 | 1224 | 4.3 | |
| 4667 | KT_velo 14.6 ± 3.8 | This Study | |||
| 1057 | KT_wind 3.65 ± 1.60 | ||||
| 2021 | 500 | 1703 ± 646 | 864.6 | 3.9 | [29] |
| 2019 Flood | 634 | 2217 ± 805 | 777 | 4.3 | [28] |
| 705 | 3.9 | ||||
| 2015–2018 | 548 | 1500 ± 743 | 654 | 3.9 | [15] |
| 2000–2001 | 374 | 1363 ± 267 | 1036 | 3.9 | [20] |
Disclaimer/Publisher’s Note: The statements, opinions and data contained in all publications are solely those of the individual author(s) and contributor(s) and not of MDPI and/or the editor(s). MDPI and/or the editor(s) disclaim responsibility for any injury to people or property resulting from any ideas, methods, instructions or products referred to in the content. |
© 2023 by the authors. Licensee MDPI, Basel, Switzerland. This article is an open access article distributed under the terms and conditions of the Creative Commons Attribution (CC BY) license (https://creativecommons.org/licenses/by/4.0/).
Share and Cite
Dristi, A.; Xu, Y.J. Large Uncertainties in CO2 Water–Air Outgassing Estimation with Gas Exchange Coefficient KT for a Large Lowland River. Water 2023, 15, 2621. https://doi.org/10.3390/w15142621
Dristi A, Xu YJ. Large Uncertainties in CO2 Water–Air Outgassing Estimation with Gas Exchange Coefficient KT for a Large Lowland River. Water. 2023; 15(14):2621. https://doi.org/10.3390/w15142621
Chicago/Turabian StyleDristi, Anamika, and Y. Jun Xu. 2023. "Large Uncertainties in CO2 Water–Air Outgassing Estimation with Gas Exchange Coefficient KT for a Large Lowland River" Water 15, no. 14: 2621. https://doi.org/10.3390/w15142621