Article

Study on the Evolution of Risk Contagion in Urban River Ecological Management Projects Based on SEIRS

1
State Key Laboratory of Eco-Hydraulics in Northwest Arid Region, Xi’an University of Technology, Xi’an 710048, China
2
Research Center of Eco-Hydraulics and Sustainable Development, The New Style Think Tank of Shaanxi Universities, Xi’an 710048, China
3
Department of Engineering Management, Xi’an University of Technology, Xi’an 710048, China
*
Author to whom correspondence should be addressed.
Water 2023, 15(14), 2622; https://doi.org/10.3390/w15142622
Submission received: 26 June 2023 / Revised: 16 July 2023 / Accepted: 17 July 2023 / Published: 19 July 2023
(This article belongs to the Special Issue Application of Artificial Intelligence in Hydraulic Engineering)

Abstract

:
The risk transmission mechanisms of urban river ecological management engineering projects are examined in this study. Using the Susceptible Exposed Infectious Recovered Susceptible (SEIRS) model for risk transmission, a model of risk propagation delay for urban river ecological management engineering projects on scale-free networks is developed, which takes into account the effects of risk propagation and delay. We conducted a steady-state analysis of the model and obtained the basic reproduction number R. When R > 1, the equilibrium point of risk outbreak is stable, and when R < 1, the equilibrium point of risk disappearance is stable. Numerical simulations of the model were conducted using the MATLAB2022b to reveal the dynamic propagation patterns of risk in urban river ecological management engineering projects. The research results show that the steady-state density of the infected nodes in the network increases with the increase in the effective propagation rate and the propagation delay time; the propagation delay reduces the risk propagation threshold in the network and accelerates the occurrence of the equilibrium state of risk outbreak. There is a correlation between the transmission rate of latent nodes and the transmission rate of infected nodes, and the effective transmission rate of latent nodes has a greater influence on risk propagation. The spread of risk in the network can be effectively controlled and mitigated with targeted immunity for susceptible nodes. This article, based on the theory of complex networks and the mean-field theory, takes into account the propagation delay and spreading of latent nodes. Building a D-SEIRS model for risk propagation broadens the research perspective on urban river ecological management risk propagation.

1. Introduction

The urban river ecological governance project is a relatively complex project. When construction projects are developed, designed, constructed, and accepted, risks are present at every stage. The urban river ecological management project’s risk network is a complex system with complex interactions between the risk factors, forming a complex network structure [1]. The interaction path between the risk factors provides a path for the spread of risk in the network. When a risk factor presents a risk state, it may spread the risk to its associated risk factors through interaction [2]. This will lead to the spread of risks across the entire network and may have a chain reaction and amplification effect, leading to the outbreak of risks in projects. It is therefore necessary to study the mechanism of risk propagation in urban river ecological management projects so that project risks can be managed and high-quality urban river ecological management projects can be developed and constructed by the departments involved in the project in a quality manner.
Transmission dynamics is a theoretical approach to the quantitative study of infectious diseases. It is possible to study the transmission dynamics of complex networks using mathematical models of epidemic transmission. At present, research on risk transmission is attracting extensive attention from scholars in different fields, including information transmission, internet rumor transmission, financial market risk transmission, corporate risk transmission, rumor transmission risk, and public opinion transmission risk, in addition to infectious diseases. Wang et al. [3] proposed the SIRaRu model and demonstrated that there is a diffusion threshold for all of them in the network and that the network topology has a significant effect on rumor propagation. Tian et al. [4] designed the super SIC model and its evolutionary law based on an opinion super network containing social, environmental, psychological, and opinion sub-networks, drawing on the modeling ideas of the SIR model and introducing rumor clarifiers. Jeon et al. [5] found that multinational banks can transfer financial risk from their parent companies to their foreign subsidiaries through their internal funding markets. Mingyuan et al. [6] used the SIR model as the basic prototype to construct a transmission model SIR-C applicable to unsafe behaviors of workers in construction and explored the transmission characteristics and intervention effects of unsafe behaviors. A model of time-encroaching behavior has been proposed by He et al. [7], which discusses the propagation of time-encroaching behavior in BA scale-free networks, ER random networks, NW small-world networks, and WS small-world networks. This scholars’ research has also linked the spread of rumors to the topological nature of social networks. An analysis of rumor transmission on small-world networks was conducted by Zanette [8]. Rumors are spread through pairwise interactions between the purveyor and others through the crowd. When interacting with another spreader or choker, the ignorant person may become infected and spread the rumor. SIR reflects the interactions between rumors and has made advances and applications in the field of information dissemination [9,10]. Since the SIR model was proposed by Kermack and McKendrick in 1927 in their study of the Black Death epidemic in London and its optimization in 1932 with the SIS model [11], researchers have proposed models such as SIRS [12] and SEIR [13]. Lu Miao et al. [14] used a clustering algorithm to cluster the data in the key nodes, based on which an SIS model was constructed and through which the simulation of the evolution of public opinion in group social networks was completed. The results of the research show that the method accurately obtains the number of opinion propagations, search indexes, and high accuracy evolutionary simulations. By constructing a SEIS model with a defined latent period, Li et al. [15] demonstrated that the latent endemic equilibrium point is local and progressive. Yu [16] and Khalkho [17] established the SEIRS model, which is infectious and rehabilitative during both the incubation and infection periods. An infectious disease model was developed by Deng and colleagues [18] to study the transmission mechanism of online mass events.
Domestic and foreign scholars have made a large number of contributions to the study of risk transfer, as well as infectious diseases. Literature analysis shows that only a few scholars have applied the infectious disease model to the risk transfer of construction projects, especially for urban river ecological management. The mechanism of the transmission of infectious diseases is that the source of the disease enters the susceptible population through a certain pathway, which in turn spreads among the population, and the infected person shows different physiological responses depending on his or her immunity [19]. Risk transmission in urban river ecological management projects is similar to infectious disease transmission. During the project construction process, the project risks are easily transmitted to the downstream participants, there is a certain latent period before the project risks occur, and they have been in a hidden state before the risks are revealed. A complex set of internal and external influencing factors, coupled with a dynamic transmission process, constantly changes the node state, making the project risk transmission appear complex. The risk contagion SEIRS model constructed by Xiao Qin et al.’s [20] study on the risk propagation mechanism of amphibious seaplane take-off and landing safety has implications for the research conducted in this paper. Some of the existing studies on infectious disease models have been carried out from the perspectives of both the infectiousness of latency and the delayed nature of risk transmission, respectively. In urban river ecological management projects, the impact of infectious latency and delayed risk transmission on the systemic risk transmission dynamics has not yet been examined.
This article begins by studying the risk evolution in urban river ecological management projects. Based on the existing research, it considers the internal mechanism and influencing factors of risk transmission, as well as the dynamic evolution process of risk. Using principles from infectious disease dynamics, a project risk transmission model based on SEIR is established. By solving the transmission threshold, the analysis and simulation examine the impact of the risk delay time and risk infection rate on the project risk transmission process. This model provides a basis for the effective supervision and control of project participants and theoretical support for indirect supervision and mid-term and post-event supervision. Figure 1 depicts the study’s general structure.
The rest of the paper if organized as follows. The proposed complex network model is constructed in Section 2 and its characteristics are analyzed. In Section 3, we construct an SEIE-based risk contagion model for urban river ecological management projects. In Section 4, the numerical simulations are presented. In Section 5, we discuss the topic. Section 6 concludes our study.

2. Complex Network of Risks

2.1. Risk Identification

Projects to manage urban rivers ecologically are complex and require high levels of technology; therefore, the risk points are not only diverse, but the factors are often coupled. As a result, project implementation risks are also usually uncontrollable and can lead to large economic losses. The data selected for this paper are mainly obtained from the following sources.
(1)
The CNKI and VIP databases are searched for relevant academic papers published between 2011–2022 [21,22,23], from which all the possible risks in urban river ecological management projects are summarized [24,25].
(2)
The list of common problems in the inspection of water conservancy project construction management (2020, Ministry of Water Resources).
(3)
Accident investigation report of the safety production management platform of construction units.
Based on the literature and social research, this paper establishes a risk factor system for river ecological management projects from four aspects: project concept [26,27], project decision [28,29], project preparation [30,31], and project implementation [31,32]. Table 1 displays the findings, which reveal that there are 53 risk factors overall and 4 risk stages in the index system.

2.2. Complex Network Construction and Characterization

2.2.1. Construction of Risk Networks

There are nodes and edges in complex networks that represent the influences and their interrelationships. In this way, a complex network can be constructed objectively. Empirical network construction, time series network construction, and correlation coefficient network construction are common methods of network construction [33]. A questionnaire and other forms of research and judgment are used in the empirical network-building method to rate the influencing factors in Table 1. Experts make judgments based on their experience of the influencing factors. If the experts consider them to be relevant, then they are linked; if not, then they are not. In this study, empirical network-building is used.
The columns of the risk factor relationship data matrix are the emitters (causes) and the rows of the matrix are the affected parties (effectors); Relationships are indicated by “1” when they exist, and by “0” when they do not exist. Let there be n risk nodes in risk element set A:  A h = ( R 1 , R 2 , , R h )  is a set of risk factors for the row;  A m = ( R 1 , R 2 , , R m )  is for the set of risk elements, and  b i j  is the binary relational data. The number of rows in the matrix is  i  and the number of columns is  j , i = 1,2 , 3 , , n , j = 1,2 , 3 , , n .
b i j = 1 . That is, the risk element in row  i  has an effect on the risk element in column  j .
b i j = 1  means that the risk element in row  i  does not affect the risk element in column  j .
The expert scoring method was used to determine the risk adjacencies for the urban river ecological management project (Table 2).

2.2.2. Network Characteristics and Network Visualization

The MATLAB2022b is used to analyze a large amount of network parameter data for projects, which identifies the key risk factors, as well as the overall characteristics of the network. The results are presented in Table 3.
Based on the adjacency matrix, MATLAB2022b is used to generate a risk network topology diagram for the urban river ecological management project, as shown in Figure 2.
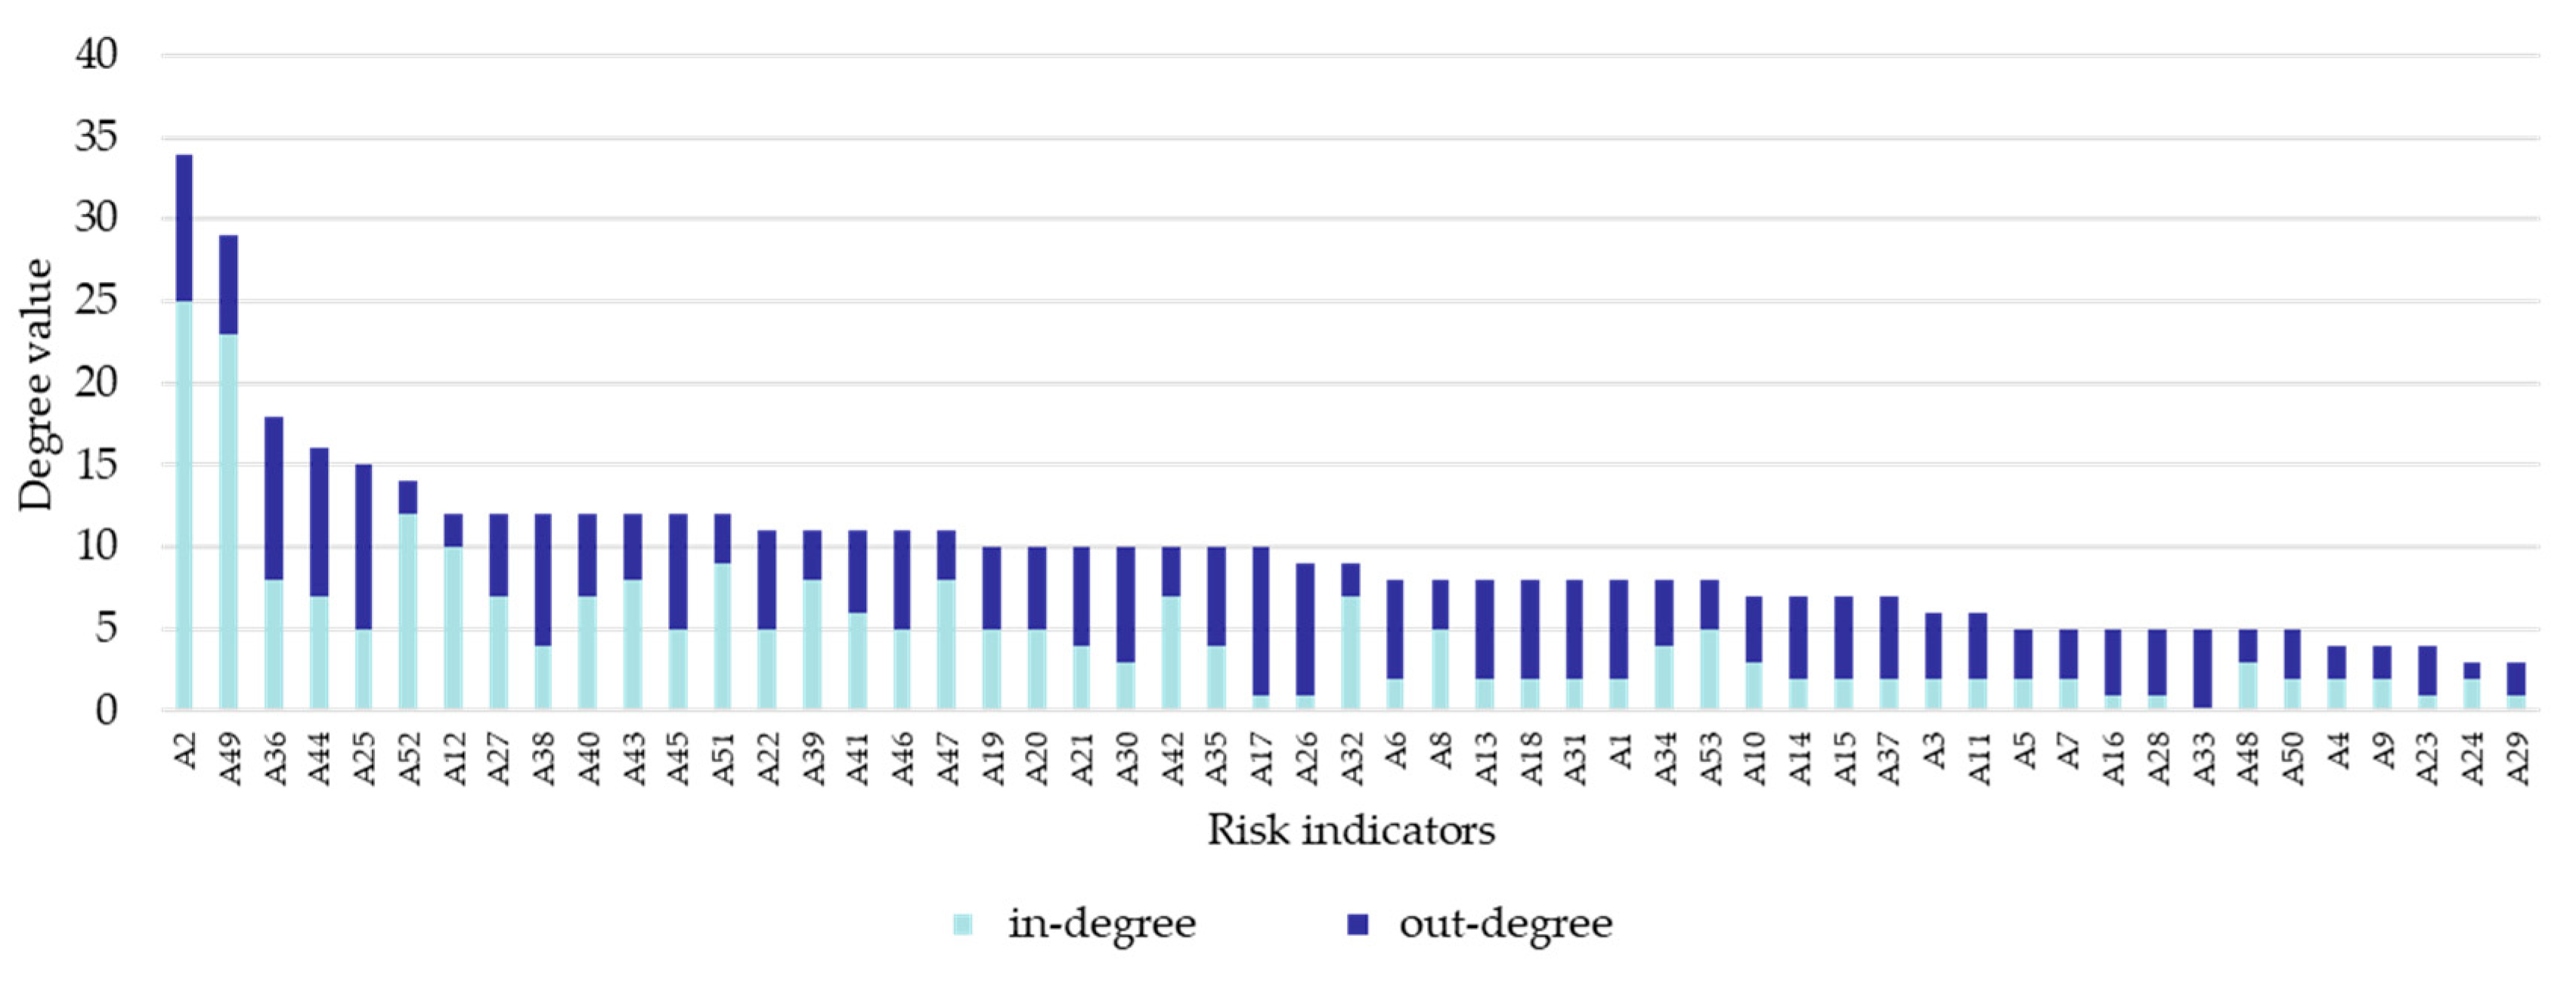
Degree describes the centrality of nodes in a network and is a simple, but important, concept. The degree indicates how many other nodes a node is connected to, and the degree indicates how influential that node is. Based on the directed network definition, degrees can be categorized into the following three types: in-degree, out-degree, and degree. The higher the incidence value of a node, the more vulnerable it is to external influences. The out-degree value can be represented by the number of neighboring edges that the node connects outwards; the larger the out-degree value of the node, the more likely it is to affect other nodes. The sum of the in-degree and out-degree is the degree of the node. The degree value distribution of each risk node in the urban river ecological management project was calculated and obtained.
According to the degree ranking chart in Figure 3, the nodes with larger degrees are listed in order as: A2—laws and regulations risk; A49—schedule delay risk; A36—engineering technology risk; A44—contract management and implementation risk. The risk of each of these on the other risk factors have a greater impact.

2.3. Analysis of Risk Propagation and Delay Effects

2.3.1. Propagation Effects

The risks associated with urban river ecological management projects can propagate from one node to downstream nodes, leading to cascading effects and amplification, ultimately impacting the overall construction project quality. Therefore, effective project risk management should take into account the risk transfer effects. An analysis of the topological relationships of urban river ecological management project risks has been conducted previously. Risk evolution in urban river ecological management projects exhibits characteristics of biological contagion, and the transmission behavior between risk factors is similar to virus diffusion. Firstly, the transmission environment is similar. Viruses are transmitted in social networks, with “people” as nodes, and the transmission channel is the contact between people. Moreover, in the process of interaction, the risk factors may make the risk nodes—which were in a stable state—become potential risk outbreaks or risk outbreak nodes. Secondly, the propagation process is similar. The propagation of a virus is carried out through the virus body to its neighbors, who then continue to propagate to their neighboring nodes, and do not spread across nodes. Risk propagation in urban river ecological management projects is also the propagation of initial risks to its neighboring nodes’ risk factors, which eventually leads to outbreaks. Thirdly, the results of propagation are similar. There are similarities between the propagation characteristics and evolutionary laws of urban river ecological management projects and the spread of viruses on social networks, which makes it possible to apply the propagation model of complex networks to the evolution of risk in urban river ecological management projects.
The SEIR model is frequently used to explain how infectious diseases spread. In construction projects, this model can be used to describe the process of risk propagation. The SEIR model consists of four stages: susceptible, exposed, infectious, and recovered. In construction projects, these states can be interpreted as follows: susceptible—that is, not affected by the risk but potentially susceptible; exposed—exposed to the risk but negative effects have not yet occurred; infectious—negative effects of the risk have already appeared, such as personal injury or property damage; recovered—having recovered from the effects of the risk and no longer affected by it.
Based on the SEIR model, risk propagation in construction projects can be described as follows: Initial risk—there may be potential risks in construction projects, such as engineering quality and safety management. These risks can be considered as “infectious sources” and become the infectious state. Risk propagation—once the initial risk has a negative impact, such as an engineering accident or quality issue, these negative impacts may spread to other personnel or stakeholders, such as project participants, government regulatory departments, media, etc. These personnel or stakeholders can be considered as “susceptible” and potentially exposed to the risk of infection. Risk exposure—once other personnel or stakeholders come into contact with the negative impact, such as learning about the occurrence of engineering accidents or quality issues, they are in an exposed state. At this stage, they have not yet suffered direct negative impacts but may face future risks. Risk impact—once other personnel or stakeholders are negatively impacted, such as suffering from the effects of engineering accidents or quality issues, they are in the infectious state. At this stage, they may face negative impacts such as personal injury and property damage. Risk management—once the infectious parties are affected by the risks and recover, they enter the recovered state. At this stage, risk management measures can help prevent future risks.

2.3.2. Delay Effects

The risks associated with urban river ecological management projects can occur at any node in the complex network. Risk generation in urban river ecological management projects is possible, but the interference of other factors can delay it. The delayed effect of risk in urban river ecological management projects in this paper refers to when the risk occurs at one or some nodes in the network and is not manifested because the risk outbreak threshold of other nodes has not been reached or the relevant units have taken temporary control measures on these nodes so that they are concealed until the risk outbreak. Risks at certain nodes do not directly characterize themselves or lead to the outbreak of risks at other nodes, but rather accumulate and eventually lead to the creation of risks. This shows that risk has a delayed effect.

3. SEIRS-Based Risk Contagion Model for Urban River Ecological Management

3.1. Model Assumptions

Based on the transmission principle of infectious diseases and the risk scale-free network topology characteristics of urban river ecological governance projects, the following assumptions are made for this study.
Hypothesis 1.
The nodes in the scale-free network of urban river ecological management projects are divided into four categories: susceptible class S, latent class E (already infected with the risk but not manifested, but with the ability to transmit the risk), infected class I, and immune class R (the risk is eliminated and has some ability to resist the risk, but cannot always resist and may still become susceptible); denoting  S k t ,  E k t ,  I k t ,  R k t  as the densities of the four classes of individuals in nodes of degree k at time t, and meets  S k t + E k t + I k t + R k t = 1 ,   0 S k t , E k t , I k t , R k t 1 .
Hypothesis 2.
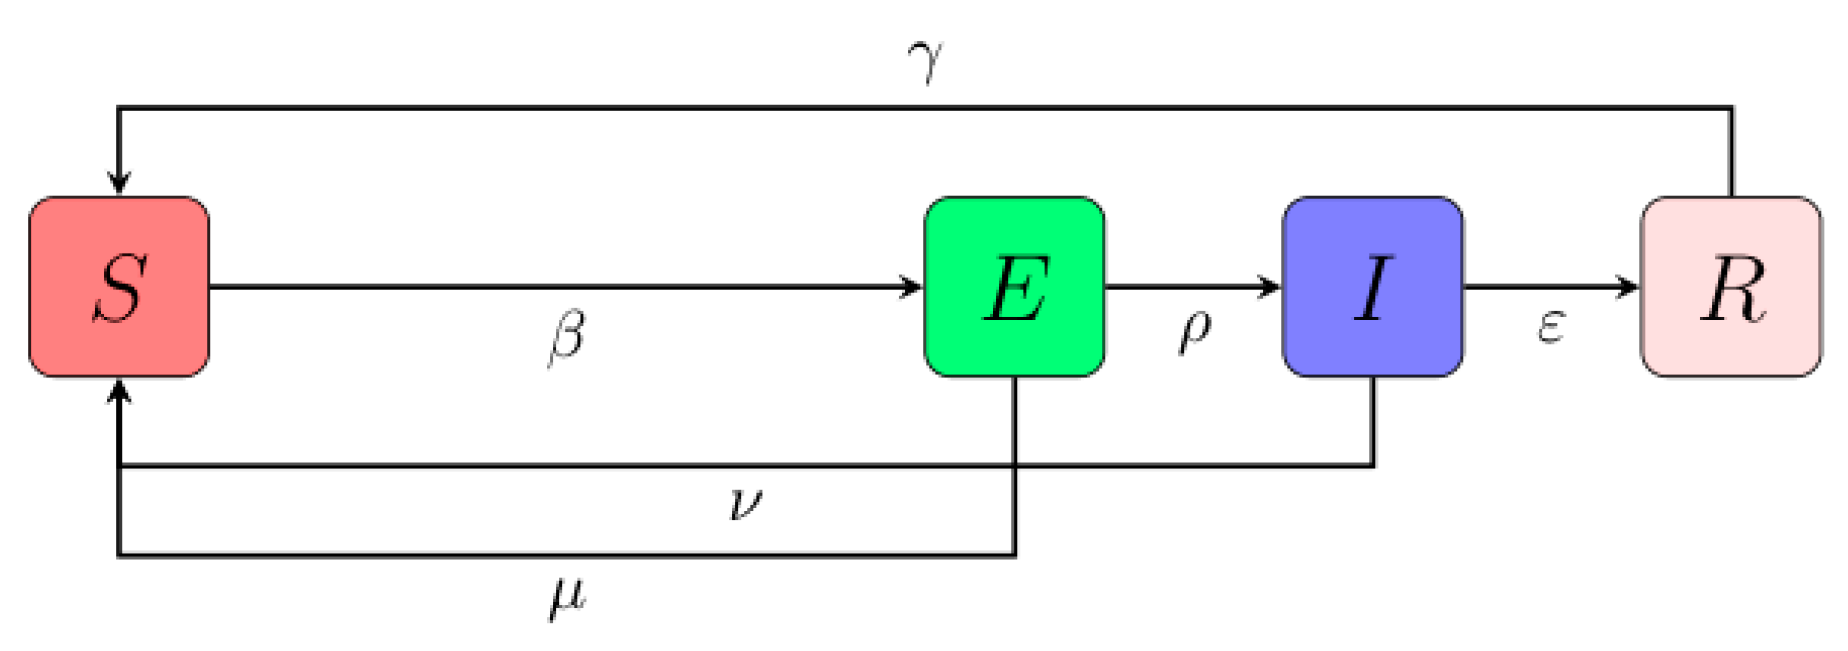
β ,  ρ ,  ε ,  γ ,  μ ,  ν ,  respectively, denote the probability of conversion of the susceptible state to the latent state, the probability of conversion of the latent state to the infected state, the probability of conversion of the infected state to the immune state, the probability of change from the immune state to the susceptible state, the probability of self-healing of the latent state to the susceptible state, and the probability of self-healing of the infected state to the susceptible state; all of the above parameters being constants between 0 and 1.
Hypothesis 3.
h 1  denotes the infection rate of latent class nodes,  h 2  denotes the infection rate of infected class nodes,  Θ 1 t  and  Θ 2 t  denote the probability of association of susceptible nodes with latent class nodes and the probability of association of susceptible nodes with infected class nodes at moment  t , respectively; the above parameters all take values between 0 and 1.
Hypothesis 4.
T denotes the delay time of risk contagion in the risk-scale-free networks of the urban river ecological management project, and it is assumed that the contagion delay time of latent class nodes and infected class nodes in the network is the same.

3.2. Construction Based on the SEIRS Model

Based on the above assumptions, the risk propagation SEIRS process for urban river ecological management projects is shown in Figure 4. A set of differential equations for the risk contagion delay model for urban river ecological management projects in a scale-free network model is constructed based on the mean-field theory, as follows.
d S k t d t = β k h 1 Θ 1 t + h 2 Θ 2 t S k t + μ E k , T t + ν I k , T t + γ R k t , d E k , 0 t d t = β k h 1 Θ 1 t + h 2 Θ 2 t S k t μ + ρ E k , 0 , d E k , 1 t d t = μ + ρ E k , 1 t + μ + ρ E k , 0 , d E k , T t d t = μ + ρ E k , T t + μ + ρ E k , T 1 t , d I k , 0 t d t = ( ν + ε ) I k , 0 t + ρ E k , T t , d I k , 1 t d t = ( ν + ε ) I k , 1 t + ( ν + ε ) I k , 0 t , d I k , T t d t = ( ν + ε ) I k , T t + ( ν + ε ) I k , T 1 t , d R k t d t = ε I k , T t γ R k t ,
where  E k , τ t I k , τ t  denote the latent and infected nodes of degree  k ,  respectively, at  t τ  moments and satisfies  E k t = τ = 0 T E k , τ I k t = τ = 0 T I k , τ . Θ 1 t = j = 1 n j P j E j t k , Θ 2 t = j = 1 n j P j I j t k .  Letting the right-hand side of Equation (1) equal zero shows that  E k , 0 = E k , 1 = = E k , T , I k , 0 = I k , 1 = = I k , T , so that  h = h 1 Θ 1 t + h 2 Θ 2 t , simplifying Equation (1) to:
S ˙ k = β h k S k + μ T + 1 E k + ν T + 1 I k + γ R k , E ˙ k = β h k S k μ + ρ T + 1 E k , I ˙ k = ρ T + 1 E k ν + ε T + 1 I k , R ˙ k = ε T + 1 I k γ R k .

3.3. Immunization Strategy Construction

Assuming that the immunization ratio of susceptible nodes is  a , the immunization strategy is modeled as in Figure 5 a [ 0 , 1 ] ; with the other parameters defined as before, the differential equation for the post-immunization system can be expressed as:
S ˙ k = β h k S k a S k + μ T + 1 E k + ν T + 1 I k + γ R k , E ˙ k = β h k S k μ + ρ T + 1 E k , I ˙ k = ρ T + 1 E k ν + ε T + 1 I k , R ˙ k = a S k + ε T + 1 I k γ R k ,
where  h = h 1 Θ 1 + h 2 Θ 2 . According to the analysis process of the unimmunized contagion model, the effective contagion rate and steady-state density of the immunized network can be found in the same way, without going over the solution process here; the contagion threshold hc and the steady-state density of infected nodes I1 of the immunized network are as follows:
h c = a + γ k γ T + 1 k 2 ,
I 1 = 2 ρ m γ β T + 1 h 1 ε + ν + h 2 ρ e ν + ε μ + ρ a + γ m β γ T + 1 h 1 ε + ν + h 2 ρ 1 ν + ε μ + ρ a + γ m β h 1 ε + ν + h 2 ρ ρ + ε + ν T + 1 γ + ε ρ e ν + ε μ + ρ a + γ m β γ T + 1 h 1 ε + ν + h 2 ρ 1 2 .

4. Numerical Simulation

4.1. Initial Model Parameter Setting

Based on the previous assumptions, there is  β  probability of the conversion of the susceptible state to the latent state,  ρ  probability of the conversion of the latent state to the infected state, ε probability of the conversion of the infected state to the immune state, γ probability of the conversion of the immune state to the susceptible state,  μ  probability of the conversion of the latent state to the susceptible state, ν probability of the conversion of the susceptible state to the infected state. Combining the actual situation of the urban river ecological management project with expert opinions and research [34], the above parameters are assigned the values: 0.4, 0.6, 0.2, 0.1, 0.1, 0.2.

4.2. Model Dynamics Simulation

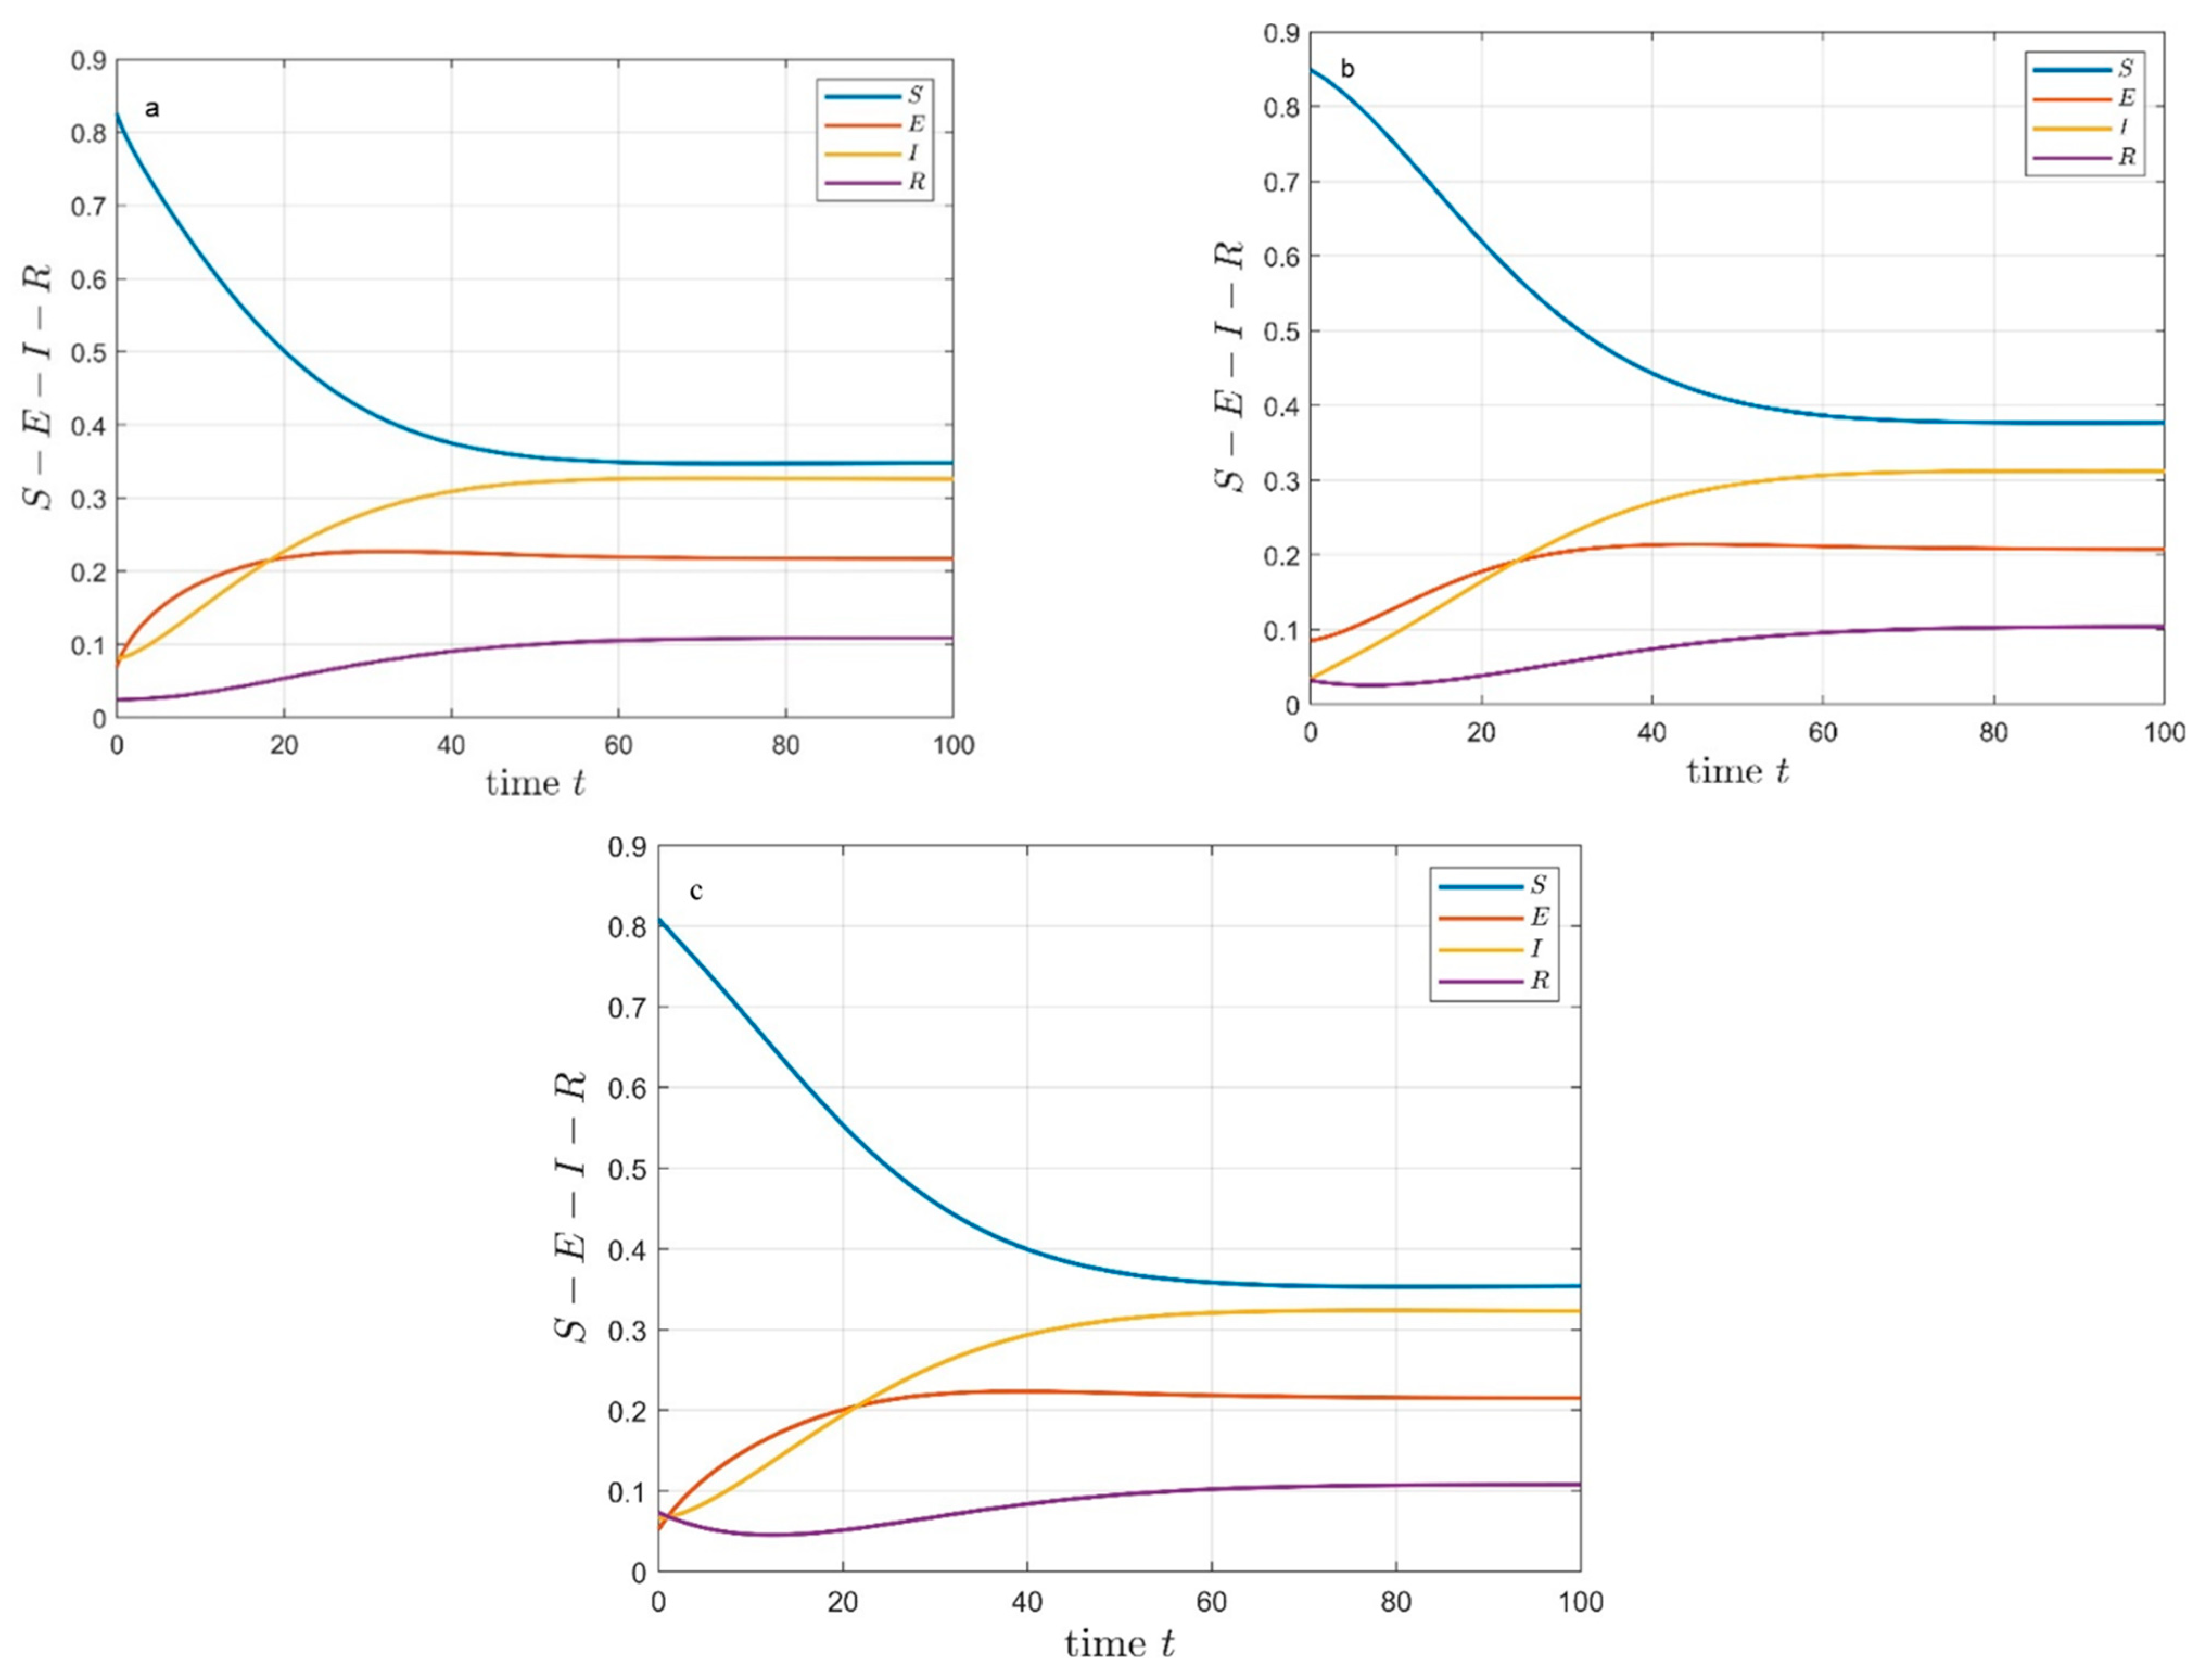
Considering the characteristics of urban river ecological management projects, project risks will persist. In this regard, we conducted dynamic analysis of the risk network for N = 1500, N = 50, and N = 10.
The parameters are as follows:
β = 0.4 , ρ = 0.6 , ε = 0.2 , γ = 0.1 , μ = 0.1 , ν = 0.2 , T = 5 , h 1 = 0.1 , h 2 = 0.3 , m = 3
From Figure 6a–c, it can be observed that in cases where the network size is 1500, 50, and 10, respectively, the instantaneous density of different-scale network models eventually reaches a steady-state density (i.e., parallel to the time axis). Moreover, based on the simulations conducted above, it can be concluded that as the evolution time of the risk network increases, the nodes tend to balance within their respective groups. Under these parameter settings, the equilibrium achieved is a balance of risk outbreak rather than the disappearance of network risks. This validates the correctness of the stability analysis of the equilibrium points in Appendix A.1.1; namely, if network risks are not effectively controlled, risks will persist. The theoretical analyses further support the need for timely risk control and management by project stakeholders involved in urban river ecological management projects. Only by doing so can the continuous presence of risks on the network be prevented, thereby avoiding potential project losses.

4.3. Dynamic Simulation Analysis of the SEIRS Model

4.3.1. Effect of Delay Time and Network Size on Propagation Thresholds

The above analysis shows that  λ = h 1 ν + ε ρ + h 2 β ρ ν + ϵ μ + ρ , i.e., the effective contagion rate of risk is influenced by the probability of  β , ρ , ε , γ , μ , ν . The infection rates are  h 1  and  h 2  for latent and infected nodes.
In this study, the parameters are set as constants to analyze the pattern of the effective propagation rate with the network size. From  λ c = k T + 1 k 2 , the propagation threshold of the security risk evolution network is related to the average degree  k k 2  and delay time  T  of the network. When the size of the network is large enough, the average degree of the network  k 2 m k 2 2 m 2 ln K c / m K c m N 1 / 2 , where  K c  is the network, the maximum value of neutrality,  m ,  is the minimum number of connected edges in the network, and  N  is the total number of nodes in the network. The transformation  λ c = 2 m T + 1 ln N .
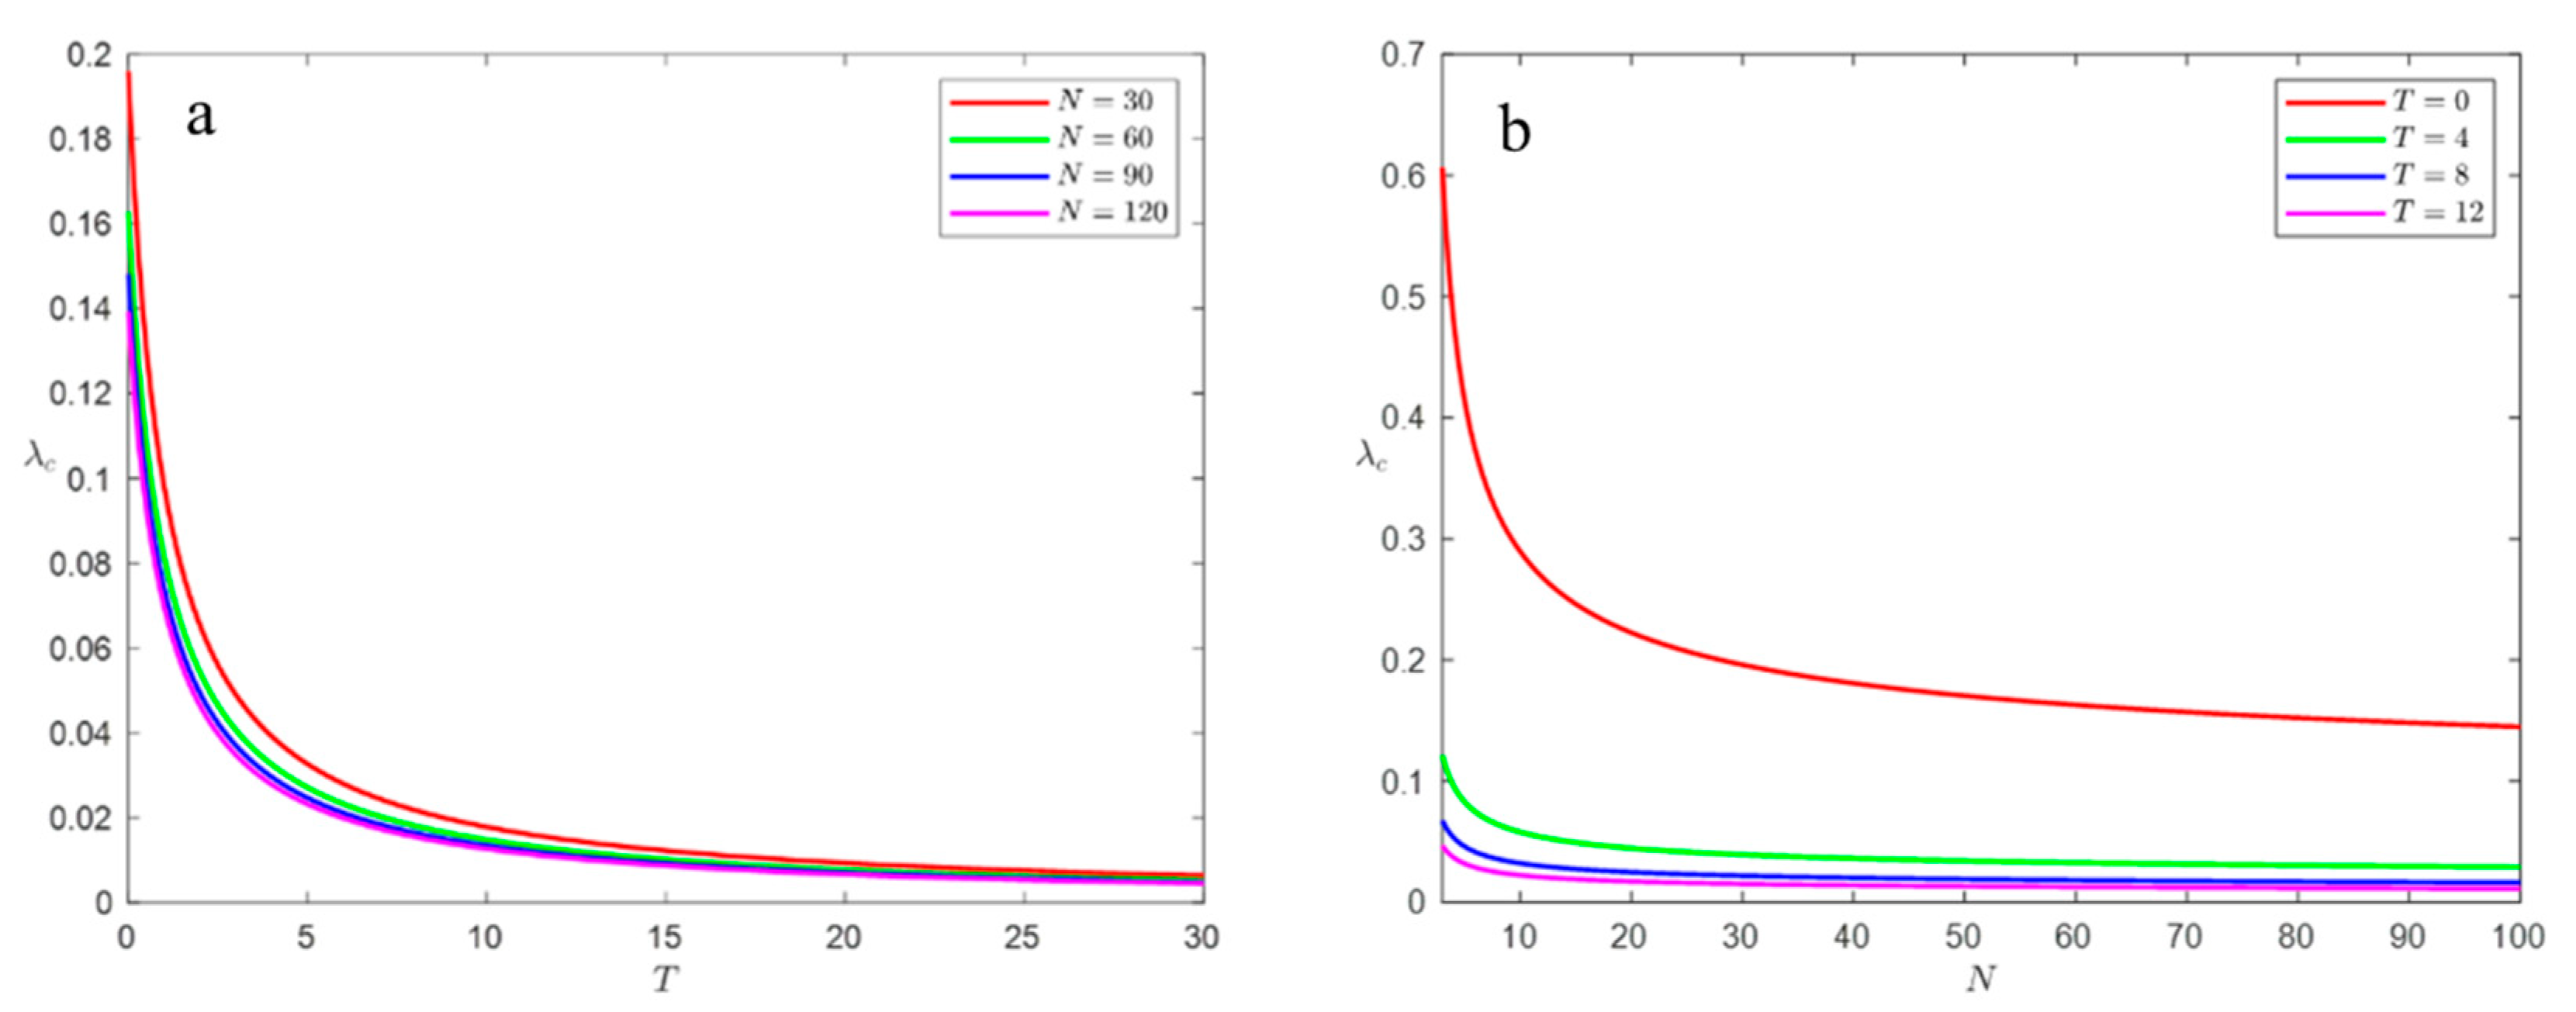
It is clear from the previous analysis, and  k 9 , that the minimum connected edge  m = 3  in this paper. The relationships between the propagation threshold  λ c T ,  and  N  are shown in Figure 7.
Figure 7a analyzes the variation pattern of the risk propagation thresholds in the network with the risk contagion delay time for the sizes of the different networks. In networks of a certain size, the contagion threshold decreases with the increasing delay time, and when the delay time is sufficiently long, the propagation threshold approaches zero, indicating that risk contagion delays in the network eventually lead to increased risk contagion. When the delay time is certain, the propagation threshold varies according to the size of the network. The larger the network size, the lower the propagation threshold, which is in line with the propagation characteristics of scale-free networks, and it can also be obtained that the propagation threshold is almost the same for different sizes of networks when the delay time is long enough. Urban river ecological management projects involve a long project cycle and many stakeholders; therefore, in the case of a certain scale of project risks, the project risks can be detected and dealt with on time according to the law of the change of the contagion threshold with the delay time in order to avoid the project risks from not being dealt with on time, resulting in a lower risk contagion threshold and causing uncontrollable project risk contagion.
According to Figure 7b, the variation patterns of the contagion threshold are shown for different delay times and network sizes in the urban river ecological management project risk network. The risk network’s contagion threshold tends to decrease as its network size increases, and the threshold with a time delay is lower than the threshold without a delay. Based on the trends, the contagion threshold of the network is almost zero when there is a time delay and the network is large enough; however, when there is no time delay and the network is large enough, the contagion threshold drops. However, the structural characteristics of the network prevent it from dropping to zero. When the network is large enough, the contagion thresholds for different delay times converge to the same value.
Figure 7a,b show that the marginal change in the project risk contagion threshold with the delay time is greater than the marginal change with the network size, indicating that the risk contagion threshold is more sensitive to the risk delay time, i.e., risk delay affects the contagion threshold more than the network size. Therefore, in the construction process of urban river ecological management projects, risks are found to be dealt with promptly to avoid the contagion of the project risks caused by the failure to deal with them promptly.

4.3.2. Effect of Delay Time on Steady-State Density

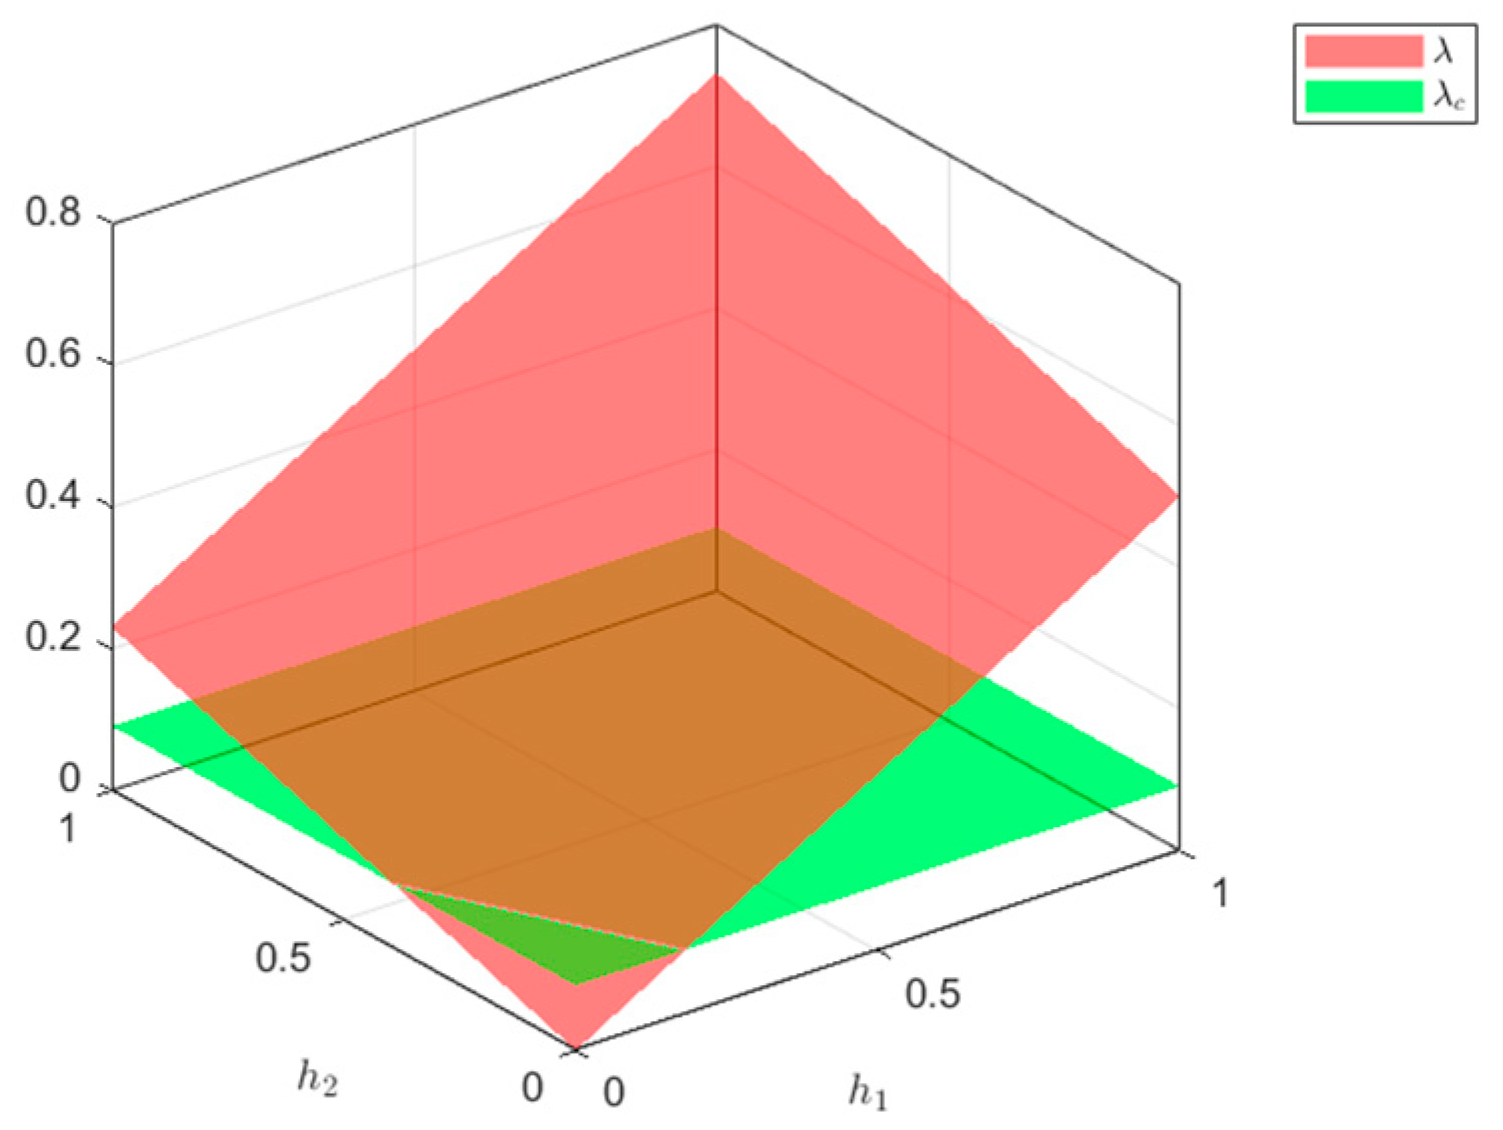
When the network size  N = 1500 , the maximum value of the contagion threshold of the network without delay  λ c max = 0.0912 , when the effective contagion rate of risk  λ = h 1 2 + 3 h 2 13 . The relationship between  λ  and  h 1  and  h 2  is shown in Figure 8, where the intersecting line segments are  h 1 2 + 3 h 2 13 = 0.0912 .
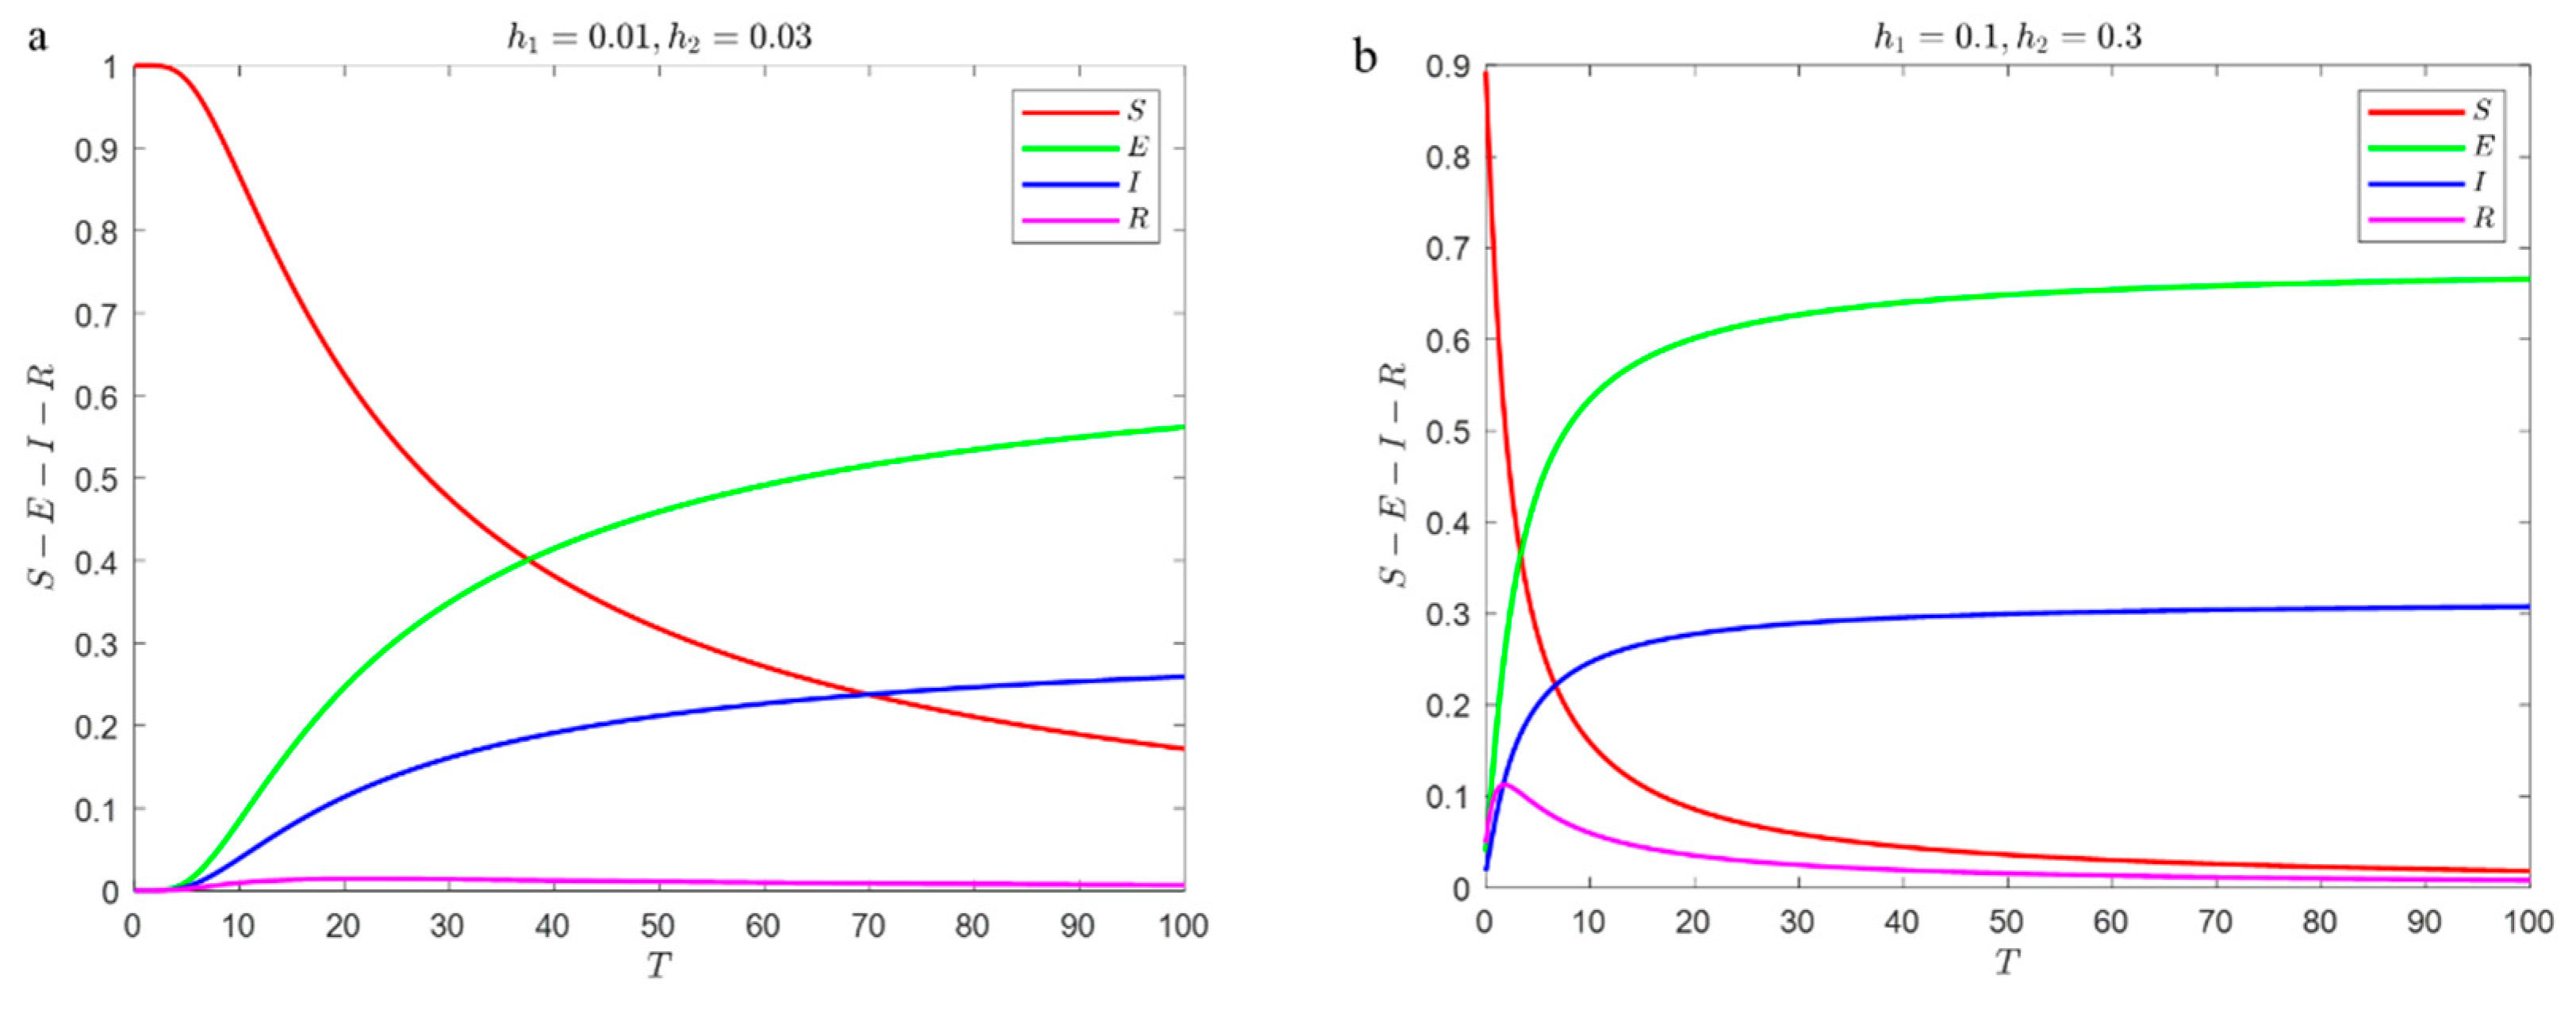
In two contexts, with  h 1 = 0.01 , h 2 = 0.03 ,  and  h 1 = 0.1 , h 2 = 0.3 , i.e.,  λ < λ c max  and  λ > λ c max .
A MATLAB2022b simulation was used to analyze the variation law of the steady-state density of various nodes in the risk network of engineering projects with a delay time. Figure 8 shows the specific results.
Figure 9a analyzes the network’s steady-state density with a delay time when  h 1 = 0.01 , h 2 = 0.03 , i.e., when the initial effective infection rate is less than the infection threshold. The density of the susceptible nodes in the network at the initial moment (zero contagion delay time) is 1, and the steady-state density of the latent, infectious, and immune nodes is 0. As the delay time of transmission increases, the transmission threshold of the risk gradually decreases, and it can be seen from Figure 9a that when the delay time is less than 5, the steady-state density of various nodes does not change, indicating that the effective transmission rate of the risk is always less than the transmission threshold. When the delay time is longer than 5, the steady-state density of the susceptible nodes decreases rapidly, and when the delay time is long enough, the density drops to 0. The steady-state densities of the latent and infected nodes show an increasing trend and eventually equalize, and the steady-state density of the latent nodes is close to 0.6, the steady-state density of the infected nodes is close to 0.3, and the steady-state density of the immune nodes changes less but shows an overall trend of first increasing and then decreasing to 0. The steady-state density of the immune nodes is less variable but shows a trend of increasing and then decreasing until it reaches zero. This indicates that when the delay time is greater than 5, the risk starts to explode in the network as the effective contagion rate of the risk is greater than the contagion threshold.
Figure 9b analyzes how the steady-state density of the network varies with the contagion delay time when  h 1 = 0 . 1 and  h 2 = 0.3 , i.e., when the initial effective contagion rate of risk in the network is greater than the contagion threshold. The steady-state density of the four types of nodes in the network is approximated to 0.9, 0.03, 0.02, and 0.05 at the initial moment; when the risk delay effect appears, the risk will be transmitted in the network regardless of the delay time, resulting in a rapid decrease in the steady-state density of the susceptible nodes until it reaches 0. The steady-state densities of the latent and infected nodes increased to 0.68 and 0.31, respectively, and the immune nodes increased and then decreased rapidly until they approached 0.
In cases where the effective rate of risk transmission is less than the transmission threshold, a longer transmission delay is required to bring the steady-state density of each node into equilibrium, and when the effective rate of risk transmission is greater than the transmission threshold, a shorter transmission delay is required. In cases where the effective transmission rate is less than the transmission threshold, risk transmission delays play a greater role than in cases where the effective transmission rate is greater. Different values of the risk transmission rate for latent and infected nodes affect the steady-state density at the initial moment, but not at equilibrium. The results provide some theoretical guidance for the development of risk contagion control strategies for urban river ecological management projects.

4.3.3. Infection Rate Effects on Steady-State Density

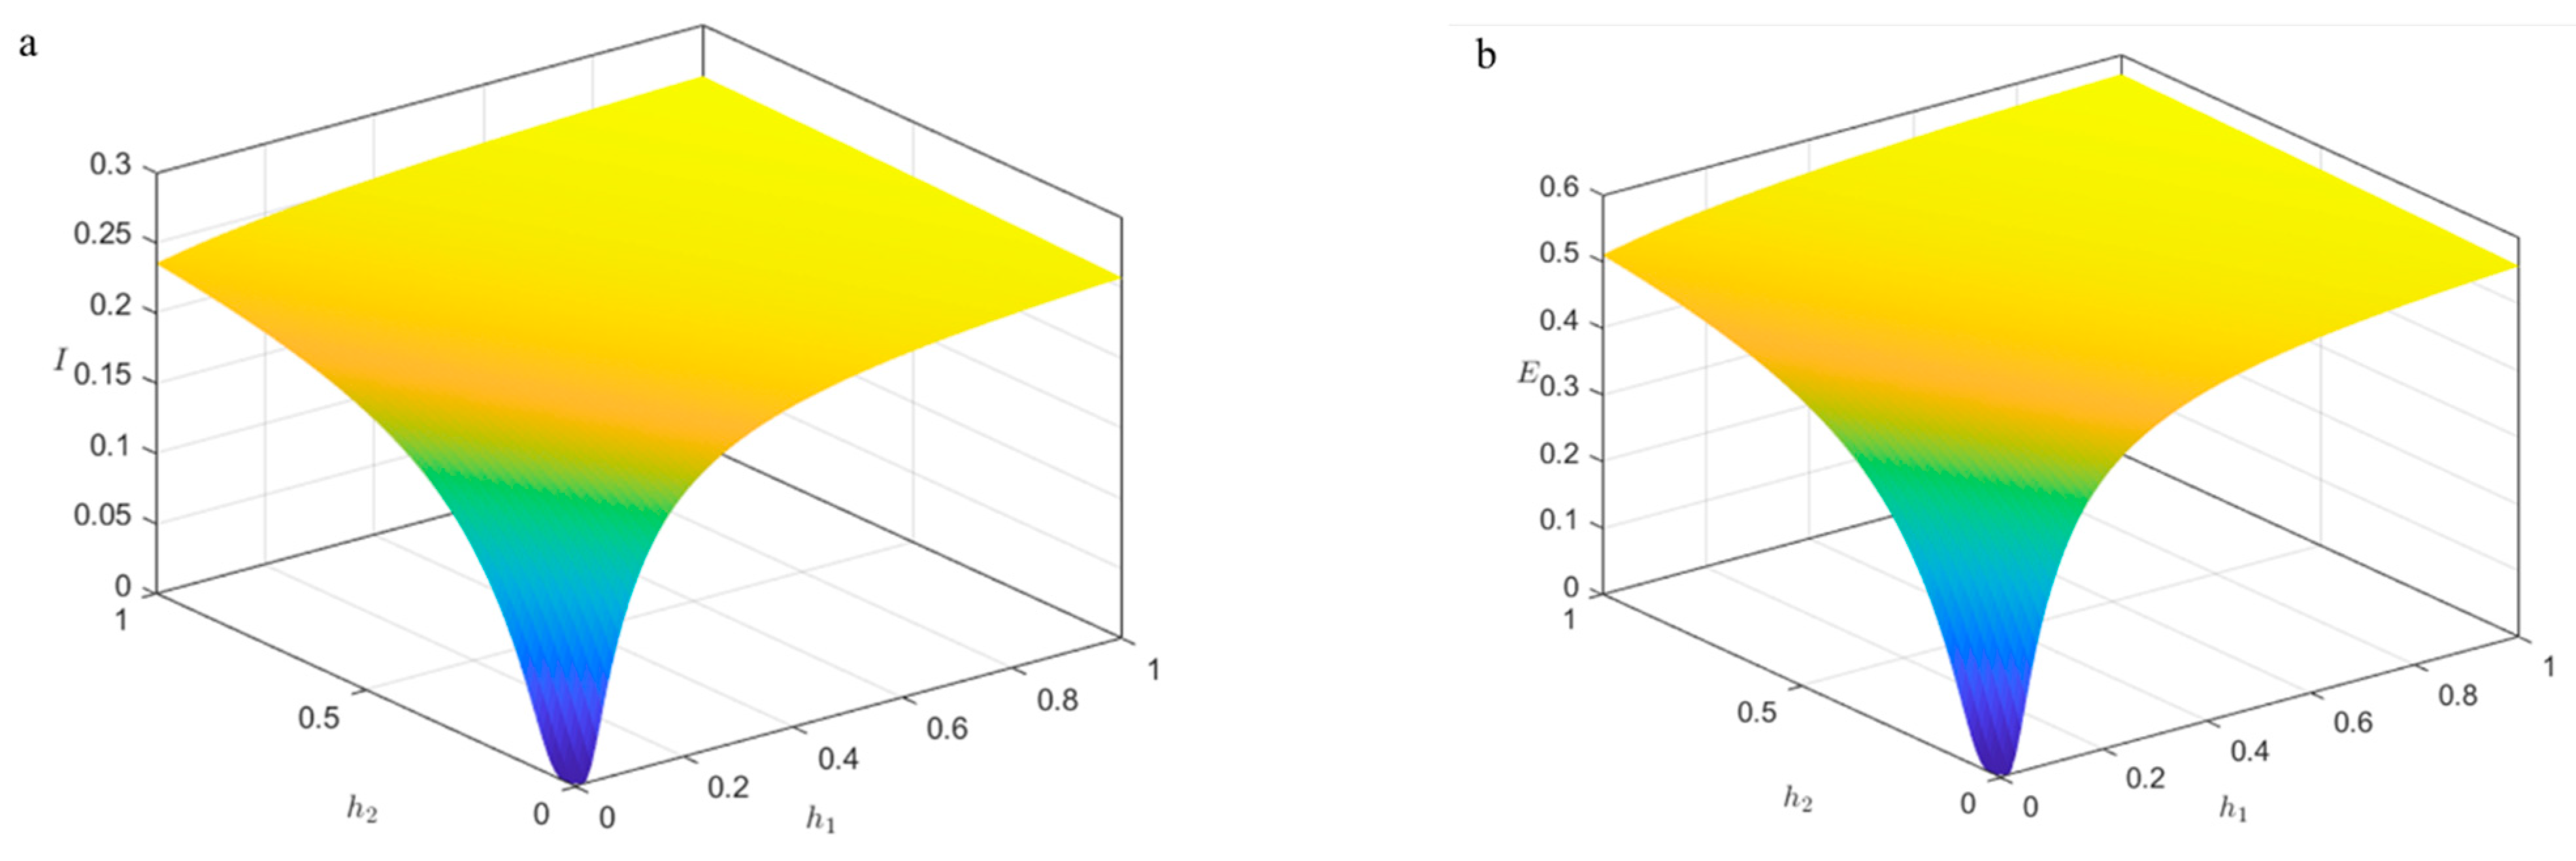
The relationship between the infected nodes, latent nodes, and  h 1 , h 2 , as well as the results of the analysis of the above steady-state density over time, show that when the density of infection is relatively small, the delay time exceeds 5 before infection occurs. Therefore, in this paper, assuming the delay time  T = 5  for risk contagion, a MATLAB simulation was used to analyze the trend of infected nodes and latent nodes with  h 1 , h 2 . Figure 10 illustrates the specific results.
From Figure 10a, it can be seen that when the values of  h 1  and  h 2  are small, there is no significant change in the steady-state density of the infected nodes and because the delay time is fixed at this time, which indicates that the risk transmission threshold is certain. As a result, the value of the effective infection rate is small and lower than the propagation threshold, and the risk cannot spread in the network, so the steady-state density of the infected nodes will remain at zero. As  h 1  and  h 2  increase, the effective infection rate gradually increases until it exceeds the propagation threshold, and the steady-state density shows a rapidly increasing trend. The marginal change of the steady-state density of the infected nodes concerning  h 1  is greater than that concerning  h 2 ; that is, the steady-state density of the infected nodes is more sensitive to  h 1 . This result is because  h 1  has a greater impact on the infection rate in the expression of the effective infection rate.
Based on Figure 10b, it can be observed that when  h 1  and  h 2  have relatively small values, the steady-state density of the latent nodes does not show significant changes. As  h 1  and  h 2  gradually increase, the pattern of change in the steady-state density of the latent nodes follows the same trend as the variation of the infected nodes in Figure 10a. Therefore, it can be concluded that the steady-state density of the latent nodes is more sensitive to  h 1 . The reason for this result is that  h 1  has a greater impact on the transmission rate in the expression of the effective transmission rate.
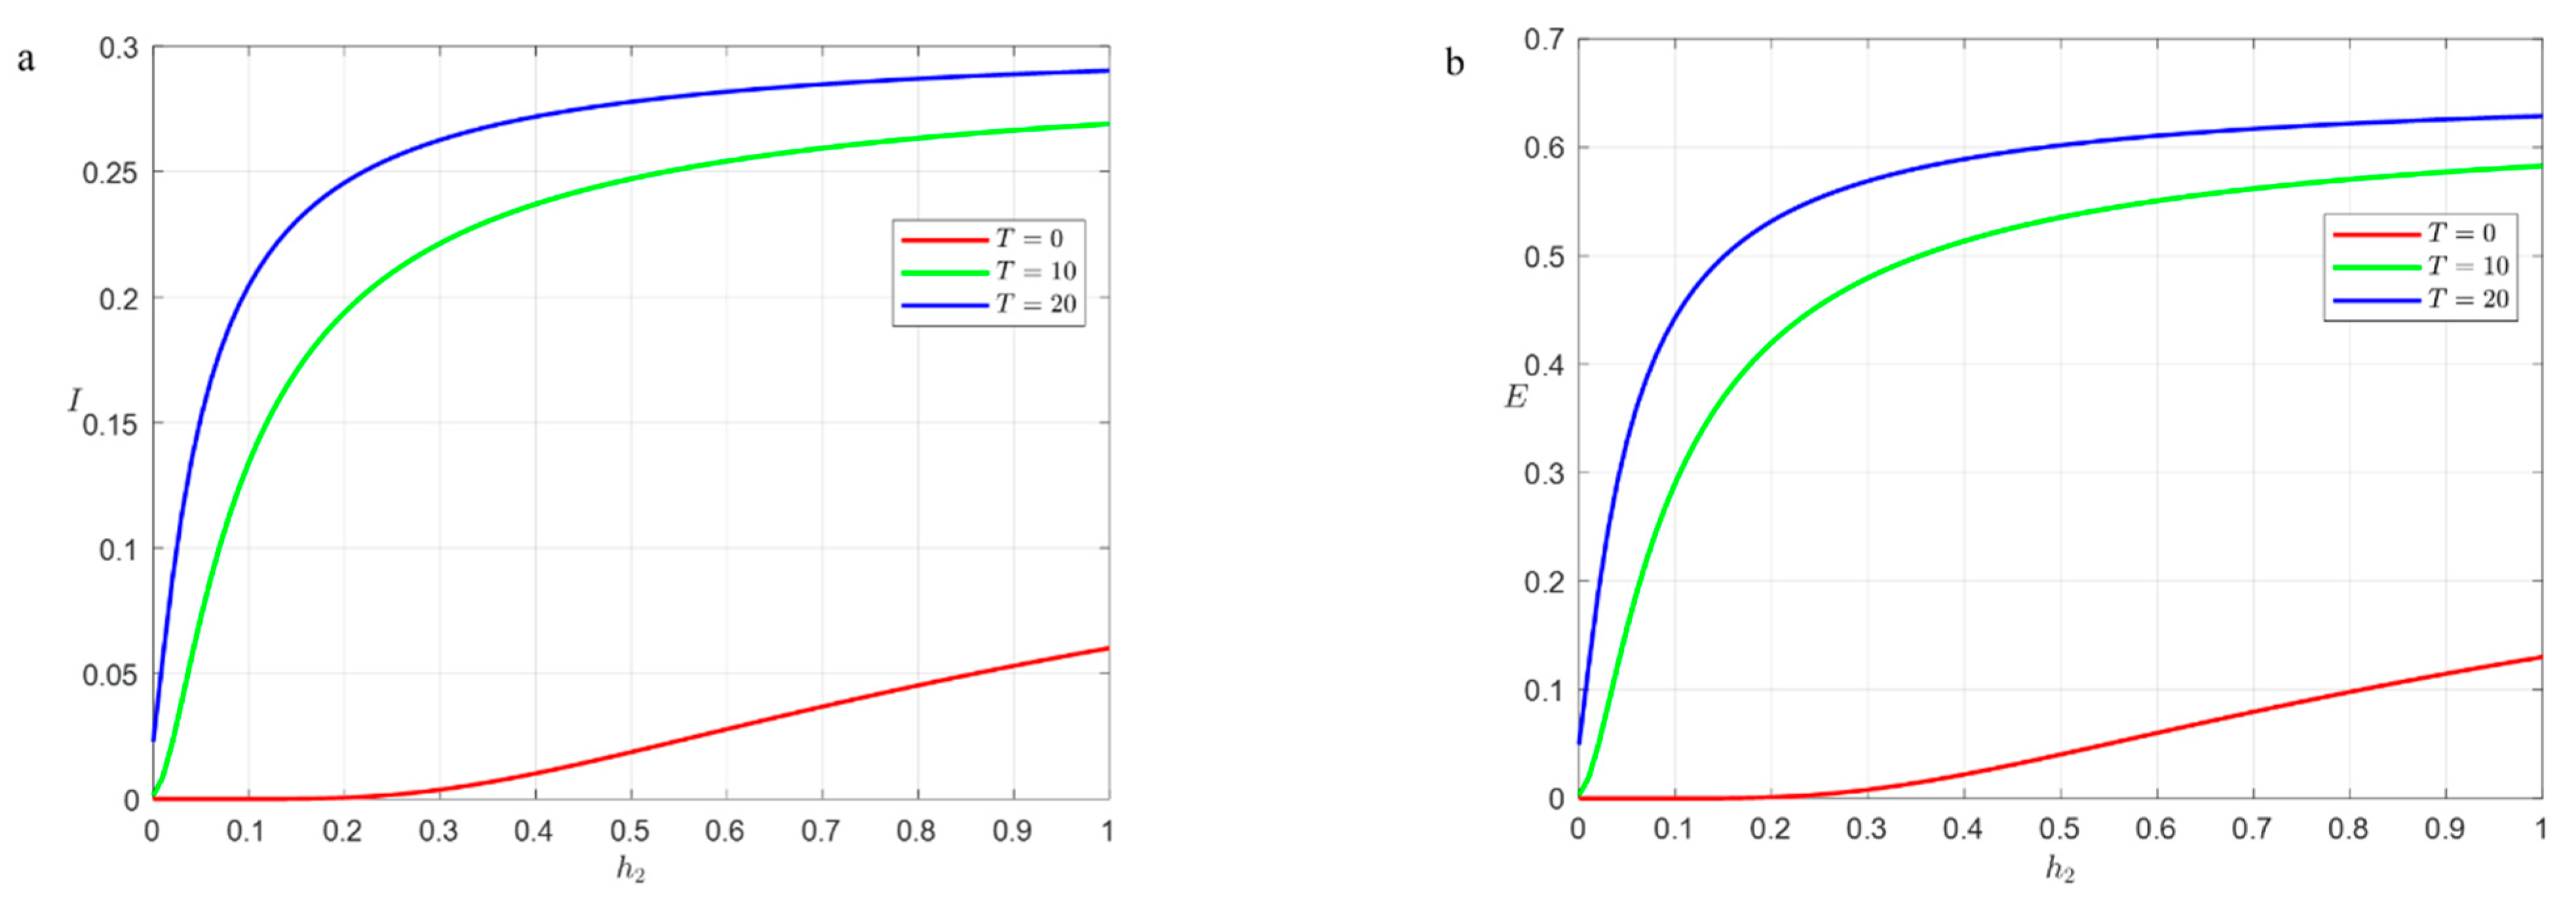
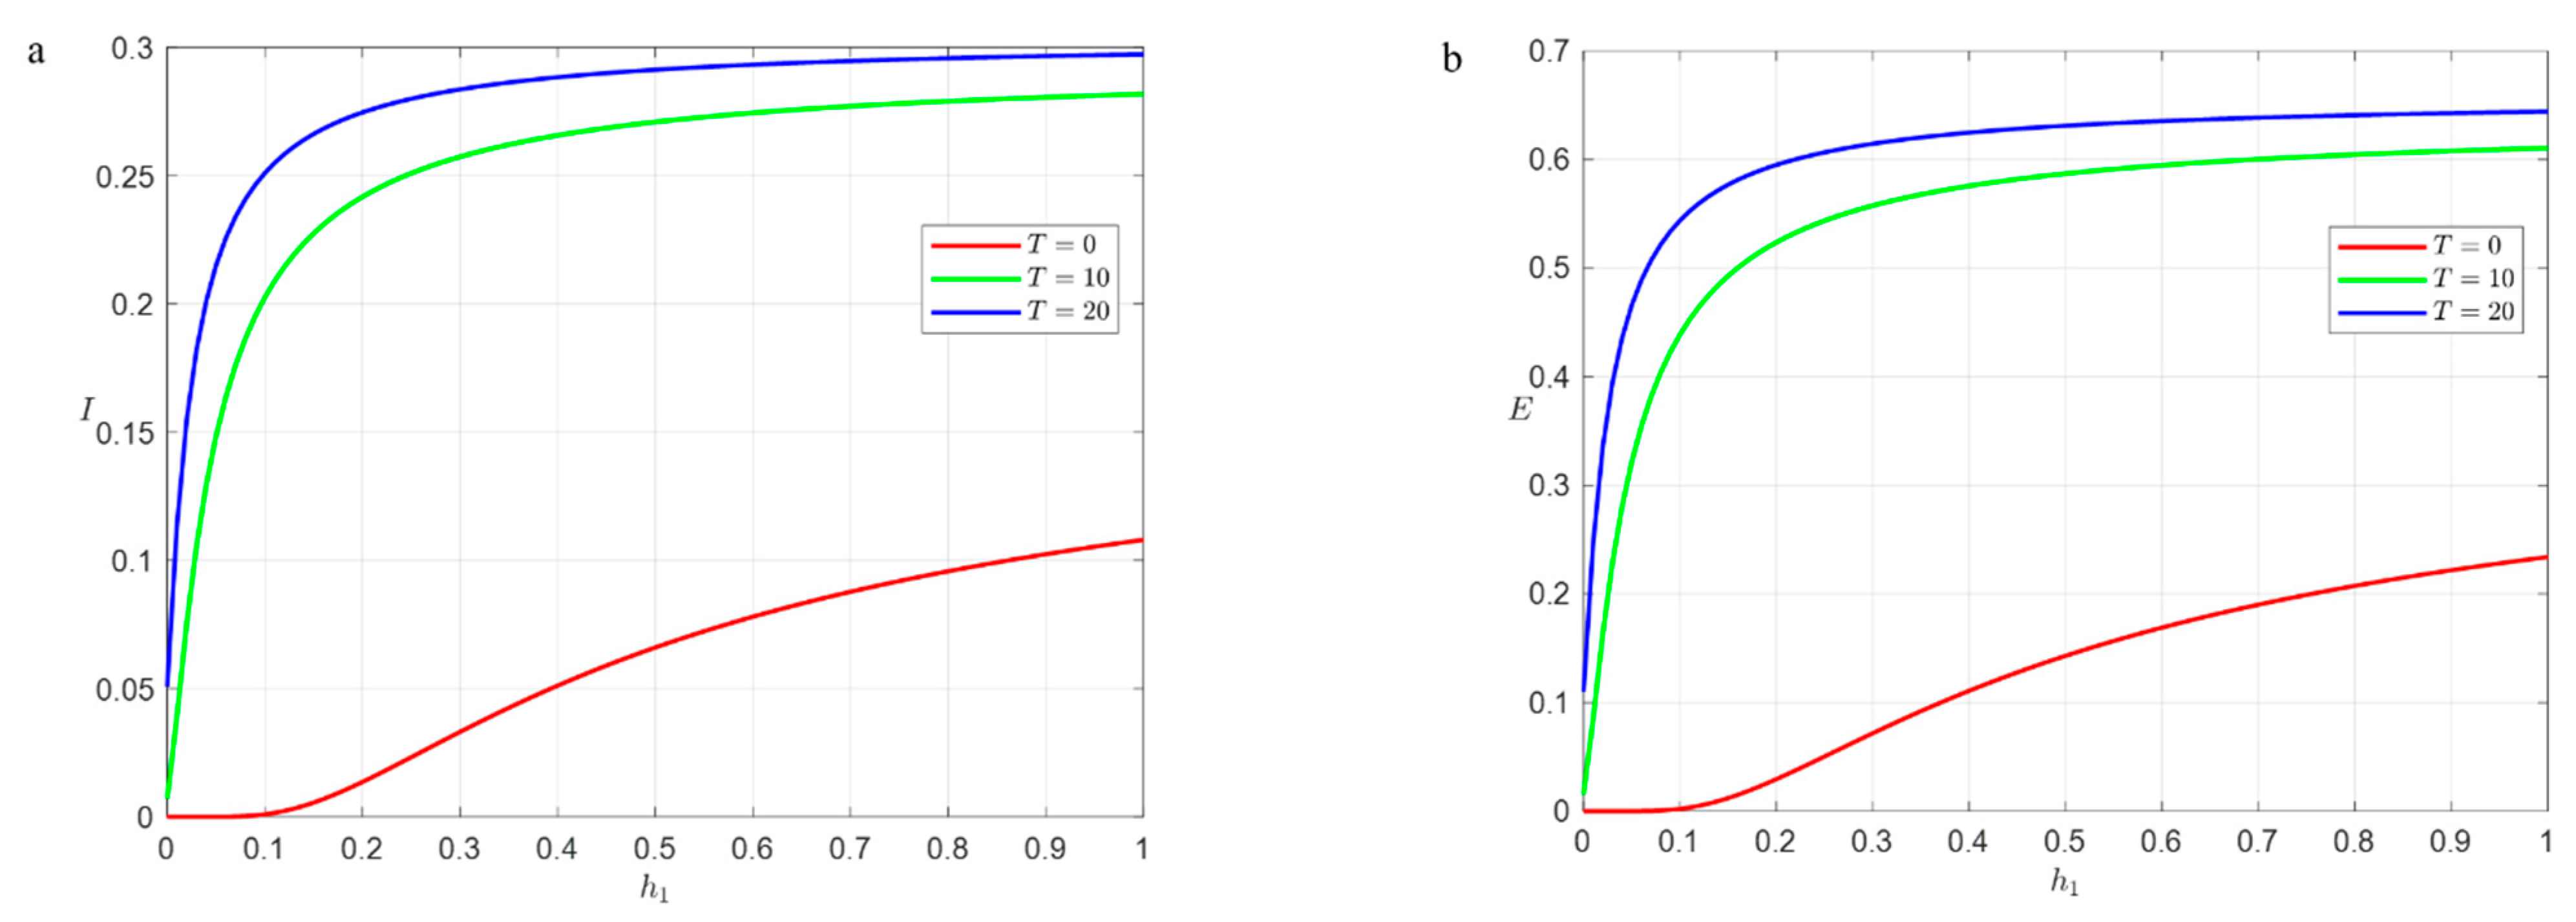
To further explore the relationship between the steady-state density of the infected and latent nodes with  h 1 , h 2 , and  T . Taking the delay time  T = 0 , 10 , 20 , the variation law of the steady-state density of the infected and latent nodes with  h 2  for fixed  h 1 = 0.01 , and the variation law of the steady-state density of the infected and latent nodes with  h 1  for fixed  h 2 = 0.03 , respectively, were analyzed. In Figure 11 and Figure 12, the specific results are shown.
Figure 11a,b show that when  h 1 = 0.01 , the steady-state densities of the infected node I and the latent node E increase with the increase in  h 2 . By comparing the cases of the risk delay being 0, 10, and 20, it is found that the project risk delay leads to an increase in the steady-state densities of node I and node E. This, in turn, accelerates the spread of the project risk within the network. In addition, as the time units of the delay increase, the growth rate of their steady-state densities also increases.
Figure 12a,b show that when  h 2 = 0.03 , the steady-state densities of the infected node I and the latent node E increase with the increase in  h 1 . By comparing the cases of the risk delay being 0, 10, and 20, it is found that the changing pattern of the steady-state densities of the infected node I and the latent node E concerning  h 1  is consistent with the pattern shown in Figure 10. This implies that increasing the value of h1 in the model leads to an increase in the steady-state densities of the infected node and latent node, indicating that more individuals are infected or in a latent state in the system.
By comparing the results of Figure 11 and Figure 12, it is observed that when parameter  h 1  is fixed, the equilibrium steady-state density of the infected node I and the latent node E is smaller than the result with a fixed parameter  h 2 . This indicates that increasing parameter  h 1  is more likely to lead to a risk outbreak in urban river ecological management projects. The equilibrium steady-state density of both the infected node I and the latent node E increases as parameters  h 1  and  h 2  increase. When one parameter is fixed and the other parameter is increased, it also leads to an increase in the steady-state density, and the combined effect of increasing both parameters is more pronounced. Furthermore, the latent node E exhibits a growth rate faster than the infected node I, and the maximum steady-state density of the latent node is greater than that of the infected node. This suggests that in the risk network of urban river ecological management projects, the contagiousness of the risk factors in the latent period plays a significant role in the entire risk-spreading process, and the transmission delay accelerates the propagation of risks within the network. Therefore, when devising risk control strategies for urban river ecological management projects, stakeholders should pay attention to the contagiousness of the latent nodes and the delay in risk propagation.

4.3.4. Sensitivity Analysis

Sensitivity analysis is a method used to assess the sensitivity of the model outputs to changes in the input parameters. By systematically varying the key parameters within the model and observing the resulting changes in the output, we can gain insights into the model’s sensitivity to different parameters, thus enhancing our understanding of the model’s behavior and predictive capabilities. In sensitivity analysis, the effects of the model outputs can be observed by changing the values of parameters such as  m , T , β , ρ , ε , γ , ν , μ , h 1 , h 2 .
Non-normalized sensitivity formula:
D x T = T x
Normalized sensitivity formula:
F x T = T x x T
where  T  is a variable, and  x  is a variable. In this article, T takes the values of  S , E , I , R , and x takes the values of  m , T , β , ρ , ε , γ , ν , μ , h 1 , a n d   h 2 . Based on the two formulas above and taking parameters 3, 5, 0.4, 0.6, 0.2, 0.1, 0.2, 0.1, 0.1, and 0.3, we can obtain the results shown in the graph.
According to the non-normalized analysis in Figure 13a, the parameters  m , T , β , ρ , ε , γ , ν , μ , h 1 , h 2  have relatively small numerical values overall, but still have some impact on the nodes  S , E , I , R  in the model. According to the analysis results in Figure 13b, for node  S , the parameters  m , T , β , ρ , ε , γ , ν , μ , h 1 , h 2  have little impact on it. For the latent node  E , the parameters  m , T , β , ρ , ε , ν , μ  have a negative influence on  E , while  h 1  and  h 2  have a positive impact on  E . Additionally, as  h 1  and  h 2  increase, the risk of the latent node  E  also continues to increase. For the infected node  I , the parameters  m , T , β , ε , ν , μ  have a negative impact on  I , while  h 1  and  h 2  have a positive impact on  I . Similarly, as  h 1  and  h 2  increase, the risk of the infected node  I  also continues to increase. Therefore, in the risk evolution study of urban river ecosystem management projects, it is crucial to strengthen the control of  h 1  and  h 2  as they play a significant role in controlling the spread of risks.

4.4. Immunization Strategy

Comparing the effective transmission rate after immunization with the effective transmission rate and transmission threshold before immunization, we can see that  h c > λ c , indicating that the transmission threshold of the risk transmission model after immunization is greater than that before immunization, and the spread of risk in the network can be controlled to a certain extent, effectively avoiding the risk of transmission.
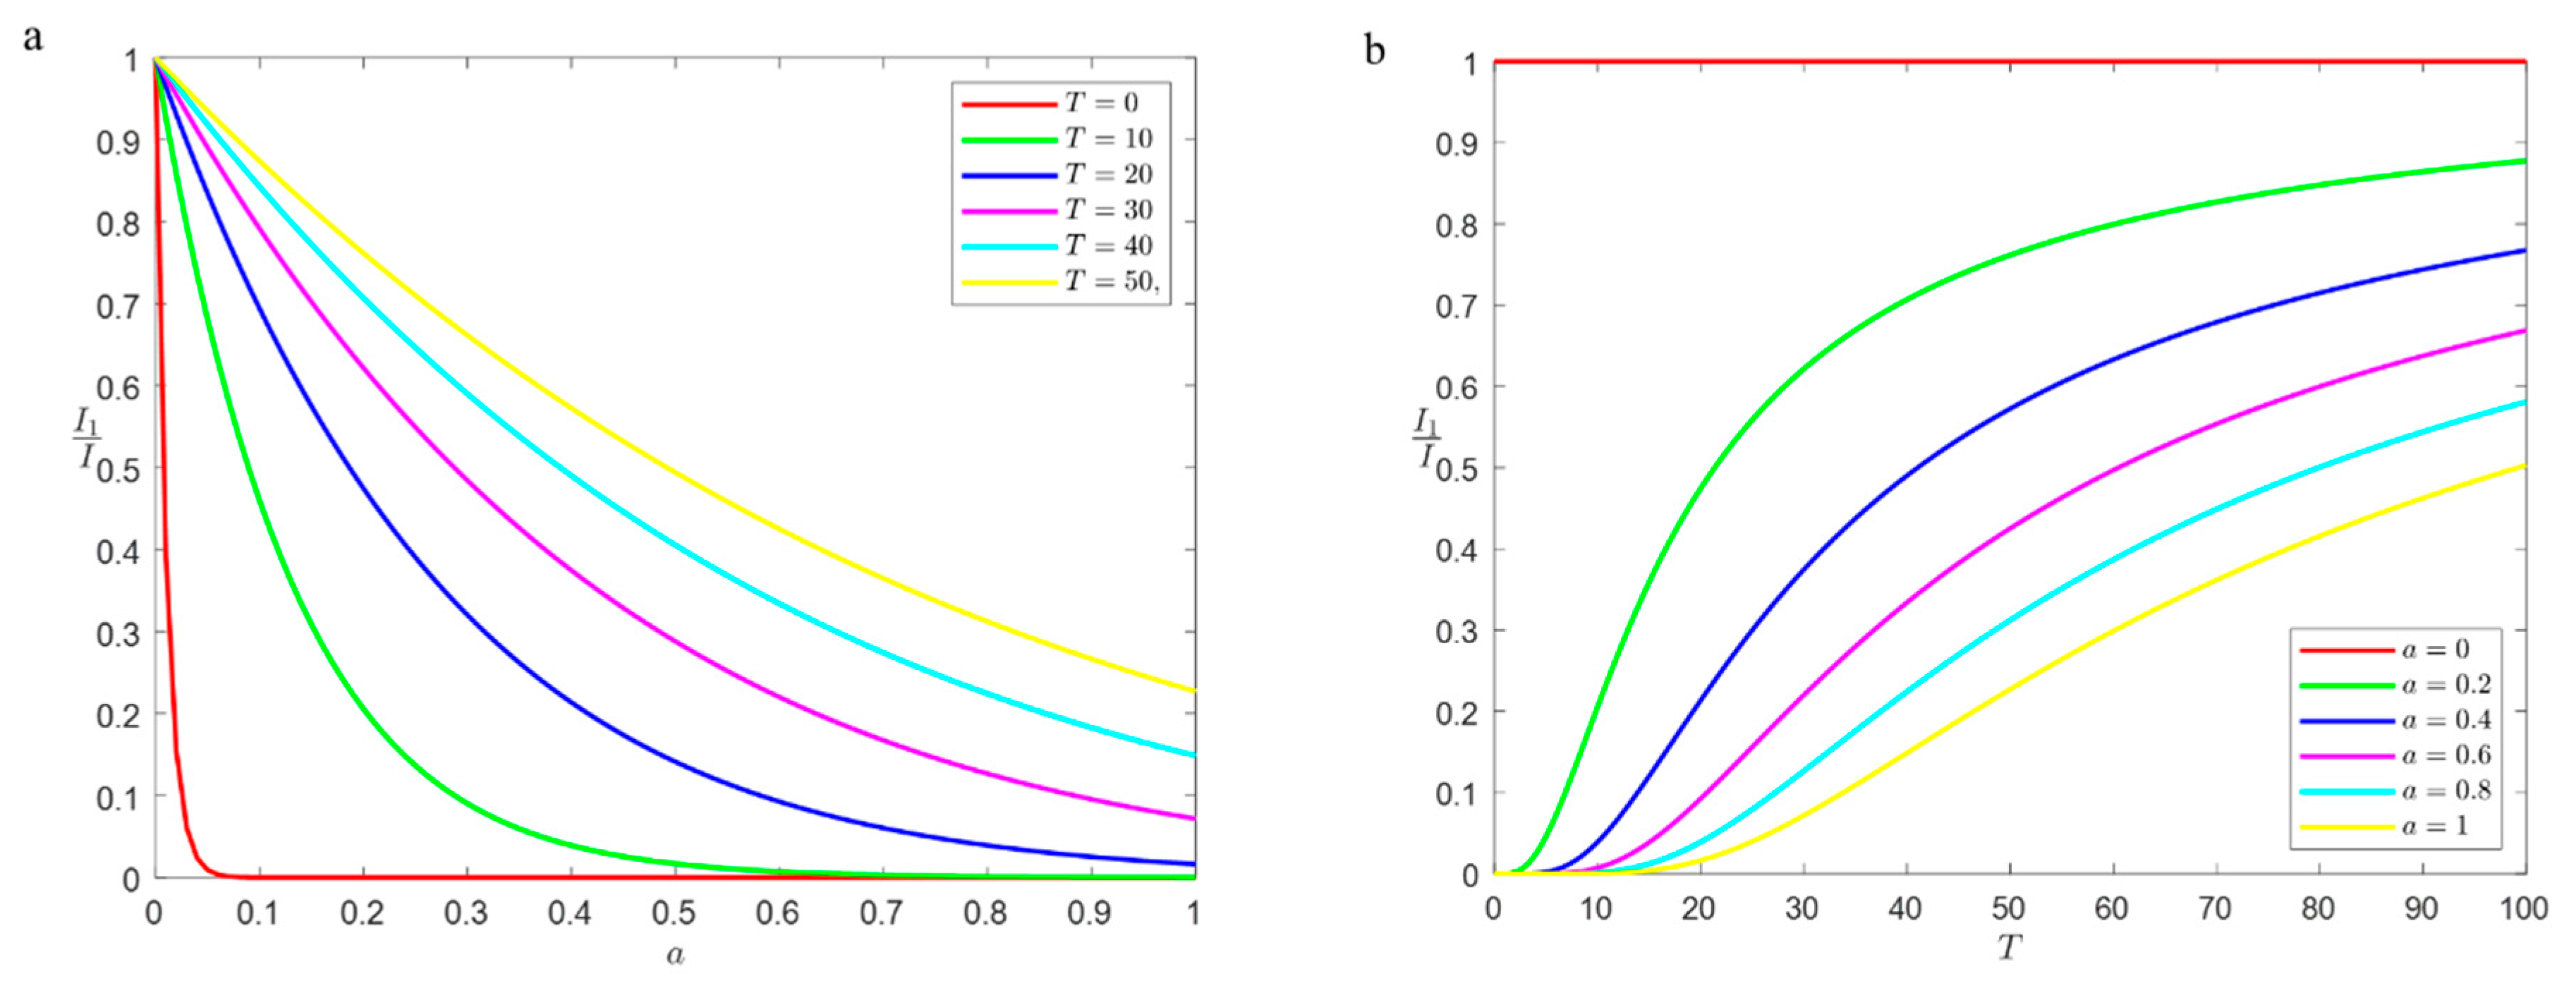
The steady-state density versus T and  a  was obtained by substituting  β = 0.4 , ρ = 0.6 , ε = 0.2 , γ = 0.1 , μ = 0.1 , ν = 0.2 , m = 3 , h 1 = 0.01 , a n d   h 2 = 0.03  into the expression for the steady-state density of the infected node after immunization. Analyze the relationship between I and  a  when  T = 0 , 10 , 20 , 30 , 40 , 50 ; I1 and T when  a = 0 , 0.2 , 0.4 , 0.6 , 0.8 , 1 . This study normalized the immune density of the infected nodes after immunization to ensure a convincing analysis. I in the figure indicates the steady-state density of the infected nodes before immunization, i.e., the maximum value of the steady-state density of the infected nodes, and the results of the analysis are shown in Figure 14.
As can be seen from Figure 14a, the steady-state density decreases as the probability of the immunization of the susceptible nodes increases, suggesting that enhanced immunization is effective in controlling contagion in the risk network of urban river ecological management projects. It was observed that the relative value of the steady-state density of the network is 1 when the immunity probability of the susceptible nodes is zero, at which point the steady-state density is at its maximum. The relative value of the steady-state density is equal to the marginal change in the immunity probability of the susceptible node, indicating that the immunity probability of the susceptible node plays an important role in the relative value of the steady-state density of the infected node.
As can be seen from Figure 14b, when the immunization probability of the susceptible nodes is 0, the relative steady-state density of the infected nodes remains at 1, which is the same as before immunization. When immunizing susceptible nodes with a certain probability, the higher the immunization probability, the smaller the relative value of the steady-state density of the infected nodes, and the better the immunization effect when the delay time is held constant. For a given probability of immunization, the relative value of the steady-state density first remains constant at 0 and then increases with the increasing delay time, i.e., the immunization becomes less effective. The reason for this phenomenon is that after immunizing the nodes in the network, the contagion threshold of the risk increases. When the delay time is short, the contagion threshold of the risk is still greater than the effective contagion rate of the network and the risk cannot spread in the network, so the relative value of the steady-state density remains 0. However, as the delay time continues to increase, the contagion threshold decreases further until it is less than the effective contagion rate, at which point the risk will spread in the network, leading to an increase in the relative value of the steady-state density. The results show that the immunization of the susceptible nodes can effectively inhibit the spread of risk; in addition, the effectiveness of immunization can be enhanced by controlling the delay time of the risk in the network.
The above analysis shows that the immunization of the susceptible nodes can effectively control the propagation of risks in the risk network of urban river ecological management projects, and controlling the delay time of risks in the network can strengthen the immunization effect of the network against risks. Therefore, in the practical work of risk management for urban river ecological management projects, project participants can combine the results of the analysis of the topology of the scale-free network for the evolution of risk in urban river ecological management projects and target immunization at the nodes with the highest degree values.

5. Discussion

The research results show that the model accurately describes the law of risk propagation in urban river ecological management projects and explains the trend in delay propagation. By adjusting the values of various parameters in the model and analyzing the influence of their changes on the proportion of various nodes, the propagation law of risk in urban river ecological management projects can be derived, which provides a theoretical basis for preventing and controlling the propagation of project risks. For the application of the research results in the construction of urban river ecological management engineering projects, for the nodes of the class of easily infected risk factors, the supervision of the project needs to be strengthened so that the factors affecting the risks in urban river ecological management engineering projects are kept within a controllable range, and the probability of the risk factors that may affect urban river ecological management engineering projects being transformed into latent or infected states is minimized as far as possible. For latent category risk factors, through strengthening the risk early warning, the timely understanding of the risk changes when the early warning signals promptly invokes the emergency plan control to reduce the risk value of the risk factor to a manageable range or directly eliminate. The most direct management tools are used to transform the risk factor into an immune node for the infection category while avoiding the probability of exposure to this risk factor with the susceptible and latent risk factors and reducing the number of risk factors transformed into the infection status. The contagiousness of the risk also needs to be considered along with the latency of the risk, and when adopting an immunization strategy in a network, the most effective risk control strategy needs to be developed in conjunction with the latency of the risk.
Applying the SEIR model to urban river revitalization projects enables comprehensive and objective risk assessment, revealing the mechanisms and patterns of risk transmission. Establishing a project risk transmission model allows for in-depth research on the interactions and influences among various stakeholders, providing theoretical support for risk management and control. In practical applications, the introduction of the SEIR model can assist managers in effectively addressing the issues of risk transmission, thereby improving the smooth progress and quality outcomes of the project. Specifically, it provides the following areas of assistance: (1) Enhanced project risk management: The application of the SEIR model helps to elevate the level of project risk management. It allows for a comprehensive and objective assessment of project risks, enabling the timely identification of and response to potential risks. (2) Improved project schedule and risk control: By analyzing the risk transmission pathways, speeds, and their impact on the project schedule and costs, the SEIR model enhances the project’s ability to manage progress and mitigate risks. It aids in developing effective risk management plans and facilitates timely adjustments in the schedule and resource allocation. (3) Strengthened coordination and collaboration among project stakeholders: The introduction of the SEIR model fosters better coordination and collaboration among project participants. It helps in predicting risk trends, analyzing the interactions and influences among stakeholders, optimizing resource allocation, and enhancing the overall coordination and cooperation. This ultimately improves the overall project outcomes and quality levels.
Although this study focuses on risk propagation in urban river ecological management projects, the analytical models and methods used can be applied to risk propagation research in other domains. Similar SEIRS models and network analysis methods can be employed to analyze and understand various risk propagation phenomena, such as the spread of infectious diseases, information dissemination, and influence propagation in social networks. By adjusting the model parameters and network structures, this approach can be extended to other domains that exhibit characteristics of risk propagation, including financial risk propagation, supply chain risk propagation, and aviation safety risk propagation. The flexibility of these models and methods allows for their application in diverse contexts and fields, thereby offering the potential for a comprehensive understanding and management of risk propagation processes.

6. Conclusions

Based on the complex network theory and mean-field theory, this paper develops a D-SEIRS model to predict risk propagation in urban river ecological management projects. This model takes into account both the propagation latency and latent node propagation, thus providing a new perspective on risk propagation. Using a complex network of risks for urban river ecological management, the network’s overall characteristics and key risk factors in project risk transfer can be determined. By analyzing the network topologically, we can identify the risk nodes with high degree values. These risks, including A2, A49, and A36, significantly affect the other risk variables.
The results of the network stability analysis revealed that when the basic reproduction number is less than 1, there exists a risk avoidance equilibrium point for urban river ecological management project risks. There is a global asymptotically stable equilibrium point at this point. The model exhibits a risk outbreak equilibrium point, which is locally asymptotically stable, when the basic reproduction number is greater than 1. The derivation of the steady-state density demonstrates that, under specific parameter settings, the steady-state densities of various nodes in the risk network of urban river ecological management projects are influenced by the contagion rates (h1 and h2) and the delay times. The simulation results indicate that in a scale-free network of project risks, the presence of risk is persistent, and the delay in risk propagation leads to a lower risk propagation threshold within the network, thereby accelerating the spread of the risk. Additionally, the decrease in the risk transmission threshold within the network, caused by the delay in risk propagation, facilitates the diffusion of network risks and the emergence of a balanced state of risk outbreak within the network. Furthermore, the steady-state densities of both the infected nodes (I) and latent nodes € in the risk network increase with higher effective transmission rates and longer propagation delay times. Moreover, the transmission rate of the latent nodes has a greater impact on the steady-state density of the risk nodes. According to the simulations involving the immunization of the susceptible risk nodes in the network, strengthening the immunity of the susceptible nodes can effectively control risks in the urban river ecological management network.
The study acknowledges the specific characteristics and limitations influenced by external conditions in the evolution of risks within urban river ecological management projects. In risk propagation theory, it is typically assumed that all risk nodes have the same attributes, meaning they are subject to the same probability of change due to the risk factors. However, in practical situations, the conditions influencing the risk factors tend to be complex and diverse. The next research focus is on integrating multidisciplinary knowledge and leveraging big data analysis techniques to construct more reasonable analytical models. These models will consider the heterogeneity of the nodes and the external conditions, ultimately enhancing the effectiveness and accuracy of project risk management.

Author Contributions

Conceptualization, J.Z.; Methodology, J.X. (Junke Xu); Software, J.X. (Junke Xu); Formal analysis, J.X. (Junke Xu); Investigation, J.X. (Junke Xu); Writing—original draft, J.X. (Junke Xu); Visualization, J.X. (Junke Xu); Supervision, J.X. (Jiancang Xie). All authors have read and agreed to the published version of the manuscript.

Funding

This research was supported by the Jinghe New City Jinghe Flood Control and Ecological Management Engineering Consulting Research Project (No. 107-441220098).

Data Availability Statement

The data used to support the findings of this study are available from the corresponding author upon request.

Conflicts of Interest

The authors declare no conflict of interest.

Appendix A

Appendix A.1. Equilibrium Point Stability and Steady-State Density Analysis

Appendix A.1.1. Equilibrium Point and Stability of the Model

Risk Aversion Balance Point and Stability

To obtain the equilibrium point, let the right-hand side of the equation in the Equation (A2) equal 0, and then according to  S k + E k + I k + R k = 1 . One can obtain the risk-averse equilibrium point  1 , 0 , 0 , 0  and the unique risk-burst equilibrium point  S k * , E k * , I k * , R k * , where:
S k * = γ ν + ε μ + ρ β h k ρ + ε + ν T + 1 γ + ρ ε + γ ν + ε μ + ρ ,
E k * = γ β h k ν + ε T + 1 β h k ρ + ε + ν T + 1 γ + ρ ε + γ ν + ε μ + ρ ,
I k * = γ β h k ρ T + 1 β h k ρ + ε + ν T + 1 γ + ρ ε + γ ν + ε μ + ρ ,
R k * = h k ρ β ε β h k ρ + ε + ν T + 1 γ + ρ ε + γ ν + ε μ + ρ .
Substituting  E k *  and  I k *  into  h  gives:
h = h 1 ν + ε ρ + h 2 j = 1 n j P j k γ β h j ρ T + 1 β h j ρ + ε + ν T + 1 γ + ρ ε + γ ν + ε μ + ρ = Δ f h .
Let the function:
F h = f h h .
It follows that the equation  F h = 0  has a banal solution  h = 0 , i.e., the risk-free equilibrium point  S k = 1 , E k = I k = R k = 0 . At this point, the risk-averse equilibrium point is  E , I , R = 0 , 0 , 0 , whose Jacobi matrix is:
J 0 = μ + ρ T + 1 0 0 ρ T + 1 ν + ε T + 1 0 0 ε T + 1 γ .
It is known that the characteristic roots are all negative,  μ + ρ T + 1 ν + ε T + 1 γ . Thus, according to the theory of differential equations, it is known that there is a risk-averse equilibrium point  ( 1 , 0 , 0 , 0 )  of the system and that the equilibrium point is locally asymptotically stable.

Risk Outbreak Equilibrium and Stability Analysis

Substituting  h = 1  into Equation (A2) gives:
F 1 < 1 .
Derivation of Equation (A2) concerning  h  gives:
F h = f h 1 = h 1 ν + ε ρ + h 2 j = 1 n j P j k γ 2 β j ρ T + 1 ν + ε μ + ρ β h j ρ + ε + ν T + 1 γ + ρ ε + γ ν + ε μ + ρ 2 1 .
The second derivative of Equation (A2) for h gives:
F h < 0 .
Thus, to obtain the equation  F h = 0  to have a non-trivial solution on  0 < h < 1 , i.e., the risk burst equilibrium point  E , I , R = E * , I * , R * , it must satisfy:
F 0 > 0 .
Hence, we have:
d F d h h = 0 = h 1 ν + ε ρ + h 2 j = 1 n j 2 P j k β ρ T + 1 ν + ε μ + ρ 1 = k 2 k h 1 ν + ε ρ + h 2 β ρ T + 1 ν + ε μ + ρ 1 > 0 .
The critical conditions are:
k 2 k h 1 ν + ε ρ + h 2 β ρ T + 1 ν + ε μ + ρ = 1 .
Let  R 0 = k 2 k h 1 ν + ε ρ + h 2 β ρ T + 1 ν + ϵ μ + ρ , then  R 0  is called the fundamental regeneration number, and when  R 0 < 1 , the risk vanishes and there exists a risk-averse equilibrium point  1 , 0 , 0 , 0  and that equilibrium point is locally asymptotically stable. When  R 0 > 1 , the risk will be stable after some control and there exists a unique equilibrium point of risk outbreak  S k * , E k * , I k * , R k * . Substituting the fundamental regenerative number  R 0  into the expression for  h *  gives  S * = 1 R I * E * = ν + ε ρ I * R * = ε T + 1 γ I * , at which point the Jacobi matrix of the equilibrium point of the risk outbreak is:
J * = ν + ε μ + ρ R 0 T + 1 I * μ + ρ T + 1 ν + ε μ + ρ R 0 T + 1 ( S * I * ) ν + ε μ + ρ R 0 T + 1 I * ρ T + 1 ν + ε T + 1 0 0 ε T + 1 γ .
Its characteristic equation can be obtained as:
x 3 + a x 2 + b x + c = 0 ,
of which:
a = ν + ε μ + ρ R T + 1 I * + μ + ρ T + 1 + ν + ε T + 1 + γ > 0 , b = ν + ε μ + ρ R T + 1 I * + μ + ρ T + 1 ν + ε T + 1 + ν + ε T + 1 γ + ν + ε μ + ρ R T + 1 I * + μ + ρ T + 1 γ ν + ε μ + ρ R T + 1 S * I * ρ T + 1 > 0 , c = ν + ε μ + ρ R T + 1 S * I * ρ T + 1 γ + ν + ε μ + ρ R T + 1 I * + μ + ρ T + 1 ε T + 1 γ + ν + ε μ + ρ R T + 1 I * ρ T + 1 ε T + 1 > 0 .
Therefore, we have:
a b c > 0 .
According to the Routh–Hurwitz stability criterion, the real part of all the characteristic roots of the characteristic Equation (A5) are all negative, and the theory of differential equations shows that there is a risk outbreak equilibrium point  ( S * , E * , I * , R * )  in the system and that the equilibrium point is locally asymptotically stable. Let  λ = β h 1 ν + ε + h 2 ρ ν + ε μ + ρ λ c = k T + 1 k 2 , where  λ  is the effective propagation rate of risk in the network and  λ c  is the risk contagion threshold. It follows that when  n + k 2 + λ c 0 , i.e., a very small contagion rate of risk in a scale-free network can also make risk persistent.

Appendix A.2. Steady-State Density Analysis of the Model

In the scale-free grid, the average degree and degree distribution of the network satisfies:
P k = 2 m 2 k 3 , k = m + k P k = 2 m ,
where  m  is the minimum number of connections in the network, substituting Equation (A6) into  h = h 1 Θ 1 t + h 2 Θ 2 t .
h = h 1 ν + ε ρ + h 2 2 m k = 1 n 2 m 2 k 1 γ β h ρ T + 1 β h k ρ + ε + ν T + 1 γ + ρ ε + γ ν + ε μ + ρ = h 1 ν + ε ρ + h 2 m γ β h ρ T + 1 × m + 1 β h k ρ + ε + ν T + 1 γ + ρ ε + γ ν + ε μ + ρ k d k .
Integrate to obtain:
h = γ ν + ε μ + ρ m β ρ + ε + ν T + 1 γ + ρ ε e ν + ε μ + ρ h 1 ν + ε + h 2 ρ m β T + 1 1 .
The proportion of infected nodes in the whole network is  I = P k I k t , where  I k t  denotes the proportion of nodes of degree k in the steady-state infected state, combined with Equations (A6)–(A8), we can obtain  I  as in Equation (A9). According to Equation (A9), we can find out the steady-state density of easily infected nodes, latent nodes, and immune nodes, see Equation (A10).
I = 2 m 2 k 3 γ β h k ρ T + 1 β h k ρ + ε + ν T + 1 γ + ρ ε + γ ν + ε μ + ρ = 2 m 2 γ β h ρ T + 1 m + 1 β h k ρ + ε + ν T + 1 γ + ρ ε + γ ν + ε μ + ρ k 2 d k = 2 m 2 β h γ ρ T + 1 × h ρ + ε + ν T + 1 γ + ρ ε m γ 2 T + 1 ν + ε μ + ρ h 1 ν + ε + h 2 ρ + m + 1 γ ν + ε μ + ρ k 2 d k = 2 m 2 β h γ ρ T + 1 × h ρ + ε + ν T + 1 γ + ρ ε m γ 2 T + 1 ν + ε μ + ρ h 1 ν + ε + h 2 ρ + 1 γ ν + ε μ + ρ m = 2 m β h ρ h ρ + ε + ν T + 1 γ + ρ ε γ ν + ε μ + ρ h 1 ν + ε + h 2 ρ + T + 1 ν + ε μ + ρ = 2 ρ γ m β T + 1 h 1 ν + ε + h 2 ρ e ν + ε μ + ρ h 1 ν + ε + h 2 ρ m β T + 1 1 ν + ε μ + ρ m β h 1 ν + ε + h 2 ρ ρ + ε + ν T + 1 γ + ρ ε e ν + ε μ + ρ h 1 ν + ε + h 2 ρ m β T + 1 1 2
Similarly, we can obtain:
S = 2 ν + ε μ + ρ m β T + 1 h 1 ν + ε + h 2 ρ + e ν + ε μ + ρ h 1 ν + ε + h 2 ρ m β T + 1 1 e ν + ε μ + ρ h 1 ν + ε + h 2 ρ m β T + 1 3 e ν + ε μ + ρ h 1 ν + ε + h 2 ρ m β T + 1 1 2 , E = 2 γ ν + ε m β T + 1 h 1 ν + ε + h 2 ρ e ν + ε μ + ρ h 1 ν + ε + h 2 ρ m β T + 1 1 ν + ε μ + ρ m β h 1 ν + ε + h 2 ρ ρ + ε + ν T + 1 γ + ρ ε e ν + ε μ + ρ h 1 ν + ε + h 2 ρ m β T + 1 1 2 , R = 2 ρ ε m β T + 1 h 1 ν + ε + h 2 ρ e ν + ε μ + ρ h 1 ν + ε + h 2 ρ m β T + 1 1 ν + ε μ + ρ m β T + 1 h 1 ν + ε + h 2 ρ ρ + ε + ν T + 1 γ + ρ ε e ν + ε μ + ρ h 1 ν + ε + h 2 ρ m β T + 1 1 2 .

References

  1. Xin, T.X.; Fan, L. Study on human-induced risk infection process in airport Flight area based on SEIRS model. Ind. Eng. 2016, 19, 56–63. [Google Scholar]
  2. Deng, G.; Lu, F.; Wu, L.; Xu, C. Social network analysis of virtual water trade among major countries in the world. Sci. Total Environ. 2021, 753, 142043. [Google Scholar] [CrossRef] [PubMed]
  3. Wang, J.; Zhao, L.; Huang, R. SIRaRu rumor spreading model in complex networks. Phys. A Stat. Mech. Appl. 2014, 398, 43–55. [Google Scholar] [CrossRef]
  4. Tian, R.-Y.; Zhang, X.-F.; Liu, Y.-J. SSIC model: A multi-layer model for intervention of online rumors spreading. Phys. A Stat. Mech. Its Appl. 2015, 427, 181–191. [Google Scholar] [CrossRef]
  5. Jeon, B.N.; Olivero, M.P.; Wu, J. Multinational Banking and Financial Contagion: Evidence from Foreign Bank Subsidiaries; SSRN: Rochester, NY, USA, 2013. [Google Scholar]
  6. Mingyuan, Z.; Qin, X. Propagation model and intervention effect analysis of Unsafe Behavior of construction workers. China Saf. Sci. J. 2021, 31, 1–9. [Google Scholar] [CrossRef]
  7. Jianjia, H.; Jusheng, L.; Fuyuan, X. Dynamic Modeling and Simulation of time Encroachment Propagation based on SIR Model. Appl. Res. Comput. 2018, 35, 1360–1364. [Google Scholar]
  8. Zanette, D.H. Dynamics of rumor propagation on small-world networks. Phys. Rev. E 2002, 65, 041908. [Google Scholar] [CrossRef] [Green Version]
  9. Ikeda, K.; Okada, Y.; Toriumi, F.; Sakaki, T.; Kazama, K.; Noda, I.; Shinoda, K.; Suwa, H.; Kurihara, S. Multi-agent information diffusion model for twitter. In Proceedings of the 2014 IEEE/WIC/ACM International Joint Conferences on Web Intelligence (WI) and Intelligent Agent Technologies (IAT), Warsaw, Poland, 11–14 August 2014; pp. 21–26. [Google Scholar]
  10. Zhu, K.; Ying, L. Information Source Detection in the SIR Model: A Sample Path Based Approach. IEEE/ACM Trans. Netw. 2016, 24, 408–421. [Google Scholar] [CrossRef] [Green Version]
  11. Kermack, W.O.; McKendrick, A.G. Contributions to the mathematical theory of epidemics-II. The problem of endemicity. Bull. Math. Biol. 1991, 53, 57–87. [Google Scholar]
  12. Xue, M.; Xu, F.; Yang, Y.; Tao, Z.; Chen, Y.; Wang, S.; Yin, J.; Min, M.; Shi, D.; Yao, C. Diagnosis of sepsis with inflammatory biomarkers, cytokines, endothelial functional markers from SIRS patients. Medicine 2022, 101, e28681. [Google Scholar] [CrossRef]
  13. Chernov, A.A.; Shemendyuk, A.A.; Kelbert, M.Y. Fair insurance premium rate in connected SEIR model under epidemic outbreak. Math. Model. Nat. Phenom. 2021, 16, 34. [Google Scholar] [CrossRef]
  14. Lu, M.; Men, K.; Ma, Y.H. Evolution simulation of public opinion in group Social networks based on SIS model. J. Jilin Univ. (Inf. Sci. Ed.) 2023, 41, 106–111. [Google Scholar] [CrossRef]
  15. Jianquan, L.; Zhien, M. Analysis of two types of SEIS infectious disease models with definite incubation period. Syst. Sci. Math. 2006, 26, 9. [Google Scholar]
  16. Yu, Z.; Arif, R.; Fahmy, M.A.; Sohail, A. Self organizing maps for the parametric analysis of COVID-19 SEIRS delayed model. Chaos Solitons Fractals 2021, 150, 111202. [Google Scholar] [CrossRef]
  17. Khalkho, B.R.; Kurrey, R.; Deb, M.K.; Karbhal, I.; Sahu, B.; Sinha, S.; Sahu, Y.K.; Jain, V.K. A simple and convenient dry-state SEIRS method for glutathione detection based on citrate functionalized silver nanoparticles in human biological fluids. New J. Chem. 2021, 45, 1339–1354. [Google Scholar] [CrossRef]
  18. Chunlin, D.; Zhen, H.; Liu, Y. Research on the transmission and prevention of mass incidents based on SIS model. Chin. J. Inf. 2016, 35, 79–84+90. [Google Scholar]
  19. Hallam, T.G.; Zhien, M. Persistence in population models with demographic fluctuations. J. Math. Biol. 1986, 24, 327–339. [Google Scholar] [CrossRef]
  20. Qin, X.; Fan, L. Safety Risk communication mechanism of amphibious seaplanes. Traffic Inf. Saf. 2022, 40, 1–9. [Google Scholar]
  21. Zhang, H.Y.; Liu, Y.H. A Study on Risk System of Water Conservancy and Hydropower Engineering. Adv. Mater. Res. 2012, 459, 450–453. [Google Scholar] [CrossRef]
  22. He, Z.; Huang, D.; Zhang, C.; Fang, J. Toward a stakeholder perspective on social stability risk of large hydraulic engineering projects in China: A social network analysis. Sustainability 2018, 10, 1223. [Google Scholar] [CrossRef] [Green Version]
  23. Yang, Z.; Feng, L.J. Application of Improved LEC Method in the Construction of Water Conservancy Project Hazard Evaluation. Adv. Mater. Res. 2014, 1028, 297–299. [Google Scholar] [CrossRef]
  24. Meng, J.; Zhang, J. Study on risk assessment of EPC water conservancy project based on entropy weight set pair analysis. IOP Conf. Ser. Earth Environ. Sci. 2021, 804, 022045. [Google Scholar] [CrossRef]
  25. Xin, W.; Wang, Y. Research on influencing factors of reservoir construction risk based on interpretative structural modeling. World J. Eng. Technol. 2021, 9, 727–736. [Google Scholar] [CrossRef]
  26. Sun, X. Research on risk management of engineering project. In Proceedings of the 2016 International Conference on Logistics, Informatics and Service Sciences (LISS), Sydney, Australia, 24–27 July 2016; pp. 1–5. [Google Scholar]
  27. Chen, J. Risk management of large water conservancy projects. J. Yangtze River Sci. Res. Inst. 2012, 29, 15. [Google Scholar]
  28. Liu, X.; Xu, C.; Zhang, Z.; Zhang, Y.; Wu, S. Study on the role of eco-environmental impact assessment in performance management assessment of large water conservancy projects. Ekoloji 2019, 28, 1165–1172. [Google Scholar]
  29. Zeng, J.; An, M.; Smith, N.J. Application of a fuzzy based decision making methodology to construction project risk assessment. Int. J. Proj. Manag. 2007, 25, 589–600. [Google Scholar] [CrossRef]
  30. Arabi, S.; Eshtehardian, E.; Shafiei, I. Using Bayesian networks for selecting risk-response strategies in construction projects. J. Constr. Eng. Manag. 2022, 148, 04022067. [Google Scholar] [CrossRef]
  31. El-Sayegh, S.M.; Manjikian, S.; Ibrahim, A.; Abouelyousr, A.; Jabbour, R. Risk identification and assessment in sustainable construction projects in the UAE. Int. J. Constr. Manag. 2021, 21, 327–336. [Google Scholar] [CrossRef]
  32. Perry, J.G.; Hayes, R. Risk and its management in construction projects. Proc. Inst. Civ. Eng. 1985, 78, 499–521. [Google Scholar] [CrossRef]
  33. Heng, Y.; Wu, M.; Wen, X.; Bedon, C. Identifying Key Risk Factors in Air Traffic Controller Workload by SEIR Model. Math. Probl. Eng. 2022, 2022, 7600754. [Google Scholar] [CrossRef]
  34. Yuting, W.; Chun, F.; Ke, Z.; Ming, L.; Song, X. Research on SEIRS Based Quality Risk Transmission Model and Simulation of Construction Projects. Oper. Res. Manag. 2020, 29, 214–221. [Google Scholar]
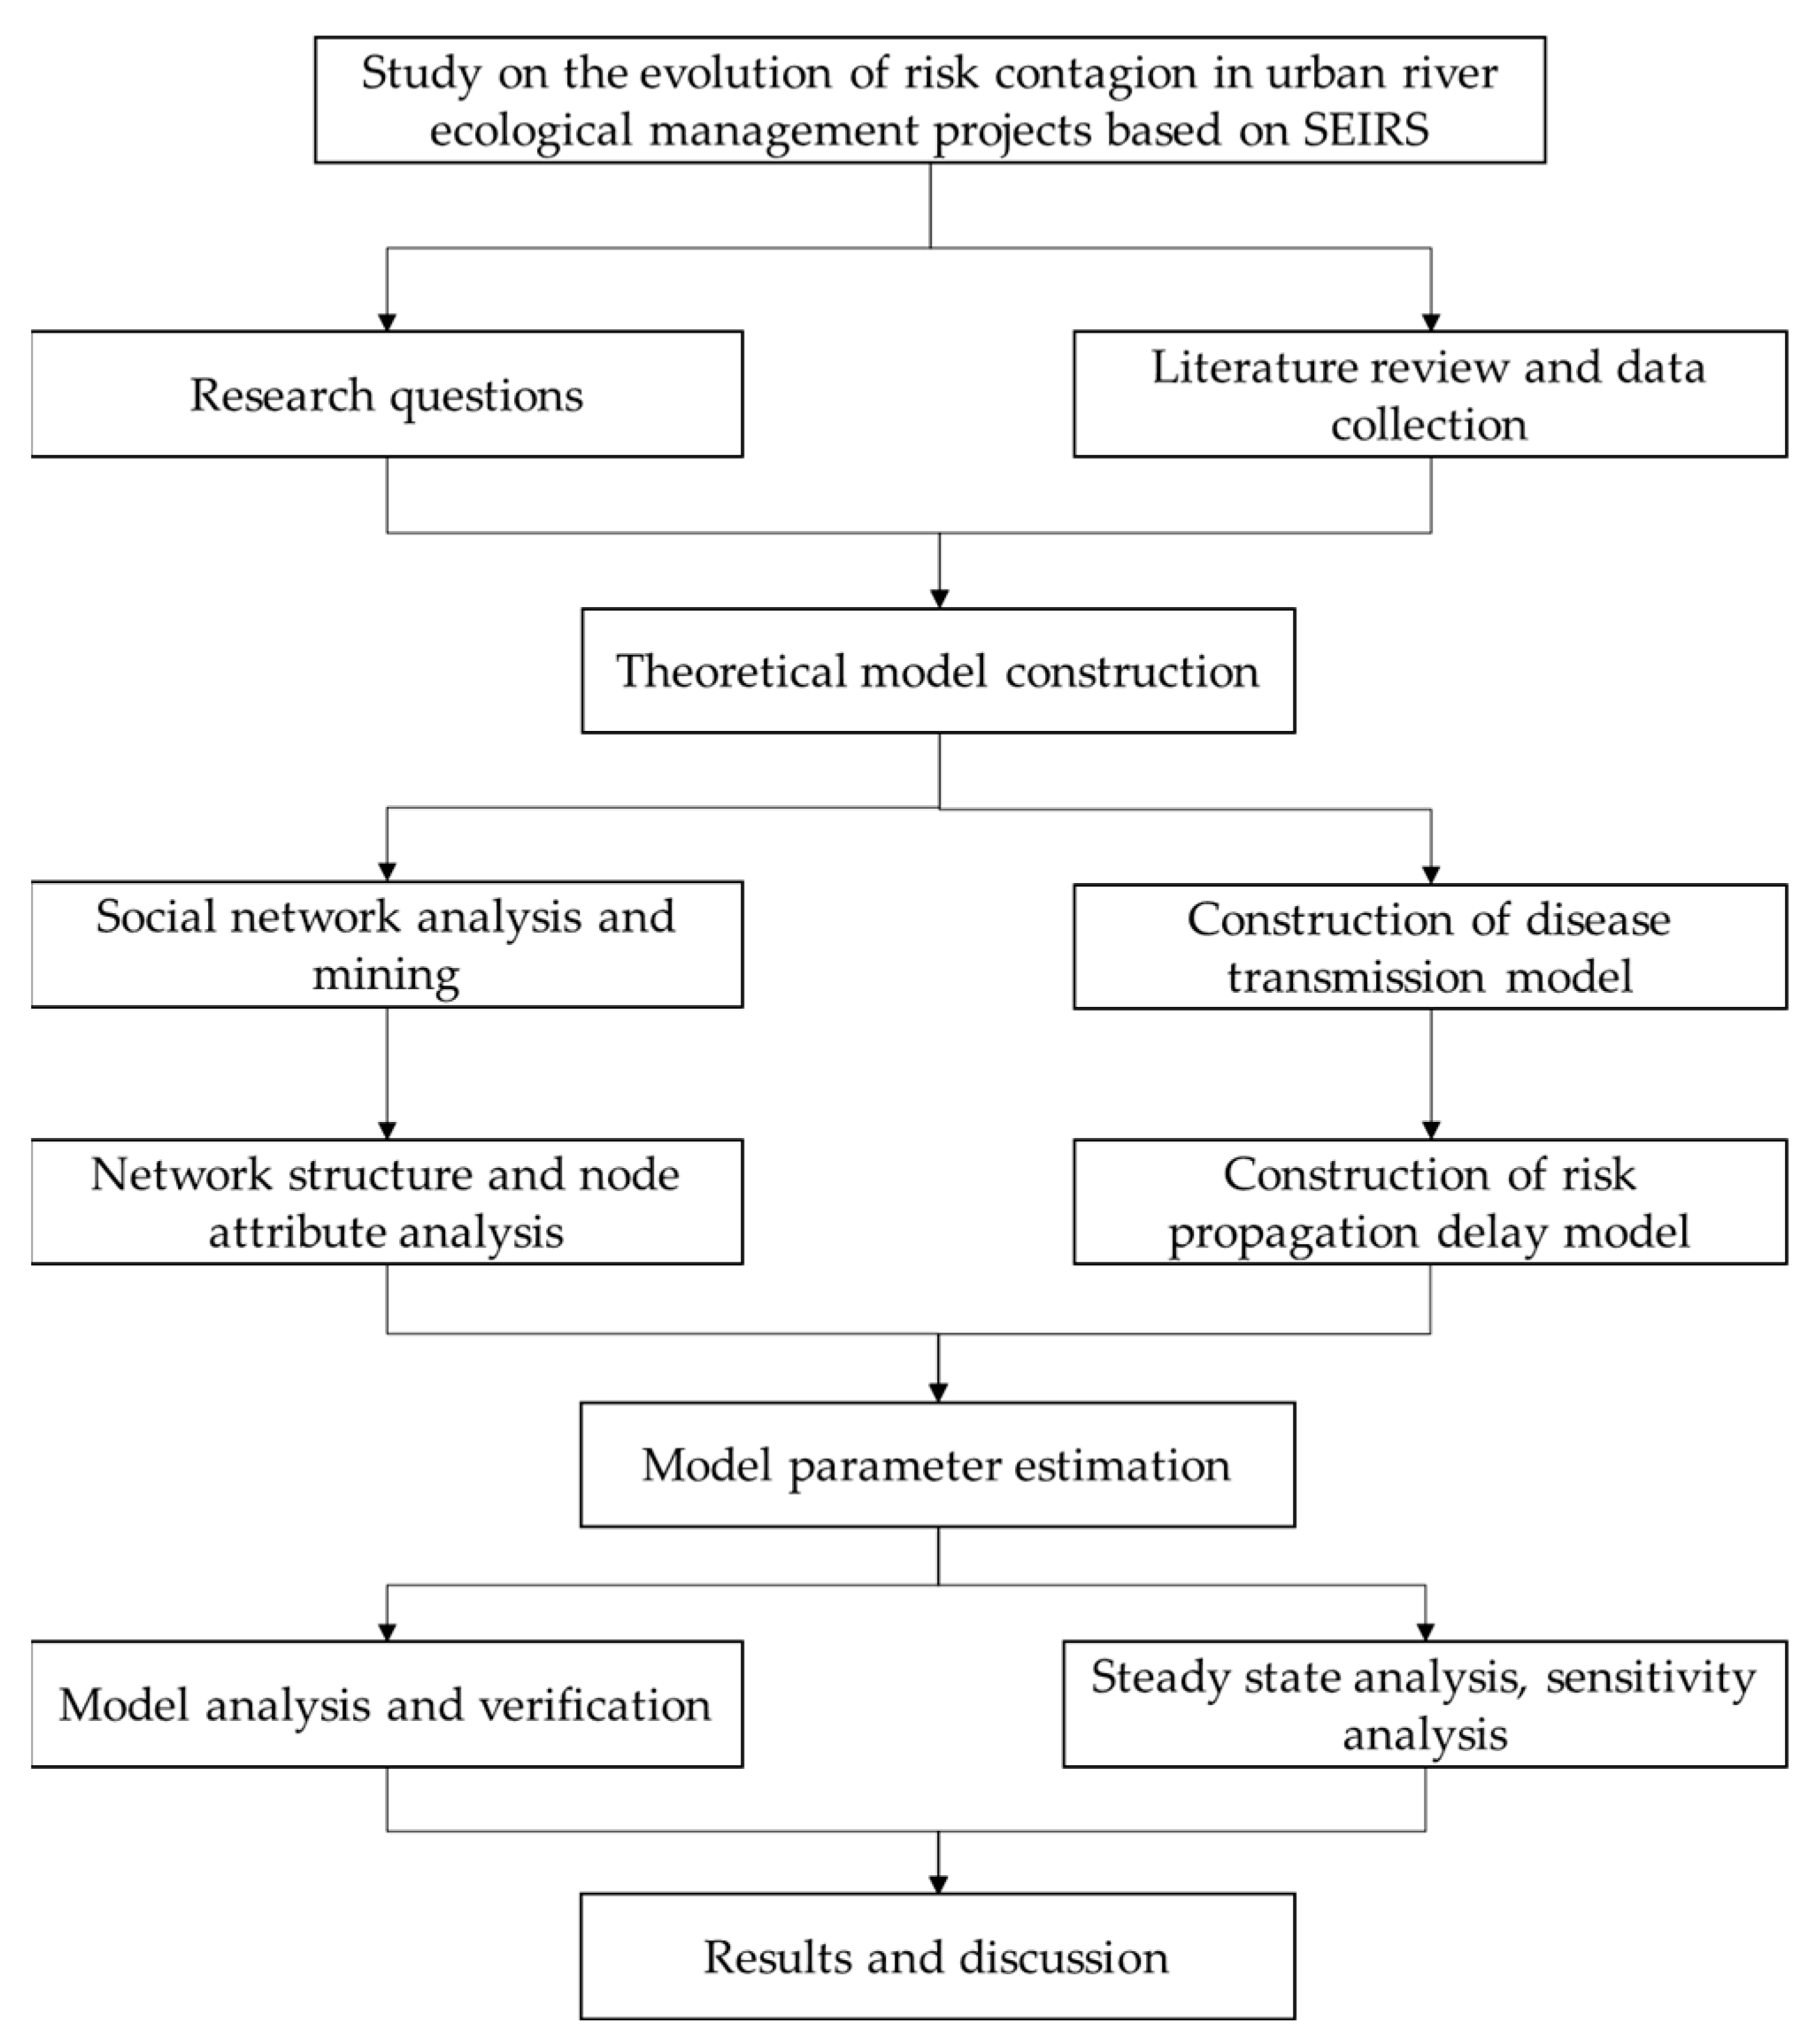
Figure 1. The overall layout of this study.
Water 15 02622 g001
Figure 2. Risk network relationship diagram.
Water 15 02622 g002
Figure 3. Ranking graph of node degree values in risk evolution network.
Water 15 02622 g003
Figure 4. SEIRS model.
Water 15 02622 g004
Figure 5. SEIRS model target immunity model.
Water 15 02622 g005
Figure 6. Dynamic evolution of the network model over time: (a) Dynamic evolution of the risk network for N = 1500. (b) Dynamic evolution of the risk network for N = 50. (c) Dynamic evolution of the risk network for N = 10.
Water 15 02622 g006
Figure 7. Propagation threshold λc Relationship between, T, and N. (a) A function of delay time for the contagion threshold; (b) Contagion threshold as a function of network size.
Water 15 02622 g007
Figure 8. The variation pattern of effective transmission rate  λ  with  h 1  and  h 2 .
Water 15 02622 g008
Figure 9. Variation of steady-state density with delay time  T . (a h 1 = 0.01 , h 2 = 0.03  Variation of steady-state density with delay time  T ; (b h 1 = 0.1 , h 2 = 0.3  Variation of steady-state density with delay time  T .
Water 15 02622 g009
Figure 10. The relationship between infection node, latent node and  h 1 h 2 . (a) Steady-state density of infected nodes as a function of  h 1  and  h 2 ; (b) Steady-state density of latent nodes as a function of  h 1  and  h 2 .
Water 15 02622 g010
Figure 11. Steady-state density of infected and latent nodes with h2 for  h 1 = 0.01 . (a) The law of steady-state density of infected nodes changing with  h 2 ; (b) The law of steady-state density of Latent Nodes changing with  h 2 .
Water 15 02622 g011
Figure 12. Steady-state density of infected and latent nodes with h1 for h2 = 0.03. (a) The law of steady-state density of infected nodes changing with  h 1 ; (b) The law of steady-state density of Latent Nodes changing with  h 1 .
Water 15 02622 g012
Figure 13. The sensitivity of model parameters and model states. (a) Non-normalized sensitivity; (b) Normalized sensitivity.
Water 15 02622 g013
Figure 14. Relationship between relative steady-state density of risk infection nodes and immune probability and delay time. (a) Relative value of steady-state density of risk-infected nodes versus probability of immunity; (b) Relative value of steady-state density of risk-infected nodes versus delay time.
Water 15 02622 g014
Table 1. River ecological management project risk factors.
StageRisk 1 Level Risk 2 Level
1 Project concept stage1 Political RiskA1 Policy risk
A2 Legal and regulatory risks
2 Economic RisksA3 Inflation risks
A4 Risk of interest rate changes
A5 Financing risk
3 Natural environmental risksA6 Hydrological and geological risks
A7 Risk of meteorological conditions
A8 Ecological environment risk
4 Social RisksA9 Sociocultural risk
A10 Resident negotiated land acquisition risk
A11 Social security situation
A12 Public opinion
2 Project decision stage5 Project decision riskA13 Project approval risk
A14 Basic acceptance risk before implementation
A15 Risk of decision-making error
A16 Risk of land change
A17 Risk of incomplete collection of basic data
3 Project preparation phase6 Bidding risksA18 Risk of document loss
A19 Risk of improper competition
A20 Information leakage risk
A21 Bid evaluation risk
A22 Normative risk of bidding process
7 Plan and design risksA23 Risk of qualification of design unit
A24 design schedule lag
A25 There are defects, errors, omissions, and frequent changes in the design plan
A26 Survey accuracy risk
8 Prepare for risks before constructionA27 Construction site layout and technical preparation risk
A28 Project contract risks
A29 Risk of insufficient supply of substances (materials) and materials
A30 Risk of illegal start
4 Project implementation phase9 Construction personnel riskA31 Technical water risk
A32 Weak security awareness
A33 Employee qualification risk
A34 Risk of construction personnel slowing down
10 Construction technical risksA35 (construction) drawings improper design risk
A36 Engineering and technical risks
A37 Construction machinery and equipment condition risk
A38 Cross operation condition risk
A39 Risk of construction accidents
11 Construction management risksA40 Safety management risks
A41 Coordination risks of participating parties (including technical disclosure)
A42 Rationality of construction organization design
A43 Plan Adjustment and engineering change risk
A44 Contract management and enforcement risks
A45 Risk of organizational structure setup confusion
A46 Manage permission risk
12 Construction duration factor riskA47 Certification period
A48 Construction period
A49 Risk of construction delay
13 Completion acceptance riskA50 Risk of file transfer not in place
A51 Quality assessment risk
A52 Audit risk
A53 Risk of cost overruns
Table 2. Risk factor adjacency matrix.
A1A2A3A4A5A6A7A47A48A49A50A51A52A53
A101010000000000
A200000000000000
A310010000000001
A400001000000001
A500000000000000
A600000000000000
A700000000000000
0
A4700000000000000
A4800000001010000
A4900000001000001
A5000000000000000
A5100000000000000
A5200000000000000
A5300100000000000
Table 3. Overall network parameter characteristics.
Parameter NameOverall NetworkParameter NamesOverall Network
Number of nodes53Network diameter7
Number of network edges255Network average aggregation coefficient0.2977
Network density0.0925Intermediation centrality0.0331
Network average path2.5287Approach centrality0.3015
Network average9.6226Global network efficiency0.5281
Disclaimer/Publisher’s Note: The statements, opinions and data contained in all publications are solely those of the individual author(s) and contributor(s) and not of MDPI and/or the editor(s). MDPI and/or the editor(s) disclaim responsibility for any injury to people or property resulting from any ideas, methods, instructions or products referred to in the content.