Article

Assessment of the Streamflow and Evapotranspiration at Wabiga Juba Basin Using a Water Evaluation and Planning (WEAP) Model

by
Abdirahman Ismail Dhaqane
1,2,*,
Mohamad Fared Murshed
1,*,
Khaldoon A. Mourad
3 and
Teh Sabariah Binti Abd Manan
1,4
1
School of Civil Engineering, Engineering Campus, Universiti Sains Malaysia, Nibong Tebal 14300, Pulau Pinang, Malaysia
2
Faculty of Engineering, Mogadishu University, Hodon District, Mogadishu P.O. Box 004, Somalia
3
The Center for Sustainable Visions, 223 62 Lund, Sweden
4
Institute of Tropical Biodiversity and Sustainable Development, Universiti Malaysia Terengganu, Kuala Terengganu 21030, Terengganu, Malaysia
*
Authors to whom correspondence should be addressed.
Water 2023, 15(14), 2594; https://doi.org/10.3390/w15142594
Submission received: 17 May 2023 / Revised: 19 June 2023 / Accepted: 27 June 2023 / Published: 17 July 2023
(This article belongs to the Section Hydrology)

Abstract

:
Rapid population growth, industrialization, and agricultural activities have impacted water resources in the arid and semi-arid areas of Somalia. The Lower Juba region in Somalia has been the most affected region. Therefore, an analysis of the hydrological patterns is essential. This paper assesses streamflow and evapotranspiration in the Wabiga Juba basin in Somalia using a hydrological simulation model, namely, the water evaluation and planning (WEAP) system via the soil moisture method. The datasets included 53 (average precipitation) and 13 (streamflow) year periods from two meteorological stations. The estimated values for potential evapotranspiration (11,921.98 to 20,775.39 MCM) were higher than the actual evapotranspiration (4904.10 to 8242.72 MCM) by 50 to 79.5%, respectively. The annual streamflow in Juba Dolow and runoff proportion of the Wabiga Juba River was estimated to be 10% of the annual precipitation. Most of the surface runoff occurred in April (47%), May (31%), October (5%), and November (14%). The streamflow variation responded to the pattern of precipitation. The model performance achieved a Nash–Sutcliffe model efficiency (NSE) coefficient of 0.71, coefficient of determination (R2) of 0.91, and percent bias (PBIAS) of 14%. The WEAP model of the Wabiga Juba basin is a baseline study for water resource management in Somalia to mitigate water shortage impacts due to limited water resources.

1. Introduction

Water shortages are a significant drawback to national socioeconomic development [1,2]. There is a need to find a solution to water reservation and allocation disputes in developing and developed countries. One of the biggest obstacles to health and socioeconomic development in diverse communities is the lack of access to freshwater. Applying an integrated strategy that considers the environment, ecological processes, and human activities in catchment areas is essential for the efficient management of water resources. This includes discussing how to manage the various ways water is valued, and it illustrates how decisions affecting the environment, politics, science, tradition, engineering, economics, culture, and tradition can have an impact. Around the world, there are many discussions about water resource challenges. Information on the primary determinants of hydrological changes and their related elements of regional water resources is needed to address these concerns. The work of evaluating water resources is difficult, and there are numerous things to consider. As part of an integrated strategy for water management strategies and policies, knowledge of the spatial and temporal distribution of water resources is crucial [3]. For water resources, an equitable and sustainable water allocation assessment of their many uses in a catchment via a long-term streamflow study is essential. Among the most crucial elements in hydrological systems, streamflow exhibits both geographical and temporal variability. It is crucial for managing and accessing water resources. To accurately estimate the hydrology of a watershed, it is essential to comprehend the features of a streamflow [4]. Therefore, quantification of the availability, consumption, and management of water is vital and can only be addressed using hydrological models.
Numerous studies have evaluated the effects of climate change and climatic variability on water supply, as well as potential management techniques to deal with growing scarcity [5,6]. The WEAP model, among other hydrological and water allocation models, can be used in studies of water resource management, including the above situation [7]. Understanding the quantity and quality of the water that is available is necessary for the effective and responsible management of water resources. The fragmented water sector in Somalia must be organised in order to create an efficient system of water governance [8]. The institutional capacity to manage, deliver, and prioritise current or future investment possibilities is limited. Because of a lack of defined or written roles for organizations involved in the water sector, there is competition for resources, such as financing for water-related projects, as well as conflicts over who is responsible for what [9]. The southern region of Somalia suffers from a significant water shortage problem. The downstream portions of the middle catchments experience a particularly severe water crisis as a result of the Juba River drying up during the dry seasons, as well as from the area’s low rainfall levels. Growing anthropogenic and socioeconomic activity in the basin has resulted in severe water scarcities in recent years, especially from January to March. Because of its climate, the basin frequently experiences droughts and floods, which pose serious issues mostly for people who reside downstream in the Juba basin [10]. The Juba River’s high floods both benefit and harm residents of the riverine areas in different ways [11]. Droughts have recently occurred in the years 1973–1976, 1979–1980, 1984–1989, 2000–2001, 2006, and 2008, among others [11]. Additionally, because most of the rivers’ water comes from sources outside of Somalia, Ethiopia’s development of its water resources has a significant impact on how the rivers flow [11].
Three morphologic (i.e., urban) areas can be found in the Juba River basin. With monsoon winds and rainfall, the higher region is characterised by high mountains, steep slopes and rocky characteristics, mountain peaks, and high plateaus, while the dominant processes in the middle region are transport and deposition [12]. Gu and Deyr are Somalia’s two rainy seasons. The Gu season is regarded as the main rainy season since it regulates the Deyr season in terms of rainfall quantity and dependability. With a maximum temperature of 41.3 °C in March and a low temperature of 17 °C, the average annual temperature is between 25 and 30 °C [12]. The intertropical convergence zone (ITCZ) is the air that flows from the north and south-easterly. The study area is mainly arid and semi-arid. The average annual rainfall is approximately 123 mm. The average year rainfall is approximately 123 mm, and the GU season accounts for 75% of this total [8,9]. Variations in the temperature, precipitation, and the frequency of extreme weather events have all affected class existence, forest structure, the incidence of pests and diseases, and climate-related dangers [13].
Runoff and other hydrological processes can be predicted using distributed hydrological models, in which the hydrological methods are assessed at many places in space, and lumped models, whose hydrological system is spatially averaged. The opportunity to estimate variables that are by their nature very challenging to measure in the field is provided with hydrological modeling [14]. Currently, there are many different models that have been used to simulate hydrological processes and human interactions with the environment to develop water allocation plans and water resource management strategies, for example, MIKE BASIN [15] and WEAP [16,17,18]. Stakeholder participation in the development and decision-making process is made easier by these models’ interactive graphic interfaces [19]. Water Evaluation and Planning (WEAP) is a software tool that is based on water balance and can simulate some elements of rainfall–runoff, water demand and supply system. Even stakeholders can readily participate in the modeling process thanks to the model’s thoroughness, simplicity, and user-friendliness [20]. Additionally, WEAP is the instrument for global integrated water resource management (IWRM) that is utilised the most frequently [17].
The hydrologic simulation in WEAP model have different methods such as soil moisture, simplified coefficient, and WEAP–plant growth model (WEAP-PGM) methods. In general, the WEAP model performance can be assessed based on statistical justification, such as the coefficient of determination (R2), Nash–Sutcliffe model efficiency (NSE) coefficient, and percent bias (PBIAS) [21]. An R2 value less than 0.3 is an indication of weak correlation (R2 < 0.3, weak correlation). An R2 value of more than 0.3 and less than 0.5 refers to moderate correlation (0.3 < R2 <0.5, moderate correlation). An R2 value of more than 0.7 indicates a strong correlation with the dependent variable (R2 > 0.7, strong correlation). As for the NSE, values ranging from 0.75 to 1 refer to an optimal value (0.75 ≤ NSE ≤ 1, optimal value). The NSE values ranging from 0.75 to 0.65 indicate a good level of performance (0.65 ≤ NSE ≤ 0.75, good level of performance). NSE values ranging from 0.50 to 0.65 refer to a fair performance (0.50 ≤ NSE ≤ 0.65, fair performance). NSE values less than 0.50 refer to an unacceptable performance because the observed value was found to be better than simulated values (NSE < 0.50, unacceptable performance). PBIAS values ranging from 0 to 10% indicate a very good performance (0 ≤ PBIAS ≤ 10%, very good performance). PBIAS values ranging from 10 to 15% refer to a good performance (10% ≤ PBIAS ≤ 15%, good performance). PBIAS values ranging from 15 to 25% indicate a fair performance (15% ≤ PBIAS ≤ 25%, fair performance). PBIAS values of more than 25% refer to an inadequate value (PBIAS > 25%, inadequate performance).
The application of WEAP models were mainly reported in the data-scarce regions, such as in Chongwe River Catchment (Zambia) (soil moisture method, R2 = 0.97) [22], Central Rift Valley basin (Ethiopia) (soil moisture method, R2 = 0.82) [14], Mahanadi River basin (India) (soil moisture method) [23], Awash basin (Ethiopia) (soil moisture method, R2 = 0.88) [24], Mae Klong (Thailand) (simplified coefficient method, R2 = 0.91) [25], South Phuthiasana (Tanzania) (WEAP and SWAT models, R2 = 0.64) [26], Lake Ziway (Ethiopia) (SWAT, R2 = 0.6) [27], Sakarya River basin (Turkey) (WEAP-PGM, R2 = 0.89) [28], Central Indus basin (WEAP-PGM, R2 = 0.89) [29], and Mae Klong (Thailand) (WEAP-PGM, R2 = 0.818) [30] (Table 1).
In recent years, there have been serious water shortages as a result of Wabiga Juba’s ongoing and repeated drying up. Moreover, hydrological model of Wabiga Juba basin has yet to be reported. Understanding the quantity and quality of the available water resources in great detail is essential for effective integrated water resource management. To address this issue, a model of the Wabiga Juba basin’s evapotranspiration, streamflow characteristics, and available water resources can be developed. Unlike any other field research areas, hydrologic simulation studies at data-scarce regions are unique and considered novel due to its complex nature. The hydrologic simulation itself is based on water fluxes movement in biological organism and/or two layers of soils, making it difficult to be compared with other common mathematical models, including the complex machine learning approach. Therefore, hydrological simulations are not as simple as it seems to be because the pattern was generated from years of data in data-scarce regions, and the behaviour of the data is organic. Any disagreement on the novelty of any hydrological simulation studies, especially in data-scarce regions, are based on a difference of perception. Moreover, hydrologic simulations were commonly reported by the native researchers of the data-scarce regions for a noble cause: to help their own nations with water-resource protection (Table 1). Other than research interest, hydrologic simulations of a country also represent the national attitudes of the researchers towards their motherland.
Therefore, this study aims to assess streamflow and evapotranspiration in the Wabiga Juba basin in the Wabiga Juba catchment using hydrological simulation model, namely the WEAP system via the soil moisture method. The model covers the entire river basin and is physically continuous, with areas constructed and grouped as subcatchments.

2. Methodology

2.1. Study Area and Data Collection

The study area was the Juba River basin. It has some of the Somalia’s greatest irrigated areas. It is located between the longitudes east 41°53 and latitudes 0°16′ south and 5°04 between north Somalia (Figure 1). The Juba River basin area is 218,114 km2 [12]. Table 2 shows the (a) data sources used in the Wabiga Juba basin–WEAP model, (b) water components for the Wabiga Juba basin for the selected years, and (c) averaged monthly climate values of the Wabiga Juba catchment (1969 to 2018). The climate (ET, atmospheric temperature, precipitation, relative humidity, and wind speed) and physical data were provided by the Somalian Meteorological Department (Table 2 (c)). The monthly rainfall data (from the year 1967 up to 2019), streamflow data for Luq and Bardere on the Juba River were collected from the Somalian Meteorological Department.
Monthly precipitation (million cubic meter (MCM), wind speed (m/s), relative humidity (%), and temperature (°C)), land use (e.g. agriculture, aquaculture, tourism), and geographic location (latitude and longitude) are required to simulate the hydrological processes by monthly in WEAP model [17]. The sub-basin or land-use level to evaluate the hydrologic behaviour, the WEAP hydrologic model was used in this study. It is based on the rainfall–runoff method and continuous lumped model. This provides a one-dimensional, two-layer model for a sub-basin unit at the root zone (or “bucket”) using an empirical function-based dynamic accounting system for soil moisture, water is separated into evapotranspiration (ET), surface runoff, subsurface runoff (also known as interflow), and deep percolation [33]. By using WEAP’s rainfall–runoff modeling approach, four sub-basins made up the main Juba basin. In this research, simulated and observed monthly streamflow were measured at two gauging stations (GS) namely Juba-GS and Bardere-GS for the purpose of calibration and validation. The Penman–Monteith equation was used in WEAP to obtain ET values from climate and land use data.

2.2. The WEAP Model Performance

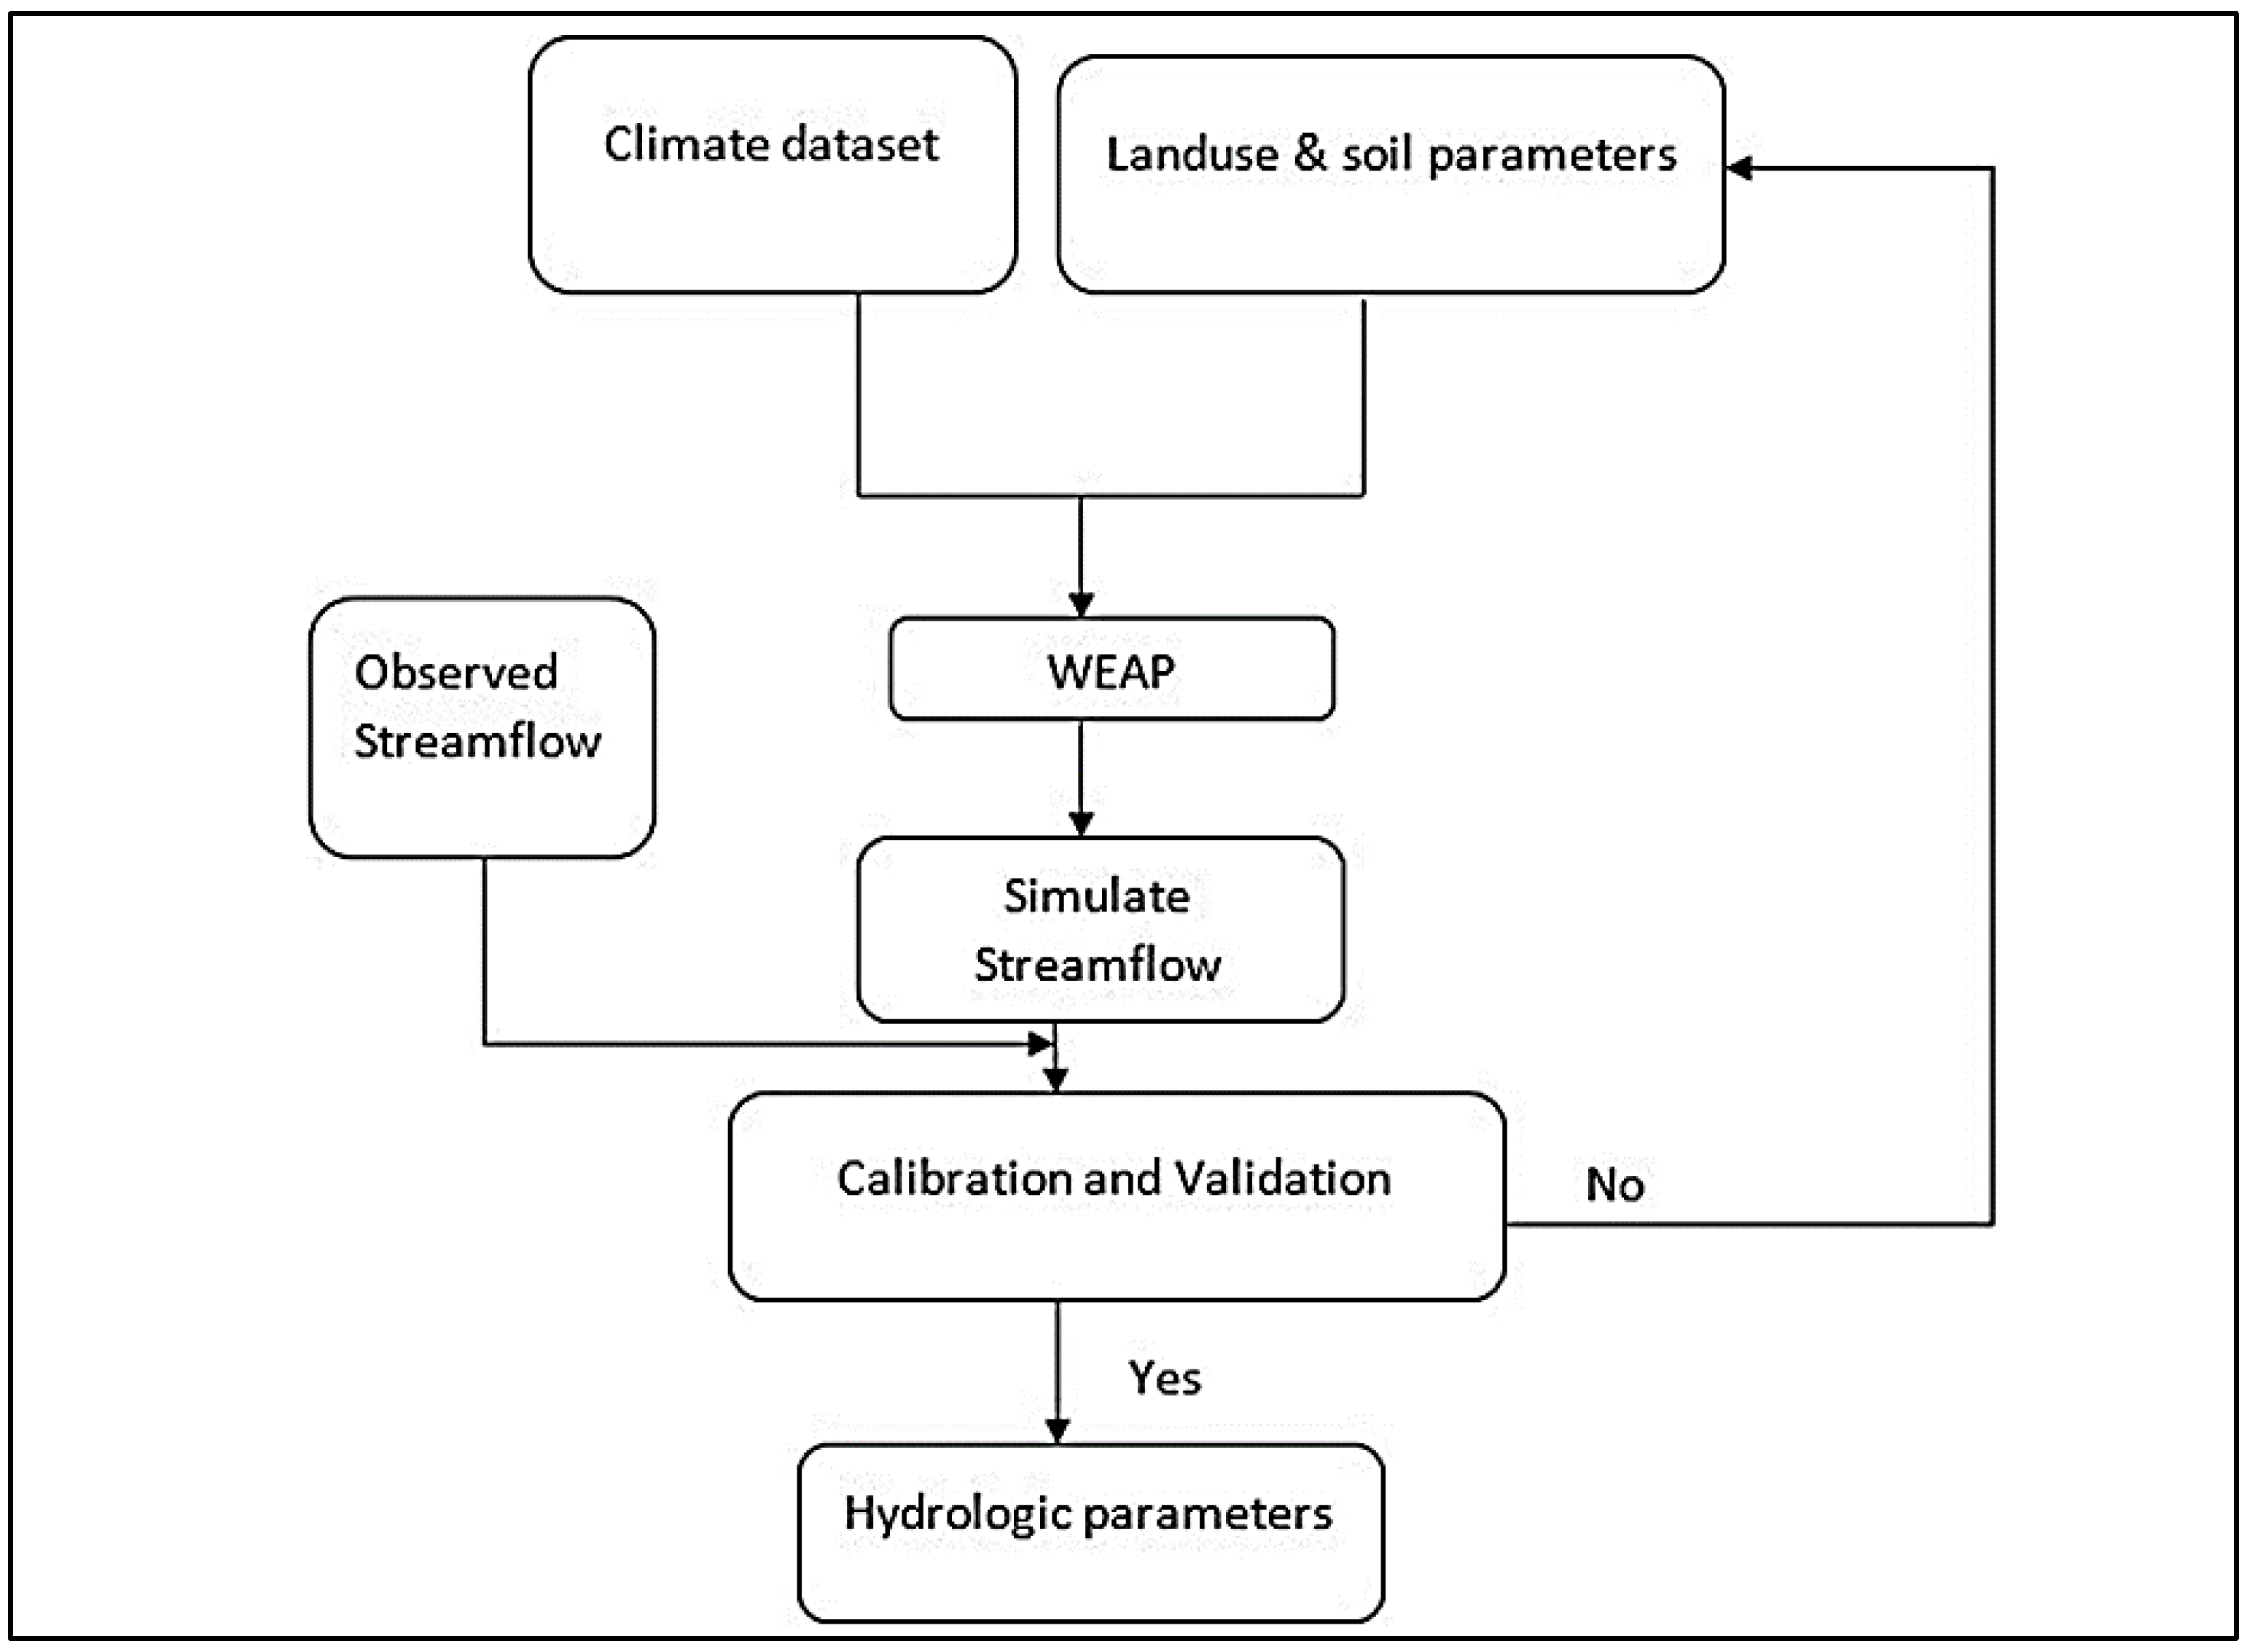
Figure 2 shows the schematic diagram for WEAP hydrological model. The WEAP model’s performance of Luq-GS and Bardere-GS were evaluated using simulated and observed mean of monthly hydrographs plotted together, as well as typical statistical techniques (NSE, PBIAS, and R2) [3].
The observed streamflow data for the Luq-GS and Bardere-GS received from Somalian hydrometeorological during a period spanning the hydrological from year 2002 to 2014 were used to calibrate the WEAP model. Data and parameters were initially defined in WEAP model. Following the calibration of the model parameters, the model was setup by employing a “Key Assumption” of the physical characteristic values for each sub-basin. Table 3 provides a summary of the descriptions, certain parameters, and related default values.
Table 3 shows the parameters used in the manual calibration of the WEAP model to simulate discharge data. The selected values were based on the location of the study area and the default values of the WEAP.

2.2.1. Nash–Sutcliffe Efficiency (NSE)

A common statistic called Nash–Sutcliffe efficiency (NSE) is used to assess how much the residual difference deviates from the variance of the observed data. (Equation (1)) [2,3].
N S E = 1 i = 1 N Q o i Q s i 2 i = 1 N Q o i Q ¯ o ¯ 2

2.2.2. Percent Bias (PBIAS)

The simulated average tendency of values to be higher or lower than their observed values is measured by percent bias (PBIAS). The preferred PBIAS value is 0. The lower values of PBIAS show strong model simulation accuracy. Positive PBIAS values, however, show an underestimate bias of the model simulation, whereas negative values reflect an overestimation PBIAS (Equation (2)) [1].
P B I A S = i = 1 n Q o i Q s i 100 i = 1 n Q o i  

2.2.3. Coefficient of Determination

The coefficient of determination (R2), which reflects how well the regression model fits the data observed, is a measure of how well the two variables are related or fit together. The closer R2 is to 1, the better (Equation (3)).
R 2 = i = 1 n Q o i Q ¯ O Q s i Q ¯ s i = 0 n Q o i Q ¯ o 2     i = 0 n Q o i Q ¯ o 2 2
  • Q o i = is observed discharge;
  • Q s i = is simulated discharge;
  • Q ¯ o = is mean of the observed discharge;
  • Q ¯ s = is the mean of the simulated discharge.

2.2.4. Validation and Classification Criteria

The validation and classification criteria for hydrological models are illustrated in Table 4. The observed and simulated streamflow was made comparison by checking of the accuracy of the model using NSE, PBIAS, and R2 values.

3. Results and Discussion

3.1. Hydrologic Model Development: WEAP

Potential evapotranspiration (PET) and actual evapotranspiration (AET) are hydrological parameters important in water resource management and sustainable development [34]. Figure 3 shows the WEAP model’s mean monthly simulated PET and AET for the Wabiga Juba basin.
The Wabiga Juba catchment has an average monthly PET of 20,067 MCM (January); 17,022.28 MCM (February); 17,844.94 MCM (March); 15,686.41 MCM (April); 13,686.64 MCM (May); 11,921.98 MCM (June); 12,589.50 MCM (July); 15,557.80 (August); 18,274.40 MCM (September); 20,776.39 MCM (October); 20,047.98 MCM (November); and 19,755.71 MCM (December). PET serves as a reference value to assess the water demand of vegetation under ideal growing conditions. The high ranges of PET values were observed from January to March (17,022.28 to 20,067 MCM) and September to December (18,274.40 to 20,776.39 MCM). The PET values were low from April to August (11,921.98 to 15,686.41 MCM). High PET is an indication of high-water loss probably due to climatic factors (e.g., temperature, humidity, sunlight, and wind) [35,36]. Farmers can adjust their irrigation practices and crop planning from April to August to ensure sufficient water supply for optimal plant growth and yield. PET helps in assessing regional water deficits from January to March and from September to December, estimating potential impacts of climate change on water resources and developing adaptation strategies. Therefore, water resources can be allocated and decisions on water allocation during dry periods can be made.
Meanwhile, the estimated monthly average AET were 5747 MCM (January); 3496.95 MCM (February); 3839.89 MCM (March); 5956.86 MCM (April); 6826.94 MCM (May); 5651.83 MCM (June); 5040.09 MCM (July); 5253.18 MCM (August); 4904.10 MCM (September); 6855.60 MCM (October); 8242.72 MCM (November); and 7252.05 MCM (December). The AET values can quantify the inputs and outputs of water within a specific area (also known as water balance equation) in actual condition. By comparing AET with precipitation and other water inflows, the water deficit in an area can be evaluated. The water availability, groundwater recharge, and streamflow generation can be predicted. Water requirements of different ecosystems (e.g., forests, wetlands, and grasslands) can be determined from AET via ecological modeling of natural resources (e.g., plant growth, ecosystem productivity, and species distribution) [37]. Overall, periods of water stress and drought can be identified from PET and AET, enabling timely responses, such as water conservation measures, land management strategies, and drought preparedness plans.
It was observed that, the PET values were larger than AET throughout the year. Similar findings from the WEAP model were also reported from the Chongwe River Catchment in Zambia [7]. The Chongwe River basin’s average annual AET and PET amounts to 4063.68 MCM (786 mm) and 6061.88 MCM (1172.81 mm), respectively. PET is generally higher than AET because it reflects the maximum water amount that could be evaporated and transpired with unlimited access to water (also known as theoretical maximum water loss). PET does not account for the limitations from water availability (e.g., soil moisture content, soil salinity, groundwater levels, or rainfall patterns) [38,39,40], vegetation and plant physiology (e.g., plant stress, leaf area index, or stomatal resistance) [37], environmental (e.g., land surface characteristics, such as vegetation cover, soil type, and slope) [38], and climatic (e.g., temperature, humidity, solar radiation, and wind speed) [2] factors. However, there can be situations where AET exceeds PET. This is due to abundant water supply (from high precipitation rate or water supply from irrigation) [41], high vegetation density (high atmospheric humidity level) [37], and errors in measurement (errors in data collection and modeling) [42]. Other spatial and temporal variations that contributes to higher AET are topography, land use, and soil characteristics.
The percentage differences between PET and AET were 71.4% (January); 79.5% (February); 78.5% (March); 62.0% (April); 50.1% (May); 52.6% (June); 60.0% (July); 66.2% (August); 73.2% (September); 67.0% (October); 58.9% (November); and 63.3% (December). Overall, the values for PET throughout the year (ranging from 11,921.98 to 20,775.39 MCM) will be higher than AET (ranging from 4904.10 to 8242.72 MCM) by 50 to 79.5%. Desta and Lemma [27] reported that 64 to 79.5% of precipitation was lost to the atmosphere through ET. Another research in the Mae Kong Basin, Thailand, indicated that the watershed will lose 80% (1411.7 mm) of its annual average water supply as a result of AET and PET [32]. ET consumes more than 60% of the world’s precipitation, which makes up the majority of water outflow and is excessively high in relation to the insufficient amount of precipitation [43].
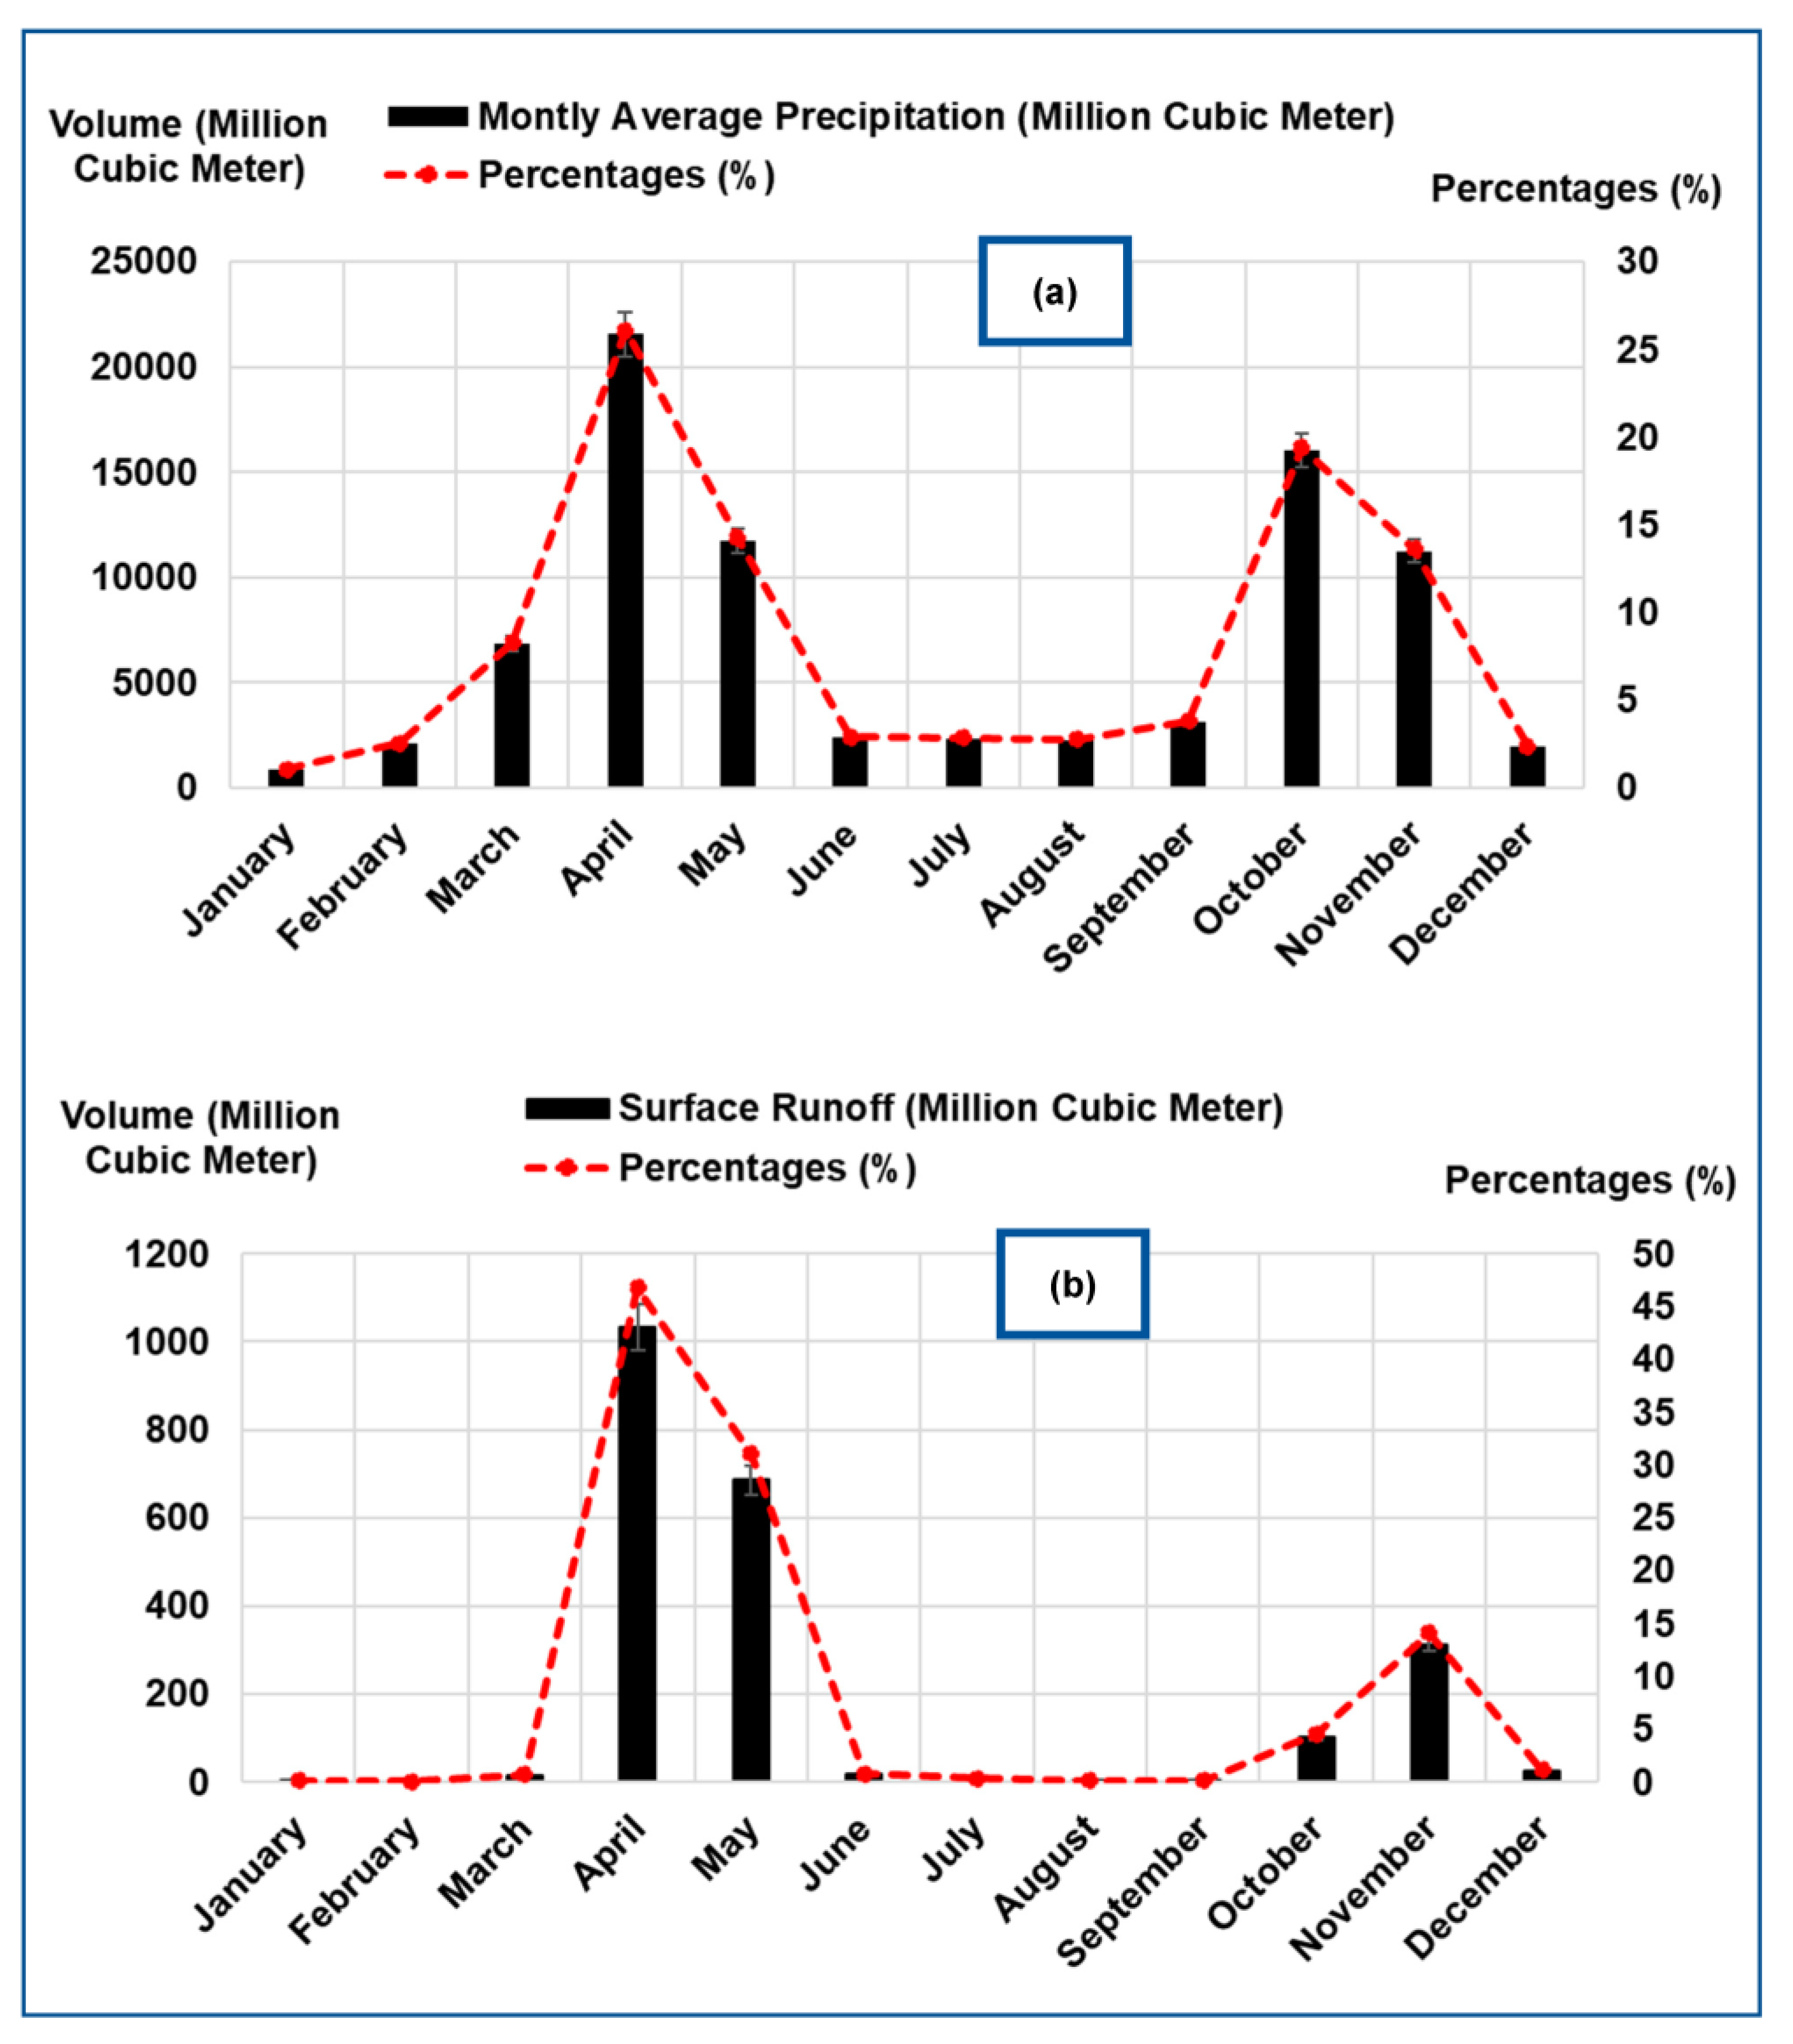
Precipitation and surface runoff are interrelated to each other [44,45]. Precipitation is the primary source of water that enters the hydrological system. It provides the initial water input that drives various hydrological processes, such as infiltration, evaporation, transpiration, and surface runoff. Surface runoff is the portion of precipitation that flows over the land surface, contributes to streamflow in rivers and other water bodies [44]. The WEAP model’s simulated monthly mean (a) precipitation, and (b) surface runoff for Wabiga Juba catchment is shown in Figure 4. The estimated monthly average precipitation for Wabiga Juba catchment were 893.5 MCM (January); 2099.12 MCM (February); 6839.49 MCM (March); 21,552.46 MCM (April); 11,751.7 MCM (May); 2410.78 MCM (June); 2353.28 MCM (July); 2277.48 MCM (August); 3151.26 MCM (September); 16,032.81 MCM (October); 11,258.11 MCM (November); and 1948.94 (December). An accurate estimation of precipitation is crucial to ensure that the water balance within the system is properly represented in the simulation model.
Hydrological models simulate the movement of water through the landscape, including the generation and routing of surface runoff. Precise estimation of surface runoff helps in predicting streamflow volumes. The average annual surface runoff for the Wabiga Juba catchment was calculated to be 2.81 MCM (January); 0.83 MCM (February); 15.38 MCM (March); 1033.07 MCM (April); 685.63 MCM (May); 17.06 MCM (June); 7.09 MCM (July); 2.77 MCM (August); 3.51 MCM (September); 100.44 MCM (October); 312.63 MCM (November); and 25.65 MCM (December). Precipitation and surface runoff are required in the hydrological simulation modeling as they provide the necessary input data for accurately representing the water balance, predicting streamflow, assessing flood risk, determining water availability, and studying the impacts of climate change on water resources [46].
The percentage differences between precipitation and surface runoff in hydrological simulation modeling helps assess the accuracy of the model, calibration of parameters, data quality assessment, water balance, and sensitivity analysis. Therefore, the reliability and applicability of the hydrological model used for water resource management can be improved. The percentage differences between precipitation and surface runoff were 1.082126% (January); 2.542264% (February); 8.28337% (March); 26.10239% (April); 14.23259% (May); 2.919718% (June); 2.850079% (July); 2.758277% (August); 3.81652% (September); 19.41749% (October); 13.6348% (November); and 2.360379% (December) (Figure 4a). The percentage differences allow for an assessment of the accuracy of the hydrological model’s simulation of surface runoff generation [47]. High percentage differences were observed on April, May, October, and November. Large percentage differences showed the occurrence of infiltration, evaporation, or runoff routing that influence the surface runoff [46,48]. The rest of the months were in almost in the same low ranges as the percentage differences.
The percentages of surface runoff (or also known as runoff coefficient) in hydrological models represents the proportion of precipitation that becomes surface runoff. The percentage of surface runoff is influenced by various factors, including soil properties (texture, structure, porosity), vegetation cover [3], land use practices, topography [49], and antecedent soil moisture conditions. Estimating the runoff coefficient allows for the calibration of hydrological models, ensuring that the simulated runoff matches the observed or measured runoff. By adjusting the runoff coefficient, model performance can be improved, leading to more accurate predictions of surface runoff. The percentages of surface runoff were 0.12733% (January); 0.03761% (February); 0.696915% (March); 46.81155% (April); 31.06798% (May); 0.773041% (June); 0.321269% (July); 0.125517% (August); 0.159049% (September); 4.551242% (October); 14.16622% (November); and 1.16228% (December) (Figure 4b), respectively. A large percentage of surface runoff implies that a significant portion of the precipitation does not infiltrate into the soil but instead flows over the land surface. This can occur when the soil is saturated or has low infiltration capacity, or when there are impermeable surfaces, such as paved areas or compacted soils [48]. A large percentage of surface runoff indicates a higher potential for floods, as a greater amount of water is rapidly transported over the land surface. On the other hand, a small percentage of surface runoff suggests that most of the precipitation infiltrates into the soil. This occurs when the soil has high permeability, allowing for efficient water absorption, or when there are ample vegetation cover and well-drained landscapes. A small percentage of surface runoff indicates a lower risk of floods [32], [50], as a greater proportion of the precipitation is retained in the soil, replenishing groundwater reserves and supporting plant growth.
The Wabiga Juba River’s annual discharge (runoff) contribution to yearly precipitation was calculated to be 3%. The months of April, May, October, and November see the most surface runoff. According to the study’s findings, the Wabiga Juba has significant flow during wet seasons and relatively little discharge during dry ones.
These results are consistent with the study at Sakarya River Basin in Turkey by [4] using the WEAP model in the study area, where agricultural land makes up over 50% of the total area, the model predicted lower values for surface runoff.
Another similar study, carried out in 2016 on the upper catchment of the Chongwe River in Zambia [51], also revealed that discharge increased during rainy season flows and decreased during dry season flows. Water harvesting techniques, including micro dams, ponds, weirs, and check dams, are frequently employed to collect excess runoff during the wet season and use them to make up for the water deficit during the dry season [7].
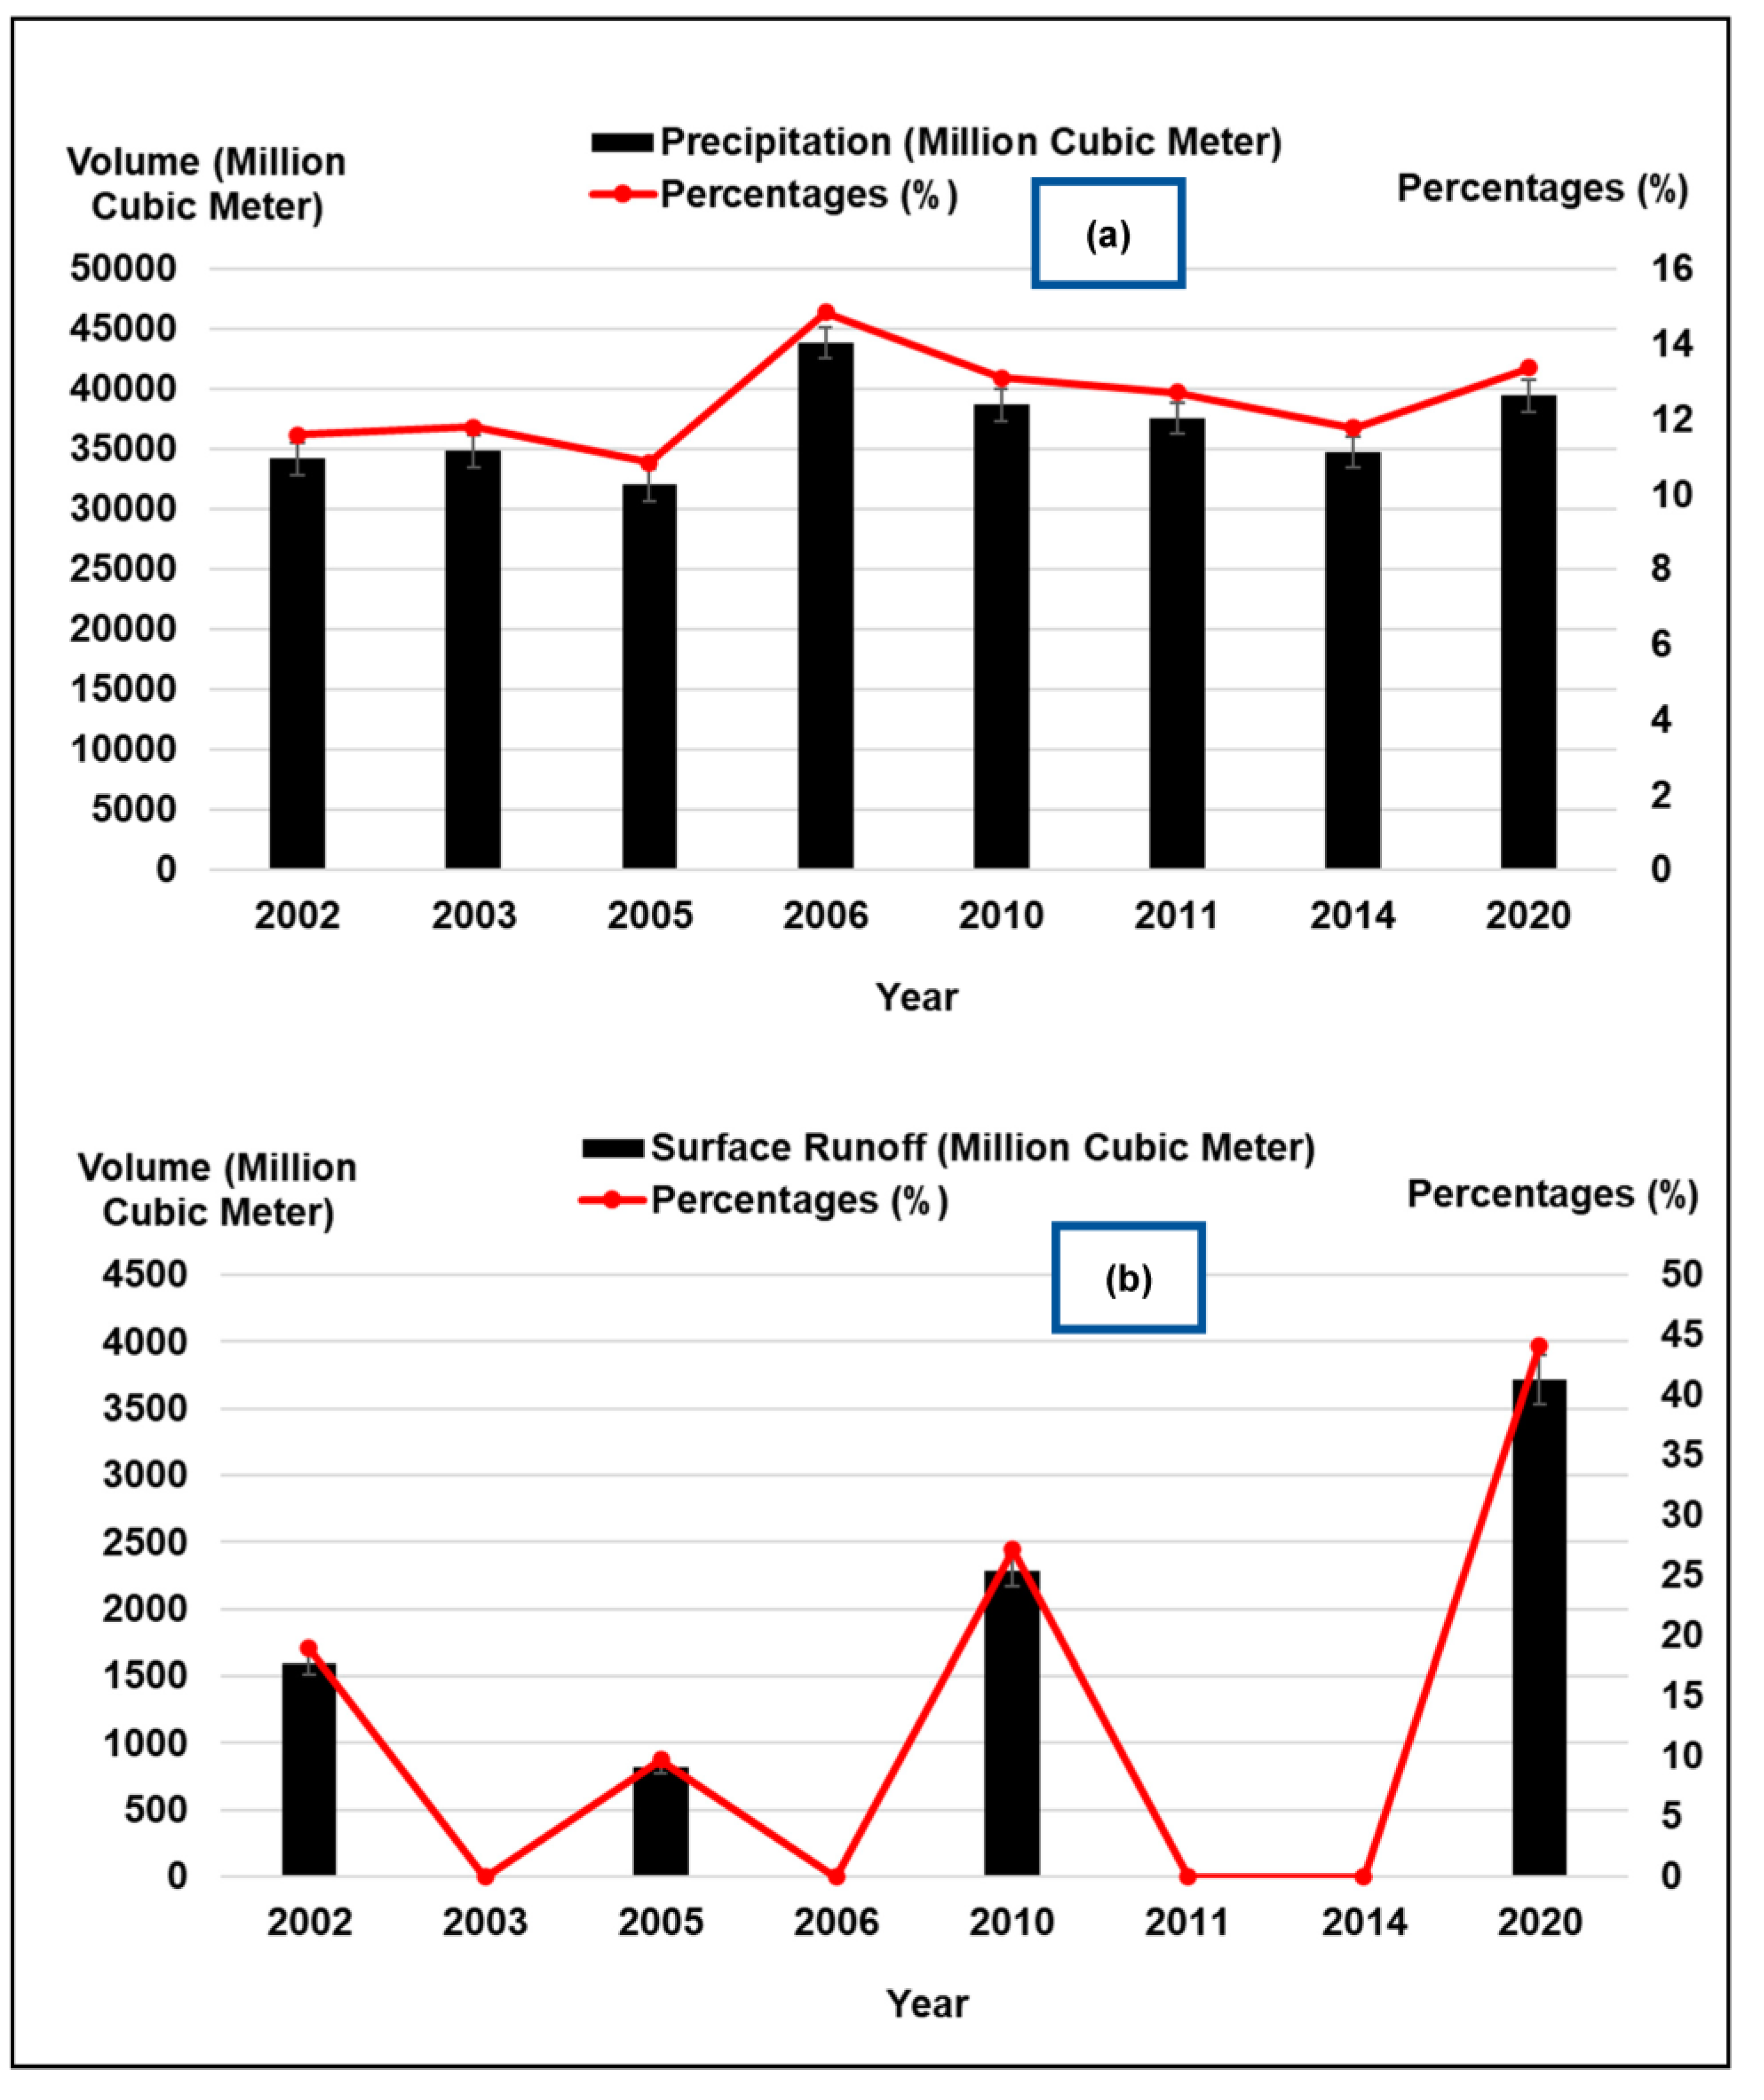
The Juba Dolow catchment (a) precipitation and (b) surface runoff for selected years are shown in Figure 5. Annual precipitation data is a critical input in the WEAP model as it influences the water balance calculation, runoff estimation, water supply assessment, climate change analysis, and scenario planning. The estimated annual precipitation for selected years for Wabiga Juba catchment were 34,208.6 MCM (2002); 34,823.17 MCM (2003); 32,002.64 MCM (2005); 43,841.09 MCM (2006); 38,698.16 MCM (2010); 37,572.53 MCM (2011); 34,758.47 MCM (2014); and 39,461.51 MCM (2020) (Figure 5a).
Meanwhile, the surface runoff for selected years also were 1596.12 MCM (2002); 0 MCM (2003); 818.68 MCM (2005); 0 MCM (2006); 2283.91 MCM (2010); 0 MCM (2011); 0 MCM (2014); and 3717.39 MCM (2020) (Figure 5b). The annual results shown in Figure 5a indicate that the high rainfall occurs during the wet season in 2006 and 2010 from April to October. Additionally, 27% amount of surface runoff was attained by 2010. Identification of wet and dry seasons helps in analysing the patterns of precipitation and surface runoff. Therefore, the hydrological modeling related to surface runoff, streamflow, and water availability during the wet period can be achieved systematically.
During the wet season, there is typically an abundance of water, and it is important to capture and store excess runoff for use during the dry season whenever the precipitation is limited. Figure 5a shows that the driest years were in 2006 and 2011 with an annual rainfall of 43,481.09 MCM and 37,572.53 MCM, respectively. In annual result shown in Figure 5b, the surface runoff was approximately 0% at 2006 and 2011. Only 12% of rainfall was transformed to surface runoff by 2011. The basin frequently experiences droughts, which pose serious issues for mostly downstream people in the Juba basin. Droughts have recently occurred in the years 2006 and 2011 [5] throughout Somalia. The Chongwe River also showed an increase in runoff during flows during the rainy season and a decrease during flows during the dry season [22].
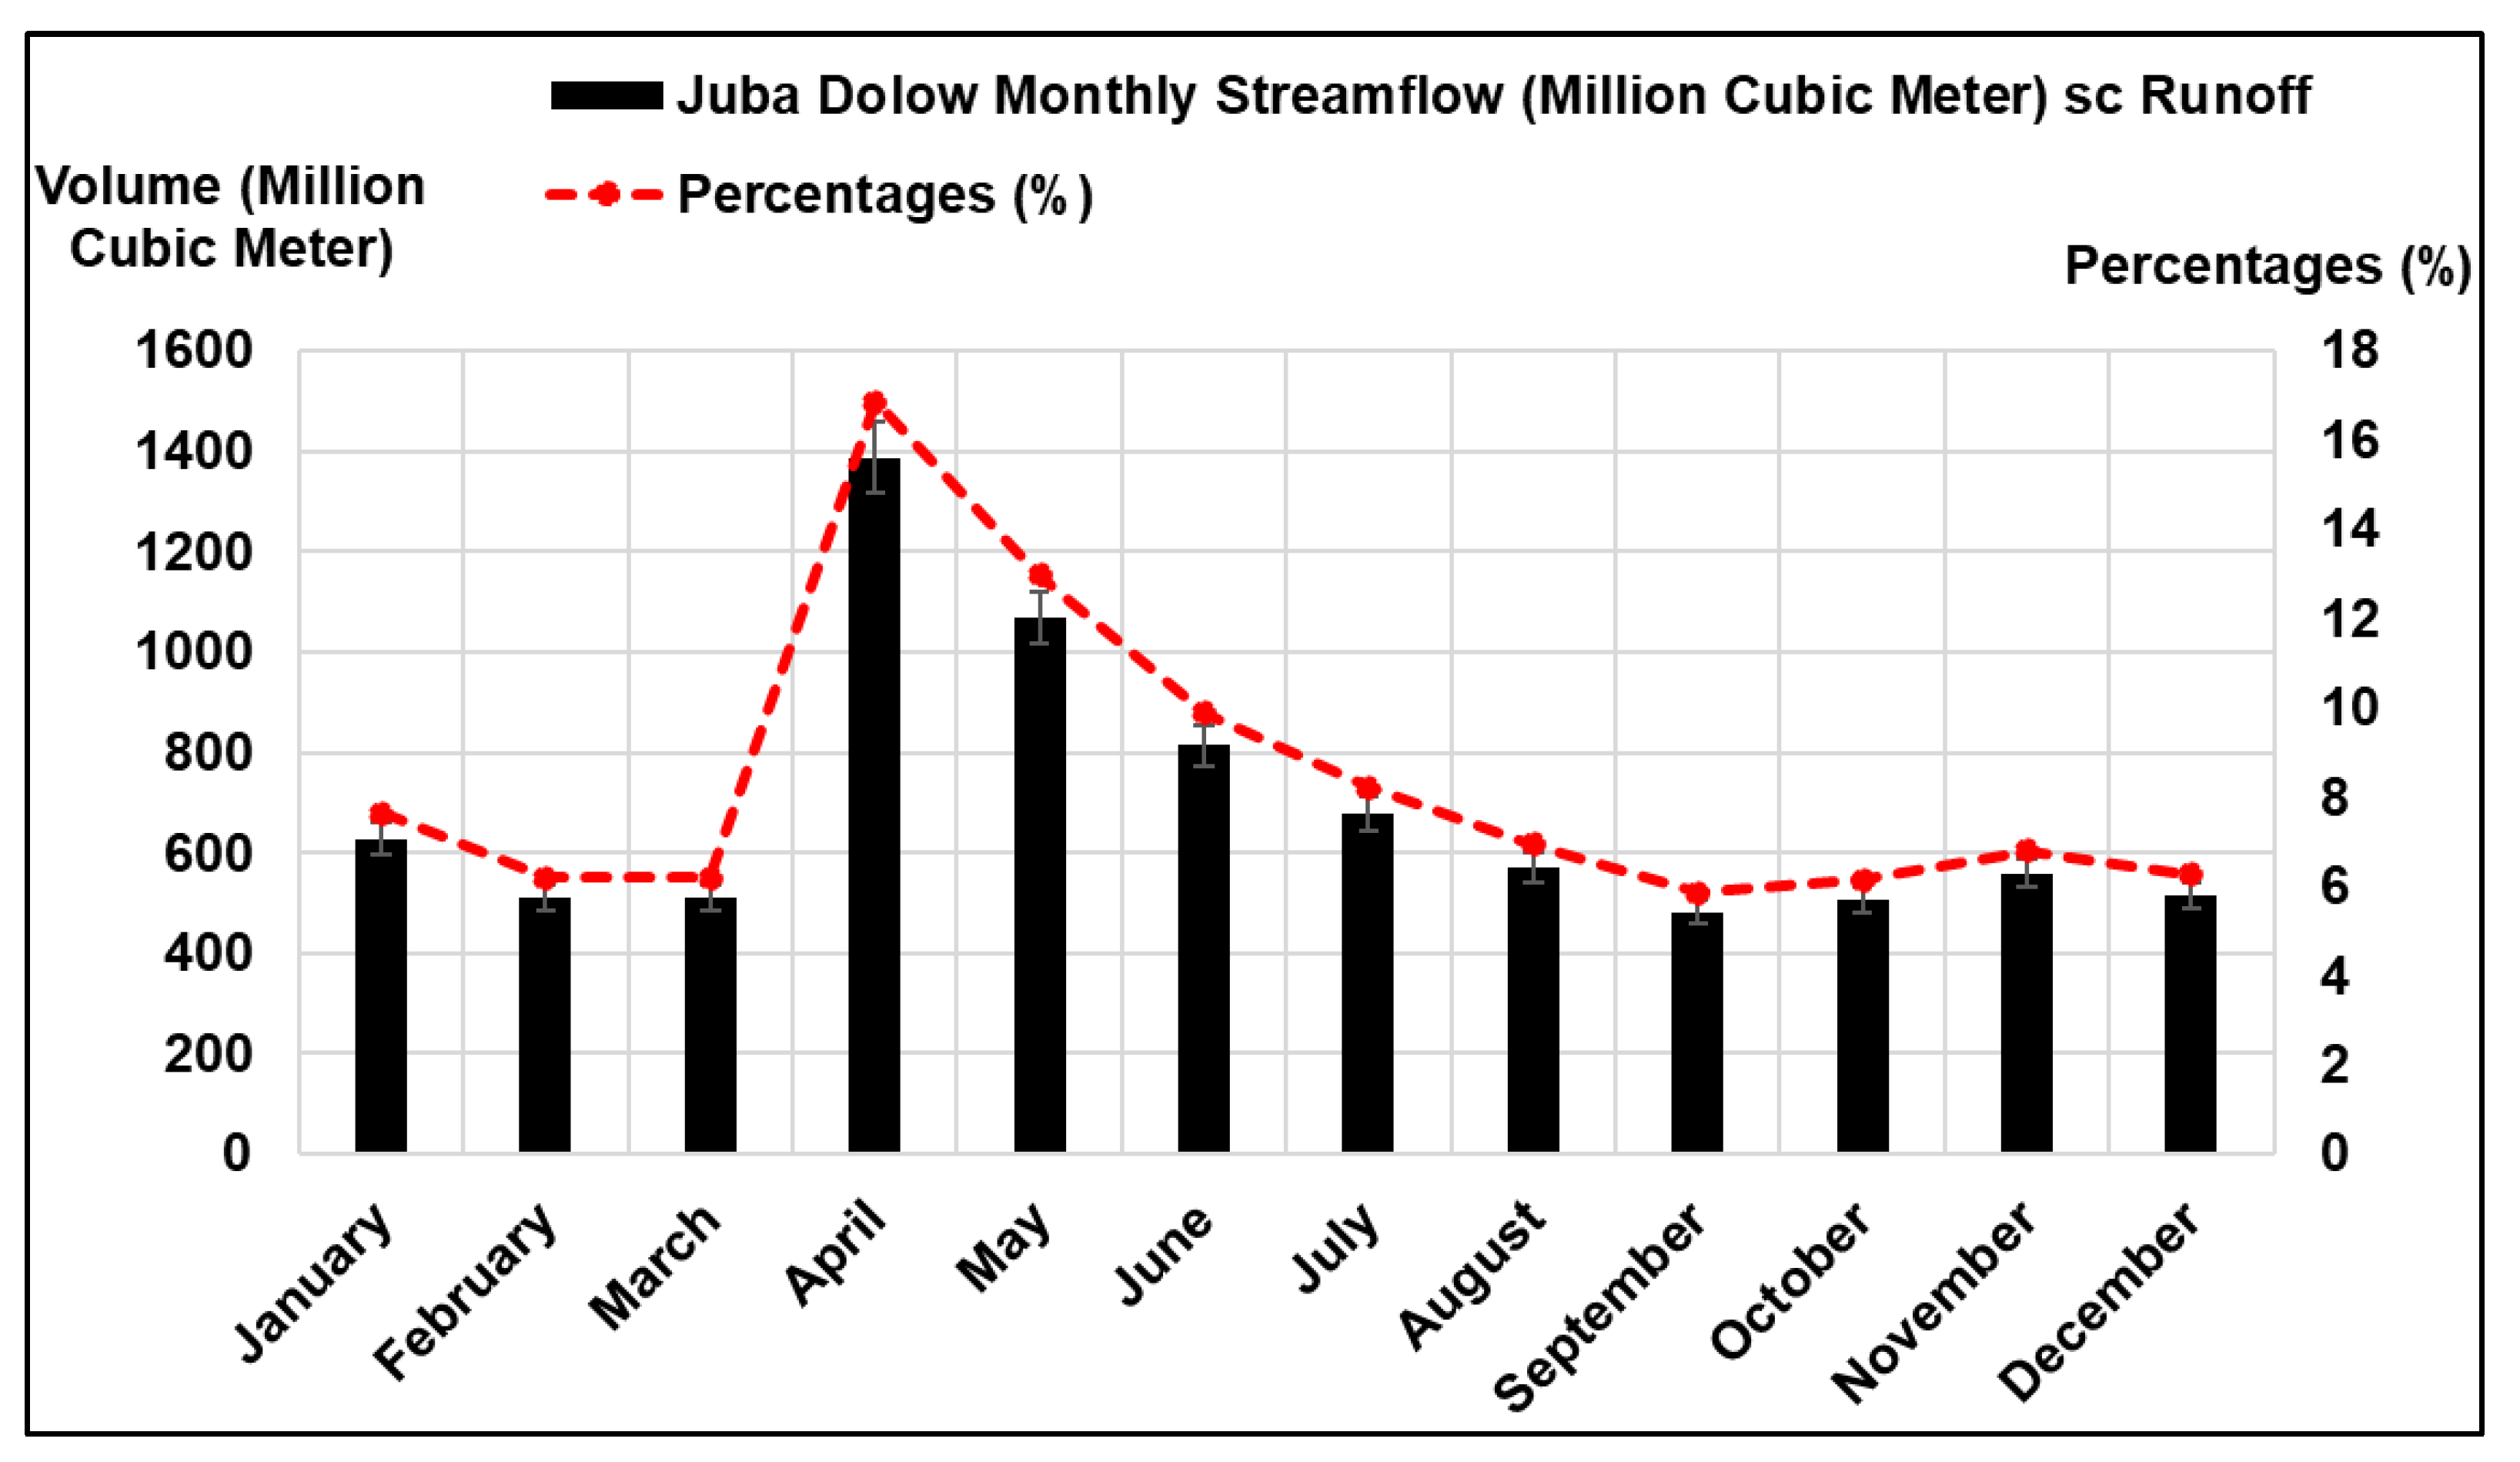
Figure 6 presents the monthly streamflow in the Juba Dolow subcatchment runoff. The estimated monthly average streamflow in Juba Dolow runoff in the Wabiga Juba catchment is equivalent to 628.12 MCM (January); 510.66 MCM (February); 509.71 MCM (March); 1387.66 MCM (April); 1068.36 MCM (May); 814.62 MCM (June); 676.85 MCM (July); 571.37 MCM (August); 482.48 MCM (September); 506.92 MCM (October); 560.08 MCM (November); and 516.69 (December).
The percentage differences between precipitation and streamflow at Juba Dolow runoff were 7.628815% (January); 6.202208% (February); 6.190669% (March); 16.85379% (April); 12.97574% (May); 9.893946% (June); 8.2204664% (July); 6.939559% (August); 5.859948% (September); 6.156783% (October); 6.802437% (November); and 6.275445% (December).
The annual streamflow at Juba Dolow runoff proportion of the Wabiga Juba River was estimated to be 10% of annual precipitation. Most surface runoff occurs in April (47%), May (31%), October (5%), and November (14%). It is evident that streamflow variation responds to the pattern of precipitation when comparing average monthly values of streamflow with precipitation. Streamflow rises when precipitation does, and vice versa. However, the main source of current flow during the dry season is ground flow. The baseflow, which is essential to maintaining the streamflow during the dry season, follows the interflow, which makes up the majority of the yearly stream flow and contributes a significant portion of flow during the wet season. While considering water availability in a temporal context, more than 97% of the annual total runoff is concentrated in 4 months (April, May, October, and November), and the remaining months largely depend on the baseflow contribution to the streamflow. This is a result of the catchment’s seasonality of rainfall.
Similar findings of WEAP model were also reported from the Central Rift Valley basin, Ethiopia [31], where the annual streamflow proportion of the Ketar River was estimated to be 10% of annual precipitation. Contrary to this, the less contribution of surface runoff to the streamflow is explained by the absence of significant impervious surfaces in the sub-basin [52].
Zambia also reported that the low streamflow of the Chongwe River [7,22] and the significant effect in the water balance model is the streamflow at the outlet of the catchment. However, ground flow is the main driving force for current flow during the dry season.

3.2. The WEAP Model Performance: Validation and Classification Criteria

The results for monthly data calibration and validation at each measurement station and calibration parameters of sub-catchments are summarised in Table 5. The performance test results from the model simulation it is observed that the model shows a satisfactory match.
For both values calibration 0.71 and 0.70 validation, respectively, the coefficient of determination (R2) represents the streamflow variations at acceptable levels. While the NSE and PBIAS are also at the acceptable level. The Ankara River Basin study conducted by [53], which has a 4932 km2 drainage area, a forecasting sediment yield and streamflow using the SWAT model between 1989 and 1996 showed that the NSE value equals to 0.79 on A monthly basis for their simulated years. Similar research was conducted in the 5649 km2 Lower Porsuk River Basin to estimate streamflow on a monthly basis using the SWAT model [51]. They found the calibration values of the NSE were 0.74 and 0.87 for the validation period, respectively. These model performances were acceptable levels for these sub-catchments.
According to Asghar et al. [29], for the monthly calibration and validation periods in the central Indus basin, the WEAP hydrologic model attained NSE and R2 values of 0.85, 0.86, 0.89, and 0.87, respectively.
According to Hamlat et al. [52], there are five gauging sites in the catchments of Western Algeria with values ranging from NSE = 0.23 to 0.88 and R2 = 0.74 to 1.0 between predicted and measured average monthly flows.
Ingol-Blanco and McKinney [53] developed the WEAP model to assess the hydrologic approaches used in Mexico’s Rio Conchos Basin. Six gauging stations were utilised throughout the basin to assess the model’s performance. Between measured and simulated flows, NSE = 0.65–0.87 and R2 = 0.92–0.97, and NSE = 0.60–0.88 and R2 = 0.92–0.97 pertinence values were found, respectively.
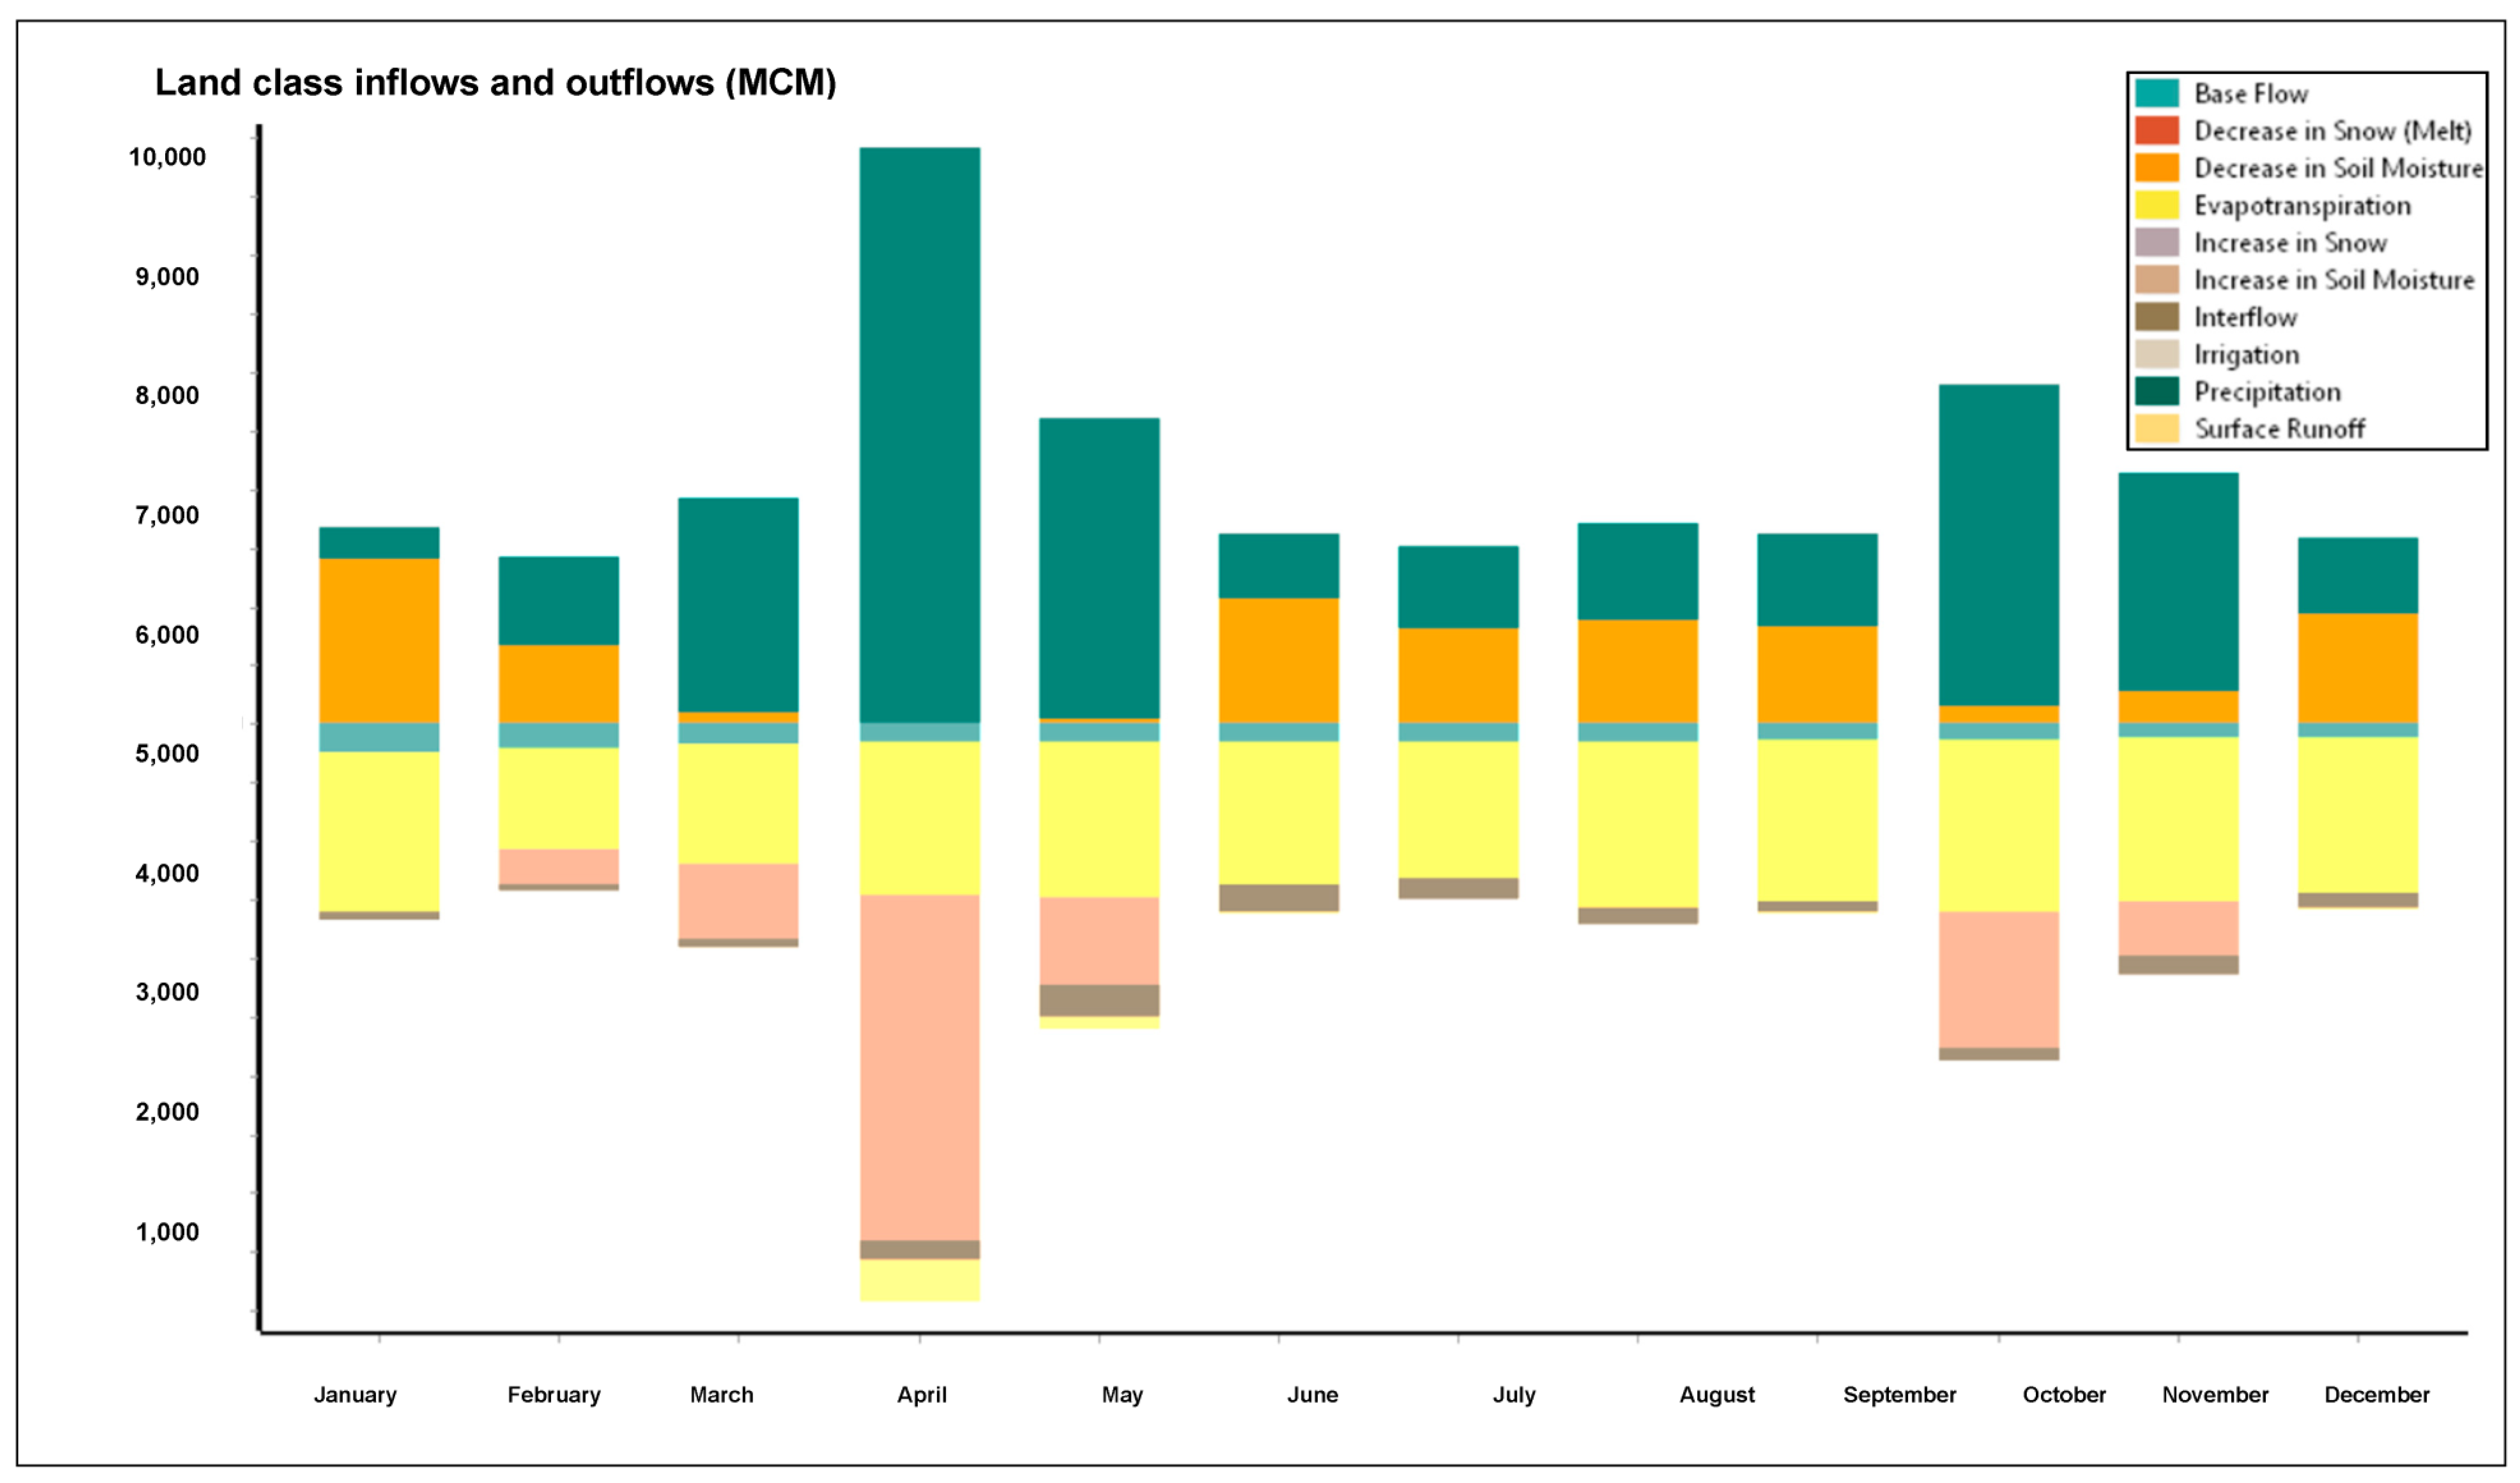
Figure 7 shows the land class inflows and outflows in the Juba Dolow subcatchment. The observed data and the simulated streamflow at the Juba Dolow station were evaluated (2002–2014) and are shown in Figure 8. The model’s streamflow estimation performance was satisfactory.
Precipitation is the primary water inflow into the basin, and according to a key component of the model, 61,016.47 Mm3 was the value provided by the water component model. Evapotranspiration accounts for the majority of water output, amounting to 69,067 Mm3. The other outflow component streamflow at the catchment’s outlet is where the water balance model has a big impact. This amount of water departs the catchment as baseflow and surface runoff. When comparing average monthly values of streamflow with precipitation, it is evident that streamflow variance responds to the pattern of precipitation. A streamflow increases when precipitation increases, and the opposite is also true base flow, however, as it is what primarily determines streamflow in the dry season. The upper catchment of the Juba River Basin indicated that the during wet season flow, the runoff also increases.

4. Conclusions

The Juba River catchment water hydrological components were analysed. WEAP model simulation and performance were assessed statistically by the calculation of the Nash–Sutcliffe model efficiency coefficient (NSE) and the coefficient of determination (R2). It is observed that the model efficiency coefficient (NSE = 0.64) and the coefficient of determination (R2) is 0.87. Both NSE and R2 show a satisfactory match. Water from the catchments is lost at a significant rate through evapotranspiration, which is also one of the main causes of water outflow. The estimated values for potential evapotranspiration (11,921.98 to 20,775.39 MCM) will be higher than actual evapotranspiration (4904.10 to 8242.72 MCM) by 50 to 79.5%, respectively. The annual streamflow at Juba Dolow runoff proportion of the Wabiga Juba River was estimated to be 10% of annual precipitation. Most surface runoff occurs in April (47%), May (31%), October (5%), and November (14%).
WEAP is effective in evaluating present and potential water resource possibilities. Building sophisticated, distributed physical hydrology and demand models of agricultural, municipal/industrial, and environmental demands at a range of spatial and temporal scales, and with cascading degrees of information, is a feature of the WEAP model user interface. Although the WEAP model is a versatile tool for hydrological modeling, it does have significant drawbacks. The WEAP model, for instance, states that there are only a few catchments hydrologic models available (namely, the simplified coefficient method, the soil moisture method, the MABIA method, and the plant growth model method), and this can be a significant constraint if some of the parameters use various catchment models. Consequently, it is necessary to translate the parameters from one model to another. The majority of farmers do not have enough reservoirs to capture the runoff for use during the dry season despite the fact that streamflow increases during the rainy season. Based on our findings and observations, it is possible to meet the catchment’s increasing water demand while also supporting accompanying socioeconomic development activities. However, doing so will necessitate using the appropriate water resource management strategies.
The options recommended for the catchment of the Juba River include the introduction of groundwater recharge ponds and protection of recharge areas for sustainability of groundwater resources and baseflow of the Juba River, and the implementation of water harvesting technologies, such as micro dams, ponds, weirs, and check dams, to harvest excess runoff in the wet season to help overcome the water deficit during the dry season.
The region needs better water resource management practices, so considering the research area’s potential for the use of several effective strategies, such as minimizing storage evaporation and enhancing irrigation efficiency. Our findings revealed that agricultural and environmental issues will arise during the drought years if water resource management strategies are not changed in the area or at least in one of the two sectors taken into consideration. Therefore, the study area’s potential for the use of various effective strategies, such as lowering the amount of cultivable land, lowering population growth, enhancing irrigation efficiency, and adopting optimum deficit irrigation should be considered. Furthermore, it is important to assess possible future climate and socioeconomic development scenarios as well as the region’s land use and land cover to deal with the significant hydrological uncertainty.

Author Contributions

Conceptualization, A.I.D. and M.F.M.; methodology, A.I.D. and M.F.M.; software, A.I.D. and M.F.M.; validation, A.I.D., M.F.M. and K.A.M.; formal analysis, A.I.D. and T.S.B.A.M.; investigation, A.I.D. and M.F.M.; resources, A.I.D. and M.F.M.; data curation, A.I.D.; writing—original draft preparation, A.I.D.; writing—review and editing, T.S.B.A.M. and K.A.M.; visualization, M.F.M.; supervision, M.F.M.; project administration, A.I.D. and M.F.M.; funding acquisition, A.I.D., M.F.M. and T.S.B.A.M. All authors have read and agreed to the published version of the manuscript.

Funding

The Article Processing Charge (APC) of this research was funded by Mogadishu University (MU) under the MU Research Development Grant Initiative.

Data Availability Statement

Data are included in this paper.

Acknowledgments

The authors would like to thank TP2 (Train to publish for second batch under Universiti Sains Malaysia) for reviewing and editing this research.

Conflicts of Interest

The authors declare no conflict of interest.

References

  1. Farrokhzadeh, S.; Monfared, S.A.H.; Azizyan, G.; Shahraki, A.S.; Ertsen, M.W.; Abraham, E. Sustainable Water Resources Management in an Arid Area Using a Coupled Optimization-Simulation Modeling. Water 2020, 12, 885. [Google Scholar] [CrossRef] [Green Version]
  2. Ghanim, A.A.J.; Beddu, S.; Abd Manan, T.S.B.; Al Yami, S.H.; Irfan, M.; Mursal, S.N.F.; Mohd Kamal, N.L.; Mohamad, D.; Machmudah, A.; Yavari, S.; et al. Prediction of Runoff in Watersheds Located within Data-Scarce Regions. Sustainability 2022, 14, 7986. [Google Scholar] [CrossRef]
  3. Moriasi, D.N.; Gitau, M.W.; Pai, N.; Daggupati, P. Hydrologic and Water Quality Models: Performance Measures and Evaluation Criteria. Am. Soc. Agric. Biol. Eng. 2015, 58, 1763–1785. [Google Scholar]
  4. Mounir, Z.M.; Ma, C.M.; Amadou, I. Application of Water Evaluation and Planning (WEAP): A Model to Assess Future Water Demands in the Niger River (In Niger Republic). Math. Model. Methods Appl. Sci. 2011, 5, 38–49. [Google Scholar] [CrossRef] [Green Version]
  5. Fowler, H.J.; Kilsby, C.G.; O’Connell, P.E. Modeling the impacts of climatic change and variability on the reliability, resilience, and vulnerability of a water resource system. Water Resour. Res. 2003, 39, 1222. [Google Scholar] [CrossRef] [Green Version]
  6. Christensen, N.S.; Wood, A.W.; Voisin, N.; Lettenmaier, D.P.; Palmer, R.N. The effects of climate change on the hydrology and water resources of the Colorado River basin. Clim. Chang. 2004, 62, 337–363. [Google Scholar] [CrossRef]
  7. Tena, T.M.; Nguvulu, A.; Mwelwa, D.; Mwaanga, P.; Tena, T.M.; Nguvulu, A.; Mwelwa, D.; Mwaanga, P. Assessing Water Availability and Unmet Water Demand Using the WEAP Model in the Semi-Arid Bweengwa, Kasaka and Magoye Sub-Catchments of Southern Zambia. J. Environ. Prot. 2021, 12, 280–295. [Google Scholar] [CrossRef]
  8. Mourad, K.A. A Water Compact for Sustainable Water Management. Sustainability 2020, 12, 7339. [Google Scholar] [CrossRef]
  9. Jama, A.A.; Mourad, K.A. Water Services Sustainability: Institutional Arrangements and Shared Responsibilities. Sustainability 2019, 11, 916. [Google Scholar] [CrossRef] [Green Version]
  10. Mohamed, A.E. Managing Shared Basins in the Horn of Africa—Ethiopian Projects on the Juba and Shabelle Rivers and Downstream Effects in Somalia. Nat. Resour. Conserv. 2013, 1, 35–49. [Google Scholar]
  11. Houghton-Carr, H.A.; Print, C.R.; Fry, M.J.; Gadain, H.; Muchiri, P. An assessment of the surface water resources of the Juba-Shabelle basin in southern Somalia. Hydrol. Sci. J. 2011, 56, 759–774. [Google Scholar] [CrossRef] [Green Version]
  12. Basnyat, D.B.; Gadain, H.M. Hydraulic Analysis of Rivers Juba and Shabelle in Somalia Basic Analysis for Irrigation and Flood Management Purposes; Technical Report No W-13; FAO-SWALIM: Nairobi, Kenya, 2009. [Google Scholar]
  13. Salman, S.M.A. The Baardhere Dam and Water Infrastructure Project in Somalia—Ethiopia’s objection and the World Bank response. Hydrol. Sci. J. 2011, 56, 630–640. [Google Scholar] [CrossRef]
  14. Abera Abdi, D.; Ayenew, T. Evaluation of the WEAP model in simulating subbasin hydrology in the Central Rift Valley basin, Ethiopia. Ecol. Process. 2021, 10, 41. [Google Scholar] [CrossRef]
  15. Jha, M.K.; Gupta, A. Das Application of Mike Basin for Water Management Strategies in a Watershed. Water Int. 2009, 28, 27–35. [Google Scholar] [CrossRef]
  16. Vieira, E.d.O.; Sandoval-Solis, S. Water resources sustainability index for a water-stressed basin in Brazil. J. Hydrol. Reg. Stud. 2018, 19, 97–109. [Google Scholar] [CrossRef]
  17. Yates, D.; Sieber, J.; Purkey, D.; Huber-Lee, A. WEAP21—A Demand-, Priority-, and Preference-Driven Water Planning Model. Water Int. 2009, 30, 487–500. [Google Scholar] [CrossRef]
  18. Labadie, J.W. MODSIM: Decision Support System for Integrated River Basin Management. In Proceedings of the International Congress on Environmental Modelling and Software, Burlington, VT, USA, 9–13 July 2006; pp. 1–11. [Google Scholar]
  19. Assaf, H.; van Beek, E.; Borden, C.; Gijsbers, P.; Jolma, A.; Kaden, S.; Kaltofen, M.; Labadie, J.W.; Loucks, D.P.; Quinn, N.W.T.; et al. Chapter Thirteen Generic Simulation Models for Facilitating Stakeholder Involvement in Water Resources Planning and Management: A Comparison, Evaluation, and Identification of Future Needs. Dev. Integr. Environ. Assess. 2008, 3, 229–246. [Google Scholar] [CrossRef]
  20. Dehghanipour, A.H.; Zahabiyoun, B.; Schoups, G.; Babazadeh, H. A WEAP-MODFLOW surface water-groundwater model for the irrigated Miyandoab plain, Urmia lake basin, Iran: Multi-objective calibration and quantification of historical drought impacts. Agric. Water Manag. 2019, 223, 105704. [Google Scholar] [CrossRef]
  21. de Salis, H.H.C.; da Costa, A.M.; Vianna, J.H.M.; Schuler, M.A.; Künne, A.; Fernandes, L.F.S.; Pacheco, F.A.L. Hydrologic Modeling for Sustainable Water Resources Management in Urbanized Karst Areas. Int. J. Environ. Res. Public Health 2019, 16, 2542. [Google Scholar] [CrossRef] [Green Version]
  22. Tena, T.M.; Mwaanga, P.; Nguvulu, A. Hydrological Modelling and Water Resources Assessment of Chongwe River Catchment using WEAP Model. Water 2019, 11, 839. [Google Scholar] [CrossRef] [Green Version]
  23. Singh, M.; Shinde, V.; Pradhan, S.K.; Chalodiya, A.L.; Shukla, K.N. Hydrologic Modelling of Mahanadi River Basin in India Using Rainfall-Runoff Model. Nat. Environ. Pollut. Technol. 2014, 13, 385–392. [Google Scholar]
  24. Teklu, S.; Soliman, A.H.; El-Zawahry, A. Planning for Environmental Water Allocations: Hydrology—Based Assessment in the Awash River Basin, Ethiopia. J. Environ. Earth Sci. 2019, 9, 78–87. [Google Scholar] [CrossRef] [Green Version]
  25. Khalil, A.; Rittima, A.; Phankamolsil, Y. The projected changes in water status of the Mae Klong Basin, Thailand, using WEAP model. Paddy Water Environ. 2018, 16, 439–455. [Google Scholar] [CrossRef]
  26. Maliehe, M.; Mulungu, D.M.M. Assessment of water availability for competing uses using SWAT and WEAP in South Phuthiatsana catchment, Lesotho. Phys. Chem. Earth 2017, 100, 305–316. [Google Scholar] [CrossRef]
  27. Desta, H.; Lemma, B.; Gebremariam, E. Identifying sustainability challenges on land and water uses: The case of Lake Ziway watershed, Ethiopia. Appl. Geogr. 2017, 88, 130–143. [Google Scholar] [CrossRef]
  28. Yaykiran, S.; Cuceloglu, G.; Ekdal, A. Estimation of Water Budget Components of the Sakarya River Basin by Using the WEAP-PGM Model. Water 2019, 11, 271. [Google Scholar] [CrossRef] [Green Version]
  29. Asghar, A.; Iqbal, J.; Amin, A.; Ribbe, L. Integrated hydrological modeling for assessment of water demand and supply under socio-economic and IPCC climate change scenarios using WEAP in Central Indus Basin. J. Water Supply Res. Technol. AQUA 2019, 68, 136–148. [Google Scholar] [CrossRef] [Green Version]
  30. Mab, P.; Kositsakulchai, E. Water Balance Analysis of Tonle Sap Lake using WEAP Model and Satellite-Derived Data from Google Earth Engine. Sci. Technol. Asia 2020, 25, 45–58. [Google Scholar] [CrossRef]
  31. Kirkham, M.B. Potential Evapotranspiration. Princ. Soil Plant Water Relat. 2005, 455–468. [Google Scholar] [CrossRef]
  32. Röske, F. A global heat and freshwater forcing dataset for ocean models. Ocean Model. 2006, 11, 235–297. [Google Scholar] [CrossRef]
  33. Chiew, F.; McMahon, T. Application of the daily rainfall-runoff model MODHYDROLOG to 28 Australian catchments. J. Hydrol. 1994, 153, 383–416. [Google Scholar] [CrossRef]
  34. Zhu, Y.; Shan, D.; Wang, B.; Shi, Z.; Yang, X.; Liu, Y. Floristic features and vegetation classification of the Hulun Buir Steppe in North China: Geography and climate-driven steppe diversification. Glob. Ecol. Conserv. 2019, 20, e00741. [Google Scholar] [CrossRef]
  35. Aboelsoud, H.M.; Habib, A.; Engel, B.; Hashem, A.A.; El-Hassan, W.A.; Govind, A.; Elnashar, A.; Eid, M.; Kheir, A.M.S. The combined impact of shallow groundwater and soil salinity on evapotranspiration using remote sensing in an agricultural alluvial setting. J. Hydrol. Reg. Stud. 2023, 47, 101372. [Google Scholar] [CrossRef]
  36. Dass, B.; Daniel, D.; Saxena, N.; Sharma, A.; Sen, D.; Sen, S. Informing watershed management in data-scarce Indian Himalayas. Water Secur. 2023, 19, 100138. [Google Scholar] [CrossRef]
  37. Hund, S.V.; Allen, D.M.; Morillas, L.; Johnson, M.S. Groundwater recharge indicator as tool for decision makers to increase socio-hydrological resilience to seasonal drought. J. Hydrol. 2018, 563, 1119–1134. [Google Scholar] [CrossRef]
  38. Orkodjo, T.P.; Kranjac-Berisavijevic, G.; Abagale, F.K. Impact of climate change on future availability of water for irrigation and hydropower generation in the Omo-Gibe Basin of Ethiopia. J. Hydrol. Reg. Stud. 2022, 44, 101254. [Google Scholar] [CrossRef]
  39. Dutta, D.; Vaze, J.; Kim, S.; Hughes, J.; Yang, A.; Teng, J.; Lerat, J. Development and application of a large scale river system model for National Water Accounting in Australia. J. Hydrol. 2017, 547, 124–142. [Google Scholar] [CrossRef]
  40. Lei, T.; Pang, Z.; Wang, X.; Li, L.; Fu, J.; Kan, G.; Zhang, X.; Ding, L.; Li, J.; Huang, S.; et al. Drought and Carbon Cycling of Grassland Ecosystems under Global Change: A Review. Water 2016, 8, 460. [Google Scholar] [CrossRef] [Green Version]
  41. Watkins, J.R. The definition of the terms hydrologically arid and humid for Australia. J. Hydrol. 1969, 9, 167–181. [Google Scholar] [CrossRef]
  42. Jiang, Y.; Xu, Z.; Xiong, L. Runoff variation and response to precipitation on multi-spatial and temporal scales in the southern Tibetan Plateau. J. Hydrol. Reg. Stud. 2022, 42, 101157. [Google Scholar] [CrossRef]
  43. Murphy, K.W.; Ellis, A.W. An assessment of the stationarity of climate and stream flow in watersheds of the Colorado River Basin. J. Hydrol. 2014, 509, 454–473. [Google Scholar] [CrossRef]
  44. Waterman, B.R.; Alcantar, G.; Thomas, S.G.; Kirk, M.F. Spatiotemporal variation in runoff and baseflow in watersheds located across a regional precipitation gradient. J. Hydrol. Reg. Stud. 2022, 41, 101071. [Google Scholar] [CrossRef]
  45. Candela, L.; Tamoh, K.; Olivares, G.; Gomez, M. Modelling impacts of climate change on water resources in ungauged and data-scarce watersheds. Application to the Siurana catchment (NE Spain). Sci. Total Environ. 2012, 440, 253–260. [Google Scholar] [CrossRef] [PubMed]
  46. Kusahara, K.; Williams, G.D.; Massom, R.; Reid, P.; Hasumi, H. Roles of wind stress and thermodynamic forcing in recent trends in Antarctic sea ice and Southern Ocean SST: An ocean-sea ice model study. Glob. Planet. Chang. 2017, 158, 103–118. [Google Scholar] [CrossRef]
  47. Ho, L.T.; Goethals, P.L.M. Opportunities and Challenges for the Sustainability of Lakes and Reservoirs in Relation to the Sustainable Development Goals (SDGs). Water 2019, 11, 1462. [Google Scholar] [CrossRef] [Green Version]
  48. Chisola, M.N.; Kuráž, M. Patterns and Implications of Hydrologic Regime Change in Chongwe River, Zambia. J. Geogr. Geol. 2016, 8, p1. [Google Scholar] [CrossRef] [Green Version]
  49. Legesse, D.; Vallet-Coulomb, C.; Gasse, F. Hydrological response of a catchment to climate and land use changes in Tropical Africa: Case study South Central Ethiopia. J. Hydrol. 2003, 275, 67–85. [Google Scholar] [CrossRef]
  50. Duru, U.; Arabi, M.; Wohl, E.E. Modeling stream flow and sediment yield using the SWAT model: A case study of Ankara River basin, Turkey. Phys. Geogr. 2017, 39, 264–289. [Google Scholar] [CrossRef]
  51. Güngör, Ö.; Göncü, S. Application of the soil and water assessment tool model on the Lower Porsuk Stream Watershed. Hydrol. Process. 2013, 27, 453–466. [Google Scholar] [CrossRef]
  52. Hamlat, A.; Guidoum, A. Assessment of groundwater quality in a semiarid region of Northwestern Algeria using water quality index (WQI). Appl. Water Sci. 2018, 8, 220. [Google Scholar] [CrossRef] [Green Version]
  53. Ingol-Blanco, E.; McKinney, D.C. Development of a Hydrological Model for the Rio Conchos Basin. J. Hydrol. Eng. 2013, 18, 340–351. [Google Scholar] [CrossRef]
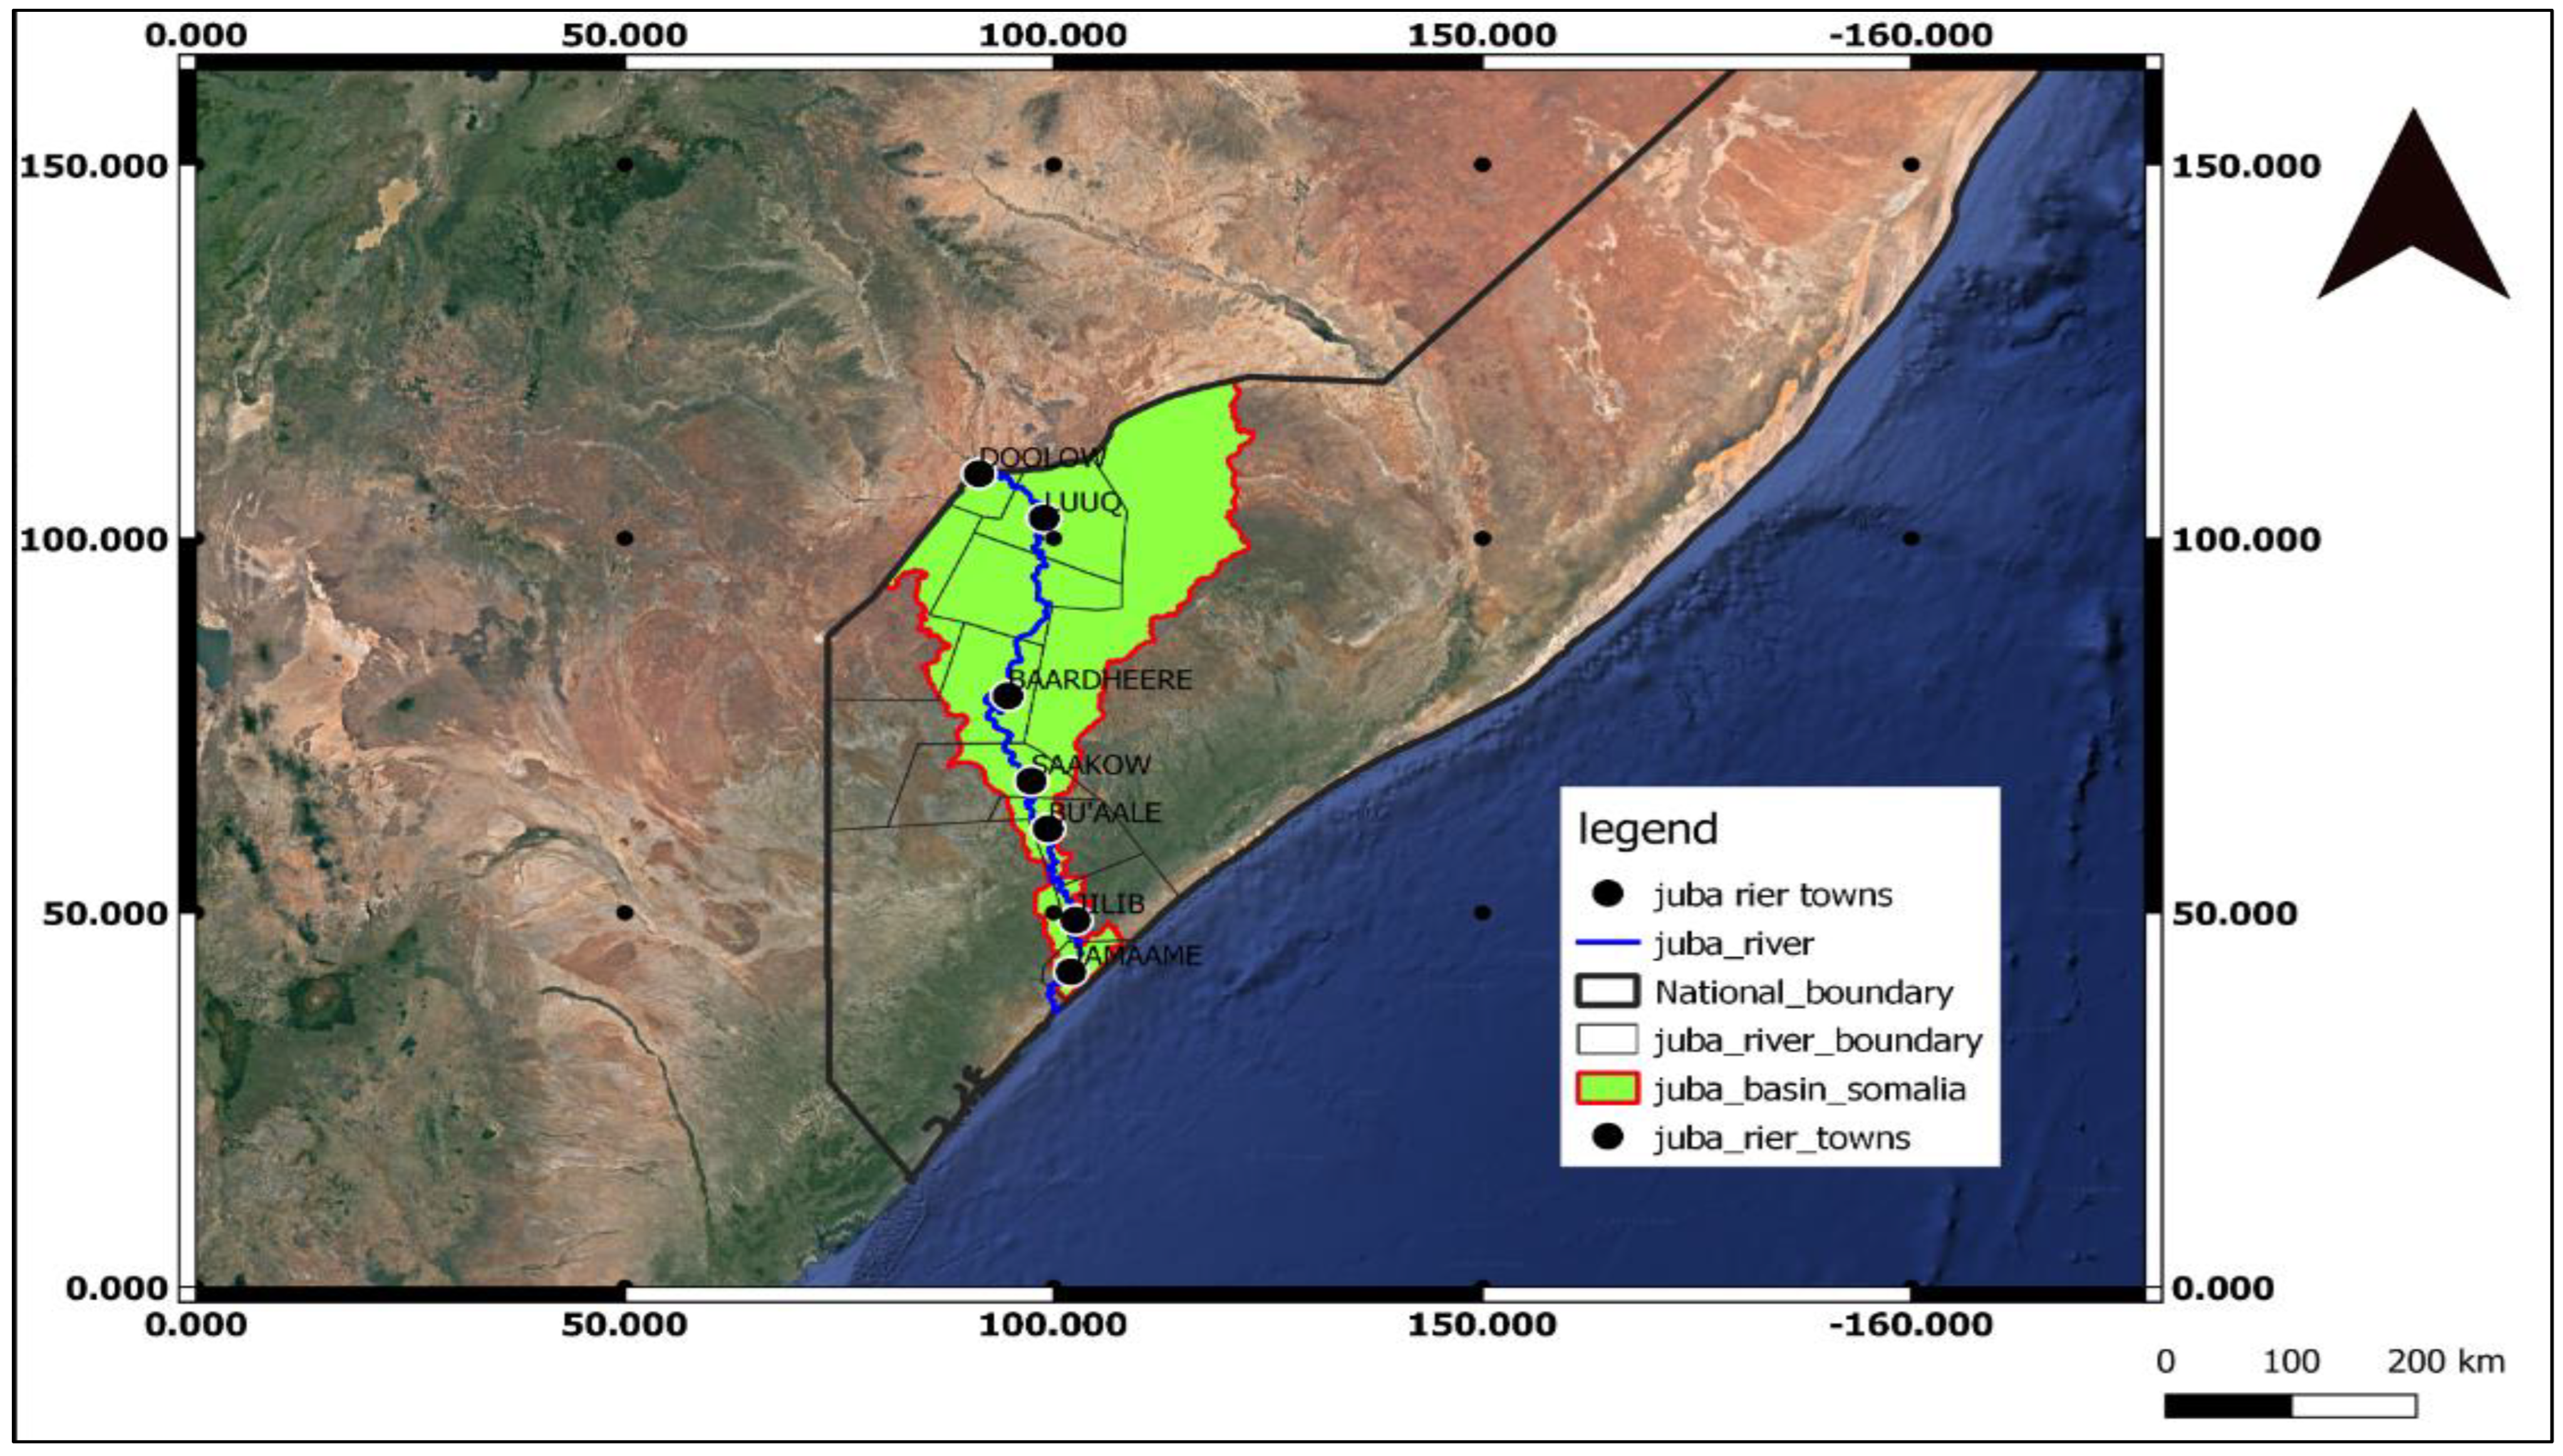
Figure 1. Location of Juba basin, Somalia (Juba River).
Water 15 02594 g001
Figure 2. The schematic diagram for WEAP hydrologic model.
Water 15 02594 g002
Figure 3. The WEAP model monthly mean of simulated PET and AET for Wabiga Juba catchment.
Water 15 02594 g003
Figure 4. WEAP model monthly mean of simulated (a) precipitation, and (b) surface runoff for Wabiga Juba catchment.
Water 15 02594 g004
Figure 5. Juba Dolow catchment: (a) precipitation and (b) surface runoff for selected years.
Water 15 02594 g005
Figure 6. Monthly streamflow at Juba Dolow sc Runoff.
Water 15 02594 g006
Figure 7. Land class inflows and outflows in Juba Dolow subcatchment.
Water 15 02594 g007
Figure 8. Comparison of observed and simulated monthly mean streamflow in Juba Dolow station (2002–2014).
Water 15 02594 g008
Table 1. Comparison between studies conducted on hydrological modeling using WEAP model.
Hydrological Model(s)Research FocusApproachSimulation MethodModel PerformanceBasin and Location
Physical ModelStatistical Model
WEAPWater resourcesSoil moisture methodR2 = 0.97
NSE = 0.64
Chongwe River Catchment (Zambia) [22]
WEAPSub-basin hydrologySoil moisture methodR2 = 0.82
NSE =0.80
Central Rift Valley basin (Ethiopia) [31]
WEAPHydrologic simulationSoil moisture rainfall–runoff methodR2 = 0.88
NSE = 0.86
PBIAS = −16.5
Awash basin (Ethiopia) [24]
WEAPEvaluating the current availability of water resourcesSimplified coefficient methodR2 = 0.91
NSE = 0.89
PBIAS = −10.7
Mae Klong (Thailand) [25]
WEAP & SWATAssessing the quantity of surface waterAllocated the resources in the catchmentR2 = 0.64
NSE = 0.73
South Phuthiasana (Tanzania) [26]
SWATAssessing the current status of Lake Ziway and its watershed from hydrological point of viewWEAP-PGMR2 = 0.6
NSE = 0.55
Lake Ziway (Ethiopia) [27]
WEAPEstimating the water budget components of the Sakarya River basin on annual basisWEAP-PGMR2 = 0.89
NSE = 0.74
PBIAS = 21.68
Sakarya River Basin (Turkey) [28]
WEAPAssessing current water resources by considering future climate changeWEAP-PGMR2 = 0.89
NSE = 0.85
Central Indus Basin [29]
WEAPComprehensive water balance analysis in a large region using limited, locally measured dataWEAP-PGMR2 = 0.818
NSE = 0.647
Mae Klong (Thailand) [32]
WEAP & multi-objective optimization modelOptimising water allocation decisions over multiple years.WEAPNSE =0.93
PBIAS = 11.4%
Sistan region and Hamoun wetland (Iran) [1]
WEAPHydrological assessment of the Juba River catchmentSoil moisture methodR2 = 0.91
NSE = 0.71
PBIAS = 14%
Current Research: Wabiga Juba basin (Somalia–Ethiopia)
Table 2. (a) Data sources used in the Juba River Basin WEAP model, (b) water components for Wabiga Juba basin for the selected years, and (c) averaged monthly climate values of Wabiga Juba catchment (1969 to 2018).
(a) Data sources used in the Juba River Basin–WEAP model
Data typeScaleFormatDescriptionSource
MeteorologyDaily (1966–2019)ExcelPrecipitation; wind speed, humidity; average tempNational Meteorological Information Centre
River FlowDaily (2002–2020)ExcelRiver dischargeNational Meteorological Information Centre
Hydrology-ShapefileRiverQ-GIS
(b) Water Components for Wabiga Juba Basin for the selected years
Year2002/03200520102020
Precipitation (Mm3)34,209.632,002.6438,698.1639,461.51
Evapotranspiration (Mm3)−38,021−29,422−31,154−33,566
Surface Runoff1596.12818.682283.913717.39
Streamflow (Mm3)3,057,397718.69339.8211,558.06
(c) Averaged monthly climate values of Wabiga Juba catchment (1969 to 2018)
MonthJanuaryFebruaryMarchAprilMayJuneJulyAugustSeptemberOctoberNovemberDecember
Average Air Temperature (°C)302121.320.5516.616.416.41623.62626.126.8
Average RH (%)55.587.388.256.377.280.280.375.282.36955.275.2
Average Wind Speed (m/s)39.3452.473.483.7139.3482.4588.369.163.95848.139.7
Cloudiness Fraction0.90.90.30.10.10.10.2110.10.10.3
Table 3. WEAP default values and parameters range.
SNParameterCodeUnitRange of ValuesOptimal Range
MinimumMaximumDefault
1Soil Water CapacitySWCmm0>010000–400
2Deep Water Capacity mm0>01000
3Runoff Resistance FactorRRF-0100020–12
4Root Zone ConductivityRZCmm/month0>02014–80
5Deep ConductivityDCmm/month0.1>0.12020
6Preferred Flow DirectionPF-010.150.33–0.8
7Initial Z1-%010030-
8Initial Z2-%010030-
9Crop CoefficientKc----0–0.987
Table 4. Hydrological model categorization and validation standards [2].
Goodness-of-FitNSEPBIASR2
Very good0.75 < NSE 1PBIAS < ± 10R2  0.75
Good0.6 < NSE 0.75 ± 10 PBAIS   ± 150.7 < R2  0.75
Satisfactory0.5 < NSE 0.6 ± 15 PBAIS   ± 450.6 < R2  0.75
UnsatisfactoryNSE 0.5PBIAS 45R2  0.6
Table 5. Statistical monthly data calibration and validation (2002–2014).
Statistical ParameterGauge Station: Juba Dolow
Calibration: 2002–2008Validation: 2009–2014
Coefficient of Determination (R2)0.710.70
Nash–Sutcliffe Efficiency (NSE)0.910.88
Percent Bias (PBIAS) (%)14%13.4%
Disclaimer/Publisher’s Note: The statements, opinions and data contained in all publications are solely those of the individual author(s) and contributor(s) and not of MDPI and/or the editor(s). MDPI and/or the editor(s) disclaim responsibility for any injury to people or property resulting from any ideas, methods, instructions or products referred to in the content.