Article

Optimal Scheduling of Cascade Reservoirs Based on an Integrated Multistrategy Particle Swarm Algorithm

1
Hubei Key Laboratory of Intelligent Yangtze and Hydroelectric Science, China Yangtze Power Co., Ltd., Yichang 443000, China
2
School of Civil and Hydraulic Engineering, Huazhong University of Science and Technology, Wuhan 430074, China
3
Hubei Key Laboratory of Digital River Basin Science and Technology, Huazhong University of Science and Technology, Wuhan 430074, China
*
Author to whom correspondence should be addressed.
Water 2023, 15(14), 2593; https://doi.org/10.3390/w15142593
Submission received: 12 June 2023 / Revised: 9 July 2023 / Accepted: 13 July 2023 / Published: 16 July 2023
(This article belongs to the Topic Hydroelectric Power)

Abstract

:
The optimal scheduling of cascade reservoirs is an important water resource management and regulation method. In the actual operation process, its nonlinear, high-dimensional, and coupled characteristics become increasingly apparent under the influence of multiple constraints. In this study, an integrated multistrategy particle swarm optimization (IMPSO) algorithm is proposed to realize the optimal operation of mid- and long-term power generation in cascade reservoirs according to the solution problem in the scheduling process of cascade reservoirs. In IMPSO, a variety of effective improvement strategies are used, which are combined with the standard PSO algorithm in different steps, among which beta distribution initialization improves population diversity, parameter adaptive adjustment accelerates convergence speed, and the Lévy flight mechanism and adaptive variable spiral search strategy balance the global and local search capabilities of the algorithm. To handle complex constraints effectively, an explicit–implicit coupled constraint handling technique based on constraint normalization is designed to guide the update process into the feasible domain of the search space. The feasibility of the proposed method is verified in the mid- and long-term power generation optimization scheduling of the lower reaches of the Jinsha River–Three Gorges cascade hydropower reservoirs. The results show that the proposed method outperforms the other methods in terms of search accuracy and has the potential to improve hydropower resource utilization and power generation efficiency significantly.

1. Introduction

Hydropower energy, which is a source of renewable energy, exhibits the qualities of being environmentally friendly, cost-effective, flexible, and reliable. These properties effectively contribute towards reducing carbon emissions while simultaneously promoting the harmonious development of economic and environmental benefits [1,2]. With the reorganization of the global energy system and the restructuring of energy sources, the advantages of hydraulic power have become increasingly apparent. Therefore, to facilitate the efficient allocation of resources, rational utilization and the development of hydropower energy are crucial. In this context, the optimal operation of cascade reservoirs has emerged as a major research area in recent years [3], with research efforts mainly focused on deriving reservoir scheduling regulations [4,5,6], identifying targets for reservoir scheduling models [7,8,9,10], and revising and utilizing optimization techniques for reservoir scheduling [11,12,13].
The connections of hydraulic and electrical systems among cascade reservoirs are closely related, and the topological relationships are extremely complicated. The optimal operation of cascade reservoirs is a type of nonlinear, multidimensional, multistage, multivariable, and multiconstrained complex optimization decision problem. To solve these problems effectively, scientists have conducted extensive research using traditional mathematical methods such as linear programming [14], nonlinear programming [15,16], dynamic programming [17,18], and other methods to solve the overall nonlinear problematic release of reservoirs. They also designed a set of metaheuristic algorithms [19,20,21] that combine physical mechanisms, natural inspiration, social laws, and evolutionary technology in order to improve the poor accuracy and vulnerability of traditional mathematical methods relative to the dimensionality problem and obtained a better solution. In addition, the optimal operation of cascade reservoirs also requires complex constraint treatment [22], and the relevant constraint processing methods are mainly the penalty function method [23], the ranking method [24], the variable repair method [25], and the boundary limitation method [26], which effectively improves the solution’s quality in practical engineering problems. However, using these methods results in greater computation or reduced population diversity, and the global optimal solution of the problem cannot be reached in a given period of time, falling to balance algorithmic robustness [27] with effectiveness in complex scenarios.
The particle swarm optimization (PSO) algorithm is a type of metaheuristic algorithm. Because of its simple structure, easy implementation, and fast convergence speed, it is widely used in practical engineering. However, due to its evolution mechanism and implementation style, this algorithm is prone to early maturation and delayed convergence in later stages, and easily falls into local optimal solutions. Numerous studies have implemented improvements relative to the PSO, such as the introduction of linear or nonlinear inertia weights and learning factors [28,29], the integration of mathematical probability distribution functions [30], and the integration with other optimization approaches [31]. These interventions have obviously increased the precision of the algorithm and enhanced its global exploration capabilities. Although the PSO algorithm has achieved some success in many aspects, the overall optimization effect of the algorithm is poor and lacks stability because of the stochasticity of the initial process and the flaw in the exploration ability. Therefore, it is necessary to study the defects of the PSO algorithm in order to improve its performance and better apply it to practical engineering cases. Based on this, a series of enhancements to the PSO method have been created to overcome the algorithm’s inadequacies in addressing high-dimensional difficult optimization issues. In particular, a beta distribution strategy is adopted to improve the monotonicity of the stochastic initialization of the PSO algorithm, a parametric nonlinear adaptive strategy is used to cope with the attraction of locally optimal neighbors in the iterative process, and a combination of the Lévy flight mechanism and a variable spiral search strategy is used to improve the algorithm exploration and exploitation performance. Meanwhile, an implicit constraint processing method is introduced to deal with the reservoir operation problem. It is combined with the explicit constraint processing technique of the static penalty function by restricting the feasible space of variables to solve the multidimensional constraint problem of cascade reservoir operation. Simulation results in practice show that the proposed method is robust and effective.
In IMPSO, the populations are first selected by beta distribution. The evolutionary process is then split into two updates. The first update employs a parameter adaptive change approach to update population velocity and location; the second employs a random number and either a Lévy flying mechanism or a variable helix search strategy to optimize population position based on the size of the random number. Finally, the answers to the two evolutions are compared, and the better option is chosen to maintain the population’s ability to explore and diversity.
The proposed scheme is experimentally evaluated by combining IMPSO with the explicit–implicit coupled constraint treatment technique and applying it to the problem of graded reservoir generation and scheduling under different runoff conditions based on various experiments. First, statistical results such as box plots, Friedman test, convergence analysis, and population diversity evaluation are used to verify the validity of the proposed scheme; second, the applicability of the proposed scheme is evaluated by analyzing the results of water abandonment, reservoir level fluctuation and output, and power generation of the step system generated during the practical application. The acquired results are compared with many other regularly used algorithms to demonstrate the suggested scheme’s superior performance in the field of reservoir scheduling.
In summary, the main contributions of this research are outlined as follows:
  • An IMPSO method is proposed that uses initialization, adaptive parameters, Lévy flight, and variable spiral search strategies to efficiently maximize performance.
  • In conjunction with the proposed IMPSO algorithm, an explicit–implicit coupled constraint handling technique is introduced to solve the generation scheduling model of cascaded hydropower systems.
  • The proposed scheme provides an effective tool for solving the complex problem of reservoir operation. Compared with several other schemes, it has the advantages of strong searching ability and robustness, which also can better utilize the collaborative generation effect of cascade hydropower units.
The remainder of this paper is organized as follows: Section 2 presents the optimization model for the operation of cascade reservoirs. Section 3 describes the IMPSO method. Section 4 briefly introduces the techniques used to process constraints. Section 5 testifies the proposed scheme’s performances in a real cascade hydropower system. Finally, Section 6 summarizes the study and outlines future research directions.

2. Operation Model of Cascade Reservoirs

2.1. Objective Function

Taking the maximum annual power generation of cascade reservoirs as the objective function, the objective function can be expressed mathematically as follows:
E = max i = 1 I t = 1 T N i , t Δ t
N i , t = A i Q i , t H i , t
where E is all the power generation of the cascade reservoirs. The cascade reservoirs are numbered from upstream to downstream in a sequence like 1 , 2 , 3 , and I is the number of reservoirs. t is the subperiod of the scheduling period, and T is the total number of stages over all scheduling periods. N i , t is the output at the t th stage of the i th hydropower reservoir. A i is the comprehensive output coefficient of the i th hydropower station. Q i , t and H i , t are the generation flow and the corresponding water head at the t th stage of the i th hydropower reservoir, respectively. In the reservoir scheduling field, power generation scheduling takes the maximum power generation as the objective function, and the final power generation result is obtained by calculating the output of each subdispatch period of the reservoir and multiplying it with the length of the subdispatch period. Therefore, Δ t is the length of each subperiod of the operation, and it is a constant value, taking different values according to different scheduling periods. In this paper, its duration is one decade.

2.2. Constraints

(1)
Water balance constraints
V i , t + 1 = V i , t + ( I i , t R i , t ) Δ t
R i , t = Q i , t + S i , t
where V i , t , I i , t , R i , t , Q i , t , and S i , t denote the storage capacity, inflow, outflow, generation flow, and abandoned water flow of the i th hydropower reservoir in the t th stage, respectively.
(2)
Storage capacity constraint
V i , t min V i , t V i , t max
where V i , t min and V i , t max denote the maximum and minimum storage capacity of the i th hydropower reservoir in the t th stage, respectively.
(3)
Hydraulic constraints
I i , t = R i 1 , t - τ + q i , t
where q i , t denotes the interval inflow of the i th hydropower reservoir in the t th stage. τ denotes the lagging periods of water flow.
(4)
Outflow constraints
R i , t min R i , t R i , t max
where R i , t max and R i , t min denote the maximum and minimum outflow of the i th hydropower reservoir in the t th stage.
(5)
Generation flow constraints
Q i , t min Q i , t Q i , t max
where Q i , t max and Q i , t min denote the upper and lower limits of the generation flow of the i th hydropower reservoir in the t th stage, respectively.
(6)
Water level constraints
Z i , t min Z i , t Z i , t max
Δ Z i d o w n Z i , t + 1 Z i , t Δ Z i u p
Z i , t + 1 = f Z V ( I i , t R i , t , Z i , t )
where Z i , t denotes the forebay water level of the i th hydropower reservoir in the t th stage. Z i , t max and Z i , t min are the upper and lower limits of forebay water levels of the i th hydropower reservoir in the t th stage, respectively. Δ Z i u p and Δ Z i d o w n are the upper and lower limits of the forebay water level variation of the i th hydropower reservoir in the t th stage, respectively. f Z V ( ) denotes the characteristic curve of the reservoir forebay water level and storage.
(7)
Water level head constraints
H i , t = Z i , t + Z i , t + 1 2 Z i , t d o w n
Z i , t d o w n = f Z R ( R i , t )
where H i , t and Z i , t d o w n denote the water level head and downstream water level of the i th hydropower reservoir in the t th stage.  f Z R ( ) denotes the function of downstream water level and outflow.
(8)
Output constraints
N i , t min N i , t N i , t max
where N i , t min and N i , t max denote the upper and lower limits of the output of the i th hydropower reservoir in the t th stage, respectively.
(9)
Initial and final water level control constraints
Z i , 0 = Z i , s t a r t
Z i , T = Z i , e n d
where Z i , s t a r t and Z i , e n d denote the water levels at the beginning and end of the operation period required by the corresponding regulation of the i th hydropower reservoir, respectively.

3. Integrated Multistrategy Particle Swarm Optimization Algorithm (IMPSO)

3.1. Introduction of the Particle Swarm Optimization Algorithm (PSO)

The PSO algorithm [32] is a metaheuristic algorithm based on population evolution that simulates the natural foraging behavior of birds to try to achieve global optimization [33] in the search zone. Therefore, by analogy with the foraging behavior of a flock of birds, in the PSO algorithm, the particles usually represent the birds, and the solution in space, i.e., the location of the particles, is the location where each bird is located; moreover, the globally optimal solution is the location with the most amount of food. The PSO algorithm consists of three phases: random population initialization, particle velocity update, and particle position update. Figure 1 shows the basic structure of the PSO algorithm.
(1)
Random population initialization
First, the initial population is generated at random by specifying the number of particles, the range of velocities, and positions and restricting the search space to the upper and lower bounds of velocity and position constraints. The initial particle velocity and position of the PSO algorithm are as follows:
v i 0 = v i , min + r a n d ( v i , max v i , min )
x i 0 = x i , min + r a n d ( x i , max x i , min )
The initial population of the PSO algorithm can be represented as follows:
X 0 = x 1 0 , x 2 0 , , x N 0
where v i 0 and x i 0 denote the initial velocity and position of the particle, respectively. v i , min and v i , max denote the lower and upper limits of the velocity of the particle, respectively. x i , min and x i , max are the bottom and upper boundaries of the position, respectively. r a n d is the random number of the interval of 0 ,   1 , and N represents the number of particles in the population.
(2)
Particle velocity update
After the population is initialized, the global and personal optimal positions are recorded, and the velocities are updated. The particle velocity update process of the PSO algorithm can be formally stated as follows:
v i k + 1 = ω v i k + c 1 r 1 ( x i p x i k ) + c 2 r 2 ( x g x i k )
where v i k denotes the velocity of the k th iteration of the i th particle. ω stands for the inertia weight for the population iteration, and its general values fall between 0.4 and 0.9. c 1 and c 2 represent the self-learning factor and social learning factor of particles, respectively; they commonly take a value of 2. r 1 and r 2 are two randomly selected numbers within the range of 0 and 1. x i k denotes the position in the k th iteration of the i th particle. x i p and x g represent the personal optimal position of the i th particle and the global optimal position, respectively.
(3)
Particle location update
The particle position is updated according to the updated particle velocity. The formula for updating the PSO particle position is as follows:
x i k + 1 = v i k + 1 + x i k
where x i k + 1 represents the position in k + 1 th iteration of the i th particle.

3.2. Integrated Multistrategy Particle Swarm Optimization Algorithm (IMPSO)

The PSO algorithm moves fast in the early phase but moves slowly in the late phase, which facilitates convergence to the local optimal solution in the early phase and cannot precisely converge to the global optimal solution. To solve this problem, an integrated multistrategy particle swarm optimization algorithm is developed that integrates the beta distribution, nonlinear adaptive parameter fitting strategy, Lévy flight mechanism, and adaptive spiral search strategy in the optimization process of PSO.

3.2.1. Population Initialization Based on the Beta Distribution

The initial population of PSO is randomly generated as Equation (18) in the search space, and the initial population generated by this method does not have small differences, so it cannot effectively cover the entire search space, the diversity of the population optimization is reduced, and the algorithm easily falls into the local optimal solution. The beta distribution is a set of continuous probability distributions defined on intervals, and the distribution [34] function is described as follows:
P ( x ; α , β ) = Γ ( α + β ) Γ ( α ) + Γ ( β ) x α 1 ( 1 x ) β 1
where Γ ( ) is the standard gamma function. The two important parameters— α , β ( α > 0 ,   β > 0 ) —of the beta distribution are parameters that control the shape of the distribution. In general, the beta distribution function’s representation can also be described as X ~ B e ( α , β ) .
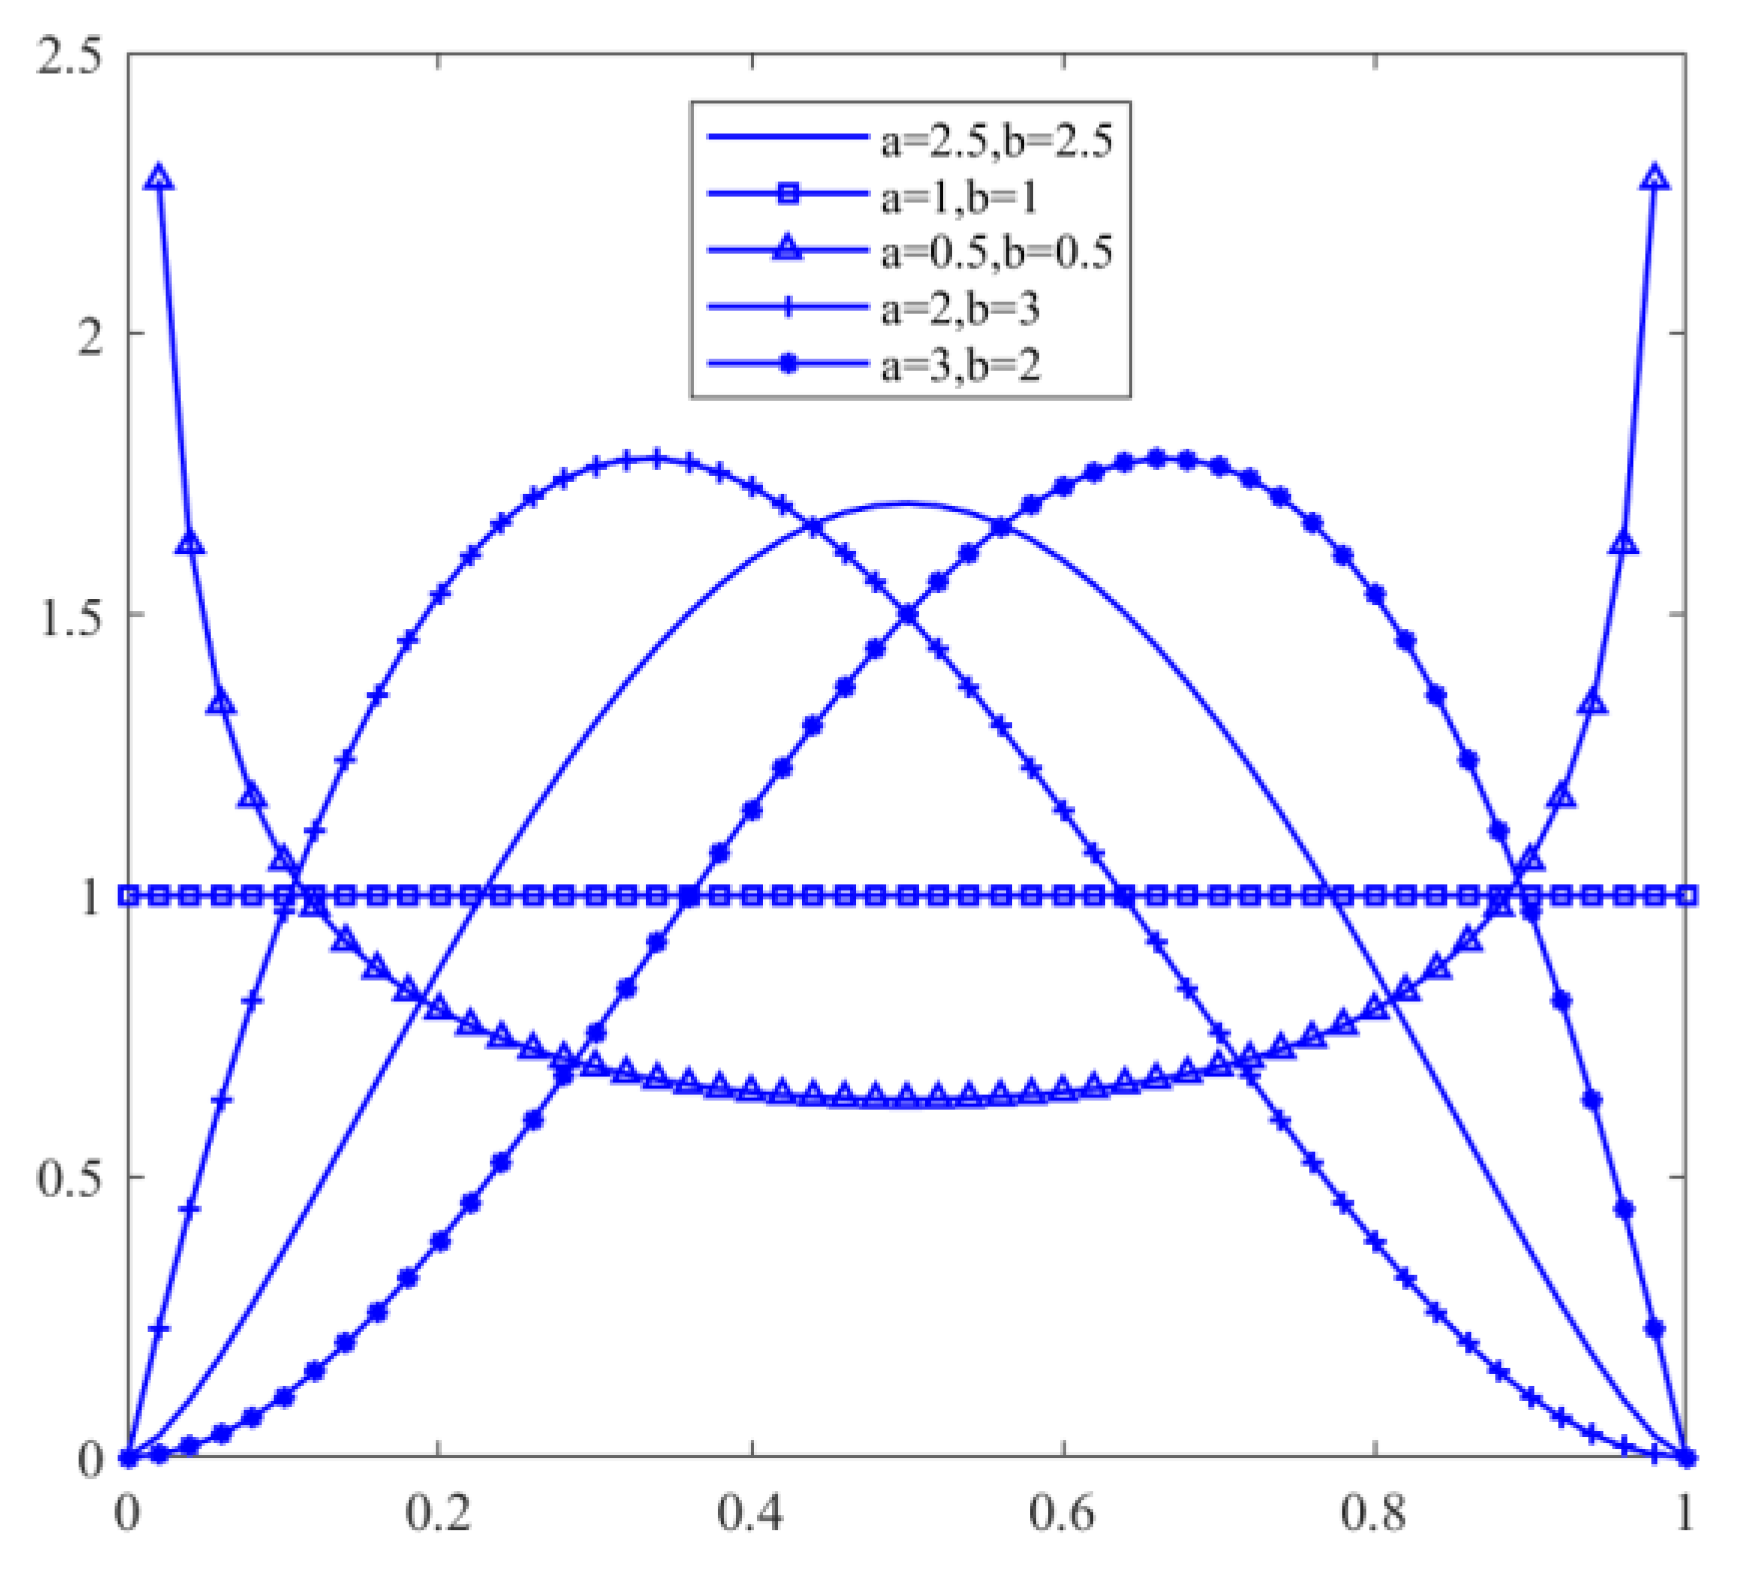
Figure 2 shows the structure of various beta distributions. The shape of the beta distribution produced by different parameters may be observed in the image; when α = β = 1 , its shape is comparable to a uniform distribution; if α > β , its distribution is left skewed; and if α < β , its distribution is right skewed. Many studies [34,35,36] have shown that the beta distribution is more competitive than the random sequence and uniform distribution. Therefore, we used the beta distribution to initialize the population. The initial particle distribution of the population is more even. The initial population sequence of the beta distribution is presented as follows:
x i 0 = x i , min + B e ( α , β ) ( x i , max x i , min )

3.2.2. Nonlinear Adaptive Parameter Fitting Strategy

To optimize the performance of PSO, the parameters of inertia weight ω , self-learning factor c 1 , and social learning factor c 2 are adjusted adaptively. Inertia weight ω keeps particles moving with inertia and tends to expand the search space. When the ω value is large, the algorithm’s global optimization ability is greater, but its local optimization ability is weak, which means that the convergence speed is high but the search accuracy is low. Although a more accurate global optimal solution can be found while the ω value is low, the convergence ability of the algorithm is weak. The self-learning factor and the social learning factor guide the particles in the iteration through the optimal position of the particles themselves and the optimal position of the population. In this study, we nonlinearly and dynamically adjust the inertia weight, self-learning factor, and social learning factor according to the number of iterations. This measure can prevent particles from falling into the local optimal solution, realize the fast convergence of particles to the global optimal solution, and effectively improve the convergence ability and optimization ability of the algorithm. The adjustment process is expressed using the following formulas:
ω k = ω max + k ( ω max ω min ) ( k 2 K ) K 2
c 1 k = c 1 max + k ( c 1 max c 1 min ) ( k 2 K ) K 2
c 2 k = c 2 min k ( c 2 max c 2 min ) ( k 2 K ) K 2
where ω k , c 1 k , and c 2 k denote the inertia weight, self-learning factor, and social learning factor of the k th iteration, respectively. ω max and ω min are the upper and lower limits of inertia weight, respectively. c 1 max and c 1 min are the maximum and minimum values of the self-learning factor, respectively. c 2 max and c 2 min are the maximum and minimum values of the social learning factor, respectively. K stands for the maximum value of the iteration.
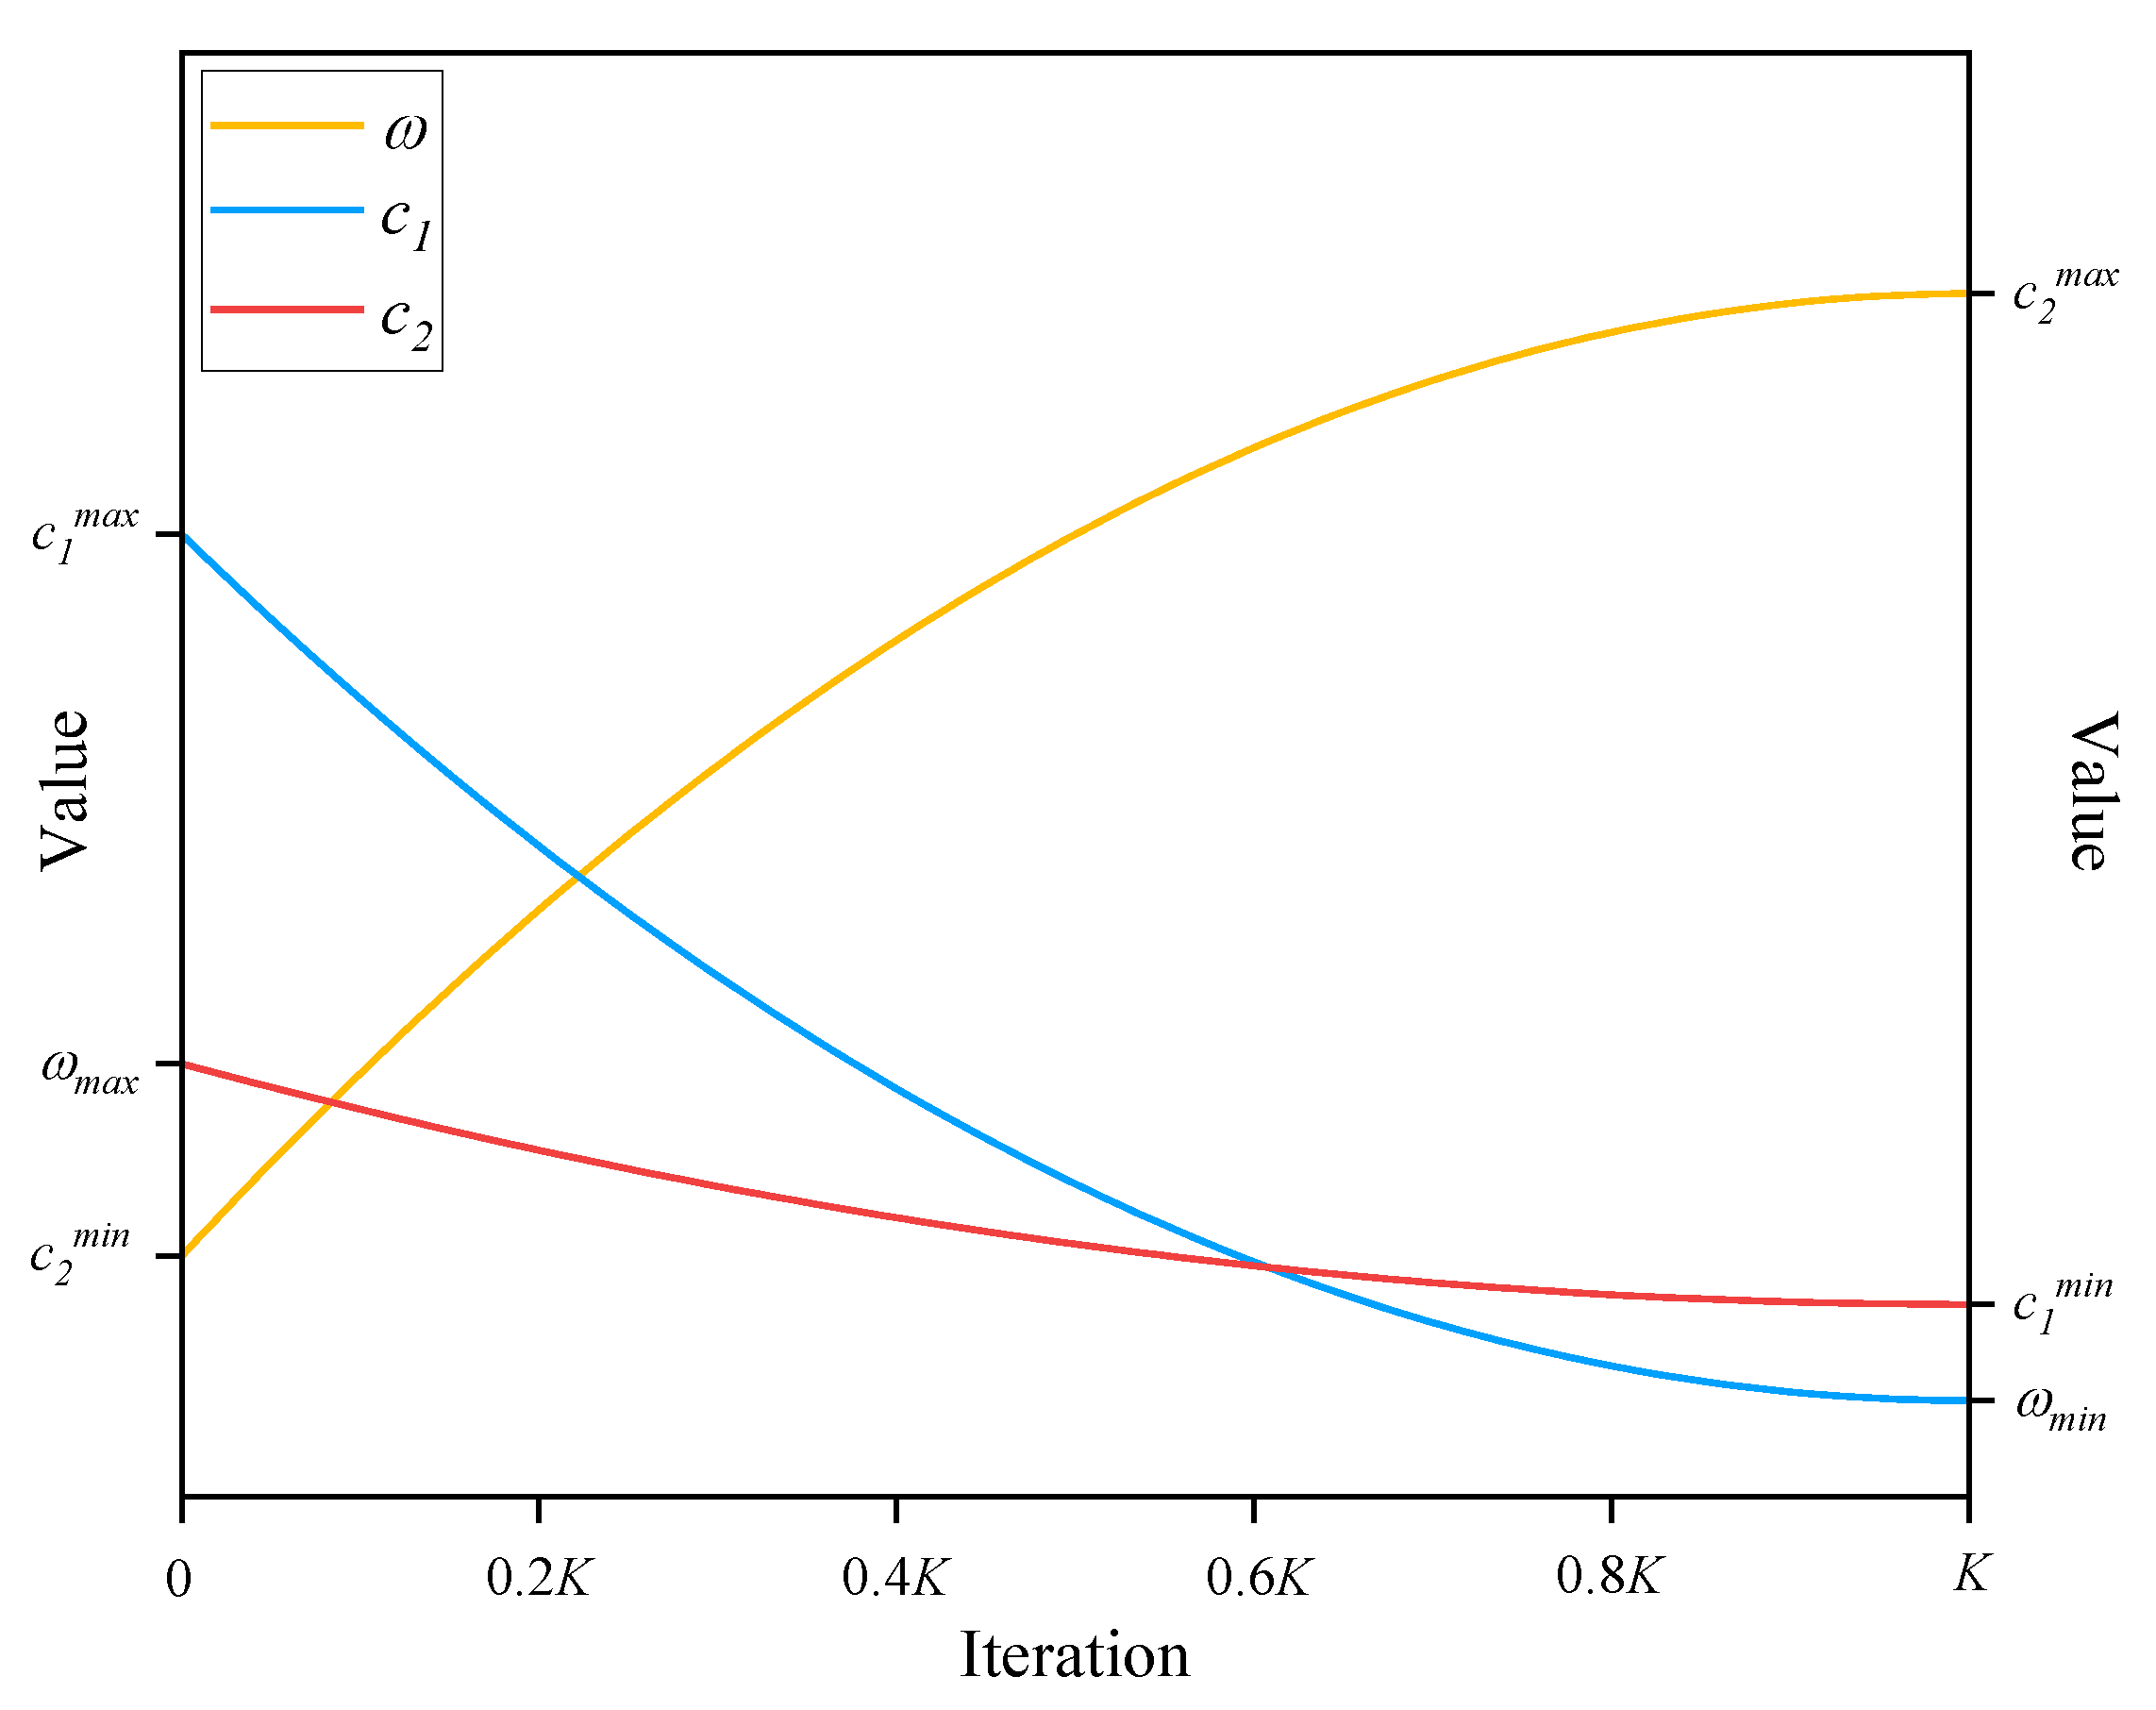
Figure 3 depicts the nonlinear variation patterns of the three PSO algorithm parameters after improvement. The figure shows that the change patterns for all three parameters are steep at first and thereafter flat, with ω and c 1 nonlinearly falling and c 2 nonlinearly increasing. This dynamic tendency may cause the algorithm to have good exploitation ability early in the optimization search and good global exploration ability later in the search to reach a balance of individual exploitation and global exploration.
The particle’s velocity and position are updated using the updated parameters. The position formula is shown in Equation (21), and the velocity formula is updated as follows:
v i k + 1 = ω k v i k + c 1 k r 1 ( x i p x i k ) + c 2 k r 2 ( x g x i k )

3.2.3. Lévy Flight Mechanism

As demonstrated in Figure 4a, Lévy flight [37] is a random wandering mechanism with a heavy-tailed distribution of step sizes. It has two characteristics: (1) small step length tracking, which can assist the algorithm in performing local neighborhood search, and (2) long distance spanning, which can jump at local locations with high probability and impose perturbation on the algorithm, allowing it to escape the local optimal solution. Therefore, we introduce the Lévy flight strategy to accelerate the particles to the global optimal position, shorten the iteration time, improve the algorithm’s convergence speed, and prevent the algorithm from stagnating in the local optimal solution. The improved position update formula is as follows:
x i , new k + 1 = x i k + ( x g x i k ) L e v y ( β )
where x i , n e w k + 1 denotes the position of the i th particle in the k th iterative Lévy flight. denotes point-to-point multiplication. L e v y ( β ) is a random search path for particles that follow the Lévy distribution with parameter β . The formulas of the Lévy distribution [37] are satisfied as follows:
L e v y ( β ) ~ μ ν 1 β
μ ~ N 0 ,   σ μ 2
ν ~ N 0 ,   σ ν 2
σ μ = Γ ( 1 + β ) + sin ( π × β 2 ) Γ ( 1 + β 2 ) × β × 2 β 1 2
σ ν = 1
where μ and ν represent the standard normal distribution. β is usually valued at a constant of 1.5.
Because the Lévy flight mechanism is widely employed in particle swarm optimization, the algorithm’s temporal complexity increases, causing the particle search strategy to be shifted by the size of the random number r of the interval of (0, 1]. For r > 0.5, we update the position using the Lévy flight mechanism; otherwise, the following search strategy is added.

3.2.4. Adaptive Variable Spiral Policy

To develop more diverse search paths for particle position updates, variable spiral search [38] is recommended, as shown in Figure 4b. It can be seen that this policy can explore and develop globally in the form of a large spiral shape in the early stage and focus on the optimal solution neighborhoods in the form of a small spiral in the later stage by adjusting the adaptive spiral coefficient. It also improves the ability of particles to explore unknown search domains. The variable spiral search position update formula designed in this study is as follows:
x i , new k + 1 = x i k + e z l ( x g x i k ) cos ( 2 π l ) z = e s cos ( π ( 1 k K ) )
where z is a variable that changes the shape of the spiral from large to small as the number of iterations increases. l is a uniformly distributed random number between [−1,1]. s is the coefficient of variation, which takes a constant number of 5. In the adaptive variable spiral policy, the scope of the spiral decreases with an increase in the number of iterations. The particle swarm can search for food using a large-scale spiral pattern early in the search, which effectively increases its diversity; later in the search, the bounding circle is gradually reduced to approximate the optimal solution, which can improve the program’s optimization performance.

3.3. Framework of IMPSO

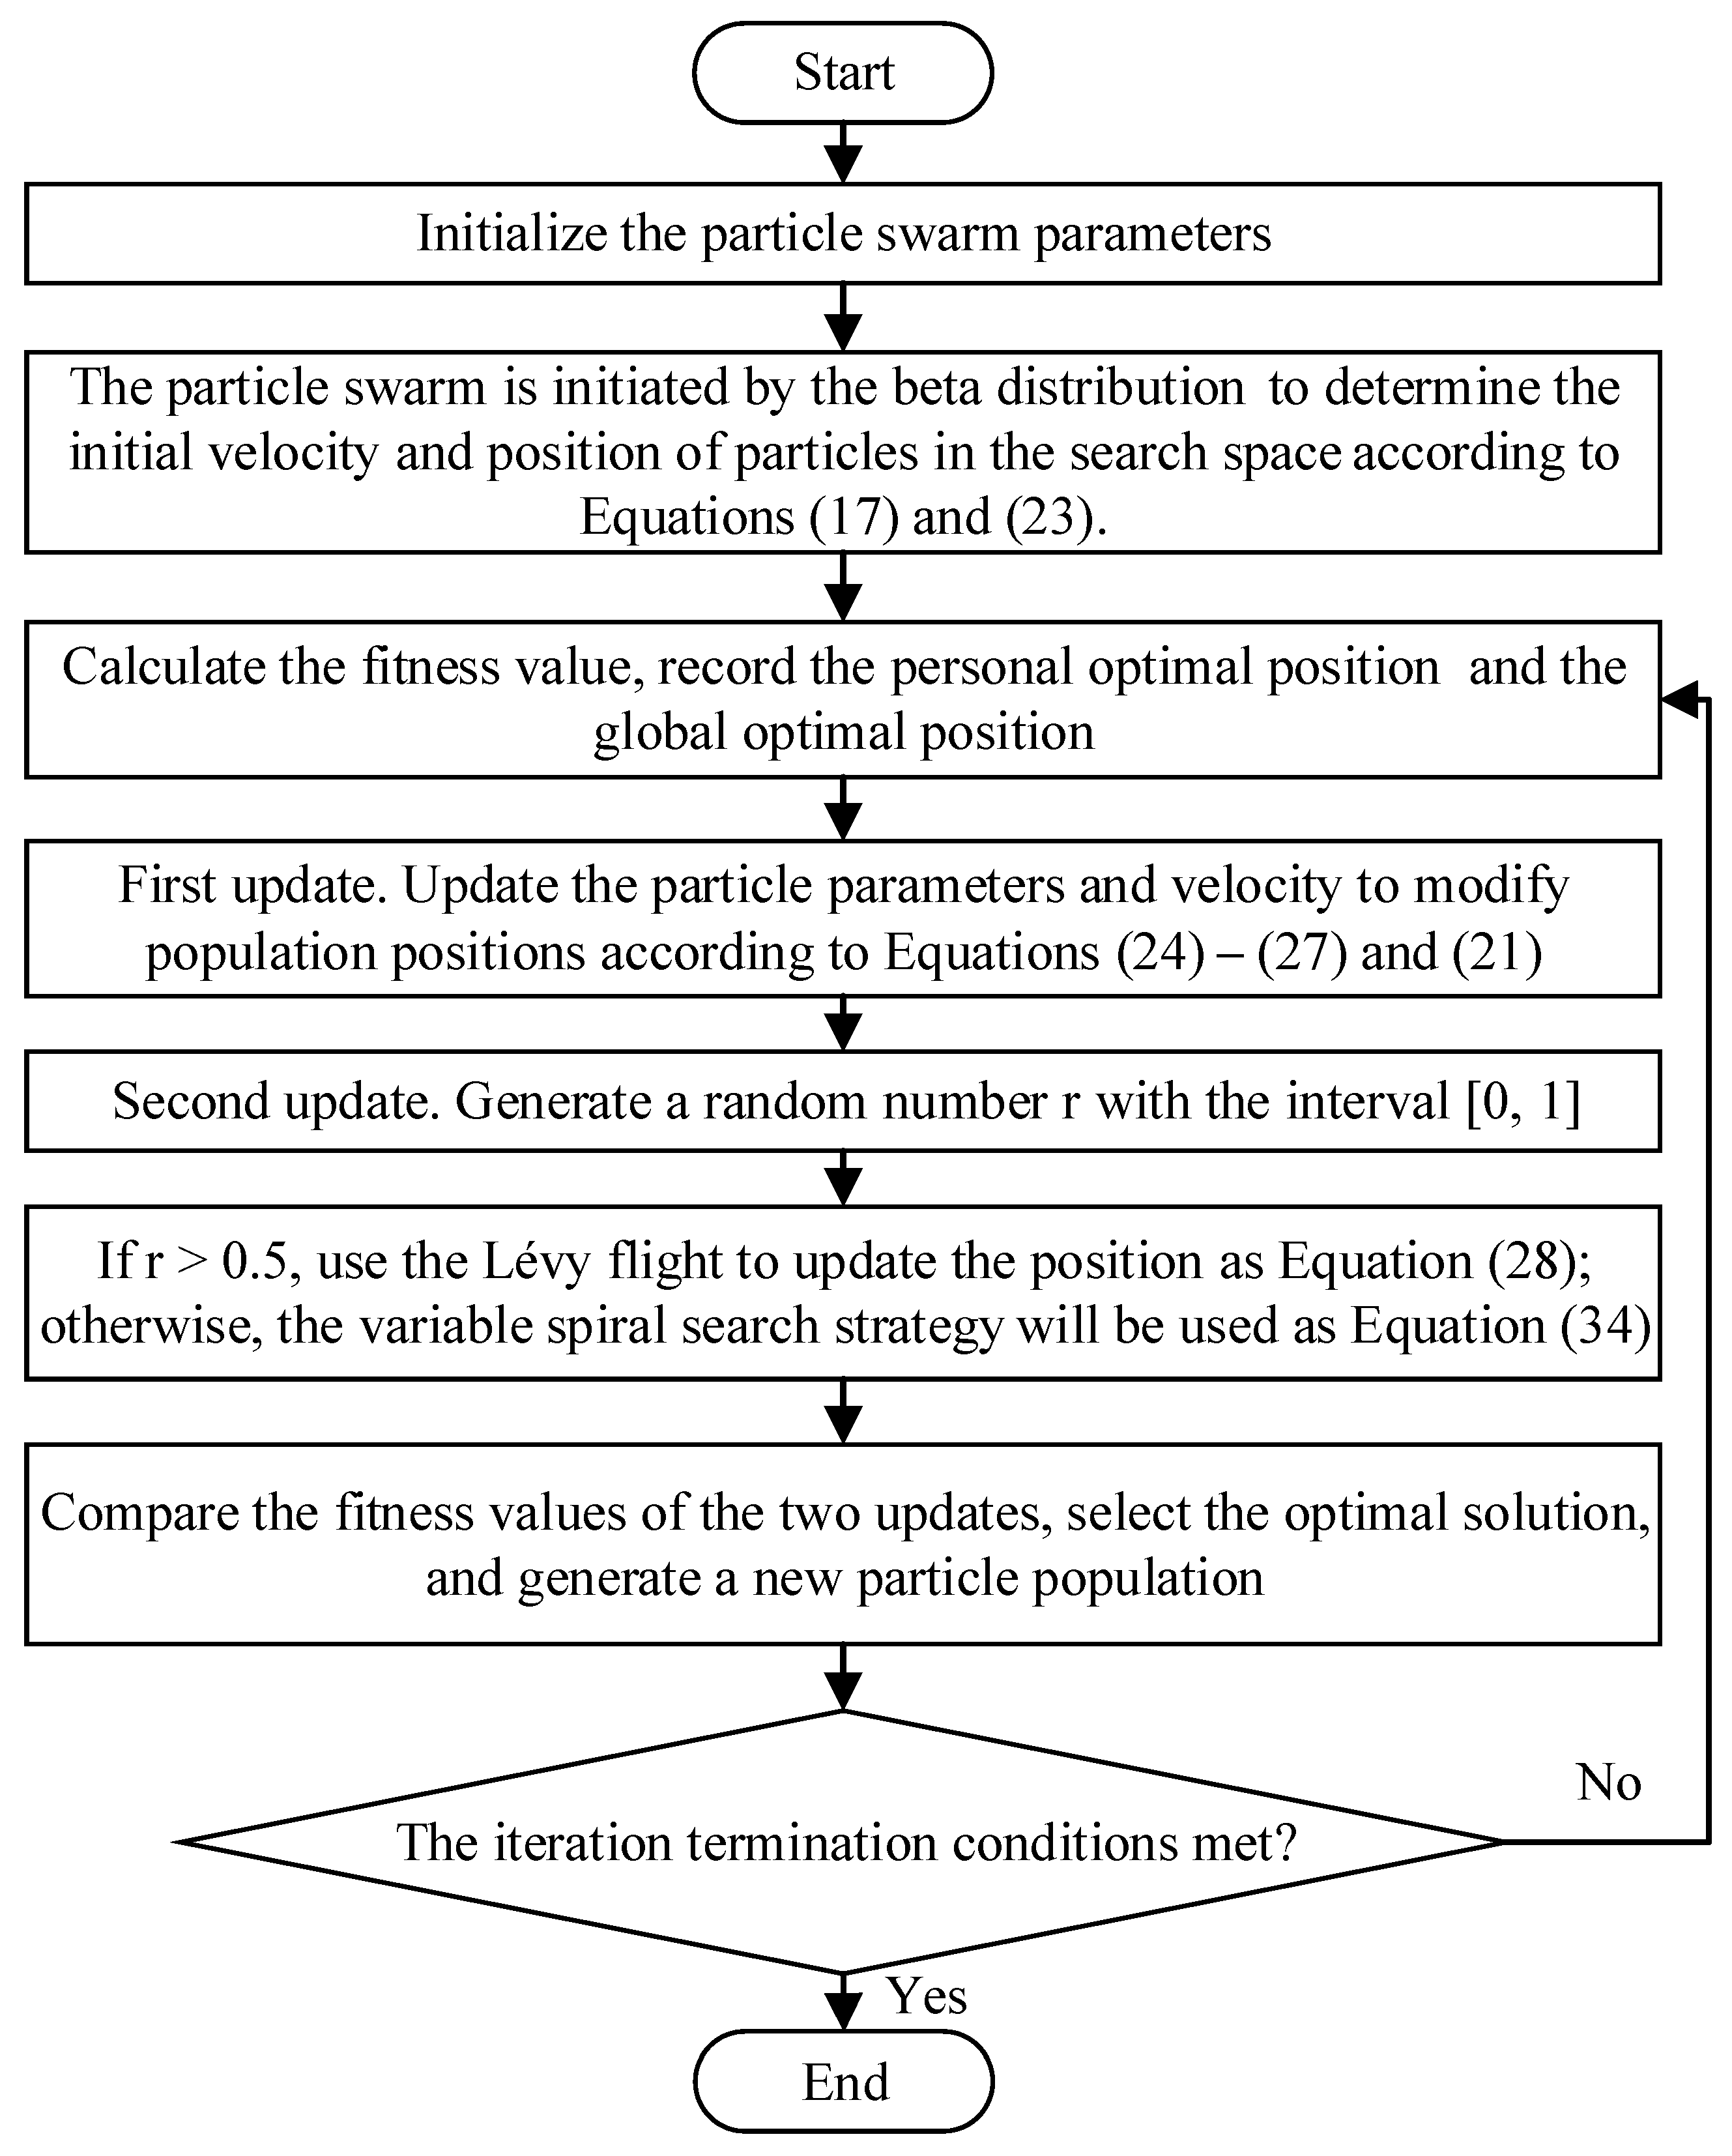
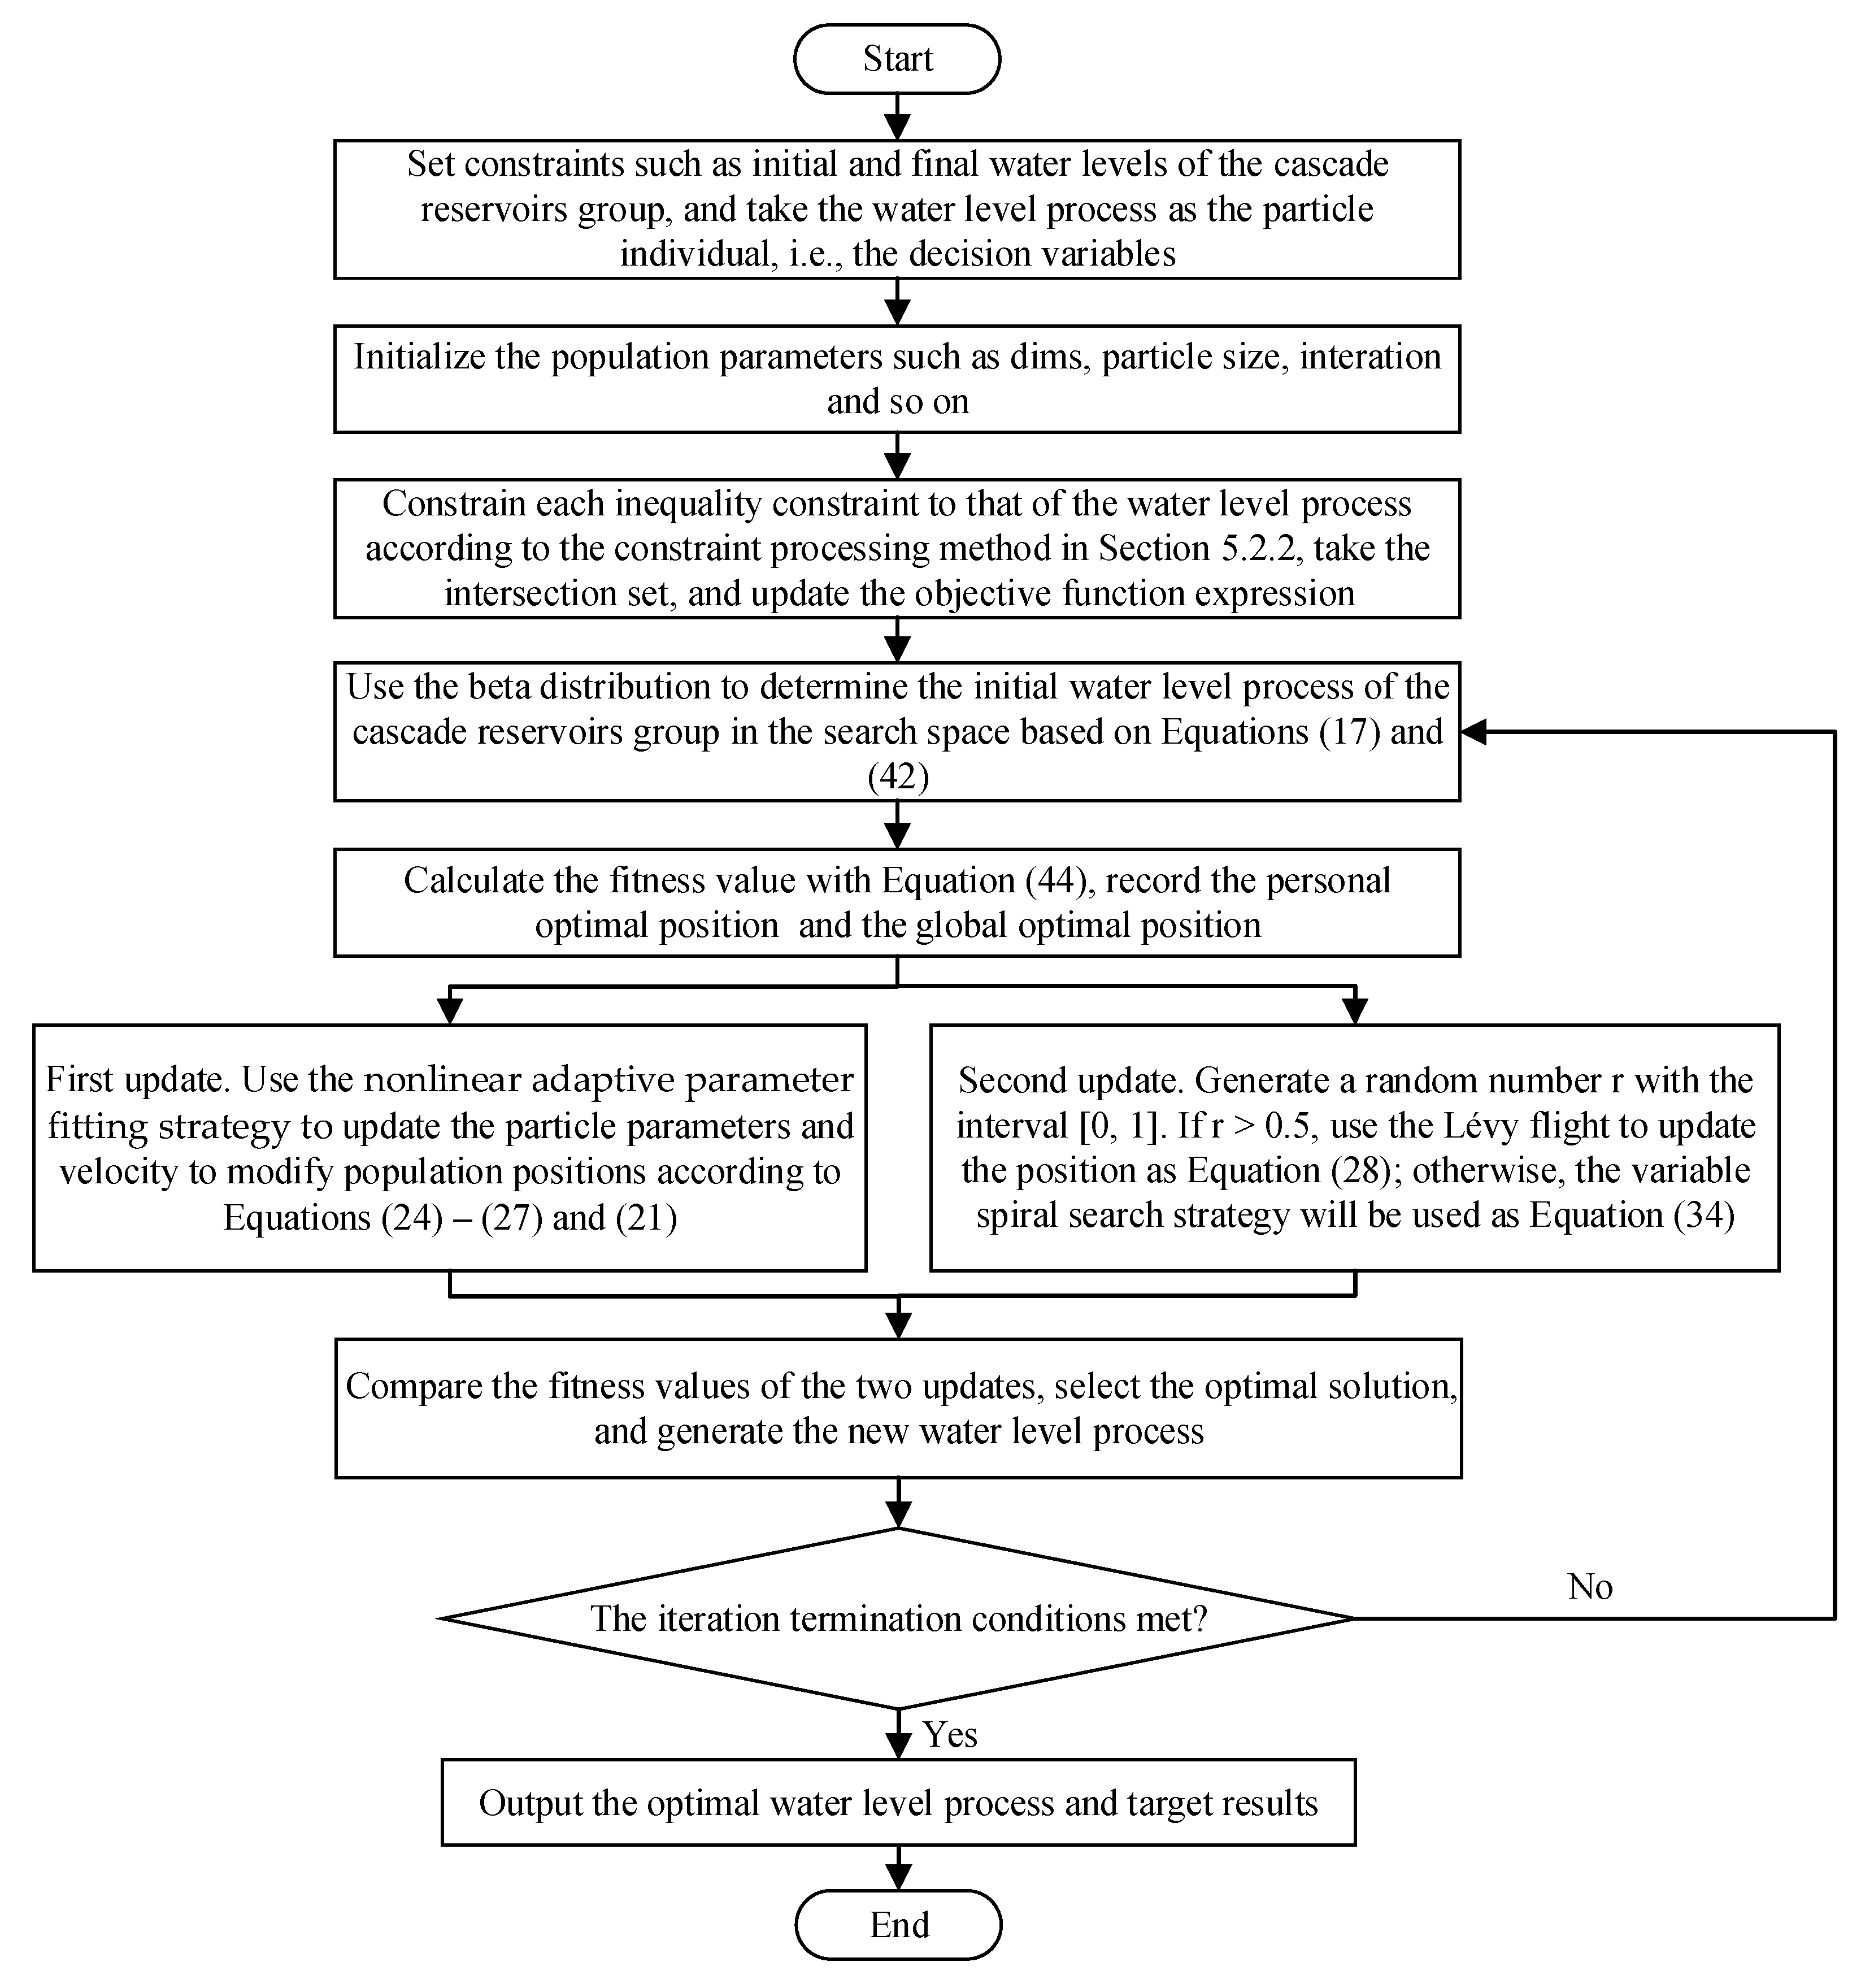
The technological process of the integrated multistrategy particle swarm algorithm designed in Section 3.2 is shown in Figure 5, which represents the overall framework of the algorithm. The execution steps of IMPSO for the optimization problems are listed below:
Step 1: The initial parameters of the population are set, and the population’s velocities are initialized.
Step 2: The beta distribution in Section 3.2.1 is used to generate the initial positions of the population, as shown in Equation (23).
Step 3: The fitness value of each individual in the initial population is calculated and recorded, and the global optimal value for storage is found.
Step 4: The first update is performed. The inertial weights, self-learning factors, and social learning factors are updated according to Equations (24)–(26) in Section 3.2.2, and individual velocities and positions are updated according to Equations (21) and (27).
Step 5: The second update is performed. A random number, r , is selected with interval [0, 1]; if r > 0.5 , the original particle position should be updated using Equation (28) in Section 3.2.3. If r 0.5 , the original particle position should be updated using Equation (34) in Section 3.2.4.
Step 6: Each individual fit value derived from the two updates is calculated separately, and the better values are chosen for storage. Then, the individual optimal values and global optimal values are recorded for each iteration.
Step 7: Whether the iteration termination condition is met is determined. If the condition is met, the procedure ends and the optimization result is exported. Otherwise, return to Step 4 to proceed with the update.

4. Constraint Handling Methods

4.1. Review of Constraint Handling Methods

The optimal operation of cascade reservoirs involves complex nonlinear constraints due to the complex system and numerous coupling connections among reservoirs. The general solution to these constraints is to enforce control over the search space, explicitly discard the solution that violates the constraint, and select only the workable solution. In the case of the metaheuristic algorithm, the abandonment of the infeasible solution limits the exploration and exploitation of the search domain, resulting in a loss of population diversity. Additionally, it is simple to settle for the local optimal value, and the global optimal solution cannot be found. As a result, solutions that exceed constraints must be properly processed to increase the precision of the solution.
Different methods of constraint processing have different effects. There are numerous techniques [39,40] that have been developed to solve constraint optimization problems, including the penalty function, feasibility rule, stochastic ranking, repair factors, and ε -constraint methods. In order to approach the optimal solution, the penalty function method converts the constrained optimization problem into an unconstrained one, and the variable violating the constraint is penalized by introducing a penalty factor. The feasibility rule is used in the evolution process to select the better solution between feasible and nonfeasible options. Due to its fundamental and flexible properties, it is suitable for use with any optimization algorithm. The stochastic ranking method sorts all solutions in the population in a manner similar to bubble sort in order to balance the target value and the penalty value for the constraint violation. The ε -constraint method changes the search bias dynamically, allowing the system to explore unfeasible domains. To solve the complex constrained optimization problem of cascade reservoirs, the static penalty function is combined with a new implicit constraint processing method [41] to update the constraint variable’s boundary and reduce the probability of the unfeasible solution.

4.2. Explicit–Implicit Coupled Constraint Handling Technique

In general, the constrained optimization problem can be mathematically described as a minimization or maximization problem as follows:
Min   f ( X )   o r   Max   f ( X ) ,   X = x 1 , x 2 , , x n
g l ( X ) 0 ,   l = 1 , 2 , , L h k ( X ) = 0 ,   k = 1 , 2 , , K l b i x i u b i
where X is the set of decision variables. g l ( X ) and h k ( X ) are the inequality constraints and equations, respectively. u b i and l b i are the upper and lower bounds of the decision variables x i , respectively.
The implicit constraint handling method presented in this study further limits the search space by turning each inequality constraint into an upper and lower bound with respect to decision variables and restricts the search space via the intersection as follows:
l b i u = min ( max [ l i , 1 ( x i ) , , l i , k i ( x i ) , l b i ] , u b i ) u b i u = max ( min [ u i , 1 ( x i ) , , u i , k i ( x i ) , u b i ] , l b i )
where u i , k i and l i , k i are the upper and lower bounds of the decision variables x i under the inequality constraint k i , respectively, and k i L . u b i u and l b i u are the upper and lower bounds of the update process of the decision variables x i , respectively. u b i and l b i are the original upper and lower bounds of the decision variables x i , respectively.
The boundary update formula is modified as follows in practical applications to prevent the upper bounds of the decision variable update process from being smaller than the lower bounds.
l b i u = min ( max [ l i , 1 ( x i ) , , l i , k i ( x i ) , l b i ] , u b i ) u b i u = max ( min [ u i , 1 ( x i ) , , u i , k i ( x i ) , u b i ] , l b i u )
Following the boundary update on decision variables, they are assigned to the search domain to ensure continuity across iterations, as shown below:
x i = l b i u + p i ( u b i u l b i u )
where p i denotes a random number between 0 ,   1 .
In this study, a static penalty function is presented that can be combined with the above implicit constraint processing approach to penalize the solution that exceeds the bounds of the decision variables during operations in order to achieve a more suitable result. The static penalty function can be expressed as follows:
F ( X ) = f ( X ) + θ × i = 1 N v i o l a t i o n i
where F ( X ) and f ( X ) are the objective values after increasing the penalty function and the original function. θ is the static penalty factor, according to the specific choice; i = 1 N v i o l a t i o n i denotes the total constraint violation.

5. Case Study

5.1. Study Area

The lower reaches of the Jinsha River–Three Gorges cascade hydropower system is selected as the study area in this section. With its abundant water resources and favorable development environment, the lower reaches of the Jinsha River have become one of the country’s largest hydropower bases and the hub of China’s “West-to-East power transmission”, providing an important contribution to local economic and social sustainability. The lower reaches of the Jinsha River–Three Gorges cascade reservoir group perform a series of social functions, including power generation, flood control, navigation, water supply, ecology, etc., providing substantial social and economic benefits for the Yangtze River basin. However, in order to maximize the economic benefits of these cascade reservoirs, establishing a joint dispatch management model of the lower reaches of the Jinsha River–Three Gorges cascade reservoirs is necessary. As a result, in order to maximize the benefits of power generation in the lower reaches of the Jinsha River–Three Gorges cascade reservoirs, this section examines the joint optimal operation of the cascade hydropower system, which provides technical support and theoretical foundations for the cascade economic operation of the system. In this paper, the Xiluodu, Xiangjiaba, Three Gorges, and Gezhouba reservoirs are mainly tested as the objects of investigation. These reservoirs are located in the lower reaches of the Jinsha River and have a total installed capacity of 44,410 MW. They are the largest reservoirs in the Yangtze River basin, and hold the top position in the hydroelectric power industry in terms of annual electricity generation and installed capacity. The topological structure of the four reservoirs in the study area is shown in Figure 6, and the main characteristic parameters are shown in Table 1.

5.2. Detailed Technical Procedures

5.2.1. Solution Structure and Population Initialization

It was mentioned in Section 3 that particles in the PSO algorithm usually refer to birds; however, the meaning of the referent can vary in specific problems. For the cascaded hydropower system of a river basin, taking the water level as the particle, i.e., the decision variable X of the optimization problem, the variable matrix is defined as follows:
X = Z 1 , 1 ,   Z 1 , 2 ,   ,   Z 1 , T Z 2 , 1 ,   Z 2 , 2 ,   ,   Z 2 , T Z N , 1 ,   Z N , 2 , ,   Z N , T N × T
where Z i , t ( i = 1 , 2 , , N ;   t = 1 , 2 , , T ) denotes the water level of the i th particle in the t th dim and the variables are continuous.
For the initial population of the optimization problem, Equation (23) of Section 3.2.1 is used to initialize the water level. The formula is expressed as follows:
Z i , 0 = Z i , 0 min + B e ( α , β ) ( Z i , 0 max Z i , 0 min )
where the parameters α and β of the beta distribution function are both 2.5 [34], which is obtained from some probability distribution initialization experiments.

5.2.2. Explicit–Implicit Coupled Constraint Handling Method Based on Constraint Normalization

In this article, the output-related constraints and flow boundary constraints are transformed into water level limit constraints using the relationship of the water level–capacity curve, ensuring the upper and lower limits of the output, installed capacity, and water level fluctuation. The feedback constraint processing method is referred to as the applied mathematical model in Section 2.1:
l b i , t u = min ( max [ Z i , t , min f Z ~ R , Z i , t , min f Z ~ N , Z i , t , min f Δ Z ~ Z , Z i , t , min f Z ~ Q , Z i , t , min f Z ~ V , l b i , t ] , u b i , t ) u b i , t u = max ( min [ Z i , t , max f Z ~ R , Z i , t , max f Z ~ N , Z i , t , max f Δ Z ~ Z , Z i , t , max f Z ~ Q , Z i , t , max f Z ~ V , u b i , t ] , l b i , t u )
E = max i = 1 I t = 1 T A i Q i , t H i , t Δ t + θ × i = 1 N v i o l a t i o n i
v i o l a t i o n i = 0 ,      o t h e r v i s e Z i , t l b i , t u   , i f   Z i , t < l b i , t u u b i , t u Z i , t ,   i f   Z i , t > u b i , t u
where Z i , t , min f Z ~ R ,   Z i , t , min f Z ~ N ,   Z i , t , min f Δ Z ~ Z   , Z i , t , min f Z ~ Q ,   Z i , t , min f Z ~ V denote the lower boundary of the water level after the conversion of the level–outflow function, level–output function, level–range of the water level function, level–generation flow function, and level–capacity function of hydropower station i in the t th stage, respectively. Z i , t , max f Z ~ R ,   Z i , t , max f Z ~ N ,   Z i , t , max f Δ Z ~ Z ,   Z i , t , max f Z ~ Q ,   Z i , t , max f Z ~ V denote the upper boundary of the water level after the conversion of the level–outflow function, level–output function, level–range of the water level function, level–generation flow function, and level–capacity function of hydropower station i in the t th stage, respectively. The penalty coefficient θ in this study is taken as a constant of 0.01, and it is determined by repeated trial calculation.
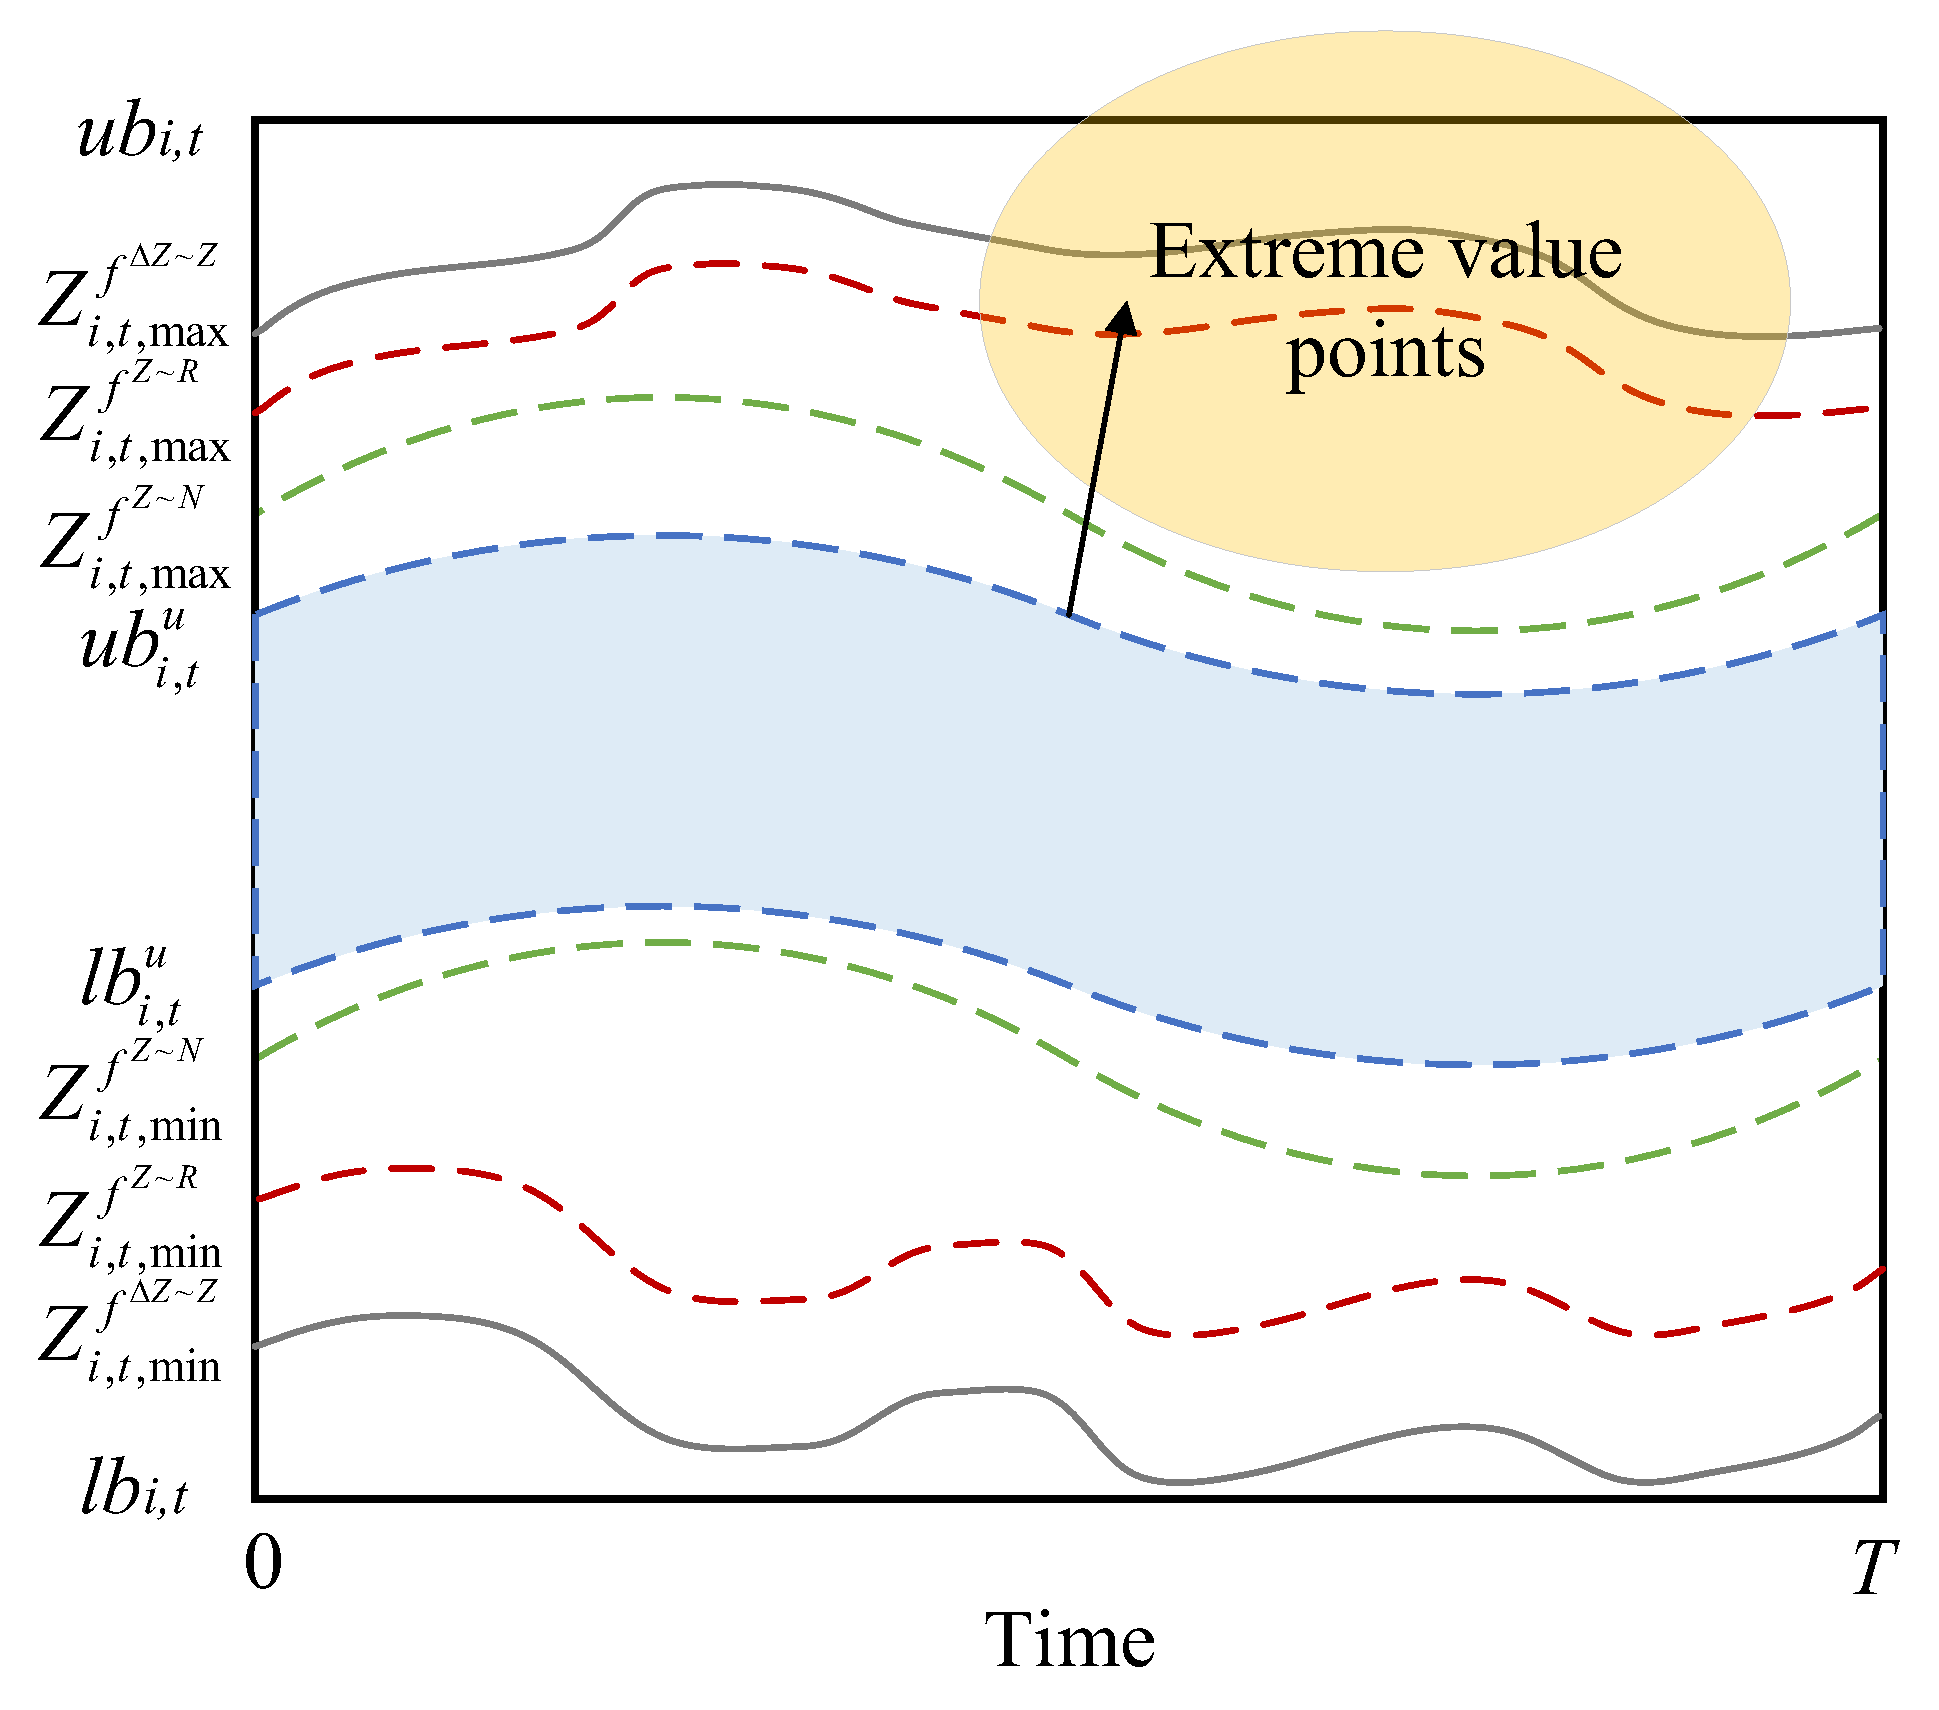
Figure 7 depicts a graphical depiction of the decision variable for this research issue, namely, water level. As can be observed, the feasible range of water level is [ l b i , t , u b i , t ] , a vast range of the search for the best is not favorable to the solution in the actual engineering problem, and the probability of an infeasible solution is higher. Following the improvement of the constraints, the feasible range of water level is gradually lowered under the management of different constraints, and eventually, the intersection of the constraints is taken to achieve the final viable range of water level, reducing the likelihood of infeasible solutions.

5.3. Overall Implementation Framework

The ideal operating method and process for maximizing the power generation benefit of the river basin cascade hydropower system is summarized as follows:
Step 1: The basic parameters of the optimization problem are defined, and the initialization method in Section 5.2.1 is used to generate initial groups in the problem space, i.e., the process of generating the initial water level of the cascade reservoir group.
Step 2: The fitness of all solutions in the current group is evaluated using the explicit–implicit coupled constraint handling method in Section 5.2.2.
Step 3: The individual best position and the global best position for each solution are updated. Then, the location of all solutions using the IMPSO approach in Section 3.2 is updated.
Step 4: If the terminal condition of the algorithm is not satisfied, return to Step 2 for the next cycle; otherwise, the iteration is stopped. Then, the optimal solution is taken as the final solution for the optimal scheduling of cascade reservoirs.
The procedure for solving the problem of the optimal operation strategy using the IMPSO algorithm is shown in Figure 8.

5.4. Results and Analysis

In order to verify the technical feasibility and efficiency of the proposed method in cascade reservoir power generation dispatching, three different typical runoff scenarios (wet, normal, and dry) were studied. In this paper, six methods were selected for the calculation to compare and analyze the application effect of the proposed method in cascade reservoir power generation dispatching, namely, IMPSO and the explicit–implicit coupled constraint handling technique (IMPSO+CHT), such as IMPSO, PSO, SAPSO [42], LFPSO [43], and DE [44].

5.4.1. Statistical analysis

For all parameter settings of the algorithms, the maximum number of iterations for each algorithm is K = 500, and the population size is N = 50. In addition, we set the mutation probability of DE to be 0.5 and the crossover probability to be 0.8; the inertia weight ω of the PSO algorithm decreases linearly from 0.9 to 0.4, and the self-learning factor c 1 and social learning factor c 2 are both 2; the SAPSO and LFPSO parameters were established by referring to Harrison H R et al. [43] and Haklı H et al. [44]; the inertia weight ω in IMPSO declined nonlinearly from 0.9 to 0.4, and the self-learning factor c 1 decreased nonlinearly from 2 to 0.2, while the social learning factor c 2 increased nonlinearly from 0.5 to 2.5. Considering the variation in the results of the intelligent optimization algorithm, each algorithm runs 10 times independently using different input data, and the average, median, best value, worst value, and standard deviation are counted. The detailed results are shown in Table 2.
It can be observed from Table 2 that under three runoff scenarios, the statistical data of the proposed IMPSO algorithm combined with the constraint processing method are mostly better than other algorithms. Taking the average power generation of 10 independent runs as an example, compared with IMPSO, SAPSO, LFPSO, PSO, and DE algorithms, the proposed scheme increased by 1.49, 31.72, 30.00, 30.24, and 30.25 billion, respectively, in the year of abundant water. Compared with IMPSO, SAPSO, LFPSO, PSO, and DE algorithms, the proposed program has increased by 0.55, 24.41, 19.24, 26.07, and 24.90 billion, respectively. Compared with IMPSO, SAPSO, LFPSO, PSO, and DE algorithms, the proposed scheme adds 0.35, 15.31, 9.29, 14.25, and 15.22 billion, respectively, in the dry year. The data shown above demonstrate that the proposed technique has excellent iterative performance and optimization capacity, and that it can significantly increase the economic benefits of cascade reservoirs aimed at generating electricity.
Figure 9 shows the distribution of the annual power generation results for each of the six methods under three typical runoff scenarios. First, it can be observed in the graph that the outcomes of the IMPSO+CHT and IMPSO algorithms are very stable compared with the other four algorithms in three runoff scenarios. The IMPSO+CHT and IMPSO algorithms are shown to be superior to the other four methods. Second, compared with IMPSO alone, the volatility of IMPSO+CHT was lower in the three runoff scenarios and the upper and lower quartile shadow area was smaller, and no outliers appeared. This indicates that IMPSO, when used in conjunction with the proposed constraint processing mechanism, is more centralized and robust in the three runoff situations. The SAPSO, LFPSO, PSO, and DE schemes all have average performance in the three runoff scenarios, with the LFPSO scheme having more outliers in the dry year scenario, and the maximum values of SAPSO and PSO are close to the two IMPSO-related schemes, but the minimum value is also lower than the other schemes, indicating that the SAPSO and PSO algorithms are less stable. The box plots along with the statistical information in Table 2 show that the IMPSO+CHT scheme is more robust and optimal compared with the IMPSO scheme.
Table 3 displays the Friedman test results for several scheduling methods under various runoff scenarios. The Friedman test ranking findings compare the overall performance of the six methods in the reservoir power generation scheduling problem. In dry and normal year scenarios, the IMPSO+CHT scheme and the IMPSO scheme rank significantly better than the rest of the schemes, and the IMPSO+CHT scheme is better than the IMPSO scheme. In the wet year, the IMPSO+CHT scheme and the IMPSO scheme have the same ranking results. Furthermore, by integrating the final ranking results, we can see that LFPSO outperforms SAPSO, LFPSO, PSO, and DE schemes, whereas PSO and DE optimization results are low overall.
Figure 10 depicts the convergence process of the six schemes when the power generation scheduling model is solved using inflow data from various runoff scenarios as model inputs. It is clear that the IMPSO+CHT scheme and the IMPSO scheme not only have high initial values but also have the highest growth rate at the start of the iterations, allowing the objective function values to converge to near-optimal values within 200 iterations. SAPSO, LFPSO, and DE schemes, on the other hand, have slower growth rates and poorer optimization results, while the PSO algorithm has the slowest growth rate and readily falls into a local optimum solution. The numbers (1), (2), etc. are a general ranking according to the mean rank.
In addition, population diversity analysis is an important component of the algorithm’s optimization search process. In general, a higher population diversity number reflects a more dispersed population, indicating that the algorithm is capable of global exploration and less likely to fall into the trap of the local optimal solutions [45]. Equation (46) can be used to express population diversity:
D i v e r s i t y ( t ) = i = 1 N d = 1 D ( x i d ( t ) x ¯ d ( t ) ) 2
where D i v e r s i t y ( t ) is the value of population diversity at the t th iteration, the parameter N is the number of population size, D is the dimension of the problem, x i d ( t ) is the position of the i th agent in the d th dimension at the t th iteration, and x ¯ d ( t ) implies the average position of the population in the d th dimension at the t th iteration.
Figure 11 depicts the population diversity study results for all scenarios under various typical runoff conditions. The figure shows that the overall results of the IMPSO+CHT scheme and the IMPSO scheme are better than the other algorithms in the three scenarios, with the IMPSO scheme outperforming the IMPSO+CHT scheme due to the use of the constraint treatment method, which weakens the algorithm performance to some extent. The outcomes displayed in different circumstances for the other four systems are not exactly the same. In the dry year, the DE scheme is the worst, the LFPSO scheme is better; in the wet year, the DE, PSO, and LFPSO schemes have similar results, and the SAPSO scheme is the best; in the wet year, the LFPSO and PSO schemes are better, then the SAPSO, and finally the DE scheme. Overall, the IMPSO scheme produced the best population diversity analysis results, followed by the IMPSO+CHT scheme, and the DE scheme produced the worst.
Based on the statistical results discussed above, it is shown that the four improvement strategies comprising beta distribution initialization, nonlinear parameter change, Lévy flight, and adaptive spiral update are feasible, and that the algorithm can effectively improve the ability of local disturbance optimization, avoid individual extreme values falling into local optimization too early, and extend the global search range scope of the algorithm. This shows that the IMPSO algorithm has broad engineering applicability in cascade reservoir optimal scheduling, which can increase the efficiency of cascade reservoir power generation and attain optimal hydropower resource assignment. At the same time, the constraint handling technique combining a variable boundary update and a penalty function is introduced, which can effectively reduce the out-of-bounds behavior of particles in the optimization process and improve the algorithm’s solution accuracy, thereby achieving the unity of robustness and exploring performance in the optimization mechanism.

5.4.2. Analysis of Optimization Scheduling Results

In this section, the disparities in water abandonment of cascade reservoirs under three typical runoff situations, the optimization results of the IMPSO+CHT scenario, and the generation rules are carefully studied based on the optimization outcomes of the six schemes.
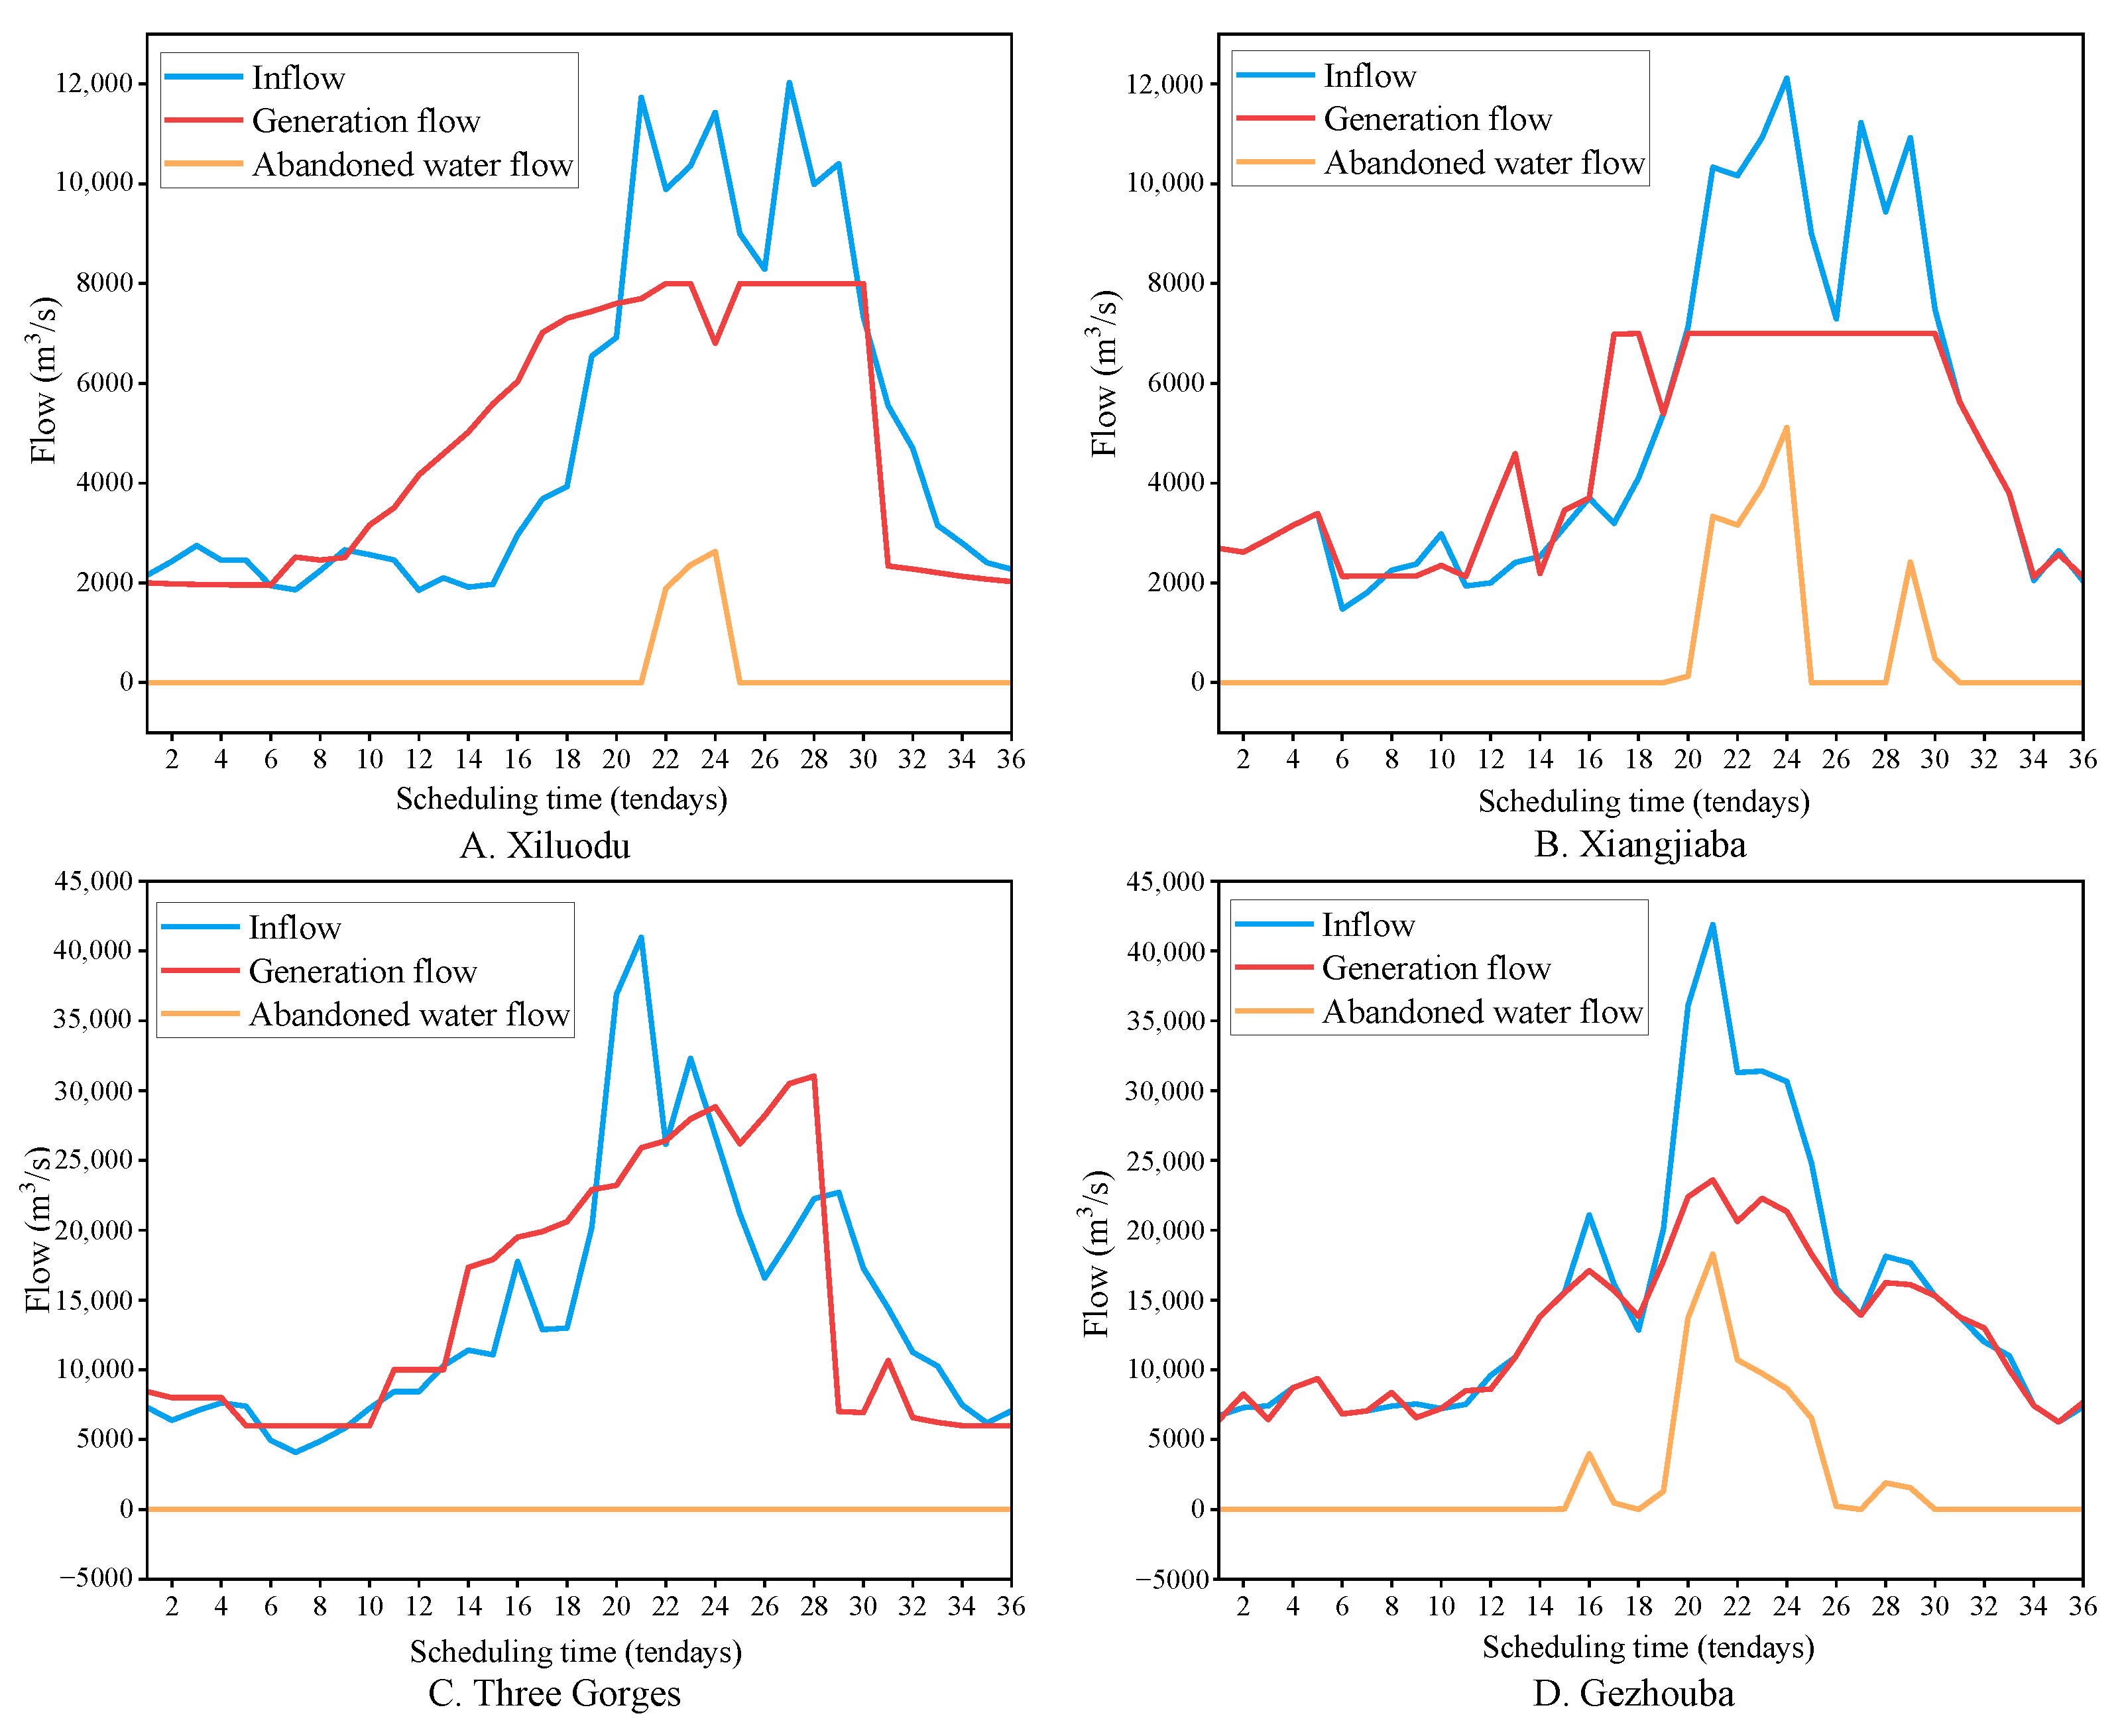
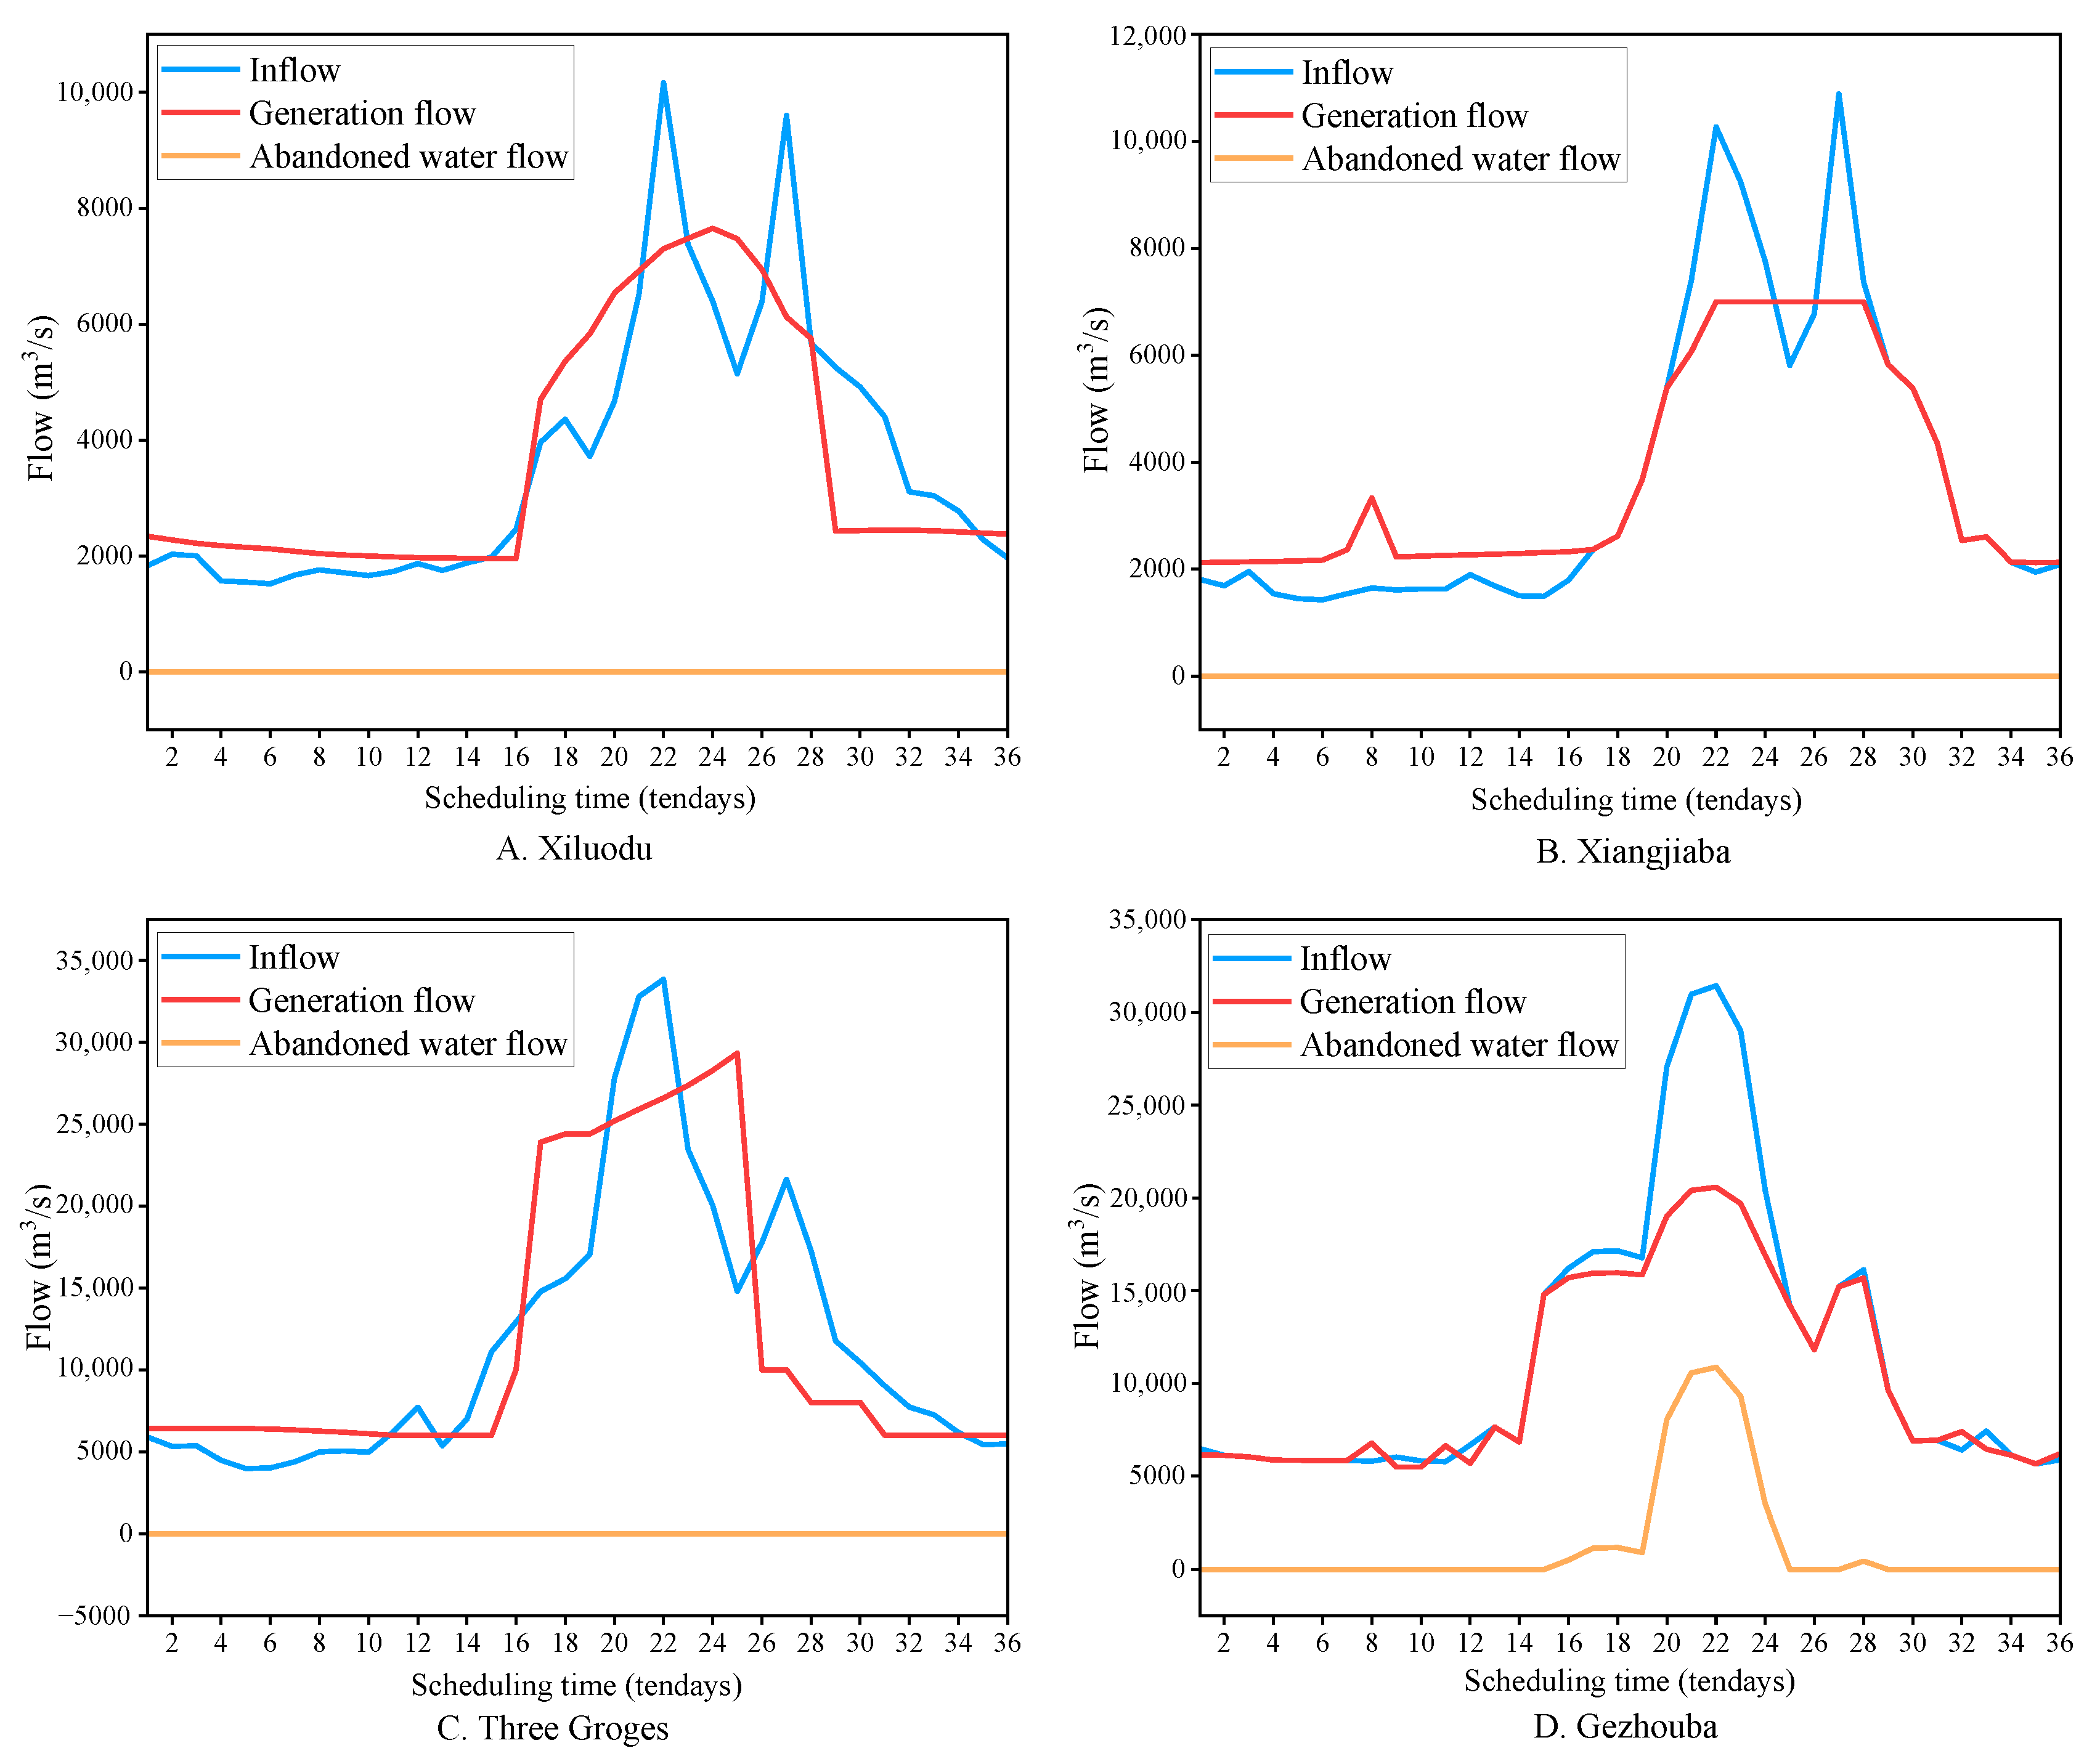
Table 4 compares the average volume of abandoned water generated by all methods for each typical runoff scenario in the results of 10 independent operations. It can be seen that under various runoff scenarios, the IMPSO+CHT scheme and the IMPSO scheme both generate significantly less abandoned water than the other schemes, with the IMPSO+CHT plan producing the least amount of waste water. Furthermore, the LFPSO scheme performs rather well, whereas the PSO and DE schemes dispose of the most water and have the lowest usage rate for water resources. Figure 12, Figure 13 and Figure 14 show the hydrological processes of the four reservoirs of the lower reaches of the Jinsha River–Three Gorges cascade hydropower system in typical runoff scenarios. It can be observed that in the flood scenario, due to the abundant flow of water, the peak value of the reservoir is large; except for the Three Gorges reservoir, the other three reservoirs have abandoned water. Due to the limited installed capacity and storage capacity, there are more water discharges in Xiangjiaba and Gezhouba, especially Gezhouba, which is a daily regulated reservoir. Under the scenario of the normal year, there is no abandoned water in Xiluodu and Three Gorges reservoirs, the water stock of Xiangjiaba consists of a small amount of abandoned water, and Gezhouba has more abandoned water, especially when the water rises sharply during the flood season, and the unit overflow of the has reached the limit, which is consistent with the trend of the inflow process. In the dry year, only Gezhouba has abandoned water in the cascade reservoirs, because the selected year has a large amount of water in the flood season, which is similar to the normal year, and the Gezhouba units, which have a low flow capacity, cannot bear a large amount of water during the flood season. Given their high regulating capacity, the Xiluodu, Xiangjiaba, and Three Gorges reservoirs can release the equivalent amount of water through reasonable operation throughout the nonflood season, lowering the quantity of water released during the regulation period. According to the findings of the preceding research, cascade reservoirs may effectively minimize water abandonment, improve hydropower utilization, and promote energy upgrading and transformation after IMPSO+CHT optimization.
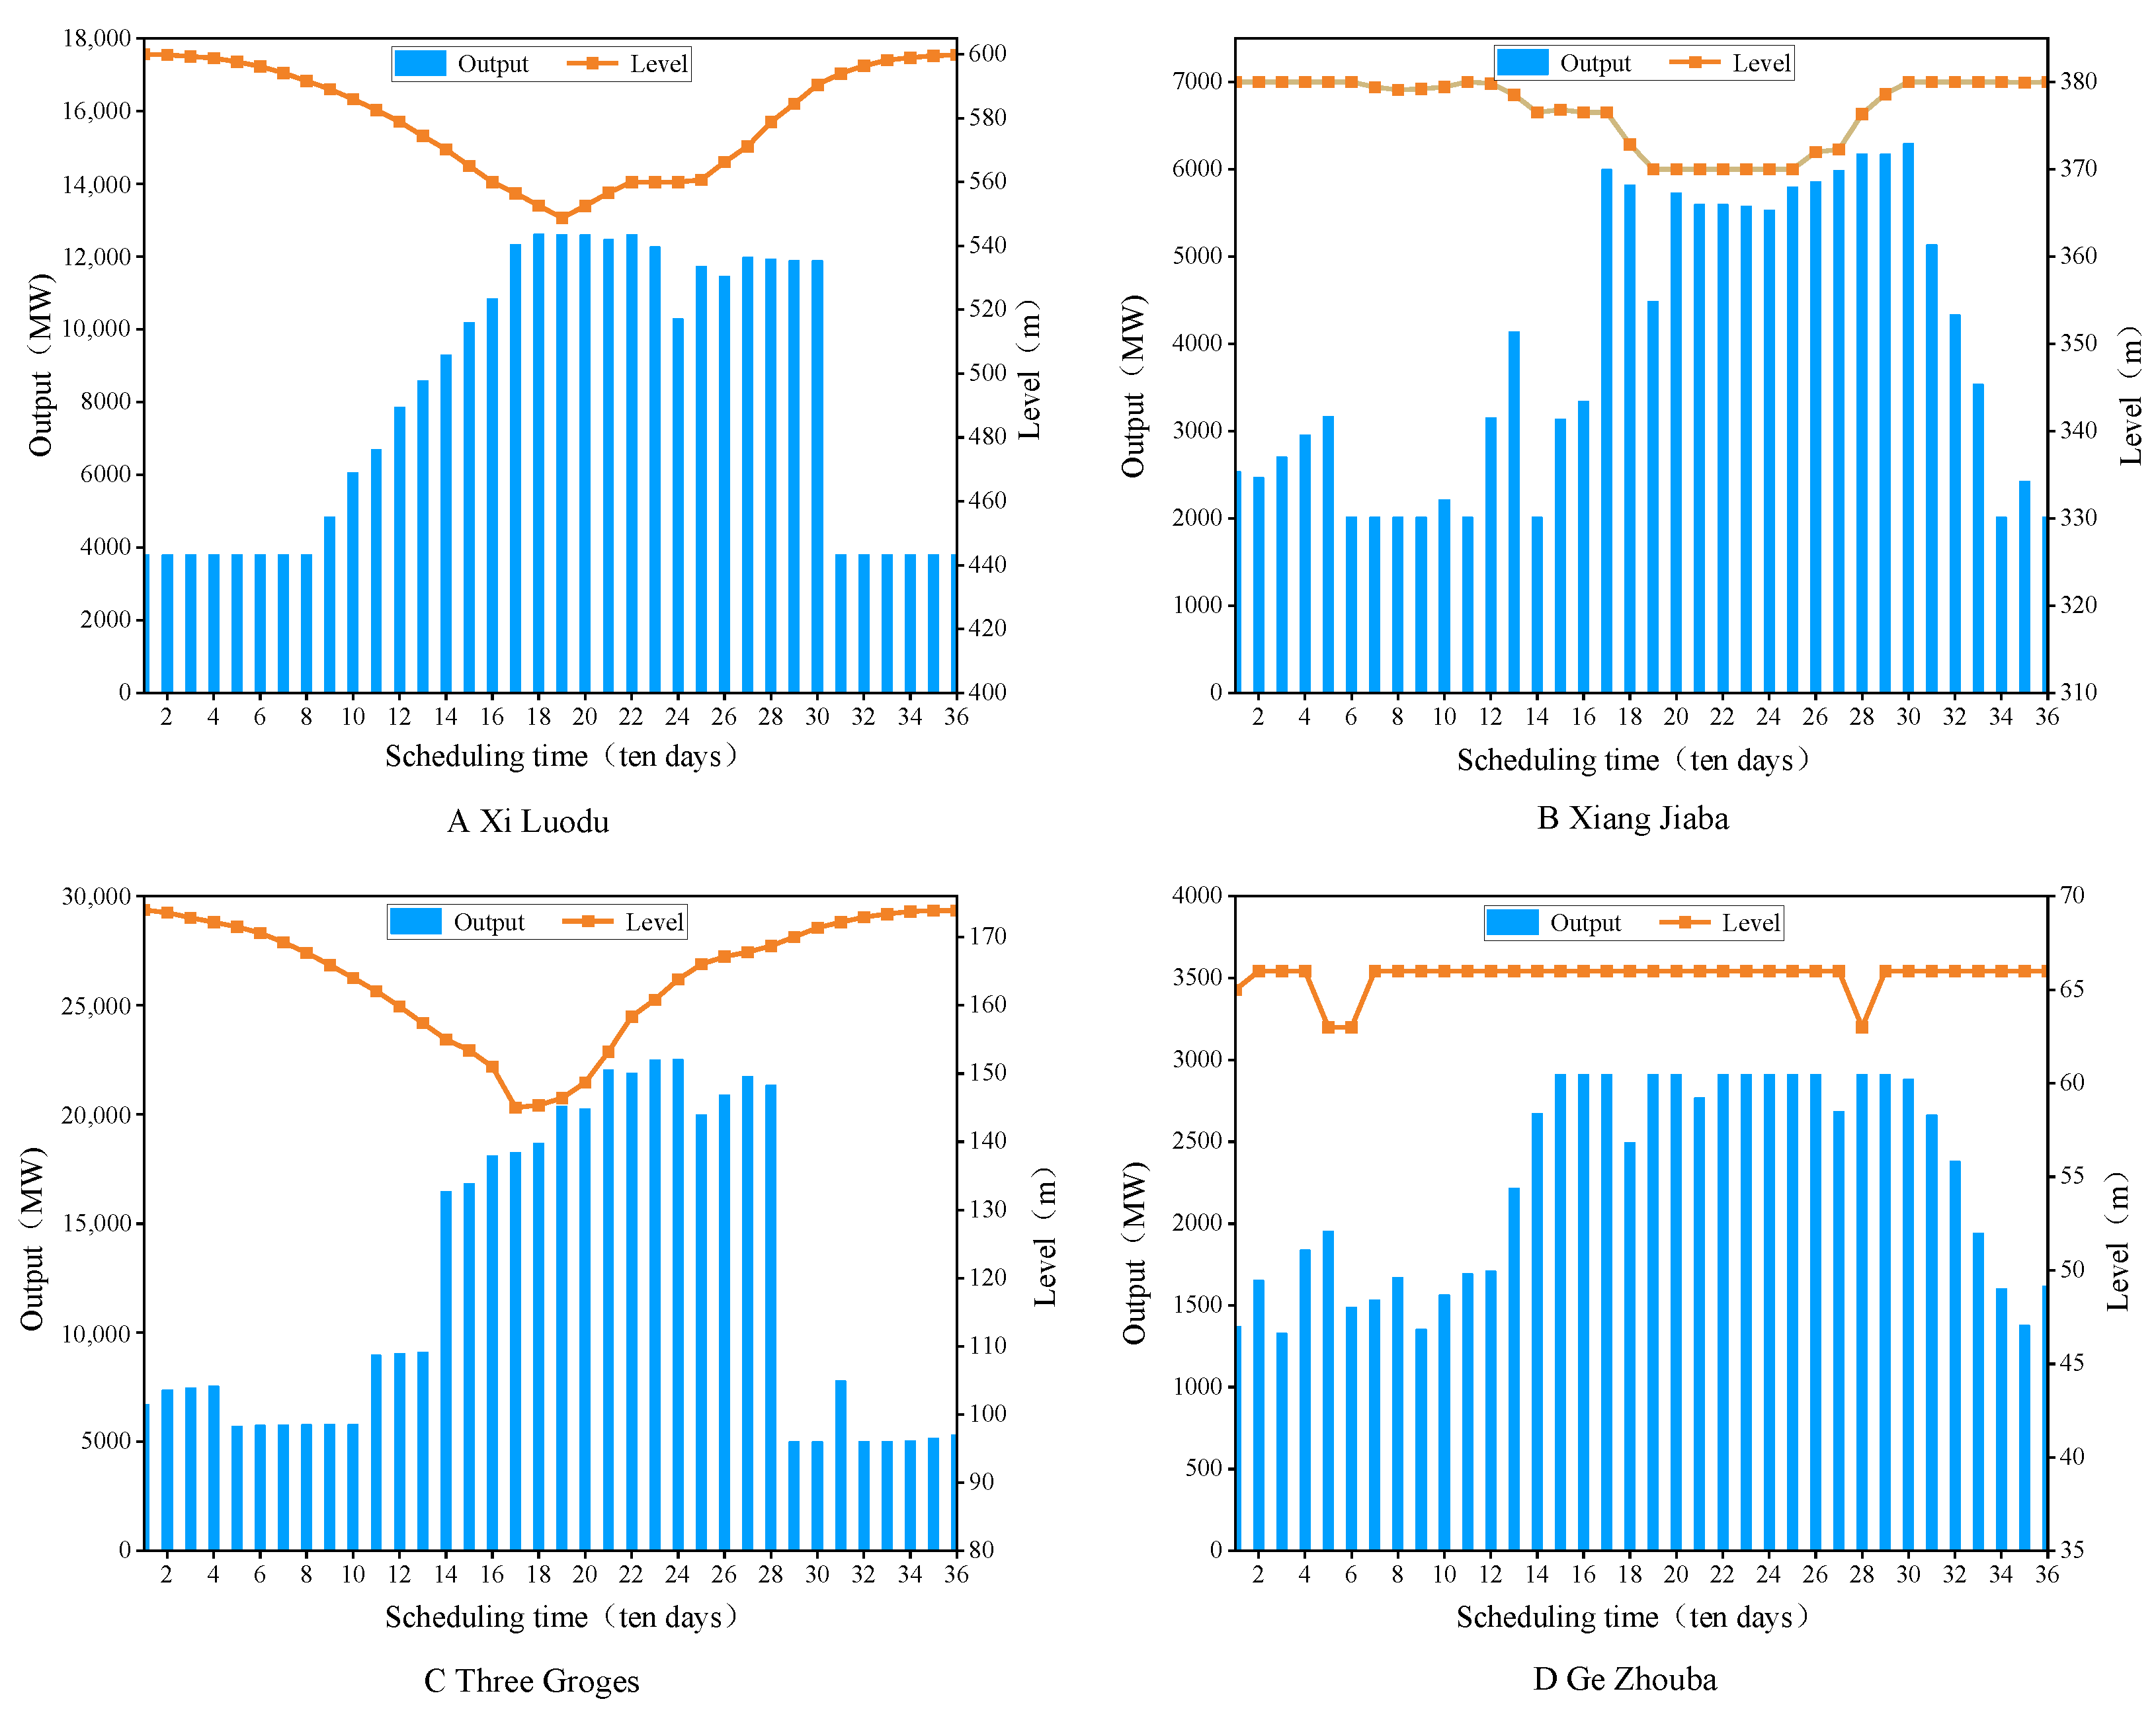
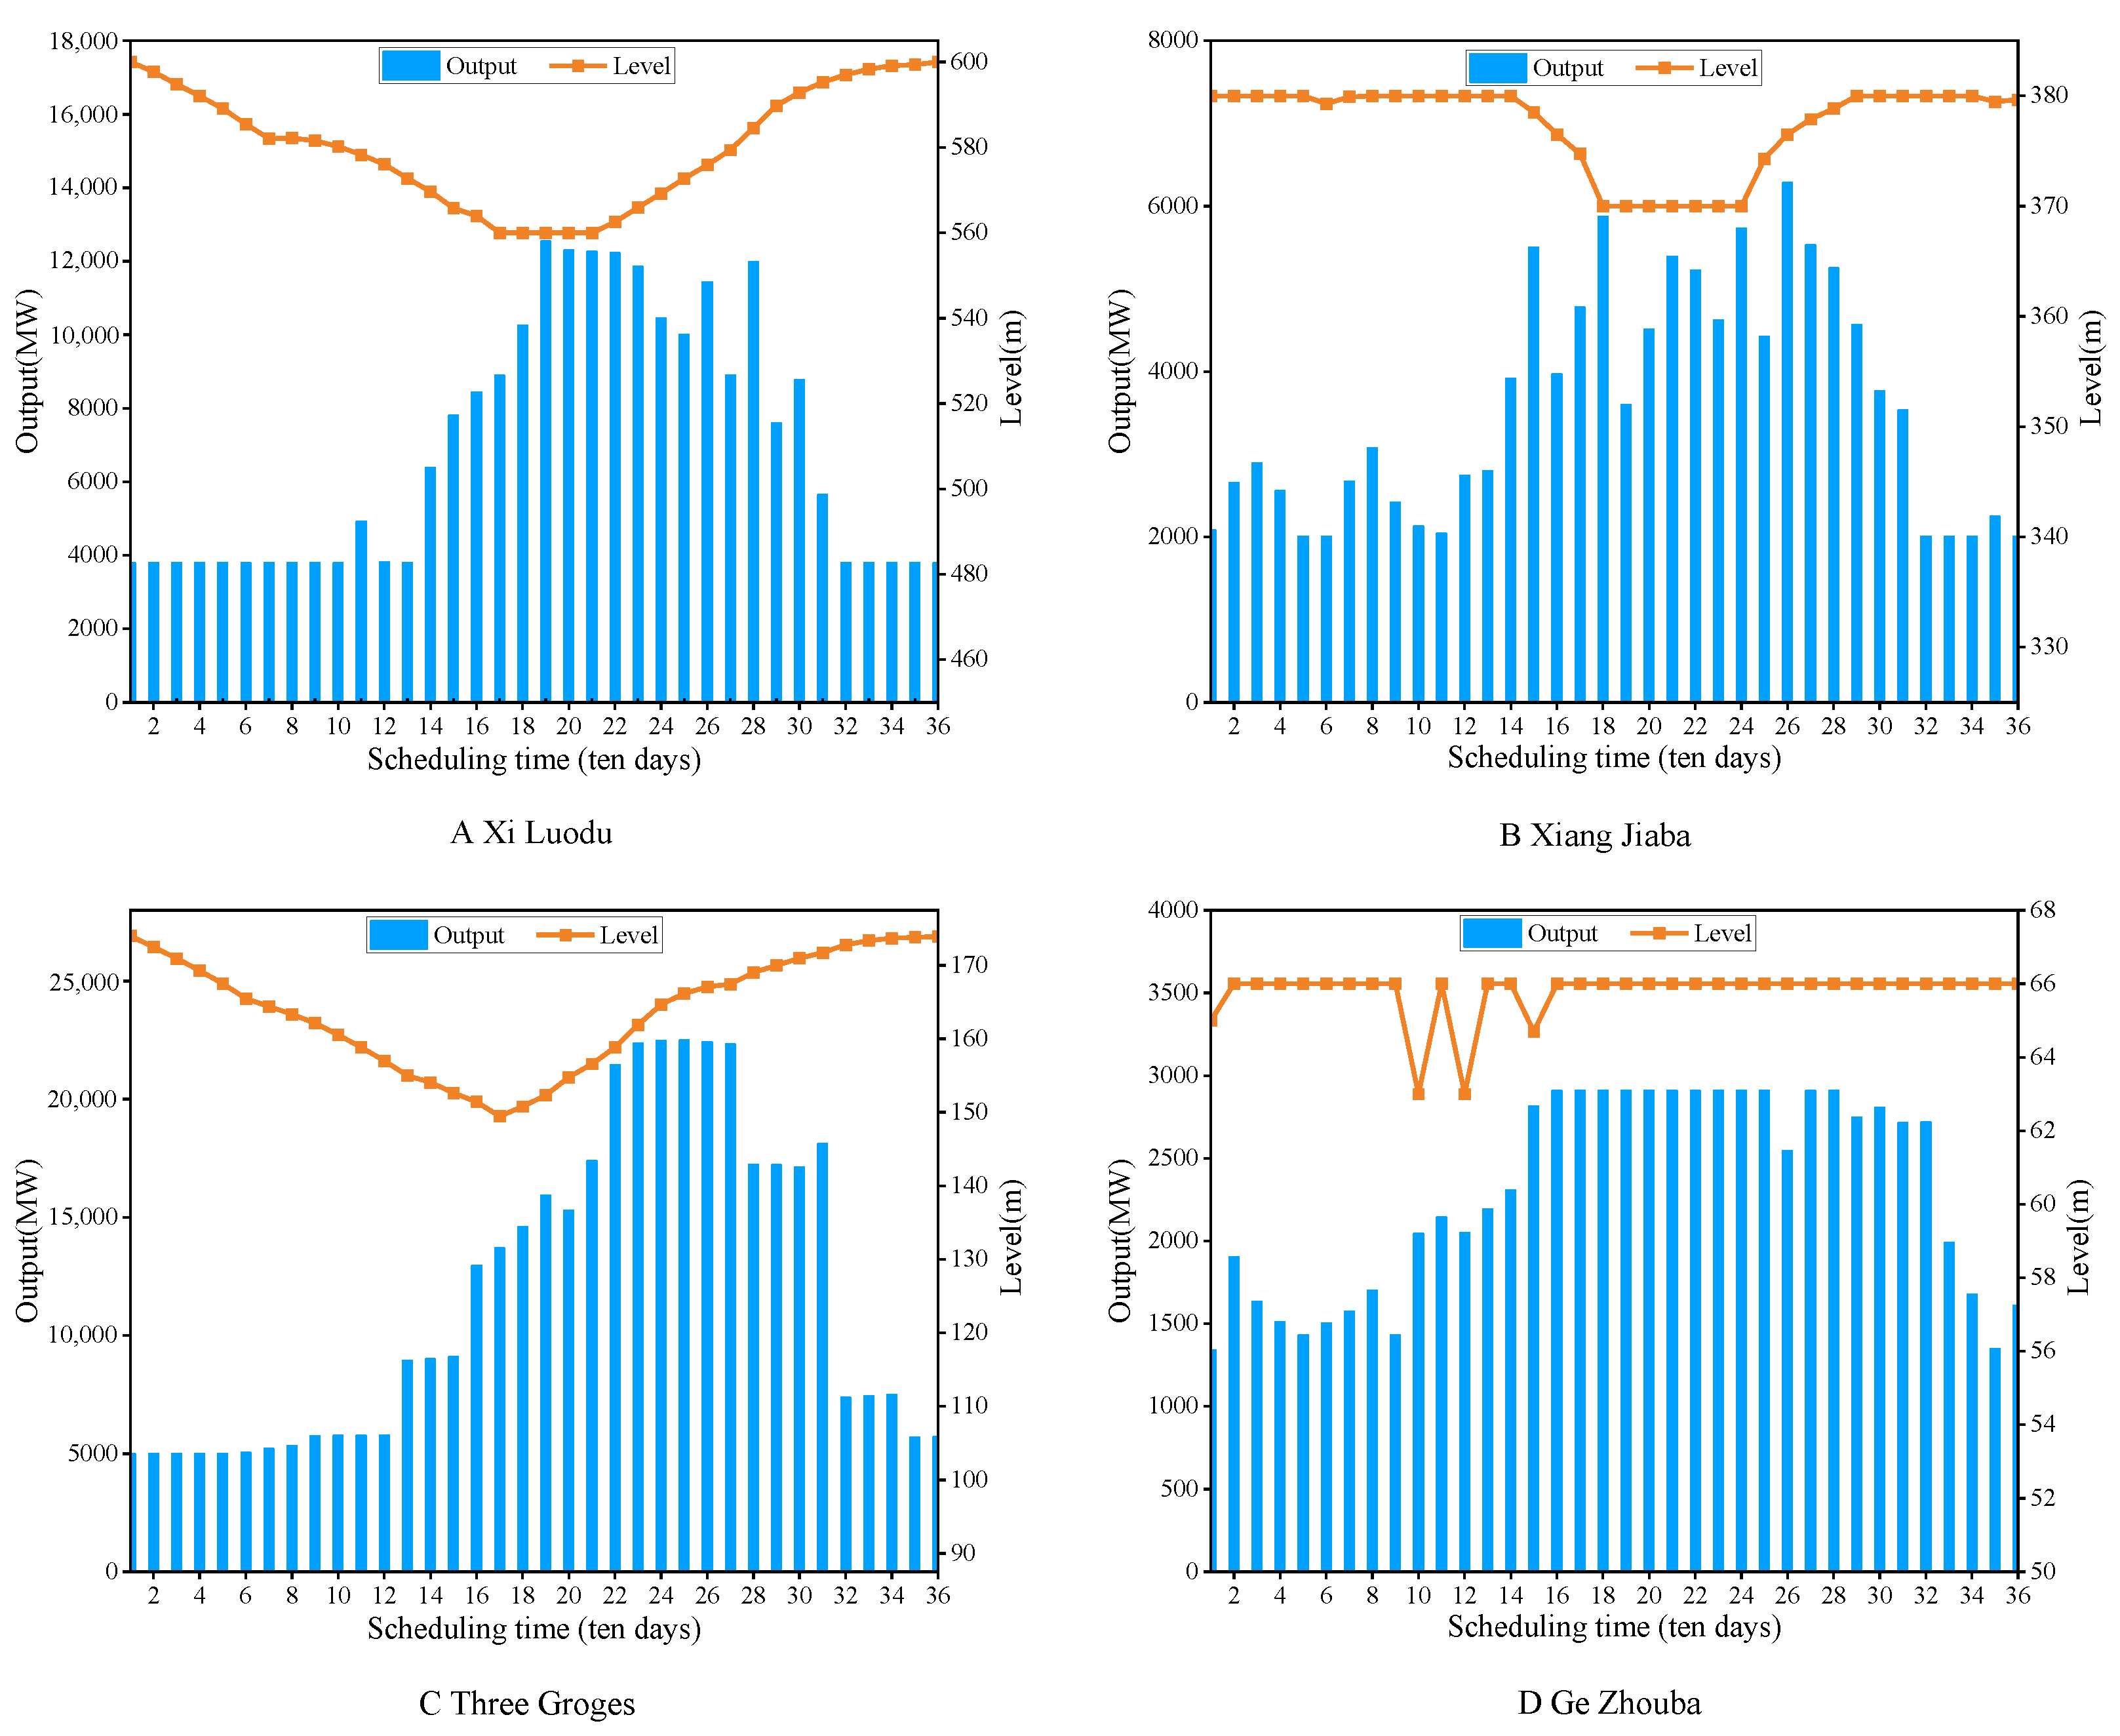
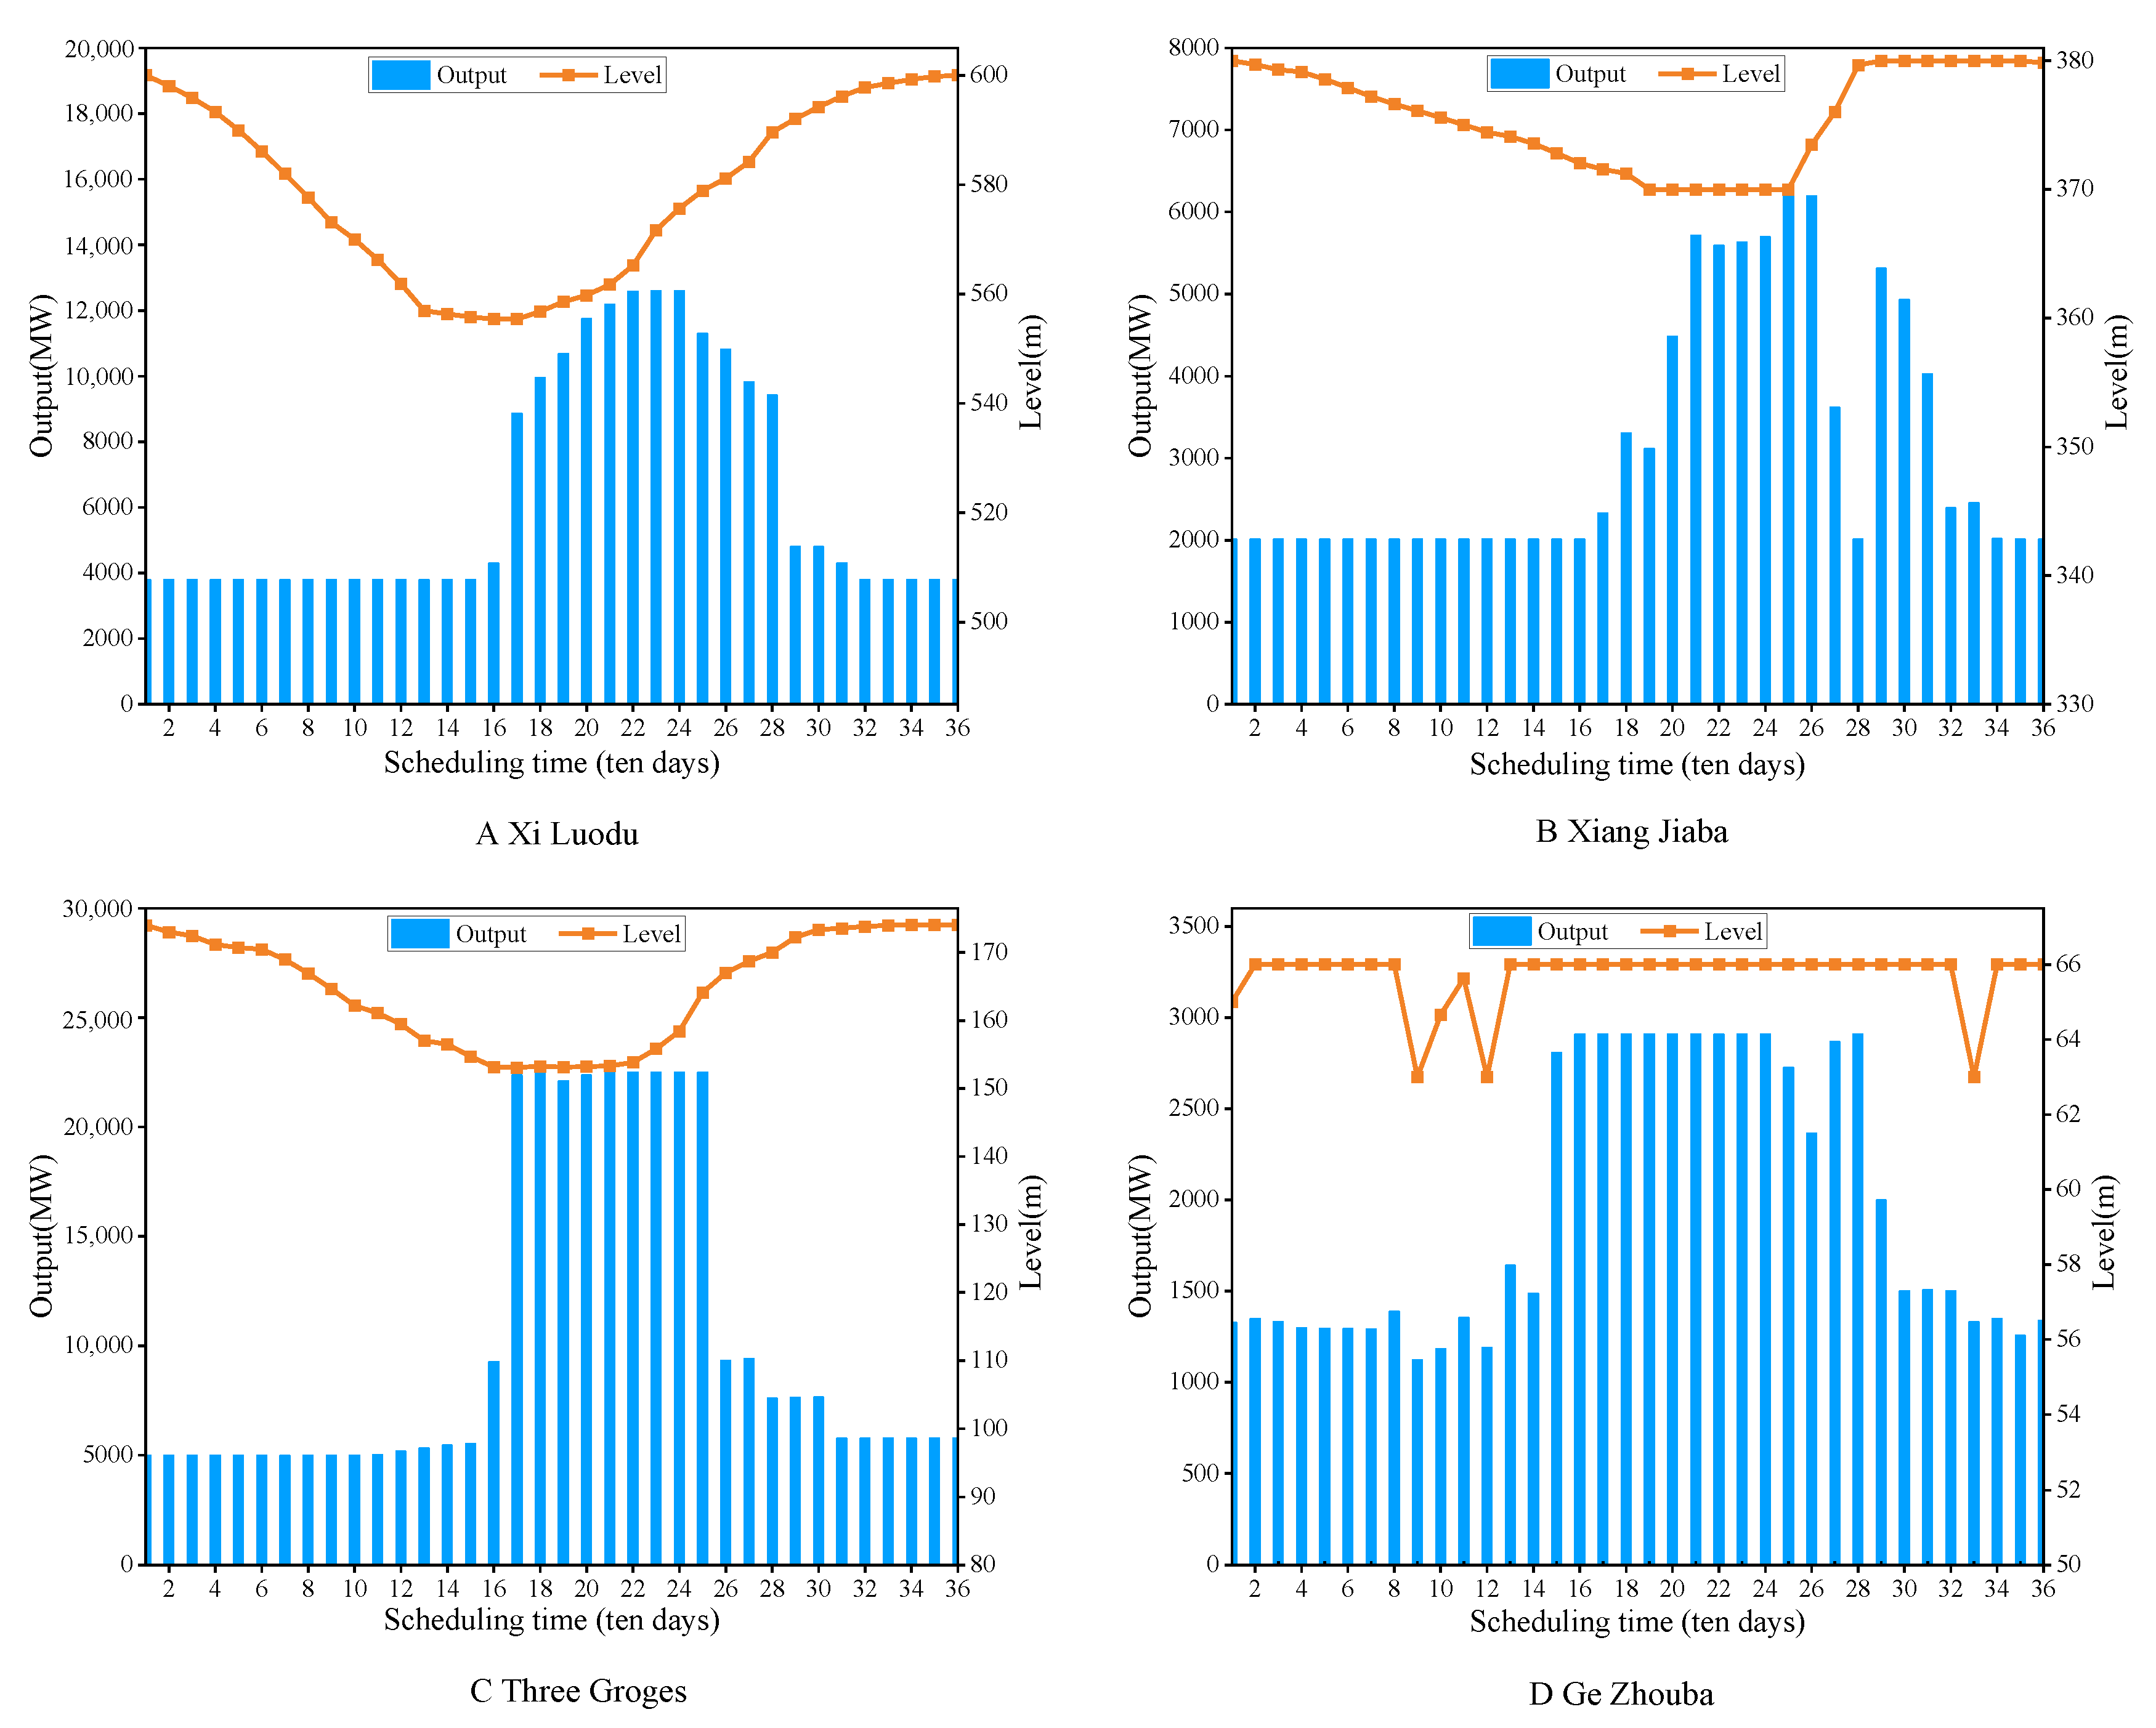
Figure 15, Figure 16 and Figure 17 depict the water level–output process of four reservoirs in the lower reaches of the Jinsha River–Three Gorges cascade hydropower system in each typical runoff scenario. It can be observed that in the case of a rainy year, the overall production degree of cascade reservoirs is rather high due to there being sufficient water resources. In the scenario of a dry year, the peak output of each hydropower station is from mid- and late June to the end of September, and the remainder of the period essentially ensures operation with the guaranteed output, with significant differences in performance between the two flood and drought years. In conjunction with the three runoff scenarios, it can be observed that the hydropower station produces less electricity in the early phase of dispatching, and the water level drops to its lowest point in mid- to late June. The production in the later period also increases, and the water level necessarily increases to almost normal water storage level from the end of October to the beginning of November. Figure 18 shows the power generation process of the lower reaches of the Jinsha River–Three Gorges cascade hydropower system under different runoff scenarios. It can be observed that the power generation process of four hydropower stations is consistent with the output process, with increased power generation during the flood period and decreased power generation during the nonflood period, and the power generation capacity of the reservoir in the nonflood period is also higher than that of other runoff scenarios under the influence of inflow in the wet year. In addition, the power generation trend of Xiluodu and Xiangjiaba is relatively close, and the power generation trend of Three Gorges and Gezhouba is relatively similar, which is caused by the different inflow situations in different regions. The modification process of the above study indicates that the output and power generation level of different reservoirs are limited by their own capacities, and the output and power generation level also change under different runoff conditions, but the overall trend and water level change are consistent with the scheduled regulations of the hydropower system in the river basin.

6. Conclusions

In this study, an integrated multistrategy particle swarm algorithm (IMPSO) is developed, and a joint explicit–implicit coupled constraint handling technique is applied to build a mathematical model of joint power generation scheduling to maximize the total power generation of a cascade hydropower station, and the operating water level, output capacity, outgoing flow, and generation flow are used as constraints. Using the example of four reservoirs in the lower reaches of the Jinsha River—Three Gorges cascade hydropower system, the model was solved by applying IMPSO+CHT, IMPSO, SAPSO, LFPSO, PSO, and DE methods according to three runoff scenarios. By carrying out the statistical analysis of the optimization results, the following conclusions are drawn.
(1)
Using beta distribution initialization to generate candidate solutions and adaptive nonlinear variation of the speed update-related parameters improves the proposed algorithm’s population diversity, resulting in faster convergence to the global optimal solution than the comparison schemes. Meanwhile, introducing the Lévy flight mechanism and variable helix search strategy, the optimization search is performed in a diverse exploration manner, which effectively enhances the local exploration capability and global exploitation capability of the algorithm.
(2)
The combined statistic results in Table 2 and Table 3 and Figure 9, Figure 10 and Figure 11 show that using the IMPSO algorithm in reservoir power generation scheduling engineering can achieve more robust and accurate results, increased population diversity, and algorithmic exploration than the comparison algorithms. Meanwhile, the IMPSO method combined with the explicit–implicit coupled constraint processing technique achieves superior results but falls short in terms of population variety when compared with the IMPSO scheme.
(3)
The combined results in Table 4 and Figure 12, Figure 13 and Figure 14 show that both IMPSO scenarios outperform the comparison scenario under various runoff situations, allowing for a more efficient use of and increased water energy utilization.
(4)
The water level and treatment results from Figure 15, Figure 16 and Figure 17 obtained using the IMPSO+CHT method can not only meet the boundary conditions of cascade hydropower reservoirs, but also make better use of the abundant water resources in the catchment area and take full advantage of the regulatory and balancing functions of cascade reservoirs; moreover, these results produce a more efficient and reasonable regulation process for the operations.
In three typical runoff scenarios, IMPSO+CHT and IMPSO are superior to the other algorithms and have absolute benefits. The IMPSO algorithm can lead to more robust benefits in power generation when a new constraint processing approach is introduced, demonstrating the advantages of the suggested method in terms of solution capacity and engineering application. Despite the fact that the optimization approach proposed in this study enhances the utilization share of hydropower resources, there are certain issues. It should be noted that the proposed method has advantages in terms of optimization capability and performance, and it can meet the operational demands of hydropower systems. However, its structure is relatively complex, and the consideration of ecological river flow restriction is required in order to satisfy the coordinated operation of basin ecology and power generation demand. Therefore, future research can concentrate on the following aspects: (1) the performance of the algorithm—developing more efficient strategies can reduce the structural complexity and improve the robustness [27] and experimental accuracy of the algorithm while optimizing its goal and taking into account learning and comparison with more advanced algorithms [45,46]; (2) model construction—carrying out model construction according to actual demands and considering the multiple constraints in order to achieve the further integration of theoretical research and practical production.

Author Contributions

Conceptualization, Y.L.; methodology, Y.L.; software, Y.L.; validation, L.M. and Y.Y.; data curation, L.M.; writing—original draft preparation, Y.L.; writing—review and editing, Y.T.; visualization, Y.T.; supervision, L.M. and Y.Y; funding acquisition, L.M. and Y.Y. All authors have read and agreed to the published version of the manuscript.

Funding

This research was funded by the National Natural Science Foundation of China (Grant No. 51979114) and the Open Research Fund of Hubei Key Laboratory of Intelligent Yangtze and Hydroelectric Science (Grant No. 242202000913).

Data Availability Statement

Not applicable.

Acknowledgments

Special thanks are given to the anonymous reviewers and editors for their constructive comments.

Conflicts of Interest

The authors declare no conflict of interest.

References

  1. Sun, L.; Niu, D.; Wang, K.; Xu, X. Sustainable development pathways of hydropower in China: Interdisciplinary qualitative analysis and scenario-based system dynamics quantitative modeling. J. Clean. Prod. 2020, 287, 125528. [Google Scholar] [CrossRef]
  2. Li, X.-Z.; Chen, Z.-J.; Fan, X.-C.; Cheng, Z.-J. Hydropower development situation and prospects in China. Renew. Sustain. Energy Rev. 2018, 82, 232–239. [Google Scholar] [CrossRef]
  3. Xie, Y.; Liu, S.; Fang, H.; Ding, M.; Wang, J. Three-Parameter Regulation Rules for the Long-Term Optimal Scheduling of Multiyear Regulating Storage Reservoirs. Water 2021, 13, 3593. [Google Scholar] [CrossRef]
  4. Jiang, Z.; Qin, H.; Wu, W.; Qiao, Y. Studying Operation Rules of Cascade Reservoirs Based on Multi-Dimensional Dynamics Programming. Water 2018, 10, 20. [Google Scholar] [CrossRef] [Green Version]
  5. Chang, J.; Wang, X.; Li, Y.; Wang, Y.; Zhang, H. Hydropower plant operation rules optimization response to climate change. Energy 2018, 160, 886–897. [Google Scholar] [CrossRef]
  6. Suwal, N.; Huang, X.; Kuriqi, A.; Chen, Y.; Pandey, K.P.; Bhattarai, K.P. Optimisation of cascade reservoir operation considering environmental flows for different environmental management classes. Renew. Energy 2020, 158, 453–464. [Google Scholar] [CrossRef]
  7. Guo, Y.; Ming, B.; Huang, Q.; Wang, Y.; Zheng, X.; Zhang, W. Risk-averse day-ahead generation scheduling of hydro–wind–photovoltaic complementary systems considering the steady requirement of power delivery. Appl. Energy 2022, 309, 118467. [Google Scholar] [CrossRef]
  8. Qiu, H.; Chen, L.; Zhou, J.; He, Z.; Zhang, H. Risk analysis of water supply-hydropower generation-environment nexus in the cascade reservoir operation. J. Clean. Prod. 2021, 283, 124239. [Google Scholar] [CrossRef]
  9. Liu, B.; Yao, K.; Wang, F.; Chi, X.; Gong, Y. Benefit Sharing in Hydropower Development: A Model Using Game Theory and Cost–Benefit Analysis. Water 2022, 14, 1208. [Google Scholar] [CrossRef]
  10. Ren, Y.; Yao, X.; Liu, D.; Qiao, R.; Zhang, L.; Zhang, K.; Jin, K.; Li, H.; Ran, Y.; Li, F. Optimal design of hydro-wind-PV multi-energy complementary systems considering smooth power output. Sustain. Energy Technol. Assess. 2022, 50, 101832. [Google Scholar] [CrossRef]
  11. Nazari-Heris, M.; Mohammadi-Ivatloo, B.; Gharehpetian, G.B. Short-term scheduling of hydro-based power plants considering application of heuristic algorithms: A comprehensive review. Renew. Sustain. Energy Rev. 2017, 74, 116–129. [Google Scholar] [CrossRef]
  12. He, S.; Guo, S.; Chen, K.; Deng, L.; Liao, Z.; Xiong, F.; Yin, J. Optimal impoundment operation for cascade reservoirs coupling parallel dynamic programming with importance sampling and successive approximation. Adv. Water Resour. 2019, 131, 103375. [Google Scholar] [CrossRef]
  13. Zhou, B.; Feng, S.; Xu, Z.; Jiang, Y.; Wang, Y.; Chen, K.; Wang, J. A Monthly Hydropower Scheduling Model of Cascaded Reservoirs with the Zoutendijk Method. Water 2022, 14, 3978. [Google Scholar] [CrossRef]
  14. Needham, J.T.; Watkins, D.W.; Lund, J.R.; Nanda, S.K. Linear Programming for Flood Control in the Iowa and Des Moines Rivers. J. Water Resour. Plan. Manag. Am. Soc. Civ. Eng. 2000, 126, 118–127. [Google Scholar] [CrossRef] [Green Version]
  15. Barros, M.T.L.; Tsai, F.T.-C.; Yang, S.-L.; Lopes, J.E.G.; Yeh, W.W.-G. Optimization of Large-Scale Hydropower System Operations. J. Water Resour. Plan. Manag. Am. Soc. Civ. Eng. 2003, 129, 178–188. [Google Scholar] [CrossRef]
  16. Dogan, M.S.; Lund, J.R.; Medellin-Azuara, J. Hybrid Linear and Nonlinear Programming Model for Hydropower Reservoir Optimization. J. Water Resour. Plan. Manag. 2021, 147, 06021001. [Google Scholar] [CrossRef]
  17. Van Dau, Q.; Kangrang, A.; Kuntiyawichai, K. Probability-Based Rule Curves for Multi-Purpose Reservoir System in the Seine River Basin, France. Water 2023, 15, 1732. [Google Scholar] [CrossRef]
  18. Hjelmeland, M.N.; Zou, J.; Helseth, A.; Ahmed, S. Nonconvex Medium-Term Hydropower Scheduling by Stochastic Dual Dynamic Integer Programming. IEEE Trans. Sustain. Energy 2018, 10, 481–490. [Google Scholar] [CrossRef] [Green Version]
  19. Agushaka, J.O.; Ezugwu, A.E. Initialisation Approaches for Population-Based Metaheuristic Algorithms: A Comprehensive Review. Appl. Sci. 2022, 12, 896. [Google Scholar] [CrossRef]
  20. Lai, V.; Huang, Y.F.; Koo, C.H.; Ahmed, A.N.; El-Shafie, A. A Review of Reservoir Operation Optimisations: From Traditional Models to Metaheuristic Algorithms. Arch. Comput. Methods Eng. 2022, 29, 3435–3457. [Google Scholar] [CrossRef]
  21. Azad, A.S.; Rahaman, S.A.; Watada, J.; Vasant, P.; Vintaned, J.A.G. Optimization of the hydropower energy generation using Meta-Heuristic approaches: A review. Energy Rep. 2020, 6, 2230–2248. [Google Scholar] [CrossRef]
  22. Thaeer Hammid, A.; Awad, O.I.; Sulaiman, M.H.; Gunasekaran, S.S.; Mostafa, S.A.; Manoj Kumar, N.; Khalaf, B.A.; Al-Jawhar, Y.A.; Abdulhasan, R.A. A Review of Optimization Algorithms in Solving Hydro Generation Scheduling Problems. Energies 2020, 13, 2787. [Google Scholar] [CrossRef]
  23. He, Z.; Zhou, J.; Xie, M.; Jia, B.; Bao, Z.; Qin, H.; Zhang, H. Study on guaranteed output constraints in the long term joint optimal scheduling for the hydropower station group. Energy 2019, 185, 1210–1224. [Google Scholar] [CrossRef]
  24. Mao, J.-Q.; Tian, M.-M.; Hu, T.-F.; Ji, K.; Dai, L.-Q.; Dai, H.-C. Shuffled complex evolution coupled with stochastic ranking for reservoir scheduling problems. Water Sci. Eng. 2019, 12, 307–318. [Google Scholar] [CrossRef]
  25. Hu, H.; Yang, K.; Su, L.; Yang, Z. A Novel Adaptive Multi-Objective Particle Swarm Optimization Based on Decomposition and Dominance for Long-term Generation Scheduling of Cascade Hydropower System. Water Resour. Manag. 2019, 33, 4007–4026. [Google Scholar] [CrossRef]
  26. Wang, C.; Zhou, J.; Lu, P.; Yuan, L. Long-term scheduling of large cascade hydropower stations in Jinsha River, China. Energy Convers. Manag. 2015, 90, 476–487. [Google Scholar] [CrossRef]
  27. Baldo, A.; Boffa, M.; Cascioli, L.; Fadda, E.; Lanza, C.; Ravera, A. The polynomial robust knapsack problem. Eur. J. Oper. Res. 2022, 305, 1424–1434. [Google Scholar] [CrossRef]
  28. Lu, Y.; Liang, M.; Ye, Z.; Cao, L. Improved particle swarm optimization algorithm and its application in text feature selection. Appl. Soft Comput. 2015, 35, 629–636. [Google Scholar] [CrossRef]
  29. Liu, D.; Xiao, Z.; Li, H.; Hu, X.; Malik, O. Accurate Parameter Estimation of a Hydro-Turbine Regulation System Using Adaptive Fuzzy Particle Swarm Optimization. Energies 2019, 12, 3903. [Google Scholar] [CrossRef] [Green Version]
  30. Cao, Y.; Pan, H. Energy-Efficient Cooperative Spectrum Sensing Strategy for Cognitive Wireless Sensor Networks Based on Particle Swarm Optimization. IEEE Access 2020, 8, 214707–214715. [Google Scholar] [CrossRef]
  31. Dahmani, S.; Yebdri, D. Hybrid Algorithm of Particle Swarm Optimization and Grey Wolf Optimizer for Reservoir Operation Management. Water Resour. Manag. 2020, 34, 4545–4560. [Google Scholar] [CrossRef]
  32. Shi, Y.H.; Eberhart, R. A modified particle swarm optimizer. In Proceedings of the IEEE World Congress on Computational Intelligence, 1998 IEEE International Conference on Evolutionary Computation Proceedings, Anchorage, AK, USA, 4–9 May 1998; pp. 69–73. [Google Scholar] [CrossRef]
  33. Yang, X.-S.; Deb, S.; Zhao, Y.-X.; Fong, S.; He, X. Swarm intelligence: Past, present and future. Soft Comput. 2018, 22, 5923–5933. [Google Scholar] [CrossRef] [Green Version]
  34. Agushaka, J.O.; Ezugwu, A.E. Evaluation of several initialization methods on arithmetic optimization algorithm performance. J. Intell. Syst. 2022, 31, 70–94. [Google Scholar] [CrossRef]
  35. Li, Q.; Liu, S.-Y.; Yang, X.-S. Influence of initialization on the performance of metaheuristic optimizers. Appl. Soft Comput. 2020, 91, 106193. [Google Scholar] [CrossRef] [Green Version]
  36. Rauf, H.T.; Shoaib, U.; Lali, M.I.; Alhaisoni, M.; Irfan, M.N.; Khan, M.A. Particle Swarm Optimization with Probability Sequence for Global Optimization. IEEE Access 2020, 8, 110535–110549. [Google Scholar] [CrossRef]
  37. Li, J.; An, Q.; Lei, H.; Deng, Q.; Wang, G.-G. Survey of Lévy Flight-Based Metaheuristics for Optimization. Mathematics 2022, 10, 2785. [Google Scholar] [CrossRef]
  38. Liu, L.; Bai, K.; Dan, Z.; Zhang, S.; Liu, Z. Whale Optimization Algorithm with Global Search Strategy. J. Chin. Comput. Syst. 2020, 41, 1820–1825. Available online: https://scholar.google.com/scholar_lookup?title=Whale+Optimization+Algorithm+with+Global+Search+Strategy&author=Liu,+L.&author=Bai,+K.&author=Dan,+Z.&author=Zhang,+S.&author=Liu,+Z.&publication_year=2020&journal=J.+Chin.+Comput.+Syst.&volume=41&pages=1820%E2%80%931825 (accessed on 4 September 2020).
  39. Zhang, C.; Lin, Q.; Gao, L.; Li, X. Backtracking Search Algorithm with three constraint handling methods for constrained optimization problems. Expert Syst. Appl. 2015, 42, 7831–7845. [Google Scholar] [CrossRef]
  40. Li, Z.; Chen, S.; Zhang, S.; Jiang, S.; Gu, Y.; Nouioua, M. FSB-EA: Fuzzy search bias guided constraint handling technique for evolutionary algorithm. Expert Syst. Appl. 2019, 119, 20–35. [Google Scholar] [CrossRef]
  41. Gandomi, A.H.; Deb, K. Implicit constraints handling for efficient search of feasible solutions. Comput. Methods Appl. Mech. Eng. 2020, 363, 112917. [Google Scholar] [CrossRef]
  42. Harrison, K.R.; Engelbrecht, A.P.; Ombuki-Berman, B.M. Self-adaptive particle swarm optimization: A review and analysis of convergence. Swarm Intell. 2018, 12, 187–226. [Google Scholar] [CrossRef] [Green Version]
  43. Haklı, H.; Uğuz, H. A novel particle swarm optimization algorithm with Levy flight. Appl. Soft Comput. 2014, 23, 333–345. [Google Scholar] [CrossRef]
  44. Yan, Z.; Zhaobin, L.; Zhang, B. A Novel Differential Evolution Algorithm for Constrained Optimization. In Proceedings of the 2017 IEEE International Conference on Computational Science and Engineering (CSE) and IEEE International Conference on Embedded and Ubiquitous Computing (EUC), Guangzhou, China, 21–24 July 2017. [Google Scholar] [CrossRef]
  45. Zamani, H.; Nadimi-Shahraki, M.H.; Gandomi, A.H. QANA: Quantum-based avian navigation optimizer algorithm. Eng. Appl. Artif. Intell. 2021, 104, 104314. [Google Scholar] [CrossRef]
  46. Zamani, H.; Nadimi-Shahraki, M.H.; Gandomi, A.H. Starling murmuration optimizer: A novel bio-inspired algorithm for global and engineering optimization. Comput. Methods Appl. Mech. Eng. 2022, 392, 114616. [Google Scholar] [CrossRef]
Figure 1. Flowchart of the PSO algorithm.
Water 15 02593 g001
Figure 2. The structure of the different beta distributions.
Water 15 02593 g002
Figure 3. The nonlinear trend of parameters.
Water 15 02593 g003
Figure 4. The Lévy flight mechanism and adaptive variable spiral policy of the IMPSO algorithm illustrated. Lévy flight trajectory is shown, where the different colored lines represent the direction and distance of each flight movement.
Water 15 02593 g004
Figure 5. Flowchart of the IMPSO algorithm.
Water 15 02593 g005
Figure 6. Topology map of the reservoir group in the lower reaches of the Jinsha River–Three Gorges basin.
Water 15 02593 g006
Figure 7. Graphical representation of decision variables (water level). Each color line is an upper and lower limit of a constraint corresponding to the water level, respectively. The solid gray line represents the water level range under the water level variation constraint; the red dashed line represents the water level range under the outflow constraint; the green dashed line represents the water level range under the outflow constraint; and the blue shaded area is the final water level feasible range. In addition, the yellow shaded area is the feasible solution that exists outside the feasible range, and the arrows represent the search agent jumping out of the feasible range to find the feasible solution.
Water 15 02593 g007
Figure 8. Flowchart of the procedure for solving the problem of the optimal operation strategy using the IMPSO algorithm.
Water 15 02593 g008
Figure 9. Box diagram of power generation operation in each typical runoff scenario.
Water 15 02593 g009
Figure 10. Convergence process of power generation operation in each typical runoff scenario.
Water 15 02593 g010
Figure 11. Population diversity analysis of six schemes in each typical runoff scenario.
Water 15 02593 g011
Figure 12. The hydrological process of reservoirs in the wet year.
Water 15 02593 g012
Figure 13. The hydrological process of reservoirs in the normal year.
Water 15 02593 g013
Figure 14. The hydrological process of reservoirs in the dry year.
Water 15 02593 g014
Figure 15. Water level–output process of reservoirs in the wet year.
Water 15 02593 g015
Figure 16. Water level–output process of reservoirs in the normal year.
Water 15 02593 g016
Figure 17. Water level–output process of reservoirs in the dry year.
Water 15 02593 g017
Figure 18. Power generation process of reservoirs in different runoff scenarios.
Water 15 02593 g018
Table 1. Main characteristic parameters of the lower reaches of Jinsha River–Three Gorges cascade reservoirs.
Reservoir FeatureXiluoduXiangjiabaThree GorgesGezhouba
Regulation performanceAnnuallySeasonallyAnnuallyDaily
Generation coefficient8.58.358.88.5
Normal water level (m)60038017566
Dead water level (m)54037014563
Guaranteed capacity (MW)3795200949901040
Installed capacity (MW)12,600640022,5002910
Minimum outflow (m3/s)1700170060005500
Table 2. Statistical results of 10 independent operations for each year.
Runoff ScenariosObjective Value (108 kW·h)
MethodsAverageMedianBestWorstStandard Deviation
Wet yearIMPSO+CHT2244.862244.412267.392224.8115.95
IMPSO2229.942240.862254.412173.1425.12
SAPSO1927.661941.312003.241839.8654.99
LFPSO1944.841933.592042.931867.8656.08
PSO1942.491963.762028.841845.5955.88
DE1942.351944.822001.021894.8534.07
Normal yearIMPSO+CHT2091.762091.572105.612075.348.59
IMPSO2086.252089.532101.462045.1216.08
SAPSO1847.681820.321987.331697.08103.22
LFPSO1899.351899.902015.221745.7590.79
PSO1830.971801.222023.521699.34102.77
DE1842.751846.891916.321781.7141.10
Dry yearIMPSO+CHT1859.841860.771864.861853.503.14
IMPSO1856.331859.991864.101840.607.91
SAPSO1706.791690.301860.611556.1383.64
LFPSO1766.921766.001875.461652.7464.51
PSO1717.391712.801859.581572.45100.16
DE1707.641722.541771.951626.0049.92
Table 3. Mean ranking results in different runoff scenarios using the Friedman test.
Runoff ScenariosMethods
IMPSO+CHTIMPSOSAPSOLFPSOPSODE
Wet year1.51.54.44.54.44.8
Normal year1.41.64.43.85.34.5
Dry year1.71.84.63.74.54.7
Mean rank1.53(1)1.63(2)4.67(4)4(3)4.73(5)4.67(4)
Table 4. Average abandoned water flow from 10 operations carried out each year (m3/s).
MethodsRunoff Scenarios
Wet YearNormal YearDry Year
IMPSO+CHT102,496.9458,496.0946,525.09
IMPSO10,9926.8058,995.8653,199.21
SAPSO150,642.8098,511.1969,218.02
LFPSO111,575.8594,364.4669,667.44
PSO155,965.26139,110.5369,218.02
DE159,466.37134,618.8871,089.28
Disclaimer/Publisher’s Note: The statements, opinions and data contained in all publications are solely those of the individual author(s) and contributor(s) and not of MDPI and/or the editor(s). MDPI and/or the editor(s) disclaim responsibility for any injury to people or property resulting from any ideas, methods, instructions or products referred to in the content.