Review

Application of Porous Concrete Infiltration Techniques to Street Stormwater Inlets That Simultaneously Mitigate against Non-Point Heavy Metal Pollution and Stormwater Runoff Reduction in Urban Areas: Catchment-Scale Evaluation of the Potential of Discrete and Small-Scale Techniques

Department of Agroenvironmental Sciences, Faculty of Food and Agricultural Sciences, Fukushima University, Fukushima 960-1296, Japan
Water 2023, 15(11), 1998; https://doi.org/10.3390/w15111998
Submission received: 3 April 2023 / Revised: 10 May 2023 / Accepted: 18 May 2023 / Published: 24 May 2023
(This article belongs to the Special Issue Urban Water-Related Problems)

Abstract

:
The expansion of pervious areas is an essential and common concept in mitigating non-point pollution runoff in urban areas. In this review, literature related to the expansion of pervious areas is introduced. In addition, the potential application of porous concrete as a medium for constructing the bottom and side walls of street stormwater inlets is investigated. The effectiveness of this medium in reducing (i) the stormwater runoff volume via porous concrete by exfiltrating from the bottom and the wall, and (ii) the heavy metal pollution runoff loads via infiltration through the porous concrete is assessed using data obtained by the author and published in the literature. The urban hydrological model Infoworks ICM (Innovyze) was used to estimate the exfiltration rates through the porous concrete plates set at the bottom and side walls of the street stormwater inlets. The exfiltration rates used in the pre-reported literature varied depending on the methods used. In the present study, sensitivity tests were performed by changing the exfiltration rates. The results of this study indicated that porous concrete used at only the bottom and side walls of the street stormwater inlets is suitable for reducing the runoff volume and removing any heavy metals from stormwater at a catchment scale.

1. Introduction

1.1. Overview and Review Objectives

The potential and realized effects of non-point sources of pollution originating from runoff from urban areas, such as stormwater drains adjacent to roadways, have received increased attention in recent years. Comprehensive reviews of state-of-art remediation techniques and their development have been reported [1,2]. The impacts of non-point sources of pollution have been demonstrated [3,4,5] and the runoff characteristics have been described [6,7]. Major non-point pollutants, including organic materials (chemical oxygen demand (COD), biochemical oxygen demand (BOD), total organic carbon (TOC)), nutrients (various forms of nitrogen and phosphorus), heavy metals, suspended solids, PAHs [8], microplastics [9,10,11], and water-soluble aerosols [12], have all been found in the runoff from urbanized areas and their surrounding areas. Of these pollutants, heavy metal pollutions from urbanized areas [13,14,15,16,17,18,19,20,21,22,23,24] are the primary focus of this review owing to its high toxicity [25,26,27,28,29]. In this review, studies on heavy metal pollution in road effluents [13,14,15] will be cited and the data therein will be compared to the author’s own data.
Since non-point pollutants, including heavy metals, in runoff water can be captured using infiltration techniques (or infiltration unit processes) [30,31,32,33,34,35], the author focused on the application of porous concrete in stormwater drainage systems. The aim of the study was the reduction of both non-point source heavy metals in runoff and surface runoff in urbanized areas. The author focused on the application of porous concrete plates set at the bottom [36,37,38,39,40] and sides of street stormwater inlets. The author intended to demonstrate that the placement of relatively small porous concrete plates at the bottom and sides of street stormwater inlets is sufficient to capture the heavy metals within the runoff and facilitate the efficient drainage of the stormwater itself in impermeable urban catchment areas. Specifically, the author examines the following points:
  • Heavy metal concentrations in urban road runoff.
  • Adsorption of heavy metals by porous concrete.
  • Estimating the amount of runoff that can be treated in stormwater drains fitted with porous concrete filters.

1.2. Features and Definitions of Non-Point Pollution Sources and the Countermeasures Required for Their Reduction in Runoff

The information provided on the homepage of the Japan Society for Water Environment (JSWE) and the US Environmental Protection Agency (EPA) is discussed in order to explore the similarities and differences in the approaches adopted by the two agencies to expand pervious areas and control non-point sources of pollution.
The JSWE (https://www.jswe.or.jp/eng/index.html (accessed on 10 May 2023)) has based its description of non-point sources of pollution in urban areas on the features of these sources and the actions that need to be implemented (http://jswe-nonpoint.com/1/documents.html (accessed on 10 May 2023)). The definitions employed by the EPA are based on basic information, such as “non-point vs. point sources” and “what we can do first, etc.”.
JSWE describes the actions that are required to remediate non-point pollution runoff by emphasizing the need to understand runoff behavior and develop pollution control measures.
The US EPA published a fact sheet entitled, “Protecting Water Quality from Urban Runoff” (https://nepis.epa.gov/Exe/ZyPDF.cgi/20004PP1.PDF?Dockey=20004PP1.PDF (accessed on 10 May 2023)), which shows “How Urbanized Areas Affect Water Quality” in terms of increasing runoff and pollutant loads. Of particular interest were the roles of porous and pervious areas in natural landscapes, such as forests, wetlands, and grasslands, at trapping rainwater and snowmelt and how they promote water filtration into the ground. The roles of pervious areas as countermeasures to non-point pollution, and the ways in which pervious areas can be expanded include the following [41]:
  • Infiltration practice
  • Infiltration basins
  • Infiltration trenches
  • Pervious or porous pavements
  • Vegetated open channel practices
  • Filtering practices
  • Detention ponds or vaults
  • Retention ponds
  • Wetlands
  • Other practices, including water quality inlets.
These could be included in the BMPs of water managers [42]. These infiltration measures are similar to those employed in the experimental sewer system (ESS) in Japan [43]. The system, which is described in [41], could be considered to include the whole catchment area, while the porous concrete plates at the bottoms and sides of the street stormwater inlets could be considered as small discrete points.

2. Runoff Behavior from Non-Point Sources in Urban Areas

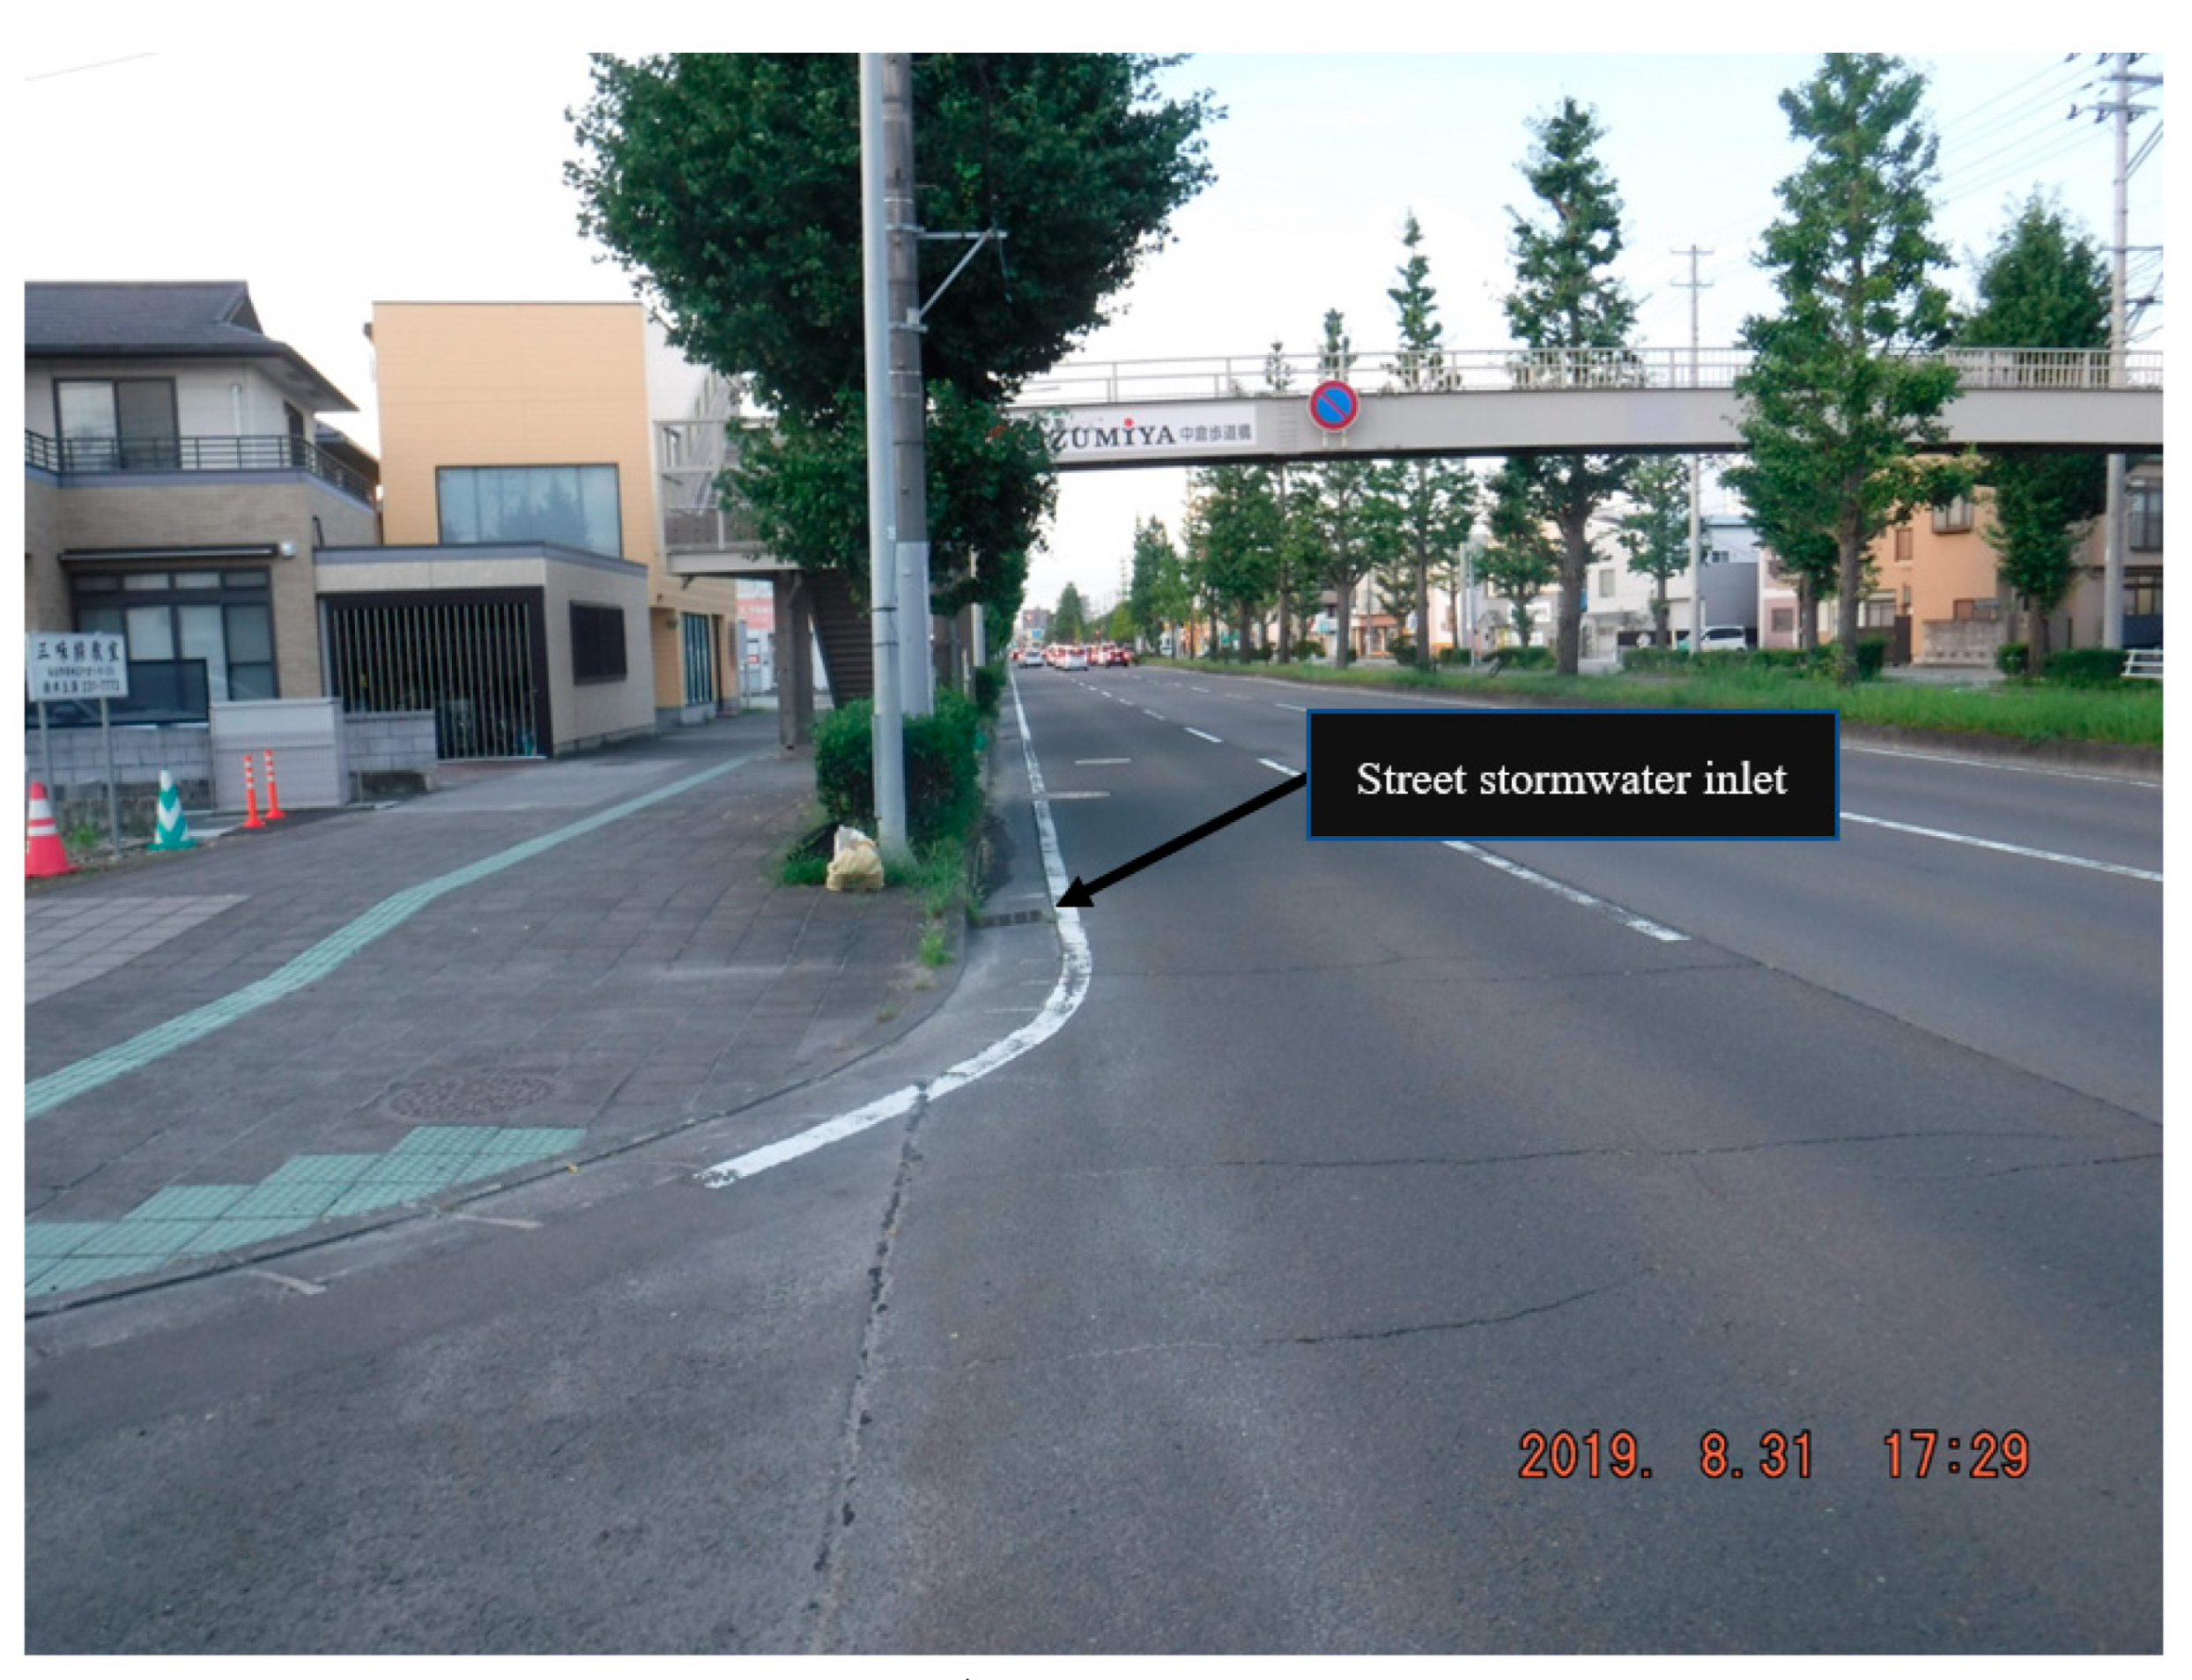
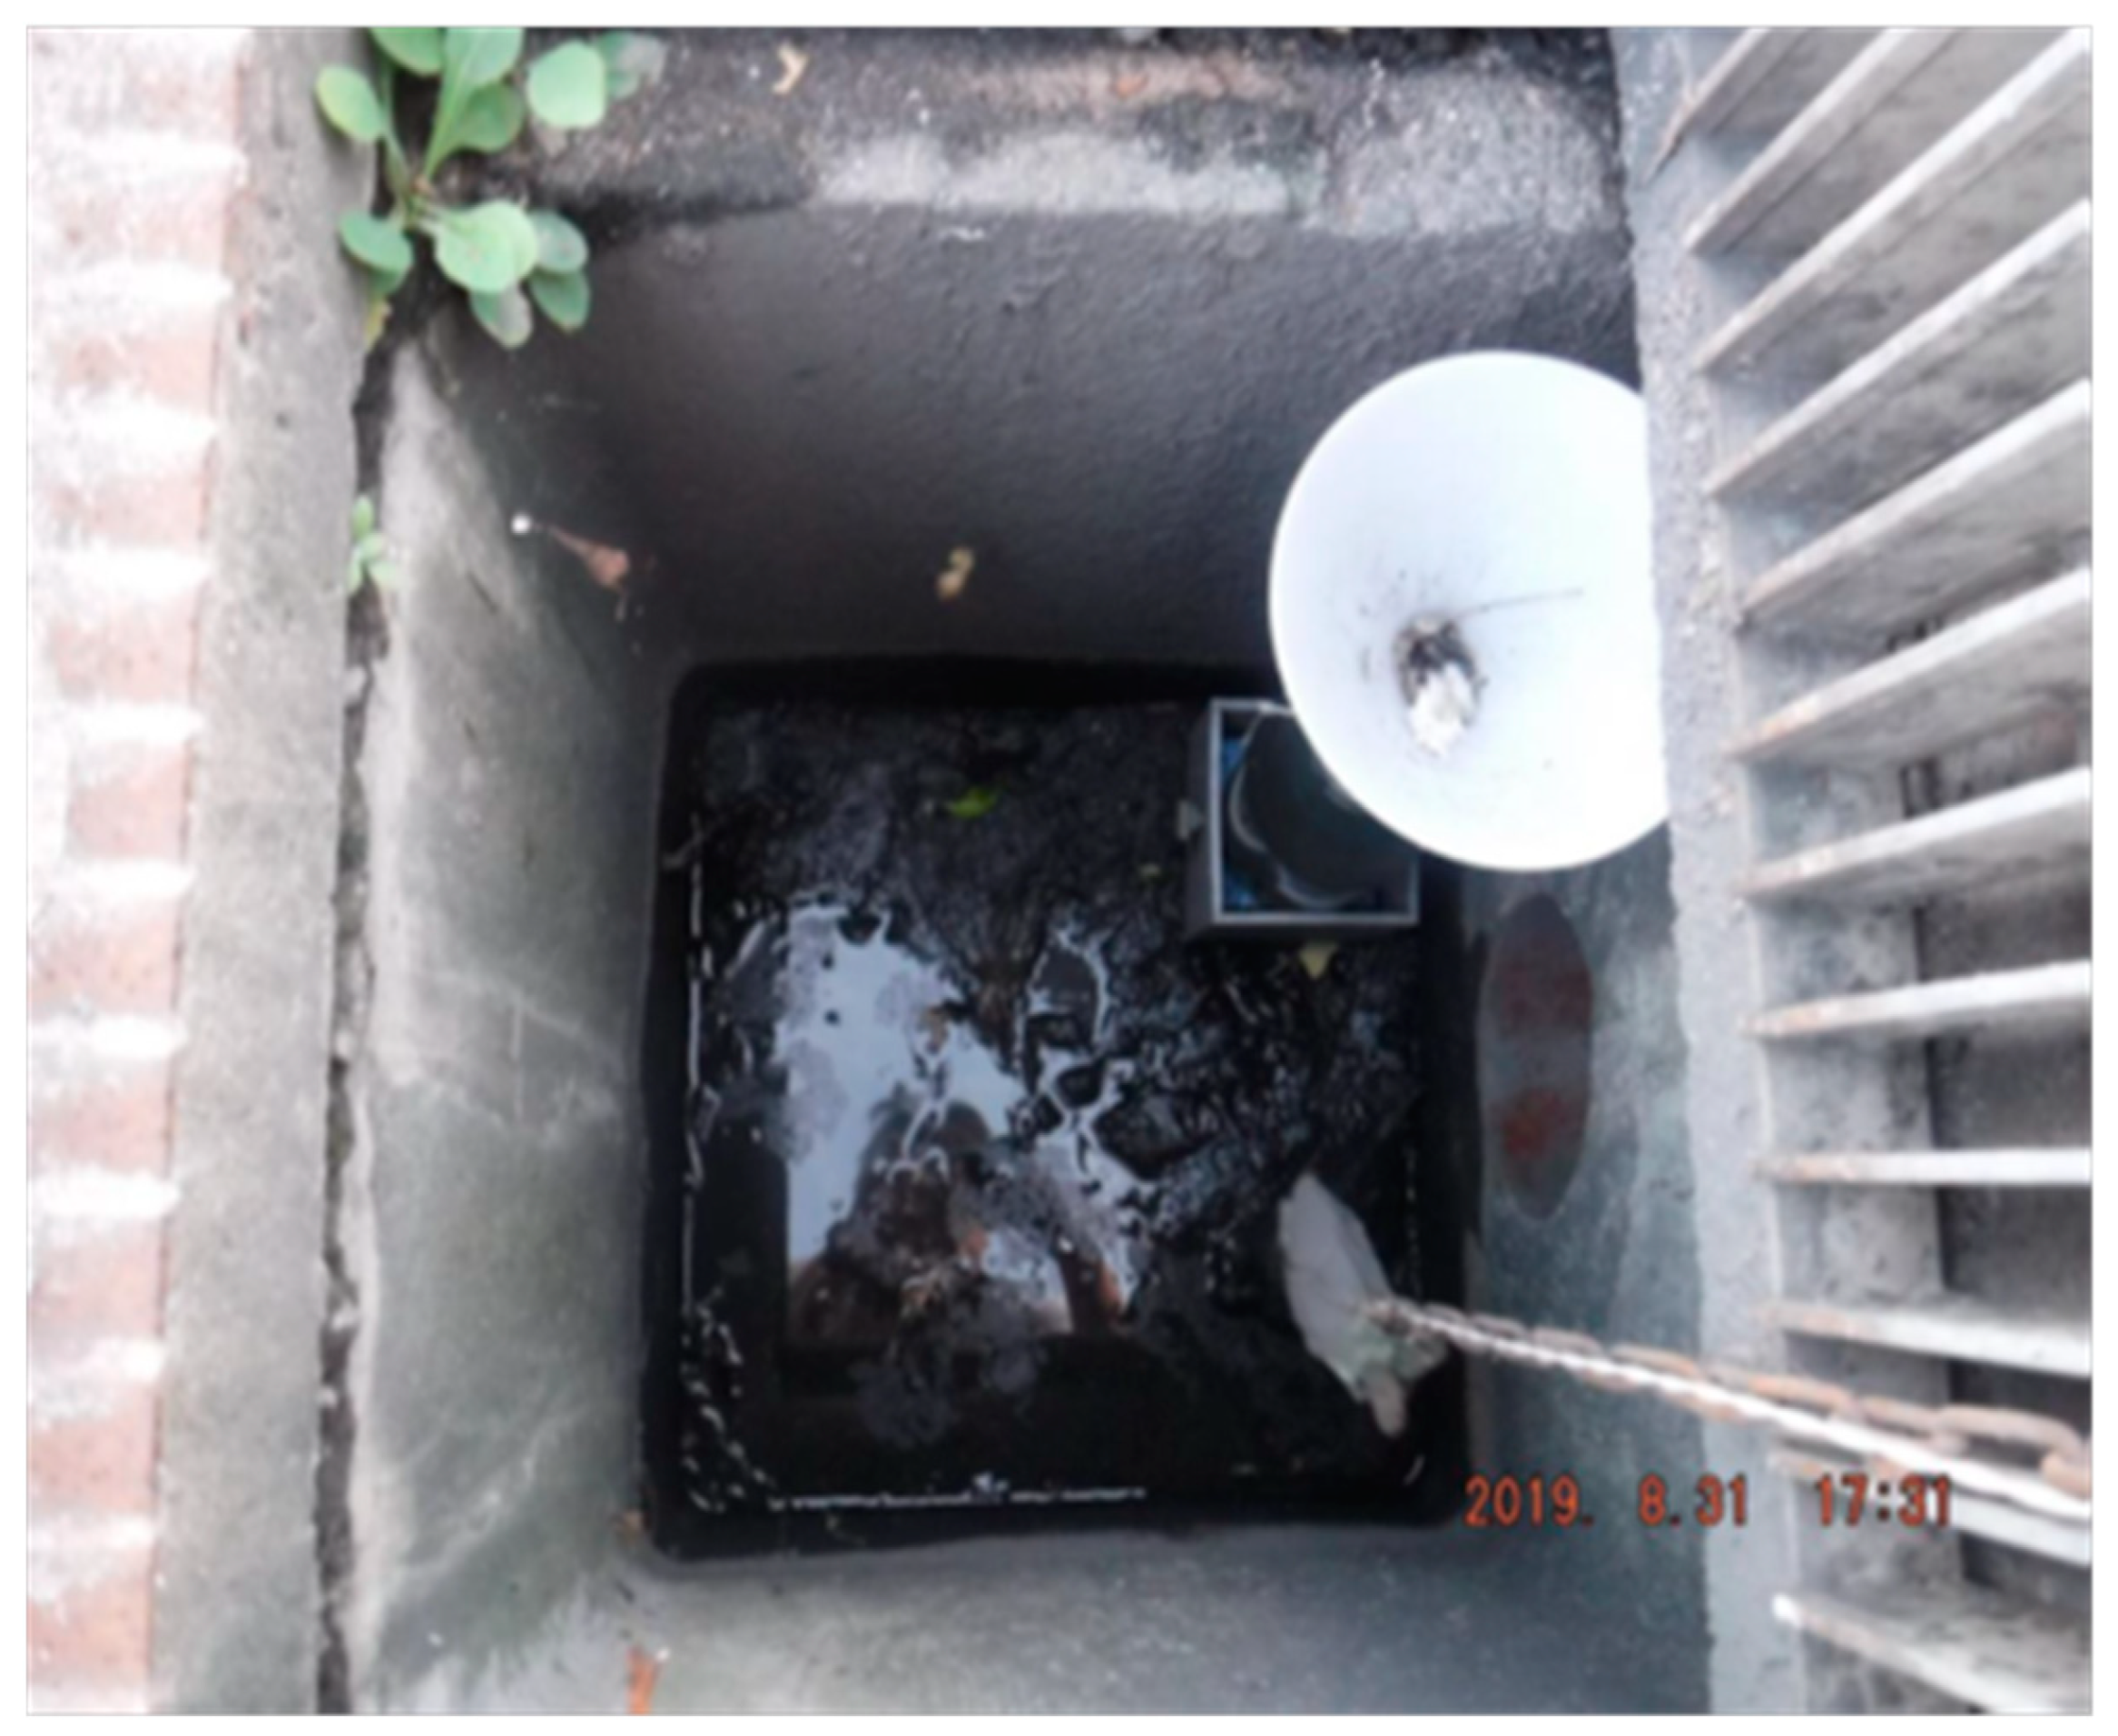
2.1. Road Runoff Water Quality Assessments in Sendai City, Miyagi Prefecture, Japan

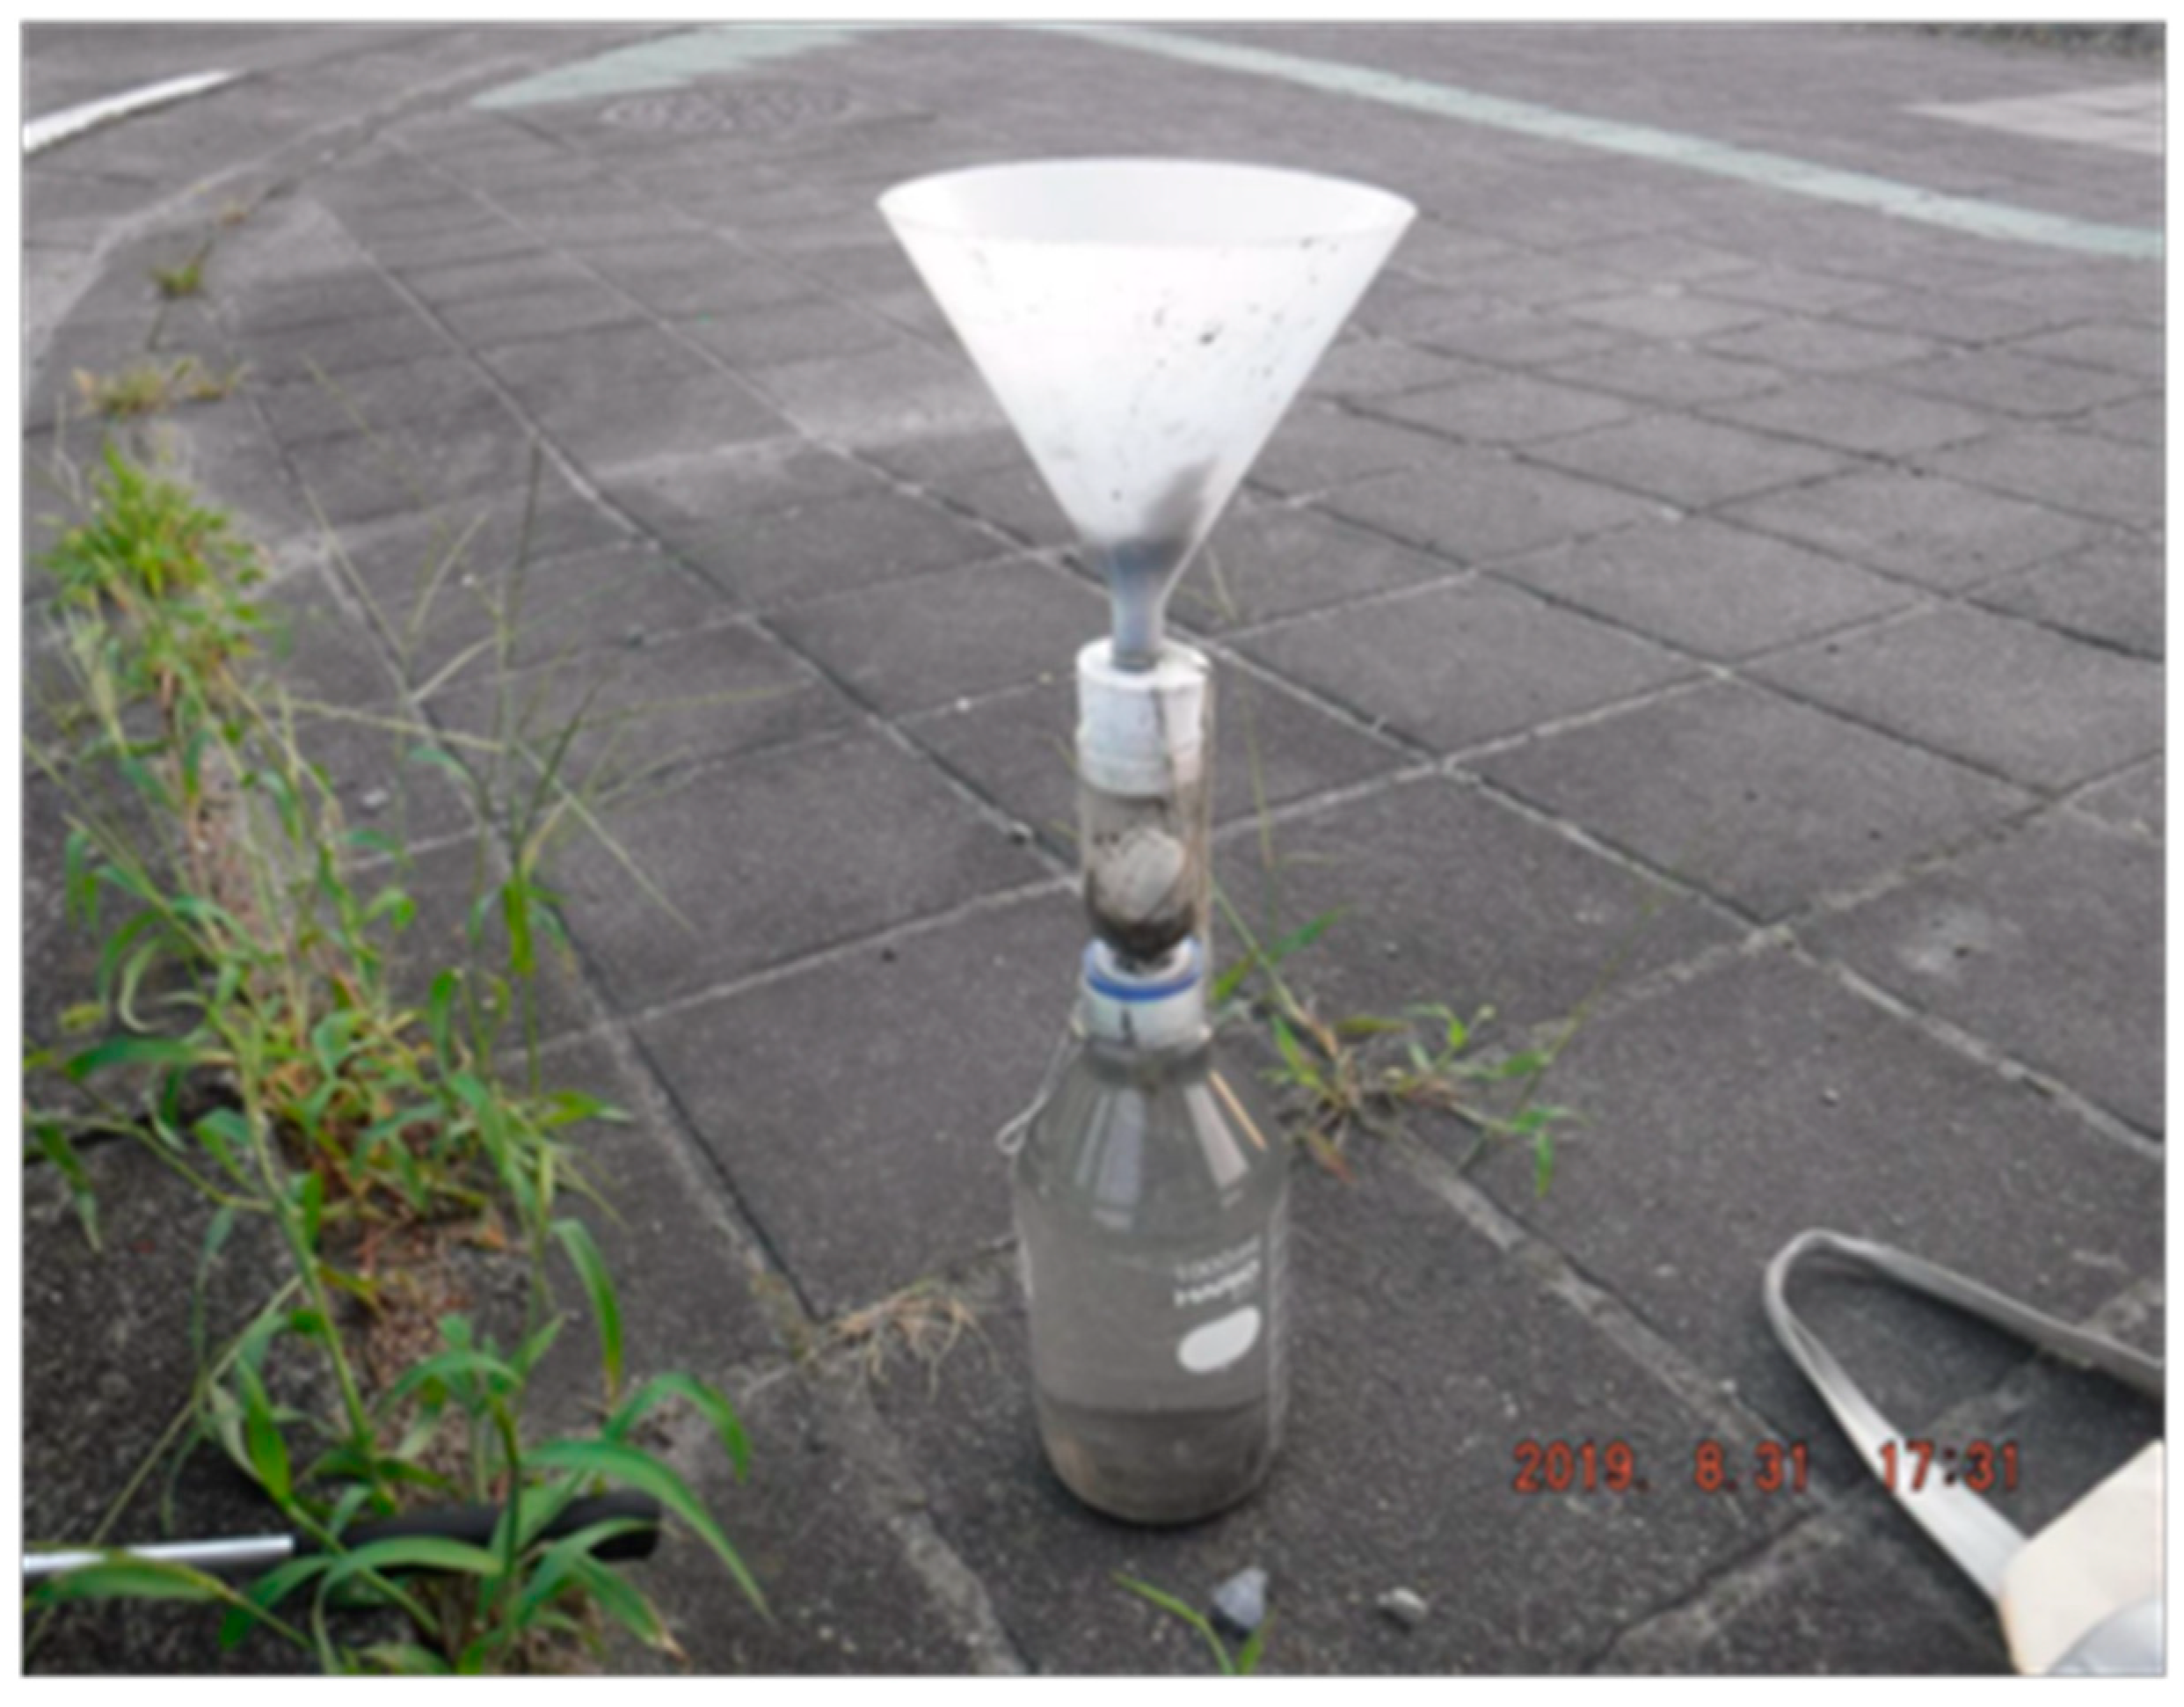
2.1.1. Materials and Methods

In Wakabayashi ward, Sendai City in Miyagi Prefecture, the author deployed a water collection device in a street stormwater inlet. The device, which consisted of a glass bottle with a floating ball, can collect 1 L samples of stormwater runoff. When the ball rises to the top of the bottle, further inflow is prevented. Therefore, the collected samples correspond to the initial stormwater runoff from 1.5 mm rainfall events (Figure 1, Figure 2 and Figure 3). This estimate is based on the assumption that the area of inflow into the inlet was 5 m by 10 m, the initial loss was 0.75 mm, the runoff ratio of the area was 0.8, and the proportion of water entering the sample collecting vessel was 0.05 (Figure 3).
The daily rainfall volumes during the periods 1985–1990 and 2015–2019 in Sendai obtained from the Japan Meteorological Agency showed daily rainfall events of <1.5 mm, which accounted for 34.1% and 31.2% of the rainy days during the 1985–1990 and 2015–2019 periods, respectively. The histograms show that daily rainfall events ranged between 0.5 and 10 mm during these two periods (Figure 4 and Figure 5), while daily rainfall events of 0.5 mm were the highest in frequency. In addition, despite the changes in climatological conditions over these periods, the shapes of the histograms are generally similar. The figures show that the sample collecting system employed in this study is well suited to collecting runoff from the most frequent rainfall events and, also, for collecting samples for some of the larger rainfall events. Whether collecting runoff for the first <1.5 mm rainfall events can capture the first flush effects should be clarified by further monitoring [6,44], literature reviews [2,45,46], and analyses using EMC [47].
In 2019, the author collected 1 L samples at intervals of 1–2 weeks (Table 1).
The collected water samples were initially stored in a cool dark space before being transferred to a refrigerator (4 °C) until filtration.
The collected water was pre-filtered using a 2 mm mesh filter followed by filtration using a glass fiber filter (Whatman GF/B, 47φ, pore size: 1 μm). Suspended solids (SS, see also Figure 5 and Figure 6) on the glass fiber filters were measured after drying the filter for two hours at 105 °C. The filtrates were used to measure heavy metals (Cr, Cu, Zn, Cd, and Pb) by ICP–MS. Separately, pre-filtrated waters were used to measure the total heavy metals (Cr, Cu, Zn, Cd, and Pb) by ICP–MS to determine the proportion of the particulate heavy metals.

2.1.2. Results

A list of the water samples and their physicochemical parameters is shown in Table 1. High SS values were often observed, which were consistent with the visual observations (Figure 6).
SS was observed in the samples, even when the antecedent dry weather days were zero. The author observed road sediment residual, even after rainfall events, and the SS values obtained, when antecedent dry weather days were zero, were consistent with this observation. Table 1 shows similar trends among SS, particulate heavy metals, and dissolved heavy metals alongside antecedent dry days. However, the correlation factor between the antecedent dry days and SS was not high (0.475) suggesting that more precise analyses, which consider the build-up and wash-off mechanisms, are needed to quantitatively characterize the effects of the antecedent dry weather days on the variations in water quality.
Table 2 shows that the runoff contained high levels of heavy metals, which was consistent with the visible abundance of SS (Figure 6), and suggests an important potential role for porous concrete in the removal of particulate heavy metals during the passage of runoff water via porous concrete because the particles are expected to be trapped.

2.2. Comparison of Dissolved Heavy Metal Concentrations with Previous Studies

Compared to previous studies [13,14,15], the heavy metal concentrations in the collected samples, shown in Table 1, were high; the results of the three studies are reviewed in Murakami [48] (Table 2.11). Specifically, the concentration of Cr was similar to those in Sansalone and Buchberger [14] and Pitt et al. [15], while it was one to two orders higher than in Shinya et al. [13]. The concentration of Cu was one order lower than in Shinya et al. [13] and Sansalone and Buchberger [14] and similar to those found by Pitt et al. [15]. The concentration of Zn was one to two orders lower than in Shinya et al. [13] and Sansalone and Buchberger [14] and similar to those found by Pitt et al. [15]. The Cd concentration was higher than in Shinya et al. [13], one order lower than in Sansalone and Buchberger [14], and similar to those in Pitt et al. [15]. The Pb concentration was one order lower than those identified in the three aforementioned studies [13,14,15].
The results of these comparisons suggest that the heavy metals levels in all four studies (including this study) varied markedly, presumably reflecting the differences in the environmental conditions at the four sites. For Zn, the environmental standards in Japan are set at 0.03 mg/L for rivers and lakes; this level was exceeded only once at the study site (19 December 2019). The mean heavy metal concentrations reported by Shinya et al. [13] and Sansalone and Buchberger [14] were one order higher than the environmental standards, suggesting that there is a need to reduce non-point Zn in Japan, and presumably the other heavy metals in stormwater runoff in urban areas.
A study by Flores-Rodriguez et al. [49] measured Pb, Zn, and Cd concentrations in stormwater samples collected at eight sites. The Pb and Cd concentrations were one order higher than most of the values obtained in this study, while the Zn levels were more varied, yet tended to be one order lower than the values shown in Table 1. In a study by Mikkelsen et al. [50], the Pb, Zn, Cd, and Cu concentrations were measured in different types of urban runoff. They found that the Cd concentrations were higher and Cu concentrations were lower than the values shown in Table 1, while the concentrations of Pb and Zn were mostly similar. Numerous factors are considered to affect non-point sources of heavy metals, as demonstrated in the studies by Ozaki et al. [51,52].

3. Control of Non-Point Sources of Pollution and Sewage Systems

3.1. Non-Point Source Pollution and Sewage Systems

The present study focused on reducing non-point heavy metal runoff. The benefits of using infiltration techniques to decrease heavy metals in runoff are (i) to avoid constructing water treatment facilities; (ii) to facilitate multipurpose uses for the surfaces used for infiltration during fine weather (i.e., these surfaces could be used for other activities); (iii) to retain the water that can be recycled for uses other than drinking.
Owing to the high ratio of paved (i.e., impervious) to non-paved (i.e., pervious) areas in urban centers, high runoff volumes and peak discharge rates are observed. Thus, mitigation measures employing infiltration and storage are very important in urban areas because they prevent flooding and/or inundation.
Furthermore, infiltration techniques are both indirectly and directly effective for water quality control, as described below.
Direct methods of control include methods such as those that the author is attempting to implement. In these cases, the infiltration site (i.e., the bottom and the sides of the street stormwater inlets) could be said to achieve two aims: water volume control and quality control. These two aims could be met by water penetration and these sites could be regarded as high-performance facilities.

3.2. Indirect and Direct Means of Reducing Non-Point Pollution Runoff Loads

Indirect control methods promote penetration of the water at the surface of the infiltration stratum and the subsequent retention therein. Percolation of the water in the infiltration stratum is referred to as temporal retention, which is different from the water inside the retention ponds because it is exfiltrated into the natural base soil below the stratum and/or through drainage pipes [53,54,55]. This method reduces the volume of runoff and decreases the volume and frequency of combined sewage overflow (CSO), as well as the sweep flow inside stormwater pipes, gutters, etc. Originally, the idea of runoff volume reduction developed from the viewpoint of flood control. The frequent occurrence of heavy rain events around the world in recent years has required catchment managers to re-evaluate runoff volume reduction, i.e., to consider the mutual benefits of flood control and runoff load reduction.
Direct control methods to control non-point pollution runoff aim at controlling (i.e., trapping and adsorbing) the pollution in the stormwater inside the infiltration stratum. In the case of porous concrete, the mechanisms of pollution control were clarified based on laboratory experiments (see Section 5). The economic aspects of the infiltration technique have been previously analyzed [36]. We intended to develop direct methods for runoff reduction into separate sewage systems.

4. Infiltration as a Direct Pollution Control Method in a Separate System

4.1. Porous Concrete as An Infiltration Medium

Porous concrete is produced using large aggregates, which ensures that permeability is maintained with only a minor decrease in hardness compared to normal cement. The author used an aggregate called Gmax15, which is composed of gravel measuring less than 15 mm.
Porous concrete columns (Figure 7) and porous concrete cubes (Figure 8) were used in the laboratory experiments. Columns were prepared using a mixture of cement (0.3 kg), gravel (Gmax15, 1.55 kg), water (8.05 kg), and admixture (high-range water-reducing admixture, 0.003 kg) [38].
The saturated hydraulic conductivity of the column was measured using the constant water level method and estimated to be 1800 mm/h.

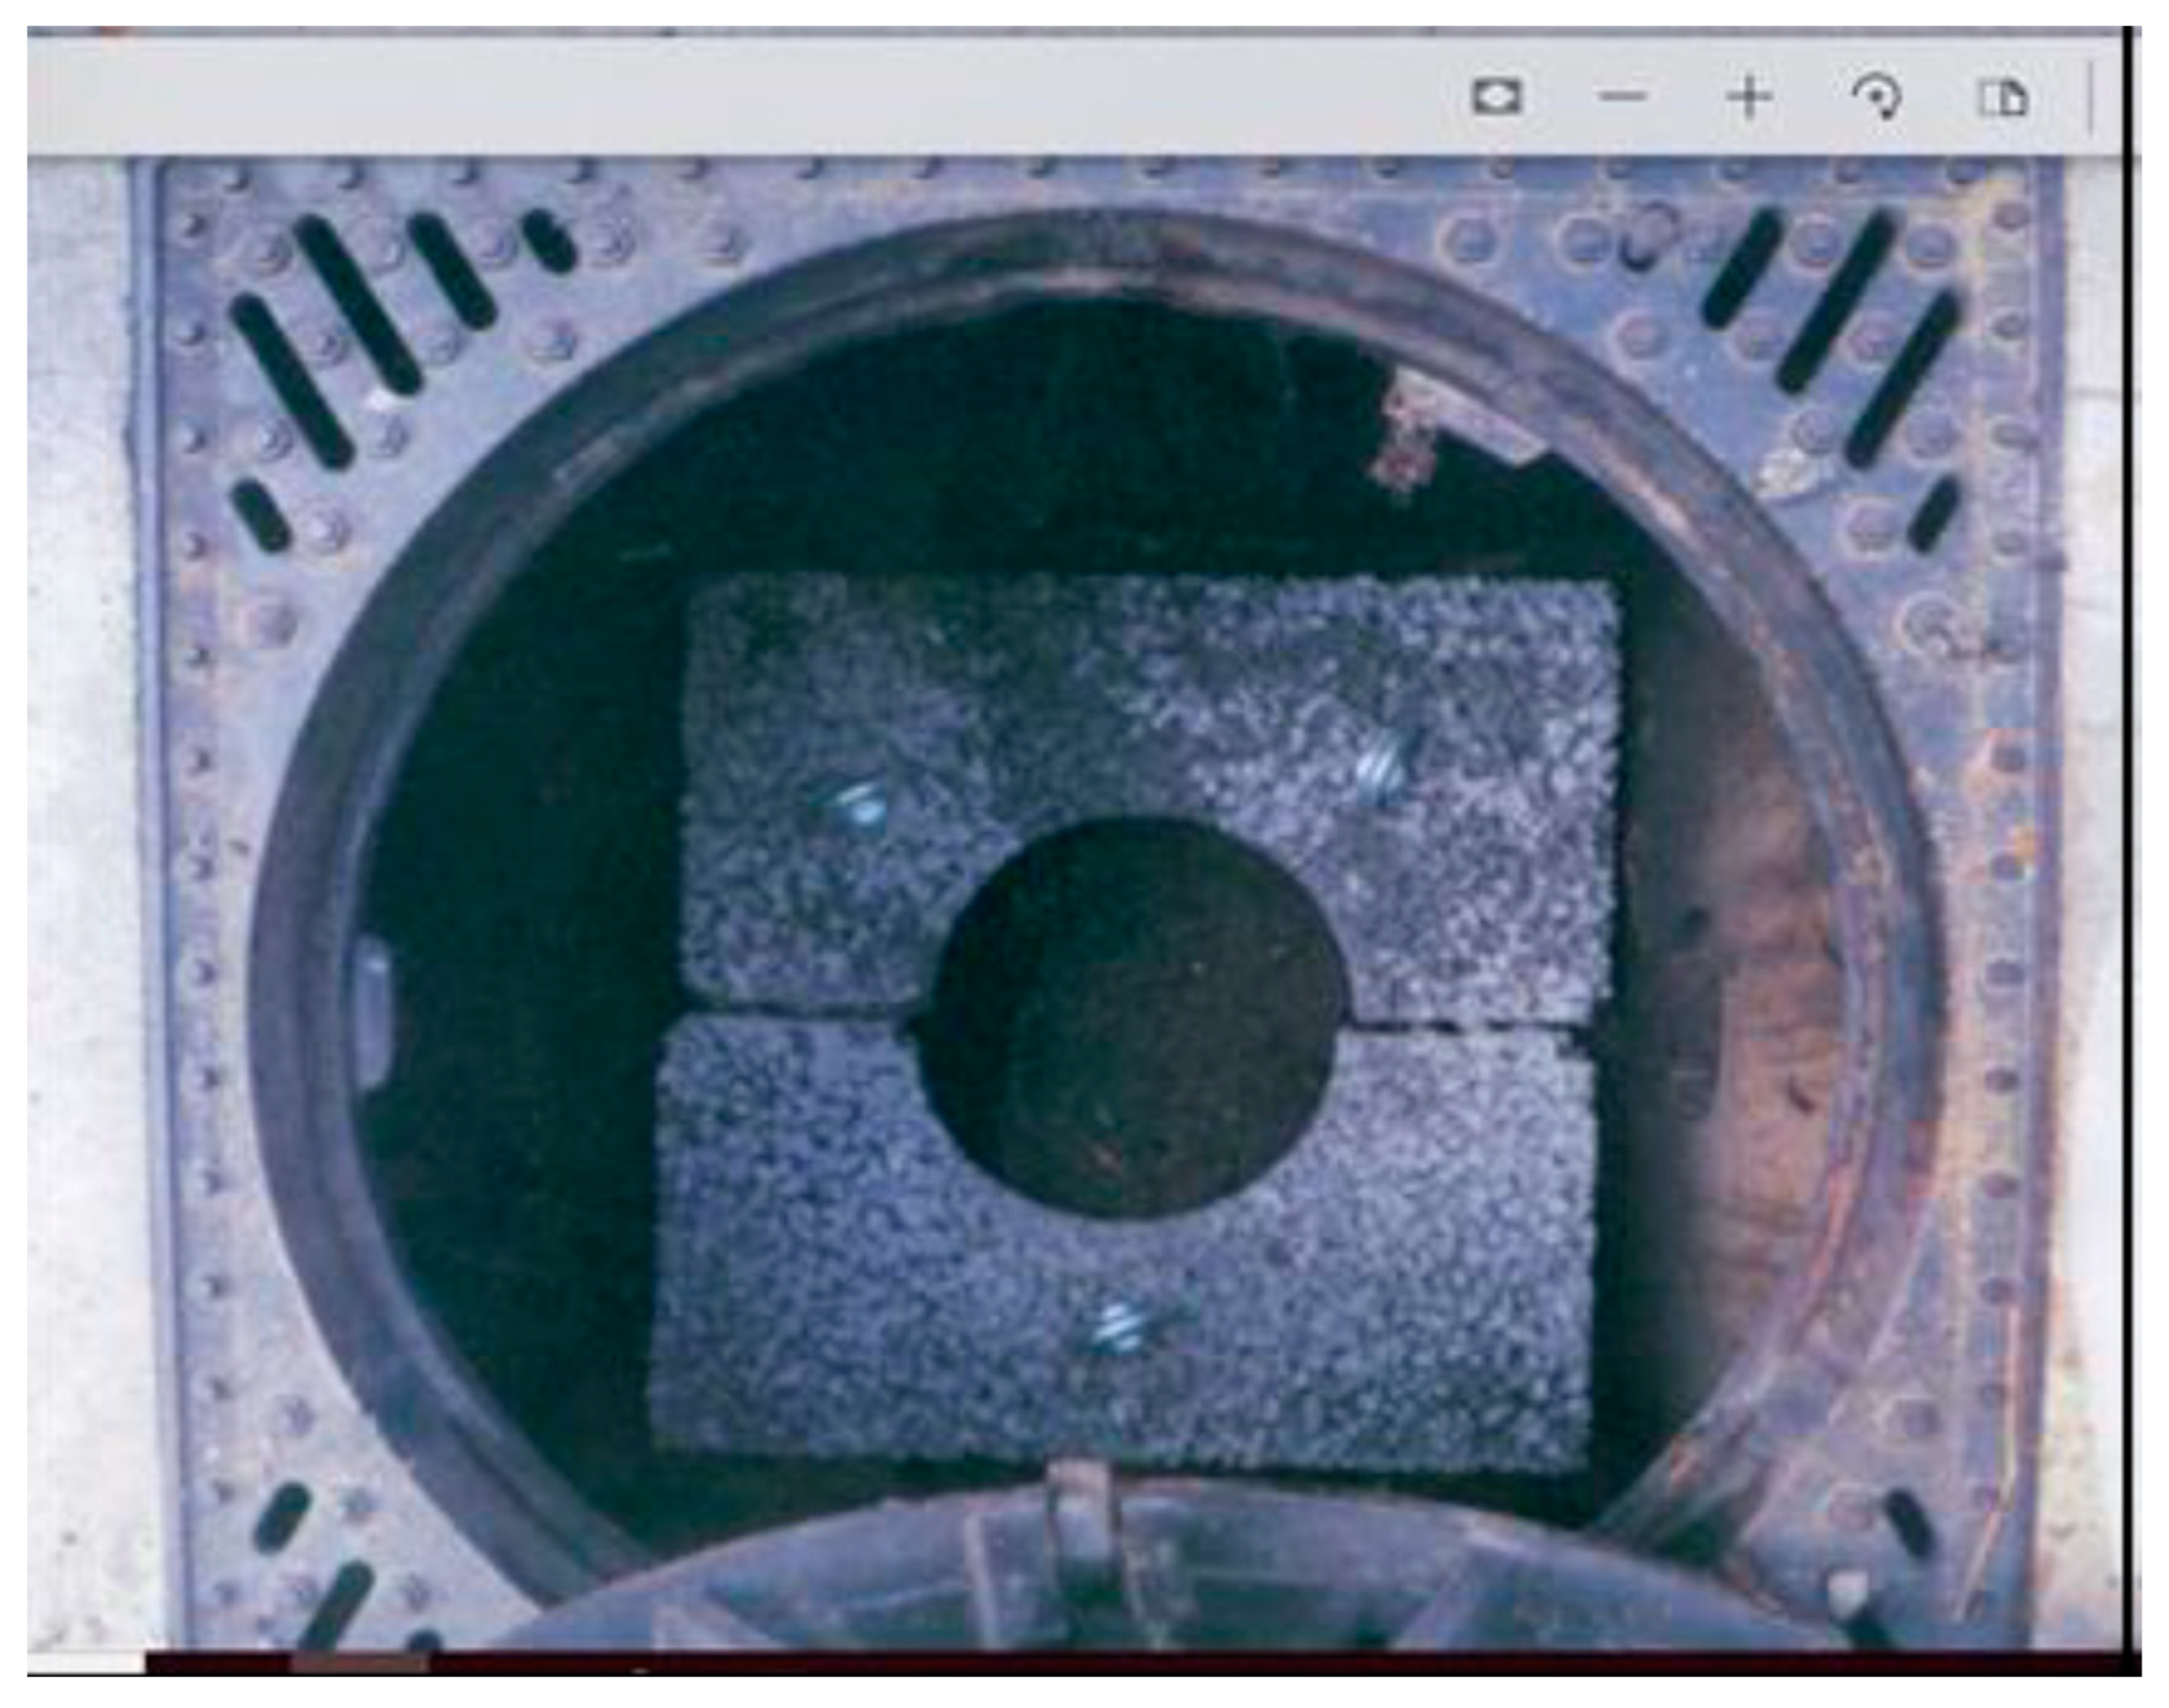
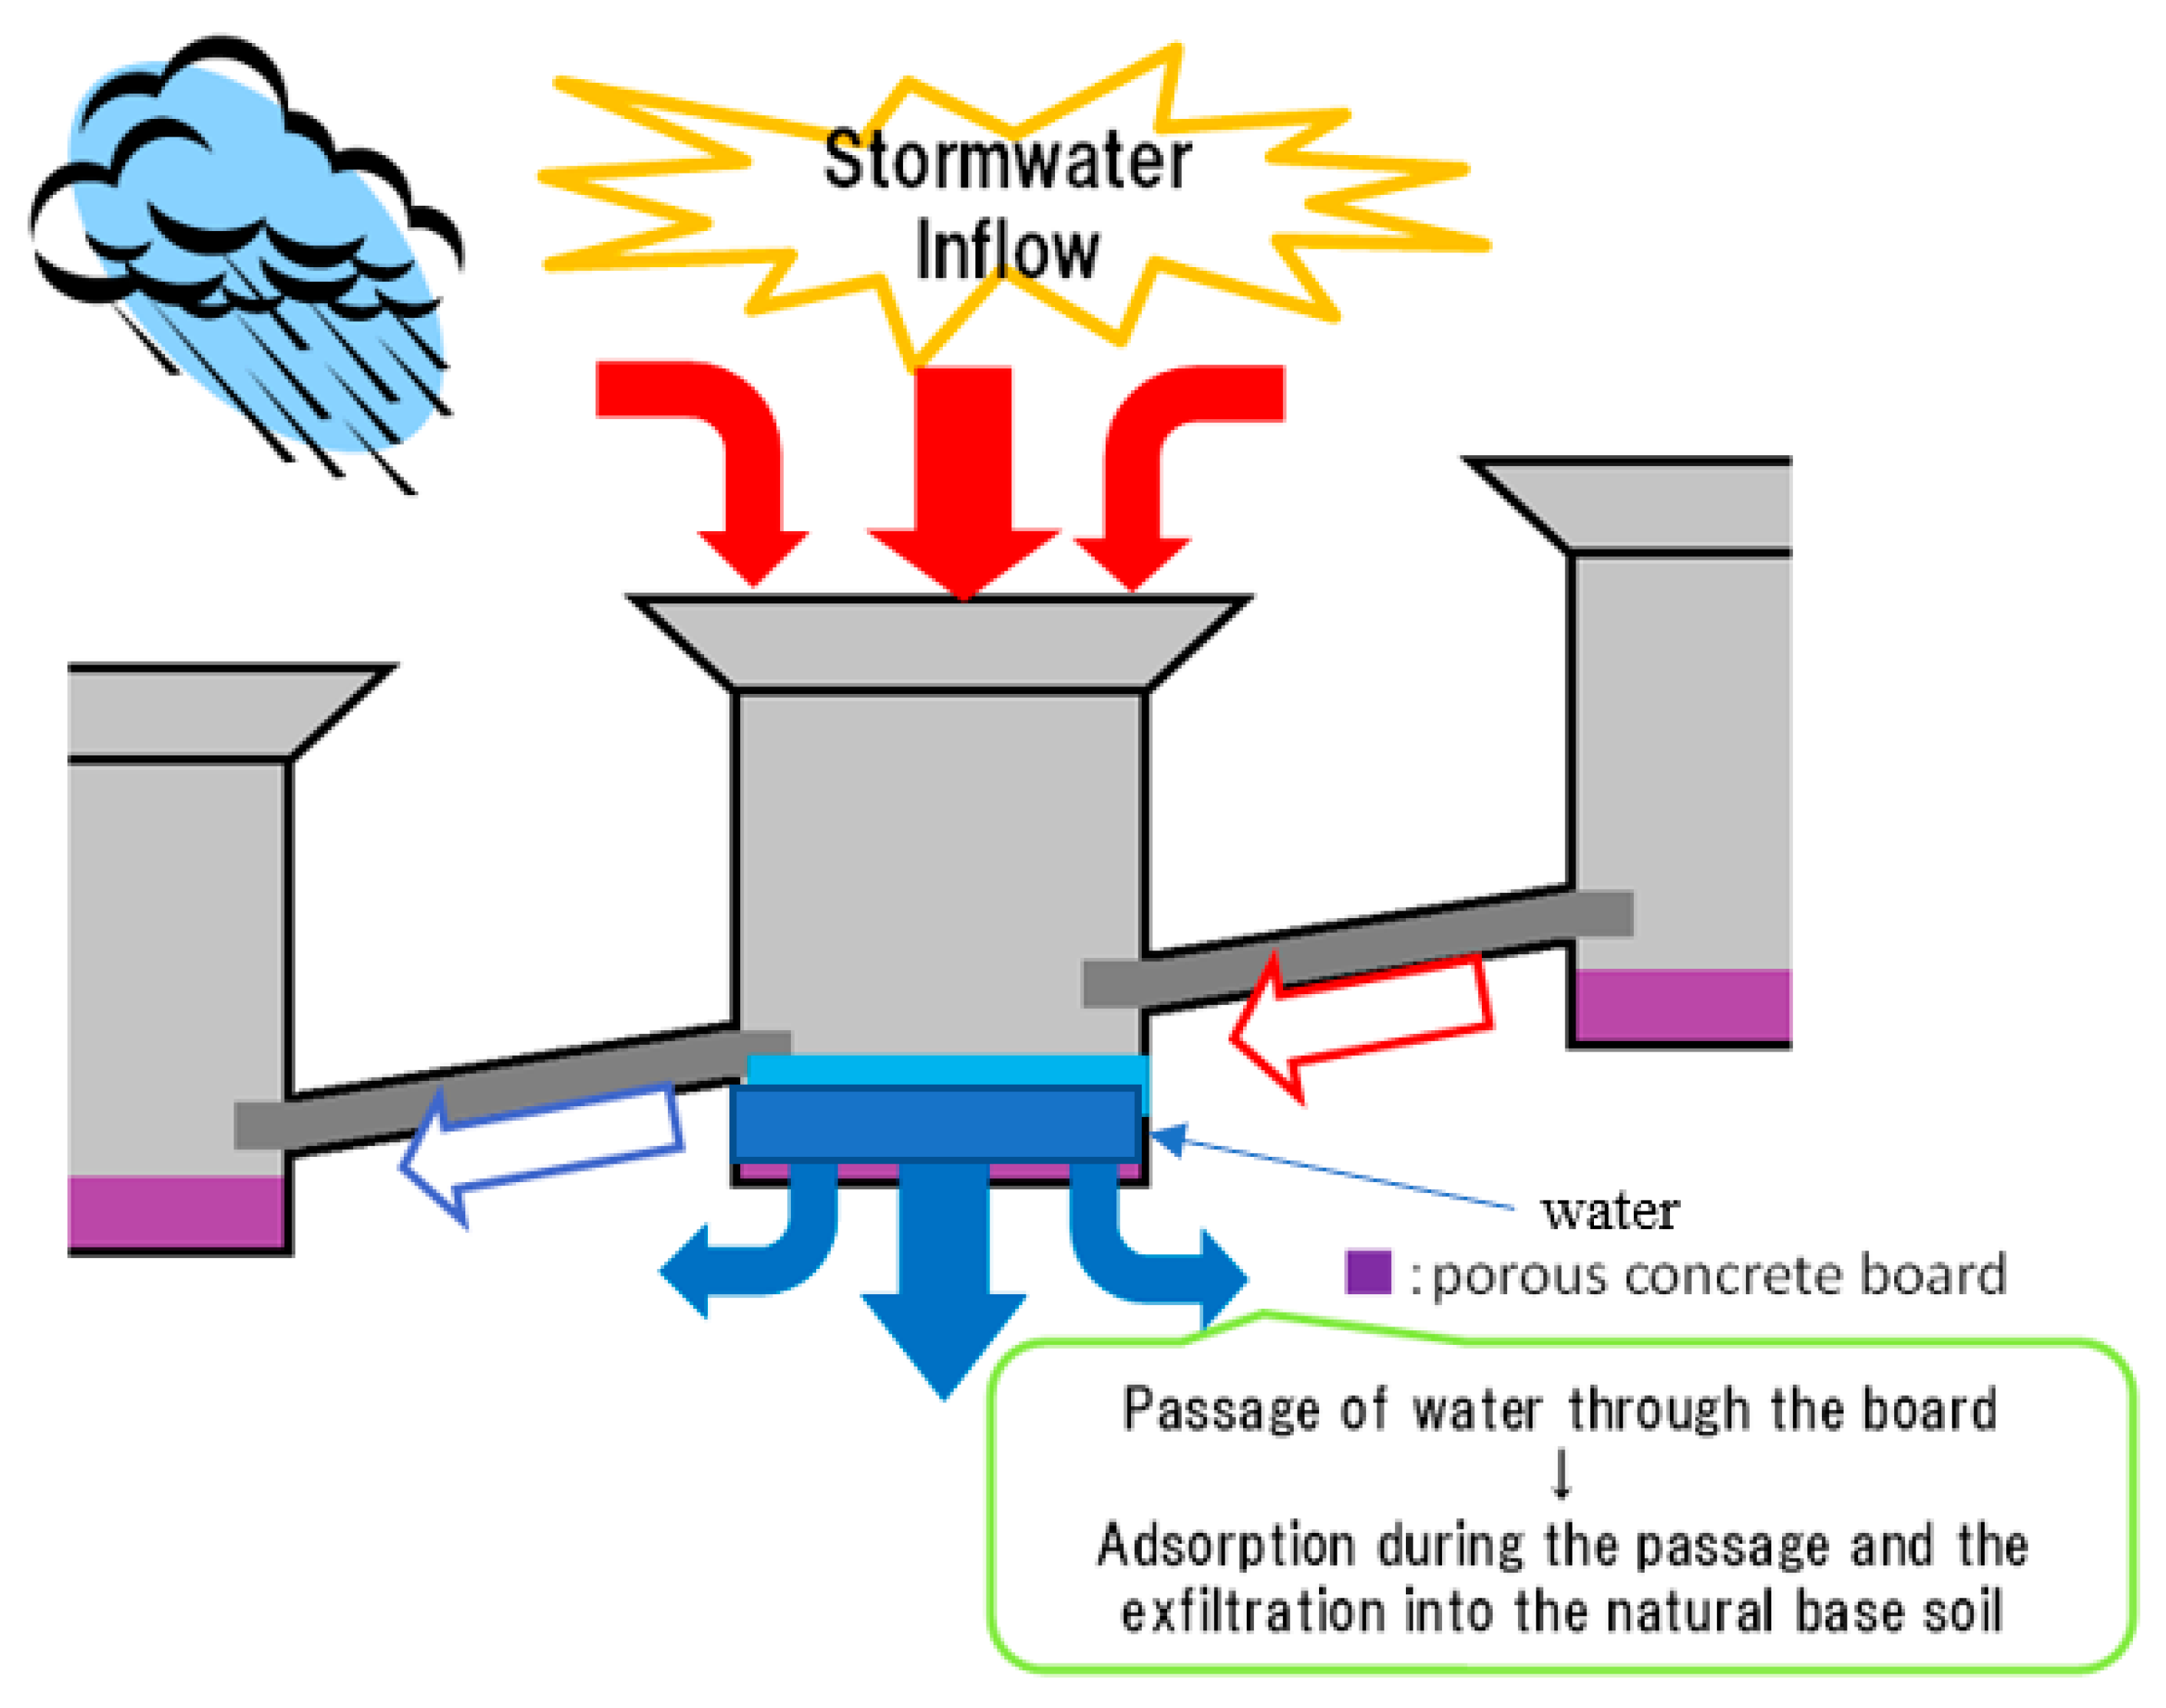
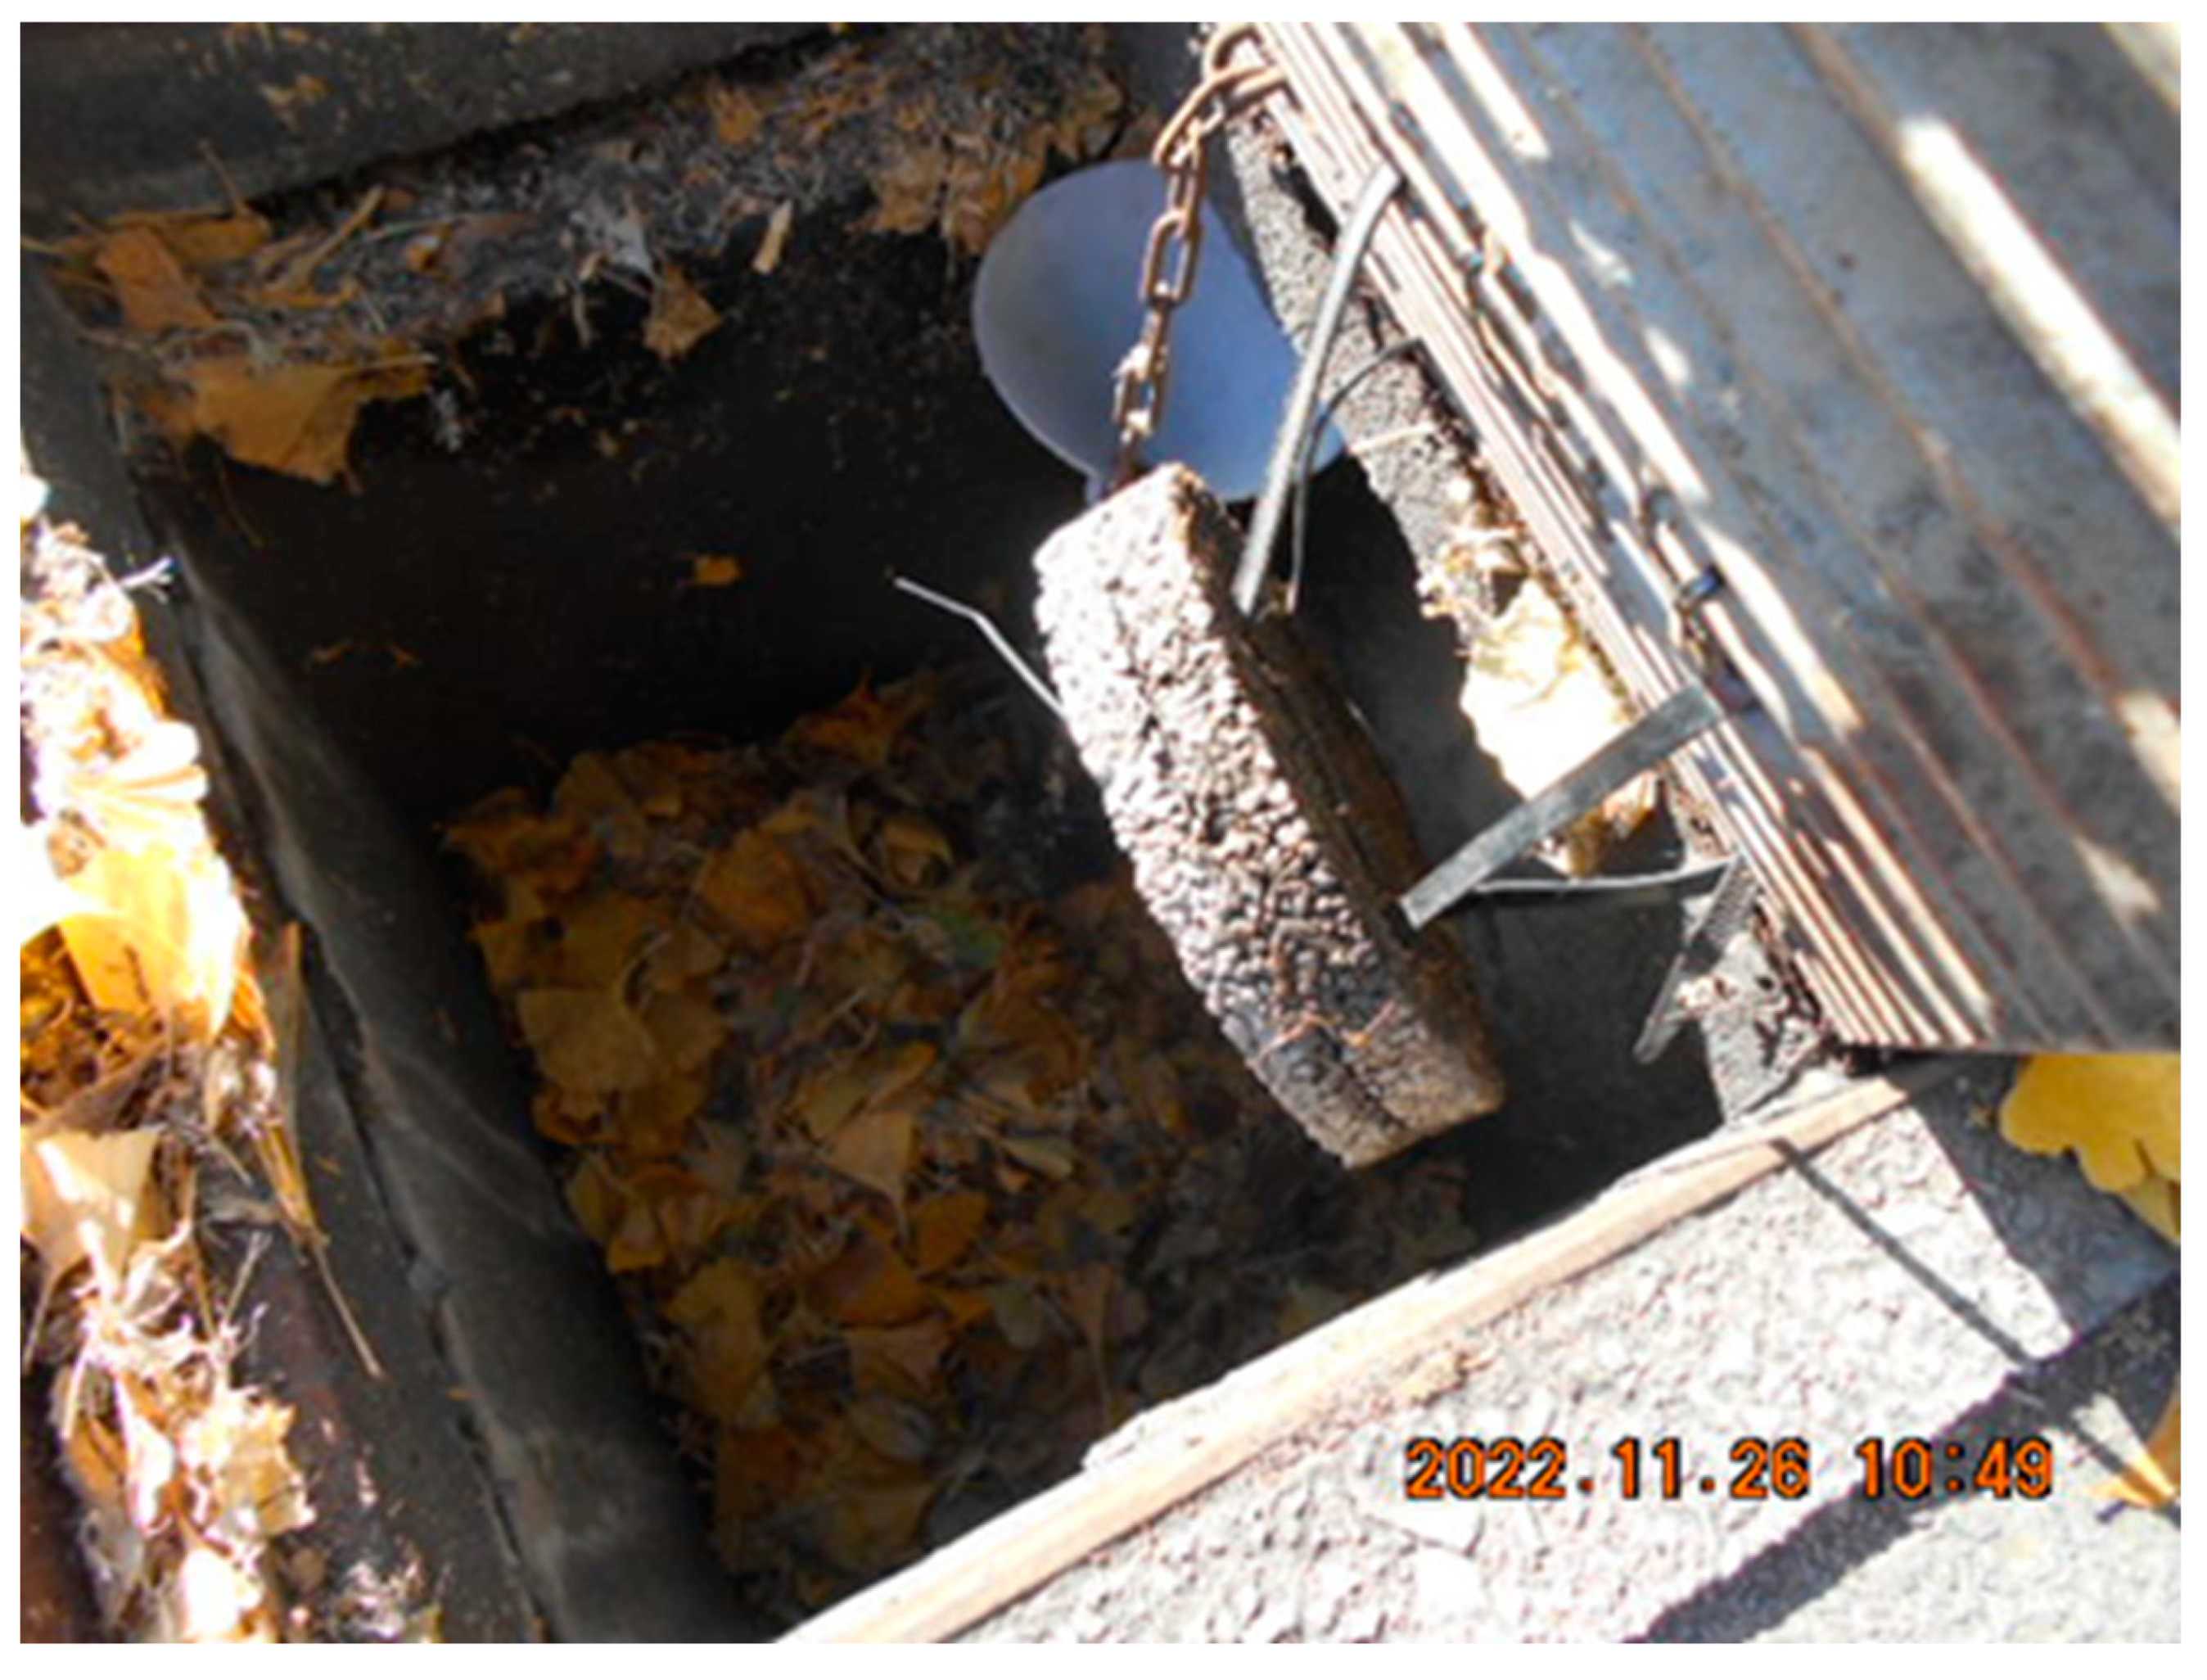
4.2. Deployment of Porous Concrete Plate at the Bottom of Street Stormwater Inlets

Using porous concrete on the bottom of the street and not at the ground surface of stormwater inlets (Figure 9) has been proposed by the author’s research group as a means of reducing heavy metal runoff, via filtration and adsorption, and water runoff reduction, via exfiltration, into the natural base soil around the bottom of the street stormwater inlets [36,37,38]. The reasons why the bottoms of the street stormwater inlets were selected as sites to deploy the porous concrete plates were because (i) porous concrete has a structural weakness and cannot bear significant loads, (ii) the inflows of the stormwater during rainfall events will keep the porous composite unclogged, and (iii) the street stormwater inlets are located in the stormwater drainage networks.
Figure 10 shows the behavior of the water passing through the permeable bottom plates in the stormwater inlets, although, in reality, the walls could also be permeable, as described below. Here, the behavior of the water at the bottom of the inlets is shown to illustrate the two proposed functions of the stormwater drains, i.e., the reduction of heavy metals in the runoff via filtration and adsorption reactions, and the overall reduction in water runoff, via the exfiltration into the natural base soil around the bottom of the street stormwater inlets [36,37,38].

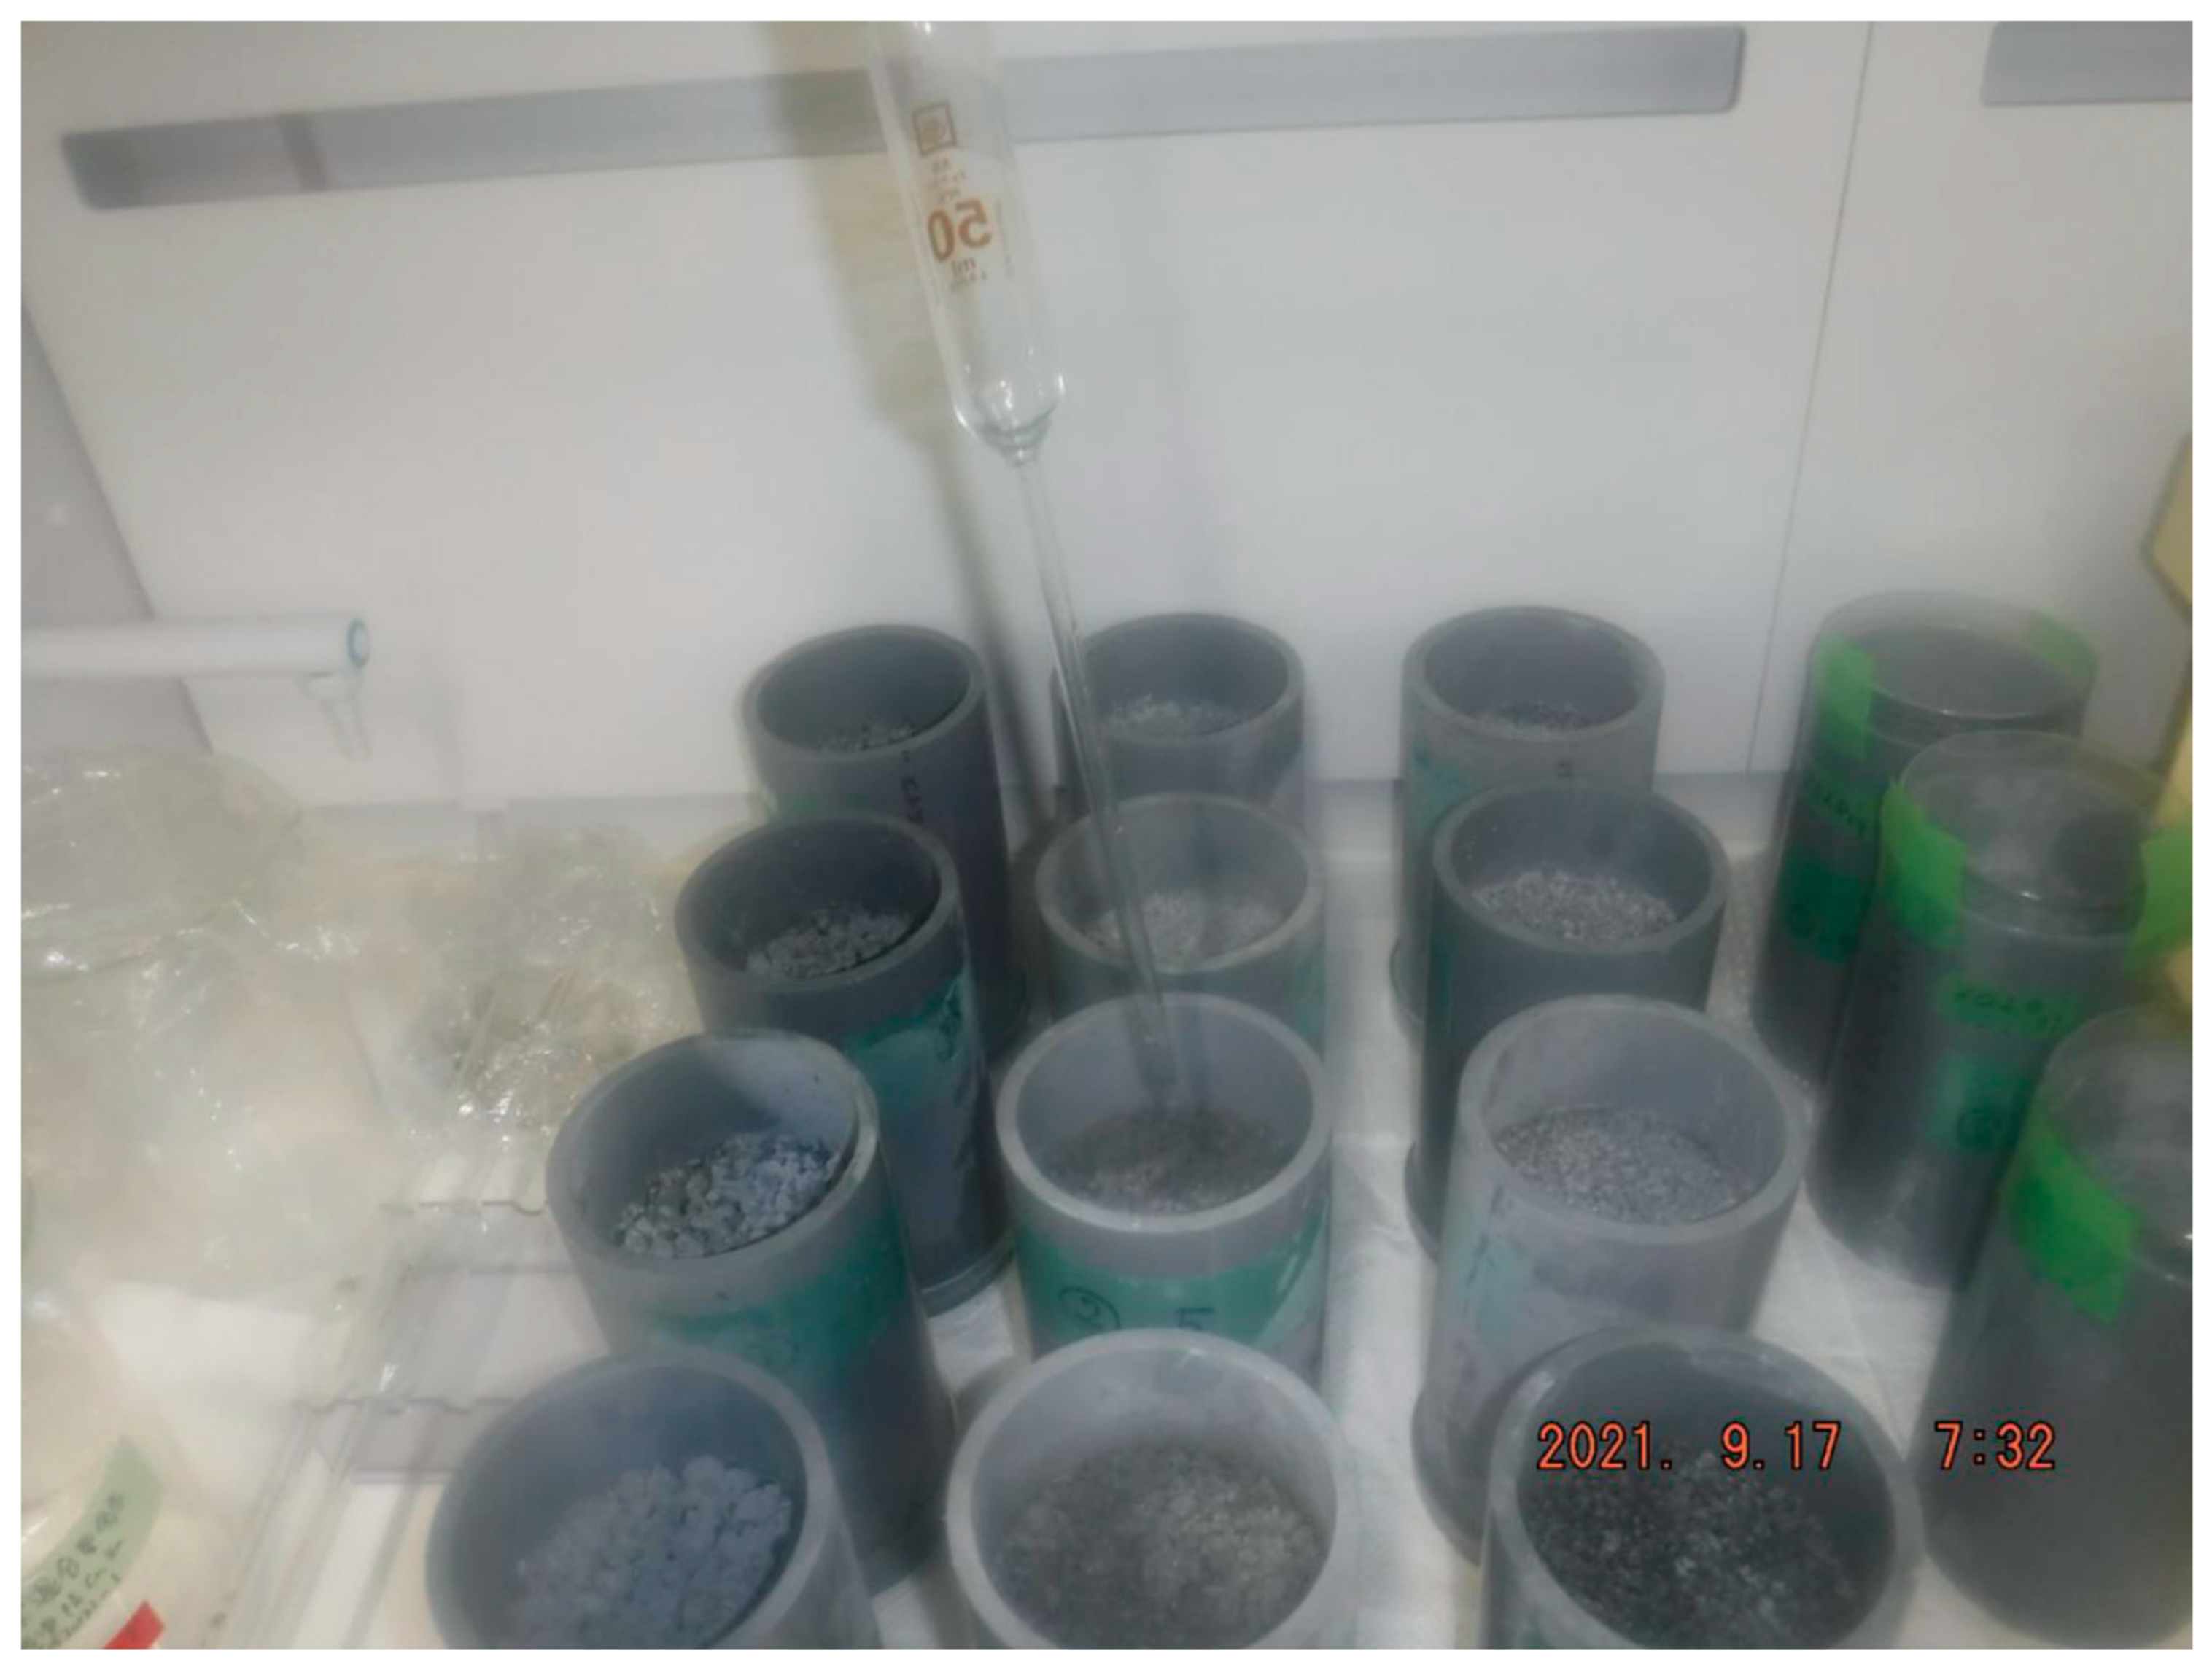
5. Laboratory Experiments Examining the Potential Reduction in Heavy Metals in Porous Concrete Exposed to Runoff

Using artificial rainfall (mixture of Zn, Cu, and Pb), the author conducted experiments using porous concrete columns (Figure 7; diameter and depth: 10 cm) and porous concrete cubes (Figure 8; 64 cm3). Specifically, the author investigated the adsorption rates of heavy metals using concrete columns and cubes under various conditions.
The porous concrete column samples (C series) consisted of a column prepared in February 2008 at the School of Food, Agricultural and Environmental Sciences at Miyagi University, alongside the column samples (N series) prepared outside the University in November 2016. Both columns were prepared using the same mixture, coefficient of permeability, and size.
We performed 12 experimental runs (Table 3). In each run, a single column was placed in a Petri dish and a 50 mL solution was added comprising either a mixture of the heavy metals Zn, Cu, and Pb, or Zn or Cu, or Pb individually. The concentrations used for Pb were higher than the level of dissolved Pb in Table 1, although Zn and Cu concentrations were of the same order of magnitude, while each was sprayed onto the top of the sample column using a 50 mL volumetric pipette (Figure 11). The experiment was left to run overnight. Then, the leachate that had accumulated in the glass Petri dish was collected, and the amount of the leachate and the concentrations of Pb, Zn, and Cu were measured. The runs for each experimental condition were repeated 2–13 times. The amount of leachate in each run varied from 25 to 45 mL. The adsorption rate was determined based on the relationship between the volume of leachate, the concentration of each heavy metal, the initial volume of solution added, and the concentration. In addition, the time taken for the 50 mL of the solution to flow out of the sample (about 25 s) was measured periodically to confirm that the spray intensity had not changed.
The variations in the proportion of Pb, Zn, and Cu adsorbed by the concrete columns in the indoor artificial rainfall experiments are shown in Table 4. The findings revealed that (i) similar proportions of Pb, Zn, and Cu were absorbed when the leachates contained mixed heavy metal solutions and when they contained individual heavy metals (Run 1-1, Run 2-1 and Run 3-1 and Run 5; Run 1-2, Run 2-2, Run 3-2 and Run 5; Run 1-3, Run 2-3 and Run 3-3 and Run 5), (ii) similar proportions of the three heavy metals were absorbed by the columns, even when the concentration of each heavy metal showed variations (Run 1-1, Run 2-1 and Run 3-1; Run 1-2, Run 2-2 and 3-2; Run 1-3, Run 2-3 and Run 3-3), (iii) similar adsorption proportions for Cu (Run 3-3 and Run 4-1) and for Zn and Pb (Run 5 and Run 6) were shown and (iv), smaller proportions were shown when the concentrations of the heavy metals were low (less than 10 ppb), such as in Runs 4-1 and 6, where a few ppb Cu elution from the column N series arose. The elution was confirmed separately by adding the ultrapure water (Millipore MQW) onto sample columns and again by the subsequent measurements of Pb, Zn, and Cu in the leachate. The results showed that a few ppb of each heavy metal leached from the recycled concrete used in the porous concrete columns. The small amount of heavy metal leaching decreased the apparent adsorption proportions. To resolve this problem, the author attempted to purify the porous concrete columns by submerging the columns in ca. 30 L pure water for approximately 2 weeks; this process was repeated three times after replacing the water with new pure water. Using this procedure, leaching from the columns decreased by 90% compared to the original concentrations of heavy metals in leachate and the porous concrete columns could be used to assess actual stormwater samples.

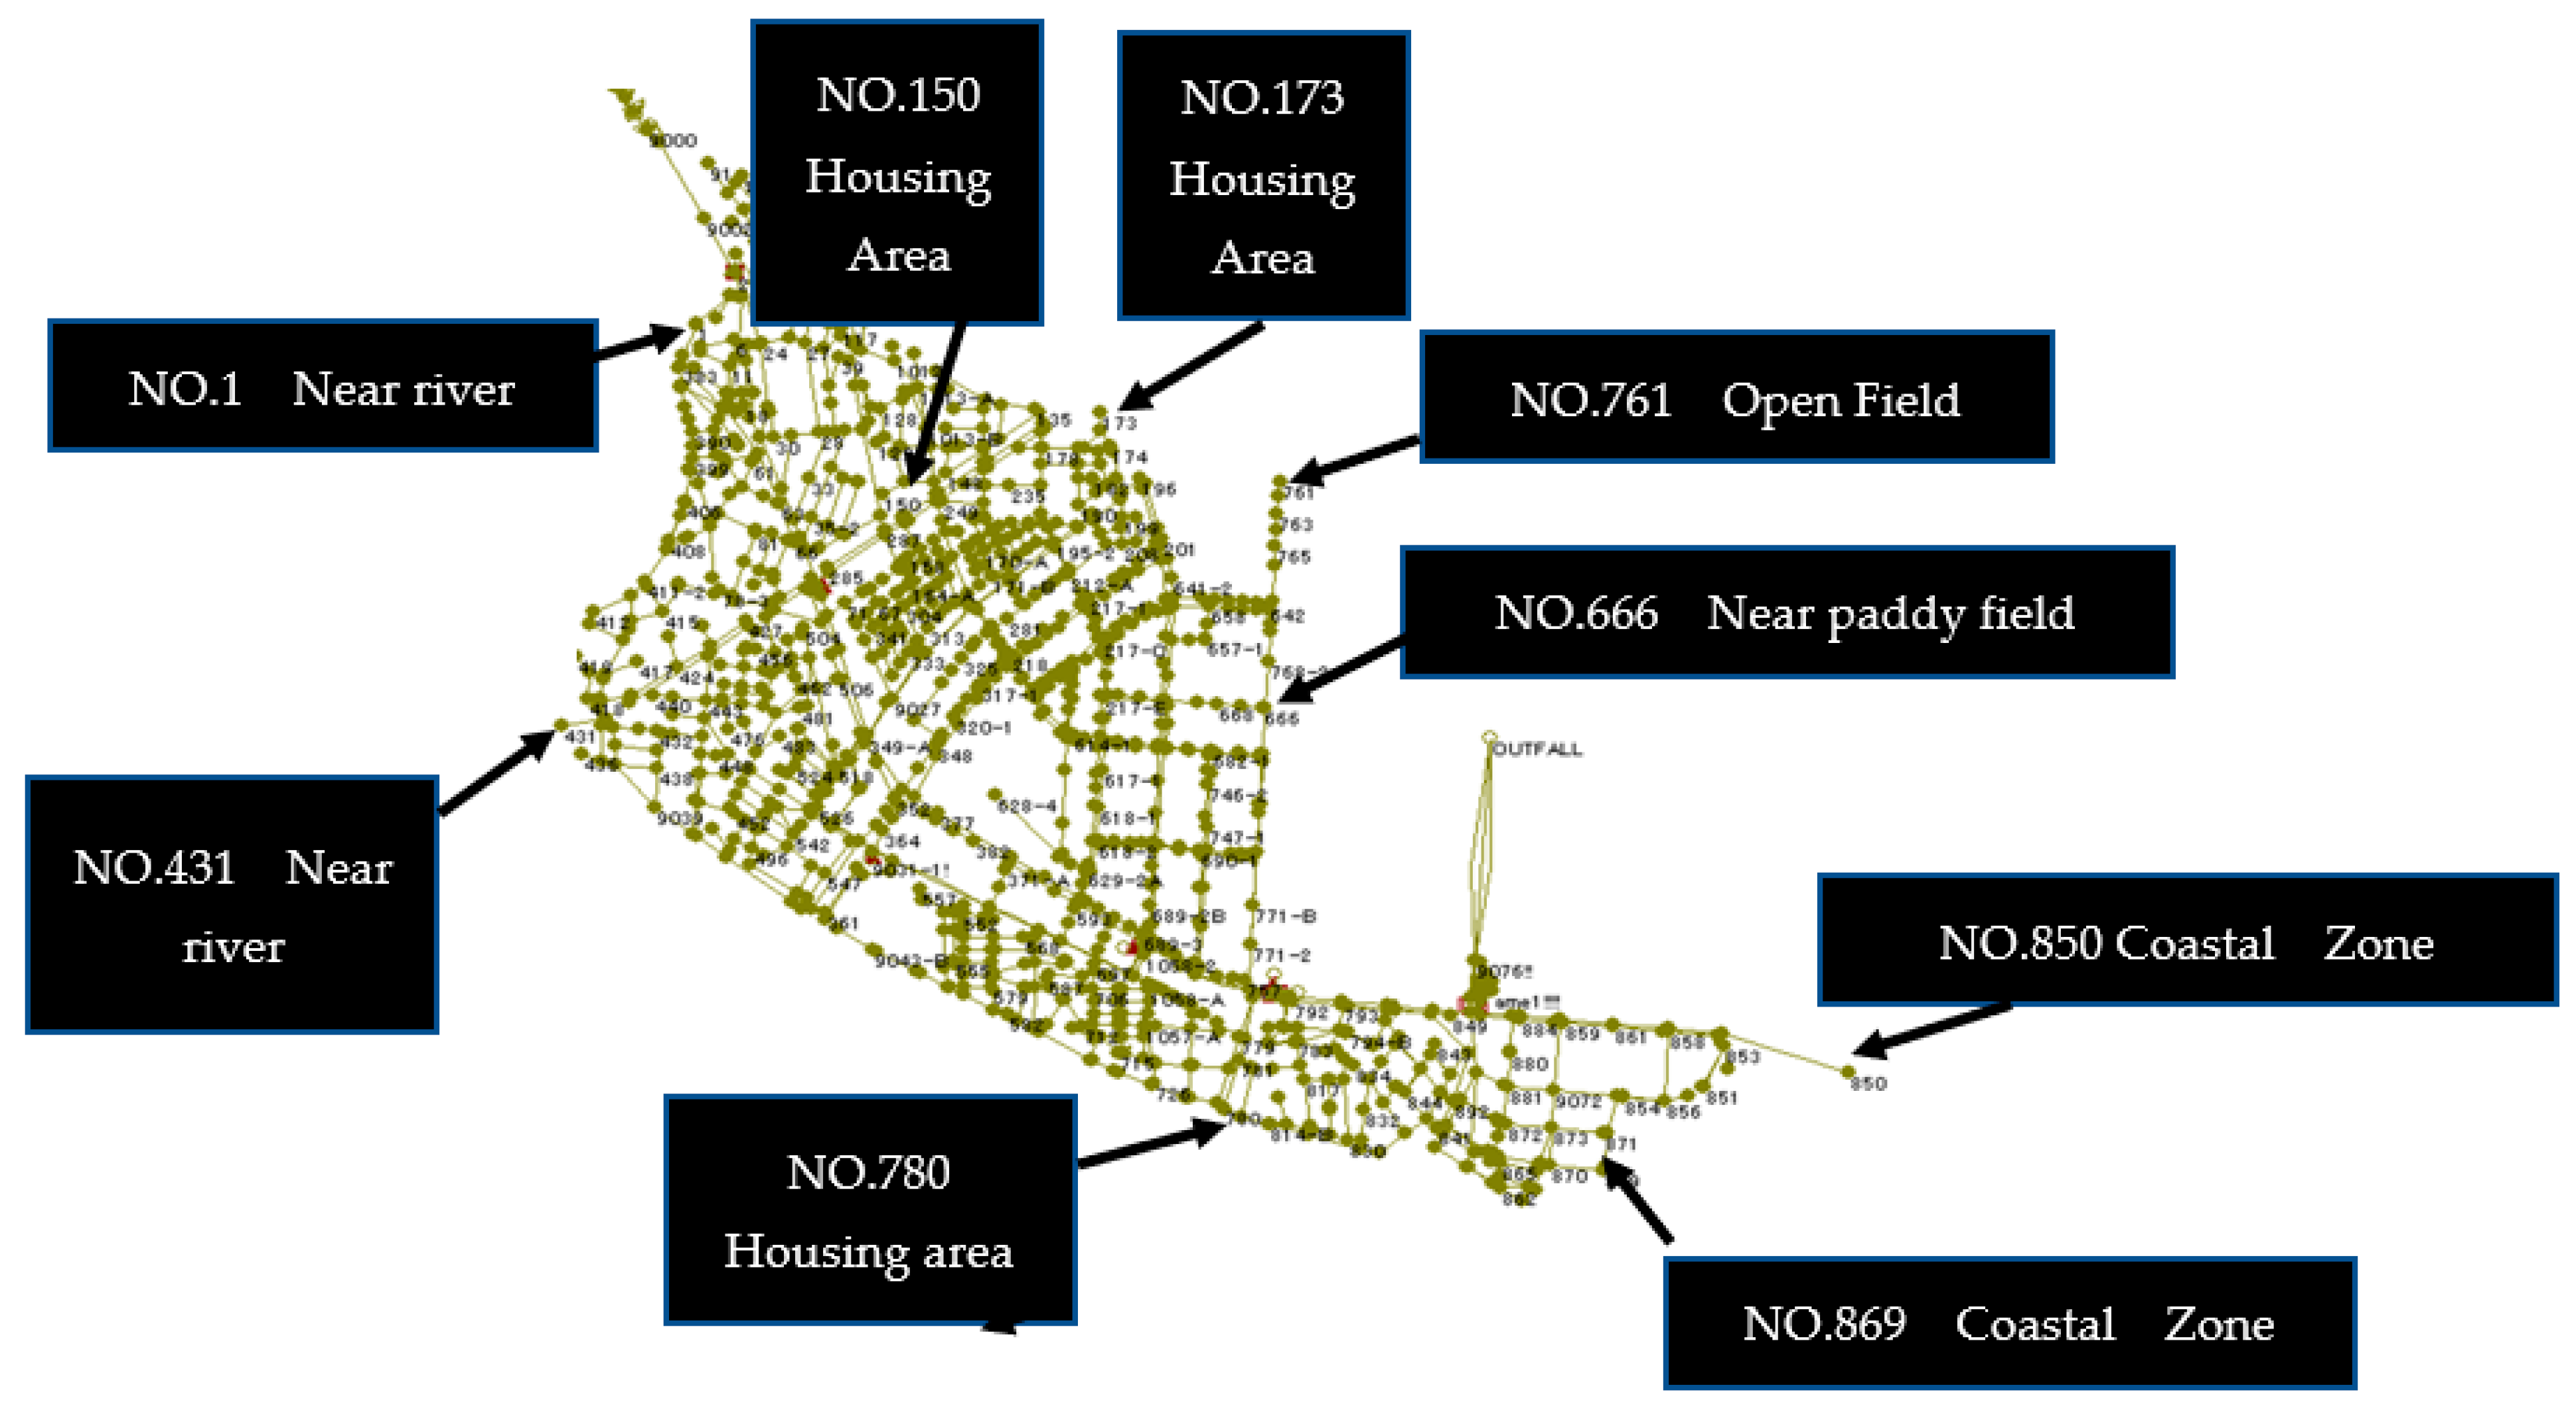
6. Effectiveness of the Porous Concrete Plates Placed at the Bottom of the Inlets Based on Calculations Using Infoworks ICM (Innovyze)

The magnitude of infiltration for a 1 ha catchment at 20 discrete street stormwater inlets where the porous concrete plates were deployed was estimated using the author’s own simulation results.
Firstly, the density of the stormwater inlets in the catchment needed to be estimated. In Japan, the density of the street stormwater inlets is 10–30/ha (20 in Harada and Komuro [37]); therefore, in this study, a value of 20 was used for the inlet density in 1 ha. Using the maximum adsorption capacity of Zn, by the cube (Figure 8) [37], the duration that the Zn runoff did not occur was estimated at about 41 years [37]. By obtaining the EMC values, a more precise duration could be calculated.
Assuming that the bottom plate was circular with a bottom thickness of 10 cm and side walls that were 10 cm thick with a 10 cm water level, while the average diameter of all stormwater inlets was set as 1.8 m, the area of the porous concrete at 1 inlet would correspond to 31,086 cm2. Thus, for the 1100 inlets in the Fukumuro catchment (Figure 12, the 9 inlets are the ones selected to conduct the passage proportion of water via porous concrete, as mentioned in Section 8), the area of the permeable media was estimated as 3419.5 m2. This area corresponds only to 0.04% of the catchment area (ca. 900 ha). Using Infoworks ICM (Innovyze) [56,57], Harada and Kim [36] showed that mitigation of the inundation occurrence happened following a 68.5 mm rainfall event in the Fukumuro catchment.
The analyses described here show that the ability to control stormwater runoff is quite high when small and discrete infiltration is used in a catchment.

7. Verification of Exfiltration Coefficient Obtained Using Infoworks ICM

The simulation described in Section 6 assumed that the exfiltration rate (i.e., three-dimensional water seepage into the natural base soil below and around the inlets) of every street stormwater inlet was 2000 mm/h. The magnitude of the exfiltration coefficient was quite sensitive in those analyses, thus, the suitability should be examined. This examination is of the validity of the 3D to 1D conversion coefficient. Here, the author has introduced four concepts from previous studies to clarify the suitable exfiltration rate.
Firstly, based on the observed infiltration rate in the vicinity of the street stormwater inlet in the Fukumuro catchment where the natural base soil was exposed at the surface (3600 mm/h, the 3D to 1D conversion coefficient was 36 because of the saturated hydraulic conductivity of the natural base soil (sand and silt), which was 100 mm/h) [36].
Next, referring to Herath et al. [58] and Herath and Mushiake [59], the ratio of the exfiltration rate to the hydraulic conductivity from infiltration trench (q/k0 in the Fig.2 of Herath and Mushiake [59]) was considered according to the matric and gravity potential slopes and water pressure (the model domain used for the numerical simulation is shown in Fig.1 of Herath and Mushiake [59]). The Fig.1 of Herath and Mushiake [59] shows a symmetric analysis, thus, the width of the trench shown in the Fig.1 of Herath and Mushiake [59] could be replaced with the average radius of the inlets in the Fukumuro area, 0.9 m. Substituting the width of the trench as 0.9 m, and the water level, 10 cm (obtained via infoworks ICM calculations) into the Fig.2 of Herath and Mushiake [59], the author obtained the 3D to 1D conversion coefficient corresponds to ca. 100.
Blazejewski et al. (2018) [60] did not consider the matric potential slope and demonstrated a 3D to 1D conversion coefficient of 1.0–1.3 [60].
The author performed the 3D to 1D conversion coefficient sensitivity tests in Infoworks ICM by changing the coefficient to 0, 5, 10, and 20 [36]. The mitigation mentioned in Section 6 used a coefficient of 20.
The author assumed that a value of 10–20 was plausible. First, the coefficient should be larger than in Blazejewski et al. (2018) [60], thereby considering the matric and gravity potential slopes with the water head. Moreover, the coefficient should be smaller than that shown by the author’s observed value of 36 (where the soil was dry) because the natural base soil around the street stormwater inlets should be wet, whereby the design runoff ratio of the Fukumuro area was 0.40 [36].

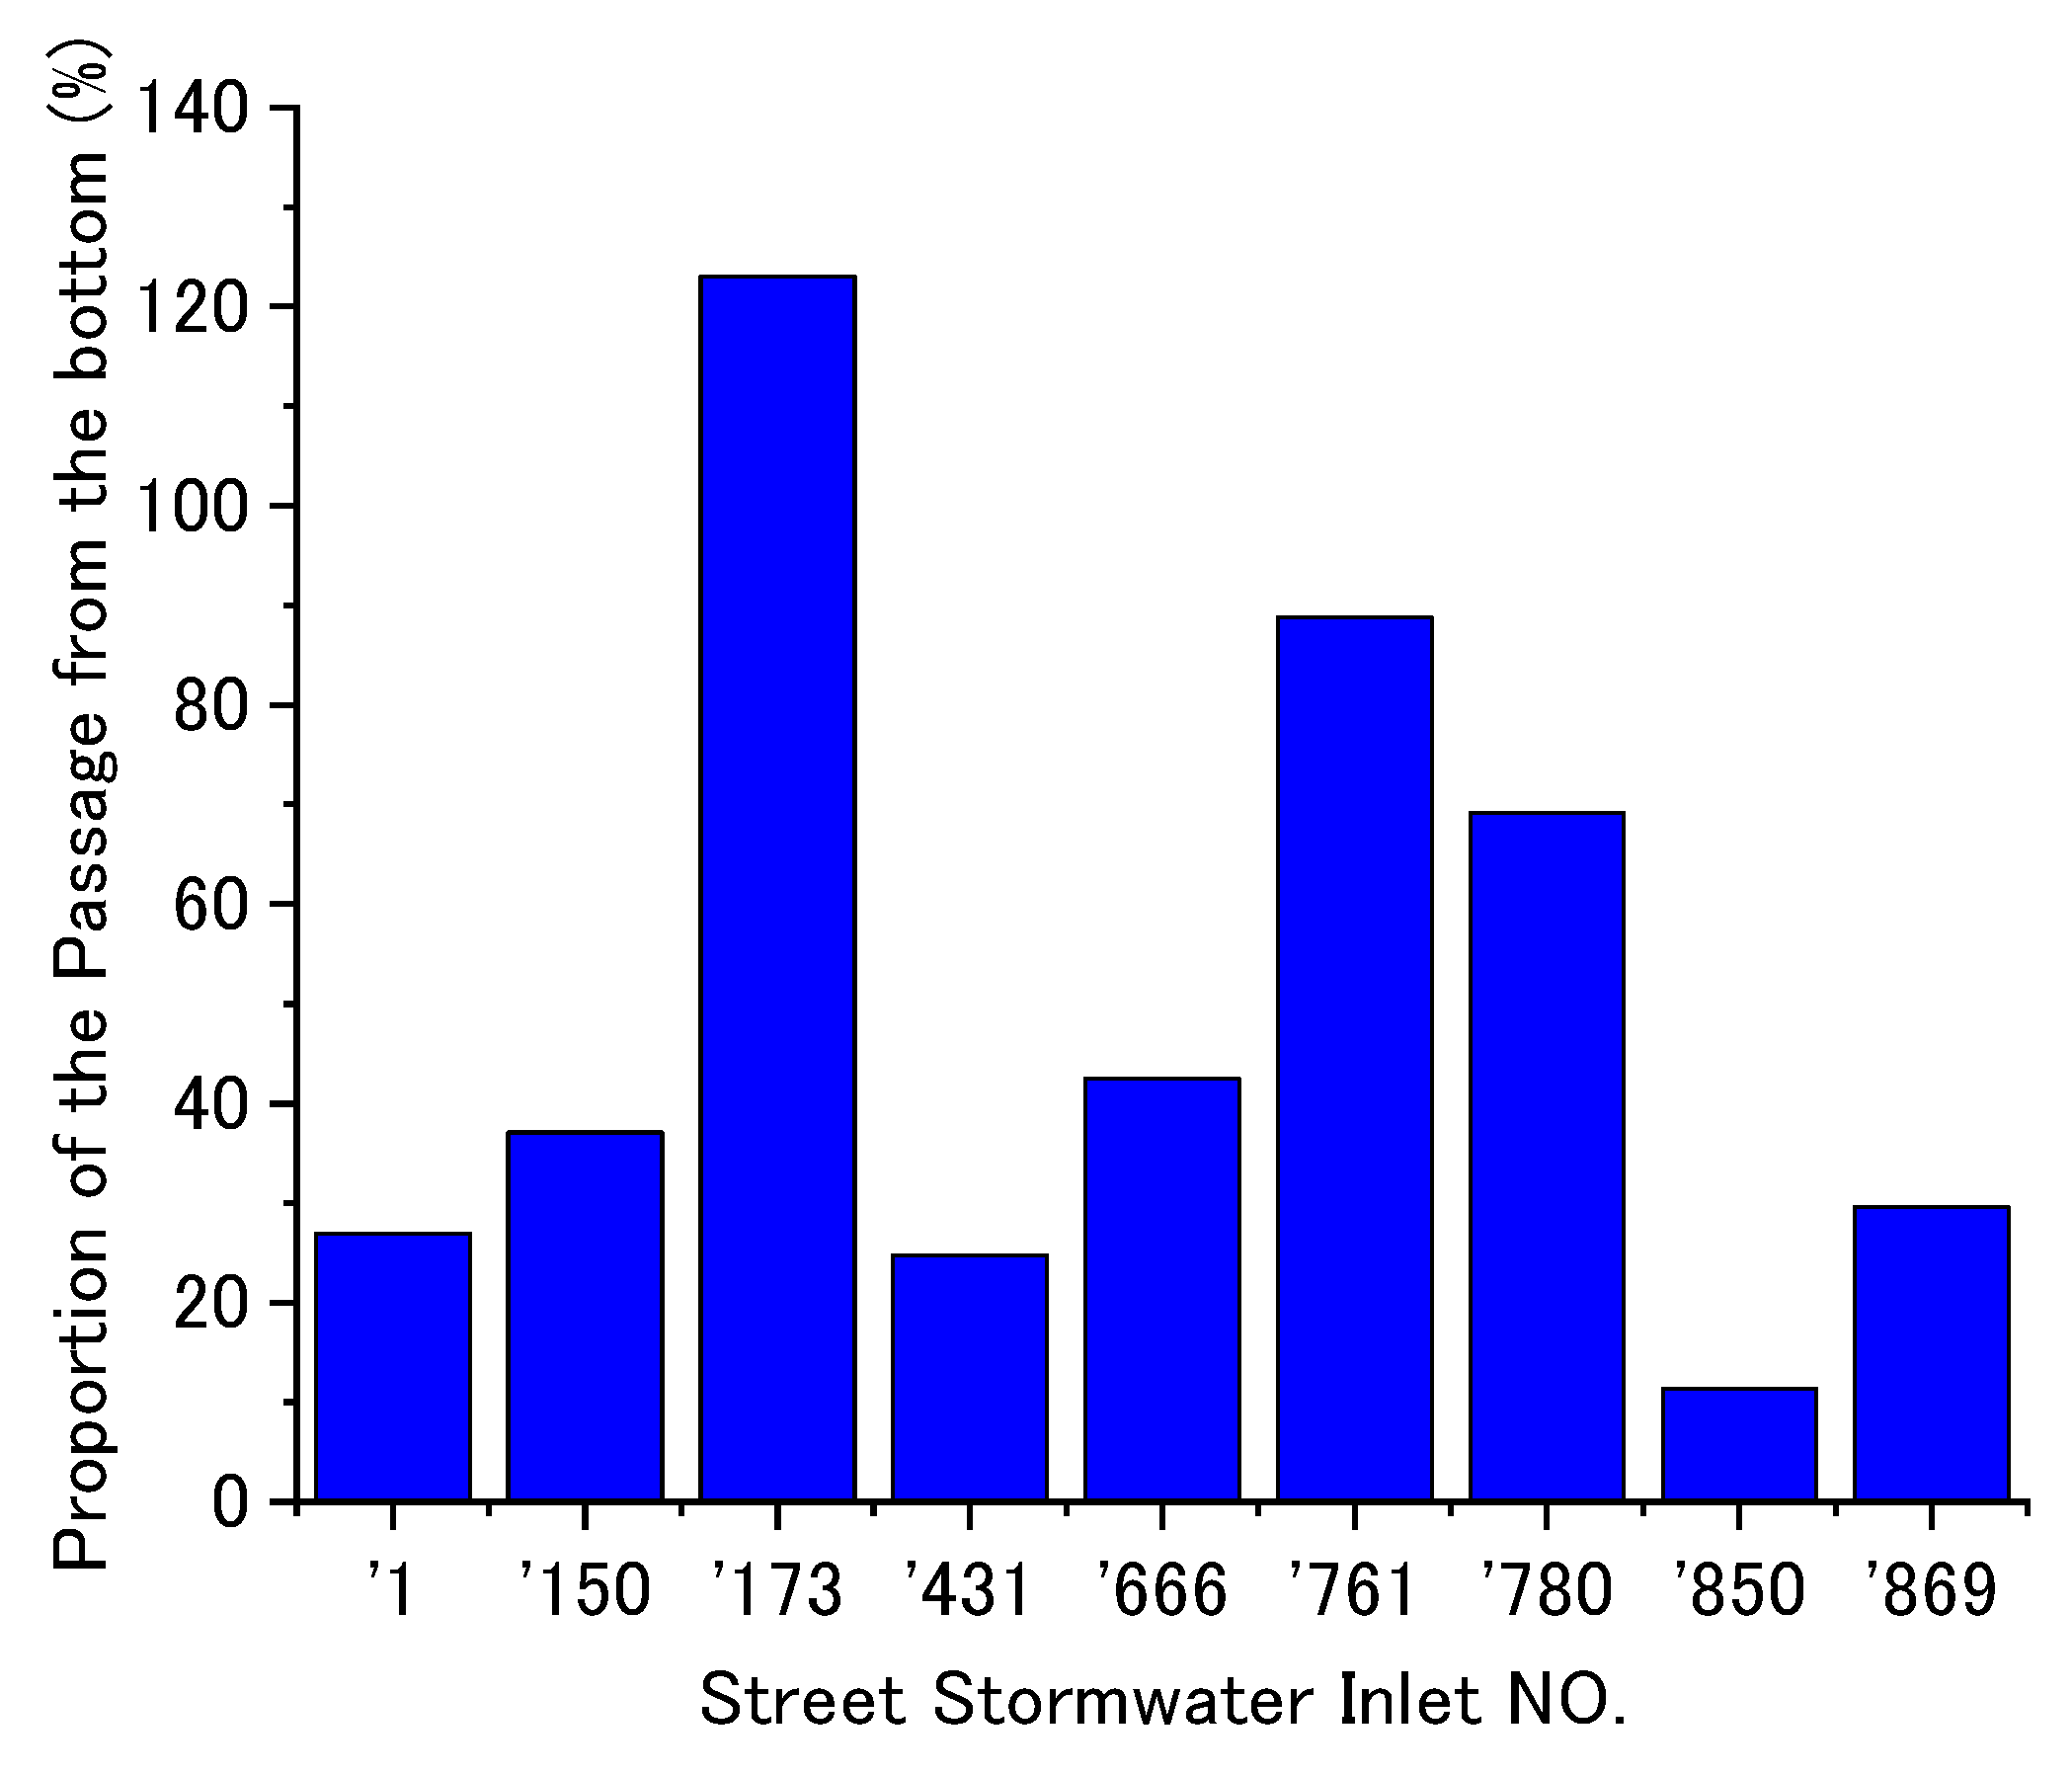
8. Proportion of Water Passing through the Porous Concrete Plates at the Bottom of the Street Stormwater Inlets to the Total Volume of Inflow Based on Estimates Calculated Using Infoworks ICM (Innovyze)

The author analyzed the proportion of water passage through the porous concrete at the bottom and the side walls of the street stormwater inlets, using alternative 3D to 1D conversion coefficients of 0, 5, 10, 15, and 20 and simultaneously changing the rainfall volume to 1, 3, and 5 mm. The proportions of water passage through the porous concrete column were calculated as the “volume of water exfiltrated into the soil from the street stormwater inlets” divided by “the volume of water that enters the street stormwater inlets” multiplied by 100 (%). The proportions at the 9 street stormwater inlets in the Fukumuro area (Figure 12) during 3 mm of rainfall, when the 3D to 1D conversion coefficient was 10 using Infoworks ICM (Innovyze) [56,57], is shown in Figure 13.
Figure 13 shows the passage proportion of the water through the porous concrete at the bottom and side walls of the inlets. The proportions varied from about 10% to 88%, excluding the proportion at the inlet of 173, meaning that the calculations there showed that these numerical analyses were unsuitable. The proportions were inversely related to the increasing rainfall volume and related to the increasing 3D to 1D conversion coefficient. However, reaching 100% was uncommon, even though heavy metal removal was expected as the proportions increased. Thus, the author proposed using a hanging-type porous concrete plate, shown in Figure 14. This configuration of which has already been deployed in Sendai.

9. Conclusions and Future Work

The present study reported the results of the author’s monitoring of heavy metal concentrations in urban road runoffs. Indoor experiments were conducted to analyze the adsorption of heavy metals by porous concrete. In addition, the study also examined the amount of runoff that could be treated in stormwater drains fitted with porous concrete filters. While Section 2 presented some of the behavior of non-point heavy metals, there remains a need to explain them in terms of environmental factors using statistical analyses, as highlighted by Ozaki et al. [51,52]. It is recommended that the EMC values should be corrected, and improvements be made to the 3D/1D conversion methods.

Funding

This research was funded by Japan Science and Technology Agency grant number [JPMJTM20BK], Fukushima University Research Fund grant number [262q006], Miyagi University Research Funds and KC Miyagi Research Fund 2019.

Data Availability Statement

Not applicable.

Conflicts of Interest

The author declares no conflict of interest.

References

  1. Fletcher, T.; Duncan, H.; Poelsma, P.; Lloyd, S. Stormwater Flow and Quality, and the Effectiveness of Non-Proprietary Stormwater Treatment Measures—A Review and Gap Analysis; Technical Report 04/8; Cooperative Research Center for Catchment Hydrology: Melbourne, Australia, 2004. [Google Scholar]
  2. Shinya, M. Non-point pollution. Seikatsu Eisei 2008, 52, 87–97, (In Japanese with English Abstract). [Google Scholar]
  3. Marsalek, J.; Ng, H. Evaluation of Pollution Loadings from Urban Nonpoint Sources: Methodology and Applications. J. Great Lakes Res. 1989, 15, 444–451. [Google Scholar] [CrossRef]
  4. Marsalek, J. Evaluation of Pollutant Loads from Urban Nonpoint Sources. Water Sci. Technol. 1990, 22, 23–30. [Google Scholar] [CrossRef]
  5. Brett, M.T.; Arhonditsis, G.B.; Mueller, S.E.; Hartley, D.M.; Frodge, J.D.; Funke, D.E. Non-Point-Source Impacts on Stream Nutrient Concentrations Along a Forest to Urban Gradient. Environ. Manag. 2005, 35, 330–342. [Google Scholar] [CrossRef] [PubMed]
  6. Wada, K.; Fujii, S. Characterization of Stormwater Runoff Processes from Urban Roadways. J. Jpn. Soc. Water Environ. 2006, 29, 699–704, (In Japanese with English Abstract). [Google Scholar] [CrossRef]
  7. Wada, Y.; Miura, H. Characterization and Control of Runoff Pollution Loads in Catchment Area of the Lake. J. Jpn. Soc. Water Environ. 1996, 19, 161–169, (In Japanese with English Abstract). [Google Scholar] [CrossRef]
  8. Zgheib, S.; Moileron, R.; Saad, M.; Chebbo, G. Partition of pollution between dissolved and particulate phases: What about emerging substances in urban stormwater catchments? Water Res. 2011, 43, 913–925. [Google Scholar] [CrossRef]
  9. Katsumi, N.; Kusube, T.; Nagao, S.; Okochi, H. The role of coated fertilizer used in paddy fields as a source of microplastics in the marine environment. Mar. Pollut. Bull. 2020, 161, 111727. [Google Scholar] [CrossRef]
  10. Katsumi, N.; Kusube, T.; Nagao, S.; Okochi, H. Accumulation of microcapsules derived from coated fer fields. Chemosphere 2021, 267, 129185. [Google Scholar] [CrossRef]
  11. Katsumi, N.; Kusube, T.; Nagao, S.; Okochi, H. The input–output balance of microplastics derived from coated fertilizer in paddy fields and the timing of their discharge during the irrigation season. Chemosphere 2021, 279, 130574. [Google Scholar] [CrossRef]
  12. Gjessing, E.; Lygren, E.; Berglind, L.; Gulbrandsen, T.; Skanne, R. Effect of highway runoff on lake water quality. Sci. Total. Environ. 1984, 33, 245–257. [Google Scholar] [CrossRef]
  13. Shinya, M.; Tsuchinaga, T.; Kitano, M.; Yamada, Y.; Ishikawa, M. Characterization of heavy metals and polycyclic aromatic hydrocarbons in urban highway runoff. Water Sci. Technol. 2000, 42, 201–208. [Google Scholar] [CrossRef]
  14. Sansalone, J.J.; Buchberger, S.G. Partitioning and First Flush of Metals in Urban Roadway Storm Water. J. Environ. Eng. 1997, 123, 134–143. [Google Scholar] [CrossRef]
  15. Pitt, R.; Field, R.; Lalor, M.; Brown, M. Urban stormwater toxic pollutants assessment, sources, and treatability. Water Environ. Res. 1995, 67, 260–275. [Google Scholar] [CrossRef]
  16. Murakami, M.; Fujita, M.; Furumai, H.; Kasuga, I.; Kurisu, F. Sorption behavior of heavy metal species by soakaway sediment receiving urban road runoff from residential and heavily trafficked areas. J. Hazard. Mater. 2009, 164, 707–712. [Google Scholar] [CrossRef] [PubMed]
  17. Murakami, M.; Nakajima, F.; Furumai, H. The sorption of heavy metal species by sediments in soakaways receiving urban road runoff. Chemosphere 2008, 70, 2099–2109. [Google Scholar] [CrossRef]
  18. Kumar, M.; Furumai, H.; Kurisu, F.; Kasuga, I. Potential mobility of heavy metals through coupled application of sequential extraction and isotopic exchange: Comparison of leaching tests applied to soil and soakaway sediment. Chemosphere 2013, 90, 796–804. [Google Scholar] [CrossRef]
  19. Kumar, M.; Furumai, H.; Kurisu, F.; Kasuga, I. Tracing source and distribution of heavy metals in road dust, soil and soakaway sediment through speciation and isotopic fingerprinting. Geoderma 2013, 211–212, 8–17. [Google Scholar] [CrossRef]
  20. Ozaki, H.; Watanabe, I.; Kuno, K. Investigation of the Heavy Metal Sources in Relation to Automobiles. Water Air Soil Pollut. 2004, 157, 209–223. [Google Scholar] [CrossRef]
  21. Root, R.A. Lead loading of urban streets by motor vehicle wheel weights, Environ. Health Perspect. 2000, 108, 937–940. [Google Scholar] [CrossRef]
  22. Westerlund, K.G. Metal Emissions from Stockholm Traffic-Wear of Brake Linings; Report SLB Analysis No.3; Stockholm Environment and Health Protection Administration: Stockholm, Sweden, 2001. [Google Scholar]
  23. Adach, K.; Tainosho, Y. Single particle characterization of size-fractionated road sediments. Appl. Geochem. 2005, 20, 849–859. [Google Scholar] [CrossRef]
  24. Gray, S.R.; Becker, N.S.C. Contaminant flows in urban residential water systems. Urban Water 2002, 4, 331–346. [Google Scholar] [CrossRef]
  25. Rijstenbil, J.W.; Poortvliet, T.C.W. Copper and zinc in estuarine water: Chemical speciation in relation to bioavailability to the marine planktonic diatom Ditylum Brightwellii. Environ. Toxicol. Chem. 1992, 11, 1615–1625. [Google Scholar] [CrossRef]
  26. Borgmann, U. Interactive Effects of Metals in Mixtures on Biomass Production Kinetics of Freshwater Copepods. Can. J. Fish. Aquat. Sci. 1980, 37, 1295–1302. [Google Scholar] [CrossRef]
  27. Enserink, E.; Maas-Diepeveen, J.; Van Leeuwen, C. Combined effects of metals; an ecotoxicological evaluation. Water Res. 1991, 25, 679–687. [Google Scholar] [CrossRef]
  28. Watanabe, H.; Nakajima, F.; Kasuga, I.; Furumai, H. Application of whole sediment toxicity identification evaluation proce-dures to road dust using a benthic ostracod Heterocypris incongruens. Ecotoxicol. Environ. Saf. 2013, 89, 245–251. [Google Scholar] [CrossRef]
  29. Watanabe, H.; Nakajima, F.; Kasuga, I.; Furumai, H. Toxicity evaluation of road dust in the runoff process using a benthic ostracod Heterocypris incongruens. Sci. Total. Environ. 2011, 409, 2366–2372. [Google Scholar] [CrossRef]
  30. Mikkelsen, P.S.; Jacobsen, P.; Fujita, S. Infiltration practice for control of urban stormwater. J. Hydraul. Res. 1996, 34, 827–840. [Google Scholar] [CrossRef]
  31. Mikkelsen, P.; Häfliger, M.; Ochs, M.; Tjell, J.; Jacobsen, P.; Boller, M. Experimental assessment of soil and groundwater contamination from two old infiltration systems for road run-off in Switzerland. Sci. Total Environ. 1996, 189–190, 341–347. [Google Scholar] [CrossRef]
  32. Bardin, J.-P.; Barraud, S.; Alfakih, E.; Dechesne, M. Performance Assessment of Stormwater Infiltration Strategies: A Multi-Indicator Approach. In Proceedings of the 9th International Conference on Urban Drainage, Portland, OR, USA, 8–13 September 2002; CD-ROM. ASCE Publications: Reston, VA, USA, 2002. [Google Scholar] [CrossRef]
  33. Goebel, P.; Fach, S.; Kories, H.; Geiger, W.F.; Coldewey, W.G. Effects of Stormwater Infiltration on the Water Balance of an Urban Area. In Proceedings of the 9th International Conference on Urban Drainage, Portland, OR, USA, 8–13 September 2002; CD-ROM. ASCE Publications: Reston, VA, USA, 2002. [Google Scholar] [CrossRef]
  34. Datry, T.; Malard, F.; Vitry, L.; Hervant, F.; Gibert, J. Solute dynamics in the bed sediments of a stormwater infiltration basin. J. Hydrol. 2003, 273, 217–233. [Google Scholar] [CrossRef]
  35. Legret, M.; Colandini, V. Effects of a porous pavement with reservoir structure on runoff water: Water quality and fate of heavy metals. Water Sci. Technol. 1999, 39, 111–117. [Google Scholar] [CrossRef]
  36. Harada, S.; Kim, J. Application of infiltration technic for residential zone in agricultural area. Water Land Environ. Eng. 2014, 82, 301–304. [Google Scholar]
  37. Harada, S.; Komuro, Y. Decrease of heavy metal non-point runoff using porous concrete. Trans. JSIDRE 2009, 264, 81–82. (In Japanese) [Google Scholar]
  38. Harada, S.; Komuro, Y. Decrease of non-point zinc runoff using porous concrete. Chemosphere 2010, 78, 488–491. [Google Scholar] [CrossRef]
  39. Harada, S.; Yanbe, M. Adsorption by and artificial release of zinc and lead from porous concrete for recycling of adsorbed zinc and lead and of porous concrete to reduce urban non-point heavy metal runoff. Chemosphere 2018, 197, 451–456. [Google Scholar] [CrossRef]
  40. Harada, S.; Kitatusji, M.; Onodera, S. Reducing Non-Point Heavy Metal Runoff from Urban Catchment Using Porous Concrete Filters in Storm Sewer Catch Basins and Manholes. In Proceedings of the DIPCON/ARC-2014, Kyoto, Japan, 3–4 September 2014. [Google Scholar]
  41. United States Environmental Protection Agency. National Management Measures to Control Nonpoint Source Pollution from Urban Area; United States Environmental Protection Agency: Washington, DC, USA, 2005.
  42. Fletcher, T.D.; Shuster, W.; Hunt, W.F.; Ashley, R.; Butler, D.; Arthur, S.; Trowsdale, S.; Barraud, S.; Semadeni-Davies, A.; Bertrand-Krajewski, J.L.; et al. SUDS, LID, BMPs, WSUD and more—The evolution and application of terminology surrounding urban drainage. Urban Water J. 2015, 12, 525–542. [Google Scholar] [CrossRef]
  43. Fujita, S. Experimental sewer system for reduction of urban storm runoff. Proc. Environ. Sani. Eng. Res. 1986, 22, 175–185, (In Japanese with English Abstract). [Google Scholar]
  44. Hijioka, Y.; Furumai, H. Long-Term Runoff Monitoring of Urban Nonpoint Pollution Load in a Separate Sewer System using Autosampler and Monitoring Devices. J. Jpn. Soc. Water Environ. 2003, 26, 237–242. [Google Scholar] [CrossRef]
  45. Al Mamun, A.; Shams, S. Nuruzzaman Review on uncertainty of the first-flush phenomenon in diffuse pollution control. Appl. Water Sci. 2020, 10, 525–542. [Google Scholar] [CrossRef]
  46. Maniquiz-Redillas, M.; Robles, M.E.; Cruz, G.; Reyes, N.J.; Kim, L.-H. First Flush Stormwater Runoff in Urban Catchments: A Bibliometric and Comprehensive Review. Hydrology 2022, 9, 63. [Google Scholar] [CrossRef]
  47. Kojima, K.; Sano, S.; Furumai, H. Contributions of Road Surface Deposits and Atmospheric Deposition to Heavy-Metal and Nitrogen Contamination by Road Runoff in a Residential Area. J. Jpn. Soc. Water Environ. 2012, 35, 119–126. [Google Scholar] [CrossRef]
  48. Murakami, M. Adsorption and Desorption of Heavy Metals in Infiltration Facilities Receiving Urban Runoff. Ph.D. Thesis, Tokyo University, Tokyo, Japan, 2006; p. 17. [Google Scholar]
  49. Flores-Rodríguez, J.; Bussy, A.-L.; Thevenot, D. Toxic Metals in Urban Runoff: Physico-Chemical Mobility Assessment Using Speciation Schemes. Water Sci. Technol. 1994, 29, 83–93. [Google Scholar] [CrossRef]
  50. Mikkelsen, P.S.; Weyer, G.; Berry, C.; Waldent, Y.; Colandini, V.; Poulsen, S.; Grotehusmann, D.; Rohlfing, R. Pollution from Urban Stormwater Infiltration. Water Sci. Technol. 1994, 29, 293–302. [Google Scholar] [CrossRef]
  51. Ozaki, N.; Wada, K.; Murakami, M.; Nakajima, F.; Furumai, H. Prediction and its Reliability Evaluation of Urban Non-point Pollution Loading by Statistical Analysis of the Data of Published Researches. J. Jpn. Soc. Water Environ. 2017, 40, 115–124. [Google Scholar] [CrossRef]
  52. Ozaki, N.; Wada, K.; Murakami, M.; Nakajima, F.; Furumai, H. Prediction of Urban Non-point Pollution Load by Statistical Analysis of Data of Published Research and Its Reliability Evaluation –Statistical Analysis of Mean Load and Verification and Modification of Previously Proposed Model Using Newly Obtained Data. J. Jpn. Soc. Water Environ. 2021, 44, 1–8. [Google Scholar] [CrossRef]
  53. Harada, S.; Ichikawa, A. Mitigating peak discharge of urban overland surface runoff using drainage infiltration strata. In Proceedings of the 5th International Conference on Ultrafast Structural Dynamics (ICUSD), Daejeon, Republic of Korea, 25–28 June 1989; Volume 5, pp. 821–826. [Google Scholar]
  54. Harada, S.; Ichikawa, A. Performance of water infiltrated within infiltration strata and Kanto loam taking into account hysteresis. J. Nat. Disaster Sci. 1990, 12, 21–35. [Google Scholar]
  55. Harada, S.; Ichikawa, A. Performance of the Drainage Infiltration Strata: Statistical and Numerical Analyses. Water Sci. Technol. 1994, 29, 255–265. [Google Scholar] [CrossRef]
  56. Harada, S.; Endo, K. Application of urban hydrological model for prediction of runoff from agriculture dominated area. Inter. J. Latest Res. Sci. Technol. 2013, 2, 44–48. [Google Scholar]
  57. Harada, S.; Sato, I. Evaluation of Exfiltration Rates at the Bottom of Manholes at an Urbanized Area Using Infoworks. Inter. J. Latest Res. Sci. Technol. 2015, 4, 134–137. [Google Scholar]
  58. Herath, S.; Musiake, K.; Hironaka, S. Field Estimation of Saturated Conductivity Using Borehole Test: Effect of Unsaturated Flow and Soil Anisotropy. Annu. J. Hydraul. Eng. (JSCE) 1992, 36, 435–440. [Google Scholar] [CrossRef]
  59. Herath, S.; Musiake, K. Simulation of Basin Scale Runoff Reduction by Infiltration Systems. Water Sci. Technol. 1994, 29, 267–275. [Google Scholar] [CrossRef]
  60. Blazejewski, R.; Nieć, J.; Murat-Błażejewska, S.; Zawadzki, P. Comparison of infiltration models with regard to design of rectangular infiltration trenches. Hydrol. Sci. J. 2018, 63, 1707–1716. [Google Scholar] [CrossRef]
Figure 1. Study site and the street stormwater inlet.
Water 15 01998 g001
Figure 2. Inside the street stormwater inlet.
Water 15 01998 g002
Figure 3. Water collection device.
Water 15 01998 g003
Figure 4. Frequency of the daily rainfall volume focusing on 0.5–10 mm events in Sendai (1985–1990).
Water 15 01998 g004
Figure 5. Frequency of the daily rainfall volume focusing on 0.5–10 mm events in Sendai (2015–2019).
Water 15 01998 g005
Figure 6. Collected water after shaking to resuspend the particulate matter.
Water 15 01998 g006
Figure 7. Experimental porous concrete column measuring 10 cm in diameter and 10 cm in depth.
Water 15 01998 g007
Figure 8. Porous concrete cube with each side measuring 4 cm.
Water 15 01998 g008
Figure 9. Porous concrete plate at the bottom of the street stormwater inlet.
Water 15 01998 g009
Figure 10. Schematic diagram showing the behavior of water through the porous concrete when placed only at the bottoms of street stormwater inlets.
Water 15 01998 g010
Figure 11. Leachate experiments.
Water 15 01998 g011
Figure 12. Fukumuro catchment and the nine sewage traps used in the study.
Water 15 01998 g012
Figure 13. The proportion of the passage of the porous concrete at the bottom of the sewage traps in case the rainfall volume is 3mm and the exfiltration rate is 1500 mm/h.
Water 15 01998 g013
Figure 14. Hanging-type placement of the porous concrete at the same inlet as the one shown in Figure 1. The grating is open. Closing the grating results in the porous concrete board assuming a horizontal orientation.
Water 15 01998 g014
Table 1. Features of the samples collected 18 May to 19 December in 2019 and qualities (SS, particulate and dissolved heavy metals).
Sampling DateSettled DateAntecedent Dry Weather DaysSSGF/B
Filtration
CrCuZnCdPb
(mg/L)(ppb)(ppb)(ppb)(ppb)(ppb)
18 May--------------------0.289 None29.88 49.27 395.47 0.22 17.35
Done16.32 6.37 73.47 0.04 0.94
25 May18 May30.051 None18.30 16.94 178.23 0.08 3.00
Done15.17 12.36 109.46 0.04 0.83
7 Jun.25 May40.414None21.60 55.88 578.17 0.30 38.38
Done14.70 8.38 116.56 0.05 1.36
9 Jun.7 Jun.00.122None19.87 31.03 246.51 0.15 12.78
Done14.89 16.10 107.69 0.06 2.16
29 Jun.9 Jun.20.382None19.57 23.19 337.92 0.18 11.21
Done14.53 5.41 92.99 0.05 0.19
6 Jul.29 Jun. 00.187None4.07 18.60 169.89 7.02
Done0.95 8.04 85.29 1.10
19 Jul.6 Jul.00.162None 32.93 374.60 0.49 8.92
Done 10.32 162.52 0.32 0.71
28 Jul.19 Jul.00.837None12.05 46.10 914.82 0.79 27.26
Done0.92 6.99 87.31 0.75 1.29
30 Jul.28 Jul.00.511None20.34 58.15 615.98 0.67 31.01
Done2.56 4.60 29.34 0.17 1.10
10 Aug.30 Jul.90.151 None 88.85 487.80 1.94 14.50
Done 6.53 240.23 0.17 1.78
23 Aug.10 Aug. 20.128None 38.47 0.71 13.25
Done 7.92 0.18 0.38
31 Aug.23 Aug.40.872None28.27 131.21 1385.67 2.04 69.69
Done3.26 7.20 138.00 0.21 0.13
26 Sep.31 Aug.10.187 None10.73 40.34 413.30 0.44 20.73
Done2.22 5.44 84.48 0.07 0.99
10 Oct.26 Sep.30.731None15.97 51.42 806.82 0.65
Done2.54 5.52 249.62 0.13
6 Dec.10 Oct.231.097 None28.68 81.86 833.19 0.57
Done2.70 8.48 76.93 0.05
19 Dec.6 Dec.110.334 None22.36 53.44 632.71 0.50 18.80
Done14.79 17.99 334.95 0.16 0.44
Table 2. Proportions of particulate heavy metal to total heavy metal in the samples shown in the Table 1.
Sampling DateCrCuZnCdPb
(%)(%)(%)(%)(%)
18 May 45.38 87.07 81.42 81.15 94.60
26 May 17.11 27.02 38.58 44.72 72.40
7 Jun. 31.94 85.01 79.84 81.63 96.45
9 Jun. 25.03 48.11 56.32 58.67 83.11
29 Jun. 25.74 76.67 72.48 71.03 98.28
6 Jul. 76.57 56.81 49.80 84.28
19 Jul. 68.66 56.62 34.18 92.07
28 Jul. 92.36 84.84 90.46 4.39 95.28
30 Jul. 87.42 92.10 95.24 75.02 96.44
10 Aug. 92.65 50.75 91.03 87.70
23 Aug. 79.41 75.07 97.15
31 Aug. 88.46 94.51 90.04 89.58
26 Sep. 79.28 86.50 79.56 83.19 95.20
1 Nov. 84.10 89.26 69.06 79.86
6 Dec. 90.57 89.65 90.77 90.62
19 Dec. 33.86 66.33 47.06 68.60 97.67
Average59.83 76.54 69.87 68.58 91.59
Table 3. Twelve experimental runs for the leachate experiments.
RUNColumnExperiment TimingHeavy Metal Concentration (ppb)
PbZnCu
1-1CJanuary 20091500--------------------------------
1-2CJanuary 2009----------------580----------------
1-3CJanuary 2009--------------------------------4150
2-1CDecember 201721--------------------------------
2-2CDecember 2017----------------53----------------
2-3CDecember 2017--------------------------------42
3-1CApril 201855--------------------------------
3-2CApril 2018----------------66----------------
3-3CApril 2018--------------------------------22
4-1NApril 2018--------------------------------22
5CApril 201810257
6NApril 2018
Table 4. Proportion of heavy metals adsorbed by the columns.
RUNAdsorption Proportion (%)
PbZnCu
1-183.1--------------------------------
1-2----------------66.6----------------
1-3--------------------------------69.6
2-184.9--------------------------------
2-2----------------77.1----------------
2-3--------------------------------66.6
3-187.9--------------------------------
3-2----------------63.2----------------
3-3--------------------------------69.6
4-1--------------------------------70.2
580.560.273.0
685.864.452.6
Disclaimer/Publisher’s Note: The statements, opinions and data contained in all publications are solely those of the individual author(s) and contributor(s) and not of MDPI and/or the editor(s). MDPI and/or the editor(s) disclaim responsibility for any injury to people or property resulting from any ideas, methods, instructions or products referred to in the content.

