Article

A Novel Layered and Advanced Nitrogen Removal Filter with Gravel and Embedded Bio-Organic Carrier Based on Autotrophic and Heterotrophic Pathways

1
School of Water Conservancy and Civil Engineering, Zhengzhou University, Zhengzhou 450001, China
2
Zhengzhou Multi-Functional Design and Research Academy Co., Ltd., Zhengzhou 450001, China
3
School of Ecology and Environment, Zhengzhou University, Zhengzhou 450001, China
*
Author to whom correspondence should be addressed.
Water 2023, 15(10), 1919; https://doi.org/10.3390/w15101919
Submission received: 13 April 2023 / Revised: 2 May 2023 / Accepted: 16 May 2023 / Published: 18 May 2023
(This article belongs to the Special Issue Biological Treatment of Sewage and Resource Utilization of Sludge)

Abstract

:
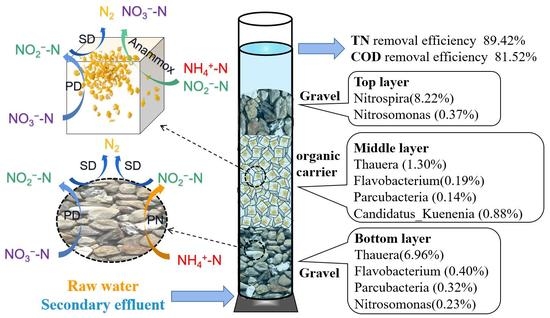
Given increasingly prominent environmental issues, there is a pressing need to satisfy more stringent emission standards for wastewater treatment plants (WWTP) while concurrently prioritizing energy conservation; a new up-flow layered nitrogen removal filter was constructed on a laboratory scale using gravel (for the bottom and top layers) and embedded bio-organic carriers (for the middle layer) containing microorganisms as fillers to treat the secondary effluent by introducing a portion of raw water. This study investigated the nitrogen removal effectiveness and transfer pathways of synthetic wastewater at varying mixing ratios, promoted the enrichment of Anammox Bacteria (AnAOB) by embedding microorganisms, and analyzed the microbial community structure using high-throughput sequencing techniques. The findings showed that the highest total nitrogen (TN) removal efficiency was achieved with chemical oxygen demand (COD), ammonia (NH4+-N), and nitrate (NO3-N) contents in the mixture at 77, 10, and 8 mg·L−1, respectively, with an average efficiency of 89.42%. NO3-N was mostly removed through denitrification (heterotrophic), while NH4+-N was eliminated by partial nitrification (PN) and anaerobic ammonium oxidation (Anammox, autotrophic). According to high-throughput sequencing results, denitrifying bacteria such as Thauera (1.30–6.96%), Flavobacterium (0.18–0.40%), and Parcubacteria (0.14–0.32%) were present in all the filter layers, and Anammox bacteria such as Candidatus_Kuenenia were predominant in the middle layer at a 0.88% abundance, with the aid of organic carriers.

Graphical Abstract

1. Introduction

High nitrogen content is a major cause of eutrophication in many bodies of water in China [1]. To reduce nitrogen pollution at the source, many urban sewage treatment plants in China have implemented the “GB18918-2016” (Discharge standard of pollutants for municipal wastewater treatment plants (WWTP)) level A discharge standard promulgated by the Ministry of Ecology and Environment of China over the last decade. However, for some poor watersheds, more stringent local discharge standards have been implemented, and since the secondary effluent is predominantly nitrate (NO3-N), it is necessary to add an additional carbon source to the WWTP to bring the effluent up to standard. Denitrification biofilters (DNBFs) are often used to purify the secondary effluent by adding an additional carbon source to remove NO3-N from the secondary effluent [2]. Unfortunately, this not only consumes sodium acetate and other chemicals and generates excessive residual sludge, but also emits large amounts of N2O during denitrification, whose greenhouse effect is 300 times greater than that of CO2 [3]. With the ongoing issue of global climate change, achieving advanced nitrogen removal while saving energy and reducing carbon emissions has become an urgent problem.
Anaerobic ammonium oxidation (Anammox), as a new type of nitrogen removal process, can save 60% of aeration energy, 100% of denitrification carbon sources, 90% of sludge production, and 100% of N2O emissions [4]; if it can be applied to the secondary effluent treatment, it will greatly reduce the energy consumption of WWTP. However, the low nitrite nitrogen (NO2-N) concentration is a key factor limiting the application of Anammox in mainstream municipal wastewater treatment processes. The partial nitrification (PN) process is an effective method for achieving NO2N accumulation. However, the PN/Anammox process cannot treat nitrate-containing wastewater, and the partial denitrification (PD) process developed in recent years provides a new idea for treating nitrate-containing wastewater. Current research indicates that PD can be easily achieved by adjusting C/N, pH, and hydraulic residence time (HRT), and has been proven to be an effective method for generating NO2-N with long-term stability [5]. Du et al. simultaneously introduced high-NO3-N wastewater and municipal wastewater into the PD reactor to convert NO3-N to NO2-N, and removed ammonia (NH4+-N) and NO2-N from the PD effluent in the subsequent Anammox reactor; the removal efficiency of total nitrogen (TN) by Anammox reached 78.9% [6]. Cui et al. utilized a biofilter with volcanic rock as filter media to enrich Anammox Bacteria (AnAOB) with NO2-N provided by PD to treat domestic wastewater, resulting in a 74.5% TN removal by Anammox [7]. The problem of applying PD/Anammox to secondary effluent treatment is the poor biodegradability and low chemical oxygen demand (COD) concentration in the secondary effluent, which also does not contain the NH4+-N required for the Anammox reaction. In order to improve the advanced nitrogen removal efficiency of the “PD/Anammox” system, some research in recent years has divided the raw water into two parts. The first stream was introduced to an aerobic tank to oxidize NH4+-N to NO3-N, and its effluent mixed with the second stream was transferred to a PD/A reactor, where NO3-N was reduced to NO2-N via PD using the organic matter in the raw wastewater [8]. Zhao used the aerobic sequencing batch reactor (SBR) to partially nitrify NH4+-N to NOx-N (NO2-N dominated), and then used an up-flow anaerobic sludge bed (UASB) to treat the mixture of its effluent and the raw water, which removed 76.8% of TN by Anammox [9]. Based on this, the PD/Anammox process can be made feasible to treat the secondary effluent by introducing a portion of raw water to provide a carbon source and NH4+-N; it can simultaneously remove NH4+-N from the raw water and NO3-N from the secondary effluent, and the distribution ratio of the two parts significantly affects the nitrogen removal performance, but few studies have been reported in this area.
Solid-phase denitrification, in which the carbon source for denitrification is decomposed from an organic solid, has been considered as a promising approach to enhance nitrate removal of the secondary effluent [10]. At present, the commonly used solid carbon sources are synthetic polymers such as polycaprolactone (PCL), polyhydroxyalkanoate (PHA), and Polyvinyl alcohol (PVA) [11,12], or agricultural wastes such as the peanut shell (PS) and corncob [13]. Up until now, several agricultural wastes such as wheat straw, corncob (CC), and rice straw have been investigated as solid carbon sources for denitrification [14]. The addition of cellulose-rich agricultural waste or artificial macromolecules as solid carbon sources can not only release organics for denitrification, but also provide a carrier for the growth of microorganisms [15,16]. AnAOB grows slowly and has strict environmental requirements, so establishing a suitable micro-environment by embedding or attachment would contribute to enhance Anammox for nitrogen removal [17]. In practical application, natural organic materials (PS, CC, et al.) are often mixed with carrier materials to improve the carbon source slow-release performance [18]. Most recent research has focused on nitrogen removal efficiency [19], as well as bacterial population components and their transformation [20]; however, the research on the collaboration of various nitrogen conversion pathways within the embedding carriers or the attached bio-film is limited. Given this, a composite organic carrier was prepared using PVA, sodium alginate (SA), and CC to investigate its nitrogen removal characteristics and promoting effect on microbial enrichment when used as a filtering medium for treating the secondary effluent.
In this study, a novel up-flow layered filter with inorganic gravel and embedded bio-organic carriers was constructed for advanced nitrogen removal of the secondary effluent using a carbon source in raw water, and the nitrogen conversion pathways and the distribution of nitrogen removal microorganisms in different distribution ratios of raw water and the secondary effluent were investigated. The potential of the PD/Anammox process for treating the secondary effluent was evaluated by examining the promotion of the AnAOB enrichment by microorganisms embedded in organic carriers, in the hope of providing a new energy-saving nitrogen removal process for the treatment of the secondary effluent in practical engineering applications.

2. Materials and Methods

2.1. Experimental Setup

The layered nitrogen removal filter is shown in Figure 1. The device was made of Plexiglas with an inner diameter of 6.8 cm, a height of 41.5 cm, and an effective volume of 1 L. Sampling ports were laid out along the vertical wall. The bottom layer (height 10 cm) was filled by the gravel with a particle size of 5–8 mm, the middle layer (height 15 cm) was filled by an embedded bio-organic carrier with a particle size of 10 mm (weight 160 g), and the top layer (height 6.5 cm) was filled by the gravel with a particle size of 5–8 mm.

2.2. Experimental Materials

The gravel was purchased from Zhengzhou Linyuan Co., Ltd. (Zhengzhou, China); its surface was relatively rough with the diameter of 3–5 mm. The embedded bio-organic carrier was prepared with corncob (CC), polycaprolactone (PCL), and PVA. CC was collected from a farmland of Henan (Zhengzhou, China); after being dried in the oven at 50 °C for 4 h, it was grinded into little particles with the diameter of 3~4 mm. PCL (molecular weight 50,000–80,000), PVA (polymerization degree 1799, alcoholysis degree > 99%), and SA (viscosity of 1.0% aqueous solution at 20 °C, 80–120 mPa-s) were purchased from Shenzhen Huixin Plastic Chemical Co., Ltd. (Shenzhen, China). The inoculated sludge was collected from the anoxic tank of an Anaerobic-Anoxic-Oxic (AAO) sewage plant (Zhengzhou, China). The bacterial suspension (BS) was obtained from the supernatant of the inoculated sludge after centrifugation at 200 rpm for 1 min. The chemicals used in this experiment include: CH3COONa·3H2O, NH4Cl, KNO3, KH2PO4, CaCl2:2H2O, NaHCO3, MgSO4, FeCl3·6H2O, H3BO3, CuSO4·5H2O, KI, MnCl2·4H2O, Na2MoO4·2H2O, ZnSO4·7H2O, CoCl2·6H2O, and EDTA. All the above chemicals were purchased from Sinopharm Group Co., Ltd. (Shanghai, China), and the grade level was an analytical reagent (AR ≥ 99.5%).

2.3. Preparation of Embedded Bio-Organic Carrier and Filmed Gravel

The embedded bio-organic carrier was prepared according to the following procedure (shown in Figure 2): (1) the PVA and SA were dissolved by distilled water with the concentration of 8% PVA and 1% SA; (2) the mixture was heated at 95 °C for 2 h; (3) after the mixture was cooled to 20 °C, CC, PCL, and BS were added to prepare a solution containing 8% CC, 8% PCL, and 2% BS; (4) the solution was continuously aerated for 1 min by a micron aeration disk under the aeration rate of 10 L·min−1; (5) the solution was poured into a plate mold with 100 small boxes of 1 cm3 each, and was frozen at −20 °C for 12 h; (6) the freezing solids were removed from the plate mold, then were dropped into the saturated H3BO3 and CaCl2 solution (4%) to crosslink at 4 °C for 24 h; and (7) the embedded bio-organic carrier was taken out of the solution and washed by distilled water. The prepared carrier had a density of 1 g·cm−3 and compressive strength bigger than 260 N. The gravel was immersed in the inoculated sludge mixture for 48 h, and then was washed by distilled water 3 times.

2.4. Experimental Design and Operation

The flow rate was controlled by a peristaltic pump (CT1000) with a HRT of 8 h and the temperature was not controlled during the operation and was maintained at 20.0–25.0 °C. The synthetic wastewater was prepared to simulate the mixture of urban sewage and the secondary effluent. The CH3COONa·3H2O, NH4Cl and KNO3, and KH2PO4 were used as the carbon, nitrogen, and phosphorus sources, respectively. NaHCO3 was added to supply the alkalinity. In addition, 1 L of synthetic wastewater consisted of 40 mg CaCl2:2H2O, 375 mg NaHCO3, 8 mg MgSO4, and 0.3 mL nutrient solution [21]. The components of the nutrient solution per liter were 1.5 g of FeCl3·6H2O, 0.15 g of H3BO3, 0.03 g of CuSO4·5H2O, 0.18 g of KI, 0.12 g of MnCl2·4H2O, 0.06 g of Na2MoO4·2H2O, 0.12 g of ZnSO4·7H2O, 0.15 g of CoCl2·6H2O, and 10 g of EDTA. According to the different mixing ratios of raw water and the secondary effluent, four different mixing components were simulated, and the experiment contained four phases (Table 1).

2.5. Analytical Methods

2.5.1. Sampling and Analytical Methods

Samples for testing were collected every 4 days during each phase. All the water samples were filtered through a 0.45 μm filter paper and analyzed immediately. CODcr, NH4+-N, NO2-N, NO3-N, and PO43−-P were measured by standard methods (State Environmental Protection Administration of China 2002). DO, pH, and oxidation–reduction potential (ORP) were measured by the WTW Multi 3401 DO tester. The morphologies of the carrier were observed using a scanning electron microscope (SEM) (Model ULTRA 55, Caise Co., Oberkochen, Germany).

2.5.2. Anammox Activity Assay

Part of the filter material was removed from the reactor and washed gently three times with distilled water for later use. A 250 mL conical flask was filled with 200 mL of an initial solution prepared from NH4Cl and NaNO2;, with NH4+-N and NO2-N concentrations of 30 mg·L−1 each. Nitrogen gas was then introduced into the flask for approximately 10 min to maintain anaerobic conditions, followed by the rapid addition of the filter material. The conical flask was tightly sealed with a butyl rubber stopper and an aluminum cap, with a hole in the rubber stopper for sample collection. The flask was placed in a water bath with a constant temperature and agitation set at 30 ± 1 °C and 120 rpm, respectively. The first water sample was collected immediately after the start of the timer, and subsequent samples were collected at 10 min, 20 min, 30 min, 45 min, 60 min, 90 min, and 120 min, respectively, for the analysis of NH4+-N, NO2-N, and NO3-N content. The activity of Anammox was determined as the biomass-specific ammonium consumption rates. The specific Anammox activity (SAA) was calculated as follows:
SAA = Δ [ NH 4 + -N ] × V × 60 Δ t × M
where Δ[NH4+-N] was the change in NH4+-N concentration during the reaction, mg·L−1; V was the volume of the reaction solution, 200 mL; Δt was the reaction time, h; and M was the mass of the filler, g.

2.5.3. High-Throughput Sequencing

High-throughput sequencing technology was used to analyze the microbial community structure of different layers. The samples were collected from different layers, named AS (initial activated sludge), Top (top layer), Middle (middle layer), and Bottom (bottom layer). High-throughput sequencing was carried out to investigate the distribution of microbial species by Bio-engineering (Shanghai) Co., Ltd. (Shanghai, China), and the samples were stored, frozen in solid CO2, during transportation.

2.5.4. Nitrogen Conversion Pathway

The analysis of nitrogen conversion pathways can reveal different nitrogen conversion reactions occurring in each filter layer and further clarify the synergistic relationship of each filter layer in the nitrogen removal process. Five pathways of nitrogen conversion were considered in this study, which are Anammox (2), PD (3), PN (4), the second step of denitrification (SD) (5), and the second step of nitrification (SN) (6); the details are shown as follows [22]:
NH 4 + + 1.32   NO 2   + 0.66   HC O 3 + 0.13   H +   0.066   C H 2 O 0.5 N 0.15 + 1.02   N 2 + 0.26   N O 3 + 2.03   H 2 O
NO 3   + 0.083   C 6 H 12 O 6 NO 2 + 0.5   CO 2   + 0.5   H 2 O
NH 4 + + 1.5   O 2 NO 2   +   H 2 O + 2   H +
NO 2 + 0.125   C 6 H 12 O 6 + H + 0.5   N 2 + 0.75   CO 2   + 1.75   H 2 O
NO 2 + 0.5   O 2   NO 3
Since the variables associated with nitrogen transformations include NH4+-N, NO2-N, and NO3-N, three of the above nitrogen conversion pathways were selected randomly to establish the equations of mass conservation for NH4+-N, NO2-N, and NO3-N, (Equations (7)–(9)), and the final nitrogen conversion pathways in each layer were determined by the combination with reasonable calculation results.
14 ( ax + by + cz ) = A
14 ( dx + ey + fz ) = B
14 ( gx + hy + iz ) = C
where x, y, and z are the extent of the reaction of the three selected nitrogen conversion pathways, mmol; a, b, and c are the stoichiometric coefficients of NH4+-N in each selected equation; d, e, and f are the stoichiometric coefficients of NO2-N in each selected equation; g, h, and i are the stoichiometric coefficients of NO3-N in each selected equation; and A, B, and C are the masses of NH4+-N, NO2-N, and NO3-N, respectively, changed in each layer of the biofilter, mg.

3. Results and Discussion

3.1. Pollutant Removal Performance

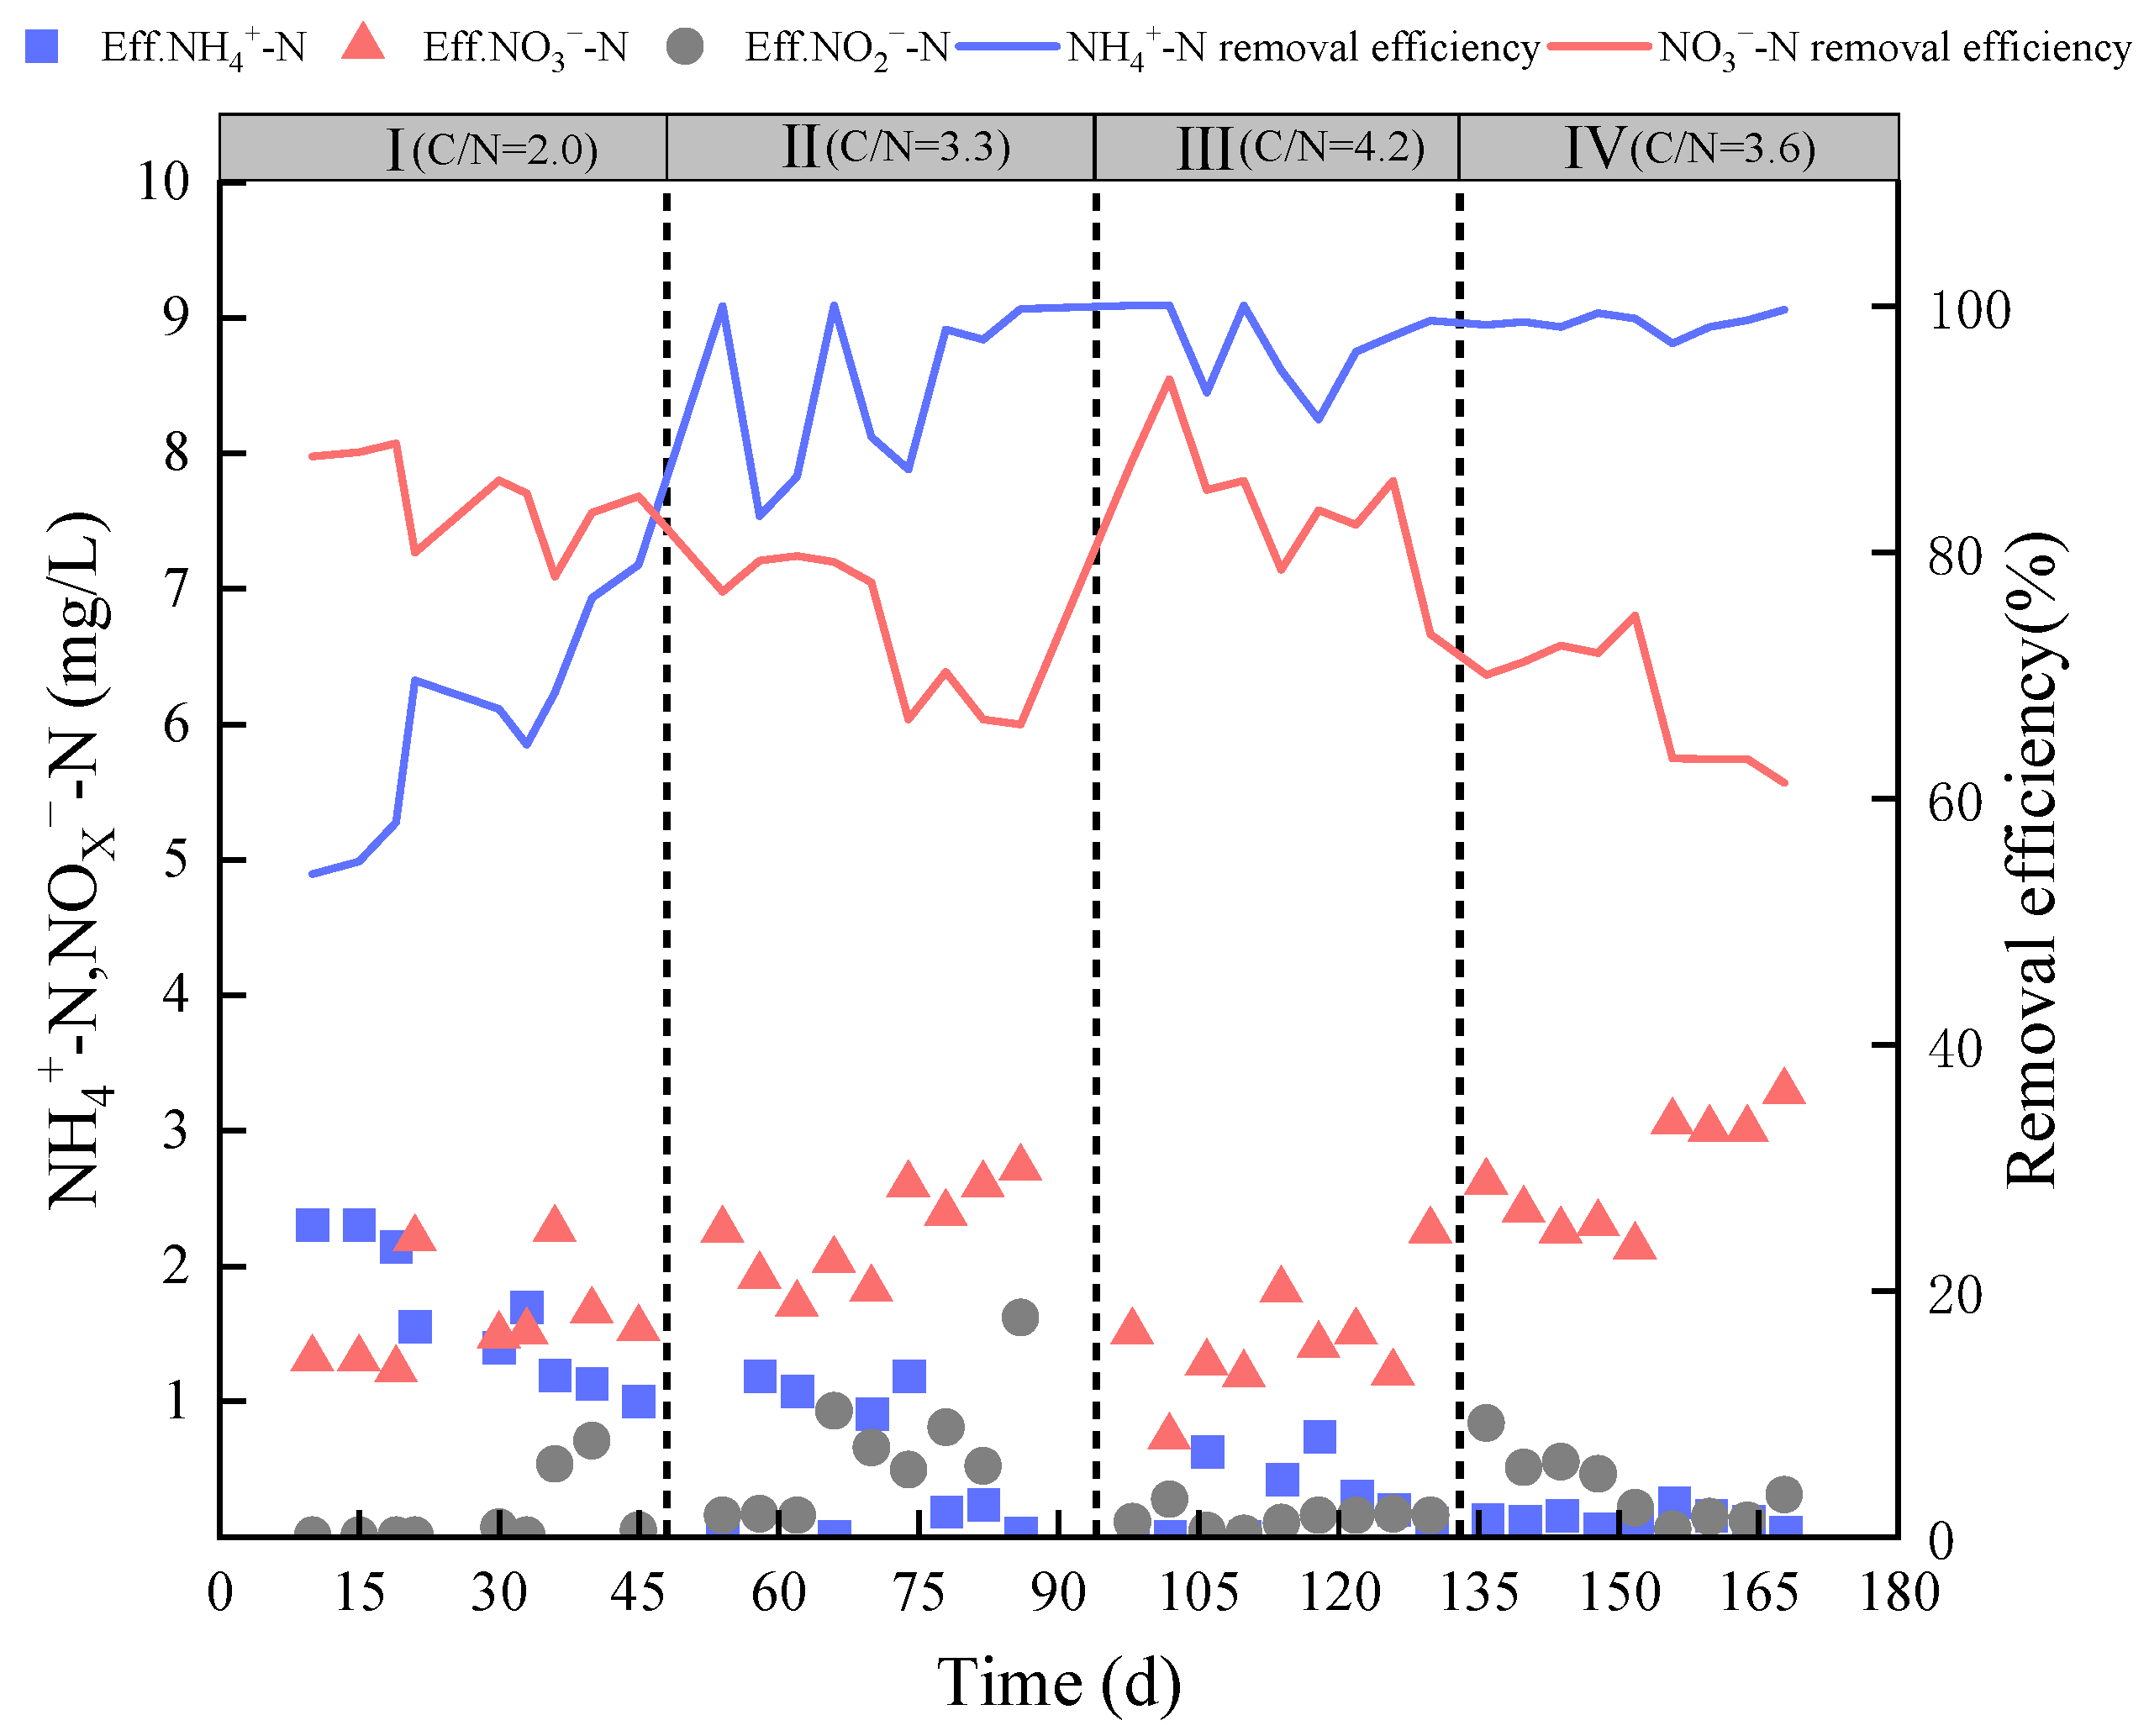
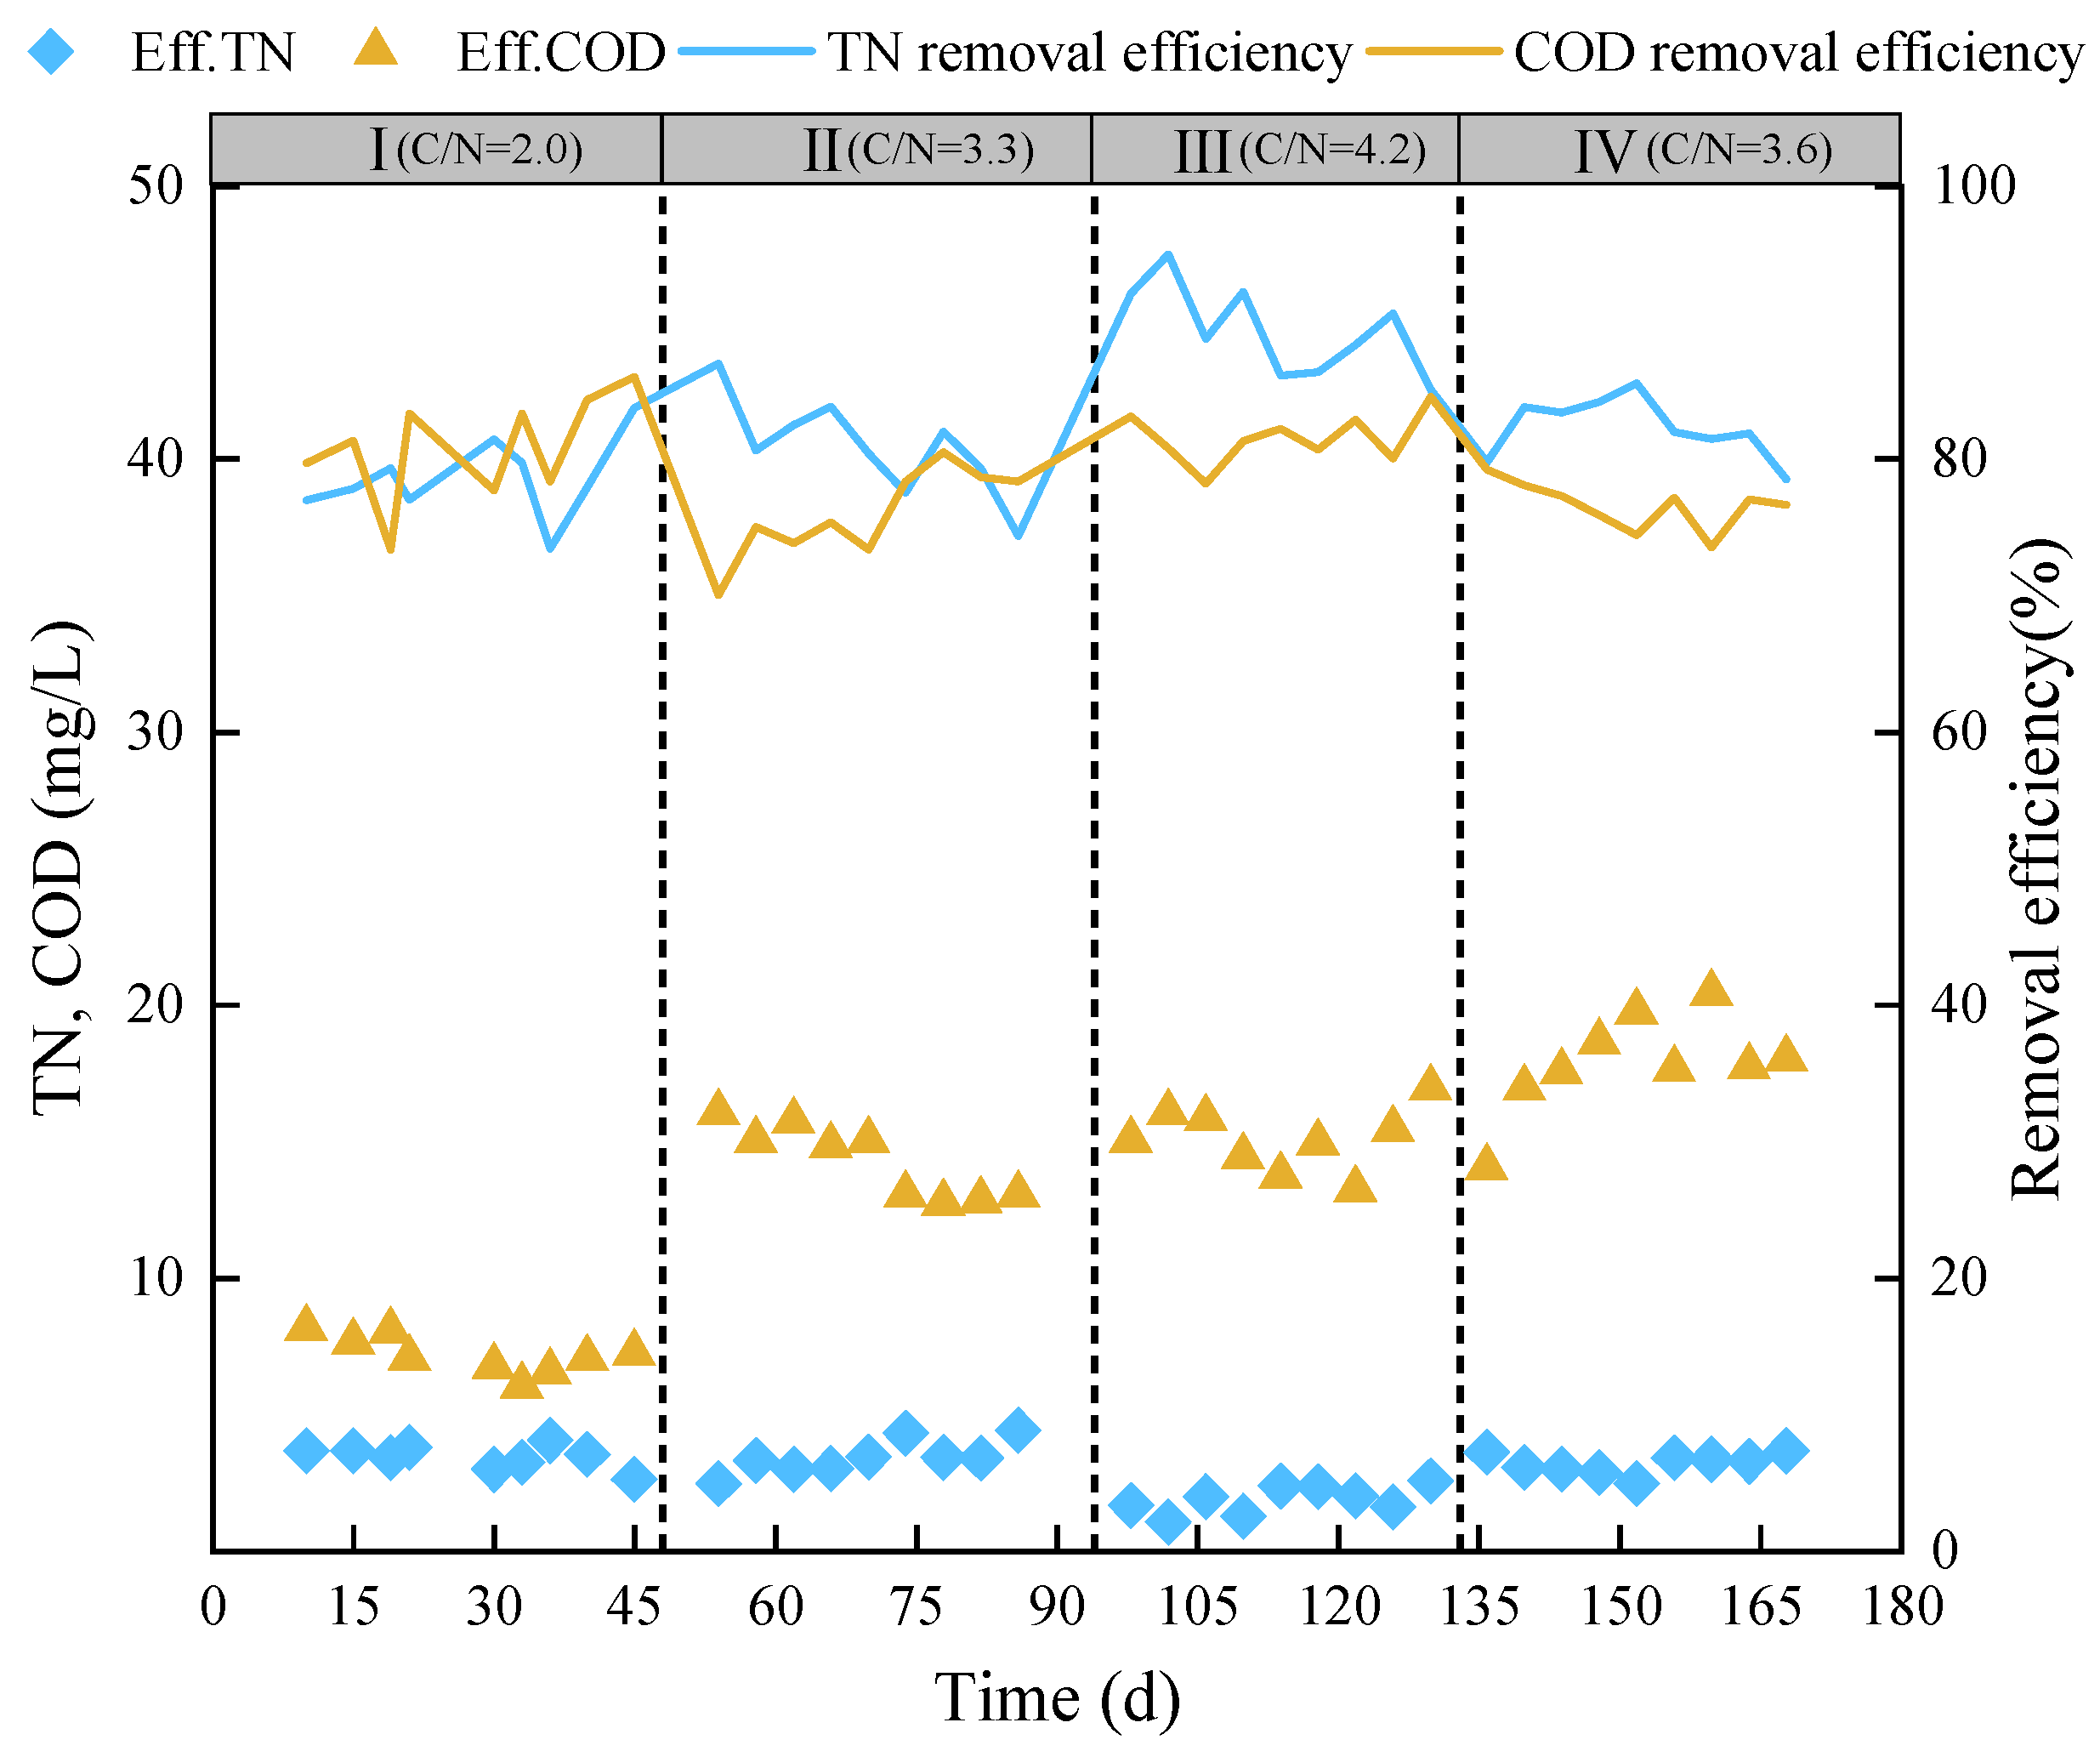
The performance of nitrogen and COD removal is shown in Figure 3 and Figure 4. During phase I (1–48 days), the average effluent concentrations of NH4+-N and NO3-N were 1.63 and 1.60 mg·L−1, respectively, and the removal efficiencies of NH4+-N and NO3-N were 65.66% and 84.48%, respectively. Meanwhile, the effluent TN and COD concentrations were 3.38 and 5.76 mg·L−1, respectively, with the removal efficiencies of 78.58% and 80.81%, respectively. The organic carriers prepared would release lots of organic matter during the initial 5 days and were conducive to enriching denitrifying bacteria (DNB) [23], so the denitrification performance was excellent during phase I, while nitrifying bacteria were not as active in the early experimental period, resulting in lower NH4+-N removal efficiency.
With the influent C/N increased to 3.33 in phase II (49–94 days), the average removal efficiency of NH4+-N increased to 93.31%, but the average removal efficiency of NO3-N decreased to 73.42%. The removal efficiency of TN and COD did not significantly change, with 80.83% and 75.93%. Compared with the nitrogen removal performance of phase I, the nitrification performance was significantly improved with the stabilization of the microbial community, while the denitrification performance slightly decreased with the increase in C/N, possibly due to the decrease in carbon release capacity of middle organic carriers [24]. The accumulation of NO2-N was also detected in the effluent, which, when oxidized by nitrifying bacteria to NO3-N in the top layer, could lead to a decrease in the removal efficiency of NO3-N, while the NO2-N generated in the reactor also provided substrates for the Anammox reaction. Although AnAOB are autotrophic bacteria, the Anammox process will not be affected under low COD concentrations [25].
During phase Ⅲ (95–133 days), the average effluent concentration of NH4+-N was 0.26 mg·L−1 and the average NH4+-N removal efficiency increased further to 96.75%. As the influent COD increased from 60 to 77 mg·L−1 (C/N = 4.23), the NO3-N and TN concentrations in the effluent were 1.43 and 1.81 mg·L−1, respectively, with the average removal efficiencies of NO3-N and TN increasing to 83.89% and 89.42%, respectively. The NH4+-N was maintained at a high removal efficiency, which was basically unaffected by the variation of the influent water. Although the influent COD concentration was increased, its removal efficiency was increased to 81.52%, which shows that the raw water dosing ratio can be increased appropriately to provide a carbon source to make the NO3-N removal more adequate. It should be noted that obvious organic matter was released from the organic carrier only during the initial 5 days, and the carbon source required for denitrification in later phases was still mainly from the influent. Hu et al. processed the secondary effluent with different C/N ratios using DNBFs, achieving an 85% removal efficiency of NO3-N at a C/N ratio of 5 [26]. This is similar to the results obtained in phase Ⅲ of our experiment. However, their use of additional carbon sources resulted in extra energy consumption.
In phase Ⅳ (134–168 days), the C/N was reduced to 3.67 by increasing the influent NH4+-N concentration, and the NH4+-N removal efficiency remained high at 98.56%, while the NO3-N removal efficiency decreased significantly to 67.81%; the decrease in C/N directly led to the deterioration of the NO3-N removal. The TN and COD removal efficiencies were 82.26% and 76.57%, respectively, which were slightly lower than phase Ⅲ. By adjusting the mixing ratio of raw water and the secondary effluent to obtain the optimal C/N, the system can have a good pollutant removal performance.

3.2. Comparison of Nitrogen Removal between Each Layer

The nitrogen removal performance of each layer is shown in Figure 5. The DO concentration in the influent water was 2–3 mg·L−1, while the nitrifying bacteria were aerobic, and the aerobic environment at the bottom made the removal of NH4+-N occur mainly in the bottom layer; its removal efficiency increased from 54.35% in phase I to 86.14% in phase Ⅳ. While the bottom removed most of the NH4+-N, the denitrifying bacteria used the COD in the influent to also remove some of the NO3-N by denitrification. The denitrification effect was directly related to C/N [27], and the NO3-N removal efficiency at the bottom varied with the fluctuation of the influent C/N, which was 33.87% in phase I, then increased to 35.89% and 44.73% due to the rise of C/N in phase II and phase Ⅲ, respectively, and decreased to 18.88% in phase Ⅳ with the decrease in C/N.
By the middle organic carrier layer, the DO concentration dropped to below 1 mg·L−1, the activity of nitrifying bacteria was inhibited, heterotrophic denitrifying bacteria dominated, and the average removal efficiency of NH4+-N in the middle layer was 8.47% throughout the experiment. In phase I, 51.48% NO3-N was removed from the middle layer due to the organic carrier that could be used as a slow-release carbon source, and although the C/N increased in phase II, the NO3-N removal efficiency decreased to 38.17%, and in phase Ⅲ, the NO3-N removal efficiency in the middle layer increased to 41.34% with the increase in C/N. By phase Ⅳ, the denitrification efficiency in the bottom layer had deteriorated due to the decrease in C/N, and most of the NO3-N was removed in the middle layer, with its removal efficiency continuing to increase up to 50.59%.
The top gravel layer had little pollutant removal effect, and its NO3-N removal efficiency was negative except for the removal of a small amount of NH4+-N, presumably because the nitrifying bacteria oxidized part of the NH4+-N and NO2-N produced in the middle to NO3-N, while the Anammox reaction also produced NO3-N; however, the organic carbon source was not enough—the NO3-N could not be further converted to N2 in the top gravel layer. Wang et al. had removed the NO3-N produced by Anammox by adding PCL to the top of the continuous up-flow reactor [28]; in this experiment, the top layer of filter media was only gravel.

3.3. Nitrogen Conversion Pathway

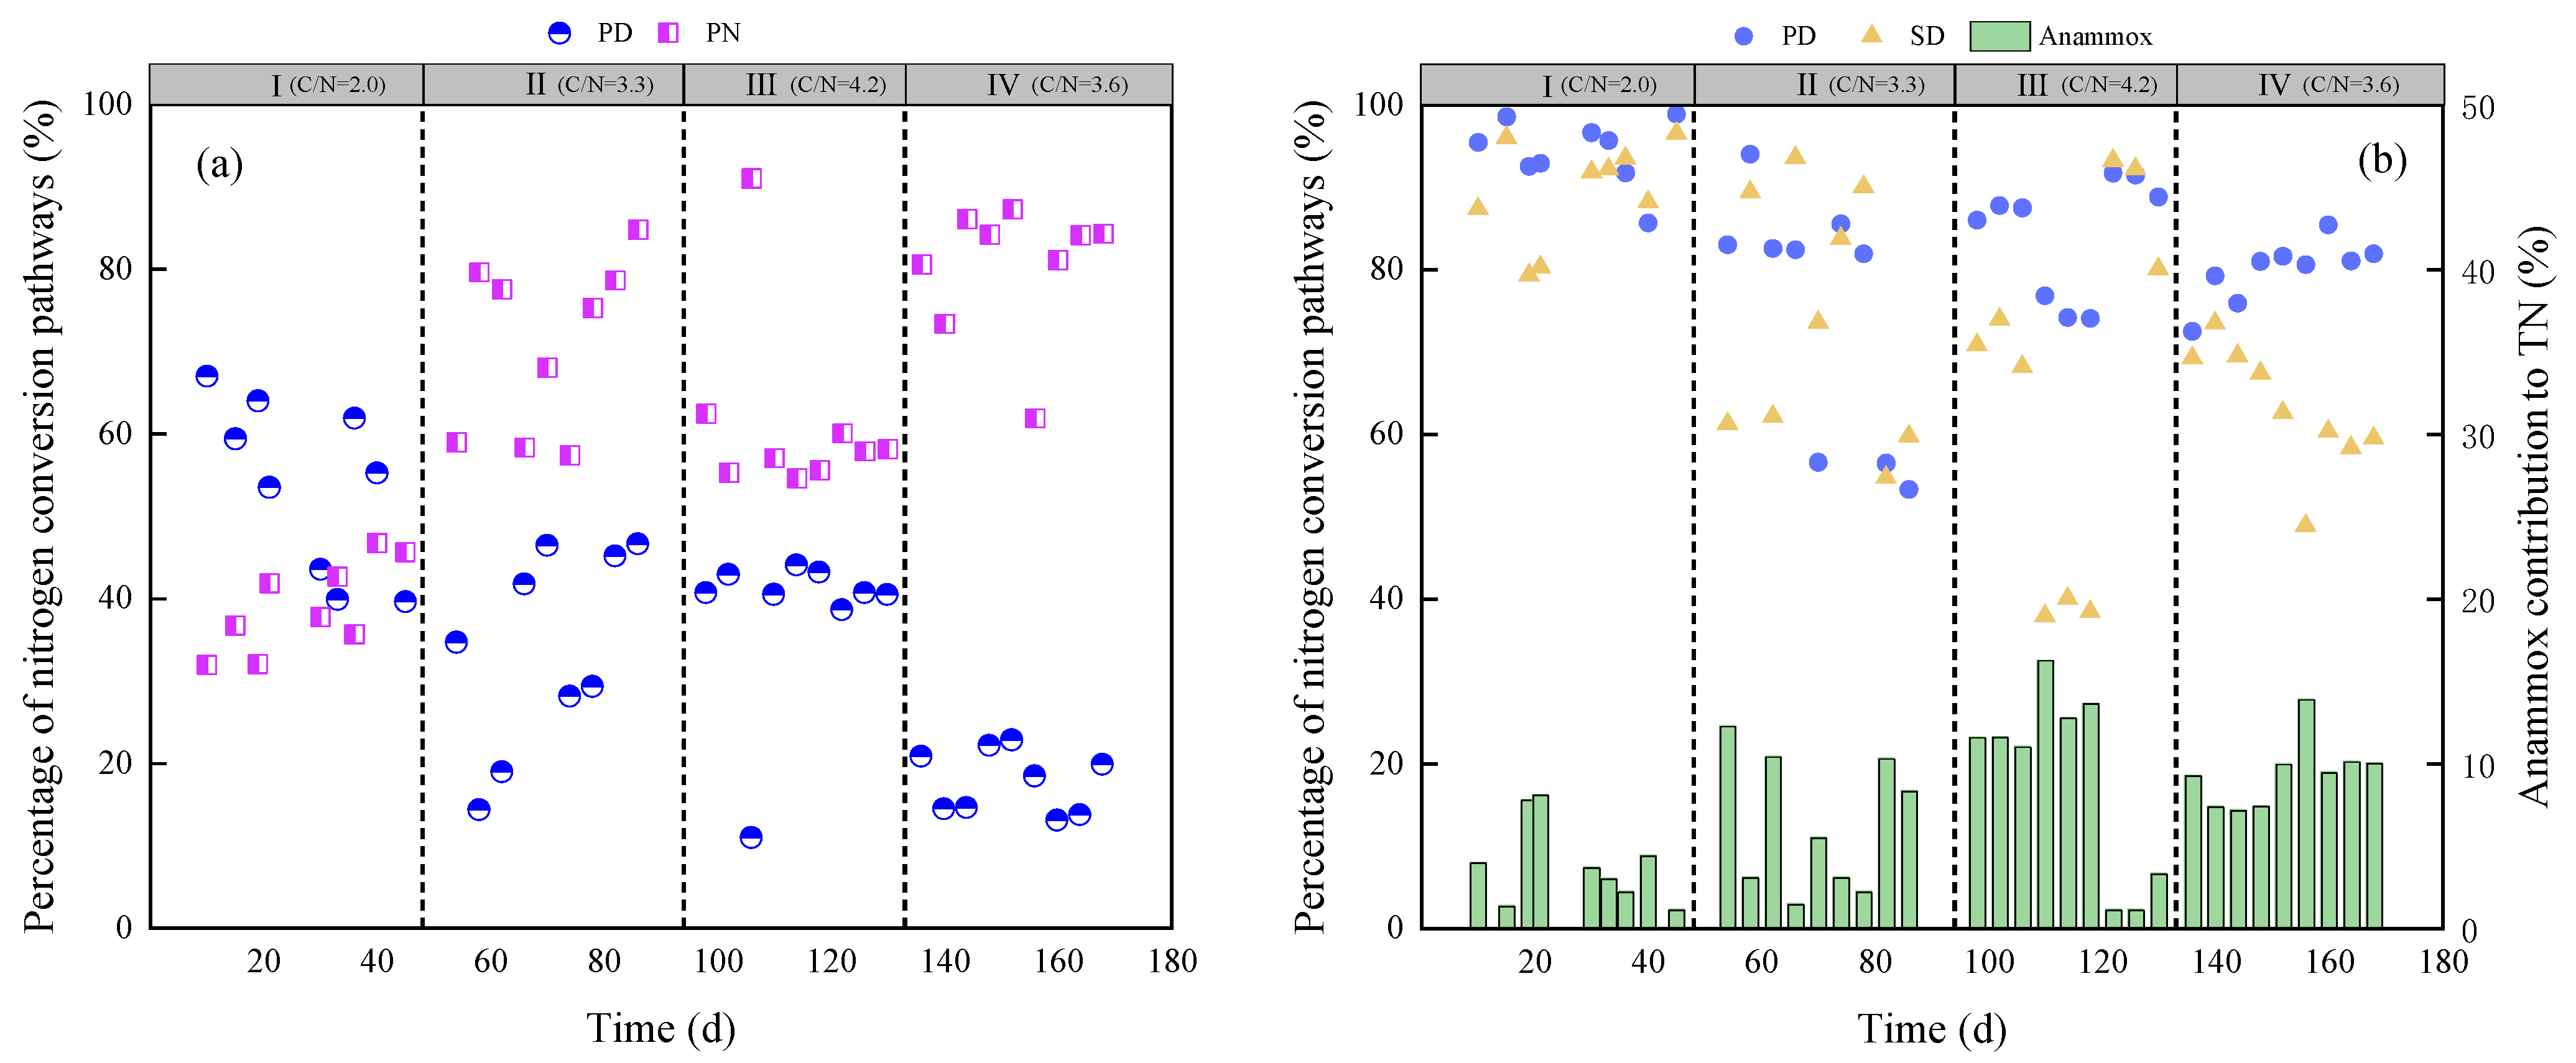
Using the established calculation method, we analyzed the nitrogen conversion pathways of different filler layers (Figure 6), and determined the contribution of Anammox to TN, as well as assessed the activity of AnAOB using kinetic experiments to calculate the SAA. As the nitrogen transformation process primarily occurred in the middle and bottom layers, only those layers were analyzed.
Our results showed that PN, PD, and SD predominantly occurred in the bottom gravel layer. Moreover, depletion of DO inside the biofilm may limit the activity of nitrite-oxidizing bacteria (NOB), as they are more sensitive to low DO than ammonia-oxidizing bacteria (AOB), which is beneficial for NO2-N accumulation [29]. AOB exhibited high activity in the bottom layer under an influent DO concentration of 2–3 mg·L−1, converting NH4+-N to NO2-N through PN. Denitrifying heterotrophic bacteria in the bottom layer utilized COD in the influent to convert NO3-N to NO2-N through PD. Typically, a C/NO3-N ratio of 2.6–3.0 is maintained to reduce the conversion of NO2-N [7]. However, the high C/NO3-N ratio (3–9.6) of the influent in this experiment resulted in the reduction of NO2-N produced by both PD and PN into N2.
Anammox, PD, and SD were found to be the primary nitrogen conversion paths in the middle layer. During the first two phases, about 96% of the NO2-N produced by PD was reduced to N2 by SD, while very limited NO2-N was available for Anammox, and the average contributions of Anammox to TN removal were 3.87% and 6.81%, respectively. By phase III and IV, with the increase in AnAOB activity, their ability to compete with NO2-N became stronger, resulting in the reduction in the proportions of NO2-N reduced by SD to 76.9% and 79.49%, respectively, and the contribution of Anammox to TN removal increased to 9.86% and 11.6% in phase III and IV, respectively. Throughout this experiment, NO2-N produced by PD in the middle and bottom layers was reduced by SD, with an average reduction efficiency of 95%. The activity of AnAOB in the organic filter layer, as represented by SAA, was low in the first two phases at 0.529 and 0.935 mg·(g·h)−1, respectively, correlating with the lower Anammox contribution to nitrogen removal. However, there was a significant increase in SAA during phase III and IV at 2.073 and 2.179 mg·(g·h)−1, respectively.
The embedding of microorganisms in the organic carrier facilitated the enrichment of AnAOB. Through autotrophic (Anammox) and heterotrophic (PD and SD) nitrogen conversion pathways, the pollutants in the influent were effectively removed. The competition for NO2-N between denitrifying bacteria and AnAOB was impacted by the influent’s varying C/N, with the optimal Anammox nitrogen removal contribution and SAA observed at C/N = 3.67.

3.4. Microbial Communities in Each Layer

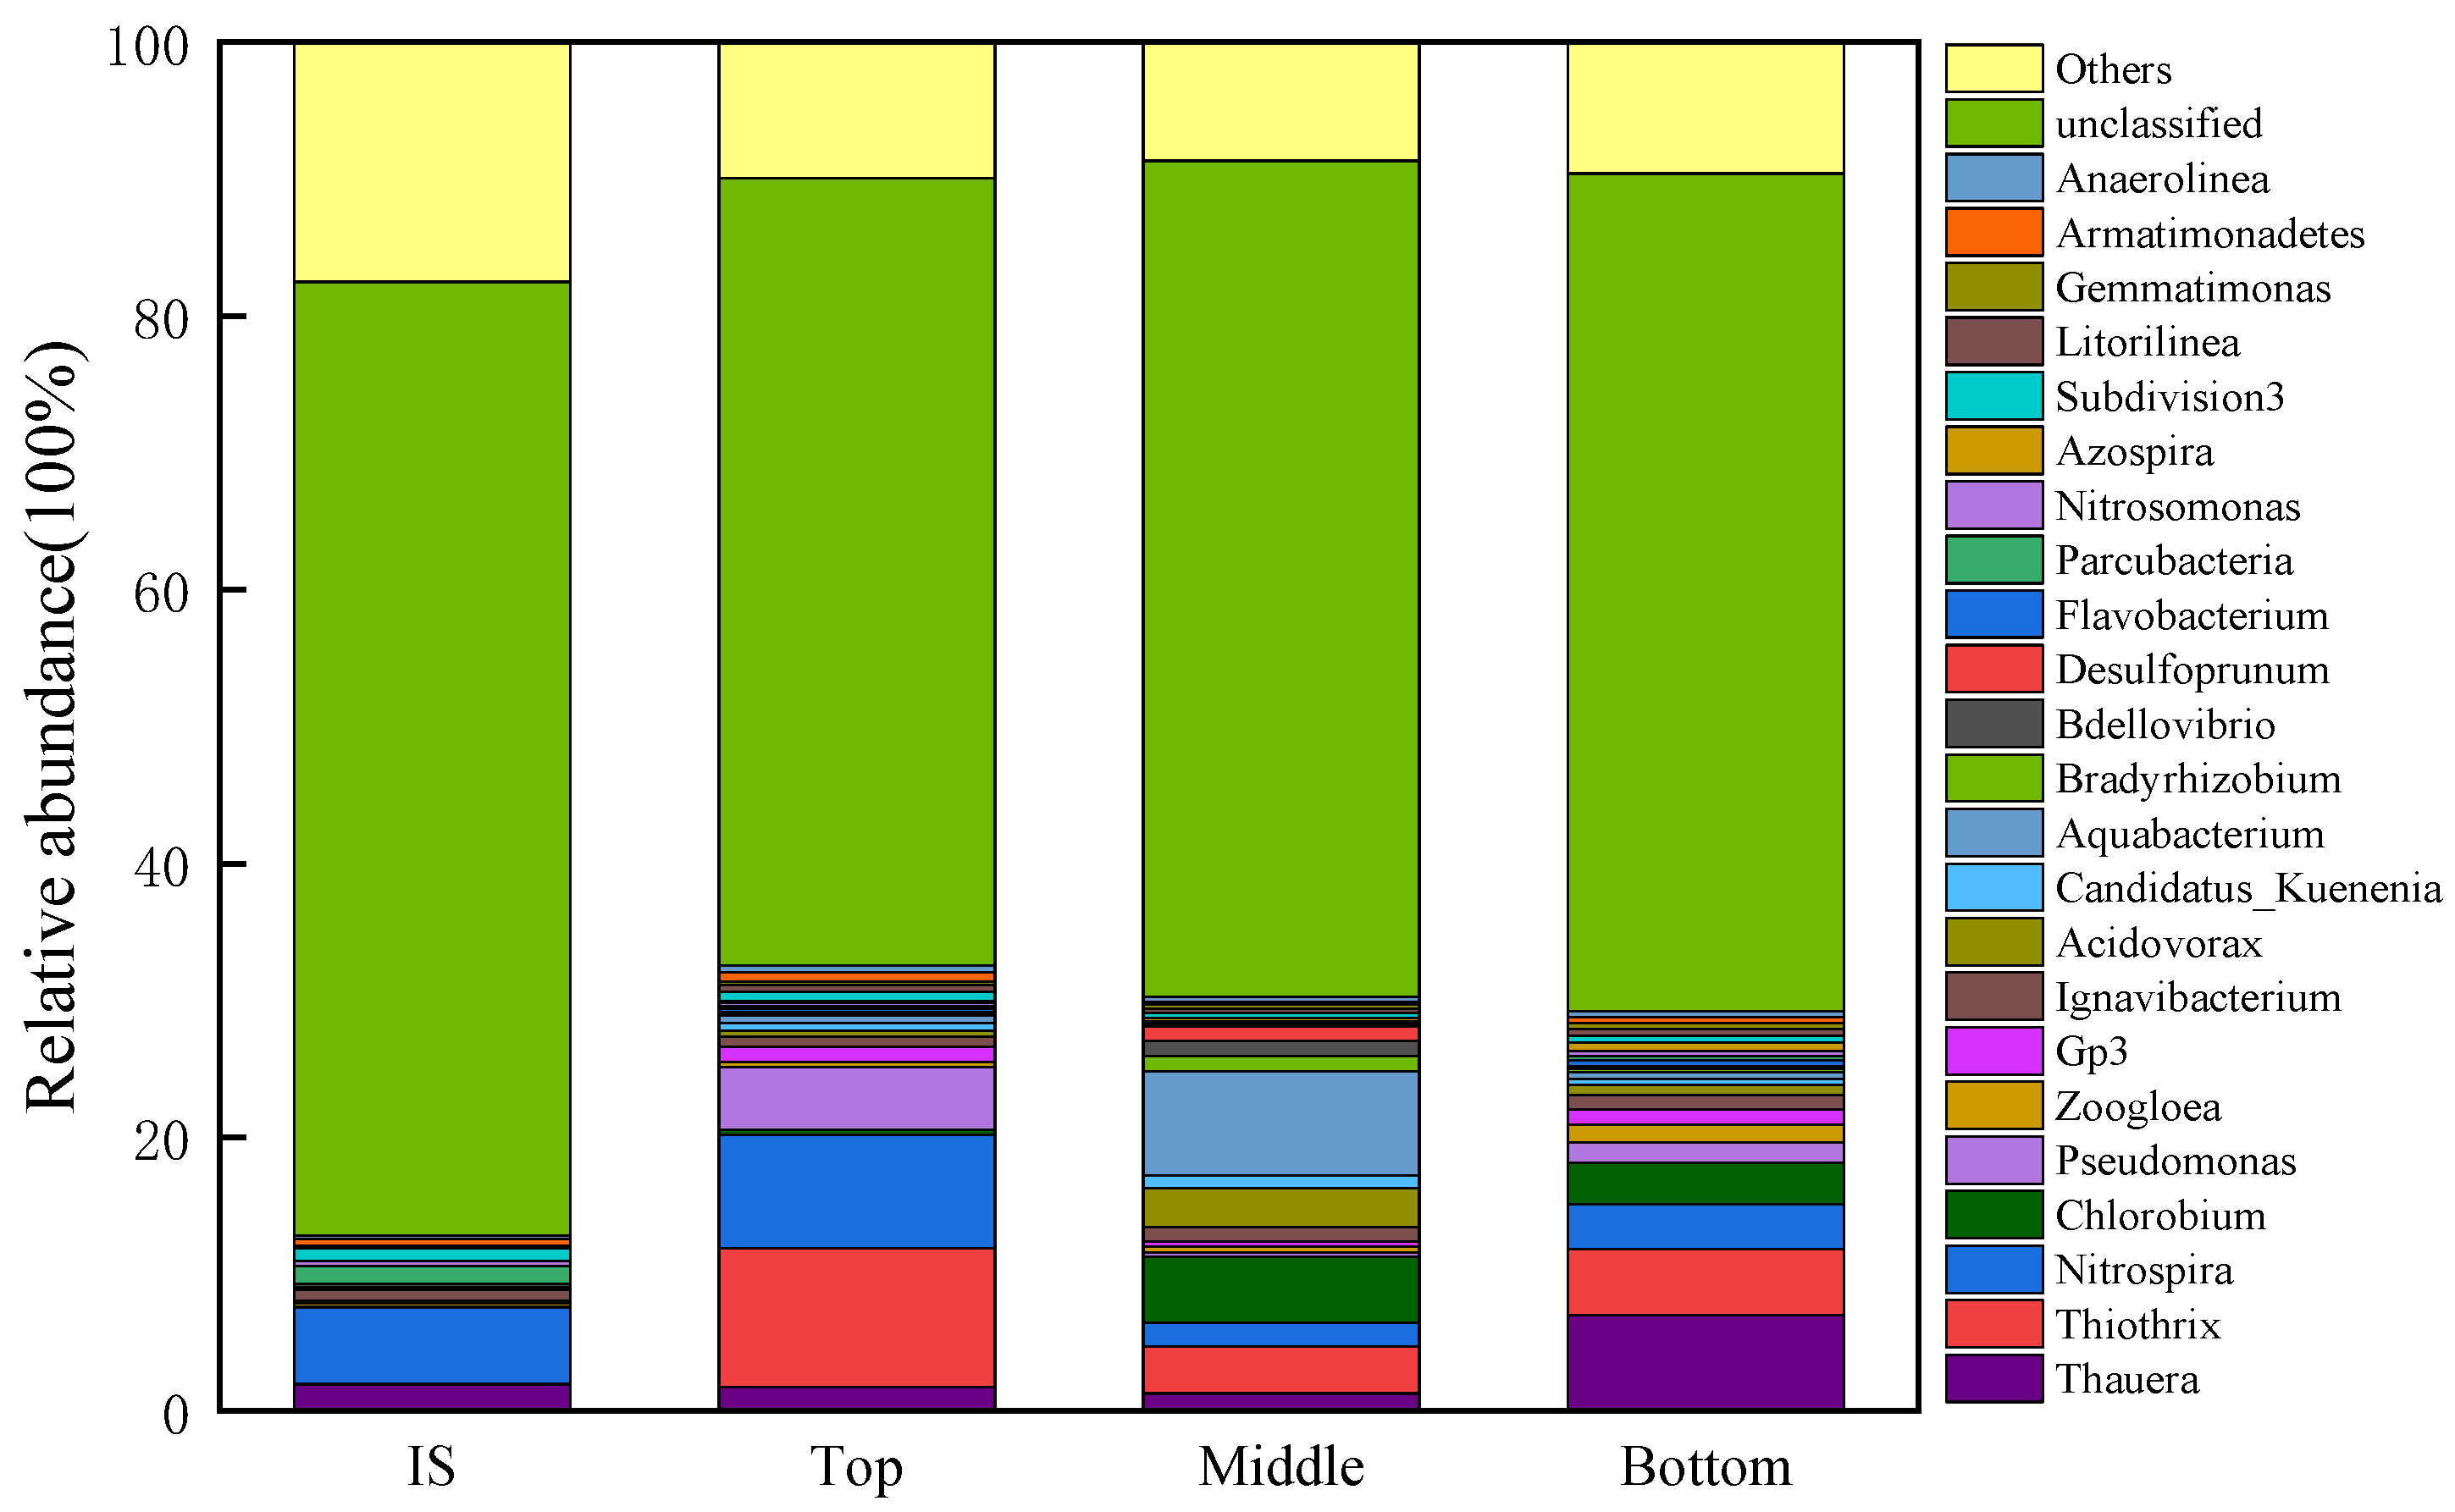
Due to our main focus on the comparison between different vertical filter layers, and the phase III filter having the highest TN removal efficiency and a more stable microbial community structure compared to the first two phases, sludge samples collected at the end of phase III were selected for high-throughput sequencing of microbial communities. All sequences with a relative abundance less than 0.5% were classified as “others”, and all unidentified sequences were classified as “unclassified” (Figure 7).
Nitrosomonas, a representative AOB genus capable of oxidizing NH4+-N to NO2-N, was detected in the bottom gravel layer with an abundance of 0.37%, which was higher than that in the middle layer (0.10%). This explains why most of the influent NH4+-N was converted to NO2-N in the bottom gravel layer. Nitrospira, a common NOB genus [30], had a relative abundance of 5.60% in the inoculated sludge, which decreased to 1.70% in the middle layer and 3.28% in the bottom layer by the end of phase III. The reduced activity of Nitrospira favored the accumulation of NO2-N. Thauera, a representative denitrifying bacterial genus, had a relative abundance of 6.96% in the bottom layer, and it reduced NO3-N and NO2-N to N2 using COD as an electron donor. Li found that, due to the presence of Thauera, about 70% of the COD reduction occurred in the bottom aerobic section of the single-phase PN/A reactor [31]. As water flowed from the bottom to top, COD was consumed first at the bottom, resulting in a higher relative abundance of denitrifying bacterial genera Thauera (6.96%), Flavobacterium (0.41%), Parcubacteria (0.32%), and Azospira (0.59%) than that in the middle layer (1.30%, 0.19%, 0.14%, and 0.23%, respectively). The gradual decrease in COD and fluctuation in C/N promoted interspecies selection among denitrifying bacterial genera [32]. Candidatus_Kuenenia, a major genus of AnAOB, had a relative abundance of only 0.01% in the inoculated sludge, but its abundance increased to 0.88% in the organic carrier layer by the end of phase III, higher than that in the top and bottom gravel layers (0.54% and 0.42%, respectively). Embedding microorganisms in organic carriers helped enrich AnAOB. Additionally, Nitrosomonas and Nitrospira had abundances of 0.37% and 8.22%, respectively, in the top gravel layer and could oxidize NH4+-N to NO3-N, further validating the negative nitrogen removal efficiency of the top gravel layer.

3.5. Influent Mixing Ratio Model

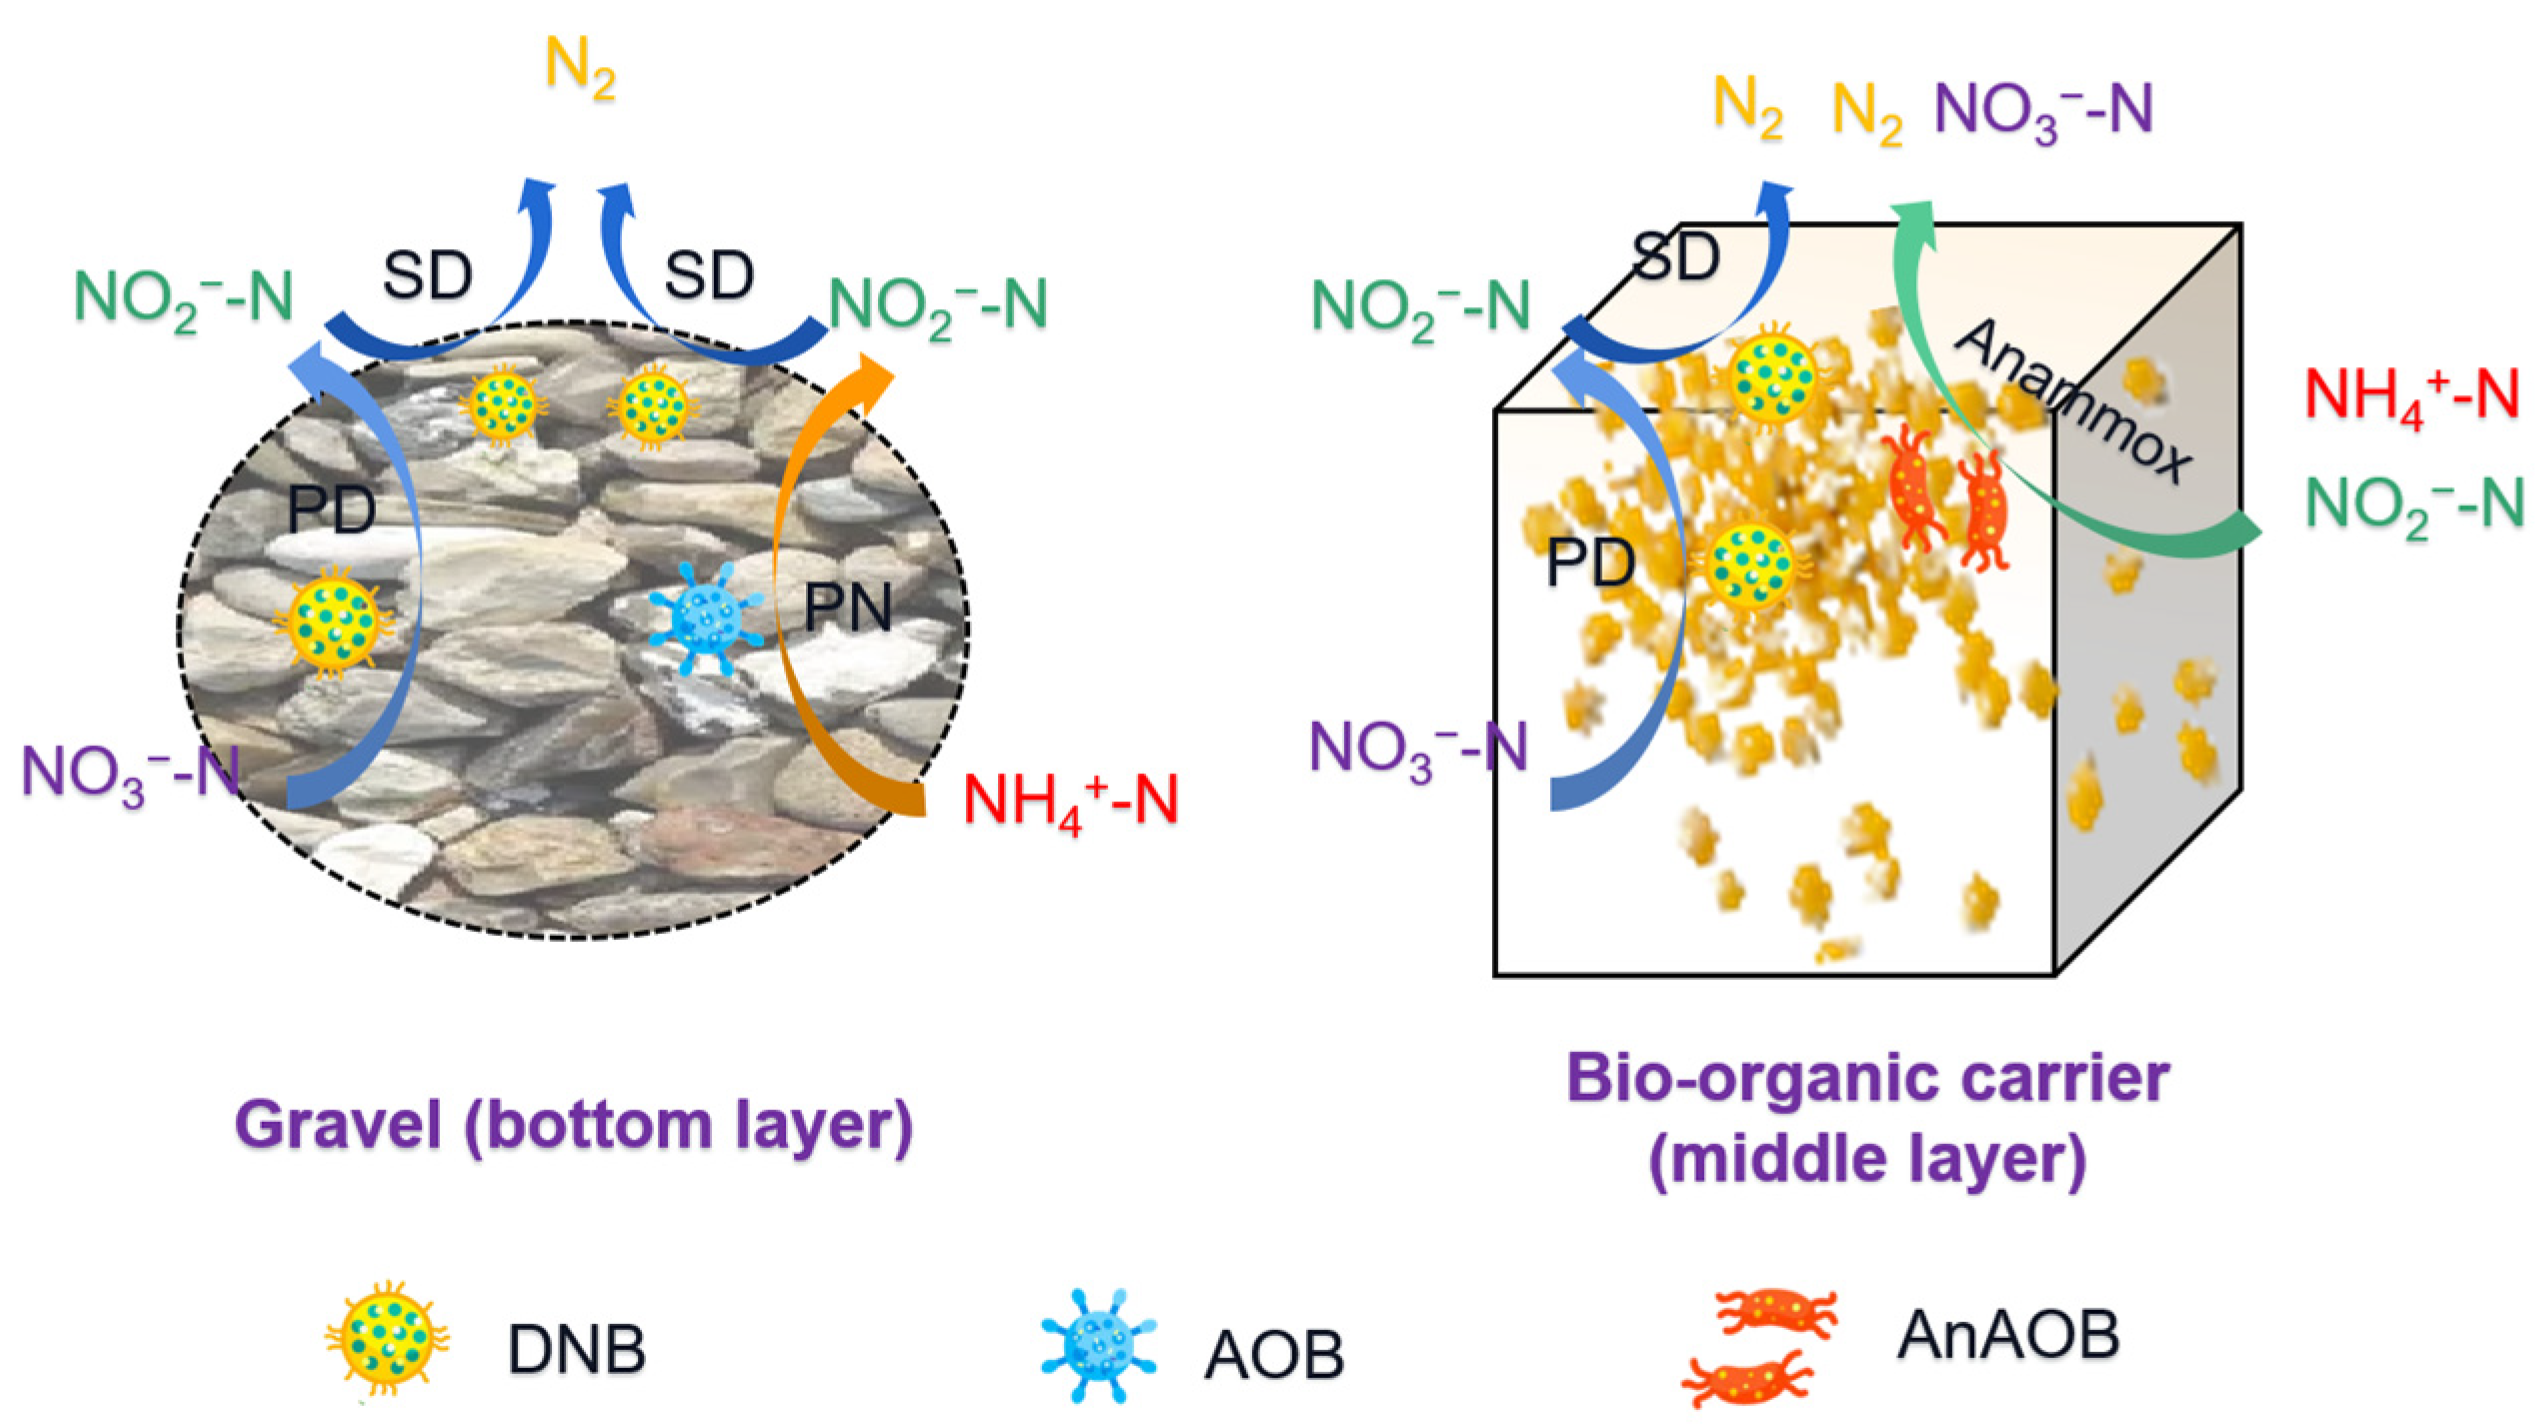
Based on the above analysis, the nitrogen conversion mechanism of the layered filter was proposed (Figure 8). The influent nitrogen and COD significantly influenced the conversion pathways. In order to flexibly adjust the distribution ratio of raw water and the secondary effluent according to the nitrogen removal requirement, and to establish a more general guide for the advanced nitrogen removal, the optimal distribution ratio calculation model was constructed.
The basic assumptions were as follows:
  • NH4+-N in the layered filter comes from the raw water (RW) and secondary effluent (SE); its transfer pathway includes PN and Anammox.
  • NO3-N comes from the SE and Anammox.
  • COD comes from the RW and SE.
  • NH4+-N in the layered filter is removed completely.
The material conservation equations for NH4+-N, NO3-N, and COD are listed separately (Equations (10)–(14)):
Q × X 2 × C N O 3 -N ( SE ) + 0.14 ( m N 1 + m D 1 m D 2 ) = m D 1 + Q × C N O 3 -N ( Eff )
Q × X 1 × C NH 4 + -N RW + Q × X 2 × C NH 4 + -N SE = m N 1 + 0.87 ( m N 1 + m D 1 m D 2 )
Q × X 1 × C COD ( RW ) + Q × X 2 × C COD ( SE ) = 1.90   m D 1 + 2.85   m D 2
m D 2 = 0.95   m D 1
X 1 + X 2 = 1
where X1: the proportion of raw water going directly to the layered filter, 100%; X2: the proportion of the secondary effluent to the layered filter, 100%; mD1: the mass of NO3-N reduced by PD, mg; mD2: the mass of NO2-N reduced by SD, mg; mN1: the mass of NH4+-N reduced by PN, mg; 0.14 and 0.87: 0.14 m of NO3-N and 0.87 m of NH4+-N consumed when m of NO2-N undergoes the Anammox reaction, respectively; 0.95: SD consumed about 95% of the NO2-N produced by PD in this experiment.
F = X 1 X 2 = 1.87   C N O 3 -N ( SE ) 0.40   C COD ( SE ) + 0.14   C N H 4 + -N ( SE ) 1.87   C N O 3 -N ( Eff ) 0.40   C COD ( RW ) 0.14   C N H 4 + -N ( RW ) + 1.87   C N O 3 -N ( Eff )
The result of the calculation is shown in Equation (15). The best distribution ratio of raw water and the secondary effluent can be evaluated by substituting the actual operating data of the sewage plant. For example, when the NH4+-N and COD of raw water were 30 and 230 mg·L−1, respectively, the NO3-N, COD, and NH4+-N of the secondary effluent were 12, 25, and 3 mg·L−1, respectively, and the effluent NO3-N of the layered filter was 2 mg·L−1. The calculated optimal distribution ratio between the raw water and secondary effluent was 1:10, when the mixed influent NH4+-N, NO3-N, and COD concentrations were 5.67, 10.80, and 45.30 mg·L−1, respectively.

4. Conclusions

By directly introducing a portion of raw water into the filter, it is possible to reduce the sludge load and save energy while providing a carbon source for the post-layered nitrogen removal filter to achieve advanced nitrogen removal. Through autotrophic and heterotrophic nitrogen conversion pathways, the TN and COD removal efficiencies of the secondary effluent can reach 89.42% and 81.52%, respectively, with concentrations of 1.81 and 14.2 mg·L−1, respectively. In addition, embedding microorganisms in the organic carrier can promote the enrichment of AnAOB while improving the nitrogen removal performance of the system. Specifically, Candidatus_Kuenenia reached an abundance of 0.88%, and Anammox contributed 11.6% to TN removal. These findings provide an economic and energy-efficient strategy for the advanced nitrogen removal of the secondary effluent in existing WWTP, without the need for external carbon sources or aeration.

Author Contributions

Methodology, formal analysis, writing—review, resources, Z.P. and J.J.; methodology, formal data analysis, writing—original draft, M.L.; formal analysis, writing—review, T.L.; methodology, writing—review, W.Z.; part of the experiment, Y.W.; part of the experiment, L.Y. All authors have read and agreed to the published version of the manuscript.

Funding

This research was funded by the National Natural Science Foundation of China (No. 42107427), the Key R&D and Promotion Special (Science and Technology) Project of Henan Province (No. 232102321051), and the Science and Technology Foundation of Henan Province (No. 222102320426).

Data Availability Statement

The data presented in this study are available on request from the corresponding author.

Conflicts of Interest

The authors declare no conflict of interest.

References

  1. Tong, Y.; Zhang, W.; Wang, X.; Couture, R.-M.; Larssen, T.; Zhao, Y.; Li, J.; Liang, H.; Liu, X.; Bu, X.; et al. Decline in Chinese lake phosphorus concentration accompanied by shift in sources since 2006. Nat. Geosci. 2017, 10, 507–511. [Google Scholar] [CrossRef]
  2. Zheng, X.; Zhang, S.; Zhang, J.; Huang, D.; Zheng, Z. Advanced nitrogen removal from municipal wastewater treatment plant secondary effluent using a deep bed denitrification filter. Water Sci. Technol. 2018, 77, 2723–2732. [Google Scholar] [CrossRef] [PubMed]
  3. Zhu-Barker, X.; Bailey, S.K.; Paw, U.K.; Burger, M.; Horwath, W.R. Greenhouse gas emissions from green waste composting windrow. Waste Manag. 2017, 59, 70–79. [Google Scholar] [CrossRef]
  4. Qiao, S.; Tian, T.; Duan, X.; Zhou, J.; Cheng, Y. Novel single-stage autotrophic nitrogen removal via co-immobilizing partial nitrifying and anammox biomass. Chem. Eng. J. 2013, 230, 19–26. [Google Scholar] [CrossRef]
  5. Tomaszewski, M.; Cema, G.; Ziembinska-Buczynska, A. Influence of temperature and pH on the anammox process: A review and meta-analysis. Chemosphere 2017, 182, 203–214. [Google Scholar] [CrossRef]
  6. Du, R.; Cao, S.; Peng, Y.; Zhang, H.; Wang, S. Combined Partial Denitrification (PD)-Anammox: A method for high nitrate wastewater treatment. Environ. Int. 2019, 126, 707–716. [Google Scholar] [CrossRef]
  7. Cui, B.; Yang, Q.; Liu, X.; Wu, W.; Liu, Z.; Gu, P. Achieving partial denitrification-anammox in biofilter for advanced wastewater treatment. Environ. Int. 2020, 138, 105612. [Google Scholar] [CrossRef]
  8. Cao, S.; Oehmen, A.; Zhou, Y. Denitrifiers in Mainstream Anammox Processes: Competitors or Supporters? Environ. Sci. Technol. 2019, 53, 11063–11065. [Google Scholar] [CrossRef]
  9. Zhao, Y.; Zhang, Q.; Peng, Y.; Peng, Y.; Li, X.; Jiang, H. Advanced nitrogen elimination from domestic sewage through two stage partial nitrification and denitrification (PND) coupled with simultaneous anaerobic ammonia oxidation and denitrification (SAD). Bioresour. Technol. 2022, 343, 125986. [Google Scholar] [CrossRef]
  10. Wu, W.; Yang, F.; Yang, L. Biological denitrification with a novel biodegradable polymer as carbon source and biofilm carrier. Bioresour. Technol. 2012, 118, 136–140. [Google Scholar] [CrossRef]
  11. Pierro, L.; Matturro, B.; Rossetti, S.; Sagliaschi, M.; Sucato, S.; Alesi, E.; Bartsch, E.; Arjmand, F.; Papini, M.P. Polyhydroxyalkanoate as a slow-release carbon source for in situ bioremediation of contaminated aquifers: From laboratory investigation to pilot-scale testing in the field. New Biotechnol. 2017, 37, 60–68. [Google Scholar] [CrossRef] [PubMed]
  12. Wang, H.M.; Yang, F. Biological Denitrification Using Slow-Release Carbon Source Composite Materials as Solid Carbon Source and Biofilm Carrier. Adv. Mater. Res. 2013, 702, 218–223. [Google Scholar] [CrossRef]
  13. Bao, T.; Chen, T.; Wille, M.-L.; Chen, D.; Yu, S.; Bian, J.; Qing, C.; Wu, W.; Frost, R.L. Production of zeolite composite filters using waste paper pulp as slow release carbon source and performance investigation in a biological aerated filter. J. Water Process Eng. 2016, 9, 38–46. [Google Scholar] [CrossRef]
  14. Reyes-Alvarado, L.C.; Okpalanze, N.N.; Rene, E.R.; Rustrian, E.; Houbron, E.; Esposito, G.; Lens, P.N.L. Carbohydrate based polymeric materials as slow release electron donors for sulphate removal from wastewater. J. Environ. Manag. 2017, 200, 407–415. [Google Scholar] [CrossRef]
  15. Lin, L.; Li, X.Y. Acidogenic fermentation of iron-enhanced primary sedimentation sludge under different pH conditions for production of volatile fatty acids. Chemosphere 2018, 194, 692–700. [Google Scholar] [CrossRef] [PubMed]
  16. Wu, S.X.; Chen, L.; Zhu, J.; Walquist, M.; Christian, D. Pre-digestion to enhance volatile fatty acids (VFAs) concentration as a carbon source for denitrification in treatment of liquid swine manure. J. Environ. Sci. Health Part A Toxic Hazard. Subst. Environ. Eng. 2018, 53, 891–898. [Google Scholar] [CrossRef] [PubMed]
  17. Wang, J.; Liang, J.; Ning, D.; Zhang, T.; Wang, M. A review of biomass immobilization in anammox and partial nitrification/anammox systems: Advances, issues, and future perspectives. Sci. Total Environ. 2022, 821, 152792. [Google Scholar] [CrossRef] [PubMed]
  18. Qiao, D.; Liu, H.; Yu, L.; Bao, X.; Simon, G.P.; Petinakis, E.; Chen, L. Preparation and characterization of slow-release fertilizer encapsulated by starch-based superabsorbent polymer. Carbohydr. Polym. 2016, 147, 146–154. [Google Scholar] [CrossRef]
  19. Yang, Y.; Li, Y.; Gu, Z.; Lu, F.; Xia, S.; Hermanowicz, S. Quick start-up and stable operation of a one-stage deammonification reactor with a low quantity of AOB and ANAMMOX biomass. Sci. Total Environ. 2019, 654, 933–941. [Google Scholar] [CrossRef]
  20. Ahmad, M.; Liu, S.; Mahmood, N.; Mahmood, A.; Ali, M.; Zheng, M.; Ni, J. Effects of porous carrier size on biofilm development, microbial distribution and nitrogen removal in microaerobic bioreactors. Bioresour. Technol. 2017, 234, 360–369. [Google Scholar] [CrossRef]
  21. Van de Graaf, A.A.; de Bruijn, P.; Robertson, L.A.; Jetten, M.S.M.; Kuenen, J.G. Autotrophic growth of anaerobic ammonium-oxidizing micro-organisms in a fluidized bed reactor. Microbiology 1996, 142, 2187–2196. [Google Scholar] [CrossRef]
  22. Kalyuzhnyi, S.; Gladchenko, M. DEAMOX—New microbiological process of nitrogen removal from strong nitrogenous wastewater. Desalination 2009, 248, 783–793. [Google Scholar] [CrossRef]
  23. Xiong, R.; Yu, X.; Yu, L.; Peng, Z.; Cheng, L.; Li, T.; Fan, P. Biological denitrification using polycaprolactone-peanut shell as slow-release carbon source treating drainage of municipal WWTP. Chemosphere 2019, 235, 434–439. [Google Scholar] [CrossRef] [PubMed]
  24. Xiong, R.; Yu, X.; Zhang, Y.; Peng, Z.; Yu, L.; Cheng, L.; Li, T. Comparison of agricultural wastes and synthetic macromolecules as solid carbon source in treating low carbon nitrogen wastewater. Sci. Total Environ. 2020, 739, 139885. [Google Scholar] [CrossRef]
  25. Jenni, S.; Vlaeminck, S.E.; Morgenroth, E.; Udert, K.M. Successful application of nitritation/anammox to wastewater with elevated organic carbon to ammonia ratios. Water Res. 2014, 49, 316–326. [Google Scholar] [CrossRef]
  26. Hu, H.; Liao, K.; Geng, J.; Xu, K.; Huang, H.; Wang, J.; Ren, H. Removal Characteristics of Dissolved Organic Nitrogen and Its Bioavailable Portion in a Postdenitrifying Biofilter: Effect of the C/N Ratio. Environ. Sci. Technol. 2018, 52, 757–764. [Google Scholar] [CrossRef]
  27. Yu, G.; Peng, H.; Fu, Y.; Yan, X.; Du, C.; Chen, H. Enhanced nitrogen removal of low C/N wastewater in constructed wetlands with co-immobilizing solid carbon source and denitrifying bacteria. Bioresour. Technol. 2019, 280, 337–344. [Google Scholar] [CrossRef]
  28. Wang, W.; Wang, X.; Wang, S.; Li, J. Partial denitrification coupled with immobilization of anammox in a continuous upflow reactor. RSC Adv. 2018, 8, 32016–32021. [Google Scholar] [CrossRef]
  29. Park, S.; Bae, W.; Rittmann, B.E. Multi-species nitrifying biofilm model (MSNBM) including free ammonia and free nitrous acid inhibition and oxygen limitation. Biotechnol. Bioeng. 2010, 105, 1115–1130. [Google Scholar] [CrossRef]
  30. Li, J.; Zhang, L.; Peng, Y.; Zhang, Q. Effect of low COD/N ratios on stability of single-stage partial nitritation/anammox (SPN/A) process in a long-term operation. Bioresour. Technol. 2017, 244, 192–197. [Google Scholar] [CrossRef]
  31. Li, B.; Wang, Y.; Guo, Y.; Wang, W.; Huang, X.; Wang, Z. Partial nitrification coupled with anammox in a biofilter reactor (BR) of large height-to-diameter ratio for treatment of wastewater with low C/N. Process Biochem. 2021, 104, 19–26. [Google Scholar] [CrossRef]
  32. Niu, W.; Guo, J.; Lian, J.; Song, Y.; Lu, C.; Li, H.; Han, Y.; Yin, P. Rapid start-up of denitrifying granular sludge by dosing with semi-starvation fluctuation C/N ratio strategy. Bioresour. Technol. 2017, 241, 945–950. [Google Scholar] [CrossRef] [PubMed]
Figure 1. Experimental setup.
Water 15 01919 g001
Figure 2. Preparation process of the embedded bio-organic carrier.
Water 15 01919 g002
Figure 3. The removal performance of NH4+-N and NOX-N.
Water 15 01919 g003
Figure 4. The removal performance of TN and COD.
Water 15 01919 g004
Figure 5. Comparison of nitrogen removal between different layers: (a) NO3-N; (b) NH4+-N.
Water 15 01919 g005
Figure 6. Percentage of nitrogen conversion pathways in different carrier layers: (a) bottom gravel layer; (b) middle organic carrier layer.
Water 15 01919 g006
Figure 7. Distribution of bacterial community at genus level on day 133 in phase III.
Water 15 01919 g007
Figure 8. Nitrogen removal mechanism.
Water 15 01919 g008
Table 1. Simulated wastewater composition at different mixing ratios.
Experimental PhaseNH4+-N
(mg·L−1)
NO2-N
(mg·L−1)
NO3-N
(mg·L−1)
COD
(mg·L−1)
TP
(mg·L−1)
C/NTime
(d)
I5010300.502.001–48
1008601.253.3349–94
1008771.404.2395–133
1308771.903.67134–168
Disclaimer/Publisher’s Note: The statements, opinions and data contained in all publications are solely those of the individual author(s) and contributor(s) and not of MDPI and/or the editor(s). MDPI and/or the editor(s) disclaim responsibility for any injury to people or property resulting from any ideas, methods, instructions or products referred to in the content.