Abstract
Many researchers have reported relationships of physical and chemical properties with water erosion; however, little is known about microbiological properties in this context. Thus, the aim of this study was to evaluate soil properties in relation to erosion in areas with different cropping system practices under no-tillage in the Brazilian Cerrado. The experiment has been carried out since 2014 in a Typic Haplustox under soybean (S) and maize (M) monoculture, maize/soybean annual rotation (MS), maize/brachiaria/soybean/brachiaria rotation (MBSB), two of those treatments with high input of fertilizer (MBSB-HI and MS-HI), and bare soil (BS). Soil losses were quantified in erosion plots. The design was completely randomized. The greater vegetation cover crop, provided by intercropping/succession with brachiaria, increased microbial biomass carbon. The lack of vegetation cover affected the basal soil respiration and metabolic quotient. Basal soil respiration proved to be inversely related to soil and water losses. Vegetation cover was a key factor regulating water erosion. Penetration resistance and aggregate stability correlated with soil and water losses. Thus, not only physical and chemical, but also biological properties are deeply affected by erosion, aiding in early monitoring of water erosion. Soil quality improvement in ecologically supported management contributes to mitigating erosion.
1. Introduction
The sustainable use of environmental resources and their conservation is a current issue that has attracted worldwide attention. Soils play a central role in this context, as they are an important part of the water cycle and the basis for healthy food production. Nonetheless, soil functions are threatened by land use changes combined with the intensification of agricultural systems, which have proved to lead to soil degradation, reducing its production capacity. High soil erosion rates and a decline in soil physical and chemical quality are examples of harmful impacts that directly affect the food production capacity necessary for a growing population [1,2]. However, there is a lack of information on the relationship between soil microbiological properties and soil erosion processes.
It is evident, therefore, that there is a need to quantify and assess the environmental impacts resulting from land use changes to determine the real capacity of soil use, exploiting production potential while mitigating degradation of natural resources. In this respect soil conservation practices can be important tools for farmers to intensify land use while avoiding acceleration of erosion processes. Otherwise, inadequate soil management can promote erosion rates that deplete soil quality and, consequently, the production capacity of the land [2,3,4,5].
The no-tillage system is a set of conservation practices already widely used in the Brazilian Cerrado and with notable benefits in terms of soil and water conservation. Maintaining crop stover on the soil surface reduces the impact of raindrops, preventing surface sealing, favoring infiltration, and decreasing surface runoff, and consequently controlling the removal of the soil surface layer by water erosion. Considering that the topsoil of the soil layer is the richest in nutrients, organic carbon, and biodiversity, the no-tillage system, when well-managed, acts as a provider of soil quality. An example of improvement of soil physical, chemical, and biological quality is the increase in carbon stocks, which has great importance for soil aggregation and porosity, as observed by Mota et al. [6], for the release of nutrients, and for the maintenance and survival of microbiota.
Microbial properties can be considered good and quick-response indicators of soil quality [7], although they are still little assessed in studies evaluating soil conservation techniques. The metabolic activity of the microbiota can be detected before some significant evidence of change in the soil physical and chemical properties. For that reason, the activity of soil microorganisms is a sensitive indicator of soil quality [8,9,10,11] and may be related to soil susceptibility to erosion processes. The relationship between soil erosion and microbial properties is not yet well understood, although some efforts toward understanding have been made recently, such as the study of Qui et al. [12], which reported negative impacts related to soil erosion on soil microbial communities.
In this context, we hypothesized that microbiological properties can aid in early monitoring of the effects of water erosion, since they can be more sensitive and indicate changes in soil quality more quickly. Therefore, the aim of this study was to relate microbiological properties with soil losses due to water erosion in areas under different cropping practices in no-tillage systems in the Brazilian Cerrado. Different crop rotation systems were investigated, assessing overall soil quality but focusing on the relationship between biological quality and susceptibility to water erosion.
2. Materials and Methods
The experiment was conducted on the Brazilian Agricultural Research Corporation (Embrapa) experimental farm in the municipality of Sete Lagoas in the central region of the state of Minas Gerais, Brazil, at 19°28′30″ S and 44°15′08″ W and average elevation of 732 m. The soil in the experimental site was classified as Typic Haplustox [13], corresponding to a Latossolo Vermelho distrófico típico [14], found in a landscape with an average slope of 8%, characterized as gently sloping. The predominant climate in the region is humid subtropical (Cwa) according to the Köppen classification, with an average annual temperature of 20 °C and mean annual rainfall of 1416 mm [15], mainly concentrated from October to April (Figure 1). This region has a characteristic dry season with frequent occurrence of dry spells during the rainy season [16].
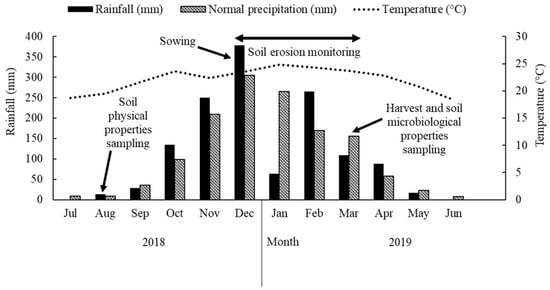
Figure 1.
Daily average temperature and monthly precipitation data during the monitoring period (August 2018 to July 2019). The normal precipitation corresponds to the period from 1927 to 2013. Adapted from Silva et al. [16].
The treatments were set up in the 2014/2015 agricultural year in a total area of 4.4 ha (Figure 2). Prior to the experiment setting up, the area had been used for maize and soybean production under conventional soil tillage for more than two decades. The experiment was prepared first by chisel plowing the soil to a depth of 25 cm to mitigate compaction. Dolomitic limestone and agricultural gypsum were applied and incorporated into the soil profile with a moldboard plow and a disk plow. The experimental site was then separated into stripes with terraces between them, creating a single large experimental block, with each stripe corresponding to a treatment (Figure 2).
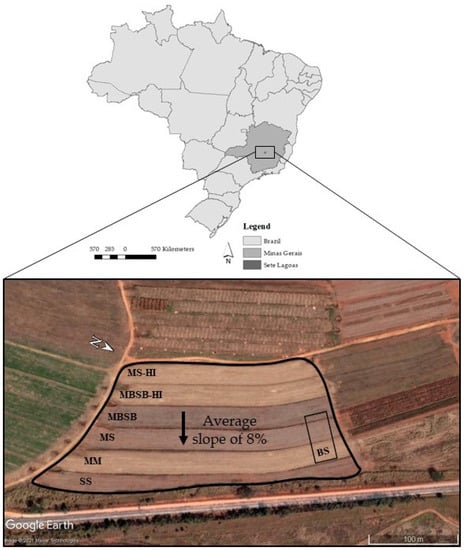
Figure 2.
Aerial image of the experimental site in Sete Lagoas, central region of the state of Minas Gerais, Brazil. SS = soybean monoculture, MM = maize monoculture, MS = maize/soybean annual rotation, MBSB = maize/brachiaria/soybean/brachiaria rotation, BS = bare soil, and HI = high input of fertilizers.
The treatments differed by soil management practices such as different crop rotation systems and different levels of fertilizer input. Monocultures of soybean (SS) and maize (MM) were compared to rotation systems of maize-soybean (MS) and maize-Brachiaria-soybean-Brachiaria (MBSB) and two additional treatments with a high level of fertilizer input, designated MS-HI and MBSB-HI, while the other treatments were maintained with a medium fertilizer input. The amounts of fertilizers applied were 148, 250, 250, 250, 415 and 415 kg ha−1 of NPK 08-28-16 + 0.3% boron and 2.1% sulfur for the treatments SS, MM, MS, MBSB, MBSB-HI, and MS-HI, respectively. For the 2018/2019 crop season, maize was grown in MS and MBSB treatments, and soybeans in MSSB-HI and MS-HI.
In the 2018/2019 crop season, the seeds of brachiaria (Urochloa brizantha syn. Brachiaria brizantha) cv. BRS Piatã were sown at different times according to the crop used in intercropping, for treatments MBSB and MBSB-HI. Brachiaria seeds were mixed with fertilizers and sown in maize rows, simultaneously with the maize sowing. However, when Brachiaria was intercropped with soybean, the grass seeds were sown when the soybean plants reached the R5 growth stage, corresponding to the phenological stage of grain filling.
2.1. Erosion Assessment and Soil Sampling
In December 2018, three unitary erosion plots of 1 m2 (0.5 m width × 2 m length) were implemented for each treatment, arranged with their length in the direction of the slope. Erosion plots were delimited by galvanized zinc sheet metal inserted 0.20 m into the soil and kept 0.20 m above the soil surface. At the lower end of each plot, there was a 20 L container for storing water and sediments from runoff and the transported soil particles.
From December 2018 to March 2019, samples were collected after rainfall events. The runoff volume was fully measured. Meanwhile, for evaluation of soil loss, after homogenizing the solution, we sampled 250 mL in each collecting container positioned at the plots, to later quantify the sediments in the laboratory by the gravimetric method. The slope of each plot was measured individually, ranging from 7% to 10%. For standardization, the values of water and soil losses were corrected considering a slope of 9%, according to Wishmeier and Smitsh [17].
Soil and plant residues were sampled within each erosion plot. The plant residues on the surface were manually collected to quantify the soil cover rate. Soil samples were collected in crop rows and in interrows at a 0–10 cm depth, for a total of 39 disturbed and 21 undisturbed soil samples. A separation between crop row and interrow was not made for the bare soil plots, as this treatment remained without plants throughout the experiment. Samples were taken when maize and soybean were at the grain maturation phase.
2.2. Soil Physical Quality Indicators
Soil penetration resistance was assessed under field conditions using a Stolf impact penetrometer [18] within the erosion plots. Simultaneously, soil cores were collected at 0–20 cm, 20–40 cm, and 40–60 cm deep, to quantify the soil water content in a laboratory by the gravimetric method.
The undisturbed soil samples were saturated for determination of total porosity. Microporosity was determined using Buchner funnel suction units for a matric potential of −6 kPa, and macroporosity was calculated by the difference between total porosity and microporosity [19,20]. Soil bulk density was determined after oven-drying the undisturbed samples at 105 °C [21].
For aggregate stability analysis, aggregates with diameters between 8 and 4.75 mm were subjected to the wet-sieving method with Yoder-type equipment [22]. Particle size analysis was performed by the pipette method [21].
2.3. Soil Chemical Quality Indicators
Particles of 2 mm were separated for soil fertility and organic matter analysis. The following chemical attributes were evaluated: pH in water; phosphorus and potassium, obtained by the Mehlich-1 method; calcium and magnesium, determined using the potassium chloride (KCl) extractor; and organic matter content, estimated by dry combustion. All analyses were performed using the protocols described in Teixeira et al. [23].
2.4. Soil Biological Quality Indicators
For analysis of microbial biomass carbon and soil basal respiration, particles smaller than 1 mm were separated and kept under refrigeration. Basal soil respiration (BSR) was estimated by incubation [24], using sodium hydroxide to capture the carbon dioxide released by the microorganisms. After 3 days, 0.5 M barium chloride was added to stop the reaction with carbon dioxide from air. The reaction indicator used was phenolphthalein and the titrant was 0.05 M hydrochloric acid.
Microbial biomass carbon (MBC) was quantified by the fumigation-extraction method [25], dividing the samples into control and fumigated samples and incubating them for 24 h with the addition of potassium sulfate and stirring them at 120 rpm for 30 min. The samples were then filtered to obtain the carbon extract, which was boiled for 5 min with potassium dichromate, sulfuric acid, and phosphoric acid. The indicator used for titration was diphenylamine with ammoniacal ferrous sulfate. The metabolic quotient was determined according to Anderson and Domsch [26] as the ratio between BSR and MBC.
The hydrolysis of fluorescein diacetate (FDA) was determined by the method proposed by Dick, Breakwell, and Turco [27]. Sodium phosphate buffer solution was added to the soil samples at pH 7.0 with fluorescein diacetate and incubated under rotation at 3840 rpm for 24 h at 35 °C. The reaction was stopped with acetone and samples were stirred for 5 min. Then, the samples were filtered and read in a spectrophotometer at 490 nm. For the control samples, the same procedures were performed, except for addition of fluorescein diacetate.
2.5. Data Analysis
Considering the study area formed by a large experimental block, a completely randomized design was adopted, as recommended by Ferreira et al. [28] and successfully used in previous studies of long-term field experiments [29,30] and also in the same experiment in anterior studies [6,16,31]. Thus, for soil losses, water losses, penetration resistance, total porosity, macroporosity, microporosity, and soil bulk density, the different cropping systems (seven treatments) were evaluated. As for the other variables (i.e., chemical and biological indicators), the same treatments were evaluated considering two different positions from the crop rows and interrows. Soil losses by erosion and water losses by runoff were log-transformed due to heteroscedasticity. After checking the assumptions, analysis of variance (ANOVA) and Tukey’s test at 5% probability were performed. Pearson’s correlation matrix and a principal component analysis (PCA) were performed as an aid for understanding data variance and the relationships between the variables evaluated.
3. Results
3.1. Soil Losses, Water Losses, and Soil Physical Indicators
Table 1 shows the soil losses (SL), water losses (WL), cover rate (CR), total porosity (TP), macroporosity (Ma), microporosity (Mi), and bulk density (Bd) for the treatments evaluated during the field experiment. The highest values of SL and WL were found for the soybean monoculture (SS) and bare soil (BS), both showing similar losses. No differences were found for the soil physical properties shown in Table 1.

Table 1.
Soil losses, water losses, cover rate, total porosity, macroporosity, microporosity, and bulk density for each treatment evaluated.
The in-field penetration resistance (PR) and the soil moisture at this evaluation moment are shown in Figure 3. Considering the top soil layer (0 to 10 cm), the most prone to water erosion, it is observed that the highest PR were in the SS and BS treatments, with averages of 3.88 and 4.26 MPa, respectively. In contrast, the lowest PR was observed in the MBSB-HI treatment (2.02 MPa), where the smallest losses of sediment and water were also obtained. Soil moisture showed significant differences at the surface (0–20 cm depth) and subsurface (20–40 cm depth) soil layers. These differences may restrict conclusions about the mechanical impedance of PR itself, as PR is strongly affected by soil moisture; the two are negatively correlated. However, maximum variation in the soil moisture range among treatments is only 27.2–32.7% at the 0–20 cm depth. Although soil moisture affects the PR, the BS showed greater PR at the 0–20 cm depth. Furthermore, MBSB-HI showed lower PR than SS, even though it had higher soil moisture than SS.
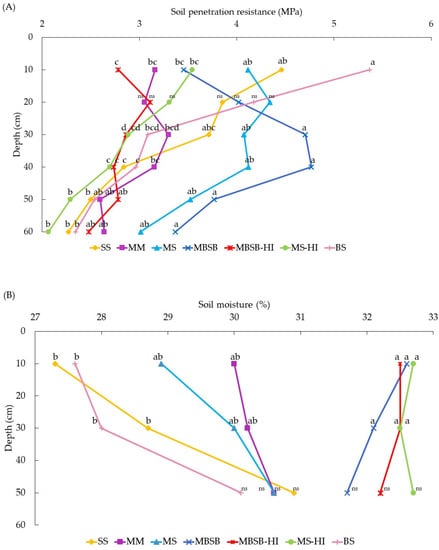
Figure 3.
Soil penetration resistance (PR) for each treatment assessing 0–60 cm (A) and soil moisture (B) for three different depths (0–20 cm, 20–40 cm, and 40–60 cm) at the time of evaluation of soil penetration resistance. Means followed by different letters among treatments differ by Tukey’s test (p < 0.05). SS = soybean monoculture, MM = maize monoculture, MS = maize/soybean annual rotation, MBSB = maize/brachiaria/soybean/brachiaria rotation, BS = bare soil, HI = high input of fertilizers, and ns = not significant.
3.2. Physical, Chemical, and Microbiological Indicators in Crop Rows
The soil physical, chemical, and microbiological indicators for the crop rows are shown in Table 2. The treatments MBSB-HI and MBSB had higher MBC and FDA than the other treatments. A high variance among replicates was found for BSR, which restricted the evidence of differences between treatments. In general, regarding BSR, the MM treatment had a higher basal respiration rate than the SS and BS treatments. MS-HI also showed higher basal respiration than SS did. The MM and MS-HI treatments exhibited high qCO2, which is an ecosystem stress indicator. In addition, MM had lower MBC than BS did and this was lower than all the treatments that used crop rotation. The FDA in MM had the lowest value, but it did not differ from SS, MS-HI, and BS. The lowest concentration of phosphorus was observed in the MBSB treatment, differing from MS. We did not find differences among the treatments for organic carbon, calcium, GMD, and MWD.
Table 2.
Physical, chemical, and microbiological indicators evaluated in crop rows for each treatment.
The correlation matrix between the variables observed in crop rows is shown in Figure 4 and the PCA is presented in Figure 5. According to Vieira (2018), the linear correlation coefficient can have an inverse correlation (negative values) or direct correlation (positive values), and correlations can be classified as small (0 ≤ r < 0.25), weak (0.25 ≤ r < 0.50), moderate (0.50 ≤ r < 0.75), strong (0.75 ≤ r < 1.00), or perfect (r = 1.00).
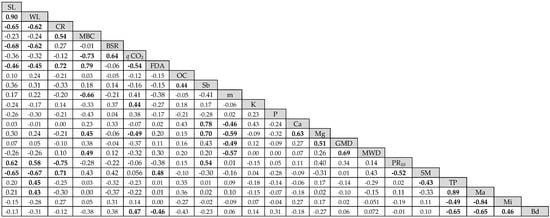
Figure 4.
Pearson correlation matrix for variables sampled in crop rows. SL = soil losses, WL = water losses, CR = cover rate, MBC = microbial biomass carbon, BSR = basal soil respiration, qCO2 = metabolic quotient, FDA = fluorescein diacetate hydrolysis, OC = soil organic carbon, Sb = sum of bases, m = aluminum saturation of soil, K = potassium, P = phosphorus, Ca = calcium, Mg = magnesium, MWD = mean weight diameter, GMD = geometric mean diameter, PR10 = soil resistance to root penetration at 10 cm depth, SM = soil moisture in situ, TP = total porosity, Ma = macroporosity, Mi = microporosity, and Bd = bulk density. Values in bold print: significant at 5%.
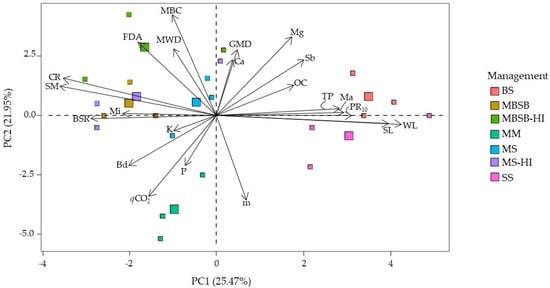
Figure 5.
Principal component analysis for variables sampled in the crop rows. SL = soil losses, WL = water losses, CR = cover rate, MBC = microbial biomass carbon, BSR = basal soil respiration, qCO2 = metabolic quotient, FDA = fluorescein diacetate hydrolysis, OC = soil organic carbon, Sb = sum of bases, m = aluminum saturation of soil, K = potassium, P = phosphorus, Ca = calcium, Mg = magnesium, MWD = mean weight diameter, GMD = geometric mean diameter, PR10 = soil resistance to root penetration at 10 cm depth, SM = soil moisture in situ, TP = total porosity, Ma = macroporosity, Mi = microporosity, Bd = bulk density, SS = soybean monoculture, MM = maize monoculture, MS = maize/soybean annual rotation, MBSB = maize/brachiaria/soybean/brachiaria rotation, BS = bare soil, and HI = high input of fertilizers.
SL correlated directly and strongly with WL and moderately with PR10, and it moderately and inversely correlated with CR, BSR, and SM, and weakly correlated with FDA. The same correlations were observed for WL, indicating that these soil physical and microbiological properties are associated with soil and water losses. The soil vegetation cover rate (CR), however, was positively correlated with MBC, FDA, and SM, and negatively correlated with PR10. In both cases, the correlation was moderate.
MBC was strongly correlated with FDA; moderately correlated with qCO2, Sb, and m, and weakly correlated with Mg and MWD. qCO2 was negatively correlated with FDA (moderate) and Mg (weak), although the FDA had a moderate correlation coefficient with SM and Bd.
The soil chemical indicators, i.e., organic carbon, sum of bases, aluminum saturation of soil, potassium, phosphorus, calcium, magnesium; other soil physical indicators, i.e., total porosity, macroporosity, microporosity, GMD, MWD, and bulk density; and some microbiological indicators, MBC and qCO2, do not show correlations with soil and water losses, indicating that they do not provide evidence of association with water erosion under the conditions of our study.
The PCA reinforces, in general, that the BS and SS treatments were strong components of the WL, SL, and PR10 variations, and inversely related to the soil cover rate. Among the variables, the basal respiration rate was negatively correlated with soil and water losses and was positively correlated with soil cover rate, providing useful insights regarding the relationship between soil erosion and microbial activity.
3.3. Physical, Chemical, and Microbiological Indicators in Crop Interrows
The soil physical, chemical, and microbiological indicators observed at the crop interrows are shown in Table 3. The MBSB-HI treatment, as per what occurred for crop rows, had the highest MBC and the lowest qCO2 among the treatments. The FDA of MBSB-HI had the lowest value among the treatments, being statistically equal to SS, MS, and BS, differently to what was observed in the crop rows. The lowest MBC value, in this case, was observed in the MS treatment, which also had high BSR and the highest qCO2, indicating possible agroecosystem stress. For the crop rows, however, this response was observed for the MM treatment. In general, the values obtained for MBC, BSR, and qCO2 for the interrow were higher than the values for the crop row (Table 2), showing that vegetation cover is necessary to the agroecosystem’s balance. The MS-HI treatment did not show significant differences regarding K and Ca in relation to the other treatments, except for MM (for both elements) and MBSB (only for K). For Mg, however, only MBSB-HI and MS differed from SS and MM. Organic carbon, GMD, and MWD did not show differences among the treatments.
Table 3.
Physical, chemical, and microbiological indicators evaluated in crop interrows for each treatment.
The Pearson correlation matrix showing the correlation between the soil erosion indicators and the soil physical, chemical, and microbiological properties evaluated in the interrows is shown in Figure 6, and its PCA in Figure 7. In the interrows SL correlated strongly and positively with WL, just as in the row, and these losses correlated moderately and negatively with CR, resulting in the same linear correlation coefficient values for both. In addition, soil and water losses were positively and moderately correlated with PR10.
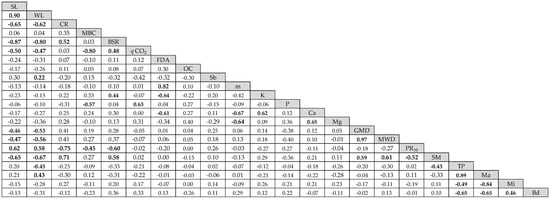
Figure 6.
Pearson correlation matrix for variables sampled in crop interrows. SL = soil losses, WL = water losses, CR = cover rate, MBC = microbial biomass carbon, BSR = basal soil respiration, qCO2 = metabolic quotient, FDA = fluorescein diacetate hydrolysis, Sb = sum of bases, m = aluminum saturation of soil, Mg = magnesium, MWD = mean weight diameter, PR10 = soil resistance to root penetration at 10 cm depth, SM = soil moisture in situ, and Bd = bulk density. Values in bold print: significant at 5%.
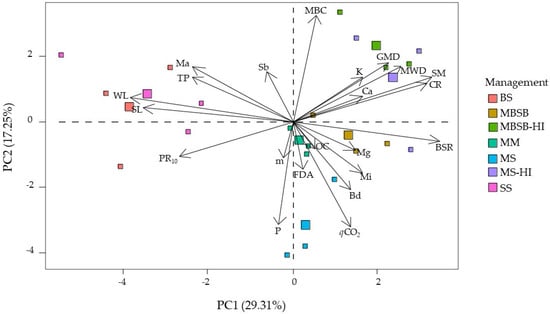
Figure 7.
Principal component analysis for variables sampled in crop interrows. SL = soil losses, WL = water losses, CR = cover rate, MBC = microbial biomass carbon, BSR = basal soil respiration, qCO2 = metabolic quotient, FDA = fluorescein diacetate hydrolysis, OC = soil organic carbon, Sb = sum of bases, m = aluminum saturation of soil, K = potassium, P = phosphorus, Ca = calcium, Mg = magnesium, MWD = mean weight diameter, GMD = geometric mean diameter, PR10 = soil resistance to root penetration at 10 cm depth, SM = soil moisture in situ, TP = total porosity, Ma = macroporosity, Mi = microporosity, Bd = bulk density, SS = soybean monoculture, MM = maize monoculture, MS = maize/soybean rotation, MBSB = maize/brachiaria/soybean/brachiaria rotation, BS = bare soil, and HI = high input of fertilizers.
Both SL and WL showed a strong inverse correlation with BSR (Figure 6), stronger than that observed for these indicators for the crop row data (Figure 4). Furthermore, SL and WL were significantly inversely correlated with CR, qCO2, GMD, MWD, and SM. CR was not correlated with MBC, but had a strong positive correlation with BSR. BSR was moderately correlated with PR10, and SM; and FDA was inversely correlated with K and Ca.
The PCA (Figure 7) shows that soil and water losses were correlated with soil physical properties, positively correlated with PR10 and negatively correlated with GMD and MWD. In addition, the BSR microbiological property was negatively correlated with SL and WL, just as observed for data from the crop rows (Figure 5). In general, treatments with cover crops or crop rotation led to improved soil microbiological and chemical properties, whereas the BS and SS monoculture systems led to a loss of soil physical quality (mainly PR10).
4. Discussion
The high soil and water losses for the SS treatment indicate that soybean monoculture is a system of low sustainability in the Cerrado and high susceptible to water erosion, and it similar to a bare soil surface (like the BS treatment). Those conditions are explained by the low production of biomass, thus not promoting enough covering to protect the soil surface against the impact of raindrops. Soybean stover not only has low biomass production compared to grasses (e.g., maize and brachiaria), it also has high nitrogen content, i.e., a low C/N ratio, therefore being rapidly decomposed without providing permanent protection to the soil surface [32]. Furthermore, the surface sealing due to the direct impact of raindrop causes a reduction in soil water infiltration rates, increasing direct runoff and, consequently, water and soil losses [33]. Conversely, treatments with more stover production, e.g., due to inclusion of Urochloa sp. or due to maize biomass production [34], reduce water and soil losses.
No differences were found for the soil physical properties shown in Table 1. Therefore, the duration of our study was not sufficient to provide strong evidence of differences in soil physical quality evaluated by porosity and static indicators, even though it showed strong differences when evaluating dynamic attributes, such as soil and water losses, as discussed above. In the same experimental area, Mota et al. [6] observed that porosity-based indicators did not correlate with grain yield, but the pore size distribution indicator and organic carbon were effective in distinguishing the cropping systems. Silva et al. [16], in the same experimental area, observed that soil and water losses were negatively correlated with crop yield and vegetation cover rate. Therefore, these findings and the absence of differences in porosity-based indicators further reinforces the role of vegetation cover as a key factor in controlling the erosive process. The soil aggregation indicators GMD and MWD, the first representing the size of aggregates and the second the ratio of large size aggregates, can provide evidence regarding soil resistance to water erosion [35,36,37,38], since they can indicate the physical condition of the soil surface, providing insights regarding soil structural quality and infiltration capacity.
The soil physical indicator PR generated different insights. The lower PR observed in the MBSB-HI treatment can be explained by the abundance of grass roots in the upper soil layers and the time that had passed since the experiment was first set up (since the 2014/2015 crop year). This created so-called biopores through periodic renewal of the aggressive root system of brachiaria grass [39,40]. These biopores contribute to soil structure alleviation and improve soil porosity [41,42], which is crucial for water percolation in the soil profile and reduction of direct runoff. However, it is noteworthy that PR is strongly affected by soil moisture of the moment of its assessment, which showed significant differences, though in a relatively small range. Thus, it is difficult to draw conclusions based only on the results of PR, since treatments with lower soil moisture will have greater PR and vice versa, even if there are no differences in the mechanical impediment itself [18]. Meanwhile, Moura et al. [31], in the same experimental area, found that the least limiting water range indicator, which considers PR, distinguished the monoculture treatments (SS and MM) from the diversified crop systems already early in 2015/2016. PR could also contribute to these insights or predictions, since it may also encompass changes in soil structure due to biopores in diversified cropping systems, as already discussed.
Considering that the water supply is homogeneous throughout the area (only rainfed), the difference in in-field soil moisture can also provide useful insights about the differences among the cropping systems. The reduced soil moisture in the SS and BS treatments may be related to little or no stover over the soil surface (i.e., low cover rate), which causes an increase in soil temperature and evaporation. Furthermore, the absence of pores with diameters greater than that of the soil, coming from the stover, generates continuity of upward movement of water from the soil to the atmosphere, resulting in higher water loss by evaporation.
Soil and water losses also showed a negative correlation with in-field soil moisture. Several studies have reported the effect of antecedent soil moisture content on soil losses by erosion [43,44,45,46]. Soil water infiltration decreases as the soil moisture content increases. Thus, infiltration rate reduction leads to greater runoff and consequently greater soil loss.
The positive correlation between SL and WL highlights the direct impact of raindrops on the soil, which break down aggregates and carry away soil particles, organic material, and nutrients [47], and lead to surface sealing, reducing infiltration capacity and increasing direct runoff. The more elevated the water losses by runoff and soil losses by erosion transport, the greater the potential for decline in agricultural yield, and pollution of aquatic ecosystems [48].
The strong inverse relationship of SL and WL with BSR is a result of reduction in the richest organic layer of the soil. Organic compounds are a source of energy for microbial biomass, and reducing their quantity will inevitably reduce decomposition and, consequently, respiration [8,49]. The carryover of microorganisms previously attached to soil particles may also be a factor contributing to reduction in BSR. The increased WL due to surface sealing also contributes to BSR reduction, since there is less water infiltration and, consequently, soil water storage [50]. These findings were not reported for tropical soils, and could be relevant information for early diagnosis and monitoring of erosion processes. Future studies can investigate this microbiological indicator and calibrate reference values or relative indexes for on-farm management tools.
The higher MBC found in treatments with inclusion of brachiaria (MBSB-HI and MBSB) may be associated with the role of the grass in thermal and water insulation [34], which affects moisture, temperature, and plant residues on the soil surface. The higher values of MBC in more diversified cropping systems, considering the use of intercropped Urochloa sp., have already been reported by Araujo et al. [51], who found similar results, especially in the soil surface layer (0–10 cm), corroborating our results.
The study of Hoffmann et al. [8] states that the soil organic matter, mainly by quantifying the MBC, can reveal important data on the stock of soil organic components, which are closely linked to soil quality. Cândido et al. [52] also reported the importance of soil organic carbon for increasing soil quality and reducing soil erosion. This confirms the important role played by organic carbon in the sustainability of agricultural systems, affecting physical, chemical, and biological properties, with reflections on the stability of yield on production systems [52]. Thus, the maintenance of conservation management systems (e.g., no-tillage with intercropped brachiaria grass) is linked to the sustainability of production systems and a better plant development, leading to improvements in the agroecosystems and the environment itself.
Araujo et al. [51], working with maize in monoculture, also reported high qCO2, which indicates stress conditions of the soil microbial community, since a small microbial mass has a high energy consumption to maintain metabolic activity. In our study, the MBSB-HI and MBSB treatments had higher MBC and FDA compared to the other treatments. Thus, the sensitivity of MBC to different land uses indicates that treatments including brachiaria were more stable in terms of soil moisture and availability of organic matter and nutrients, resulting in an increase in the microbial population and, consequently, in metabolic activity. Therefore, qCO2 combined with high BSR may indicate environmental change due to higher energy consumption for soil organic matter decomposition.
Considering high BSR values, Odum [53] reported that respiration of the microbial community can be the first sign of imbalance, since energy is directed towards cell maintenance instead of growth and reproduction, leading to loss of C in the form of CO2. Furthermore, Hoffmann et al. [8] highlighted that cropping systems with greater plant diversity and less soil disturbance favor the MBC increase, possibly due to the greater offer of soil organic matter, thus providing greater soil quality.
5. Conclusions
Monoculture grain cropping systems of soybeans and maize contrasted with diverse cropping systems with soybean/maize rotation, intercropped brachiaria grass, and higher fertilization, regarding soil quality and water erosion. The higher soil losses by erosion (SL) and water losses by runoff (WL) occurred for soybean monoculture (SS) and bare soil treatment (BS), confirming the importance of maintaining crop stover over the soil surface over time.
Soil penetration resistance (PR) was important for distinguishing cropping systems, allowing recognition of better soil quality in cropping systems with intercropped grass. PR and aggregate stability indicators (GMD and MWD) were correlated with SL and WL, and this contributes to identifying erosion issues.
Cropping systems with intercropped brachiaria grass showed higher microbial biomass carbon (MBC) and basal soil respiration (BSR). BSR was negatively correlated with SL and WL, due to the removal of surface organic matter, which acts as source of energy for the microbiota. Soil without surface organic matter can lead to surface sealing, which reduces water infiltration and soil moisture, directly affecting microbiological communities and the erosion process. Therefore, higher BSR indicates lower soil and water losses and, consequently, better soil quality. These results provide useful insights regarding the close relationship between soil microbiological quality and intensity of the soil erosion process in cropping systems. Thus, not only physical and chemical, but also biological properties are deeply affected by erosion, aiding in early monitoring of water erosion. Soil quality improvement in ecologically supported management contributes to mitigating erosion.
Author Contributions
Conceptualization, J.C.A., M.L.N.S. and B.M.S.; methodology, M.N.M., J.C.A., L.d.C.M.d.S., O.O.d.S.A., E.B., F.M.d.S.M., M.S.T., Á.V.d.R., M.L.N.S. and B.M.S.; validation, M.N.M. and L.d.C.M.d.S.; formal analysis, M.N.M. and L.d.C.M.d.S.; investigation, M.N.M., J.C.A., L.d.C.M.d.S., O.O.d.S.A., E.B., F.M.d.S.M., M.S.T., Á.V.d.R., M.L.N.S. and B.M.S.; resources, J.C.A., E.B., F.M.d.S.M., Á.V.d.R. and B.M.S.; data curation, M.N.M., J.C.A., L.d.C.M.d.S. and B.M.S.; writing—original draft preparation, M.N.M. and L.d.C.M.d.S.; writing—review and editing, M.N.M., J.C.A., L.d.C.M.d.S., O.O.d.S.A., E.B., F.M.d.S.M., M.S.T., Á.V.d.R., M.L.N.S. and B.M.S.; supervision, J.C.A. and B.M.S.; project administration, J.C.A., E.B., Á.V.d.R. and B.M.S.; funding acquisition, J.C.A., E.B., Á.V.d.R. and B.M.S. All authors have read and agreed to the published version of the manuscript.
Funding
This study was funded by the Minas Gerais State Research Funding Foundation (FAPEMIG), processes CAG-APQ 01053-15, CAG—APQ-02075-16 and PPM-00774-18; the Brazilian National Council of Technological and Scientific Development (CNPq), processes 422538/2016-7, 408204/2016-8 and 306511-2017-7; the Agrisus Foundation, process 1491/15; and the Coordination for the Improvement of Higher Education Personnel (CAPES), process 001.
Acknowledgments
We acknowledge the financial support of FAPEMIG, CAPES, Agrisus, and CNPq. We are also grateful to the Department of Soil Science at the Federal University of Lavras, and the Brazilian Agricultural Research Corporation (Embrapa) for collaboration in setting up and conducting the field experiment.
Conflicts of Interest
The authors declare no conflict of interest.
References
- Khanchoul, K.; Boubehziz, S. Spatial variability of soil erodibility at el hammam catchment, northeast of algeria. Environ. Ecosyst. Sci. 2019, 3, 17–25. [Google Scholar] [CrossRef]
- Mello, G.; Bueno, C.R.P.; Pereira, G.T. Variabilidade espacial de perdas de solo, do potencial natural e risco de erosão em áreas intensamente cultivadas. Rev. Bras. Eng. Agríc. Ambient. 2006, 10, 315–322. [Google Scholar] [CrossRef][Green Version]
- Blake, W.H.; Rabinovich, A.; Wynants, M.; Kelly, C.; Nasseri, M.; Ngondya, I.; Patrick, A.; Mtei, K.; Munishi, L.; Boeckx, P.; et al. Soil erosion in East Africa: An interdisciplinary approach to realising pastoral land management change. Environ. Res. Lett. 2018, 13, 124014. [Google Scholar] [CrossRef]
- Borrelli, P.; Märker, M.; Panagos, P.; Schütt, B. Modeling soil erosion and river sediment yield for an intermountain drainage basin of the Central Apennines, Italy. CATENA 2014, 114, 45–58. [Google Scholar] [CrossRef]
- Oliveira, F.G.; Seraphim, O.J.; Borja, M.E.L. Estimativa de perdas de solo e do potencial natural de Erosão da bacia de contribuição da microcentral Hidrelétrica do Lageado, Botucatu—SP. Eng. Agríc. 2015, 30, 302–309. [Google Scholar] [CrossRef]
- Mota, P.K.; Silva, B.M.; Borghi, E.; Viana, J.H.M.; Resende, Á.V.; Moura, M.S. Soil physical quality in response to intensification of grain production systems. Rev. Bras. Eng. Agríc. Ambient. 2020, 24, 647–655. [Google Scholar] [CrossRef]
- Raghavendra, M.; Sharma, M.P.; Ramesh, A.; Richa, A.; Billore, S.D.; Verma, R.K. Soil Health Indicators: Methods and Applications. In Soil Analysis: Recent Trends and Applications; Springer: Singapore, 2020; pp. 221–253. [Google Scholar]
- Hoffmann, R.B.; Moreira, E.E.A.; Hoffmann, G.S.S.; Araújo, N.S.F. Efeito do manejo do solo no carbono da biomassa microbiana. Braz. J. Anim. Environ. Res. 2018, 1, 168–178. [Google Scholar]
- Gonçalves, V.A.; Melo, C.A.D.; Assis, I.R.; Ferreira, L.R.; Saraiva, D.T. Biomassa e atividade microbiana de solo sob diferentes sistemas de plantio e sucessões de culturas. Rev. Ciênc. Agrár. 2019, 62. [Google Scholar] [CrossRef]
- Souza, R.A.; Telles, T.S.; Machado, W.; Hungria, M.; Filho, J.T.; Guimarães, M.F. Effects of sugarcane harvesting with burning on the chemical and microbiological properties of the soil. Agric. Ecosyst. Environ. 2012, 155, 1–6. [Google Scholar] [CrossRef]
- Venzke Filho, S.P.; Feigl, B.J.; Piccolo, M.C.; Siqueira Neto, M.; Cerri, C.C. Biomassa microbiana do solo em sistema de plantio direto na região de Campos Gerais—Tibagi, PR. Rev. Bras. Ciênc. Solo 2008, 32, 599–610. [Google Scholar] [CrossRef]
- Qiu, L.; Zhang, Q.; Zhu, H.; Reich, P.B.; Banerjee, S.; van der Heijden, M.G.A.; Sadowsky, M.J.; Ishii, S.; Jia, X.; Shao, M.; et al. Erosion reduces soil microbial diversity, network complexity and multifunctionality. ISME J. 2021, 15, 2474–2489. [Google Scholar] [CrossRef] [PubMed]
- Soil Survey Staff. Keys to Soil Taxonomy, 12th ed.; USDA—Natural Resources Conservation Service: Washington, DC, USA, 2014.
- Santos, H.G.; Jacomine, P.K.T.; Anjos, L.H.C.; Oliveira, V.Á.; Lumbreras, J.F.; Coelho, M.R.; Almeida, J.A.; Araújo Filho, J.C.; Oliveira, J.B.; Cunha, T.J.F. Sistema Brasileiro de Classificação de Solos, 5th ed.; Embrapa Solos: Brasília, Brazil, 2018; ISBN 978-85-7035-800-4. [Google Scholar]
- Alvares, C.A.; Stape, J.L.; Sentelhas, P.C.; Gonçalves, J.L.M.; Sparovek, G. Köppen’s climate classification map for Brazil. Meteorol. Z. 2013, 22, 711–728. [Google Scholar] [CrossRef]
- Silva, L.C.M.; Avanzi, J.C.; Peixoto, D.S.; Merlo, M.N.; Borghi, E.; Resende, Á.V.; Acuña-Guzman, S.F.; Silva, B.M. Ecological intensification of cropping systems enhances soil functions, mitigates soil erosion, and promotes crop resilience to dry spells in the Brazilian Cerrado. Int. Soil Water Conserv. Res. 2021, 9, 591–604. [Google Scholar] [CrossRef]
- Wischmeier, W.H.; Smith, D.D. Predicting Rainfall Erosion Losses: A Guide to Conservation Planning; Department of Agriculture: Washington, DC, USA, 1978.
- Stolf, R.; Fernandes, J.; Furlani Neto, V.L. Recomendação Para o uso do Penetrômetro de Impacto—Modelo IAA/Planalsucar—Stolf; Piracicaba, Brazil. 1983. Available online: https://www.servidores.ufscar.br/hprubismar/arquivos10.htm (accessed on 29 December 2021).
- Grohmann, F. Distribuição e tamanho de poros em três tipos de solos do estado de São Paulo. Bragantia 1960, 19, 319–328. [Google Scholar] [CrossRef]
- Oliveira, L.B. Determinação da macro e microporosidade pela mesa de tensão em amostras de solo com estrutura indeformada. Pesqui. Agropecu. Bras. 1968, 3, 197–200. [Google Scholar]
- Flint, L.E.; Flint, A.A. Porosity. In Methods of Soil Analysis: Part 4, Physical Methods; Dane, J.H., Topp, G.C., Eds.; Soil Science Society of America Book Series; Soil Science Society of America: Madison, WI, USA, 2002; pp. 241–254. [Google Scholar]
- Kemper, W.D.; Rosenau, R.C. Aggregate Stability and Size Distribution. In Methods of Soil Analysis. Part 1, Physical and Mineralogical Methods, 2nd ed.; Klute, A., Ed.; Soil Science Society of America Book Series; American Society of Agronomy: Madison, WI, USA, 1986; pp. 425–442. [Google Scholar]
- Teixeira, P.C.; Donagemma, G.K.; Fontana, A.; Teixeira, W.G. Manual de Métodos de Análise de Solo, 3rd ed.; Embrapa Solos: Brasília, Brazil, 2017. [Google Scholar]
- Jenkinson, D.S.; Powlson, D.S. The effects of biocidal treatments on metabolism in soil—V. Soil Biol. Biochem. 1976, 8, 209–213. [Google Scholar] [CrossRef]
- Vance, E.D.; Brookes, P.C.; Jenkinson, D.S. An extraction method for measuring soil microbial biomass C. Soil Biol. Biochem. 1987, 19, 703–707. [Google Scholar] [CrossRef]
- Anderson, T.-H.; Domsch, K.H. Application of eco-physiological quotients (qCO2 and qD) on microbial biomasses from soils of different cropping histories. Soil Biol. Biochem. 1990, 22, 251–255. [Google Scholar] [CrossRef]
- Dick, R.P.; Breakwell, D.P.; Turco, R.F. Soil Enzyme Activities and Biodiversity Measurements as Integrative Microbiological Indicators. Methods Assess. Soil Qual. 1997, 49, 247–271. [Google Scholar]
- Ferreira, D.F.; Cargnelutti Filho, A.; Lúcio, A.D. Procedimentos estatísticos em planejamentos experimentais com restrição na casualização. In Boletim Informativo Sociedade Brasileira de Ciência do Solo; Sociedade Brasileira de Ciência do Solo: Campinas, Brazil, 2012; pp. 16–19. [Google Scholar]
- Cecagno, D.; Costa, S.E.V.G.A.; Anghinoni, I.; Kunrath, T.R.; Martins, A.P.; Reichert, J.M.; Gubiani, P.I.; Balerini, F.; Fink, J.R.; Carvalho, P.C.F. Least limiting water range and soybean yield in a long-term, no-till, integrated crop-livestock system under different grazing intensities. Soil Tillage Res. 2016, 156, 54–62. [Google Scholar] [CrossRef]
- Peixoto, D.S.; Silva, B.M.; Oliveira, G.C.; Moreira, S.G.; Silva, F.; Curi, N. A soil compaction diagnosis method for occasional tillage recommendation under continuous no tillage system in Brazil. Soil Tillage Res. 2019, 194, 104307. [Google Scholar] [CrossRef]
- Moura, M.S.; Silva, B.M.; Mota, P.K.; Borghi, E.; Resende, A.V.; Acuña-Guzman, S.F.; Araújo, G.S.S.; Silva, L.C.M.; Oliveira, G.C.; Curi, N. Soil management and diverse crop rotation can mitigate early-stage no-till compaction and improve least limiting water range in a Ferralsol. Agric. Water Manag. 2021, 243, 106523. [Google Scholar] [CrossRef]
- Andrade, A.T.; Torres, J.L.R.; Torres, J.L.R.; Paes, J.M.V.; Teixeira, C.M.; Condé, A.B.T. Desafios do Sistema Plantio Direto no Cerrado. Inf. Agropecu. 2018, 39, 18–26. [Google Scholar]
- Debiasi, H.; Franchini, C.F.; Gonçalves, S.L. Manejo da Compactação do Solo em Sistema de Produção de Soja Sob Semeadura Direta; Embrapa: Londrina, Brazil, 2008; Available online: https://www.infoteca.cnptia.embrapa.br/handle/doc/470946 (accessed on 29 December 2021).
- Wu, G.-L.; Yang, Z.; Cui, Z.; Liu, Y.; Fang, N.-F.; Shi, Z.-H. Mixed artificial grasslands with more roots improved mine soil infiltration capacity. J. Hydrol. 2016, 535, 54–60. [Google Scholar] [CrossRef]
- Le Bissonnais, Y.; Arrouays, D. Aggregate stability and assessment of soil crustability and erodibility: II. Application to humic loamy soils with various organic carbon contents. Eur. J. Soil Sci. 1997, 48, 39–48. [Google Scholar] [CrossRef]
- Wilson, H.A.; Browning, G.M. Soil Aggregation, Yields, Runoff, and Erosion as Affected by Cropping Systems. Soil Sci. Soc. Am. J. 1946, 10, 51–57. [Google Scholar] [CrossRef]
- Wischmeier, W.H.; Mannering, J.V. Relation of Soil Properties to its Erodibility. Soil Sci. Soc. Am. J. 1969, 33, 131–137. [Google Scholar] [CrossRef]
- Yoder, R.E. A Direct Method of Aggregate Analysis of Soils and a Study of the Physical Nature of Erosion Losses 1. Agron. J. 1936, 28, 337–351. [Google Scholar] [CrossRef]
- Crusciol, C.A.C.; Nascente, A.S.; Mateus, G.P.; Pariz, C.M.; Martins, P.O.; Borghi, E. Intercropping soybean and palisade grass for enhanced land use efficiency and revenue in a no till system. Eur. J. Agron. 2014, 58, 53–62. [Google Scholar] [CrossRef]
- Silva, R.F.; Severiano, E.C.; Oliveira, G.C.; Barbosa, S.M.; Peixoto, D.S.; Tassinari, D.; Silva, B.M.; Silva, S.H.G.; Dias Júnior, M.S.; Figueiredo, T.A.F.R. Changes in soil profile hydraulic properties and porosity as affected by deep tillage soil preparation and Brachiaria grass intercropping in a recent coffee plantation on a naturally dense Inceptisol. Soil Tillage Res. 2021, 213, 105127. [Google Scholar] [CrossRef]
- Williams, S.M.; Weil, R.R. Crop Cover Root Channels May Alleviate Soil Compaction Effects on Soybean Crop. Soil Sci. Soc. Am. J. 2004, 68, 1403–1409. [Google Scholar] [CrossRef]
- Ajayi, A.E.; Horn, R.; Rostek, J.; Uteau, D.; Peth, S. Evaluation of temporal changes in hydrostructural properties of regenerating permanent grassland soils based on shrinkage properties and μCT analysis. Soil Tillage Res. 2019, 185, 102–112. [Google Scholar] [CrossRef]
- Vaezi, A.; Haghani, Z. Effect of Soil Water Content on Runoff Production and Soil Loss from Rills in Field Experimental Plots in Different Slopes. Water Soil Sci. 2021, 31, 31–43. [Google Scholar]
- Nishigaki, T.; Sugihara, S.; Kilasara, M.; Funakawa, S. Surface Runoff Generation and Soil Loss Under Different Soil and Rainfall Properties in The Uluguru Mountains, Tanzania. Land Degrad. Dev. 2017, 28, 283–293. [Google Scholar] [CrossRef]
- Wei, L.; Zhang, B.; Wang, M. Effects of antecedent soil moisture on runoff and soil erosion in alley cropping systems. Agric. Water Manag. 2007, 94, 54–62. [Google Scholar] [CrossRef]
- Luk, S.-H.; Hamilton, H. Experimental effects of antecedent moisture and soil strength on rainwash erosion of two luvisols, Ontario. Geoderma 1986, 37, 29–43. [Google Scholar] [CrossRef]
- Bertoni, J.; Lombardi Neto, F. Conservação do Solo, 9th ed.; Ícone: São Paulo, Brazil, 2014. [Google Scholar]
- Baldassarini, J.S.; Nunes, J.O.R. Estimação da perda de solo por processos erosivos em parcelas de monitoramento utilizando pinos de erosão em propriedades rurais do interior do Estado de São Paulo. Confins 2018. Available online: https://journals.openedition.org/confins/16084 (accessed on 29 December 2021). [CrossRef]
- Cattelan, A.J.; Vidor, C. Flutuações na biomassa, atividade e população microbiana do solo, em função de variações ambientais. Rev. Bras. Ciênc. Solo 1990, 14, 133–142. [Google Scholar]
- Silva, E.E.; Azevedo, P.H.S.; De-Polli, H. Determinação de Respiração Basal (RBS) e Quociente Metabólico do solo (qCO2); Comunidado Técnico 99—EMBRAPA Agrobiol: Seropédica, Brazil, 2007. [Google Scholar]
- Araujo, T.S.; Gallo, A.S.; Araujo, F.S.; Santos, L.C.; Guimarães, N.F.; Silva, R.F. Biomassa e atividade microbiana em solo cultivado com milho consorciado com leguminosas de cobertura. Rev. Ciênc. Agrár. 2019, 42, 347–357. [Google Scholar]
- Cândido, B.M.; Silva, M.L.N.; Curi, N.; Freitas, D.A.F.; Mincato, R.L.; Ferreira, M.M. Métodos de indexação de indicadores na avaliação da qualidade do solo em relação à erosão hídrica. Rev. Bras. Ciênc. Solo 2015, 39, 589–597. [Google Scholar] [CrossRef]
- Odum, E.P. Trends Expected in Stressed Ecosystems. Bioscience 1985, 35, 419–422. [Google Scholar] [CrossRef]
Publisher’s Note: MDPI stays neutral with regard to jurisdictional claims in published maps and institutional affiliations. |
© 2022 by the authors. Licensee MDPI, Basel, Switzerland. This article is an open access article distributed under the terms and conditions of the Creative Commons Attribution (CC BY) license (https://creativecommons.org/licenses/by/4.0/).