Article

Detection of Eight Cannabinoids and One Tracer in Wastewater and River Water by SPE-UPLC–ESI-MS/MS

by
Simone Milan
1,
Filomena Lelario
1,*,
Laura Scrano
2,*,
Chiara Ottati
3,
Sabino Aurelio Bufo
1,4 and
Maria de Fátima Alpendurada
5
1
Department of Sciences, University of Basilicata, 85100 Potenza, Italy
2
Department of European Cultures (DICEM), University of Basilicata, 75100 Matera, Italy
3
Tab Consulting S.r.l.s, 85100 Potenza, Italy
4
Department of Geography, Environmental Management & Energy Studies, University of Johannesburg, Johannesburg 2092, South Africa
5
IAREN—Instituto da Água da Região Norte, 4450-113 Porto, Portugal
*
Authors to whom correspondence should be addressed.
Water 2022, 14(4), 588; https://doi.org/10.3390/w14040588
Submission received: 3 January 2022 / Revised: 4 February 2022 / Accepted: 13 February 2022 / Published: 15 February 2022

Abstract

:
The consumption of illicit drugs represents a global social and economic problem. Using suitable analytical methods, monitoring, and detection of different illegal drugs residues and their metabolites in wastewater samples can help combat this problem. Our article defines a method to develop, validate, and practically applicate a rapid and robust analytical process for the evaluation of six naturally occurring cannabinoids (CBG, CBD, CBDV, CBN, THC, THCV), two cannabinoids in acidic form (CBDA, THCA-A), and the major cannabis-related human metabolite (THC-COOH). After SPE offline enrichment, we used a UPLC–ESI-MS/MS system, which permitted the determination of several by-products. Studied matrices were samples of different origins: (i) effluent water from a wastewater treatment plant in the Porto urban area; (ii) environmental water from Febros River, the last left-bank tributary of the Douro River. The multi-residue approach was substantiated and successfully employed to analyze the water samples collected in the above locations. The rapid and precise quantification of nine different cannabinoids in different water samples occurred within nine minutes at the ng L−1 level. The appearance of dozens of ng L−1 of some cannabis secondary metabolites, such as CBD, CBDA, CBN, THCA-A, indicates this plant species’ widespread usage among the general population in the considered area.

1. Introduction

Cannabis (Cannabis sativa L.) is a controversial plant species and the most used illicit drug worldwide [1,2,3]. Agreeing with the last World Drug Report from the United Nations Office of Drugs and Crime, its production and prevalence are not diminishing [4]. Instead, its use increased during the COVID-19 pandemic [5,6]. It remains the most diffused and accessible drug experienced by European citizens [7]; the Portuguese population is no exception [8,9,10]. The same trend is generally applicable for other drugs (i.e., amphetamine, cocaine) and “legal highs” (i.e., new psychoactive substances, synthetic cannabinoids) [11,12,13].
Hemp and marijuana are two distinct varieties of C. sativa. A cannabis plant with high cannabinoid and Δ9-tetrahydrocannabinol (THC) content is defined as marijuana [14], while hemp has a significantly lower THC content (i.e., <0.2%, w/dryw).
Among several hundred isolated compounds, cannabinoids are terpenophenolic secondary metabolites obtained with the alkylation of an olivetol such as alkyl resorcinol with a monoterpene unit [15,16]. They are classified according to their source and mainly into ten distinct structural types [17,18].
The consumption of illicit drugs represents a significant social and environmental problem [19,20]. More countries are adopting measures to regulate cannabis production and consumption [21].
Portugal permitted the ownership and usage of small amounts of all psychotropic substances in 2001 with the Decree-Law 30/2000 [22].
Since 2001, the legislation change appears to be correlated to a halved number of people convicted and imprisoned for drug trafficking [23]. Levels of drug use in Portugal have been steadily below the European standard over the past twenty years [24]. This survey is relevant, especially in the case of young people [25].
One of the Portuguese districts with a higher ranking for drug dealing infractions is Porto (the most populated municipality of northern Portugal), both in absolute values and rates per 100,000 inhabitants aged 15–64 years [26].
Still, stable regulations and randomized clinical trials cannot fully confirm cannabis’s beneficial properties for human health [27,28,29,30]. Additionally, more efforts are needed to inform physicians, clinicians, and patients [31,32].
Cannabis and related human metabolic by-products (HMs) are frequently present in environmental studies, representing a new ecological concern [33,34]. Monitoring and detecting cannabinoids (phyto-, synthetic, human metabolite tracers) in different matrices are of actual interest for food, human health, and environment-related reasons [35,36,37,38,39]. Analysis campaigns, including wastewater and environmental water resources, represent an excellent multi-purpose approach to detect illicit drugs, licit substances, abused pharmaceuticals, or other compounds (i.e., personal care products) [40]. Sewage epidemiology, sewage-based epidemiology, or forensic epidemiology using drugs in sewage are current definitions of such an approach [41,42]. Sewage epidemiology was initially proposed by Daughton [43] and applied for the first time to evaluate cocaine intake in Italy [44,45]. Sewage epidemiology represents a technologically advanced and rapidly growing field that monitors and assesses population consumption from excreted quantities of a drug residue/metabolite in environmental water samples. It has been beneficial in collecting society-wide data and individuating new psychoactive substances or emerging recreational drugs [46].
Cannabinoids, together with the related HMs (also called drug target residues), currently have high production and growth in consumption volumes (legal and illegal). They have been addressed as pseudo-persistent and environmentally emerging contaminants. The primary psychotropic cannabis compound, THC, and tracers for drug prevalence as human metabolic by-products are commonly analyzed in blood, serum, plasma, hair, and urine/oral fluids [47,48,49,50].
The presence of an HM in detectable concentrations at the inlet of sewage catchment areas such as a wastewater treatment plant (WWTP) and a sewage treatment plant is an indicator of significant drug use. These sewage epidemiology approaches are more often used to observe consumption trends and loads by directly measuring a specific drug of abuse or a related HM, thus estimating the consumption via back-calculations [51,52]. When a particular drug HM is found in effluent water (EWW), river water (RW), and surface water (SW), it represents a clear symptom of wide use across the general population or in a specific context [53,54].
Advanced analytical methodologies based on solid-phase extraction (SPE) liquid chromatography (LC) coupled to tandem mass spectrometry (MS/MS) and liquid chromatography coupled to high-resolution mass spectrometry (HRMS) are excellent tools in trace analysis for rapidity, sensitivity, and selectivity to screen and assess drug use at a large scale by wastewater and surface water sampling [55,56,57,58,59,60,61,62]. Such high-throughput screenings give non-intrusive measurements and helpful information, allowing estimation and comparison of “per capita” consumption [63,64]. The degree of drug abuse and range of used drugs can be assessed in an urban or metropolitan area, university cities, and small rural towns with no ethical risks such as individual labeling or stigmatization [65,66].
Wastewater analysis (WWA) and monitoring should be included as a measure of illicit drug consumption because they directly reflect observable consumption of all users and because they give comparable drug use estimation in several countries worldwide [67]. Moreover, WWA allows the spatial difference and temporal change estimates in a specific place and for specific drug use to be made, enabling the study of non-homogeneous trends [68]. In some cases, quantification (ng L−1 or mg day−1 per 1000 inhabitants) is in good agreement with officially reported prevalence data [69], thus more reliable than indirect methods (i.e., consumer interviews, population surveys, crime statistics, and drug seizures). WWA represents rapid and regular technologies (compared to traditional indirect methods) able to estimate illicit drug use and the international illicit drug market for which such data do not exist [70].
Target compounds or tracers to estimate drug of abuse consumption by sewage/wastewater and SW/RW analysis are derived compounds and consumption-related HMs. Often found in environmental water samples is marijuana’s main psychoactive component, THC, its acidic form Δ9-tetrahydrocannabinolic acid A (THCA-A), and the common HMs selected in WWA and sewage epidemiology as consumption biomarkers: the psychoactive 11-OH-THC, rapidly oxidized to form (-)-11-nor-9-carboxy-Δ9-THC (THC-COOH) and its glucuronide (THC-COOH-GLC) in the human body [71,72]. Moreover, two other natural cannabinoids, namely cannabinol (CBN) and cannabidiol (CBD), have been found in wastewater, urban groundwater [73,74], and airborne particulate matter [75]. Further, these two compounds have been found in the suspended solids and particulate phase of sewage sludge at significant levels [76]. Regarding sewage epidemiology approaches for cannabinoids and related HMs in Europe, the highest loads have been observed in Spain and the Netherlands compared to Croatia, Finland, and Italy [69,77]. No evident differences have been reported in seasonal variations and weekly patterns in load for this family of compounds; in fact, cannabis HMs have been found fairly consistently during weekend nights [78].
These compounds enter the aquatic environment as unaltered or slightly transformed metabolites via EWW. They have frequently been removed and transformed into different transformation products through transformation/degradation processes in both WWTPs and environmental conditions (i.e., air and aquatic ecosystems) [75].
THC-COOH is the more frequently detected cannabis-related HM in influent wastewater (IWW). Sometimes released in surface water (SW) and river water (RW), it is correlated to cannabis consumption and is linked to urine content in wastewater and the aquatic environment. THC-COOH is hydrolyzed, chlorinated, and photo-degraded mainly by sunlight and UV under controlled and EWW conditions [79]. We suggest measuring concentrations of THC-COOH in sewage suspended solid matter for epidemiologic approaches to correct THC-COOH concentrations, considering its adsorption onto suspended particulate matter (SPM). The total mass loads might be miscalculated by ignoring the particulate matter [78,80]. THC-COOH presents relatively high distribution coefficients; thus, adsorption might play a significant role in its overall removal during wastewater treatment [76].
Cannabinoids’ cumulative hazard quotients have been studied, and in some cases, sufficient concentrations to generate hazard quotients have been reported, indicating probable risks due to their presence. However, additional studies are recommended to fill the gap in toxicological data that does not allow environmental risk assessment or estimation of their potential adverse effects on aquatic systems [65]. Deeper investigations are also needed to better understand cannabis use in populations and assess prevention and treatment programs [81]. We suggest further studies to accurately indicate how cannabinoids can affect natural waters.
Cannabinoids used in sewage-based epidemiology through WWA approaches present several issues and require separate preconcentration protocols to overcome poor sensitivity and low recoveries [55].
Cannabidiolic acid (CBDA) is the acidic form of CBD; its homolog cannabidivarin (CBDV) has been recently studied for its negative modulations of the endocannabinoid system [31]. The THC precursor in the cannabis plant’s intricate biochemistry, cannabigerol (CBG), has been recently addressed against inflammation in the human body. Another of the multiple active components of C. sativa is Δ9-tetrahydrocannabivarin (THCV). Since most illicit drugs seem to have at least one chiral center [82], this may explain some of the significant variations in values in assessed cannabis use in sewage epidemiology investigations. To our knowledge, the four cannabinoids, namely CBDA, CBDV, CBG, and THCV, have never been considered in WWA and sewage epidemiology approaches before the present study.

2. Materials and Methods

2.1. Chemicals and Reagents

HPLC-grade methanol was acquired from Sigma-Aldrich (Steinheim, Germany). Ultra-pure water was produced using a Milli-Q RG system from Millipore (Bedford, MA, USA). Methanolic solutions of CBDV, THCV, CBD, CBN, CBG (1.0 mg mL−1), and THC (0.1 mg mL−1) were purchased from H.P.C. Standard GmbH (Cunnersdorf, Germany). Methanolic solutions (1.0 mg mL−1) of CBDA and THCA-A were obtained from THC Pharm GmbH (Frankfurt am Main, Deutschland). Ethanolic solution (0.1 mg mL−1) of (THC-COOH) was obtained from Sigma-Aldrich (Milan, Italy). All standard solutions were handled following the manufacturers’ instructions. Mixtures of standard compounds were utilized as spiking solutions to prepare the aqueous calibration tools and to perform recovery studies. Individual stock solutions were prepared weekly by diluting each analyte solution with methanol.

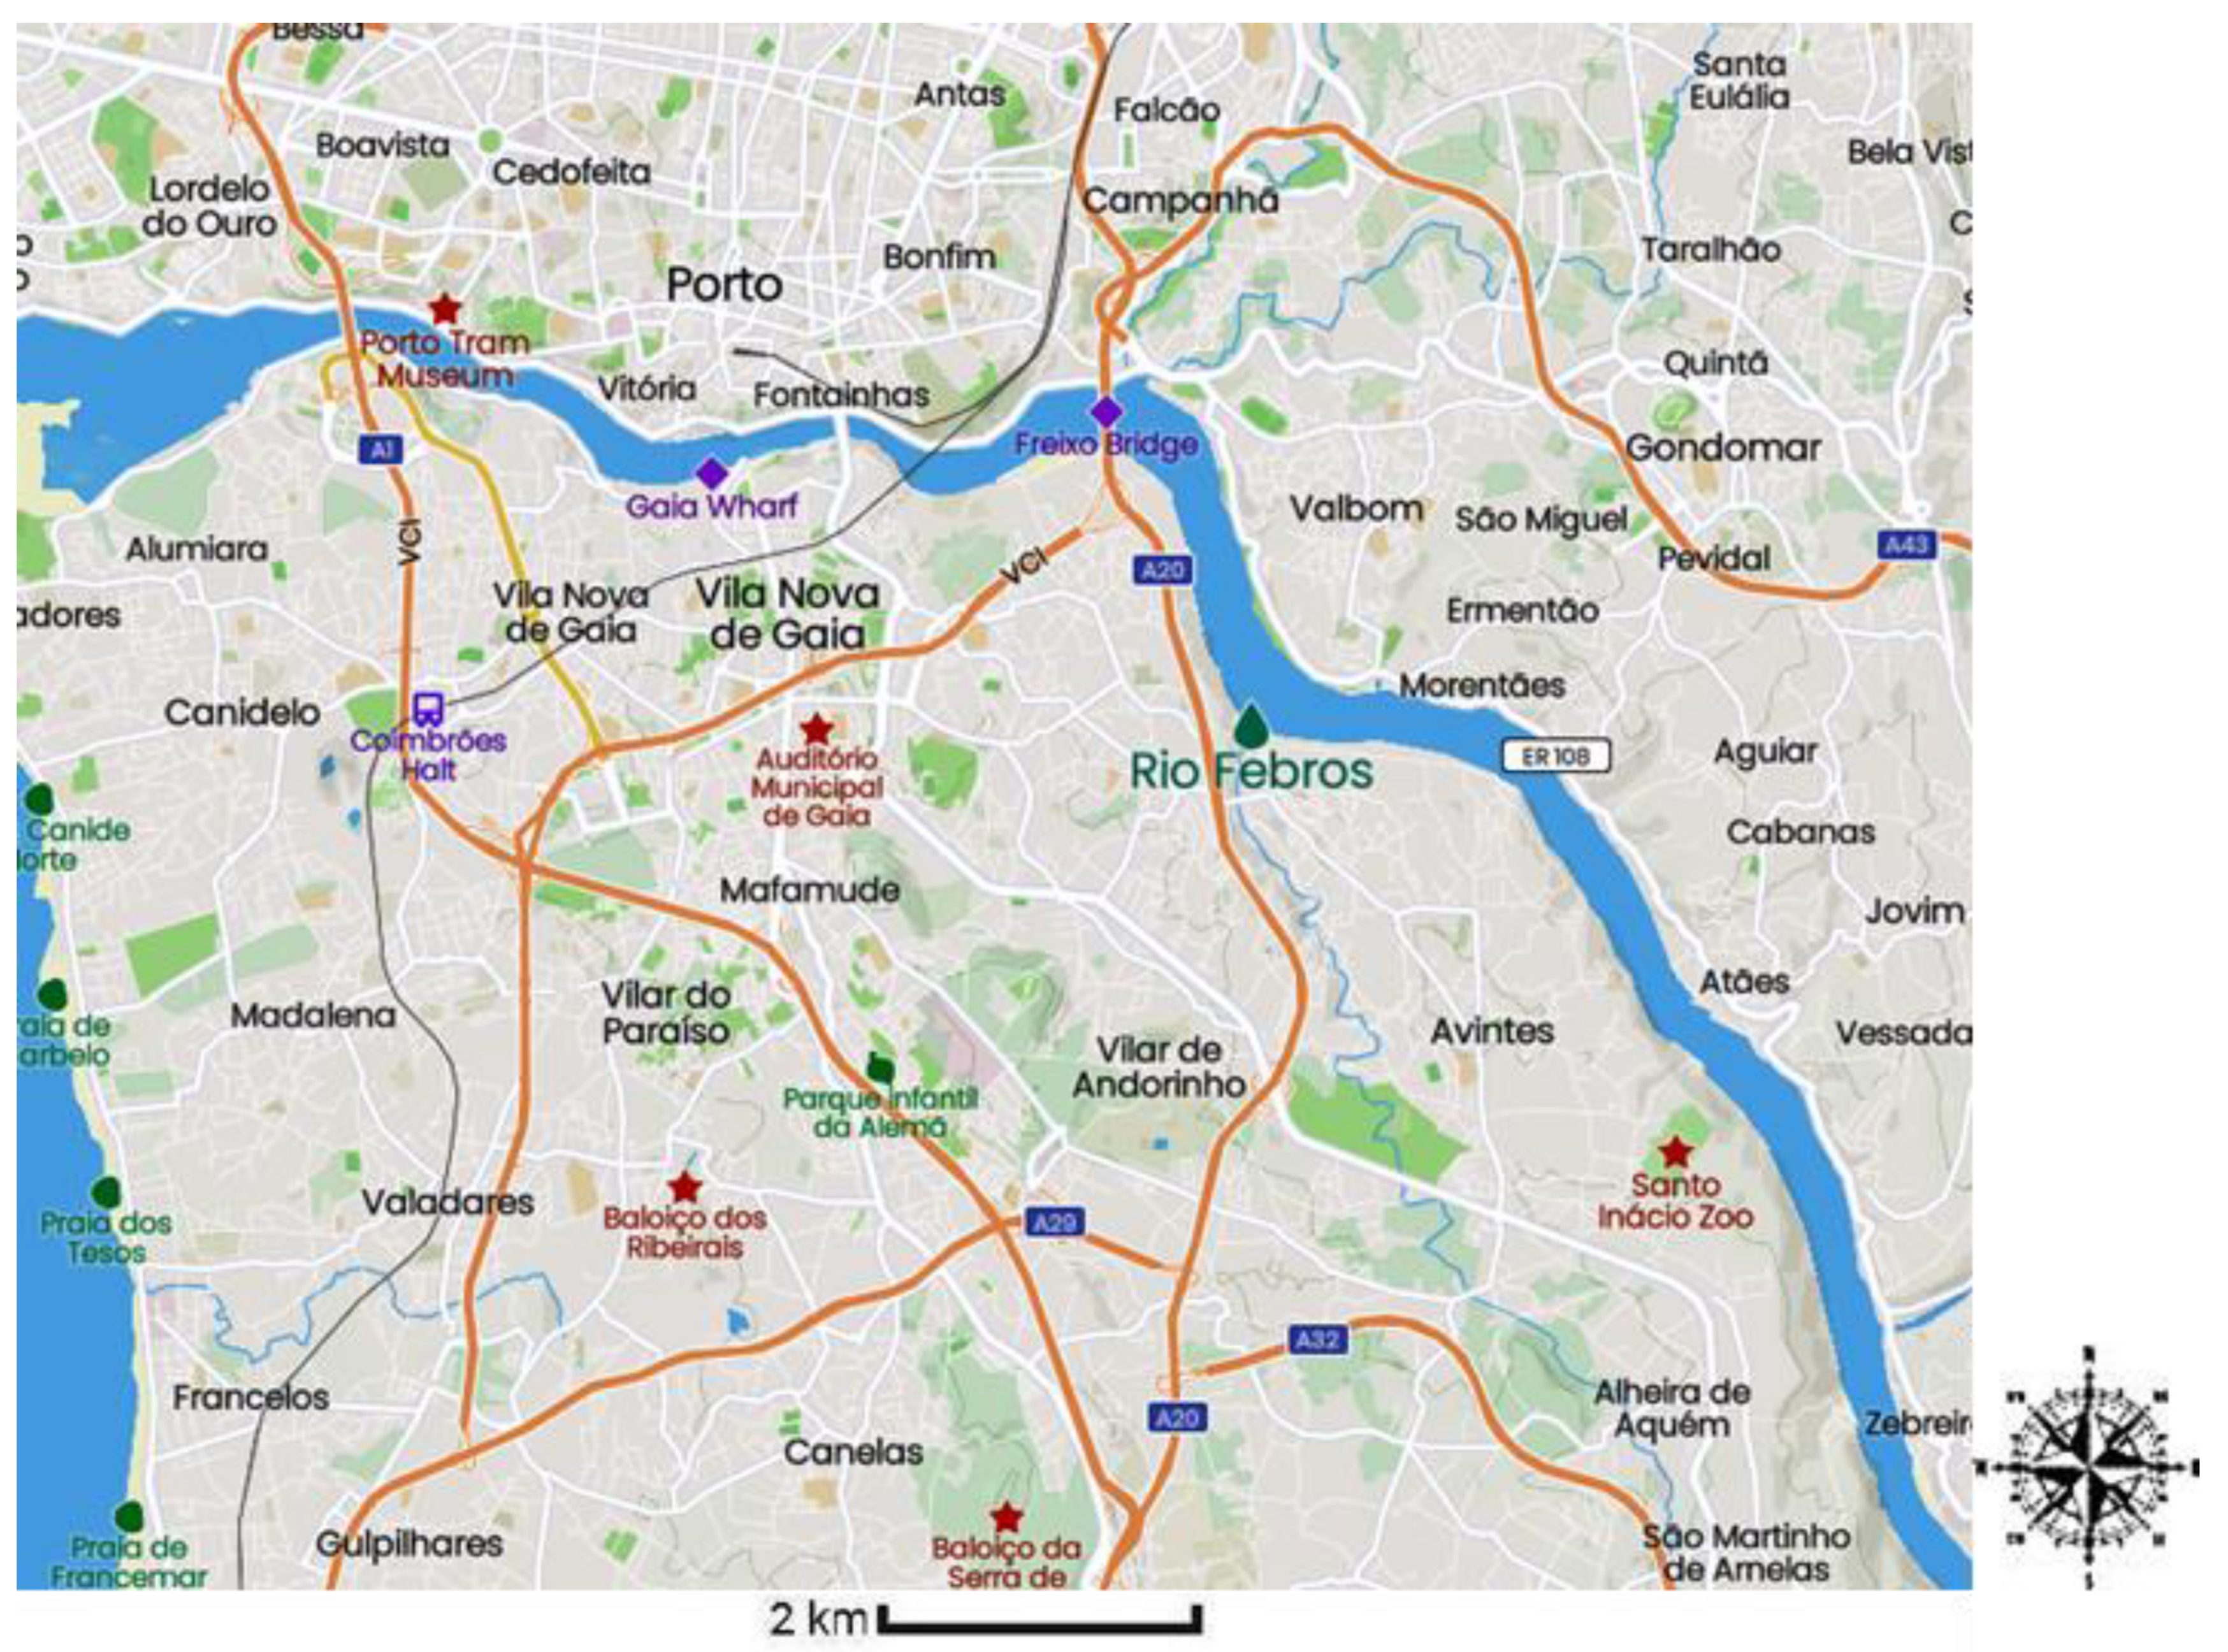
2.2. Description of the Sampling Site

Located in northwest Portugal in a maritime-Atlantic climate, the Febros River is the last left-bank tributary of the Douro River, one of the major rivers in the Iberian Peninsula [83]. It has a 35.4 km2 basin and a varying diversity of riparian vegetation along its course (Figure 1). In most adjacent land, human urban and industrial development has taken place over a tradition of agriculture, with a consequent increase in pollution and a decrease in its natural fish species diversity [84]. After an accident occurred in 2008, resulting in 4 tons of hydrochloric acid being released, the river characteristics and hydraulics have been studied, and environmental protection strategy models have been implemented [85,86]. The studied WWTP (Figure S1) is located along the Febros River shoreline in Vila Nova de Gaia, Porto. It is one of the largest aerated wastewater treatment plants in Europe. It was inaugurated in 2003. It treats wastewater from the Porto interlard, namely Avintes, Olival, Pedroso, Seixezelo, Vilar de Andorinho, and part of Oliveira do Douro. With a wastewater flow rate of 39,605 m3/day, this plant serves 80,000 inhabitants, having a total load of 5334 kg day−1 BOD. The WWTP consists of harrowing, desanding, and degreasing sections; two aeration tanks with 6053 m3 capacity each; three secondary sedimentation tanks 25 m in diameter and 14 m deep; dehydration of sludge with two mechanical centrifuges; 50 m3 sludge storing system; odor treatment in a deodorization column with activated carbon, capacity 6380 m3/h.

2.3. Sample Pretreatment and Solid-Phase Extraction (SPE)

After sampling, pH, conductivity, and temperature measurements were immediately conducted for WWE and river water. Moreover, collected samples were kept frozen at −20 °C.
An offline SPE protocol was created and optimized, selecting the best sorbent type and quantity. Cartridge breakthrough volume was calculated to optimize the sample volume to be extracted. Different SPE sorbent types and amounts have been tested in this study. Three additional 10 mm × 2 mm i.d. disposable trace enrichment solid phases obtained from Waters (Barcelona, Spain) were evaluated for extraction efficiency, clean-up performance, concentration, and elimination of interferences, regarding the analytes considered: reversed-phase hydrophilic–lipophilic polymeric Oasis HLB (macroporous polymer of divinylbenzene and N-vinylpyrrolidone, 30 µm particle size); mixed-mode anion exchange (Oasis MAX); mixed-mode cation exchange (Oasis MCX).
Sorbent quantities (1, 3, or 6 mL) and breakthrough volume have been investigated. Sample preconcentration was conducted in an ASPEC XL system from Gilson (Villiers-le-bel, France). The semi-automated offline SPE preconcentration of all samples (previously filtered), standard aqueous solutions, and blanks were performed by loading 1000 mL of the corresponding solutions at 10 mL/min through the SPE cartridge once conditioned with 6 mL of MeOH and 6 mL of H2O (flow rate 10 mL/min).
After sample loading and elution, the cartridges were washed with 3 mL of HPLC water at a 10 mL/min flow rate to remove interferences (i.e., inorganic salts) and complete the sample transfer.
Upon completing each ASPEC protocol, the trapped analytes were eluted manually into sterile glass tubes with 6 mL of MeOH and dried with nitrogen. The matrix was reconstituted with 1 mL of MeOH/water (1:1, v/v).

2.4. Ultra-Performance Liquid Chromatography–Electrospray Ionization-Tandem Mass Spectrometry (UPLC–ESI-MS/MS) Analysis

The chromatographic conditions (i.e., mobile phase, gradient) were optimized using ACQUITY UPLC® (Waters, Manchester, UK) binary solvent and sample manager systems. The mass detection was carried out in a triple-quadrupole mass analyzer (TQD, Waters, Manchester, UK). Target compounds were identified in multiple reaction monitoring (MRM) mode, recording two transitions between precursor ions and the two most abundant product ions. MS/MS operational parameters (i.e., cone voltages, collision energies) were optimized using the Intellistart™ software. The equipment was operated in both positive and negative ESI mode and the MRM and product ion scan mode.
The multi-residue method was validated and applied to the wastewater and river water samples. In addition, recoveries, repeatabilities, method variation coefficient, and intermediate precision were assessed for each studied analyte. After mobile phase optimization, chromatographic separation was achieved using an ACQUITY UPLC® BECH C18 (1.7 µm 2.1 × 100 mm) column. The UPLC module was interfaced with a TQD mass spectrometer and an electrospray ionization (ESI) source.
Formic acid (FA) as an organic modifier (0.1%, v/v) was tested for peak resolution and signal suppression during the chromatography. An optimized mobile phase consisting of A: MeOH, B: H2O at a flow rate of 300 μL/min at 25 °C was adopted. The gradient program was: 20% A at 0 min; linearly increased to 90% A in 6 min and 98% A in 2 min; followed by a decrease to the initial conditions in 0.1 min and equilibration time for 1 min, which resulted in a total run time of 9.1 min. The injected sample was always 20 μL.
MassLynx® V4.1 SCN 714 was used to control the system operation and data acquisition; data were processed by TargetLynx V4.1 SCN 714 software (Waters, Manchester, UK).

2.5. Method Validation

The quantification of compounds in samples was performed using six-point calibration curves achieved with standard compounds. Those curves, obtained with four repeated injections for each concentration, were satisfactorily linear for eight standard compounds in the range 0.050–0.500 μg L−1. The linearity was achieved in the range 0.050–0.15 μg L−1 for THC-COOH. The linearity was assumed satisfactory when the determination coefficient (R2) was >0.99, based on analyte/internal standard peak area measurement (Table S1).
Standard addition curves, prepared in the same concentration range, helped calculate the limit of detection (LOD) of the method and limit of quantitation (LOQ) by testing the lowest spiked concentration five times. Confirmation using three MS/MS transitions was also required at the LOQ level. Replicate determinations of the same sample were necessary to calculate the LODs. The standard deviation of the lowest spiked concentration or the standard deviation of the replicate determinations (for abundant compounds) was multiplied by three and divided by the slope of the spiked sample calibration curve. Spiking experiments at 1 μg L−1 were carried out to assess the method’s validity.
The method performance was satisfactory under the optimized linearity range, considering sensitivity, accuracy, repeatability, and intermediate precision. Instrumental analytical parameters, linearity ranges, determination coefficients (R2), and intraday instrumental precision (all evaluated through the RSD values) were selected as quality indices.
The acquisition in MRM mode was the standard process, with the protonated molecular ion of each compound chosen as a precursor ion. The method used the most abundant product ion of each target analyte for quantification and two additional product ions for confirmation.
Compared with the reference standards, LC retention time helped to confirm the compounds detected in samples. For the quantification of each compound, the method used its corresponding labeled analyte as a surrogate internal standard.
The detection limit was fixed to a signal-to-noise of three from the quantitation MRM chromatograms, using samples spiked at the lowest analyte concentration tested. Accuracy (estimated through recovery experiments) and precision (expressed as repeatability in terms of RSD) were evaluated by analyzing spiked river and wastewater samples. In wastewater, the LOQ objective was 147 ng L−1 for CBN and 19 ng L−1 for THC-COOH (Table S1). The method was used to perform all recovery experiments in quintuplicate for each type of water sample tested.

3. Results and Discussion

3.1. SPE Procedure

The decisive implementation of the analytical method is significantly affected by sample preconcentration and purification of the focus compounds. Target analytes of the present work are included in the same class of chemical compounds; however, they show different physicochemical properties. Cannabinoids are neutral at pH 2.5. A compromise has been reached to match these physicochemical characteristics, which provided reasonable recovery rates for most compounds.
Throughout the optimization of the SPE process, three distinct sorbent types (Oasis HLB, Oasis MCX, and Oasis MAX) and quantities (1, 3, 6 mL) were evaluated. One liter of Milli-Q water was spiked with a mixed standard solution at individual concentrations of 1.5 µg L−1. All selected analytes showed adequate absolute recoveries (65–130%) for 6 mL Oasis MCX and 6 mL Oasis HLB cartridges (Figure S2). A 6 mL (500 mg) Oasis HLB was selected for further optimization and breakthrough volume calculation (Figure S3). The reversed-phase hydrophilic–lipophilic polymeric mixed-mode material allows improved selectivity towards loading washing and elution steps through the developed ASPEC protocol. The HLB cartridges were washed with Milli-Q water at a flow rate of 10 mL/min at the end of the ASPEC protocol set to remove interferences such as inorganic salts, which caused a lower matrix effect. We noticed that the washing had no adverse impact on the recoveries or sensitivity of the target analytes. Finally, the analytes were eluted from the cartridges using MeOH. Their extraction efficiency was estimated from the recovery percentage obtained for each target compound when loading an optimized sample volume (1 L) of Milli-Q water at a 10 mL/min flow rate (triplicate analysis).
Most of the sample preconcentration protocol steps have been programmed and automatically controlled by the ASPEC system; this configuration allows a partially automated SPE with short cycle times.
The ASPEC system described allows programming and automation of most sample preconcentration steps. This kind of configuration enables a partially automated SPE resulting in a substantial reduction of the well-known time-consuming procedures for our target compounds, reducing human errors (Figure S4).

3.2. UPLC Optimization

In LC-MS/MS operations, an efficient LC separation was essential to avoid or reduce matrix effects. The chromatography procedures were used to perform different experiments and evaluate the analyte retention times, peak shapes, and sensitivity. Moreover, the choice of the mobile phase composition significantly improved the detector response. The system tested several mobile phase combinations using MeOH and water as solvents. The ACQUITY UPLC® binary solvent system varied the gradient of the mobile phase optimized composition, enhancing the sensitivity for these compounds. Different mobile phases and gradient conditions resulted from the system tests (Figure 2; Table 1).
The chromatographic optimization included tests with different concentrations of formic acid (FA) used as organic modifiers to obtain the maximum peak resolution and small-signal suppression. In general, the addition of FA decreased the peak areas of most of the studied compounds, causing a retarded exit of the column.
An optimum mobile phase consisting of MeOH and Milli-Q water (both without FA) was preferred, allowing a satisfactory elution for all the studied analytes and THC-COOH, the compound with lower sensitivity (Figure S5).
Employing the UPLC gradient indicated in Section 2.4, the separation of the selected analytes occurred in 9.1 min.
The system tested different column temperatures (from 25 to 50 °C). Generally, the temperature variation did not significantly affect the sensitivity of the analytes; the effect of column temperature (°C) expressed as RSD was below 2% for the retention time and below 7.0% for peak area. In any case, 25 °C was the optimized column temperature chosen since better sensitivity resulted for some of the selected compounds.
With the described method, the quantification of nine different cannabinoids was rapid and precise in different water samples within nine minutes at the ng L−1 level (Table S1).

3.3. MS/MS Parameter Optimization

The TQD mass spectrometer is a fast-acquisition triple quadrupole mass analyzer. MS/MS compound-dependent operating parameters were optimized (i.e., cone voltage, collision energy) via direct injection experiments (infusion) of individual standard solutions at 1 mg L−1 in methanol at a flow rate of 10 µL min−1. This procedure permitted us to select the best electrospray ionization (ESI) mode. The following parameters were manually optimized and set up to improve desolvation efficiency, analyte ionization, and reproducibility: source temperature, 140 °C; desolvation temperature, 350 °C; cone gas flow rate, 60 L/h; desolvation gas flow rate, 1100 L/h.
Optimum MS source and analyzer conditions for MRM determination of each target and standard internal compound are listed in Table S2. The three most intense MRM transitions were selected for each target compound: the most abundant was used as quantitation transition (Q) whereas the other two were used as qualifier transition (q). For most of the studied compounds, ionization in both modes is possible. The IntelliStart™ technology allows fast and automatic ESI optimization, enhancing deprotonated or protonated adduct formation in the ionization source for each target compound and standard solution; it also helped optimize the retention time windows used in the method.
According to the European Union Guidelines, a sample is positive when the experimental ion ratio falls in the tolerance range.
We have devoted special efforts to optimizing sample preparation and LC separation to incorporate THC-COOH in the analytical method. Although we observed some difficulties related to the confirmatory capability, LOD and LOQ values for this analyte were satisfactory. However, a unique, relevant indicator of cannabinoid consumption cannot be suggested yet. Nevertheless, we are assumed to have a rough estimation of the cannabis consumption by the amounts of THC-COOH in water samples, which have been adopted as an indicator of cannabis usage by several authors.

3.4. Method Validation

Before the application of the analytical procedure, it was necessary to carry out its overall validation for surface water and effluent wastewater, considering the following parameters: linearity, precision, and accuracy, LOQs, LODs, and Q/q ratios used for confirmation.
Calibration curves obtained via UPLC-MS/MS and offline SPE-UPLC-MS/MS for the analytes had determination coefficients (R2) higher than 0.99 in all cases. In general, recoveries (between 70 and 120%) and precision (RSD < 20%) were satisfactory for most compounds. Two quality control samples (QCs), i.e., a blank water sample (previously analyzed) spiked at LOQ, and 10 LOQ levels were also analyzed. QC recoveries were considered satisfactory when they ranged from 60 to 130% for each analyte.
The LOQ objective was taken as the lowest concentration level for which the method was fully validated using spiked samples with satisfactory recovery (between 64 and 130% for WWPT effluent water; between 73 and 120% for Febros River) and precision (relative standard deviation (RSD) ≤15% for WWPT effluent water and ≤13.7% for Febros River (Table 2)).
We monitored the recoveries of analytes at each step of the procedure through four groups of blank controls fortified with native compounds before SPE extraction (Table 2).
CBG showed poor recovery (64%) but good RSD (15%). At the 10LOQ level, THC showed a relatively high recovery (133% in effluent water) but with good precision (1.3%). Some analytes (i.e., CBG, THC-COOH) in surface water and effluent wastewater showed low relative recoveries (in the range of 64–73%), but good RSD (<15%). The absence of an adequate internal standard perhaps affected the possibility of good relative recoveries for CBG.
In any case, we assessed the overall accuracy by the differences observed among the neat drug amounts, experimentally determined in the fortified drug samples and those added to them. It was equal to −0.4 ± 7.6% for methadone, 2.3 ± 6.1% for cocaine, and 7.7 ± 4.2% for cocaethylene.
Groups of samples (n = 3) were processed to assess precision, taken from a homogenous matrix, and fortified with drug amounts (0.500 μg L−1). Table S1 shows the cannabinoid molecular mass (MM), the ESI mode optimized via Intellistart™, LOD, LOQ, and intermediate precision (IP) for three replicates at 0.500 μg/L, and the mean repeatability (REP) obtained with five repetitions at 0.125 μg L−1.
The intermediate precision, expressed as RDS%, was calculated by comparing the analyte concentrations detected in the samples and was very satisfactory for the laboratory, ranging from 2.6% (CBD) to 10.0% (CBN).
Finally, the calculated MS detector repeatability was 88% (±6%) for the nine studied compounds.

3.5. Application to Actual Samples

No treatment has been applied to date for the specific removal of cannabis HMs and transformation products [87].
The occurrence of cannabinoids and the related HMs in the EWW of the Febros WWTP and Febros River located in Vila Nova de Gaia was evaluated using the multi-residue method described above.
We also considered positive samples with concentrations of the analytes below the respective LOQ when we observed all three transitions acquired, and at least one Q/q ratio was within tolerance limits. Due to the chromatograms’ higher chemical background and the low peak intensity corresponding to the low analyte concentration, compliance of the Q/q ratio of both confirmatory transitions was not always possible.
Photo-degradation studies suggest UV as an effective method for THC-COOH removal in WWTPs, better than chlorination, which generates unwanted transformation products. The studied WWTP, designed to treat urban wastewaters of a small population, seemed to have good removal efficiency (>99%) for the THC-COOH compounds. However, we could not conclude about the WWTP THC-COOH removal efficiency. In our case, the SW/RW analysis did not lead to confirmation of an abundant presence of this specific analyte. Usually, THC-COOH is present in lower concentrations on EWW than in IWW because WWTPs present a certain degree of THC-COOH removal efficiency (31–98%) [67,79].
We could not define the presence of the transformation products of THC-COOH because their structures were not yet commonly available in the scientific databases during our investigation, and it was not possible to find their labeled compounds in the market, probably due to their recent discovery. Moreover, nineteen THC-COOH metabolic by-products or transformation products have been reported. Most of them have been found in EWW [85].
Illustrative chromatograms (quantitative transition) are shown in Figure 3. The method presents excellent sensitivity and the potential to detect low concentration levels of analytes.
Data concentrations for this sample are in Table 3, where several analytes are reported as detected (i.e., concentration below the LOQ). Looking at the corresponding chromatograms, it is possible to realize that satisfactory peaks were obtained for these analytes when acquiring the quantification transition.
Although we could report the quantitative data as lower levels, we assumed a conservative criterion; we describe these analytes as detectable with concentrations above the LOD of the method but below the LOQ.
In any case, the levels of analytes detected in effluent wastewater and river samples led to the conclusion that the WWTP removal efficiency was poor for some studied analytes (i.e., CBN, CBD, CBDA, THCA-A). More specific applications of the developed method and efforts are needed to understand the impact of cannabinoids in aquatic ecosystems, considering their recently discovered transformation products.

4. Conclusions

We developed an analytical method based on UPLC-ESI–MS/MS instrumental analysis for the simultaneous quantification and confirmation of some illicit drugs and their relevant metabolites at ng L−1 levels in surface water and urban effluent wastewater. This method allowed us to depict and validate a highly technological extraction and an analytical method for screening one of the most used illicit drugs, marijuana, at the outlet of a WWTP and in Febros River water located in Vila Nova de Gaia (Porto urban area, northern Portugal).
The method is based on UPLC-ESI–MS/MS using a semi-automated method for the SPE enrichment step; Oasis HLB cartridges (6 mL–500 mg) provided the best results with higher sensitivity, allowing the rapid and precise quantification of six cannabinoids (THC, CBD, CBG, CBN, CBDV, THV), two cannabinoids in acidic form (THCA-A, CBDA), and the major human metabolite related to cannabis with high THC (marijuana) consumption (THC-COOH), in an aquatic environment.
The multi-residue method was demonstrated to be highly sensitive, with LODs ranging from 6 to 48.0 ng L−1 for the analyzed compounds, and suitable for monitoring the presence of the target analytes in river and wastewater samples.
Absolute recovery rates obtained ranged from 65 to 130% for the considered substances.
We implemented the whole analytical method entirely based on an offline SPE phase using Oasis HLB cartridges (6 mL volume) before the UPLC-MS/MS determination (a triple quadrupole analyzer). We validated the method at the LOQ and 10LOQ levels, obtaining satisfactory accuracy and precision. We obtained the full confirmation of analyte identities by acquiring three MRM transitions and guaranteed the accomplishment of the ion ratio deviations for all analyte/matrix combinations, even at the LOQ level. The LOQ target was recognized as a function of the method sensitivity for each analyte, and in some cases, it was as low as 10 ng L−1.
THC-COOH, which is the most significant metabolite of high-THC cannabis (marijuana) consumption, commonly used to obtain consumption data of this drug, was not present at relevant concentrations in our river and wastewater samples. Results show the high consumption of this illicit drug (THC), but we could not assess the presence of the metabolite THC-COOH and its transformation products.
Applying this method to river water and effluent urban wastewater samples showed the presence of cannabis secondary metabolites other than the most studied THC and THC-COOH, confirming the consumption of this specific drug in the general population. Specifically, the processed water sample (EWW and RW) quantification did not show an abundant amount of the human metabolic by-product THC-COOH, sometimes found in surface waters at the tens of ng L−1 level [88]. However, the presence of cannabis secondary metabolites (i.e., CBD, CBDA, CBN, THCA-A) other than the well-known THC indicates the widespread usage of this plant species among the general population in the considered area.
All positive findings were confirmed by the achievement of ion ratios among the quantification transition and two specific additional confirmation transitions. The removal efficiency of the WWTP was not assessed because we did not consider IWW.
These protocols have been validated and applied to environmental water samples (waste and surface water) through proper sample collection campaigns, allowing us to study, monitor, and estimate the presence of the target analytes in environmental water samples. Good analytical results were obtained for THC-COOH, the most significant metabolite of high-THC cannabis (marijuana) commonly used to obtain consumption data of this drug.
The consumption of the most used illicit drug in Vila Nova de Gaia, Porto, Portugal, can be derived from the obtained results.
The study of emerging contaminants in the aquatic environment may lead to a better understanding of the consumption of the most used illicit drug in Vila Nova de Gaia, Porto, Portugal, derived from the obtained results by setting up specific enrichment (i.e., offline SPE) and analysis (i.e., UPLC-MS/MS) techniques for the isolation and quantification of cannabinoids in different water samples (i.e., EWW and SW). These methods may provide an estimate of illicit drug use in a specific area by applying such high technological value methods in other specific locations.

Supplementary Materials

The following are available online at https://www.mdpi.com/article/10.3390/w14040588/s1, Figure S1. Aerial view of the WWTP located in Vila Nova de Gaia, Porto (photo courtesy of Águas de Gaia). Figure S2. Comparison of solid-phase MCX (6 mL) and HLB (6 mL) sorbent types needed for the cartridge optimization. Figure S3. Breakthrough volume defining the optimal volume of environmental water sample to preconcentrate/enrich via the developed offline SPE method using HLB cartridges (6 mL). Table S1. Optimized SPE-UPLC-MS/MS working range, determination coefficient (R2), limit of quantification (LOQ), limit of detection (LOD), and intermediate precision (IP). Table S2. Summary of the standard solutions considered and electrospray ionization optimization (gray) through IntelliStart™. Figure S4. Scheme of the offline SPE method developed and applied for the enrichment/preconcentration of standard solutions for calibration and environmental water samples for quantification before the UPLC-MS/MS analysis. Figure S5. Improvement of chromatographic conditions for compounds THV, CBDV, CBD, CBDA, THC, THC-COOH, CBG obtained with the optimized chromatographic mobile phase (grey), compared to other mobile phases.

Author Contributions

Conceptualization, M.d.F.A., L.S. and S.M.; methodology, M.d.F.A. and F.L.; validation, S.A.B., C.O. and L.S.; formal analysis, M.d.F.A. and S.M.; investigation, S.M. and C.O.; resources, S.A.B. and M.d.F.A.; data curation, S.M., M.d.F.A. and F.L.; writing—original draft preparation, S.M. and M.d.F.A.; writing—review and editing, S.A.B., F.L. and L.S.; supervision, M.d.F.A. and S.A.B.; project administration, S.A.B. and L.S.; funding acquisition, S.A.B. All authors have read and agreed to the published version of the manuscript.

Funding

This research received no external funding.

Institutional Review Board Statement

Not applicable.

Informed Consent Statement

Not applicable.

Data Availability Statement

Not applicable.

Acknowledgments

We are grateful to the BIOMON internal fund for its economic support.

Conflicts of Interest

The authors declare no conflict of interest.

References

  1. Breijyeh, Z.; Jubeh, B.; Bufo, S.A.; Karaman, R.; Scrano, L. Cannabis: A Toxin-Producing Plant with Potential Therapeutic Uses. Toxins 2021, 13, 117. [Google Scholar] [CrossRef] [PubMed]
  2. Thomaidis, N.S.; Asimakopoulos, A.G.; Bletsou, A.A. Emerging contaminants: A tutorial mini-review. Glob. NEST J. 2012, 14, 72–79. [Google Scholar]
  3. European Monitoring Centre for Drugs and Drug Addiction (EMCDDA). Annual Report on the State of the Drugs Problem in Europe. Lisbon 2021. Available online: https://www.emcdda.europa.eu/publications/edr/trends-developments/2021_en (accessed on 1 September 2021).
  4. United Nations Office on Drugs and Crime (UNODC). World Drug Report. United Nations Publication, 2021. Available online: https://www.unodc.org/unodc/data-and-analysis/wdr2021.html (accessed on 1 September 2021).
  5. Van Laar, M.W.; Oomen, P.E.; Van Miltenburg, C.J.; Vercoulen, E.; Freeman, T.P.; Hall, W.D. Cannabis and COVID-19: Reasons for concern. Front. Psychiatry 2020, 11, 1419. [Google Scholar] [CrossRef] [PubMed]
  6. Vanderbruggen, N.; Matthys, F.; Van Laere, S.; Zeeuws, D.; Santermans, L.; Van den Ameele, S.; Crunelle, C.L. Self-reported alcohol, tobacco, and cannabis use during COVID-19 lockdown measures: Results from a web-based survey. Eur. Addict. Res. 2020, 26, 309–315. [Google Scholar] [CrossRef] [PubMed]
  7. Bufo, S.A.; Milan, S.; Milella, L.; Scrano, L.; Varallo, C. Cannabis sativa L. in Foodstuffs: The Italian case and the need for EU harmonised limits for THC unavoidable contamination. Eur. Food Feed Law Rev. 2016, 11, 52–57. [Google Scholar]
  8. Pinto, I.C.; Pereira, O.R.; Fernandes, A.; Nogueira, J.; Costa, R. Psychoactive substance consumption: A Portuguese cross-sectional study. Work 2021, 70, 335–344. [Google Scholar] [CrossRef]
  9. Eurobarometer, F. Youth Attitudes on Drugs; Analytical; The European Commission and The GALLUP Organization: Luxembourg, 2011. [Google Scholar]
  10. Molinaro, S.; Vicente, J. (Espad Group) ESPAD Report 2019: Results from European School Survey Project on Alcohol and Other Drugs; Publications Office of the European Union: Luxembourg, 2020. [Google Scholar]
  11. Burns, N.K.; Theakstone, A.G.; Zhu, H.; O’Dell, L.A.; Pearson, J.R.; Ashton, T.D.; Pfeffer, F.M.; Conlan, X.A. The identification of synthetic cannabinoids surface coated on herbal substrates using solid-state nuclear magnetic resonance spectroscopy. Anal. Chim. Acta 2021, 1104, 105–109. [Google Scholar] [CrossRef]
  12. Peacock, A.; Bruno, R.; Gisev, N.; Degenhardt, L.; Hall, W.; Sedefov, R.; White, J.; Thomas, K.V.; Farrell, M.; Griffiths, P. New psychoactive substances: Challenges for drug surveillance, control, and public health responses. Lancet 2019, 394, 1668–1684. [Google Scholar] [CrossRef]
  13. Potts, A.J.; Cano, C.; Thomas, S.H.L.; Hill, S.L. Synthetic cannabinoid receptor agonists: Classification and nomenclature. Clin. Toxicol. 2020, 58, 82–98. [Google Scholar] [CrossRef]
  14. De Meijer, E.P.M.; Van der Kamp, H.J.; Van Eeuwijk, F.A. Characterisation of cannabis accessions with regard to cannabinoid content in relation to other plant characters. Euphytica 1992, 62, 187–200. [Google Scholar] [CrossRef]
  15. Casano, S.; Grassi, G.; Martini, V.; Michelozzi, M. Variations in terpene profiles of different strains of Cannabis sativa L. Acta Hortic. 2011, 925, 115–121. [Google Scholar] [CrossRef]
  16. Appendino, G.; Chianese, G.; Taglialatela-Scafati, O. Cannabinoids: Occurrence and medicinal chemistry. Curr. Med. Chem. 2011, 18, 1085–1099. [Google Scholar] [CrossRef] [PubMed]
  17. Aliferis, K.A.; Bernard-Perron, D. Cannabinomics: Application of metabolomics in Cannabis (Cannabis sativa L.) research and development. Front. Plant Sci. 2020, 11, 554. [Google Scholar] [CrossRef] [PubMed]
  18. Flores-Sanchez, I.J.; Choi, Y.H.; Verpoorte, R. Metabolite analysis of Cannabis sativa L. by NMR spectroscopy. In Functional Genomics; Springer: New York, NY, USA, 2012; pp. 363–375. [Google Scholar]
  19. Fontes, M.K.; Maranho, L.A.; Pereira, C.D.S. Review on the occurrence and biological effects of illicit drugs in aquatic ecosystems. Environ. Sci. Pollut. Res. 2020, 27, 30998–31034. [Google Scholar] [CrossRef]
  20. Huerta-Fontela, M.; Galceran, M.T.; Martin-Alonso, J.; Ventura, F. Occurrence of psychoactive stimulatory drugs in wastewaters in north-eastern Spain. Sci. Total Environ. 2008, 397, 31–40. [Google Scholar] [CrossRef]
  21. Adams, P.J.; Rychert, M.; Wilkins, C. Policy influence and the legalized cannabis industry: Learnings from other addictive consumption industries. Addiction 2021, 116, 2939–2946. [Google Scholar] [CrossRef] [PubMed]
  22. De Andrade, P.V.; Carapinha, L. Drug decriminalisation in Portugal. BMJ 2010, 341, c4554. [Google Scholar] [CrossRef]
  23. Laqueur, H. Uses and abuses of drug decriminalization in Portugal. Law Soc. Inq. 2015, 40, 746–781. [Google Scholar] [CrossRef] [Green Version]
  24. Ximene, R.Ê.G.O.; Oliveira, M.J.; Lameira, C. 20 years of Portuguese drug policy-developments, challenges and the quest for human rights. Subst. Abus. Treat. Prev. Policy 2021, 16, 59. [Google Scholar]
  25. European Monitoring Centre for Drugs and Drug Addiction (EMCDDA). Statistical Bulletin 2020—Prevalence of Drug Use 2020. Available online: https://www.emcdda.europa.eu/data/stats2020/gps_en. (accessed on 22 December 2020).
  26. European Commission, Directorate-General for Communication. Flash Eurobarometer 401: Young People and Drugs Report, Version v1.00. 2015. Available online: https://data.europa.eu/data/datasets/s2029_401?locale=en (accessed on 22 December 2020).
  27. Schuster, W.M.; Bird, R.C. Legal Strategy during Legal Uncertainty: The Case of Cannabis Regulation. Stanf. J. Law Bus. Financ. 2021, 26, 362–412. [Google Scholar]
  28. Bridgeman, M.B.; Abazia, D.T. Medicinal cannabis: History, pharmacology, and implications for the acute care setting. Pharm. Ther. 2017, 42, 180. [Google Scholar]
  29. Cristino, L.; Bisogno, T.; Di Marzo, V. Cannabinoids and the expanded endocannabinoid system in neurological disorders. Nat. Rev. Neurol. 2020, 16, 9–29. [Google Scholar] [CrossRef]
  30. Sajdeya, R.; Goodin, A.J.; Tighe, P.J. Cannabis use assessment and documentation in healthcare: Priorities for closing the gap. Prev. Med. 2021, 153, 106798. [Google Scholar] [CrossRef] [PubMed]
  31. McPartland, J.M.; Duncan, M.; Di Marzo, V.; Pertwee, R.G. Are cannabidiol and Δ9-tetrahydrocannabivarin negative modulators of the endocannabinoid system? A systematic review. Br. J. Pharmacol. 2015, 172, 737–753. [Google Scholar] [CrossRef] [Green Version]
  32. Abazia, D.T.; Bridgeman, M.B. Reefer madness or real medicine? A plea for incorporating medicinal cannabis in pharmacy curricula. Curr. Pharm. Teach. Learn. 2018, 10, 1165–1167. [Google Scholar] [CrossRef]
  33. Davoli, E.; Zuccato, E.; Castiglioni, S. Illicit drugs in drinking water. Curr. Opin. Environ. Sci. Health 2019, 7, 92–97. [Google Scholar] [CrossRef]
  34. European Food Safety Authority (EFSA); Arcella, D.; Cascio, C.; Mackay, K. Acute human exposure assessment to tetrahydrocannabinol (Δ9-THC). EFSA J. 2020, 18, e05953. [Google Scholar]
  35. Castaneto, M.S.; Wohlfarth, A.; Desrosiers, N.A.; Hartman, R.L.; Gorelick, D.A.; Huestis, M.A. Synthetic cannabinoids pharmacokinetics and detection methods in biological matrices. Drug Metab. Rev. 2015, 47, 124–174. [Google Scholar] [CrossRef] [PubMed]
  36. Nahar, L.; Uddin, S.J.; Alam, M.A.; Sarker, S.D. Extraction of naturally occurring cannabinoids: An update. Phytochem. Anal. 2021, 32, 228–241. [Google Scholar] [CrossRef]
  37. Lelario, F.; Scrano, L.; De Franchi, S.; Bonomo, M.G.; Salzano, G.; Milan, S.; Milella, L.; Bufo, S.A. Identification and antimicrobial activity of most representative secondary metabolites from different plant species. Chem. Biol. Technol. Agric. 2018, 5, 13. [Google Scholar] [CrossRef]
  38. Zarei, S.; Salimi, Y.; Repo, E.; Daglioglu, N.; Safaei, Z.; Güzel, E.; Asadi, A. A global systematic review and meta-analysis on illicit drug consumption rate through wastewater-based epidemiology. Environ. Sci. Pollut. Res. 2020, 278, 36037–36051. [Google Scholar] [CrossRef] [PubMed]
  39. Bijlsma, L.; Burgard, D.A.; Been, F.; Ort, C.; Matias, J.; Yargeau, V. The estimation of cannabis consumption through wastewater analysis. Compr. Anal. Chem. 2020, 90, 453–482. [Google Scholar]
  40. Sulej-Suchomska, A.M.; Klupczynska, A.; Dereziński, P.; Matysiak, J.; Przybyłowski, P.; Kokot, Z.J. Urban wastewater analysis as an effective tool for monitoring illegal drugs, including new psychoactive substances, in the Eastern European region. Sci. Rep. 2020, 10, 4885. [Google Scholar] [CrossRef] [PubMed]
  41. Zheng, X.; Yuan, M.; Wang, D.; Zhao, Y.; Hu, K.; Qian, Z.; Gao, L.; Zheng, H. Sewage Epidemiology for Drug Situation Assessment. Asian J. Ecotoxicol. 2020, 4, 79–87. [Google Scholar]
  42. Devault, D.A.; Néfau, T.; Levi, Y.; Karolak, S. The removal of illicit drugs and morphine in two waste water treatment plants (WWTPs) under tropical conditions. Environ. Sci. Pollut. Res. 2017, 24, 25645–25655. [Google Scholar] [CrossRef]
  43. Daughton, C.G. Illicit drugs: Contaminants in the environment and utility in forensic epidemiology. Rev. Environ. Contam. Toxicol. 2011, 210, 59–110. [Google Scholar]
  44. Zuccato, E.; Chiabrando, C.; Castiglioni, S.; Bagnati, R.; Fanelli, R. Estimating community drug abuse by wastewater analysis. Environ. Health Perspect. 2008, 116, 1027–1032. [Google Scholar] [CrossRef] [Green Version]
  45. Zuccato, E.; Chiabrando, C.; Castiglioni, S.; Calamari, D.; Bagnati, R.; Schiarea, S.; Fanelli, R. Cocaine in surface waters: A new evidence-based tool to monitor community drug abuse. Environ. Health 2005, 4, 14. [Google Scholar] [CrossRef] [Green Version]
  46. Bijlsma, L.; Celma, A.; López, F.J.; Hernández, F.E.L.I.X. Monitoring new psychoactive substances use through wastewater analysis: Current situation, challenges and limitations. Curr. Opin. Environ. Sci. Health 2019, 9, 1–12. [Google Scholar] [CrossRef]
  47. Citti, C.; Braghiroli, D.; Vandelli, M.A.; Cannazza, G. Pharmaceutical and biomedical analysis of cannabinoids: A critical review. J. Pharm. Biomed. Anal. 2018, 147, 565–579. [Google Scholar] [CrossRef]
  48. Nicolaou, A.G.; Christodoulou, M.C.; Stavrou, I.J.; Kapnissi-Christodoulou, C.P. Analysis of cannabinoids in conventional and alternative biological matrices by liquid chromatography: Applications and challenges. J. Chromatogr. A 2021, 1651, 462277. [Google Scholar] [CrossRef] [PubMed]
  49. Pellegrini, M.; Marchei, E.; Papaseit, E.; Farré, M.; Zaami, S. UHPLC-HRMS and GC-MS Screening of a Selection of Synthetic Cannabinoids and Metabolites in Urine of Consumers. Medicina 2020, 56, 408. [Google Scholar] [CrossRef]
  50. Gorziza, R.P.; Duarte, J.A.; González, M.; Arroyo-Mora, L.E.; Limberger, R.P. A systematic review of quantitative analysis of cannabinoids in oral fluid. J. Forensic Sci. 2021, 66, 2104–2112. [Google Scholar] [CrossRef]
  51. Krizman-Matasic, I.; Senta, I.; Kostanjevecki, P.; Ahel, M.; Terzic, S. Long-term monitoring of drug consumption patterns in a large-sized European city using wastewater-based epidemiology: Comparison of two sampling schemes for the assessment of multiannual trends. Sci. Total Environ. 2019, 647, 474–485. [Google Scholar] [CrossRef]
  52. Van Nuijs, A.L.N.; Castiglioni, S.; Tarcomnicu, I.; Postigo, C.; de Alda, M.L.; Neels, H.; Zuccato, E.; Barcelo, D.; Covaci, A. Illicit drug consumption estimations derived from wastewater analysis: A critical review. Sci. Total Environ. 2011, 409, 3564–3577. [Google Scholar] [CrossRef]
  53. Postigo, C.; de Alda, M.L.; Barceló, D. Analysis of drugs of abuse and their human metabolites in water by LC-MS2: A non-intrusive tool for drug abuse estimation at the community level. Trends Anal. Chem. 2008, 27, 1053–1069. [Google Scholar] [CrossRef]
  54. Castiglioni, S.; Bijlsma, L.; Covaci, A.; Emke, E.; Hernández, F.; Reid, M.; Ort, C.; Thomas, K.V.; van Nuijs, A.L.N.; de Voogt, P. Evaluation of uncertainties associated with the determination of community drug use through the measurement of sewage drug biomarkers. Environ. Sci. Technol. 2013, 47, 1452–1460. [Google Scholar] [CrossRef] [PubMed]
  55. Postigo, C.; Lopez de Alda, M.; Barceló, D. Fully automated determination in the low nanogram per liter level of different classes of drugs of abuse in sewage water by on-line solid-phase extraction-liquid chromatography–electrospray-tandem mass spectrometry. Anal. Chem. 2008, 80, 3123–3134. [Google Scholar] [CrossRef]
  56. Lelario, F.; Pascale, R.; Bianco, G.; Scrano, L.; Bufo, S.A. Hemp Chemotype Definition by Cannabinoids Characterization Using LC-ESI(+)-LTQ-FTICRMS and Infrared Multiphoton Dissociation. Separations 2021, 8, 245. [Google Scholar] [CrossRef]
  57. Baker, D.R.; Kasprzyk-Hordern, B. Critical evaluation of methodology commonly used in sample collection, storage and preparation for the analysis of pharmaceuticals and illicit drugs in surface water and wastewater by solid phase extraction and liquid chromatography-mass spectrometry. J. Chromatogr. A 2011, 1218, 8036–8059. [Google Scholar] [CrossRef] [PubMed] [Green Version]
  58. González-Mariño, I.; Quintana, J.B.; Rodríguez, I.; González-Díez, M.; Cela, R. Screening and selective quantification of illicit drugs in wastewater by mixed-mode solid-phase extraction and quadrupole-time-of-flight liquid chromatography-mass spectrometry. Anal. Chem. 2012, 84, 1708–1717. [Google Scholar] [CrossRef] [PubMed]
  59. Mohan, H.; Rajput, S.S.; Jadhav, E.B.; Sankhla, M.S.; Sonone, S.S.; Jadhav, S.; Kumar, R. Ecotoxicity, Occurrence, and Removal of Pharmaceuticals and Illicit Drugs from Aquatic Systems. Biointerface Res. Appl. Chem. 2021, 11, 12530–12546. [Google Scholar]
  60. Hernández, F.; Ibáñez, M.; Botero-Coy, A.M.; Bade, R.; Bustos-López, M.C.; Rincón, J.; Moncayo, A.; Bijlsma, L. LC-QTOF MS screening of more than 1000 licit and illicit drugs and their metabolites in wastewater and surface waters from the area of Bogotá, Colombia. Anal. Bioanal. Chem. 2015, 407, 6405–6416. [Google Scholar] [CrossRef] [PubMed] [Green Version]
  61. Lelario, F.; Brienza, M.; Bufo, S.A.; Scrano, L. Effectiveness of different advanced oxidation processes (AOPs) on the abatement of the model compound mepanipyrim in water. J. Photochem. Photobiol. Chem. 2016, 321, 187–201. [Google Scholar] [CrossRef]
  62. Benaglia, L.; Udrisard, R.; Bannwarth, A.; Gibson, A.; Béen, F.; Lai, F.Y.; Esseiva, P.; Delémont, O. Testing wastewater from a music festival in Switzerland to assess illicit drug use. Forensic Sci. Int. 2020, 309, 110148. [Google Scholar] [CrossRef]
  63. Lai, F.Y.; Ort, C.; Gartner, C.; Carter, S.; Prichard, J.; Kirkbride, P.; Bruno, R.; Hall, W.; Eaglesham, G.; Mueller, J.F. Refining the estimation of illicit drug consumptions from wastewater analysis: Co-analysis of prescription pharmaceuticals and uncertainty assessment. Water Res. 2011, 45, 4437–4448. [Google Scholar] [CrossRef]
  64. Bijlsma, L.; Beltrán, E.; Boix, C.; Sancho, J.V.; Hernández, F. Improvements in analytical methodology for the determination of frequently consumed illicit drugs in urban wastewater. Anal. Bioanal. Chem. 2014, 406, 4261–4272. [Google Scholar] [CrossRef]
  65. Mendoza, A.; Rodríguez-Gil, J.L.; González-Alonso, S.; Mastroianni, N.; De Alda, M.L.; Barceló, D.; Valcárcel, Y. Drugs of abuse and benzodiazepines in the Madrid Region (Central Spain): Seasonal variation in river waters, occurrence in tap water and potential environmental and human risk. Environ. Int. 2014, 70, 76–87. [Google Scholar] [CrossRef]
  66. Prichard, J.; Hall, W.; de Voogt, P.; Zuccato, E. Sewage epidemiology and illicit drug research: The development of ethical research guidelines. Sci. Total Environ. 2014, 472, 550–555. [Google Scholar] [CrossRef] [Green Version]
  67. Bijlsma, L.; Emke, E.; Hernández, F.; De Voogt, P. Investigation of drugs of abuse and relevant metabolites in Dutch sewage water by liquid chromatography coupled to high resolution mass spectrometry. Chemosphere 2012, 89, 1399–1406. [Google Scholar] [CrossRef] [PubMed]
  68. Nefau, T.; Karolak, S.; Castillo, L.; Boireau, V.; Levi, Y. Presence of illicit drugs and metabolites in influents and effluents of 25 sewage water treatment plants and map of drug consumption in France. Sci. Total Environ. 2013, 461, 712–722. [Google Scholar] [CrossRef] [PubMed]
  69. Thomas, K.V.; Bijlsma, L.; Castiglioni, S.; Covaci, A.; Emke, E.; Grabic, R.; Hernández, F.; Karolak, S.; Kasprzyk-Hordern, B.; Lindberg, R.H.; et al. Comparing illicit drug use in 19 European cities through sewage analysis. Sci. Total Environ. 2012, 432, 432–439. [Google Scholar] [CrossRef] [Green Version]
  70. European Monitoring Centre for Drugs and Drug Addiction (EMCDDA). Annual Report on the State of the Drugs Problem in Europe; EMCDDA: Lisbon, Portugal, 2012; ISSN 1609-6150.
  71. Huestis, M.A. Pharmacokinetics and metabolism of the plant cannabinoids, Δ 9-tetrahydrocannibinol, cannabidiol and cannabinol. Cannabinoids 2005, 168, 657–690. [Google Scholar]
  72. Desrosiers, N.A. Pharmacodynamics, Pharmacokinetics, and Cannabinoid Stability Following Smoked Cannabis in Occasional and Frequent Cannabis Smokers. Ph.D. Thesis, University of Maryland, Baltimore, ML, USA, 2014. [Google Scholar]
  73. Jurado, A.; Mastroianni, N.; Vàzquez-Suñé, E.; Carrera, J.; Tubau, I.; Pujades, E.; Postigo, C.; López de Alda, M.; Barceló, D. Drugs of abuse in urban groundwater. A case study: Barcelona. Sci. Total Environ. 2012, 424, 280–288. [Google Scholar] [CrossRef]
  74. Jurado, A.; Walther, M.; Díaz-Cruz, M.S. Occurrence, fate and environmental risk assessment of the organic microcontaminants included in the Watch Lists set by EU Decisions 2015/495 and 2018/840 in the groundwater of Spain. Sci. Total Environ. 2019, 663, 285–296. [Google Scholar] [CrossRef] [PubMed]
  75. Mastroianni, N.; Postigo, C.; de Alda, M.L.; Viana, M.; Rodríguez, A.; Alastuey, A.; Querol, X.; Barceló, D. Comprehensive monitoring of the occurrence of 22 drugs of abuse and transformation products in airborne particulate matter in the city of Barcelona. Sci. Total Environ. 2015, 532, 344–352. [Google Scholar] [CrossRef] [PubMed]
  76. Senta, I.; Krizman, I.; Ahel, M.; Terzic, S. Integrated procedure for multiresidue analysis of dissolved and particulate drugs in municipal wastewater by liquid chromatography–tandem mass spectrometry. Anal. Bioanal. Chem. 2013, 405, 3255–3268. [Google Scholar] [CrossRef]
  77. Vazquez-Roig, P.; Andreu, V.; Blasco, C.; Picó, Y. SPE and LC-MS/MS determination of 14 illicit drugs in surface waters from the Natural Park of L’Albufera (València, Spain). Anal. Bioanal. Chem. 2010, 397, 2851–2864. [Google Scholar] [CrossRef]
  78. Been, F.; Rossi, L.; Ort, C.; Rudaz, S.; Delémont, O.; Esseiva, P. Population normalisation with ammonium in wastewater-based epidemiology: Application to illicit drug monitoring. Environ. Sci. Technol. 2014, 48, 8162–8169. [Google Scholar] [CrossRef]
  79. Postigo, C.; de Alda, M.J.L.; Barceló, D. Drugs of abuse and their metabolites in the Ebro River basin: Occurrence in sewage and surface water, sewage treatment plants removal efficiency, and collective drug usage estimation. Environ. Int. 2010, 36, 75–84. [Google Scholar] [CrossRef]
  80. Baker, D.R.; Očenášková, V.; Kvicalova, M.; Kasprzyk-Hordern, B. Drugs of abuse in wastewater and suspended particulate matter—Further developments in sewage epidemiology. Environ. Int. 2012, 48, 28–38. [Google Scholar] [CrossRef]
  81. Irvine, R.J.; Kostakis, C.; Felgate, P.D.; Jaehne, E.J.; Chen, C.; White, J.M. Population drug use in Australia: A wastewater analysis. Forensic Sci. Int. 2011, 210, 69–73. [Google Scholar] [CrossRef] [PubMed] [Green Version]
  82. Kasprzyk-Hordern, B. Testing wastewater in public health epidemiology: Pharmaceuticals, illicit drugs and the phenomenon of chirality. In The SfAM Meeting Control of Water-Borne Disease: A Century of the Activated Sludge Sewage Treatment Process; University of Bath: Bath, UK, 2014. [Google Scholar]
  83. Bordalo, A.A.; Teixeira, R.; Wiebe, W.J. A water quality index applied to an international shared river basin: The case of the Douro River. Environ. Manag. 2006, 38, 910–920. [Google Scholar] [CrossRef] [PubMed]
  84. Cabral, J.P.; Marques, C. Faecal coliform bacteria in Febros River (Northwest Portugal): Temporal variation, correlation with water parameters, and species identification. Environ. Monit. Assess. 2006, 118, 21–36. [Google Scholar] [CrossRef] [PubMed]
  85. Lima, A.S.A. Modelação do Transporte e Dispersão de um Marcador Corado no Rio Febros. Ph.D. Thesis, Instituto Superior de Engenharia do Porto, Porto, Portugal, 2009. [Google Scholar]
  86. Bio, A.; Vieira, N.; Costa, M.J.; Valente, A. Assessment of habitat and water quality of the Portuguese Febros River and one of its tributaries. Limnetica 2011, 30, 103–116. [Google Scholar] [CrossRef]
  87. Boix, C.; Ibáñez, M.; Bijlsma, L.; Sancho, J.V.; Hernández, F. Investigation of cannabis biomarkers and transformation products in waters by liquid chromatography coupled to time of flight and triple quadrupole mass spectrometry. Chemosphere 2014, 99, 64–71. [Google Scholar] [CrossRef] [Green Version]
  88. Ujváry, I.; Grotenhermen, F. 11-Nor-9-carboxy-∆ 9-tetrahydrocannabinol–a ubiquitous yet underresearched cannabinoid. A review of the literature. Cannabinoids 2014, 9, 1–8. [Google Scholar]
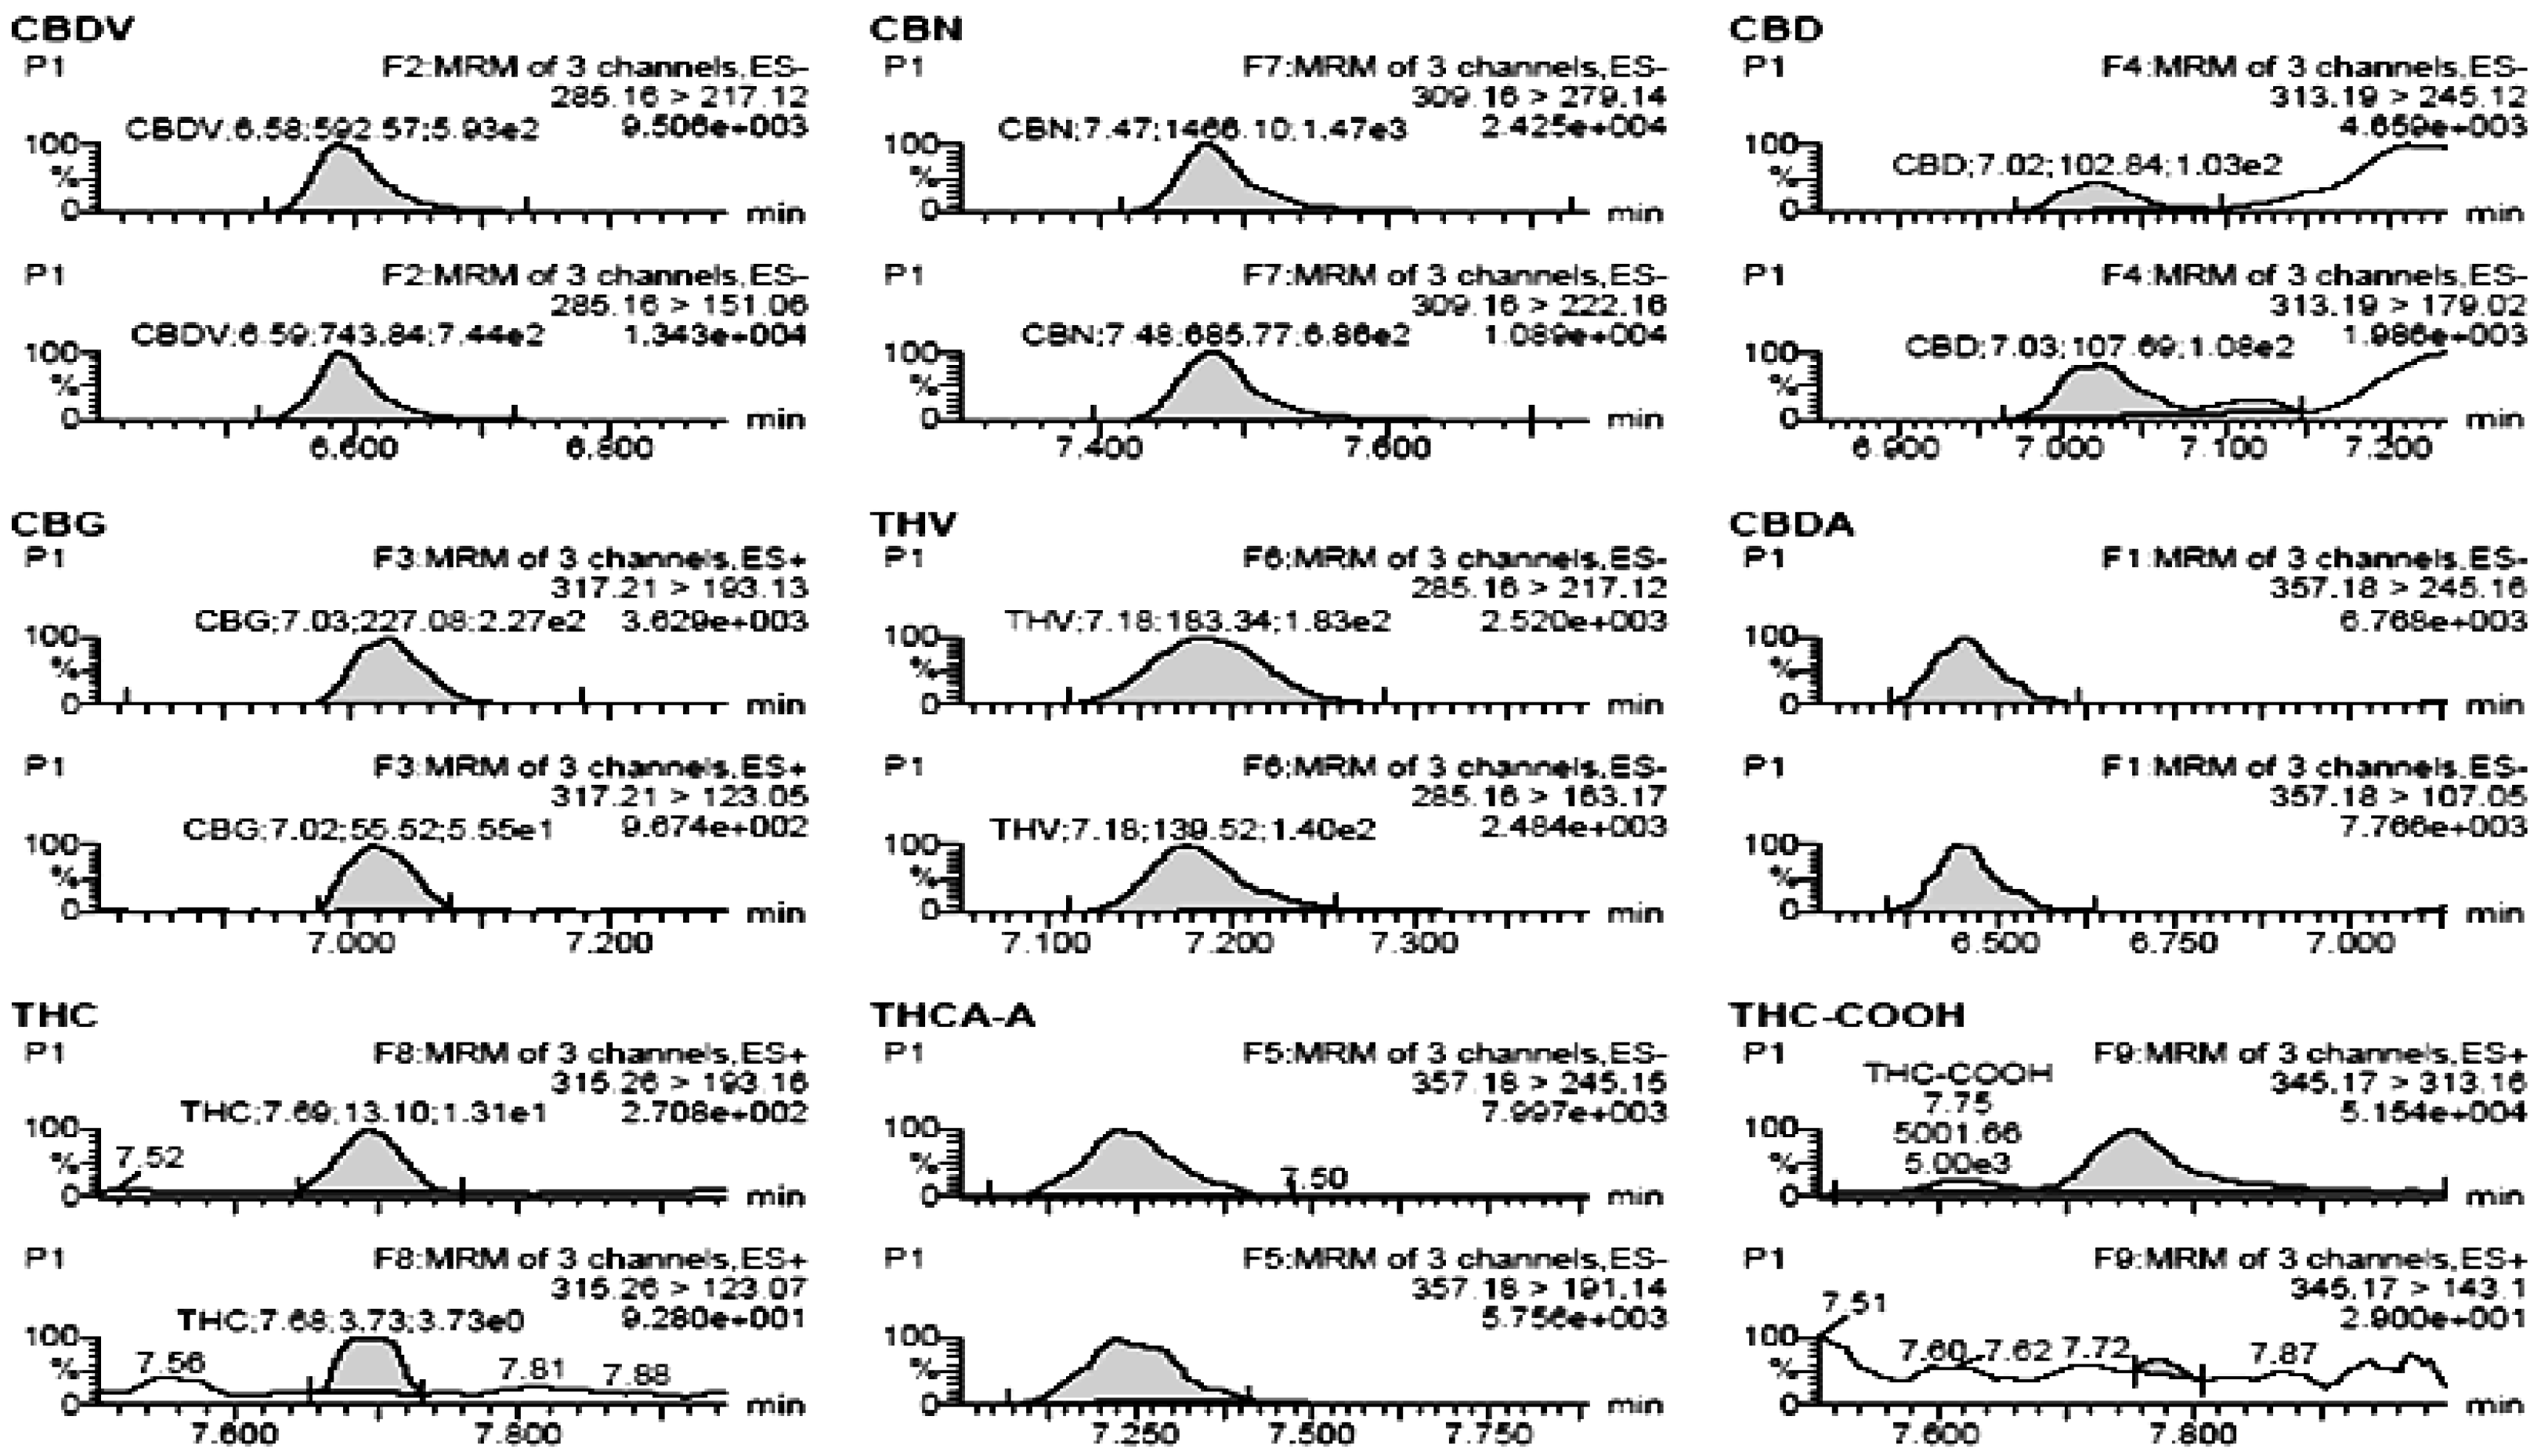
Figure 1. Location of the Febros River in northern Portugal.
Water 14 00588 g001
Figure 2. The improvement obtained with optimized chromatographic mobile phase (gray) compared to other mobile phases (other colors), an example of two compounds: CBN, (left), and THCA-A, (right).
Water 14 00588 g002
Figure 3. Performance characteristics of the method for the considered analytes. Chromatographic peaks of all studied compounds, solution mix at 5 μg L−1, transitions for quantitation and confirmation.
Water 14 00588 g003
Table 1. Optimized retention times and variations expressed as RSD, LOD, and LOQ calculated with the S/N at the lowest concentration, UPLC-MS/MS injection at 5 μg L−1.
CompoundRt
min
RSD
min
1st Standard S/NLOQ (S/N)
10 μg L−1
LOD (S/N)
3 μg L−1
CBDV6.580.001383.50.130.039
CBN7.480.077734.40.0680.020
CBD7.030.0828.1226.21.86
CBG7.020.00023.352.10.64
THV7.190.08016.783.00.89
CBDA6.610.26268.270.730.22
THC7.690.07520.250.250.74
THCA-A7.400.13540.971.20.37
THC-COOH7.750.00084.260.590.18
Table 2. Concentrations (μg L−1) of cannabinoids and recoveries (Rec) with their respective %RSD in Febros River and effluent water flowing from the WWTP located in Vila Nova de Gaia.
CompoundFebros RiverC
C
(μg L−1)
RSD
(%)
QC LOQ
(%)
QC LOQ
RSD (%)
QC 10LOQ
(%)
Rec
RSD (%)
C
(μg L−1)
RSD
(%)
QC LOQ
(%)
QC LOQ
RSD (%)
QC 10LOQ
(%)
Rec
RSD (%)
CBDV<LOQ-993.51012.5<LOQ-987.2969.4
CBN0.0793.0911.9911.10.0764.8943.1922.2
CBD<LOQ-10211.410013.70.0964.31294.51331.8
CBG<LOQ-767.6738.5<LOQ-6710.86415.0
THV<LOQ-1182.31231.3<LOQ-892.9840.9
CBDA0.0707.91141.71101.20.0650.01245.21253.2
THC<LOQ-1162.21123.2<LOQ-1281.51331.3
THCA-A0.0738.71042.41101.70.0715.81083.61164.3
THC-COOH<LOQ-987.51026.3<LOQ-748.5719.8
Table 3. Concentrations (μg L−1) of cannabinoids in Febros River and effluent water flowing from the WWTP located in Vila Nova de Gaia.
CompoundFebros River WaterWWPT Effluent Water
AreaRSD (%)C (μg L−1)AreaRSD (%)C (μg L−1)
CBDV22.60.6<LOQ24.60.6<LOQ
CBN250340.079227450.076
CBD72.40.7<LOQ120540.096
CBG20.50.3<LOQ8.00.4<LOQ
THV9.20.5<LOQ7.80.4<LOQ
CBDA202680.070135050.065
THC326.6-<LOQ133.72.7<LOQ
THCA-A209890.073176860.071
THC-COOH87,00033<LOQ55078<LOQ
Publisher’s Note: MDPI stays neutral with regard to jurisdictional claims in published maps and institutional affiliations.

