Article

Oxidation to Control Cyanobacteria and Cyanotoxins in Drinking Water Treatment Plants: Challenges at the Laboratory and Full-Scale Plants

1
Department of Civil, Mineral and Mining Engineering, Polytechnique Montréal, Montréal, QC H3C 3A7, Canada
2
Faculty of Engineering and Information Technology, University of Melbourne, Melbourne, VIC 3010, Australia
3
Department of Biological Sciences, University of Montréal, Montréal, QC H2V 0B3, Canada
4
Department of Microbiology and Immunology, McGill University, Montréal, QC H3A 2B4, Canada
5
McGill Genome Centre, McGill University, Montréal, QC H3A 0G1, Canada
6
National Research Council Canada, Energy, Mining and Environment, Montréal, QC H4P 2R2, Canada
7
Department of Chemistry, University of Montréal, Montréal, QC H3C 3J7, Canada
*
Author to whom correspondence should be addressed.
Water 2022, 14(4), 537; https://doi.org/10.3390/w14040537
Submission received: 14 December 2021 / Revised: 15 January 2022 / Accepted: 9 February 2022 / Published: 11 February 2022

Abstract

:
The impact of oxidation on mitigation of cyanobacteria and cyanotoxins in drinking water treatment sludge was investigated at the laboratory and treatment plant scales. Two common oxidants, KMnO4 (5 and 10 mg/L) and H2O2 (10 and 20 mg/L) were applied under controlled steady-state conditions. Non-oxidized and oxidized sludge was left to stagnate in the dark for 7 to 38 days. Controlled laboratory trials show that KMnO4 and H2O2 decreased cell counts up to 62% and 77%, respectively. The maximum total MC level reduction achieved after oxidation was 41% and 98% using 20 mg/L H2O2 and 10 mg/L KMnO4, respectively. Stagnation caused cell growth up to 2.6-fold in 8 out of 22 oxidized samples. Microcystin (MC) producer orders as Chroococcales and Synechococcales were persistent while Nostocales was sensitive to combined oxidation and stagnation stresses. In parallel, two on-site shock oxidation treatments were performed in the DWTP’s sludge holding tank using 10 mg/L KMnO4. On-site shock oxidation decreased taxonomic cell counts by up to 43% within 24 h. Stagnation preceded by on-site shock oxidation could increase total cell counts by up to 55% as compared to oxidation alone. The increase of cell counts and mcyD gene copy numbers during stagnation revealed the impact of oxidation/stagnation on cyanobacterial cell growth. These findings show the limitations of sludge oxidation as a strategy to manage cyanobacteria and cyanotoxins in sludge and suggest that alternative approaches to prevent the accumulation and mitigation of cyanobacteria in sludge should be considered.

1. Introduction

Health concerns about the occurrence of cyanobacterial cells and their associated metabolites (cyanotoxins, taste, and odor agents) in water sources have been raised in the past decade [1,2,3,4,5,6].
Conventional treatment processes including coagulation, flocculation, sedimentation, and filtration are common approaches to respond to the presence of cyanobacteria and cyanotoxins in drinking water treatment plants (DWTPs) [7,8,9,10,11]. In spite of the high efficiency of these processes to remove cyanobacterial cells and cell-bound metabolites (up to 99%), the accumulation of cells and metabolites in the sludge and backwash water is still considered a challenge [7,12,13,14,15,16,17]. In certain DWTPs, the supernatant of the sludge is discharged to the water source or is recycled to the head of the DWTPs [11,18,19]. The quality of stored sludge impacts the load of cyanobacteria and toxins in the sludge supernatant [11].
Several studies have reported that toxic cyanobacterial cells (e.g., Microcystis aeruginosa, Dolichospermum circinale, Oscillatoria sp., and Cylindrospermopsis raciborskii) can survive and release cyanotoxins in the stored sludge for up to 12 days [7,14,20,21,22,23,24]. Recent studies hypothesized toxic cyanobacterial cells can even grow in the stored sludge up to 16 days leading to cyanotoxin release up to four times higher than the expected concentration [25]. Recent evidence documenting the growth of cyanotoxin-producing species during controlled extended storage of sludge raises the need for additional treatment controls to be implemented to limit this risk [26].
KMnO4 and H2O2 were successfully applied to manage cyanobacteria and cyanotoxins in DWTPs and source waters [27,28,29,30,31,32]. However, there are limited data on the efficacy of oxidants and adsorbents, such as powdered activated carbon (PAC), applied directly to DWTP sludge. Zamyadi et al. [18] showed that online continuous application of 10 mg/L KMnO4 decreased cyanobacterial cell counts by up to 97% within 72 h in the sludge thickener. Using 20 mg/L powdered activated carbon also decreased 21% of the 2-Methylisoborneol (MIB) concentration. However, the fate of cyanobacteria and cyanotoxins in oxidized sludge needs to be studied during subsequent storage in lagoons or sludge holding tanks before further processing or disposal [11,33].
The objectives of this study were to (i) investigate the impact of oxidation on cyanobacteria and cyanotoxins in both lab- and full-scales, (ii) determine the efficiency of oxidation during sludge storage and, (iii) evaluate the impact of oxidation and stagnation on microbial and cyanobacterial communities. To the authors’ knowledge, this is the first study on oxidation of DWTP’s sludge containing natural cyanobacterial blooms followed by storage (stagnation) in a full-scale DWTP using taxonomic cell counts, shotgun metagenomic sequencing, MC and mcyD gene copy quantification.

2. Materials and Methods

2.1. Studied Drinking Water Treatment Plant and Sampling Description

The studied DWTP was located Southeast of Montreal on the Canadian side of Missisquoi Bay (Lake Champlain). The occurrence of cyanobacterial blooms was reported in this DWTP in previous studies [8,11,13], and detailed information on the diversity of the blooms and water quality at this site is presented in [11].
The treatment chain comprised of powdered activated carbon (wood-based), coagulation, flocculation, sedimentation and filtration followed by post-chlorination. Sludge of the clarifier is collected in a sludge holding tank (200 m3). The supernatant of the holding tank is discharged to the source and the solids are transferred to a wastewater treatment plant (WWTP) for treatment. Sludge storage time in the holding tank varied from 7 to 35 days. All details are presented in our previous study [11]. The samples for laboratory oxidation were taken from the solids of the sludge holding tank on 31 July, 7 and 17 August 2018. On-site oxidation was performed on sludge holding tank on 17 August and 5 September 2018.

2.2. Oxidation and Stagnation Procedures

2.2.1. Oxidation

The experimental plan for the oxidation assays is presented in Table 1. The maximum dose of KMnO4 (10 mg/L) was selected based on a previous study on the oxidation of sludge collected from the dewatering tank of a DWTP [18]. However, there was a need for data about sludge oxidation. Therefore, the decisions were based on the previous studies of oxidation of water samples containing cyanobacteria and cyanotoxins [29,34].
For the laboratory oxidation by KMnO4, powdered KMnO4 (>99.9%, Sigma Aldrich, Oakville, ON, Canada) was dissolved in ultrapure water to prepare a 5000 mg/L stock solution. This stock solution was used to prepare the applied doses (5 and 10 mg/L KMnO4). For H2O2, a 3000 mg/L stock solution was prepared using stabilized H2O2 (30%, Sigma Aldrich, St. Louis, MO, USA). The applied H2O2 doses were 10 and 20 mg/L. All laboratory oxidation scenarios were performed at room temperature (20 ± 2 °C). The contact time of KMnO4 and H2O2 oxidation was 1 and 24 h, respectively. The volume of the sludge in the laboratory oxidation assays was 2 L.
On-site (full-scale) treatment was conducted as shock oxidation. Powdered KMnO4 (>97.5%, Carus, LaSalle, IL, USA) was added to the sludge holding tank. Then, sludge was mixed manually to ensure that KMnO4 was completely dissolved. During on-site oxidation, the clarifier’s sludge was extracted into the sludge holding tank around four times per hour. The effective volume of the sludge holding tank was 200 m3. The holding tank was full during on-site oxidation and the supernatant surplus was discharged into the lake. After the shock oxidation, samples were taken daily from the sludge and corresponding supernatant.
Concentrations of KMnO4 stock solution and residual were determined by the DPD-colorimetric (4500-Cl) standard method using DR5000 (HACH, Canada) spectrophotometer and applying the stoichiometric ratio to convert the chlorine concentration to the KMnO4 concentration [35]. The H2O2 residual was measured by Chemetrics K-5510 colorimetric test kit (Midland, VA, USA). At the end of the contact times, KMnO4 and H2O2 residuals were quenched using sodium thiosulfate (Fisher Scientific, Whitby, ON, Canada) at stoichiometric ratio [35,36].
Oxidant exposure (CT) as residual concentration (mg/L) multiplied by contact time (min) was calculated for each oxidation assay according to Equation (1) [29].
CT = 0 t Oxidant   dt = C 0 k   e kt 1
where k (min−1) is the first-order decay rate, t (min) is the exposure time (contact time) and C0 is the initial concentration of the oxidant (mg/L).
For statistical analysis, CT values were normalized and reported as relative CT by dividing CT of each oxidation assay by the maximum observed CT of each oxidant (i.e., KMnO4: 239 mg·min/L and H2O2: 7781 mg·min/L). Thus, the relative CT of both 10 mg/L KMnO4 and 20 mg/L H2O2 oxidation on the 7 August sample was 1.0 (Table 2).

2.2.2. Stagnation

Stagnation was applied to all the samples before (time zero) and after oxidation assays for 7–38 days. Stagnation time was selected based on the sludge storage time in the studied DWTP. The stagnated samples were stored in the dark and at room temperature (20 ± 2 °C) to simulate sludge holding tank conditions. To avoid interferences such as the presence of other microorganisms and air impact, the samples were stored in 1-L autoclaved polypropylene bottles and the bottles remained tightly capped (sealed) during stagnation.

2.3. Sample Preparation and Analysis

2.3.1. Taxonomic Cell Counts

Samples for taxonomic cell count analysis were preserved using Lugol’s iodine. The analysis of taxonomic cell counts was conducted using inverted microscopy at magnification of 10X and 40X. All details of the analysis are presented in [37,38,39]. The predominant species are presented and less dominant species (<5%) are shown as “Other”. In this study, cell removal is calculated based on the cell removal (disappearance) after oxidation.

2.3.2. Dissolved Organic Carbon (DOC)

Samples for DOC analysis were taken by filtration of the sludge samples using pre-rinsed 0.45-μm membranes (PALL, Port Washington, NY, USA). DOC analysis was conducted based on USEPA 415.1 method by total organic carbon analyzer (Sievers Analytical Instruments, Boulder, CO, USA) [40].

2.3.3. Microcystins (MCs)

Samples for MC (cell-bound and dissolved) analysis were prepared by filtration of the samples using pre-weighted 0.45-μm GHP membranes (Pall, Mississauga, ON, Canada). MC analysis was conducted by on-line solid-phase extraction ultra-high-performance liquid chromatography coupled to tandem mass spectrometry (on-line SPE-UHPLC-MS/MS). MC quantification was conducted on a Thermo Hypersil Gold C18 column (100 mm × 2.1 mm, 1.9 µm particle size). Potassium permanganate and sodium (meta) periodate (Sigma Aldrich, Oakville, ON, Canada) were used for the sample oxidation. Quenching was carried out by a 4 M sodium bisulfite solution (Sigma Aldrich, Oakville, ON, Canada). Standard solutions were 4-phenylbutyric acid (50 ng/L) (Sigma Aldrich, Oakville, ON, Canada) and erythro-2-methyl-3-methoxy-4-phenylbutyric acid (D3-MMPB, 10 ng/L) (Wako Pure Chemicals Industries, Ltd., Osaka, Japan). The volume of the samples applied for MC measurement was 10 mL. Additional details including extraction steps are presented in Munoz et al. [41] and Roy-Lachapelle et al. [42].

2.3.4. DNA Extraction, Shotgun Metagenomic Sequencing Protocols, Bioinformatics Description, and Statistical Analysis

Samples for shotgun metagenomic analysis were collected directly from the sludge samples without any filtration and were stored in a sterile falcon tube. A 10 mL of sludge samples were taken for DNA extraction. Sludge samples were homogenized before extraction. Extraction yields were evaluated using RT-qPCR and adding 200 µL of nuclease-free water and 5 µL of TATAA Universal DNA spike II (TATAA Biocenter AB). RNeasy PowerWater Isolation kit solution PM1 was used to lyse the cells along with Dithiothreitol (DTT), which prevents disulfide bonds forming residues of proteins. Total nucleic acid was extracted using RNeasy PowerSoil Total RNA Kit (Qiagen, Toronto, ON, Canada) and at room temperature. For the gDNA quantification, Qubit V2.0 fluorometer (Life Technologies, Burlington, ON, Canada) was applied. The Covaris E220 was used to shear gDNA.
Sequencing was performed by Génome Québec. Libraries were generated by the NEBNext Ultra II DNA Library Prep Kit for Illumina (New England BioLabs, MA, USA) and according to the manufacturer’s instruction. Adapters and PCR primers were provided from IDT (Coralville, IA, USA). SparQ beads (Qiagen, Toronto, ON, Canada) were applied for the size selection of libraries. The Kapa Illumina GA with Revised Primers-SYBR Fast Universal kit (Kapa Biosystems, MA, USA) was applied for library quantification. Metagenomic libraries were sequenced using NovaSeq 6000 S4 with a paired-end of 150 bp. Other details are presented in our previous work [11]. DNA extraction was performed in triplicate, while one replicate was sequenced. Reproducibility and variability between replicates of our technique were evaluated by comparing results from triplicates [43].
Statistical analysis was conducted by R (3.6.2) and phyloseq (1.28.0) [44]. Normalization of the taxonomic data was performed using EasyCODA (0.31.1) and centered log-ratio transformation [45]. Redundancy analysis (RDA) was applied for evaluation of the constrained variables. The variance homogeneity was validated prior to implementation of the model [46]. Significant variables (>95%) were selected by permutation test. All details are explained in our previous investigation [11].

2.3.5. Droplet Digital PCR (ddPCR)

Genomic DNA samples were normalized to 1.0 ng/μL. Initial concentrations below 1.0 ng/μL were concentrated to the ideal 1.0 ng/μL using a speed vacuum. Primers for the detection of the mcyD gene (microcystin production) were: mcyD(KS)F1: 5′-TGGGGATGGACTCTCTCACTTC-3′ and mcyD(KS)R1:5′ GGCTTCAACATTCGGAAAACG-3′ [47]. The details of the analysis are presented in Moradinejad et al. [48].

2.3.6. Solid Analysis

Solids analysis including total suspended solids (TSS) and volatile suspended solids (VSS) were performed based on the 2540-Standard Method [35].

3. Results

3.1. Characteristics of Untreated Sludge

Characteristics of the sludge samples are presented in (Table S1). Total MC concentrations remained below 161 ng/L on 31 July, 7 and 17 August and increased to 1084 ng/L on 5 September with 88% being cell-bound MCs. DOC remained in the range of 3.19–3.60 mg/L with a peak on 5 September (9.8 mg/L). Similarly, while pH remained in the range of 7.05–7.54 on 31 July, 7 and 17 August (laboratory oxidation dates), it decreased to 6.81 on 5 September (on-site oxidation date). Higher turbidity, TSS and TVS were also recorded on 5 September as 701 NTU, 1957 mg/L and 1230 mg/L, respectively.
Taxonomic cell counts remained in the range of 2.25 × 10⁶ cells/mL to 2.71 × 10⁶ cells/mL during the studied dates (Table S1). The highest cell counts were reported on 7 August. Aphanothece clathrata brevis, Microcystis aeruginosa, Dolichospermum spiroides, Aphanocapsa delicatissima, Aphanocapsa planctonica, and Aphanocapsa holsatica were the predominant species in the sludge samples before oxidation or stagnation (Figure S1).
Shotgun metagenomic sequencing showed that Proteobacteria was the predominant phylum in all studied dates. Cyanobacteria, Bacteroidetes and Actinobacteria were the next predominant phyla. The relative abundance of Cyanobacteria reached its highest level on 17 August, while the lowest relative abundance of Cyanobacteria was recorded on 7 August (Figure S2a). Investigation of Cyanobacteria at the order level revealed that Nostocales was predominant on 31 July and 17 August. In contrast, Chroococcales was the predominant order on 7 August (Figure S2b). Similarly, Dolichospermum (Nostocales) was predominant on 31 July and 17 August. Synechococcus was the predominant genus on 7 August (Figure S2c).

3.2. Oxidation of Cyanobacteria-Laden Sludge in Controlled Conditions

The first-order rate constants and half-life of applied oxidants are presented in (Table 2). Rate constants varied from 0.044 min−1 to 0.054 min−1 using 5 mg/L KMnO4 in different oxidation assays. Increasing the KMnO4 dose to 10 mg/L caused the rate constant range to drop to 0.037 min−1–0.43 min−1. Finally, applying 10 mg/L and 20 mg/L H2O2 led to 0.0024 and 0.0022 min−1 rate constants, respectively. Amongst KMnO4 assays, the highest CT (239 mg·min/L) was observed in the 31 July sample and after applying 10 mg/L KMnO4. The highest CT of H2O2 (7781 mg·min/L) was reported by 20 mg/L H2O2 on 7 August.
Oxidation with KMnO4 caused different shifts of diversity as revealed by taxonomic cyanobacterial cell counts. On 31 July, 5 mg/L KMnO4 resulted in modest increases in cyanobacterial cell counts (16%), while 10 mg/L KMnO4 slightly decreased cell counts (3%) (Figure 1). This apparent resistance to oxidation could be attributed to the presence of colonies leading to cell count uncertainty. In addition, oxidation could release cells from colonies resulting in an increase in cell counts. Similar increases after oxidation were observed in one of our pre-tests performed on sludge and water samples in 2017 (data not shown). In contrast, 5 and 10 mg/L KMnO4 decreased cyanobacterial cell counts by 46–55% and 59–62%, on 7 and 17 August, respectively (Figure 2 and Figure 3). Applying 10 mg/L H2O2 removed 58% of cyanobacterial cells while increasing the dose to 20 mg/L led to a removal of 77% of the cells (Figure 2).
At the phylum level, shotgun metagenomic sequencing showed that the relative abundance of Proteobacteria increased, while the relative abundance of Cyanobacteria decreased for both dates (7 and 17 August) and oxidants (KMnO4 and H2O2) (Figure 4a). The relative abundance trends are coherent with absolute abundance observations based on taxonomic cell counts (Figure 2, Figure 3 and Figure 4a).
At the cyanobacterial genus level, the relative abundance of Synechococcus increased from 3–13% and 23–25% after oxidation on 7 and 17 August, respectively. Additionally, Dolichospermum slightly decreased by 3–9% and 13–14% on 7 and 17 August, respectively. The relative abundance of the other genera (ex. Microcystis) remained almost constant (<7%) (Figure 4c).
Overall, two different trends were observed in the microbial communities after oxidation: (i) on 7 August, the diversity (Shannon index) remained almost constant after oxidation in all scenarios (Figure 5a), (ii) on 17 August, the Shannon index increased after oxidation. This could be caused by the higher relative abundance of Cyanobacteria on 17 August (<70%) as compared to 7 August (<33%) (Figure 4a). Indeed, at the order level, Chroococcales was predominant on 7 August and was not impacted by oxidation (Figure 4b). On 17 August, Nostocales (Dolichospermum) was predominant and was most impacted by oxidation. Finally, the impact of oxidative stress on microbial communities can be assessed by considering the relative CT. The relative abundance of cyanobacteria is inversely associated with the relative CT (Figure 6a,b).
At the cyanobacterial level and on 7 August, 5 mg/L KMnO4 did not affect diversity. However, 10 mg/L KMnO4 and both doses of H2O2 reduced the Shannon index. Furthermore, on 17 August, both doses of KMnO4 decreased cyanobacterial diversity (Figure 5b). The relative abundance of Synechococcus, Microcystis, Cyanobium and Prochlorococcus persisted during oxidation, while that of Dolichospermum decreased (Figure 4b,c). Precisely, on 7 August, the control (before oxidation) correlated with the relative abundance of Chroococcales followed by Nostocales. After oxidation with both KMnO4 and H2O2, Chroococcales was the most abundant order within the cyanobacterial community. On 17 August, the control was dominated by Nostocales followed by Chroococcales. After oxidation, the cyanobacterial community shifted towards Chroococcales. Therefore, regardless of the initial cyanobacterial composition, oxidation shifted cyanobacterial communities to the resistant orders such as Chroococcales (Figure 6c,d). The initial microbial community before oxidation and the CT determines the extent of changes caused by oxidation within the microbial composition as reported by Moradinejad et al. [29].

3.3. Oxidation of Cyanobacteria-Laden Sludge in a Full-Scale Plant

On-site sludge oxidation was performed by adding a single dose of 10 mg/L KMnO4 into the sludge holding tank on 17 August and 5 September. This simulates a shock treatment in the sludge holding tank. This type of simple corrective response can easily be used by operators if toxicity was detected at the source or in the sludge holding tank.
On 17 August, a 42% decrease was observed in total cyanobacterial cell counts after 24 h. No cells of Microcystis aeruginosa were detected and 76% of Dolichospermum spiroides and Aphanocapsa delicatissima were removed. Total taxonomic cell counts increased by 33% between 24 and 72 h in the absence of KMnO4 residual (see Section 3.2). This increase was driven mostly by Aphanocapsa holsatica, Aphanocapsa delicatissima and Aphanothece clathrata brevis but among potential toxin producers, Microcystis aeruginosa increased from non-detected to 3.3 × 10⁴ cells/mL after 72 h. Additionally, Dolichospermum spiroides depletion continued (99% removal) (Figure 7a). On 5 September and after 24 h, total taxonomic cell counts decreased by 34%. Precisely, an 18–99% reduction was observed in Chroococcus dispersus, Aphanocapsa delicatissima, Microcystis aeruginosa, and Aphanothece clathrata brevis. In contrast, cell counts of Dolichospermum spiroides increased by 79% (Figure 7b). After 48 h, total cell counts increased by 72% as compared to the 24 h contact time. A full-scale investigation of multiple repeated applications of 10 mg/L KMnO4 in a sludge thickener reported a similar range of total taxonomic cell count reduction ranging from 13–98% [18].
The on-site oxidation testing was conducted during regular plant operation involving up to four sludge extractions per hour. Since KMnO4 was applied as a single shock dose and because of regular inputs of new sludge, it was not possible to conduct a mass balance. Therefore, the observed increase in total taxonomic counts could be the result of: (i) fresh sludge containing cyanobacterial cells entering the sludge holding tank from the clarifier, (ii) cell settling from the sludge supernatant into the sludge in the sludge holding tank, and (iii) cell growth of cyanobacterial cells after dissipation of KMnO4.
On 17 August, the relative abundance of Proteobacteria increased slightly (>7%) and the relative abundance of Cyanobacteria decreased (16%) after 24 and 72 h (Figure 8a), as observed for the laboratory testing. At the cyanobacterial genus level, the relative abundance of Synechococcus increased. Interestingly, on-site oxidation decreased the relative abundance of two potentially toxic genera, Microcystis and Dolichospermum. However, Microcystis persisted more than Dolichospermum (Figure 8b).
On 17 August, cell-bound and dissolved MC levels were low (<67 ng/L) before oxidation and after 24 h. After 72 h, cell-bound MCs increased to 552 ng/L (Figure 9a). This is in line with the increase of potential MC producer species such as Microcystis aeruginosa (3.3 × 10⁴ cells/mL), Chroococcus dispersus (1.1 × 10⁴ cells/mL) and Aphanocapsa delicatissima (3.8 × 10⁵ cells/mL) (Figure 5a). On 5 September and before oxidation, total MCs were 1084 ng/L containing 952 and 132 ng/L cell-bound and dissolved MCs, respectively (Figure 9). After 24 and 48 h, cell-bound MCs reached 580 and 888 ng/L, respectively. Dissolved MCs increased to 230 and 168 ng/L after 24 h and 48 h, respectively.
KMnO4 was shown to cause cell-bound MCs release and degrade dissolved MCs efficiently, with oxidation rate constants ranging from 4.51–22 M−1 s−1 for cell-bound MCs release to 118–520 M−1 s−1 for degradation of various dissolved analogs of MCs [34,49,50]. In fact, dissolved MCs are easily degraded and KMnO4 compromises cell integrity. If a residual persists, it degrades released cell-bound MCs [31,51]. However, in our work, this trend was not observed on 17 August, as a sharp increase in cell-bound MCs after 72 h was detected due to either the impact of fresh MCs producing species, an increased expression of MC synthesis genes (mcy) or growth of surviving MC producing species.
Taxonomic cell counts in the sludge supernatant increased by up to two-fold after on-site oxidation, and by even more than 144X on 17 August after 72 h contact time (Figure S3a,b). Before oxidation, potential MC producing species accounted for 23% and 1% of the total cell counts on 17 August and 5 September, respectively. After oxidation, this percentage increased on 17 August to 36% and 51% after 24 and 72 h oxidation, respectively. On 5 September, up to 58% of total cell counts remained as potential MC producers for both contact times. Although total MC concentrations were lower than 160 ng/L before oxidation, they increased by 46–140% in three out of four cases after oxidation (Figure S3c,d). In contrast to observations in the sludge (Figure 7), the proportion of dissolved to cell-bound MCs was greater in the supernatant. A dynamic exchange of cells and toxins can occur between sludge and supernatant in the holding tank [11], posing an operational challenge during sludge management. These findings support other reports [18,33,52], outlining the challenge of supernatant recycling to the head of the DWTPs during toxic cyanobacterial blooms.
Small facilities (e.g., the studied DWTP) may not be able to install quickly and operate safely online dosage equipment for continuous on-site oxidation of sludge. Additionally, such an approach may be warranted if cyanobacterial accumulation in sludge is not a frequent problem at a given site. Sporadic shock oxidation treatment of sludge holding tanks is easy to implement and could provide a temporary response to the presence of toxins in the stored sludge, allowing for existing disposal methods to be maintained. In that case, the system will not be isolated at least not for an extended period. Documenting the impact of on-site shock oxidation in these dynamic operating conditions provide valuable information to operators.

3.4. Impact of Stagnation on Oxidized Cyanobacteria-Laden Sludge

3.4.1. Stagnation after Laboratory Oxidation

This section provides results from a controlled system of cell decay or cell growth after sludge oxidation and stagnation. Overall, in most of the sludge samples (12 out of 16), KMnO4 oxidation followed by stagnation resulted in a 4–70% cell count reduction as compared to only oxidized samples (Figure 1, Figure 2 and Figure 3). However, a 17–75% increase in total counts was also observed in some samples (4 out of 16) during stagnation (Figure 1, Figure 2 and Figure 3). H2O2 oxidation resulted in an important decrease in total taxonomic cell counts by 58% for 10 mg/L and 77% for 20 mg/L H2O2. However, during stagnation, a 17–161% (1.2–2.6 time) cell growth was observed in four out of six samples oxidized by H2O2. In the 10 mg/L H2O2 followed by stagnation, total taxonomic cell counts increased by 17% after 9 days and then decreased by 4% and 44% after 17 and 34 days, respectively. In contrast, with 20 mg/L H2O2, taxonomic cell counts increased back by 22–161% (1.2–2.6 time) within 9 to 34 days (Figure 2). Results presented in Section 3.3 and plotted in Figure 1, Figure 2 and Figure 3 show that stagnation alone causes a sharp and quite stable reduction of taxonomic cell counts. These findings reveal that the combination of oxidation and stagnation overall reduces taxonomic cell counts by 12–76% depending on the duration of stagnation, falling short of global removal observed without oxidation that ranges from 19–83%.
Combining oxidation with stagnation increased taxonomic cell counts by 7–145% (1.1–2.4 time) as compared to samples with only stagnation in 14 out of 22 cases (Figure 1, Figure 2 and Figure 3). Specifically, 10 mg/L H2O2 followed by stagnation caused a 24–55% increase in total cell counts within 9–34 days as compared to stagnated (non-oxidized) samples. A dynamic trend of taxonomic cell count decrease and the increase was also observed in the sample oxidized by 20 mg/L H2O2 followed by stagnation.
These observations in controlled conditions clearly demonstrate an increased potential for regrowth when oxidation is used prior to stagnation. Regardless of the actual increase in cell counts, it may be more relevant to quantify what type of cells are likely to regrow after storage preceded by oxidation. Cell growth was mostly observed for Aphanothece clathrata brevis and for MCs producers as Microcystis aeruginosa, Dolichospermum spiroides, and Aphanocapsa delicatissima.
Despite rather low concentrations of measured MCs, MCs in the oxidized sludge generally decreased during stagnation, but less so than in only stagnated samples. In 14 out of 22 samples, MCs increased by 1.2–10X, suggesting that oxidation followed by stagnation was not capable of controlling low levels of MCs in sludge (Figure S4).
The impact of KMnO4 and H2O2 on cyanobacterial communities is quite different (Figure S5). Stagnation time significantly affected cyanobacterial communities (p < 0.05) in the sludge oxidized by KMnO4 with a shift towards tolerant orders such as Chroococcales and Pleurocapsales. This shift was also observed for only stagnated samples. Similar to Moradinejad et al. [29] findings of H2O2 oxidation of cyanobacterial bloom water, H2O2 oxidation of sludge in this study reveals selective reduction of Chroococcales. The distinct shift is obtained following stagnation only.

3.4.2. Stagnation after On-Site Oxidation

On 17 August and as compared to oxidation alone, taxonomic cell counts increased by 55% in sludge collected 24 h after on-site oxidation and subjected to controlled stagnation for 10 days (Figure 7a). In contrast, taxonomic cell counts decreased by 15% after 20 days of stagnation. After 38 days, taxonomic cell counts increased by 5% as compared to oxidation alone. Taxonomic cell counts increased by 10–40% in sludge collected 72 h after on-site oxidation and subjected to controlled stagnation as compared to oxidation alone (Figure 7a).
The relative abundance of Cyanobacteria increased during oxidation/stagnation as compared to the non-oxidized/stagnated samples (Figure 8a). Similarly, the relative abundance of Microcystis increased during oxidation/stagnation. The highest increase was observed in the 24 h/10-day and the 72 h/20-day samples (Figure 8b). In accordance with our laboratory oxidation/stagnation results, depletion of Nostocales and persistence of Chroococcales order were observed (Figure S6).
To better visualize the taxonomic composition after 38 days of stagnation following on-site KMnO4 oxidation, differential heat trees were used to show pairwise comparisons at the microbial and the cyanobacterial level between T0 (oxidized sludge and not stagnated) and T38 (oxidized sludge after 72 h and stagnated for 38 days). Verrucomicrobia, Actinobacteria, and Proteobacteria (Gammaproteobacteria and Alphaproteobacteria) phyla were more abundant after stagnation. Within Cyanobacteria, the majority of Oscillatoriales, Gloebacterales were more abundant after stagnation. Chroococcales and Nostocales were partitioned between representatives that persist after stagnation and others that do not persist (Figure S7).
Cell-bound MCs in the oxidized sludge (24 and 72 h) remained 1.2–27 times higher than that of non-oxidized sludge during stagnation (Figure 9a). In the non-oxidized sludge, mcyD gene copy numbers gradually increased with stagnation from 14 copies/mL (day 10) to 123.7 copies/mL (day 20) and 95.6 copies/mL (day 38). Samples collected 24 h after oxidation showed a low level of mcyD gene copies (<37 copies/mL). Surprisingly, mcyD gene copy numbers increased after 72 h oxidation/stagnation by 5.7X and 13.0X after 20 and 38 days, respectively, as compared to the 10-day stagnated sample (Figure 9c). Interestingly, 58% of cell counts were potential MCs producers before oxidation, and on-site oxidation decreased this percentage to 33% and 46% after 24 and 72 h oxidation, respectively (Figure 7a). The percentage of potential MC producers remained relatively stable during stagnation without oxidation and in the sample taken 24 h after oxidation (13–30%). Most importantly, this proportion increased up to 35–56% in the samples collected 72 h after oxidation followed by stagnation (Figure 7a). This marked increase corresponds to 7.2 × 10⁵ cells/mL out of which 82% were potential MC producers mainly Aphanocapsa delicatissima, Aphanocapsa holsatica, and Chroococcus dispersus.
On 5 September and as compared to oxidation alone, taxonomic cell counts in the sludge after on-site oxidation (24 h)/8-day stagnation increased by up to 24% (Figure 7b). Then, taxonomic cell counts slightly decreased (15%) after 23 and 35 days of stagnation (Figure 7b). About 48% of cyanobacterial cells before oxidation were potential MC producers. In this case, oxidation decreased the percentage of potential MC producer species by 39%, and subsequent stagnation caused an additional 12–31% decrease in cell counts (Figure 7b). On this date, slightly higher MC concentrations were detected (Figure 9b). On-site oxidation did not markedly decrease these MCs (3–25%) as shown by the 24 h and 48 h results (Figure 9b). However, stagnation without oxidation decreased MCs by 73% within 8 days and up to 86% within 35 days. A different trend was observed for the oxidized sludge as total MCs were barely reduced by 8 days and then reduced by up to 81% within 35 days. Cell-bound MCs in the oxidized sludge remained around 0.7 times less than non-oxidized sludge during stagnation. However, dissolved MCs remained 1.2–9.2× higher than non-oxidized/stagnated sludge within 8–35 days (Figure 9b).

3.5. Factors Affecting the Fate of Cyanobacteria and MCs in Sludge

Different phenomena should be considered to understand the fate of cyanobacteria and MCs in real sludge after oxidation and stagnation:
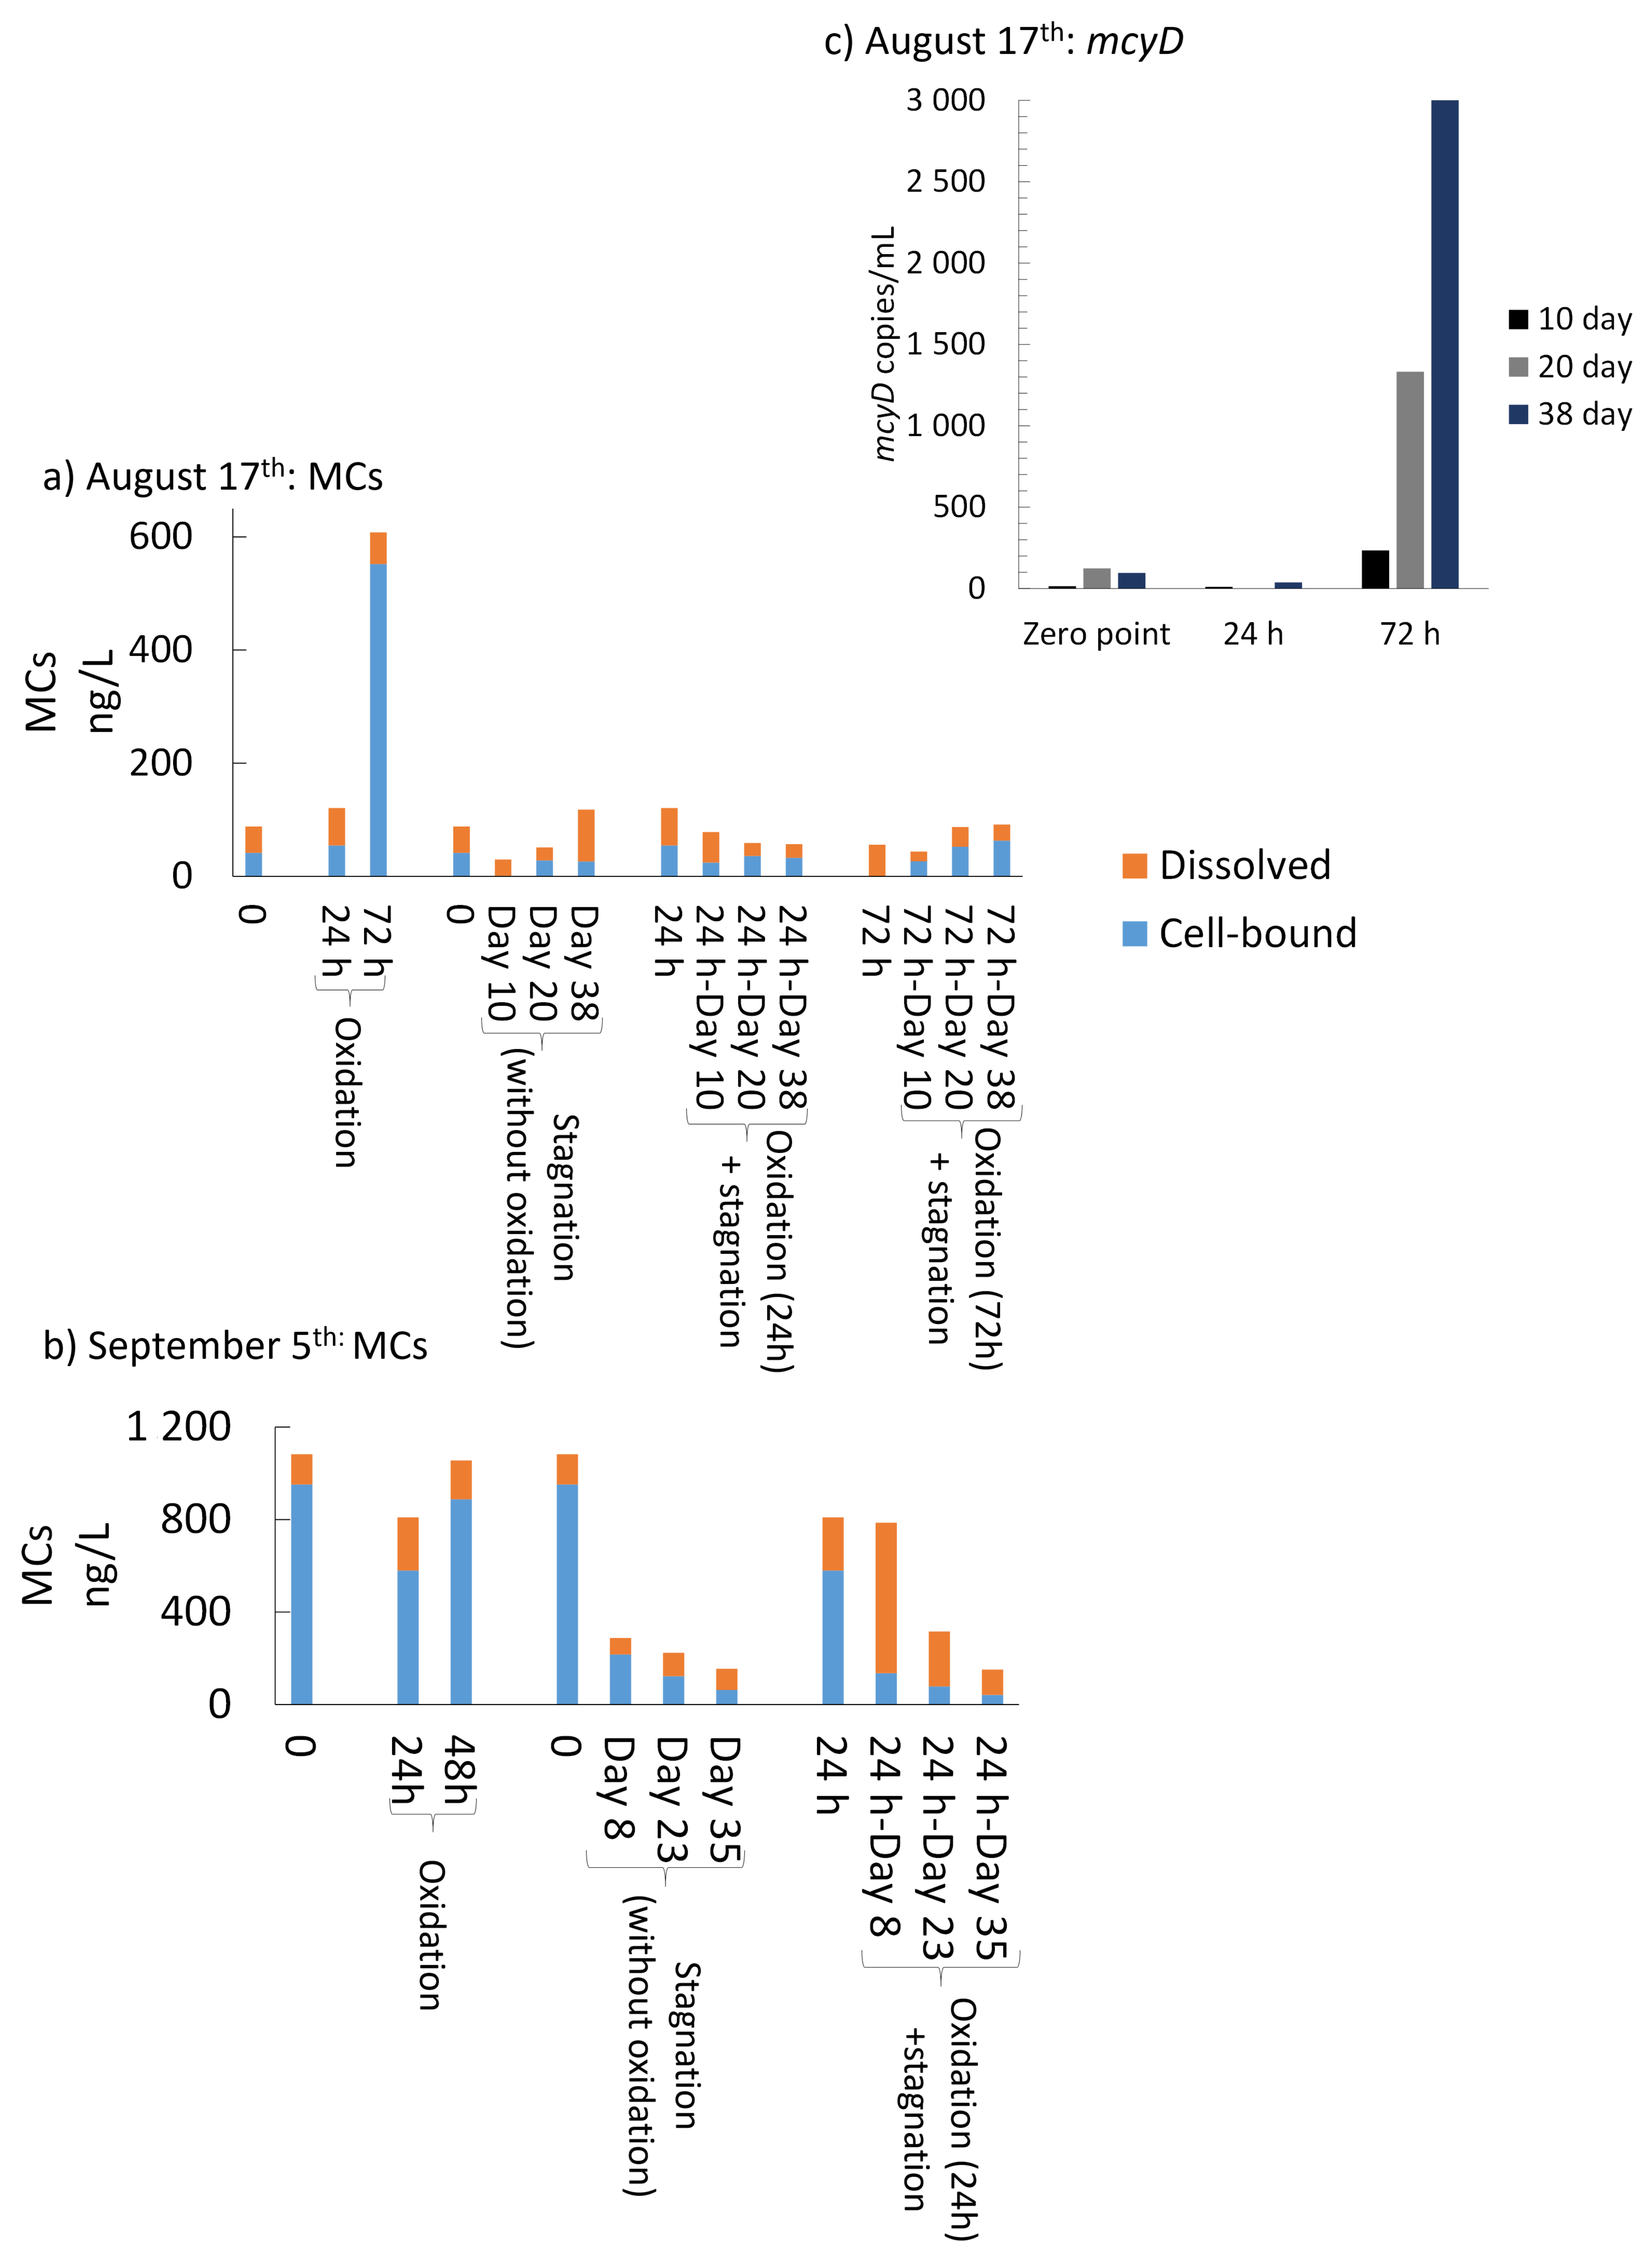
  • MCs detected in the sludge are present in dissolved and cell-bound forms and this partitioning is affected by storage and oxidation. Cyanobacterial cell integrity losses can lead to the release of cell-bound cyanotoxins after oxidation [27,28] and as revealed by this study, after stagnation. Released dissolved MCs can be oxidized [31], adsorbed onto PAC or flocs [11,53] or can be biodegraded by species belonging to Proteobacteria, Actinobacteria, and Firmicutes [54,55].
  • Oxidation causes significant changes in microbial diversity leading to the selective persistence of some cyanobacterial species over other communities [29,30] and nutrient availability [11] as obtained here by the increase of DOC (data not shown). These factors could explain the observed growth of some cyanobacterial species proceeded by oxidation and stagnation.
  • Oxidative stress (ex. H2O2 and nutrient depletion) may cause gene expression regulation of mcy genes, leading to MCs production [56,57]. There are no data about gene expression regulation in the presence of KMnO4 in water or sludge samples. In our investigation, the combination of oxidation and stagnation represents an increase in oxidative stress.

4. Conclusions

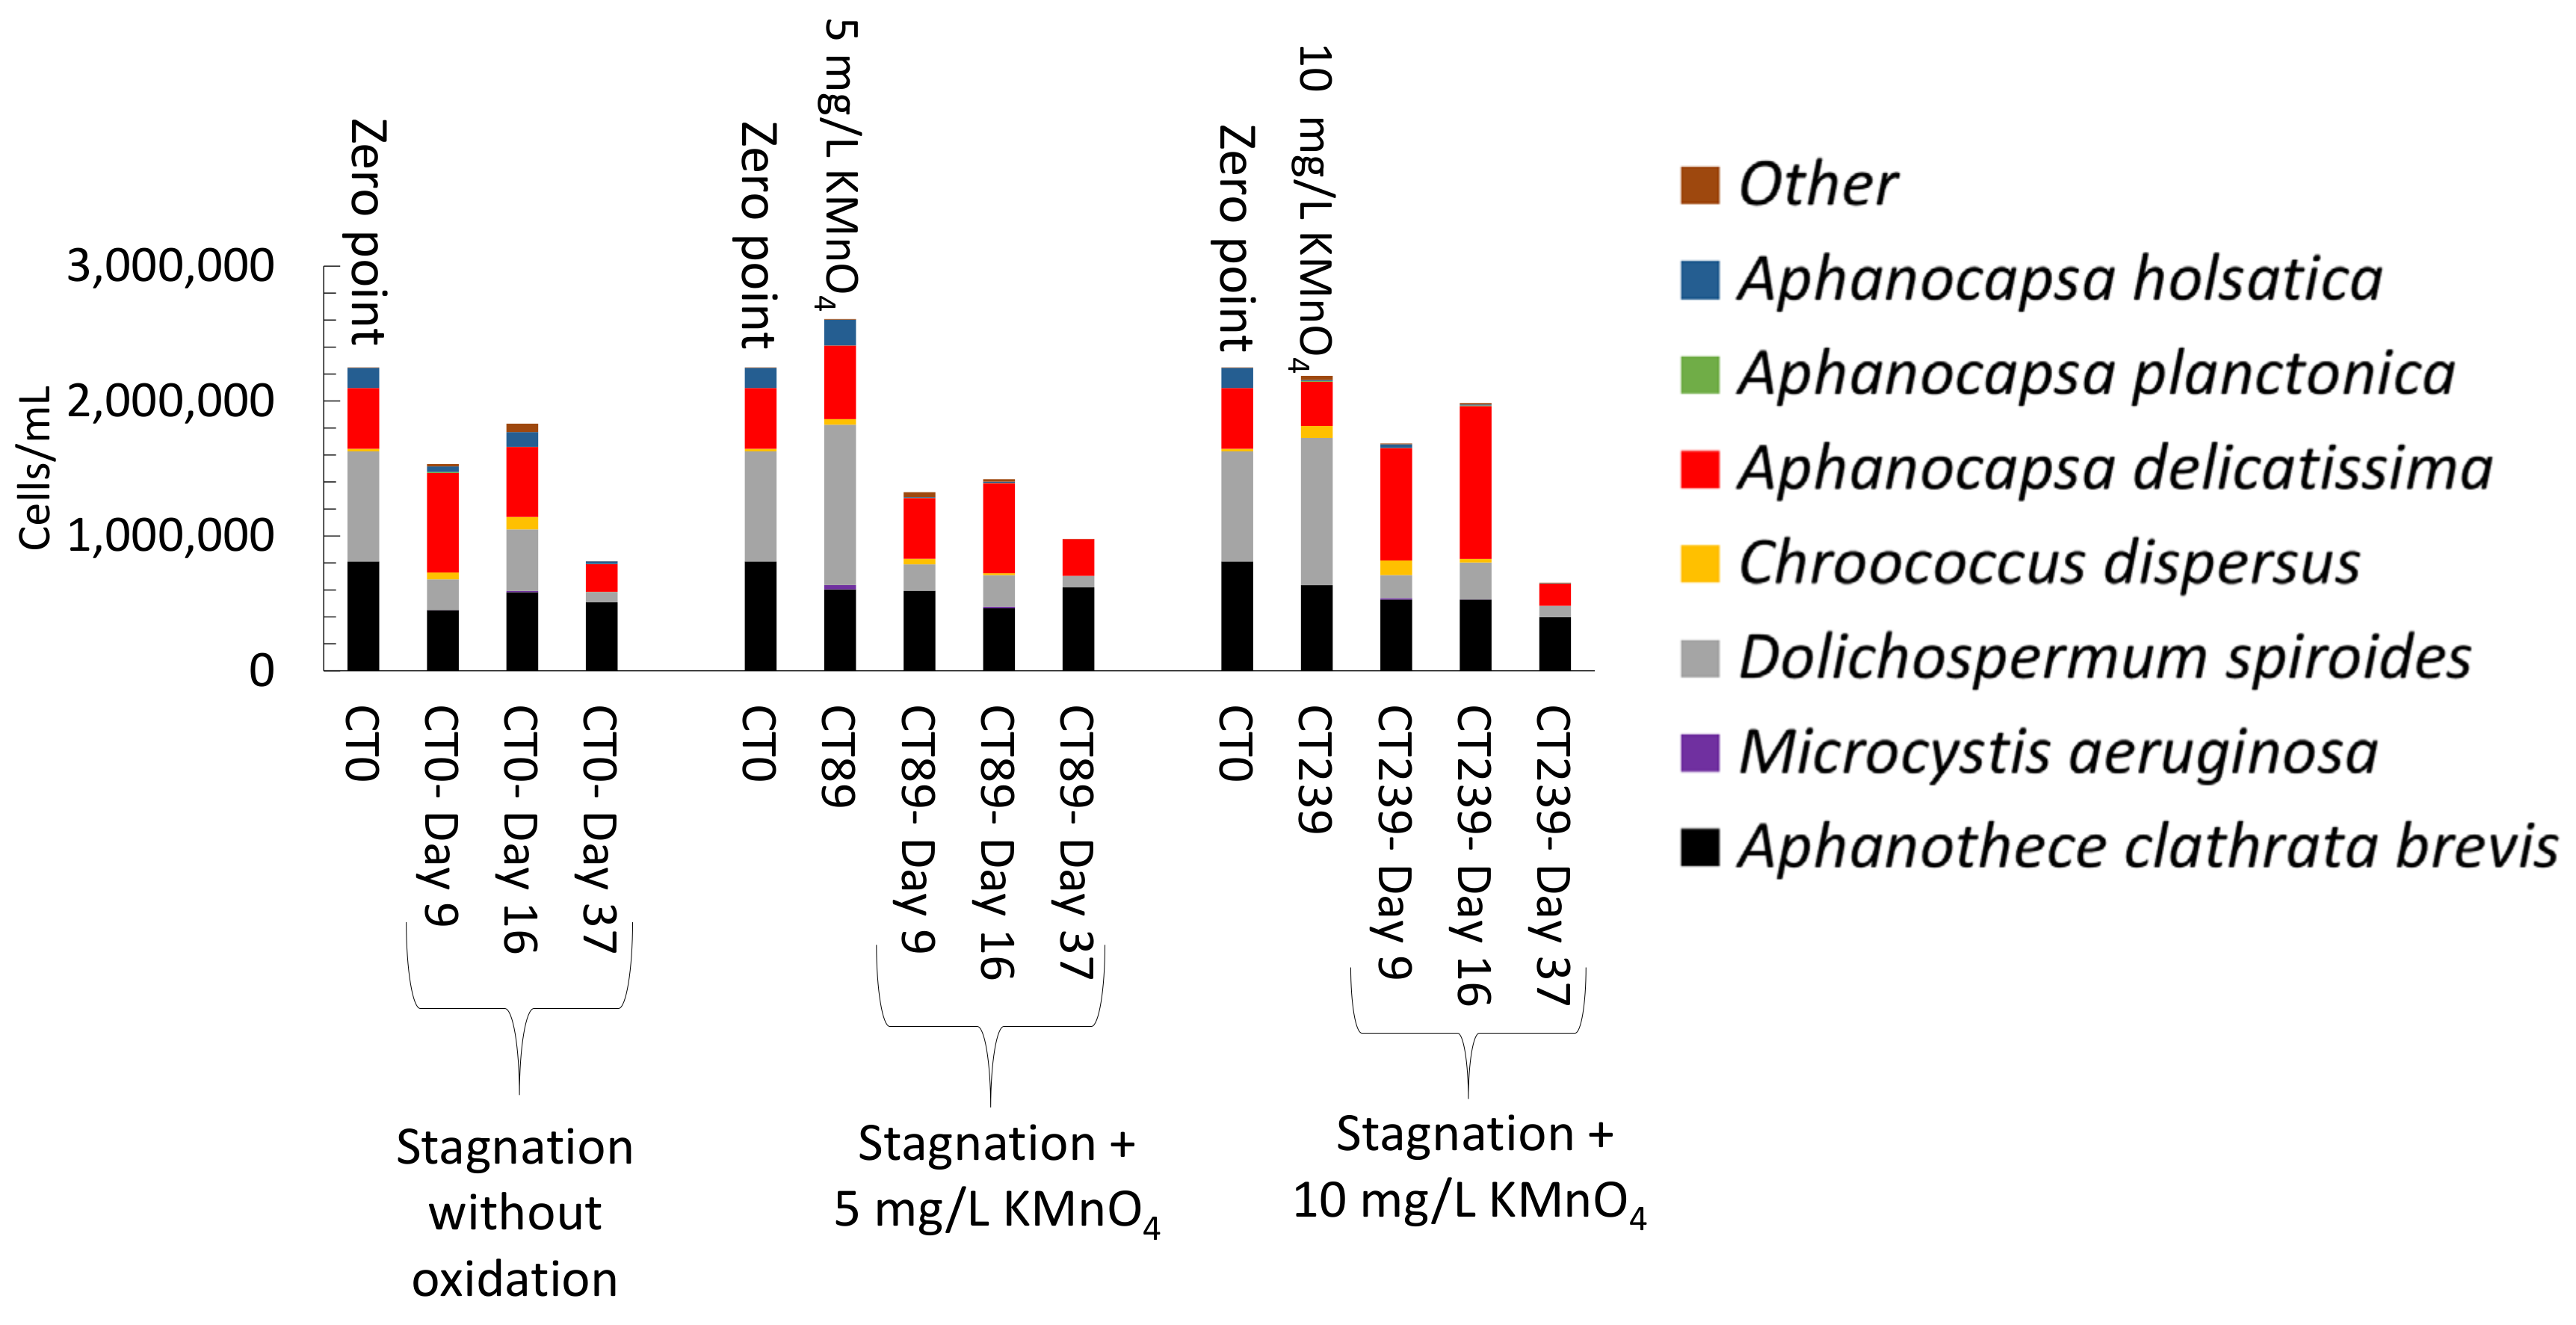
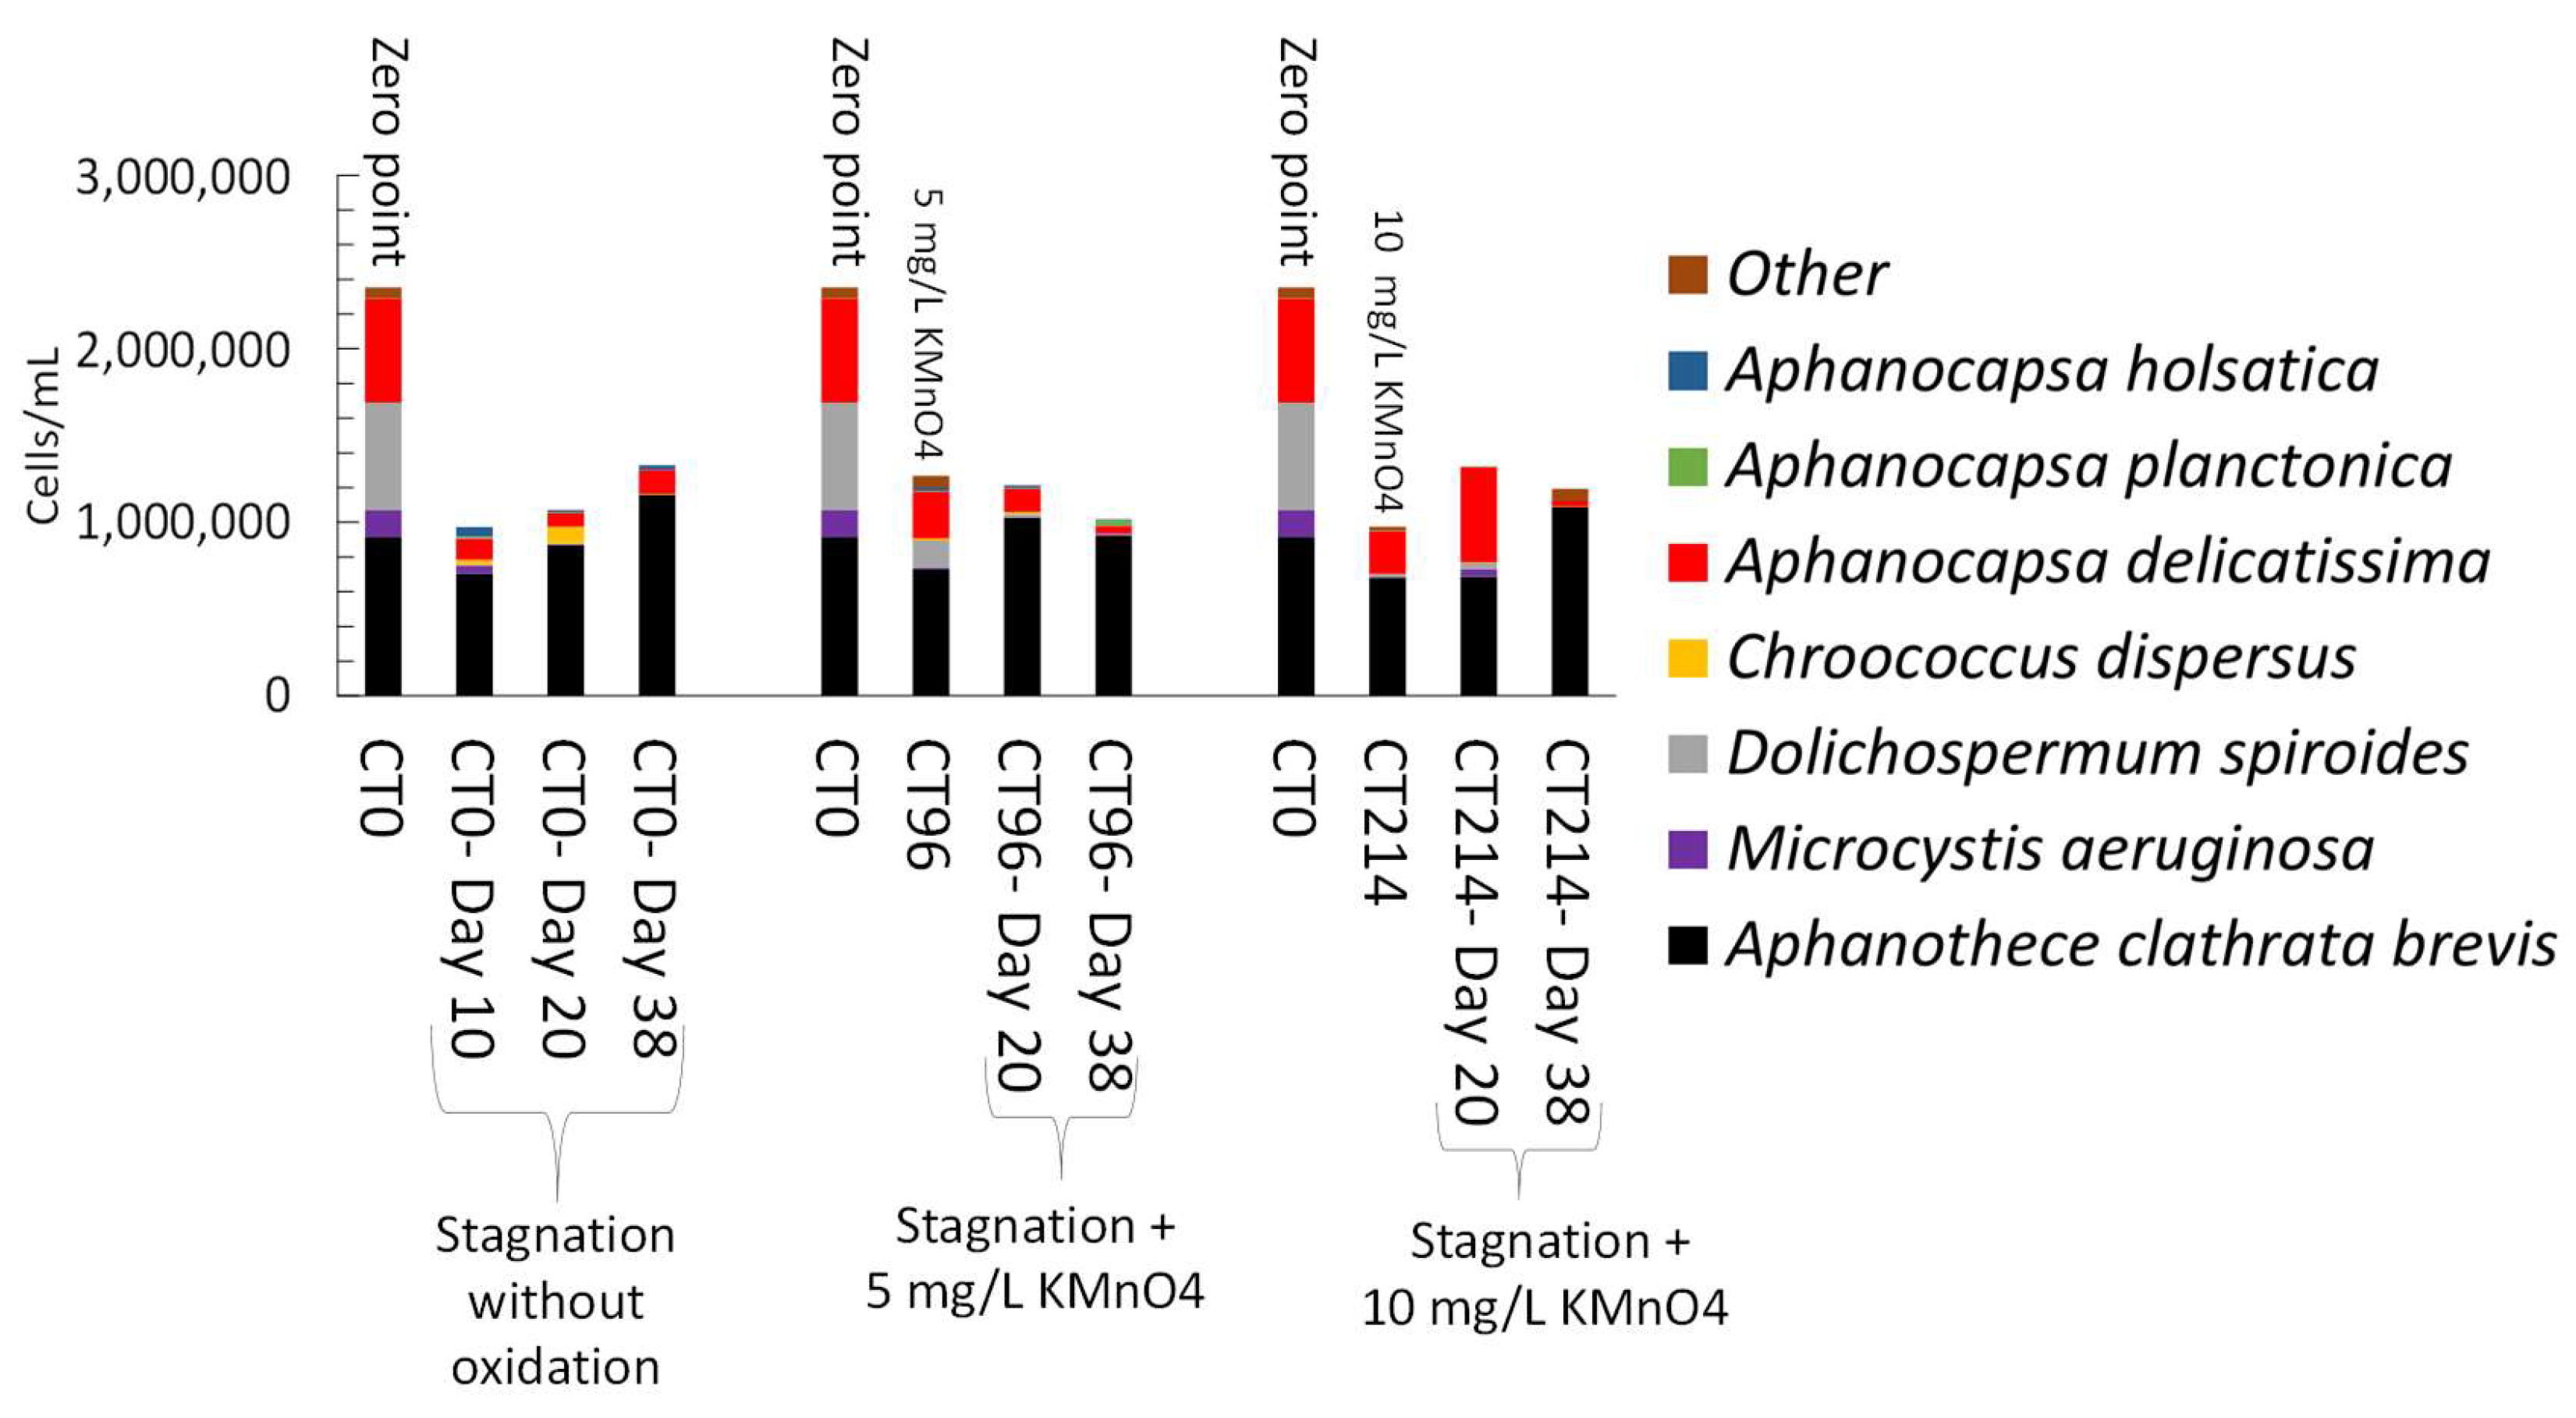
  • Controlled laboratory oxidation with KMnO4 and H2O2 decreased total taxonomic counts, as well as potential MC producers. The highest observed cell count decrease was from 2.7 × 10⁶ cells/mL to 6.2 × 10⁵ cells/mL (77%) when applying 20 mg/L H2O2. However, stagnation after controlled oxidation (laboratory scale) led to an increase of cyanobacterial cells in 8 out of 22 samples as compared to oxidation alone. The highest cell count increase after stagnation was from 6.2 × 10⁵ cells/mL to 1.6 × 10⁶ cells/mL (2.6-fold increase) observed in the sludge sample oxidized by 20 mg/L H2O2 and stagnated for 17 days. KMnO4 (10 mg/L) and H2O2 (20 mg/L) could decrease MC concentration up to 98% (from 63 ng/L to below detection limit) and 41% (from 139 ng/L to 77 ng/L), respectively. Laboratory oxidation did not lead to higher production of MCs during stagnation. When comparing H2O2 and KMnO4 oxidation results in the same day, H2O2, with greater half-lives than KMnO4, was more effective than KMnO4 for a decrease of cyanobacterial cells and cyanotoxin concentrations. Similarly, oxidation/stagnation caused cell growth in 14 out of 22 samples by up to 145% as compared to stagnation alone.
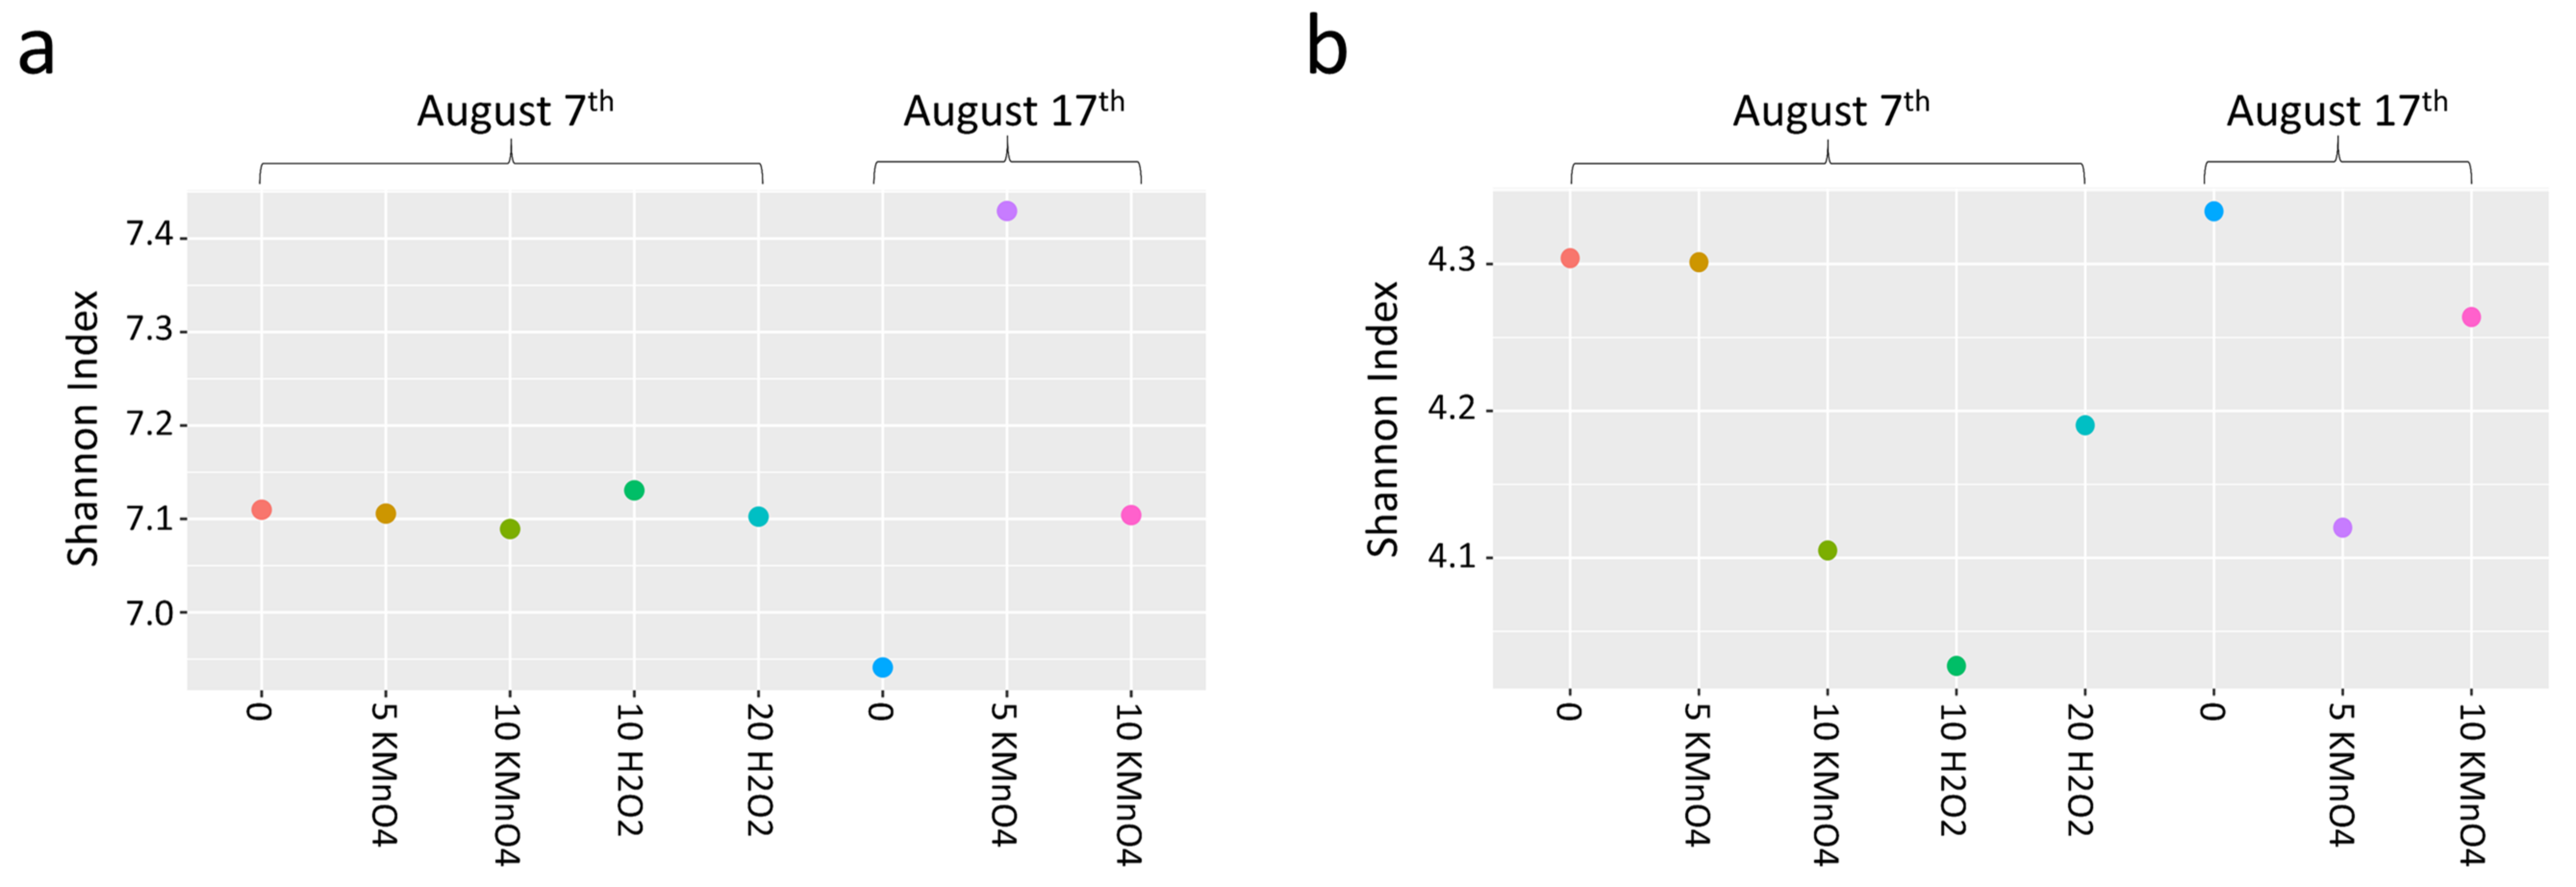
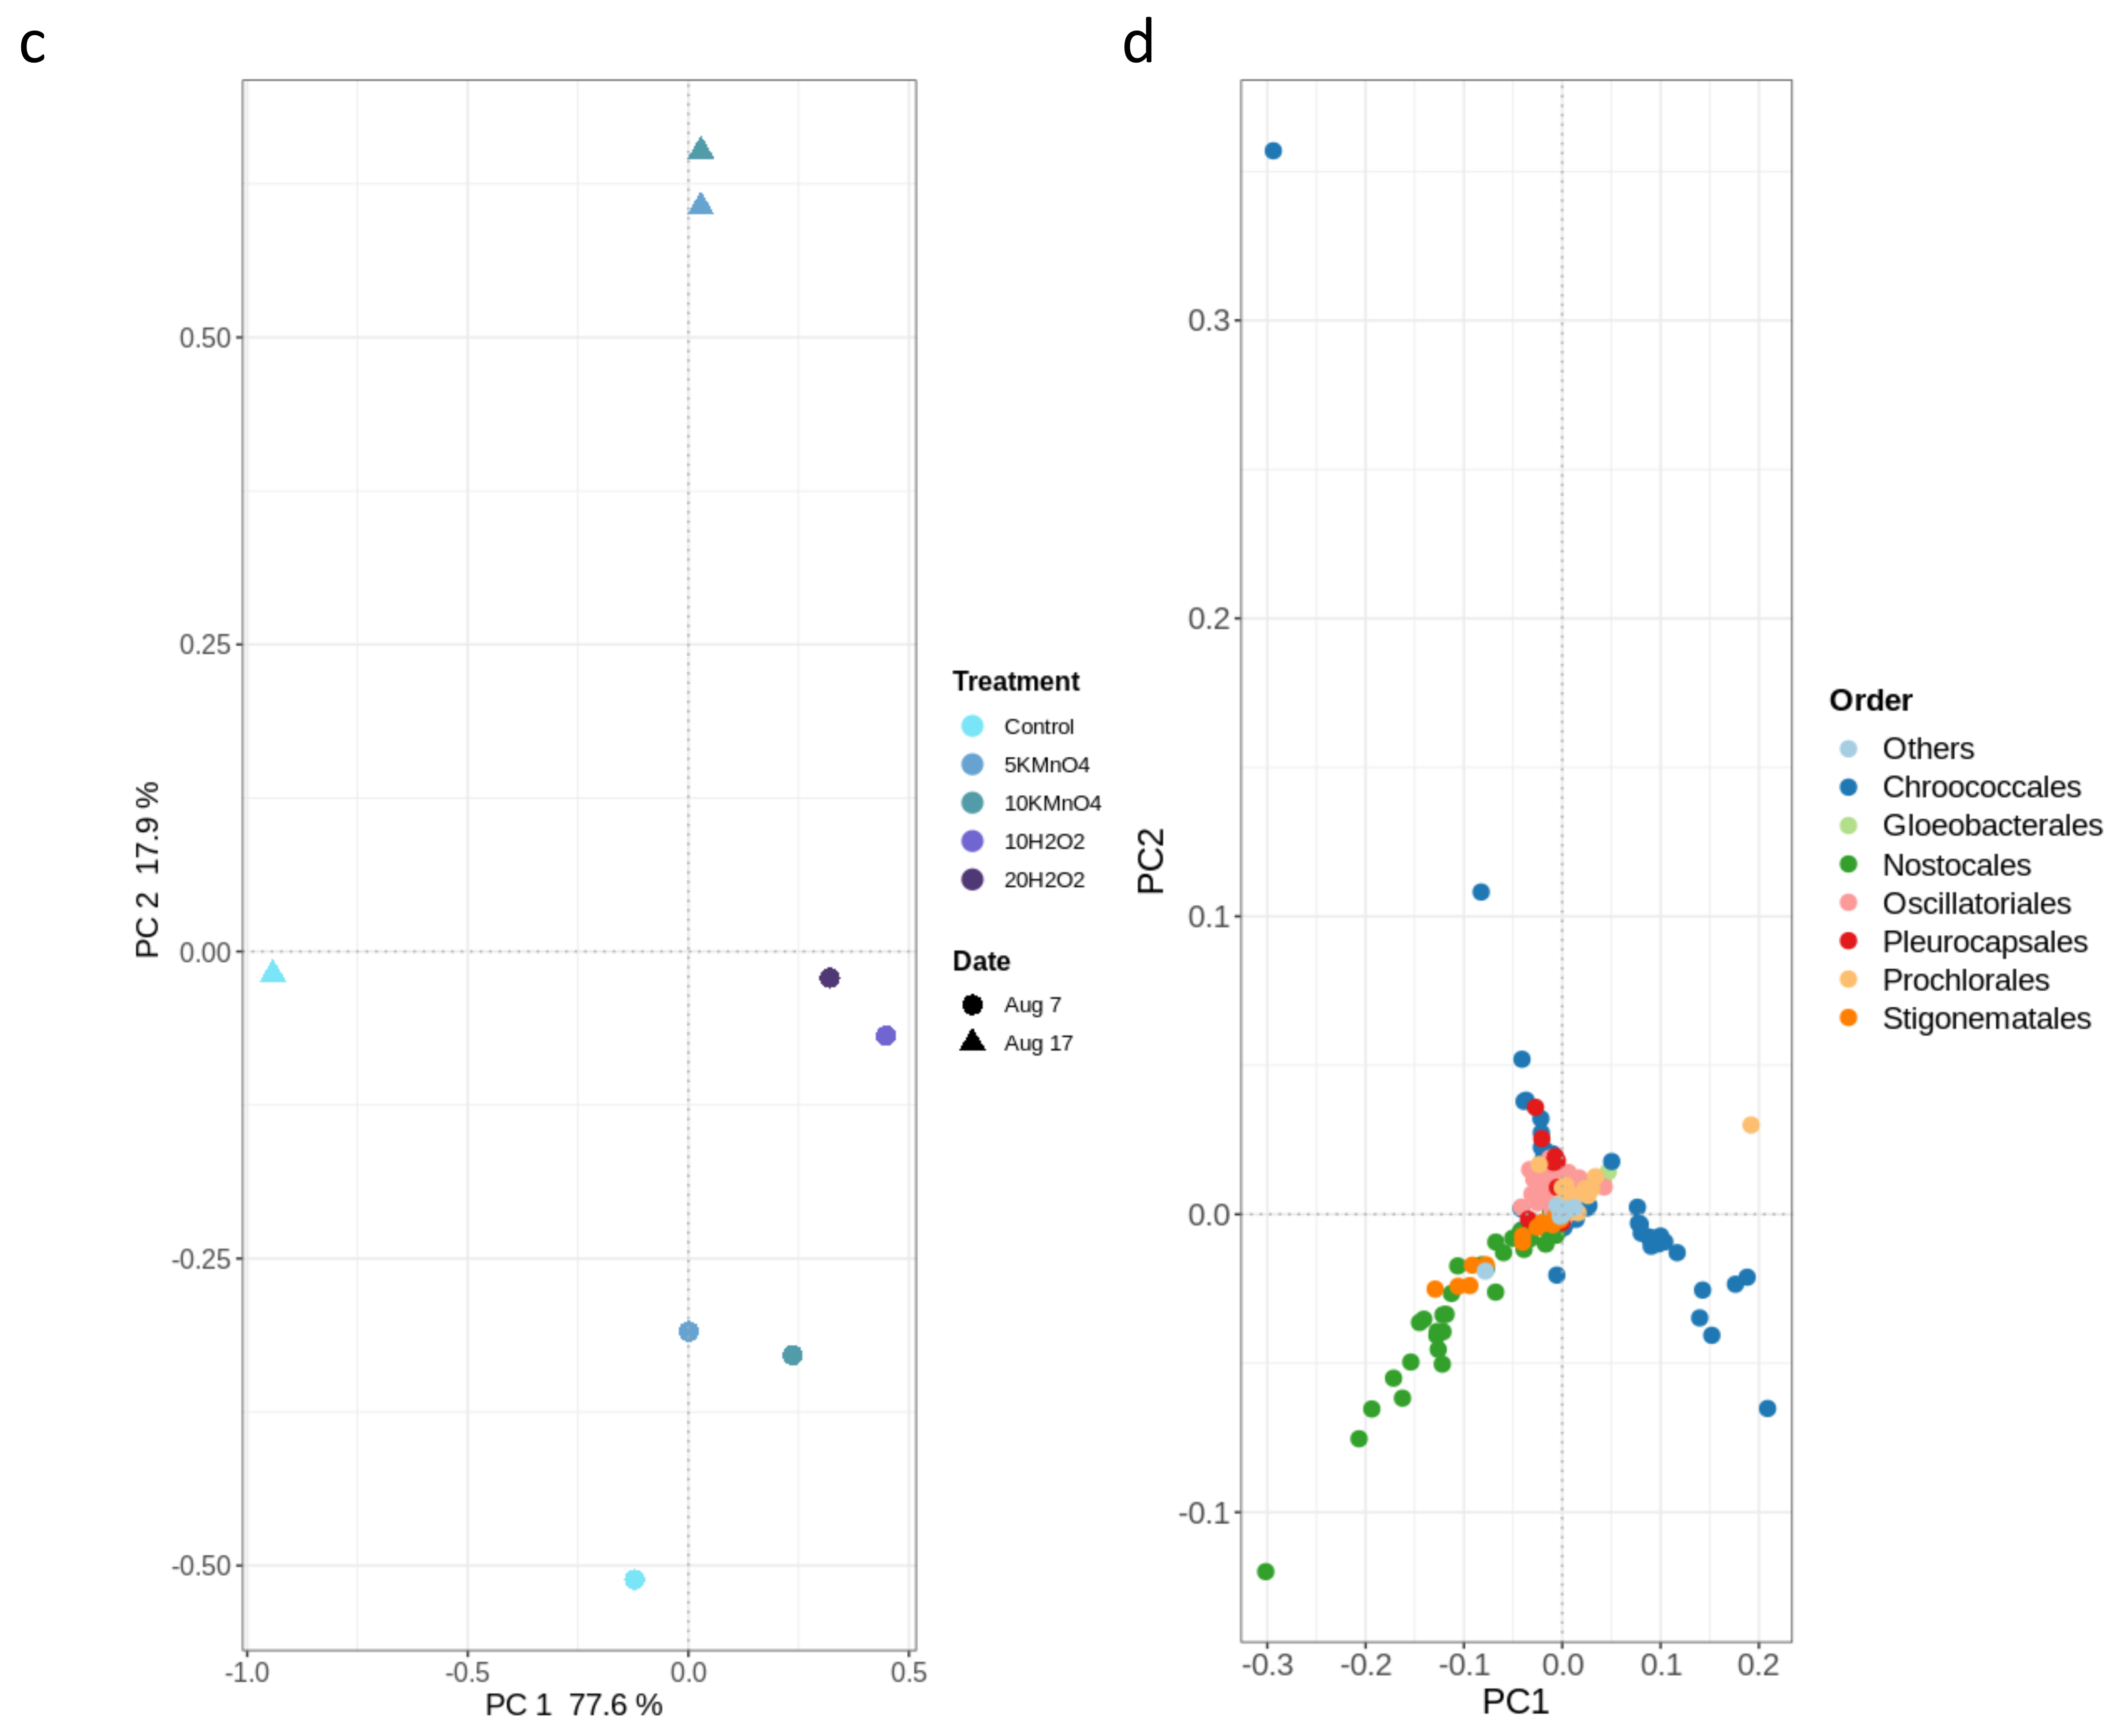
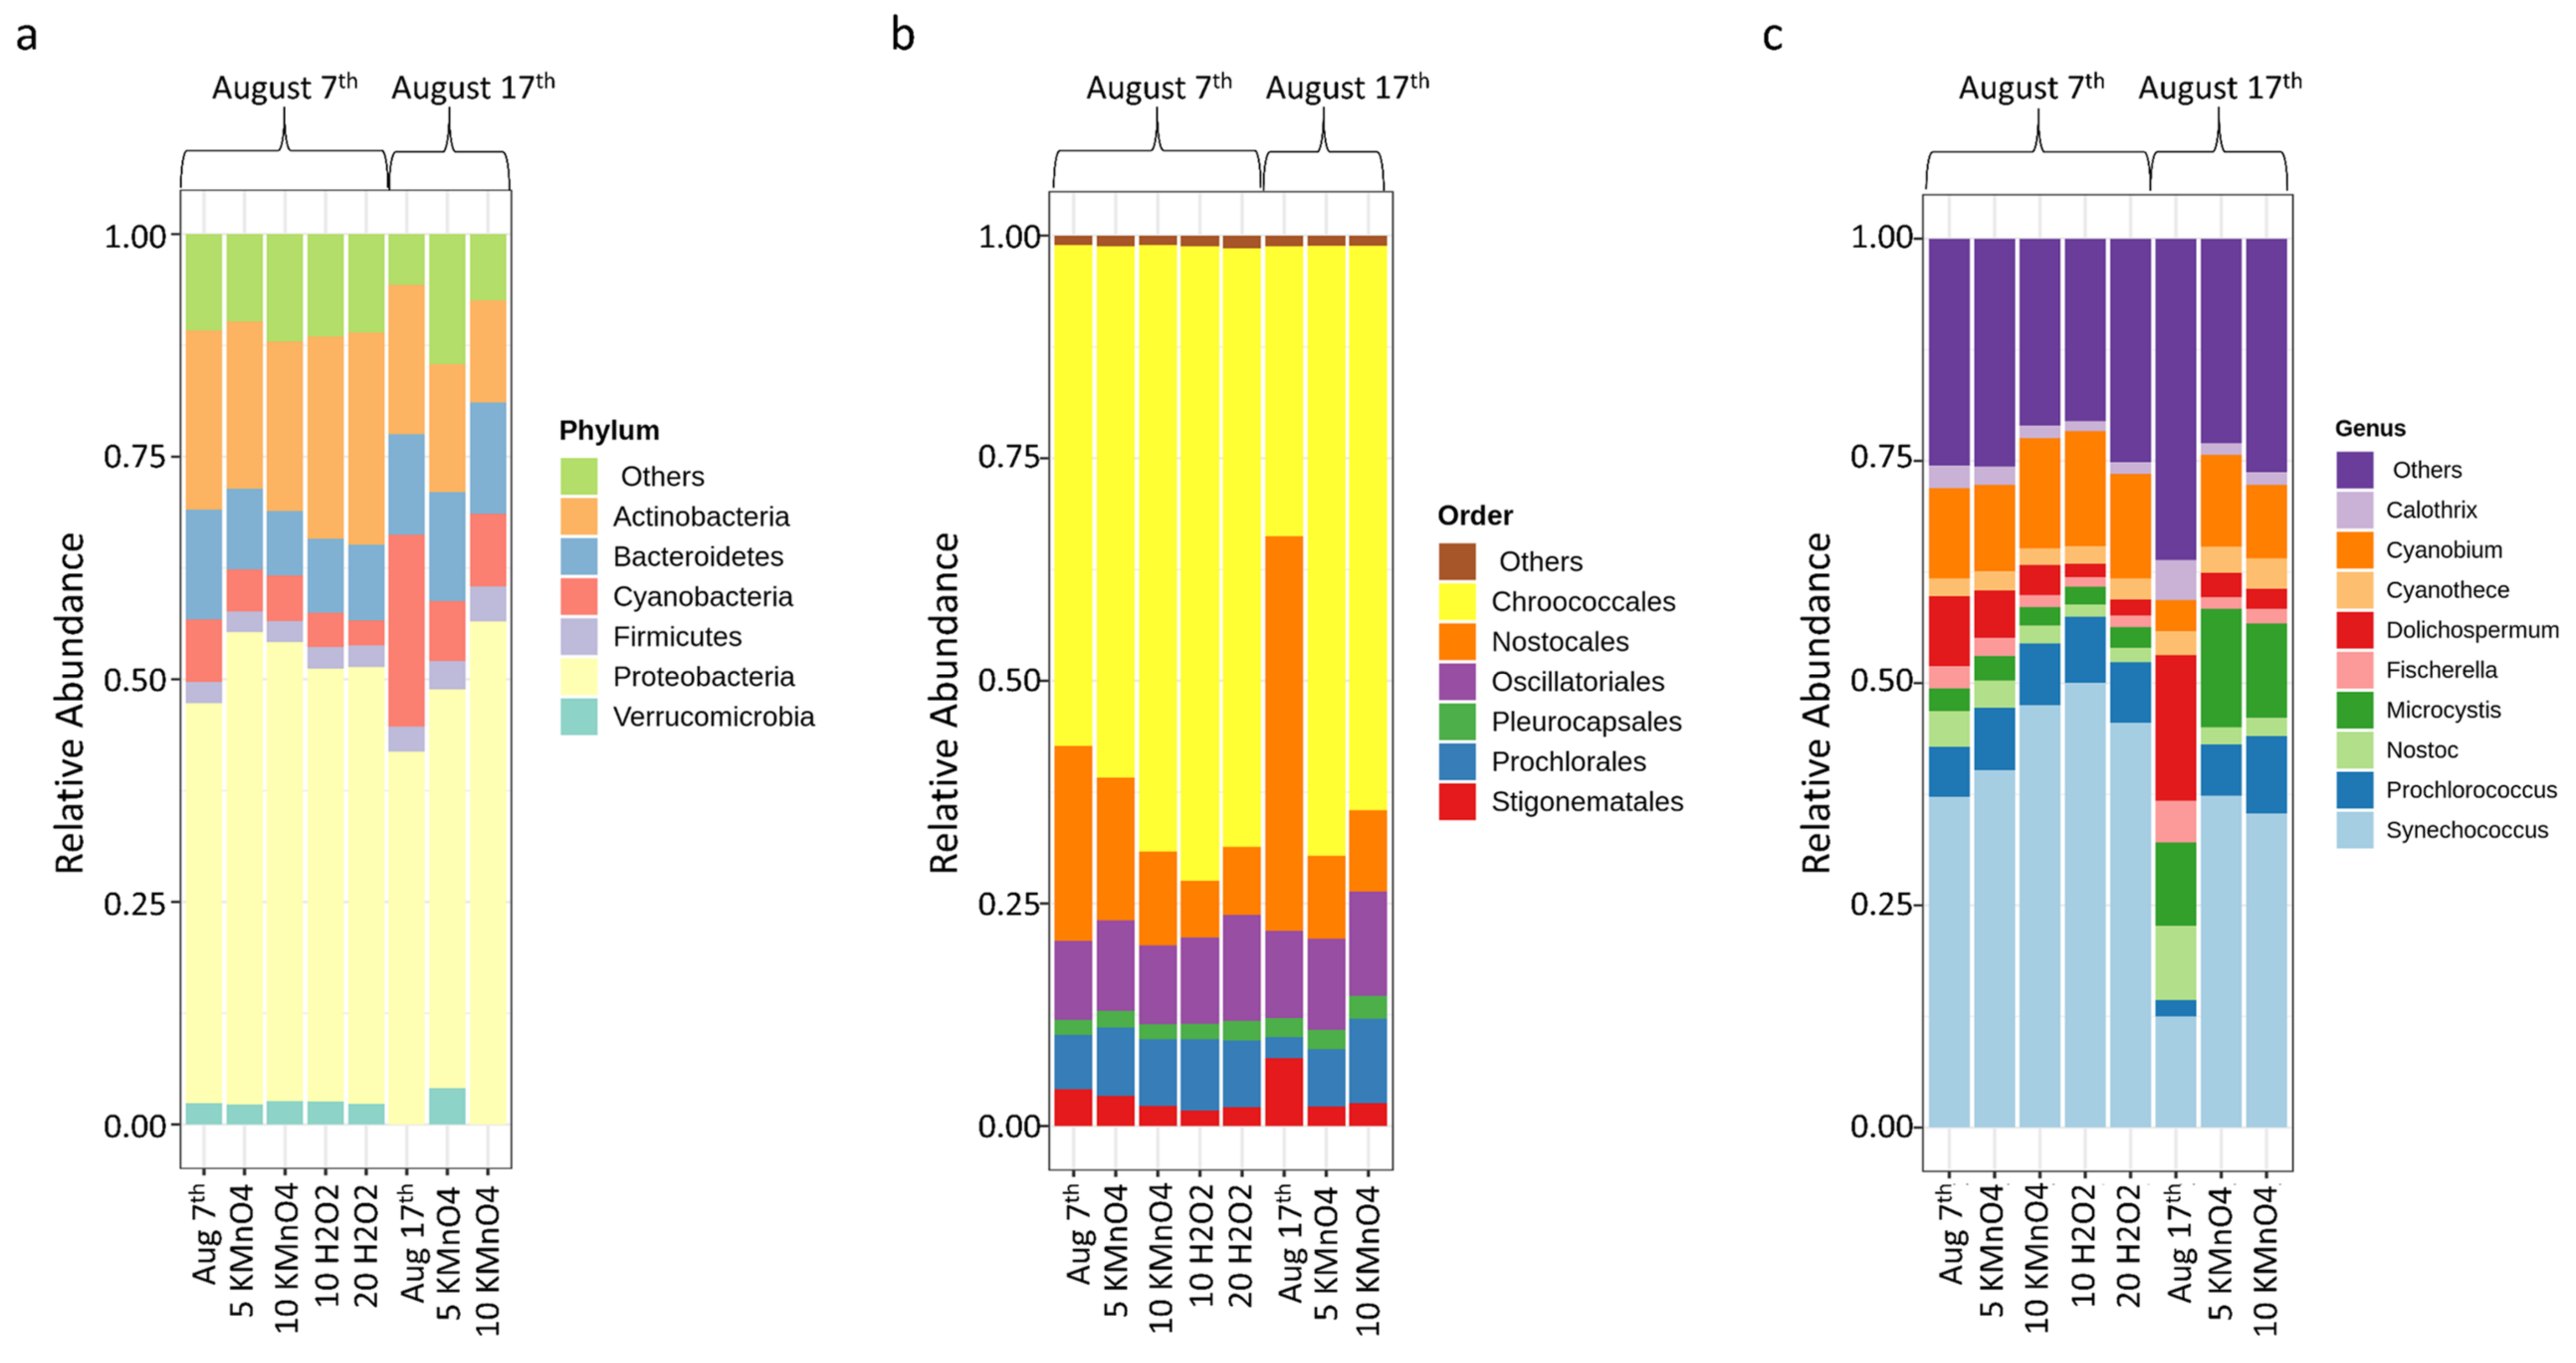
  • Laboratory oxidation shifted cyanobacterial diversity from Nostocales (Dolichospermum) towards Chroococcales (Microcystis) and Synechococcales (Synechococcus) as the persistent orders (genus). Opposite to KMnO4 oxidation, in which no selective removal within the cyanobacterial community was observed, H2O2 selectively reduced Chroococcales.
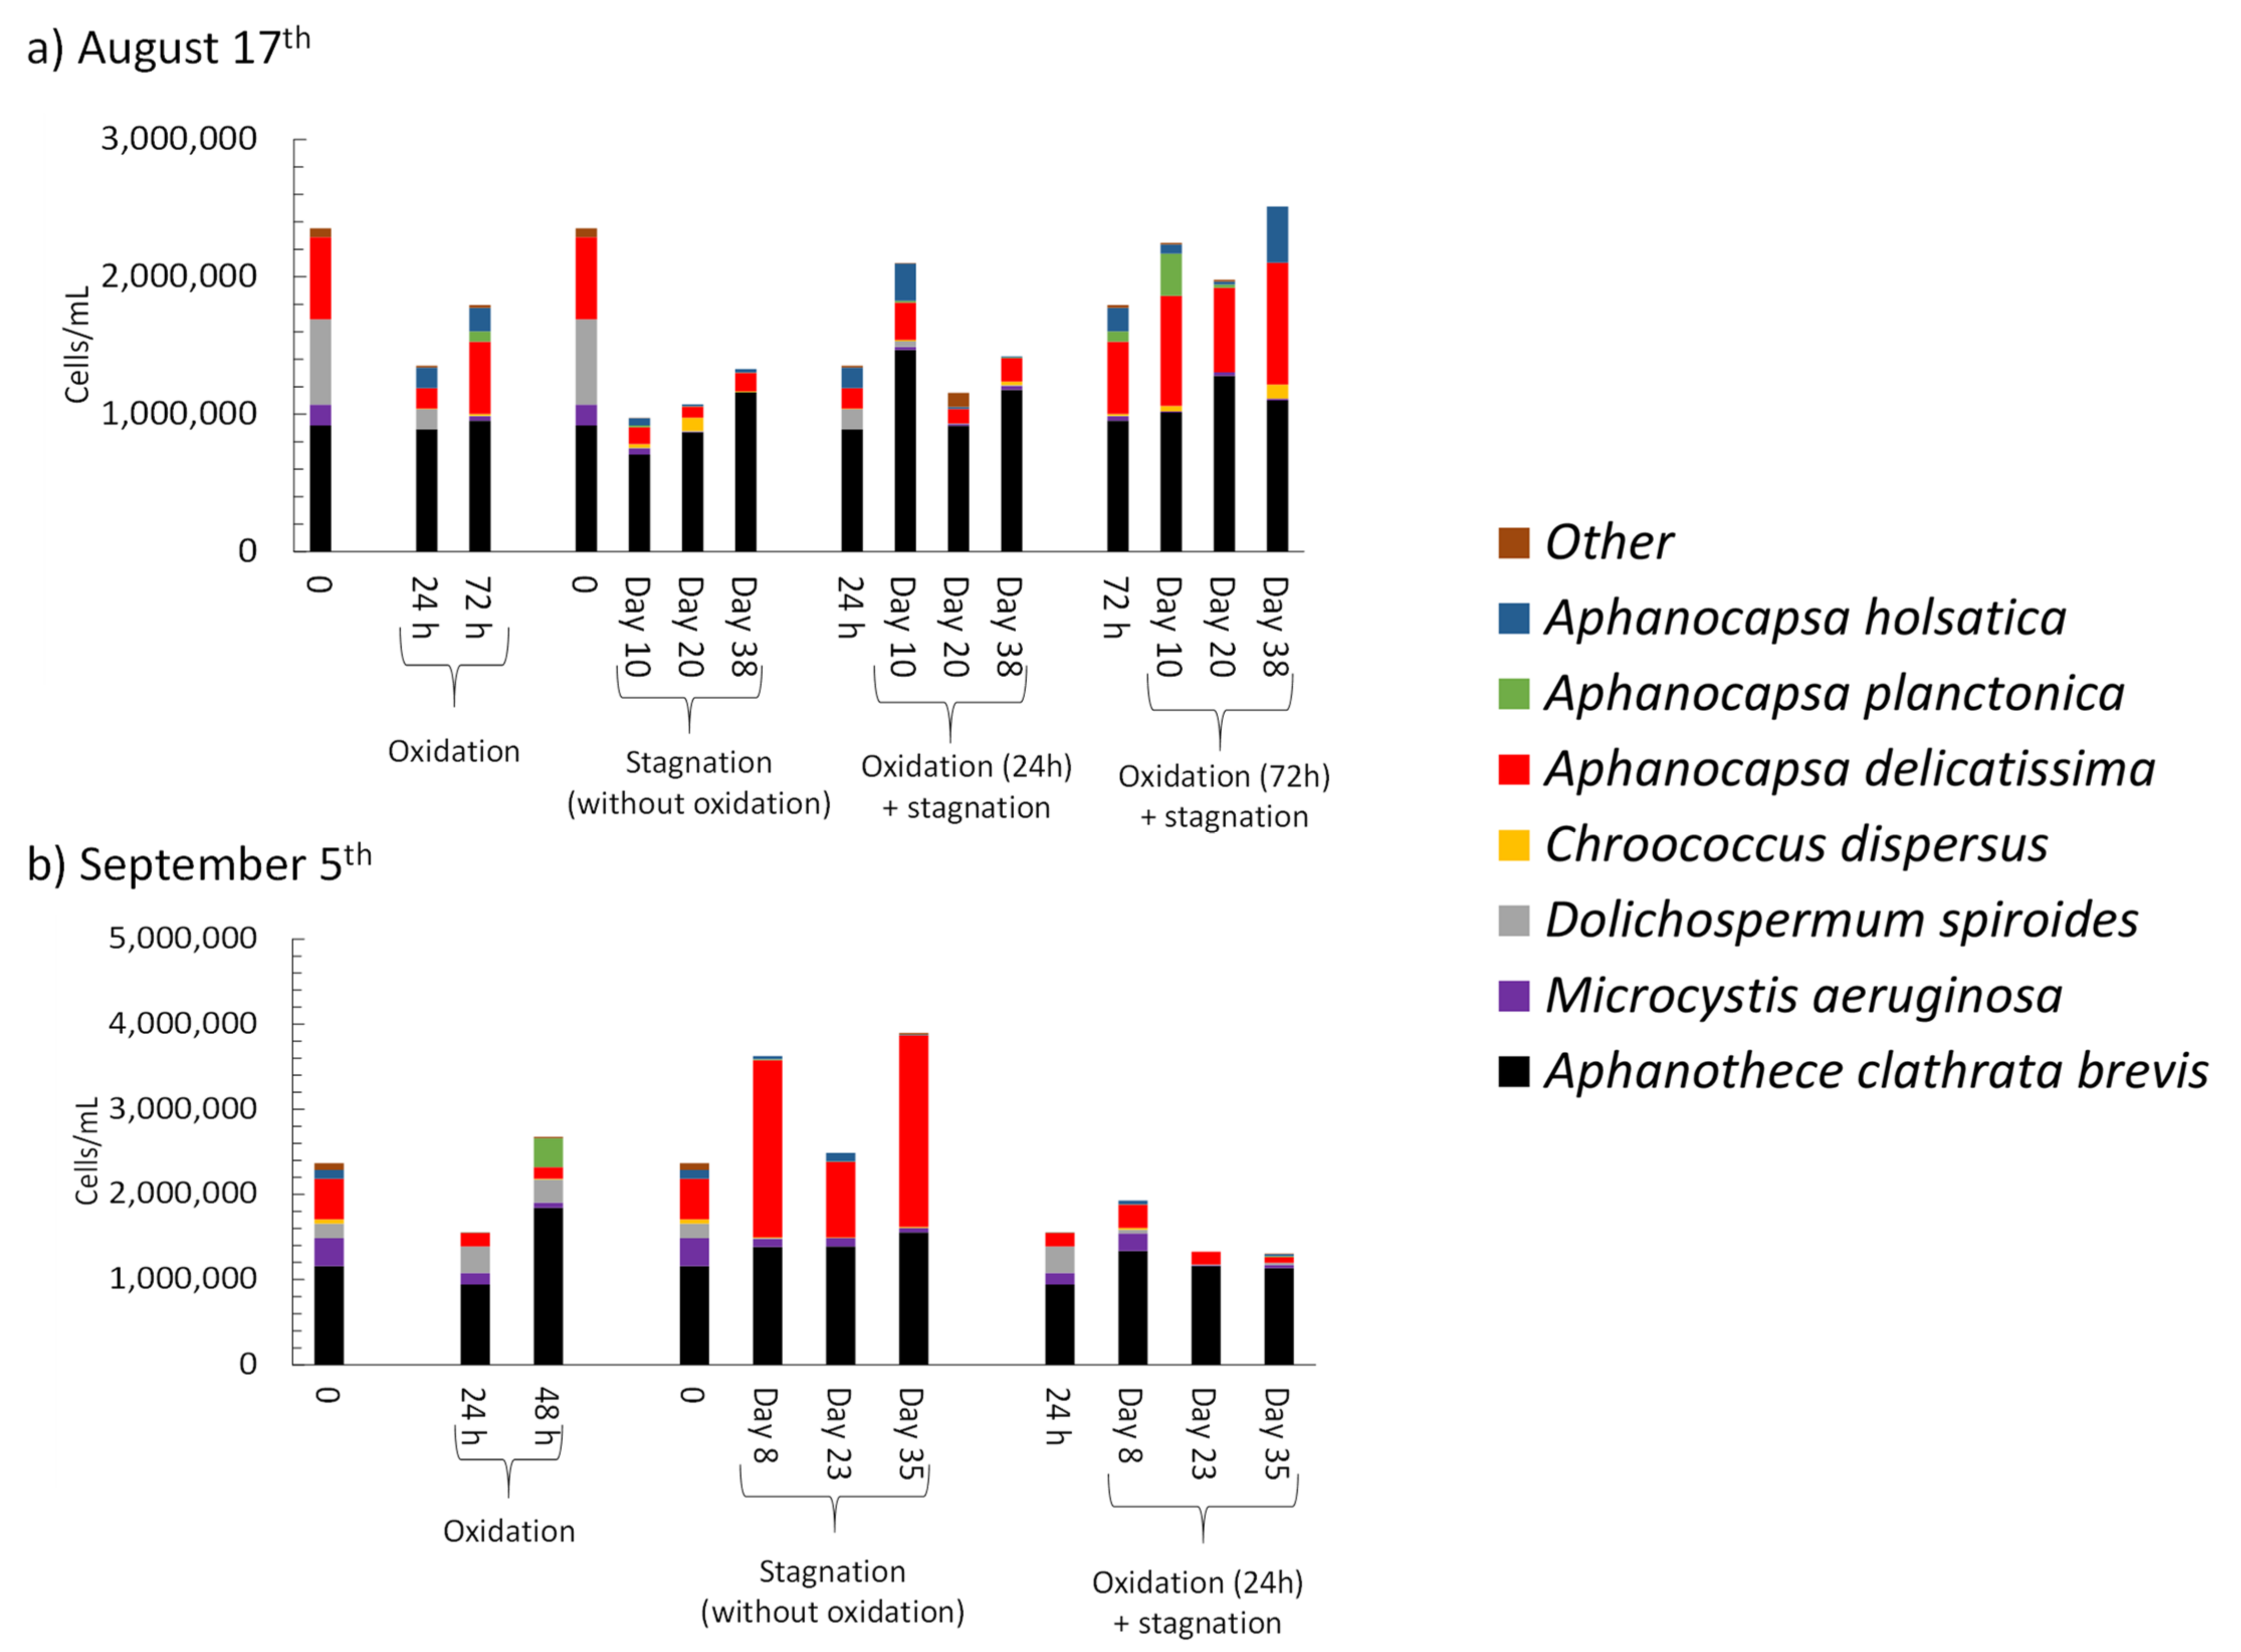
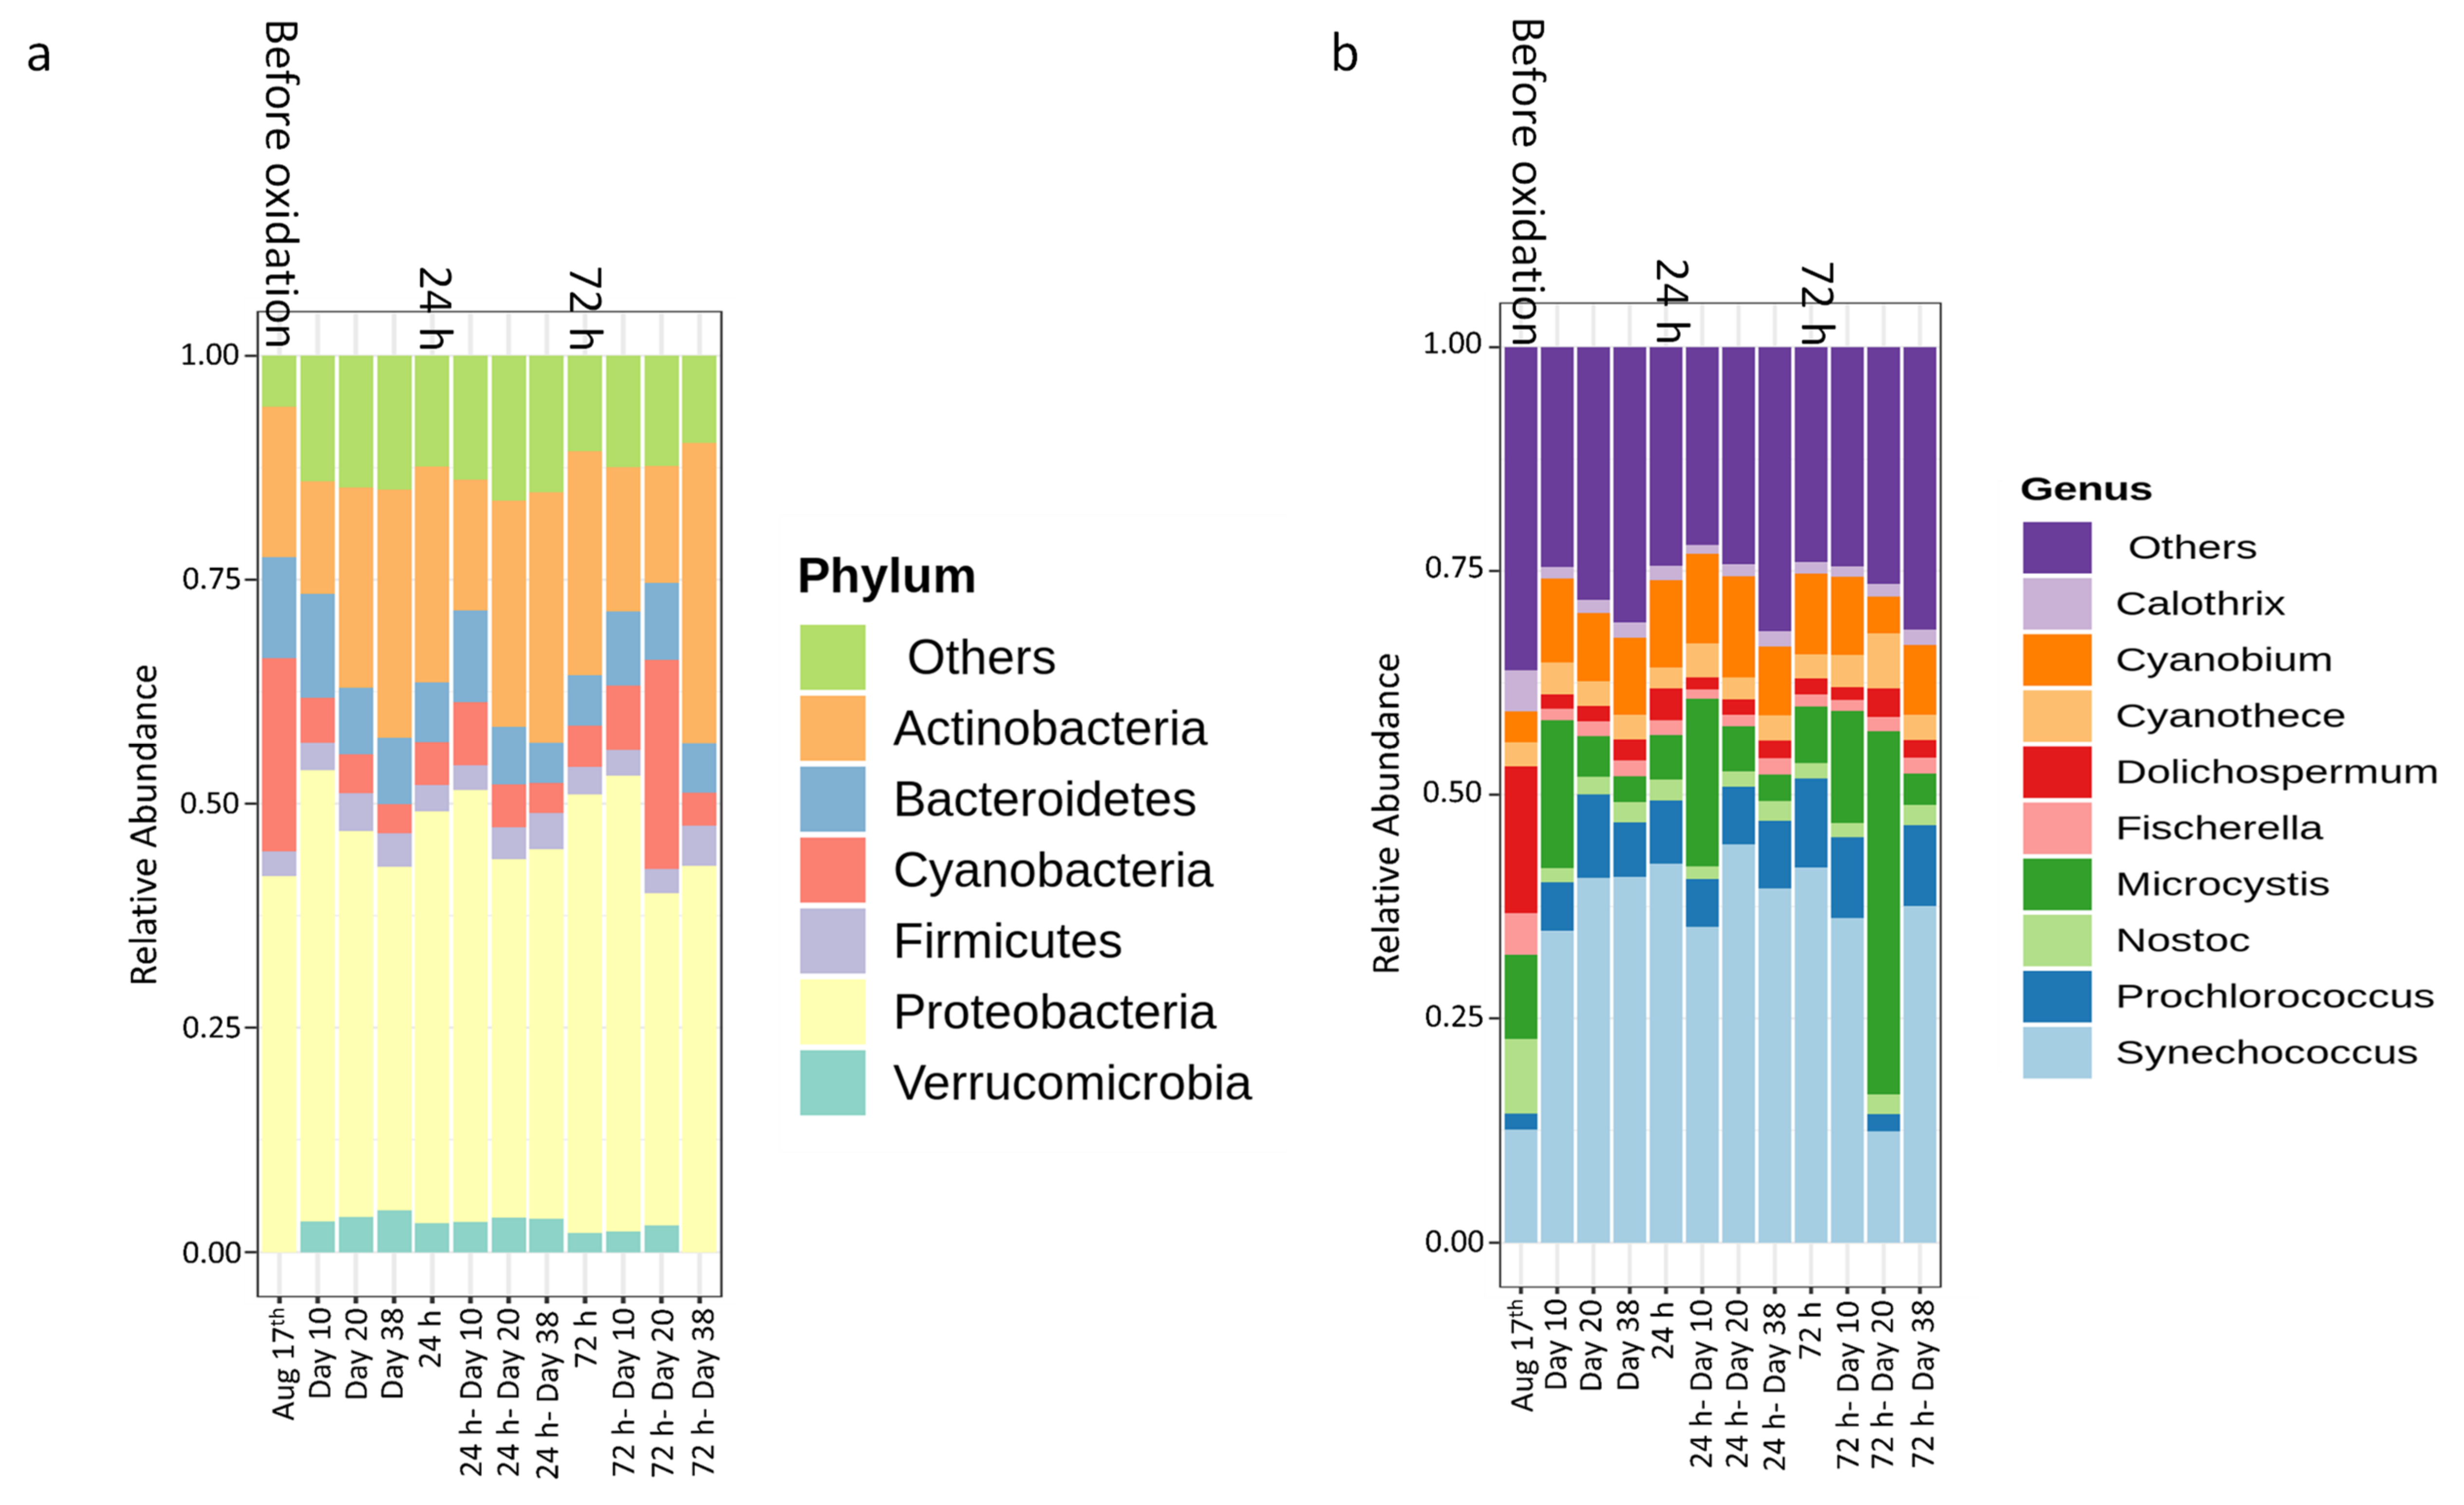
  • Short-term (24 h) reduction on total taxonomic cell counts was observed during shock on-site oxidation. Indeed, on-site shock oxidation could decrease total taxonomic cell counts up to 43% (after 24 h). In contrast, it did not deplete cyanobacteria in the sludge supernatant. However, stagnation led to exceeding total cell counts by up to 55% in six out of nine samples as compared to on-site oxidation alone. Partial cell growth was also observed in MC producer genera such as Microcystis, Chroococcus, and Aphanocapsa.
  • Total MCs after stagnation preceded by shock on-site oxidation (10 mg/L KMnO4) remained below initial MCs concentrations. However, mcyD gene copy numbers increased during stagnation, suggesting the growth of potential MC producer species.
  • As compared to storage (stagnation) only, sludge oxidation with KMnO4 and H2O2 at the dosages studied did not bring remarkable additional benefits for the mitigation of cyanobacterial cells and cyanotoxins during subsequent storage. In some cases, oxidation prior to storage led to enhanced growth of potential MC producers in the sludge. Continuous application of oxidants or higher concentrations may prove to be more effective.
  • These results demonstrate the interest in developing strategies that minimize cyanobacteria and cyanotoxin accumulation in the stored sludge, such as pre-oxidation, PAC application, and source treatment.

Supplementary Materials

The following are available online at https://www.mdpi.com/article/10.3390/w14040537/s1, Table S1. Characteristics of untreated sludge, Figure S1. Taxonomic cell counts in the untreated sludge before oxidation or stagnation, Figure S2. (a) Microbial communities at the phylum level, (b) Cyanobacterial communities at the order level, and (c) Cyanobacterial communities at the genus level in the sludge samples, Figure S3. Taxonomic cell counts on (a) 17 August and (b) 5 September 5; MC concentrations on (c) 17 August and (d) 5 September in the sludge supernatant after on-site oxidation, Figure S4. MC concentrations during laboratory oxidation followed by stagnation on (a) 31 July using 5 and 10 mg KMnO4/L, (b) 7 August using 5, 10 mg/L KMnO4 and 10, 20 mg/L H2O2, and (c) 17 August using 5 and 10 mg/L KMnO4, Figure S5. Principal component analysis (PCA) of cyanobacterial communities and cyanobacterial species grouped at the order level on oxidized/stagnated samples in the laboratory scale on (a) 7 August, PC1: 68.6, PC2: 21.5% and (b) 17 August, PC1: 64.8, PC2: 28.1%. Sig-nificant parameters (p <0.05): stagnation time after oxidation by KMnO4, and oxidation by H2O2, Figure S6. (a) Principal component analysis (PCA) on sludge samples after on-site oxidation followed by stagnation on 17 August, PC1: 66.5%, PC2: 26.6%, (b) Cyanobacterial species grouped at the order level, Figure S7. Differential heat tree demonstrating changes in microbial and cyanobacterial taxonomic profiles of KMnO4 oxidized sludge for 72 h at T0/T38.

Author Contributions

Conceptualization, F.J., H.T., S.D. and M.P.; Methodology, F.J., H.T., J.F.G.M., N.F., B.J.S., Y.T., A.Z., S.D., S.S. and M.P.; Software, F.J., J.F.G.M. and Y.T.; Validation, F.J., H.T., J.F.G.M., N.F., Y.T., S.D. and M.P.; Formal analysis, F.J., H.T., J.F.G.M. and Y.T.; Investigation, F.J., H.T., N.F., J.F.G.M., S.D., A.Z. and M.P.; Resources: F.J., H.T. and N.F.; Data curation, F.J. and J.F.G.M.; Writing—original draft preparation, F.J., H.T. and J.F.G.M.; Writing—review and editing, F.J., H.T., N.F., J.F.G.M., S.S., S.D. and M.P.; Visualization, F.J., H.T., J.F.G.M., N.F., S.D. and M.P.; Supervision, A.Z., S.D. and M.P.; Project administration, A.Z., S.D., B.J.S., S.S. and M.P.; Funding acquisition, S.D., S.S., B.J.S. and M.P. All authors have read and agreed to the published version of the manuscript.

Funding

This research was funded by Algal Blooms, Treatment, Risk Assessment, Prediction, and Prevention through Genomics (ATRAPP), Genome Canada and Génome Québec.

Institutional Review Board Statement

Not applicable.

Informed Consent Statement

Not applicable.

Data Availability Statement

Not applicable.

Acknowledgments

The authors greatly acknowledge the financial support of Algal Blooms, Treatment, Risk Assessment, Prediction, and Prevention through Genomics (ATRAPP) (Genome Canada and Génome Québec). In addition, the authors sincerely thank the staff at NSERC Industrial Chair on Drinking Water at Polytechnique Montréal, Shapiro lab, GRIL lab, Dana F. Simon, Quoc Tuc Dinh (University of Montréal), Irina Moukhina (Université du Québec à Montréal), Stephanie Messina Pacheco (National Research Council Canada) and the studied plant’s operators for their important contributions.

Conflicts of Interest

The authors declare no conflict of interest.

References

  1. Ho, J.C.; Michalak, A.M. Exploring temperature and precipitation impacts on harmful algal blooms across continental U.S. lakes. Limnol. Oceanogr. 2019, 65, 992–1009. [Google Scholar] [CrossRef] [Green Version]
  2. Ho, J.C.; Michalak, A.M.; Pahlevan, N. Widespread global increase in intense lake phytoplankton blooms since the 1980s. Nature 2019, 574, 667–670. [Google Scholar] [CrossRef] [PubMed]
  3. Pick, F.R. Blooming algae: A Canadian perspective on the rise of toxic cyanobacteria. Can. J. Fish. Aquat. Sci. 2016, 73, 1149–1158. [Google Scholar] [CrossRef] [Green Version]
  4. Kimambo, O.N.; Gumbo, J.R.; Chikoore, H. The occurrence of cyanobacteria blooms in freshwater ecosystems and their link with hydro-meteorological and environmental variations in Tanzania. Heliyon 2019, 5, e01312. [Google Scholar] [CrossRef] [Green Version]
  5. Winter, J.G.; DeSellas, A.M.; Fletcher, R.; Heintsch, L.; Morley, A.; Nakamoto, L.; Utsumi, K. Algal blooms in Ontario, Canada: Increases in reports since 1994. Lake Reserv. Manag. 2011, 27, 107–114. [Google Scholar] [CrossRef] [Green Version]
  6. Chorus, I.; Fastner, J.; Welker, M. Cyanobacteria and Cyanotoxins in a Changing Environment: Concepts, Controversies, Challenges. Water 2021, 13, 2463. [Google Scholar] [CrossRef]
  7. Drikas, M.; Chow, C.W.K.; House, J.; Burch, M.D. Using coagulation, flocculation, and settling to remove toxic cyanobacteria. J. Am. Water Works Assoc. 2001, 93, 100–111. [Google Scholar] [CrossRef]
  8. Zamyadi, A.; Dorner, S.; Ellis, D.; Bolduc, A.; Bastien, C.; Prévost, M. Species-dependence of cyanobacteria removal efficiency by different drinking water treatment processes. Water Res. 2013, 47, 2689–2700. [Google Scholar] [CrossRef]
  9. Newcombe, G.; House, J.; Ho, L.; Baker, P.; Burch, M. Management Strategies For Cyanobacteria (Blue-Green Algae): A Guide for Water Utilities; The Cooperative Research Centre for Water Quality and Treatment: Adelaïde, Australia, 2010; p. 112. [Google Scholar]
  10. Chorus, I.; Welker, M. Toxic Cyanobacteria In Water: A Guide to Their Public Health Consequences, Monitoring and Management, 2nd ed.; CRC Press: Boca Raton, FL, USA, 2021. [Google Scholar] [CrossRef]
  11. Jalili, F.; Trigui, H.; Guerra Maldonado, J.F.; Dorner, S.; Zamyadi, A.; Shapiro, B.J.; Terrat, Y.; Fortin, N.; Sauvé, S.; Prévost, M. Can cyanobacterial diversity in the source predict the diversity in sludge and the risk of toxin release in a drinking water treatment plant? Toxins 2021, 13, 25. [Google Scholar] [CrossRef]
  12. Shang, L.; Feng, M.; Xu, X.; Liu, F.; Ke, F.; Li, W. Co-occurrence of microcystins and taste-and-odor compounds in drinking water source and their removal in a full-scale drinking water treatment plant. Toxins 2018, 10, 26. [Google Scholar] [CrossRef] [Green Version]
  13. Zamyadi, A.; MacLeod, S.; Fan, Y.; McQuaid, N.; Dorner, S.; Sauvé, S.; Prévost, M. Toxic cyanobacterial breakthrough and accumulation in a drinking water plant: A monitoring and treatment challenge. Water Res. 2012, 46, 1511–1523. [Google Scholar] [CrossRef] [PubMed]
  14. Sun, F.; Pei, H.-Y.; Hu, W.-R.; Ma, C.-X. The lysis of Microcystis aeruginosa in AlCl3 coagulation and sedimentation processes. Chem. Eng. J. 2012, 193–194, 196–202. [Google Scholar] [CrossRef]
  15. Teixeira, M.R.; Rosa, M.J. Comparing dissolved air flotation and conventional sedimentation to remove cyanobacterial cells of Microcystis aeruginosa. Part II. The effect of water background organics. Sep. Purif. Technol. 2007, 53, 126–134. [Google Scholar] [CrossRef]
  16. Almuhtaram, H.; Cui, Y.; Zamyadi, A.; Hofmann, R. Cyanotoxins and cyanobacteria cell accumulations in drinking water treatment plants with a low risk of bloom formation at the source. Toxins 2018, 10, 430. [Google Scholar] [CrossRef] [PubMed] [Green Version]
  17. Zamyadi, A.; Dorner, S.; Ndong, M.; Ellis, D.; Bolduc, A.; Bastien, C.; Prévost, M. Low-risk cyanobacterial bloom sources: Cell accumulation within full-scale treatment plants. J. Am. Water Work. Assoc. 2013, 102, E651–E663. [Google Scholar] [CrossRef] [Green Version]
  18. Zamyadi, A.; Henderson, R.K.; Stuetz, R.; Newcombe, G.; Newtown, K.; Gladman, B. Cyanobacterial management in full-scale water treatment and recycling processes: Reactive dosing following intensive monitoring. Environ. Sci. Water Res. Technol. 2016, 2, 362–375. [Google Scholar] [CrossRef]
  19. Zamyadi, A.; Romanis, C.; Mills, T.; Neilan, B.; Choo, F.; Coral, L.A.; Gale, D.; Newcombe, G.; Crosbie, N.; Stuetz, R.; et al. Diagnosing water treatment critical control points for cyanobacterial removal: Exploring benefits of combined microscopy, next-generation sequencing, and cell integrity methods. Water Res. 2019, 152, 96–105. [Google Scholar] [CrossRef]
  20. Ho, L.; Dreyfus, J.; Boyer, J.E.; Lowe, T.; Bustamante, H.; Duker, P.; Meli, T.; Newcombe, G. Fate of cyanobacteria and their metabolites during water treatment sludge management processes. Sci. Total Environ. 2012, 424, 232–238. [Google Scholar] [CrossRef]
  21. Sun, F.; Pei, H.-Y.; Hu, W.-R.; Li, X.-Q.; Ma, C.-X.; Pei, R.-T. The cell damage of Microcystis aeruginosa in PACl coagulation and floc storage processes. Sep. Purif. Technol. 2013, 115, 123–128. [Google Scholar] [CrossRef]
  22. Xu, H.; Pei, H.; Xiao, H.; Jin, Y.; Li, X.; Hu, W.; Ma, C.; Sun, J.; Li, H. Behaviors of Microcystis aeruginosa cells during floc storage in drinking water treatment process. Sci. Rep. 2016, 6, 34943. [Google Scholar] [CrossRef] [Green Version]
  23. Sun, J.; Xu, H.; Pei, H.; Jin, Y.; Li, H.; Ma, C. Worse than cell lysis: The resilience of Oscillatoria sp. during sludge storage in drinking water treatment. Water Res. 2018, 142, 405–414. [Google Scholar] [CrossRef] [PubMed]
  24. Li, H.; Pei, H.; Xu, H.; Jin, Y.; Sun, J. Behavior of Cylindrospermopsis raciborskii during coagulation and sludge storage-higher potential risk of toxin release than Microcystis aeruginosa? J. Hazard. Mater. 2018, 347, 307–316. [Google Scholar] [CrossRef] [PubMed]
  25. Newcombe, G.; Dreyfus, J.; Monrolin, Y.; Pestana, C.; Reeve, P.; Sawade, E.; Ho, L.; Chow, C. Optimizing Conventional Treatment for the Removal of Cyanobacteria and Toxins; Water Research Foundation (WRF): Denver, CO, USA, 2015; ISBN 978-1-60573-216-9. [Google Scholar]
  26. Jalili, F. Optimal Treatment Strategies to Prevent and Manage Cyanobacteria and Cyanotoxins in Drinking Water Sludge. Ph.D. Thesis, Polytechnique Montréal, Montréal, QC, Canada, 2022. [Google Scholar]
  27. Fan, J.; Ho, L.; Hobson, P.; Brookes, J. Evaluating the effectiveness of copper sulphate, chlorine, potassium permanganate, hydrogen peroxide and ozone on cyanobacterial cell integrity. Water Res. 2013, 47, 5153–5164. [Google Scholar] [CrossRef] [PubMed]
  28. Fan, J.; Daly, R.; Hobson, P.; Ho, L.; Brookes, J. Impact of potassium permanganate on cyanobacterial cell integrity and toxin release and degradation. Chemosphere 2013, 92, 529–534. [Google Scholar] [CrossRef]
  29. Moradinejad, S.; Trigui, H.; Guerra Maldonado, J.F.; Shapiro, J.; Terrat, Y.; Zamyadi, A.; Dorner, S.; Prévost, M. Diversity assessment of toxic cyanobacterial blooms during oxidation. J. Toxins 2020, 12, 728. [Google Scholar] [CrossRef] [PubMed]
  30. Lusty, M.W.; Gobler, C.J. The efficacy of hydrogen peroxide in mitigating cyanobacterial blooms and altering microbial communities across four lakes in NY, USA. Toxins 2020, 12, 428. [Google Scholar] [CrossRef]
  31. Piezer, K.; Li, L.; Jeon, Y.; Kadudula, A.; Seo, Y. Review: The application of potassium permanganate to treat cyanobacteria-laden water. Proc. Saf. Environ. Prot. 2021, 148, 400–414. [Google Scholar] [CrossRef]
  32. Matthijs, H.C.P.; Visser, P.M.; Reeze, B.; Meeuse, J.; Slot, P.C.; Wijn, G.; Talens, R.; Huisman, J. Selective suppression of harmful cyanobacteria in an entire lake with hydrogen peroxide. Water Res. 2012, 46, 1460–1472. [Google Scholar] [CrossRef]
  33. Pestana, C.J.; Reeve, P.J.; Sawade, E.; Voldoire, C.F.; Newton, K.; Praptiwi, R.; Collingnon, L.; Dreyfus, J.; Hobson, P.; Gaget, V.; et al. Fate of cyanobacteria in drinking water treatment plant lagoon supernatant and sludge. Sci. Total Environ. 2016, 565, 1192–1200. [Google Scholar] [CrossRef]
  34. Fan, J.J.; Hobson, P.; Ho, L.; Daly, R.; Brookes, J. The effects of various control and water treatment processes on the membrane integrity and toxin fate of cyanobacteria. J. Hazard. Mater. 2014, 264, 313–322. [Google Scholar] [CrossRef]
  35. American Public Health Association (APHA); American Water Works Association (AWWA); Water Environment Federation (WEF). Standard Methods for the Examination of Water and Wastewater; American Public Health Association: Washington, DC, USA, 2012; Volume 5, p. 1360. [Google Scholar]
  36. Fan, J.J.; Ho, L.; Hobson, P.; Daly, R.; Brookes, J. Application of various oxidants for cyanobacteria control and cyanotoxin removal in wastewater treatment. J. Environ. Eng. 2014, 140, 04014022. [Google Scholar] [CrossRef]
  37. Lund, J.W.G.; Kipling, C.; Le Cren, E.D. The inverted microscope method of estimating algal number and the statistical basis of estimations by counting. Hydrobiologia 1958, 11, 143–170. [Google Scholar] [CrossRef]
  38. Lund, J.W.G. A simple counting chamber for Nannoplankton. Limnol. Oceanogr. 1959, 4, 57–65. [Google Scholar] [CrossRef]
  39. Planas, D.; Desrosiers, M.; Groulx, S.R.; Paquet, S.; Carignan, R. Pelagic and benthic algal responses in eastern Canadian Boreal Shield lakes following harvesting and wildfires. Can. J. Fish. Aquat. Sci. 2000, 57, 136–145. [Google Scholar] [CrossRef]
  40. United States Environmental Protection Agency (USEPA). Method 415.1. Organic Carbon, Total (Combustion or Oxidation); United States Environmental Protection Agency: Washington, DC, USA, 1974; p. 3. [Google Scholar]
  41. Munoz, G.; Vo Duy, S.; Roy-Lachapelle, A.; Husk, B.; Sauve, S. Analysis of individual and total microcystins in surface water by on-line preconcentration and desalting coupled to liquid chromatography tandem mass spectrometry. J. Chromatogr. 2017, 1516, 9–20. [Google Scholar] [CrossRef] [PubMed]
  42. Roy-Lachapelle, A.; Vo Duy, S.; Munoz, G.; Dinh, Q.T.; Bahl, E.; Simon, D.F.; Sauvé, S. Analysis of multiclass cyanotoxins (microcystins, anabaenopeptins, cylindrospermopsin and anatoxins) in lake waters using on-line SPE liquid chromatography high-resolution Orbitrap mass spectrometry. Anal. Methods 2019, 11, 5289–5300. [Google Scholar] [CrossRef] [Green Version]
  43. Moradinejad, S. Characterization of Phenomenon Governing Oxidation of Cyanobacteria through Metagenomics. Ph.D. Thesis, Polytechnique Montréal, Montréal, QC, Canada, 2021. [Google Scholar]
  44. McMurdie, P.J.; Holmes, S. phyloseq: An R package for reproducible interactive analysis and graphics of microbiome census data. PLoS ONE 2013, 8, e61217. [Google Scholar] [CrossRef] [Green Version]
  45. Greenacre, M. Compositional Data Analysis in Practice; Chapman and Hall/CRC Press: London, UK, 2018; 136p, ISBN 978-1-138-31661-4. [Google Scholar] [CrossRef]
  46. Blanchet, F.G.; Legendre, P.; Borcard, D. Forward selection of explanatory variables. Ecology 2008, 89, 2623–2632. [Google Scholar] [CrossRef]
  47. Fortin, N.; Aranda-Rodriguez, R.; Jing, H.; Pick, F.; Bird, D.; Greer, C.W. Detection of microcystin-producing cyanobacteria in Missisquoi Bay, Quebec, Canada, using quantitative PCR. Appl. Environ. Microbiol. 2010, 76, 5105–5112. [Google Scholar] [CrossRef] [Green Version]
  48. Moradinejad, S.; Trigui, H.; Maldonado, J.F.G.; Shapiro, B.J.; Terrat, Y.; Sauvé, S.; Fortin, N.; Zamyadi, A.; Dorner, S.; Prévost, M. Metagenomic study to evaluate functional capacity of a cyanobacterial bloom during oxidation. Chem. Eng. J. Adv. 2021, 8, 100151. [Google Scholar] [CrossRef]
  49. Szlag, D.C.; Spies, B.; Szlag, R.G.; Westrick, J.A. Permanganate Oxidation of Microcystin-LA: Kinetics, Quantification, and Implications for Effective Drinking Water Treatment. J. Toxicol. 2019, 2019, 3231473. [Google Scholar] [CrossRef] [PubMed]
  50. Kim, M.S.; Lee, H.J.; Lee, K.M.; Seo, J.; Lee, C. Oxidation of Microcystins by Permanganate: pH and Temperature-Dependent Kinetics, Effect of DOM Characteristics, and Oxidation Mechanism Revisited. Environ. Sci. Technol. 2018, 52, 7054–7063. [Google Scholar] [CrossRef] [PubMed]
  51. Li, L.; Shao, C.; Lin, T.-F.; Shen, J.; Yu, S.; Shang, R.; Yin, D.; Zhang, K.; Gao, N. Kinetics of cell inactivation, toxin release, and degradation during permanganation of Microcystis aeruginosa. Environ. Sci. Technol. 2014, 48, 2885–2892. [Google Scholar] [CrossRef]
  52. Dreyfus, J.; Monrolin, Y.; Pestana, C.J.; Reeve, P.J.; Sawade, E.; Newton, K.; Ho, L.; Chow, C.W.K.; Newcombe, G. Identification and assessment of water quality risks associated with sludge supernatant recycling in the presence of cyanobacteria. J. Water Suppl. Res. Technol. Aqua 2016, 65, 441–452. [Google Scholar] [CrossRef]
  53. Ma, C.; Pei, H.; Hu, W.; Xu, H.; Jin, Y. The lysis and regrowth of toxic cyanobacteria during storage of achitosan–aluminium chloride composite coagulated sludge: Implications for drinking water sludge treatment. RSC Adv. 2016, 6, 112756–112764. [Google Scholar] [CrossRef]
  54. Kormas, K.A.; Lymperopoulou, D.S. Cyanobacterial toxin degrading bacteria: Who are they? Biomed. Res. Int. 2013, 2013, 463894. [Google Scholar] [CrossRef] [Green Version]
  55. Maghsoudi, E.; Fortin, N.; Greer, C.; Maynard, C.; Page, A.; Duy, S.V.; Sauve, S.; Prevost, M.; Dorner, S. Cyanotoxin degradation activity and mlr gene expression profiles of a Sphingopyxis sp. isolated from Lake Champlain, Canada. Environ. Sci. Proc. Impacts 2016, 18, 1417–1426. [Google Scholar] [CrossRef] [Green Version]
  56. Pimentel, J.S.; Giani, A. Microcystin production and regulation under nutrient stress conditions in toxic microcystis strains. Appl. Environ. Microbiol. 2014, 80, 5836–5843. [Google Scholar] [CrossRef] [Green Version]
  57. Schatz, D.; Keren, Y.; Vardi, A.; Sukenik, A.; Carmeli, S.; Börner, T.; Dittmann, E.; Kaplan, A. Towards clarification of the biological role of microcystins, a family of cyanobacterial toxins. Environ. Microbiol. 2007, 9, 965–970. [Google Scholar] [CrossRef]
Figure 1. Fate of cyanobacterial cells (taxonomic cell counts) during sludge oxidation and stagnation in the laboratory on 31 July using 5 and 10 mg/L KMnO4. Zero point: Before oxidation, CT: exposure (mg∙min/L), Day: stagnation day.
Water 14 00537 g001
Figure 2. Fate of cyanobacterial cells (taxonomic cell counts) during sludge oxidation and stagnation in the laboratory on 7 August using 5, 10 mg/L KMnO4 and 10, 20 mg/L H2O2. Zero point: Before oxidation, CT: exposure (mg∙min/L), Day: stagnation day.
Water 14 00537 g002
Figure 3. Fate of cyanobacterial cells (taxonomic cell counts) during sludge oxidation and stagnation in the laboratory on 17 August using 5 and 10 mg/L KMnO4. Zero point: Before oxidation, CT: exposure (mg∙min/L), Day: stagnation day.
Water 14 00537 g003
Figure 4. Impact of laboratory oxidation on (a) Microbial relative abundance at the phylum level, (b) Cyanobacterial relative abundance at the orders and (c) Cyanobacterial relative abundance at the genus level on 7 and 17 August.
Water 14 00537 g004
Figure 5. Impact of laboratory oxidation on (a) Microbial and (b) Cyanobacterial diversity (Shannon index) on 7 August and 17 August, 0: Sludge samples before oxidation.
Water 14 00537 g005
Figure 6. Principal component analysis (PCA) of (a) Microbial communities, (b) Microbial/cyanobacterial communities grouped at the phylum and order levels, (c) Cyanobacterial communities, (d) Cyanobacterial species grouped at the order level on 7 and 17 August in the laboratory oxidation. The relative CT significantly affected microbial communities (p < 0.05).
Water 14 00537 g006aWater 14 00537 g006b
Figure 7. Taxonomic cell counts on (a) 17 August, and (b) 5 September after on-site oxidation using 10 mg/L KMnO4 and stagnation. 0: Before oxidation, Day: Stagnation day.
Water 14 00537 g007
Figure 8. Taxonomic composition before/after on-site oxidation by 10 mg/L KMnO4 and stagnation on 17 August: (a) Microbial communities at the phylum level, (b) Cyanobacterial communities at the genus level. 24 h and 72 h: Oxidation contact time, Day: Stagnation day.
Water 14 00537 g008
Figure 9. MC concentrations in the sludge after on-site oxidation and stagnation on (a) 17 August, (b) 5 September, (c) mcyD gene copy numbers during stagnation on 17 August.
Water 14 00537 g009
Table 1. Experimental plant of oxidation assays. DOC: Dissolved organic carbon.
DateOxidantInitial Applied Dose (mg/L)Contact Time
(h)
Oxidant/DOC Ratio
31 JulyKMnO451: Laboratory assay1.4
102.8
7 August51.6
103.1
H2O21024: Laboratory assay3.1
206.3
17 AugustKMnO451: Laboratory assay
24, 72: On-site assay (10 mg/L)
1.5
103.1
5 SeptemberKMnO41024, 48: On-site assay (10 mg/L)1.0
Table 2. Apparent decay rate constant in cyanobacteria-laden sludge oxidation. Contact times: KMnO4: 1 h, H2O2: 24 h.
Date31 July7 August17 August17 August
OxidantKMnO4KMnO4KMnO4H2O2
Dose (mg/L)5105105101020
k (min−1)0.0540.0370.0440.0420.0490.0430.00240.0022
Half-life (min)12.818.715.816.514.116.1288.8315.0
R20.920.900.900.920.910.930.950.99
CT (mg·min/L)892391052189621440907781
Relative CT0.371.00.440.910.400.900.531.0
Publisher’s Note: MDPI stays neutral with regard to jurisdictional claims in published maps and institutional affiliations.

