
Assessment of Water Resources Availability in Amu Darya River Basin Using GRACE Data


 ,
,  ,
,  ,
,  and
and 
Abstract
:1. Introduction
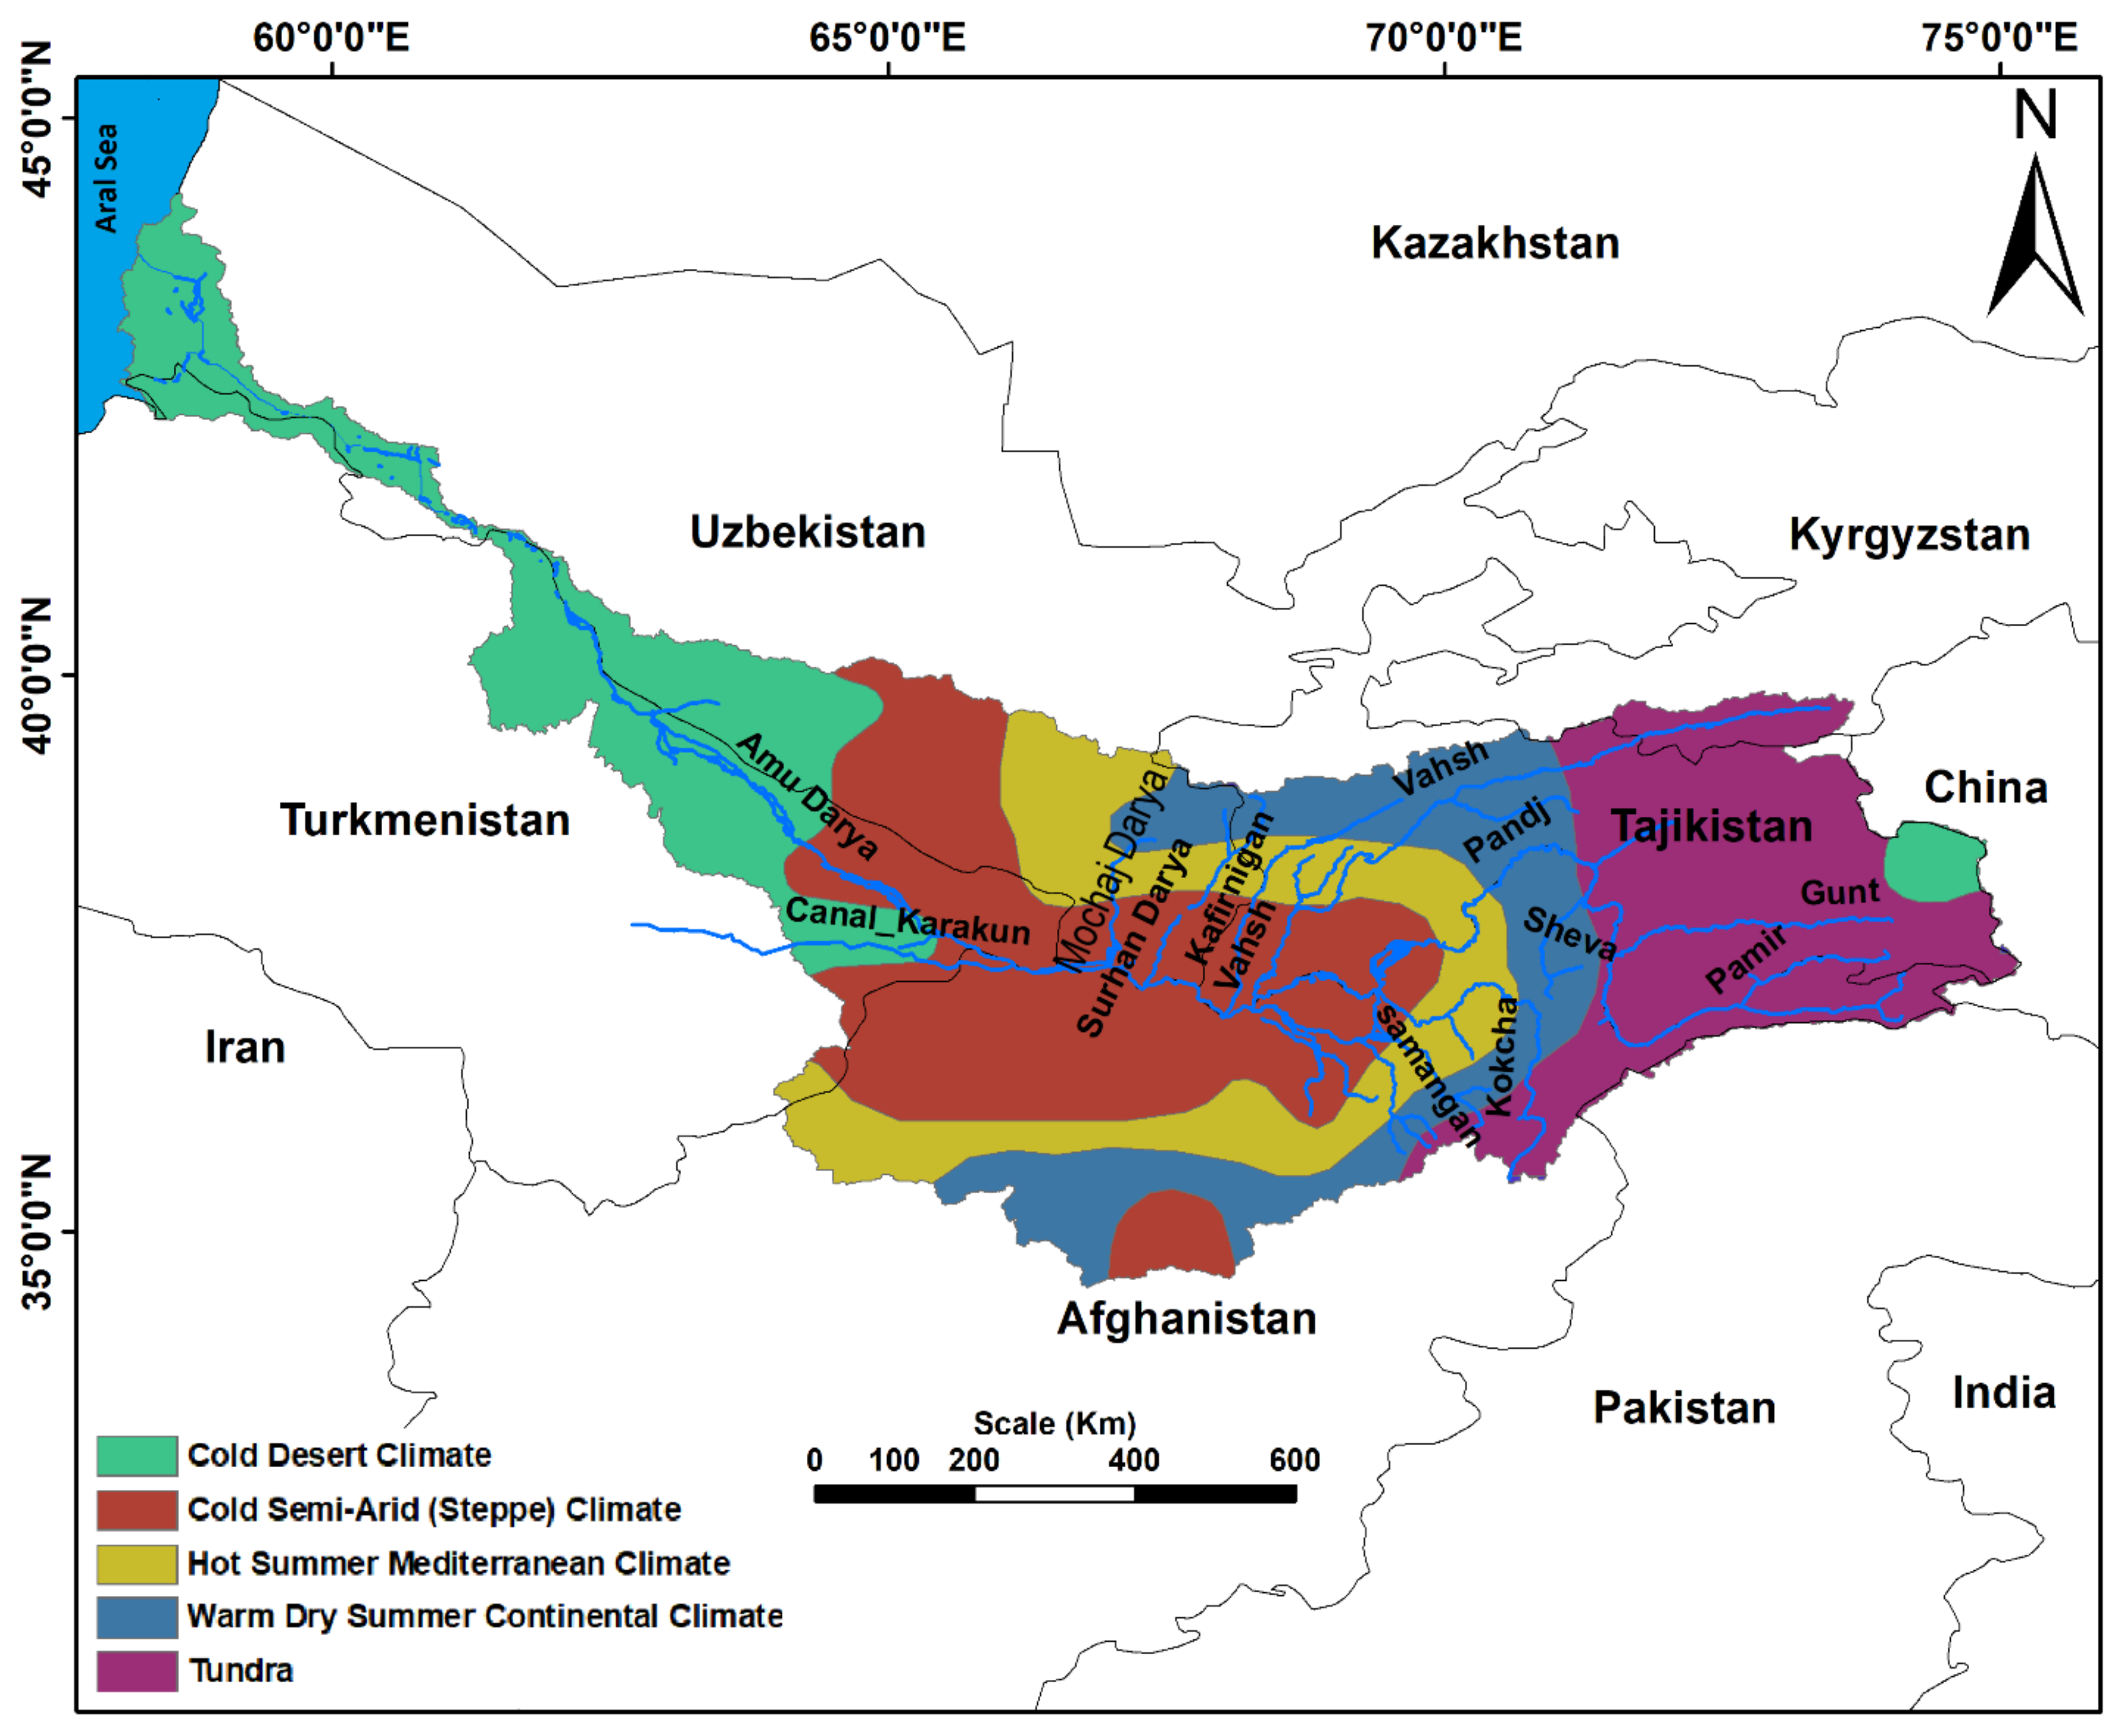
2. Study Area
3. Research Method
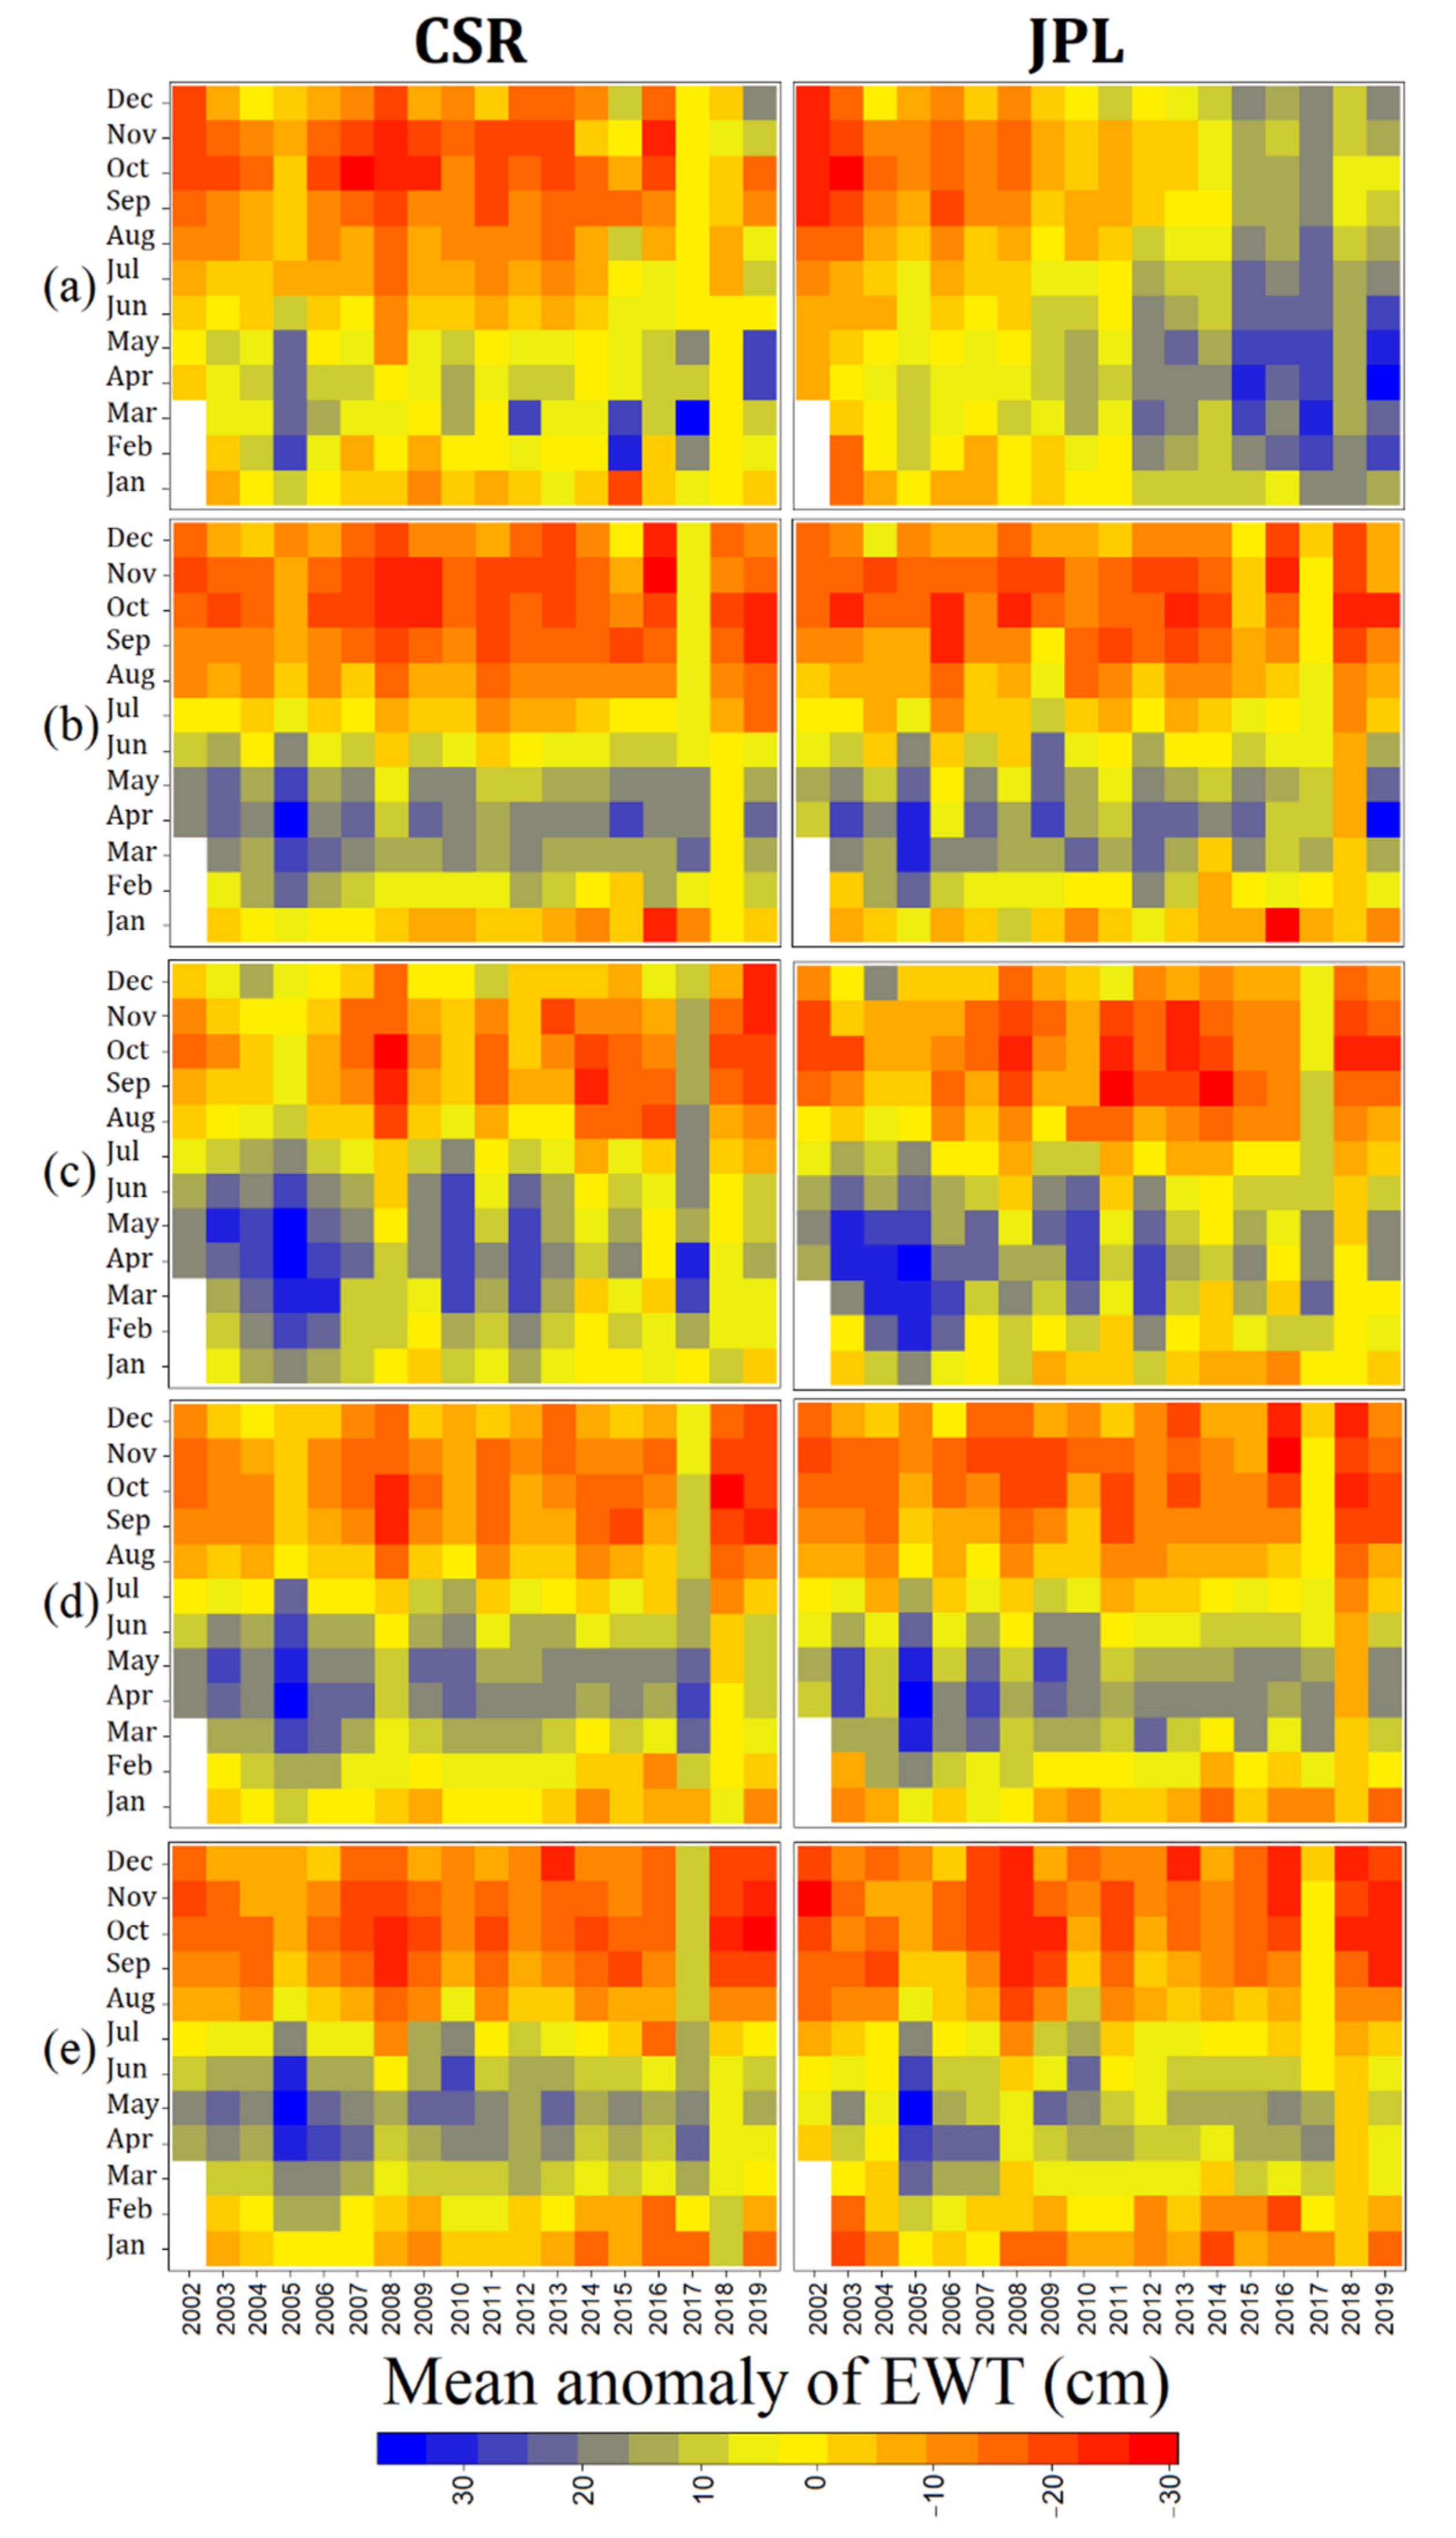
- Two solutions of GRACE datasets (CSR and JPL) with a spatial resolution of were extracted for the Amu Darya basin (total 241 grid points).
- The above GRACE solutions were used to estimate EWT trend using Sen’s slope estimator and modified Mann–Kendall (MMK) tests to assess the spatiotemporal variability of water storage change over the basin.
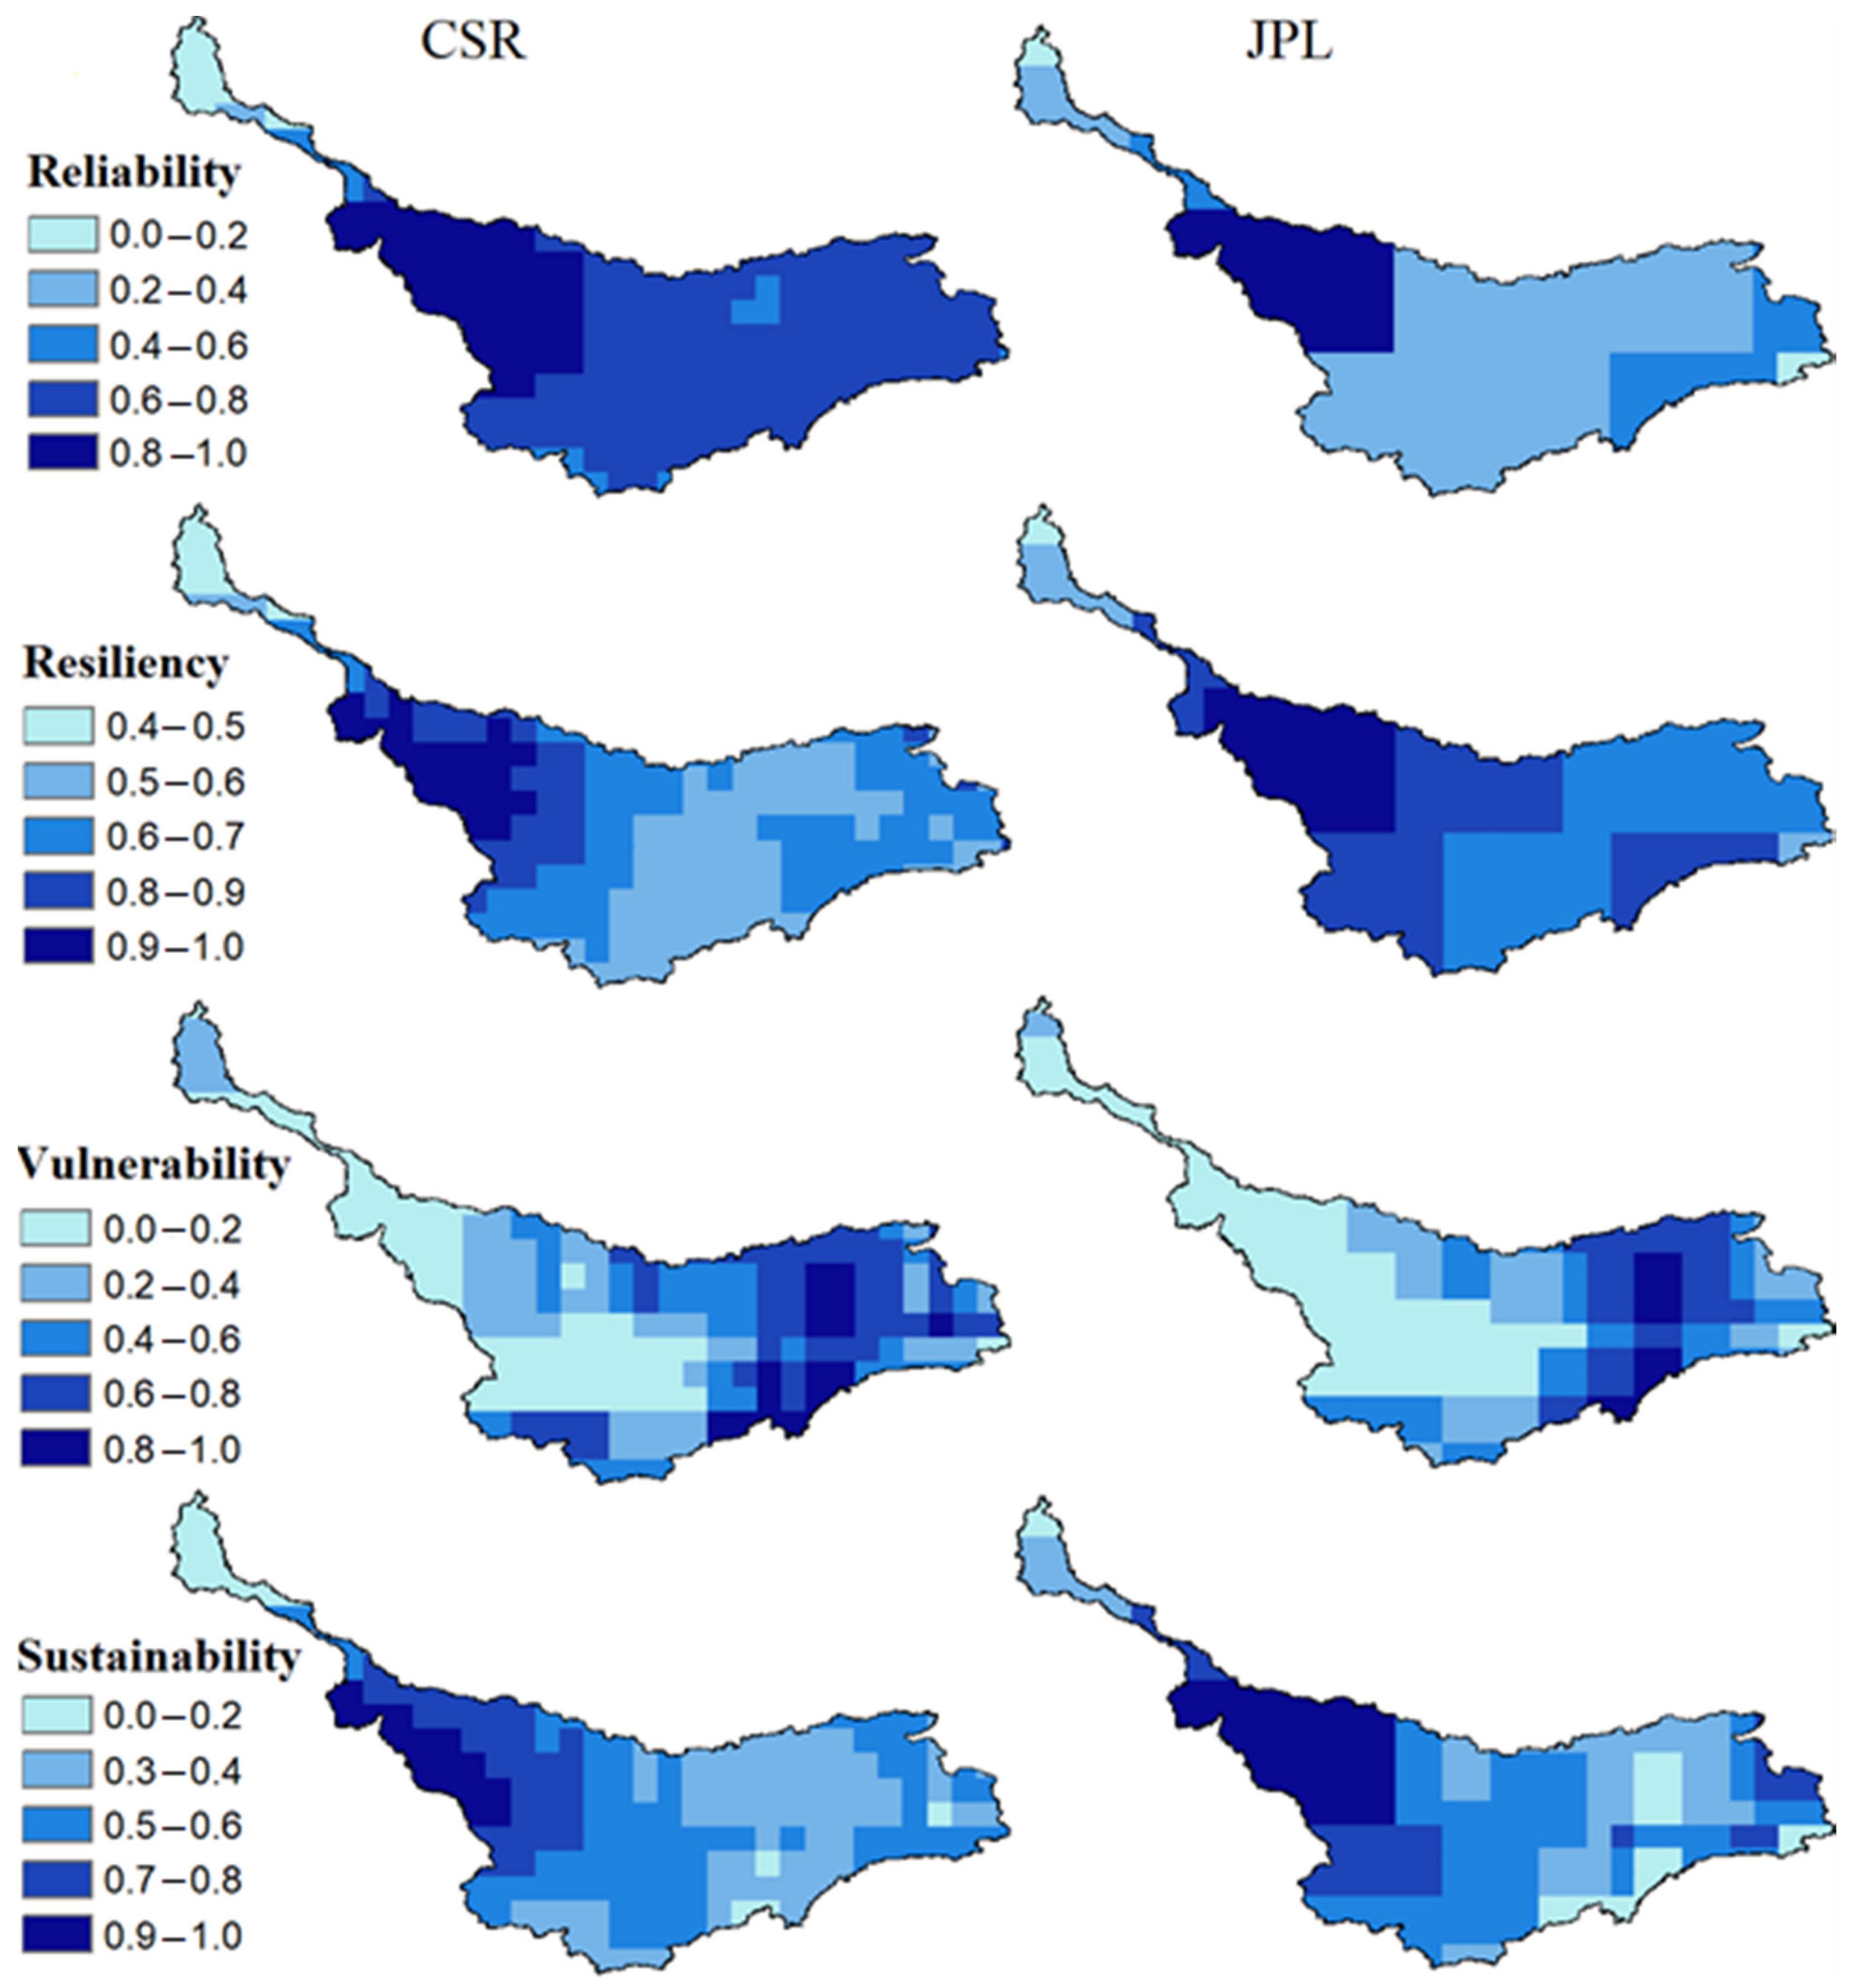
- The water sustainability index was applied to assess water availability in terms of change in EWT reliability, resiliency and vulnerability (RRV) at all grid points over the basin.
- The indices were standardized between 0 and 1 to remove the influence of individual indexes.
- All the outcomes from RRV were mapped using ArcGIS.
3.1. Trend Analysis of Water Availability
3.2. Assessment of Water Resources Availability
4. Results
4.1. Monthly Mean Anomaly of EWT
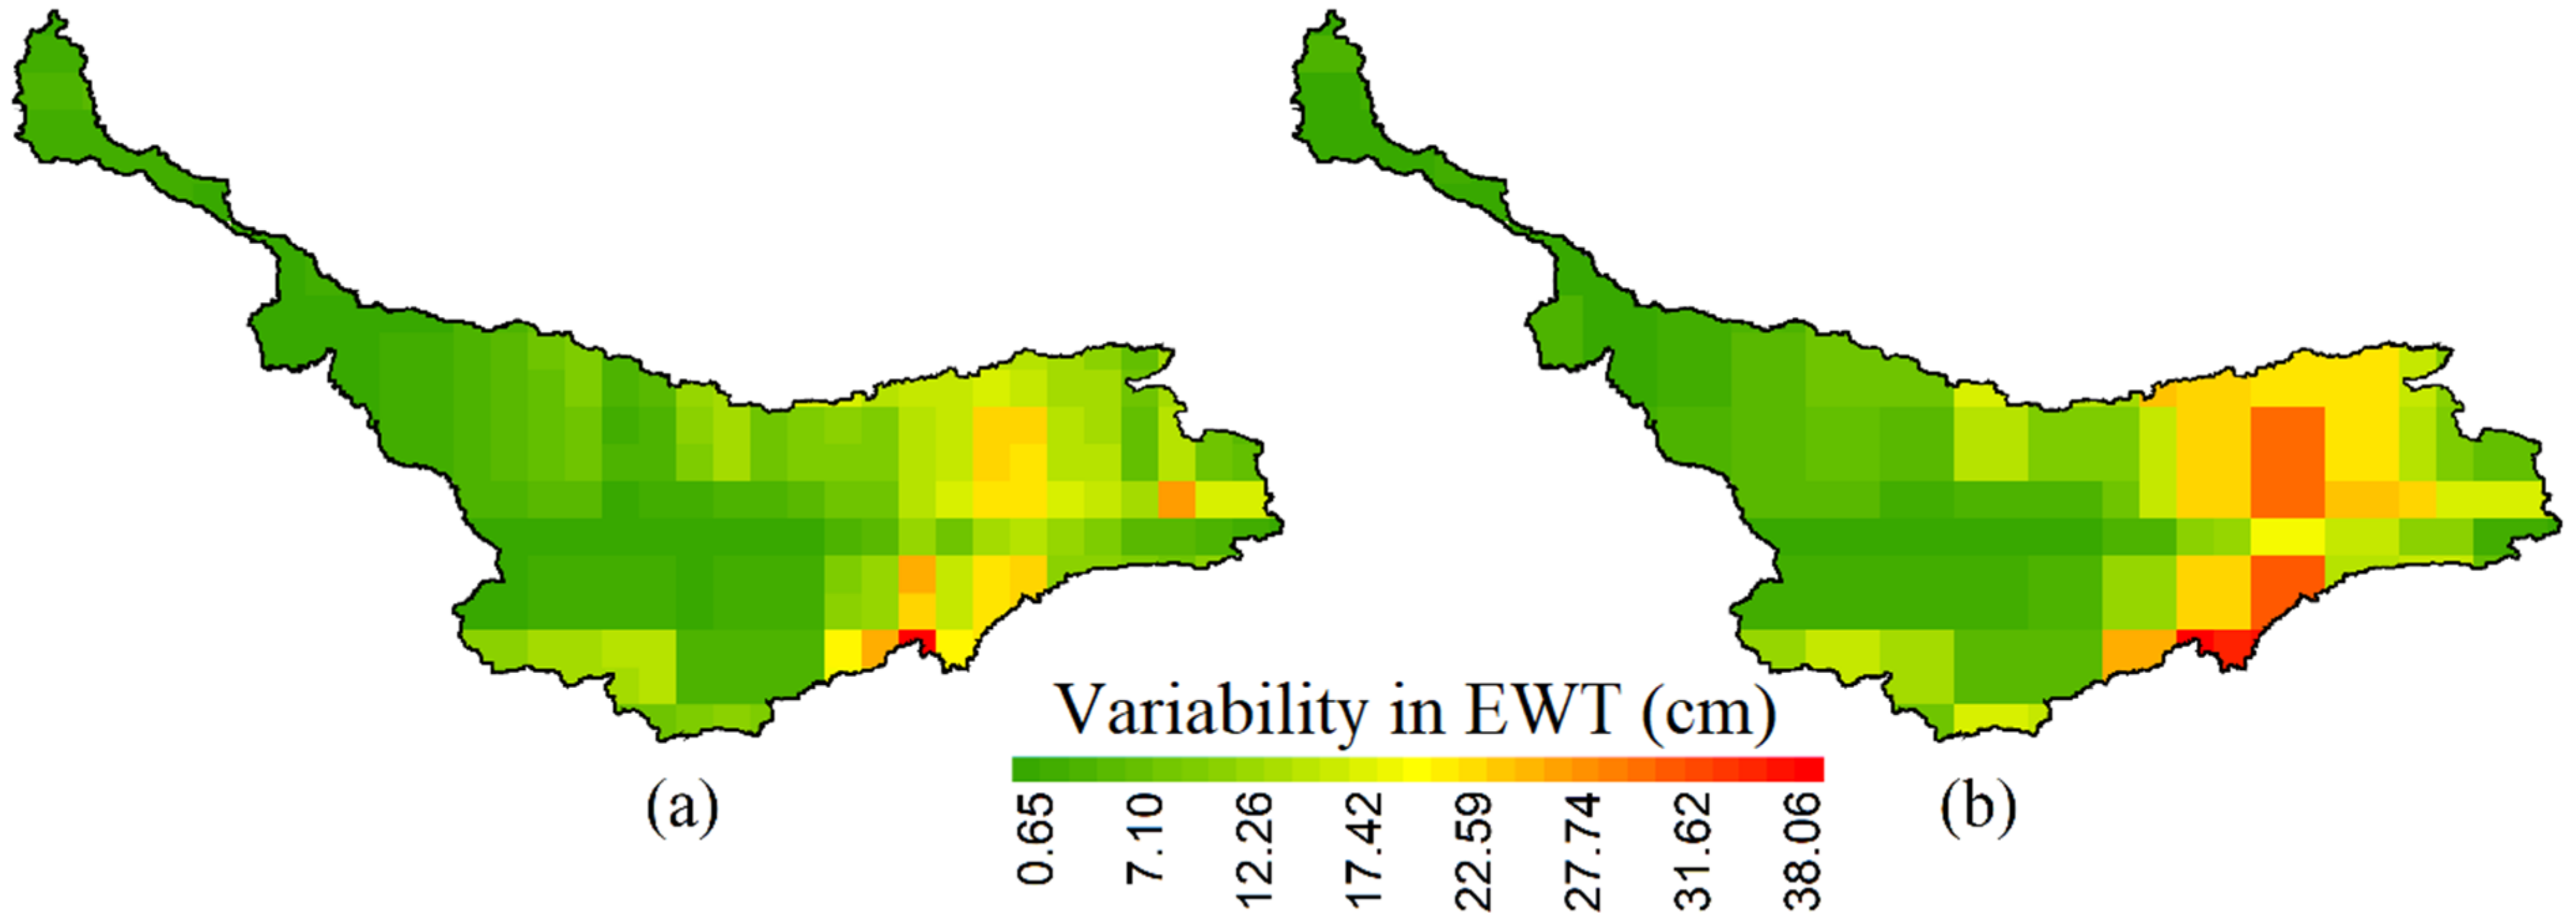
4.2. Spatial Distribution of EWT
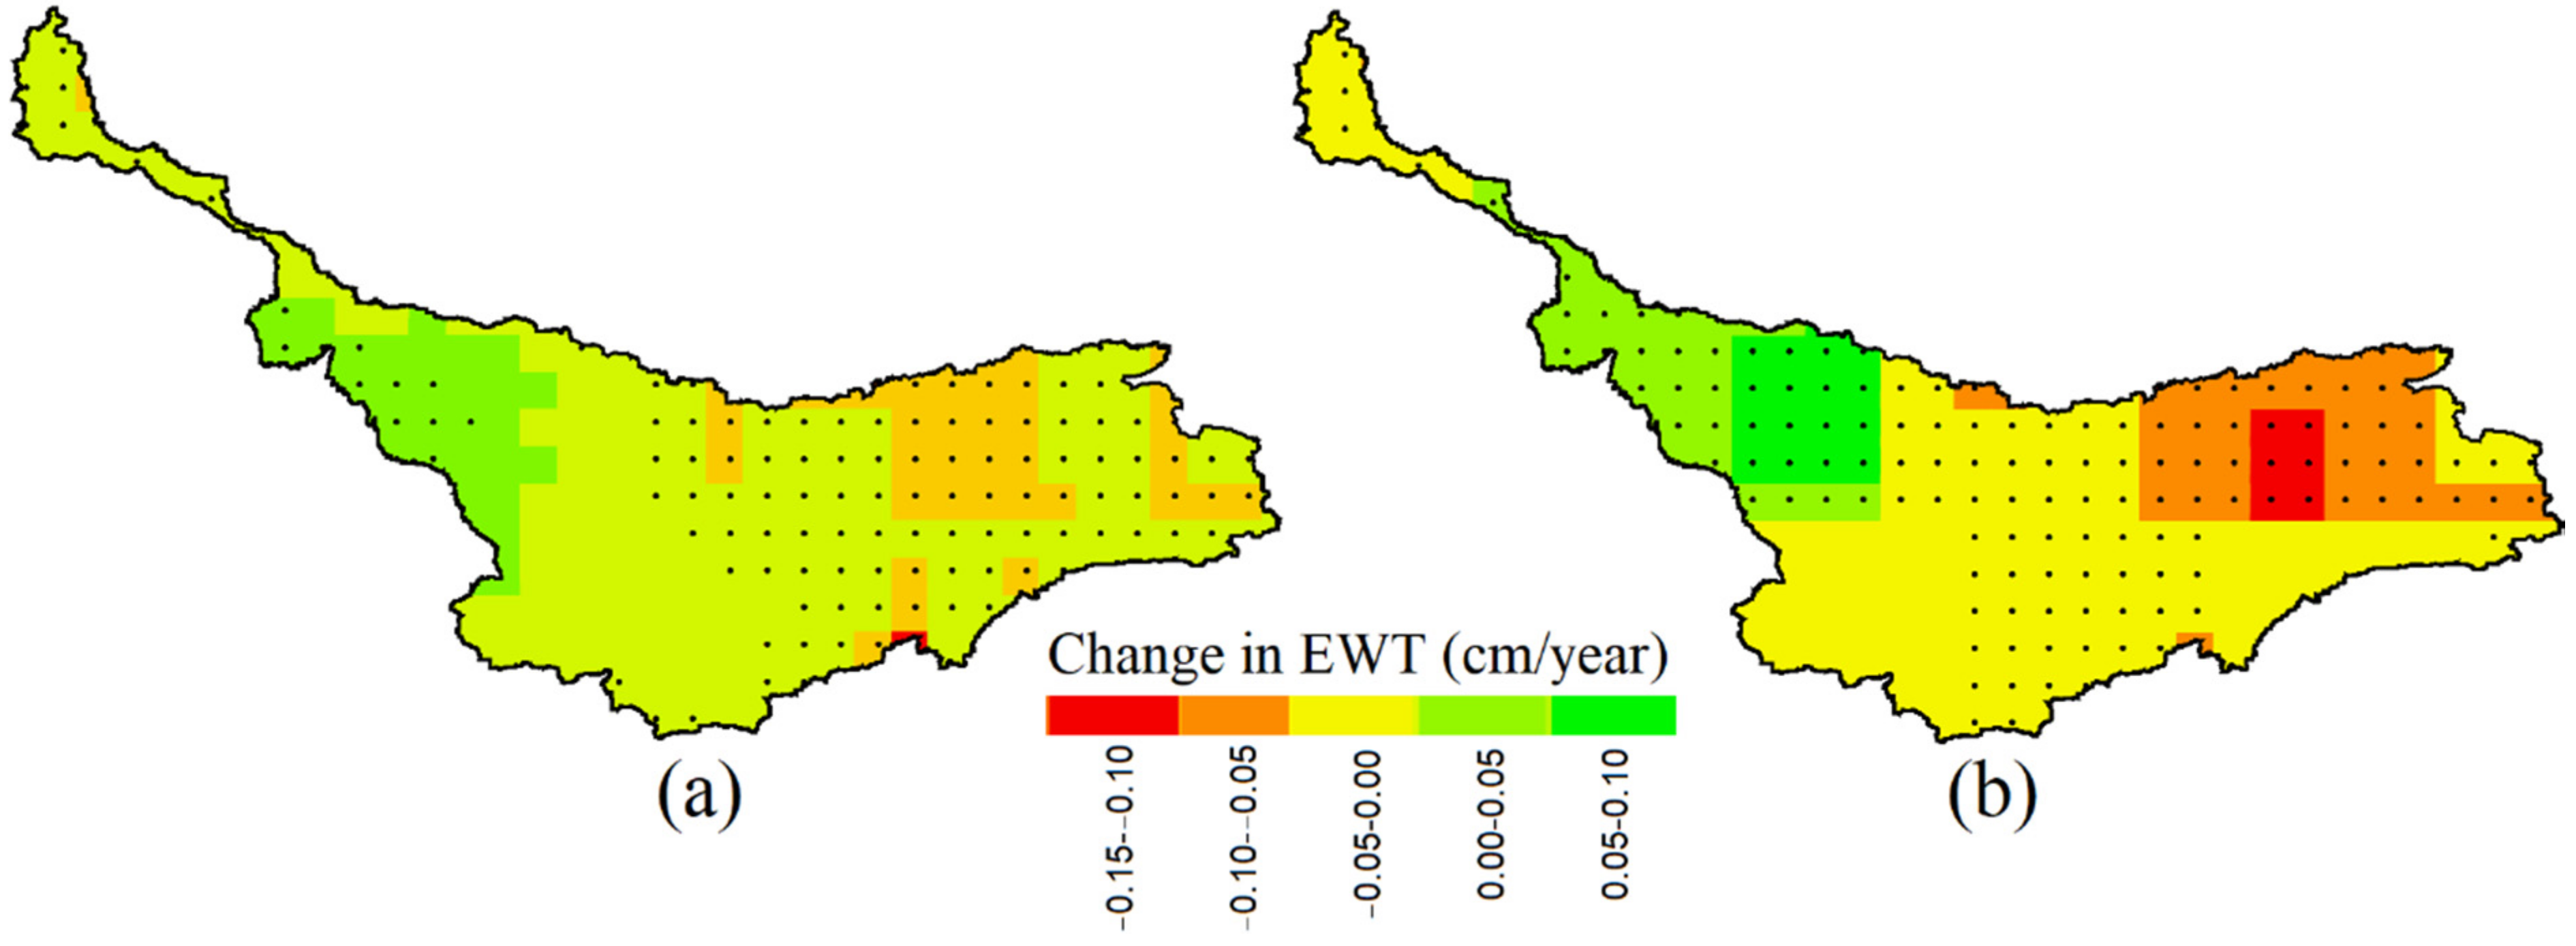
4.3. Trend Analysis of EWT
4.4. Spatial Distribution of Water Sustainability
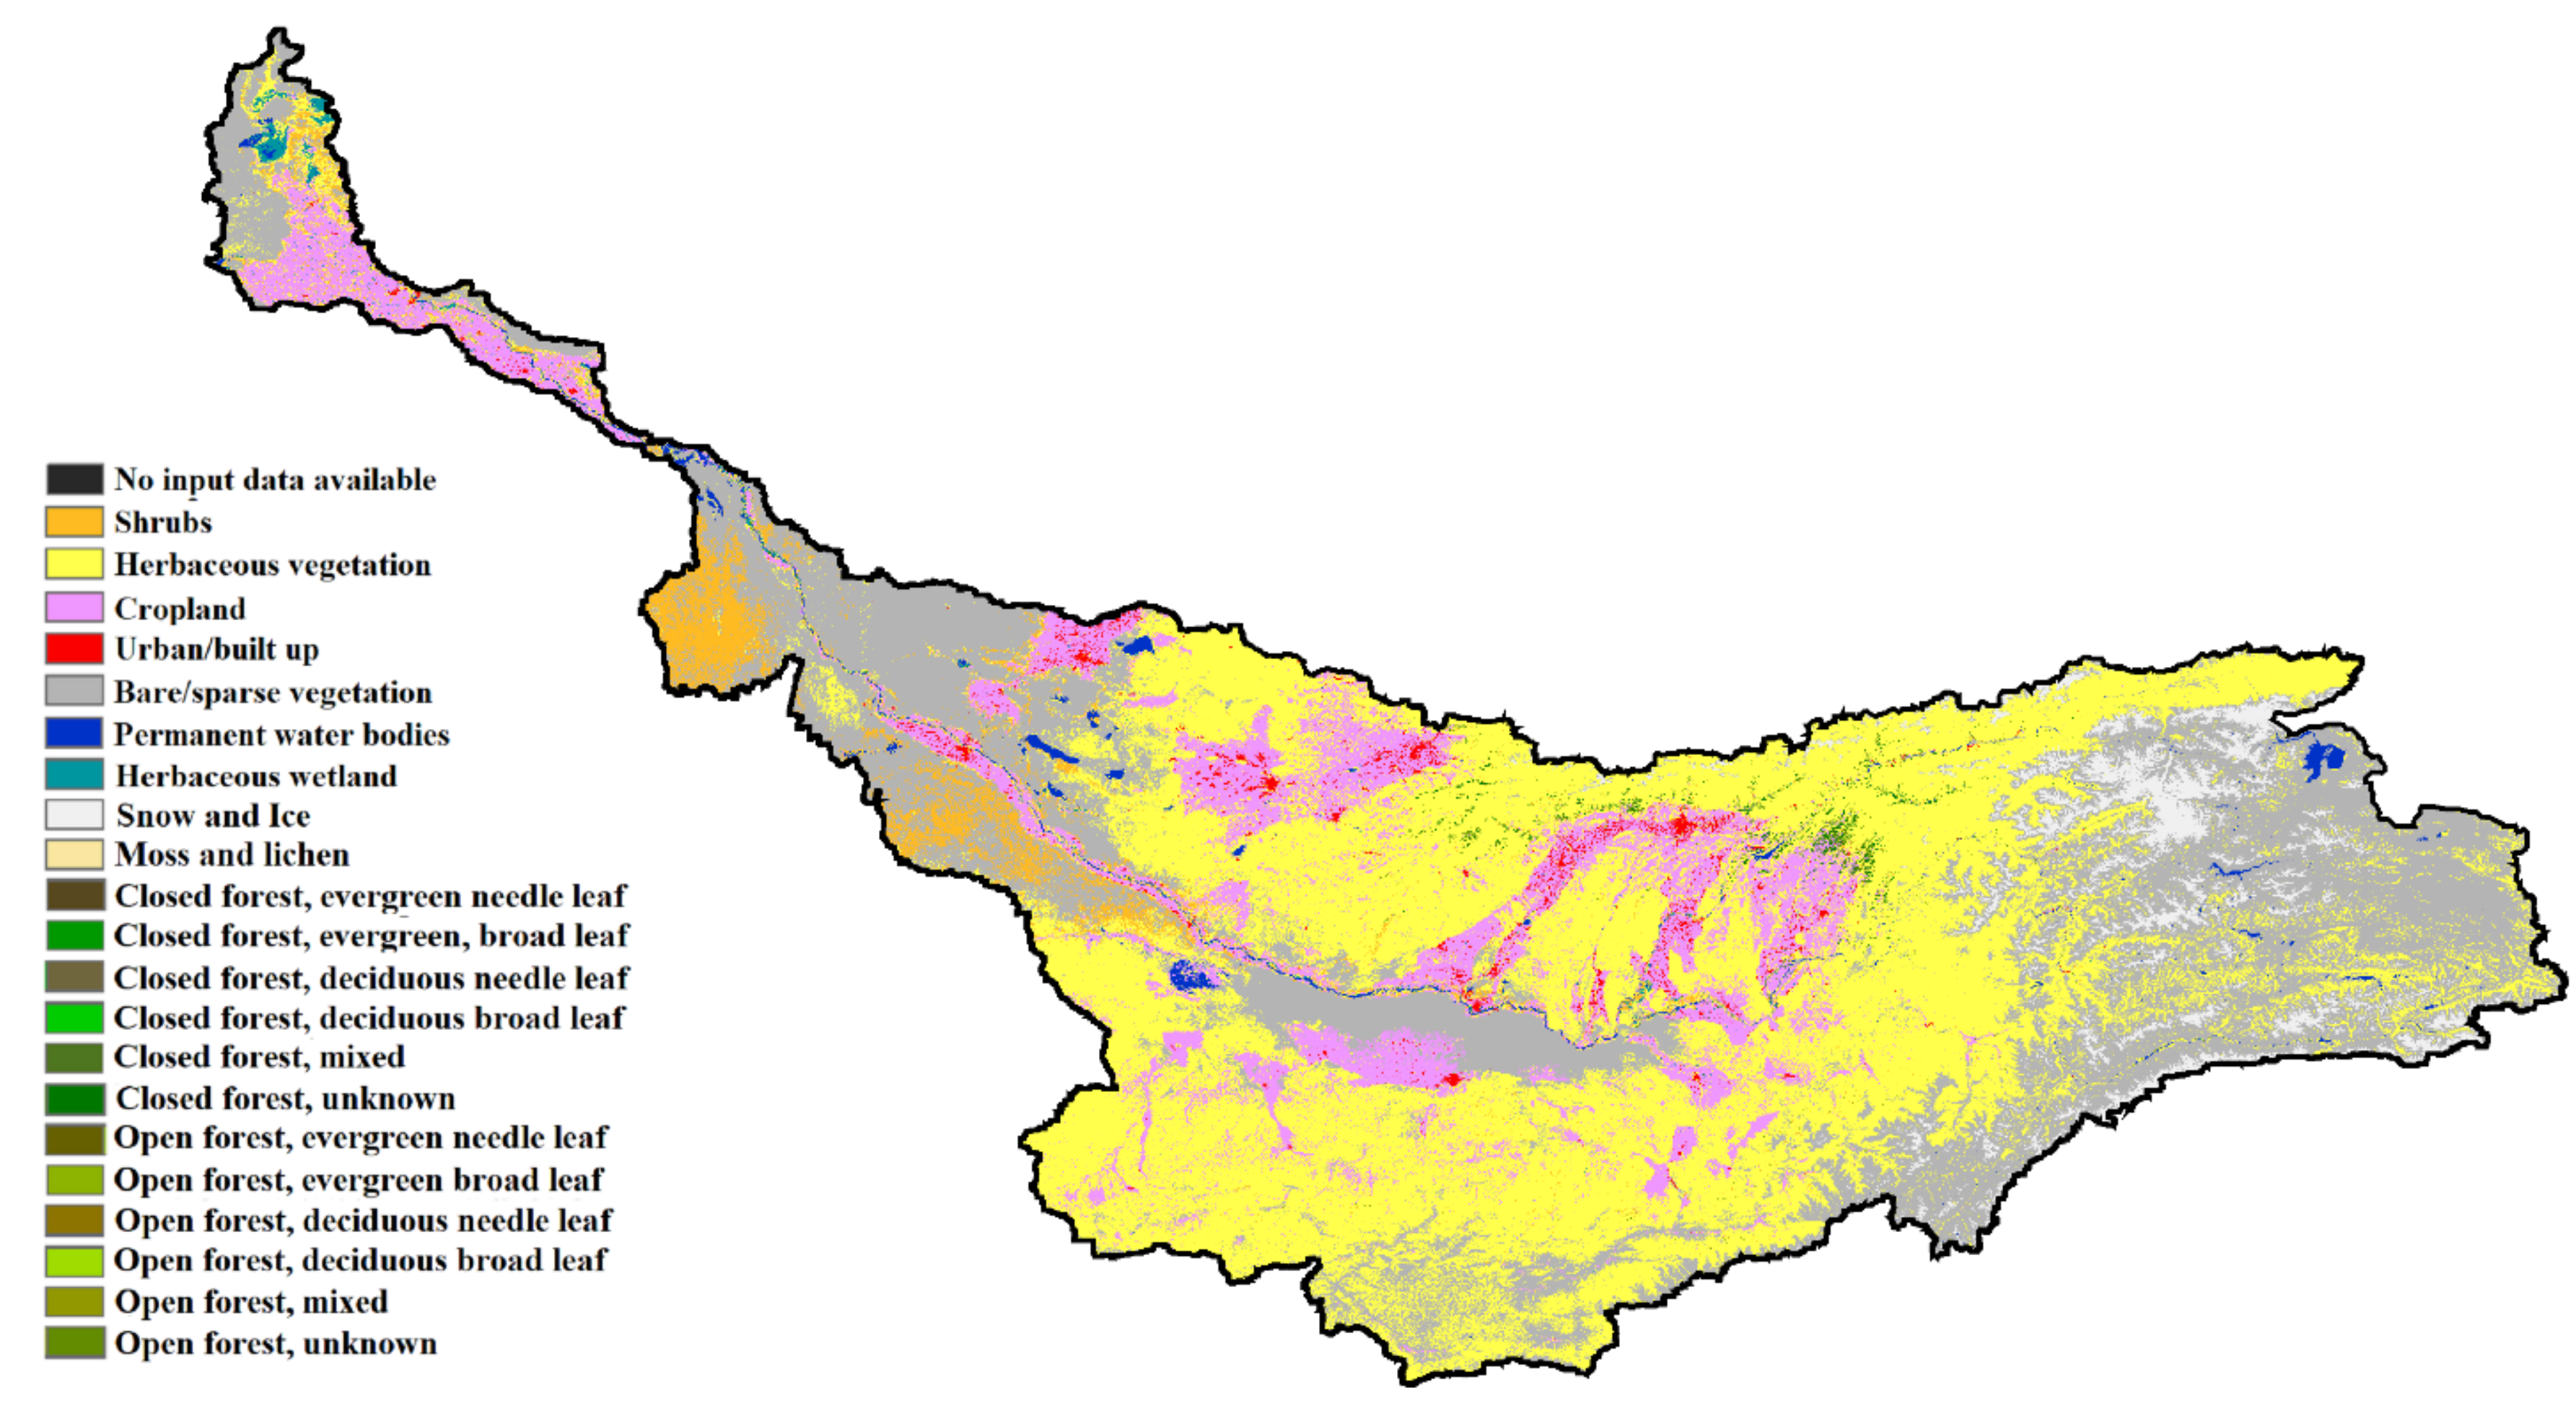
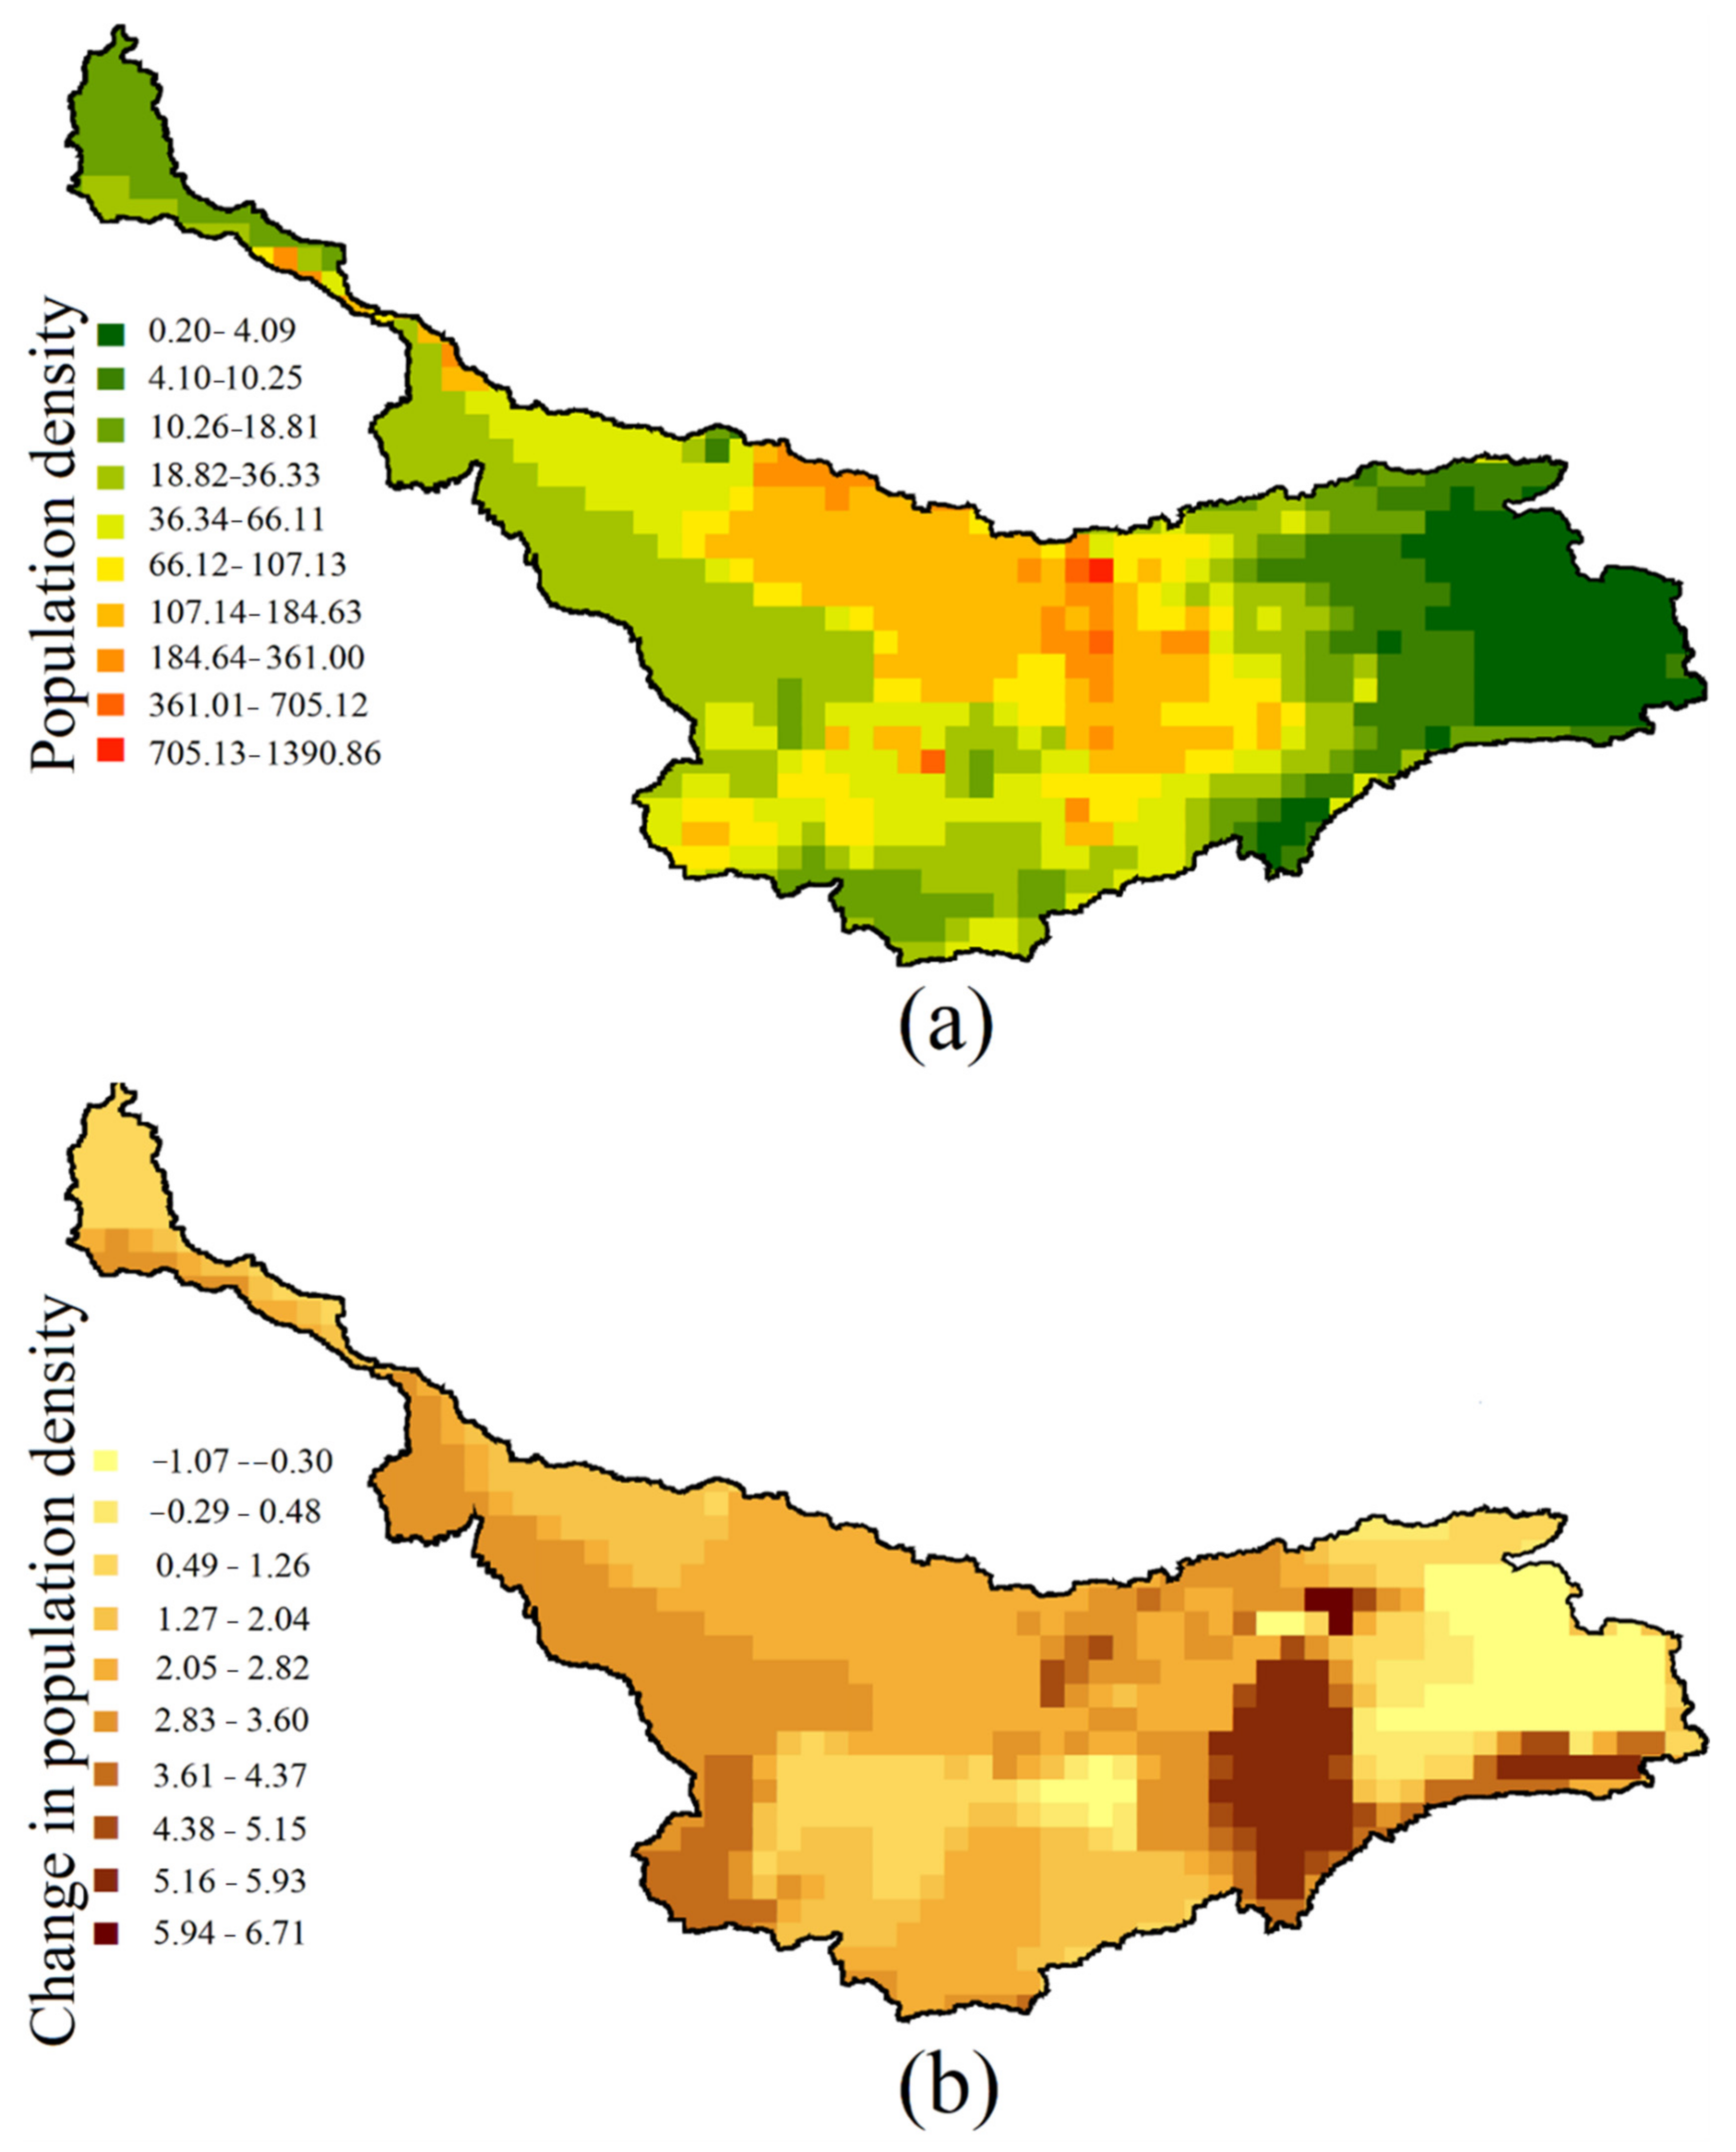
4.5. Relation of Water Sustainability with Land Use and Population
5. Discussion
6. Conclusions
Author Contributions
Funding
Institutional Review Board Statement
Informed Consent Statement
Data Availability Statement
Acknowledgments
Conflicts of Interest
References
- Connor, R. The United Nations World Water Development Report 2015: Water for a Sustainable World; UNESCO publishing: Paris, France, 2015; Volume 1. [Google Scholar]
- Sun, S.; Wang, Y.; Liu, J.; Cai, H.; Wu, P.; Geng, Q.; Xu, L. Sustainability assessment of regional water resources under the DPSIR framework. J. Hydrol. 2016, 532, 140–148. [Google Scholar] [CrossRef]
- Hamed, M.M.; Nashwan, M.S.; Shahid, S.; Ismail, T. bin; Wang, X.; Dewan, A.; Asaduzzaman, M. Inconsistency in historical simulations and future projections of temperature and rainfall: A comparison of CMIP5 and CMIP6 models over Southeast Asia. Atmos. Res. 2022, 265, 105927. [Google Scholar] [CrossRef]
- Hamed, M.M.; Nashwan, M.S.; Shahid, S. Intercomparison of Historical Simulation and Future Projection of Rainfall and Temperature by CMIP5 and CMIP6 GCMs Over Egypt. Int. J. Climatol. 2022. [Google Scholar] [CrossRef]
- Houmsi, M.R.; Shiru, M.S.; Nashwan, M.S.; Ahmed, K.; Ziarh, G.F.; Shahid, S.; Chung, E.S.; Kim, S. Spatial shift of aridity and its impact on land use of Syria. Sustainability 2019, 11, 7047. [Google Scholar] [CrossRef] [Green Version]
- Hamed, M.M.; Nashwan, M.S.; Shahid, S. Performance Evaluation of Reanalysis Precipitation Products in Egypt using Fuzzy Entropy Time Series Similarity Analysis. Int. J. Climatol. 2021, 41, 5431–5446. [Google Scholar] [CrossRef]
- Hamed, M.M.; Nashwan, M.S.; Shahid, S. A Novel Selection Method of CIMP6 GCMs for Robust Climate Projection. Int. J. Climatol. 2022. [Google Scholar] [CrossRef]
- Shiru, M.S.; Shahid, S.; Chung, E.-S.; Alias, N. Changing characteristics of meteorological droughts in Nigeria during 1901–2010. Atmos. Res. 2019, 223, 60–73. [Google Scholar] [CrossRef]
- Pour, S.H.; Wahab, A.K.A.; Shahid, S.; Asaduzzaman, M.; Dewan, A. Low impact development techniques to mitigate the impacts of climate-change-induced urban floods: Current trends, issues and challenges. Sustain. Cities Soc. 2020, 62, 102373. [Google Scholar] [CrossRef]
- Ahmed, K.; Shahid, S.; Wang, X.; Nawaz, N.; Khan, N. Spatiotemporal changes in aridity of Pakistan during 1901–2016. Hydrol. Earth Syst. Sci. 2019, 23, 3081–3096. [Google Scholar] [CrossRef] [Green Version]
- Nashwan, M.S.; Shahid, S.; Wang, X. Assessment of satellite-based precipitation measurement products over the hot desert climate of Egypt. Remote Sens. 2019, 11, 555. [Google Scholar] [CrossRef] [Green Version]
- Salman, S.A.; Shahid, S.; Afan, H.A.; Shiru, M.S.; Al-Ansari, N.; Yaseen, Z.M. Changes in climatic water availability and crop water demand for Iraq region. Sustainability 2020, 12, 3437. [Google Scholar] [CrossRef] [Green Version]
- Ahmed, K.; Shahid, S.; Ali, R.O.; Harun, S. Bin; Wang, X.J. Evaluation of the performance of gridded precipitation products over balochistan province, pakistan. Desalin. Water Treat. 2017, 79, 73–86. [Google Scholar] [CrossRef]
- Flörke, M.; Schneider, C.; McDonald, R.I. Water competition between cities and agriculture driven by climate change and urban growth. Nat. Sustain. 2018, 1, 51–58. [Google Scholar] [CrossRef]
- Mehran, A.; AghaKouchak, A.; Nakhjiri, N.; Stewardson, M.J.; Peel, M.C.; Phillips, T.J.; Ravalico, J.K. Compounding impacts of human-induced water stress and climate change on water availability. Sci. Rep. 2017, 7, 6282. [Google Scholar] [CrossRef] [Green Version]
- Wada, Y.; Flörke, M.; Hanasaki, N.; Eisner, S.; Fischer, G.; Tramberend, S.; Ringler, C. Modeling global water use for the 21st century: The Water Futures and Solutions (WFaS) initiative and its approaches. Geosci. Model. Dev. 2016, 9, 175–222. [Google Scholar] [CrossRef] [Green Version]
- Boretti, A.; Rosa, L. Reassessing the projections of the world water development report. NPJ Clean Water 2019, 2, 15. [Google Scholar] [CrossRef]
- Rathnayaka, K.; Malano, H.; Arora, M. Assessment of sustainability of urban water supply and demand management options: A comprehensive approach. Water 2016, 8, 595. [Google Scholar] [CrossRef] [Green Version]
- Padowski, J.C.; Jawitz, J.W. Water availability and vulnerability of 225 large cities in the United States. Water Resour. Res. 2012, 48. [Google Scholar] [CrossRef] [Green Version]
- Mirrah, A.; Kusratmoko, E. Application of GIS for Assessment of Water Availability in the Cianten Watershed, West Java. In Proceedings of the 5th Geoinformation Science Symposium 2017 (GSS 2017), Yogyakarta, Indonesia, 27–28 September 2017. [Google Scholar]
- Maliehe, M.; Mulungu, D.M. Assessment of water availability for competing uses using SWAT and WEAP in South Phuthiatsana catchment, Lesotho. Phys. Chem. EarthParts A/B/C 2017, 100, 305–316. [Google Scholar] [CrossRef]
- Barlow, P.M.; Alley, W.M.; Myers, D.N. Hydrologic aspects of water sustainability and their relation to a national assessment of water availability and use. Water Resour. Updat. 2004, 127, 76–86. [Google Scholar]
- Maiolo, M.; Pantusa, D. Sustainable water management index, SWaM_Index. Cogent Eng. 2019, 6, 1603817. [Google Scholar] [CrossRef]
- Sandoval-Solis, S.; McKinney, D.; Loucks, D.P. Sustainability index for water resources planning and management. J. Water Resour. Plan. Manag. 2011, 137, 381–390. [Google Scholar] [CrossRef] [Green Version]
- Loucks, D.P. Quantifying trends in system sustainability. Hydrol. Sci. J. 1997, 42, 513–530. [Google Scholar] [CrossRef]
- Prakash, S.; Gairola, R.; Papa, F.; Mitra, A. An assessment of terrestrial water storage, rainfall and river discharge over Northern India from satellite data. Curr. Sci. 2014, 1582–1586. [Google Scholar]
- Yin, W.; Hu, L.; Zhang, M.; Wang, J.; Han, S.C. Statistical Downscaling of GRACE-Derived Groundwater Storage Using ET Data in the North China Plain. J. Geophys. Res. Atmos. 2018, 123, 5973–5987. [Google Scholar] [CrossRef]
- Zhang, K.; Xie, X.; Zhu, B.; Meng, S.; Yao, Y. Unexpected groundwater recovery with decreasing agricultural irrigation in the Yellow River Basin. Agric. Water Manag. 2019, 213, 858–867. [Google Scholar] [CrossRef]
- Richey, A.S.; Thomas, B.F.; Lo, M.-H.; Reager, J.T.; Famiglietti, J.S.; Voss, K.; Swenson, S.; Rodell, M. Quantifying renewable groundwater stress with GRACE. Water Resour. Res. 2015, 51, 5217–5238. [Google Scholar] [CrossRef]
- Pang, Y.; Wu, B.; Cao, Y.; Jia, X. Spatiotemporal changes in terrestrial water storage in the Beijing-Tianjin Sandstorm Source Region from GRACE satellites. Int. Soil Water Conserv. Res. 2020, 8, 295–307. [Google Scholar] [CrossRef]
- Tapley, B.D.; Bettadpur, S.; Watkins, M.; Reigber, C. The gravity recovery and climate experiment: Mission overview and early results. Geophys. Res. Lett. 2004, 31. [Google Scholar] [CrossRef] [Green Version]
- Long, D.; Yang, Y.; Wada, Y.; Hong, Y.; Liang, W.; Chen, Y.; Chen, L. Deriving scaling factors using a global hydrological model to restore GRACE total water storage changes for China’s Yangtze River Basin. Remote Sens. Environ. 2015, 168, 177–193. [Google Scholar] [CrossRef]
- Dai, C.; Shum, C.; Wang, R.; Wang, L.; Guo, J.; Shang, K.; Tapley, B. Improved constraints on seismic source parameters of the 2011 Tohoku earthquake from GRACE gravity and gravity gradient changes. Geophys. Res. Lett. 2014, 41, 1929–1936. [Google Scholar] [CrossRef] [Green Version]
- Wang, X.; Linage, C.; Famiglietti, J.; Zender, C.S. Gravity Recovery and Climate Experiment (GRACE) detection of water storage changes in the Three Gorges Reservoir of China and comparison with in situ measurements. Water Resour. Res. 2011, 47, W12502. [Google Scholar] [CrossRef]
- Mo, X.; Wu, J.; Wang, Q.; Zhou, H. Variations in water storage in China over recent decades from GRACE observations and GLDAS. Nat. Hazards Earth Syst. Sci. 2016, 16, 469–482. [Google Scholar] [CrossRef] [Green Version]
- Shamsudduha, M.; Taylor, R.G.; Jones, D.; Longuevergne, L.; Owor, M.; Tindimugaya, C. Recent changes in terrestrial water storage in the Upper Nile Basin: An evaluation of commonly used gridded GRACE products. Hydrol. Earth Syst. Sci. 2017, 21, 4533–4549. [Google Scholar] [CrossRef] [Green Version]
- Li, T.; Zhang, Q.; Zhao, Y.; Gao, Y. Detection of groundwater storage variability based on GRACE and CABLE model in the Murray-Darling Basin. E3S Web Conf. 2019, 131, 1067. [Google Scholar] [CrossRef]
- Boergens, E.; Güntner, A.; Dobslaw, H.; Dahle, C. Quantifying the Central European droughts in 2018 and 2019 with GRACE Follow-On. Geophys. Res. Lett. 2020, 47, e2020GL087285. [Google Scholar] [CrossRef]
- Cammalleri, C.; Barbosa, P.; Vogt, J. V Analysing the relationship between multiple-timescale SPI and GRACE terrestrial water storage in the framework of drought monitoring. Water 2019, 11, 1672. [Google Scholar] [CrossRef] [Green Version]
- Jin, S.; Zhang, T. Terrestrial water storage anomalies associated with drought in southwestern USA from GPS observations. Surv. Geophys. 2016, 37, 1139–1156. [Google Scholar] [CrossRef]
- Singh, A.; Reager, J.T.; Behrangi, A. Estimation of hydrological drought recovery based on precipitation and Gravity Recovery and Climate Experiment (GRACE) water storage deficit. Hydrol. Earth Syst. Sci. 2021, 25, 511–526. [Google Scholar] [CrossRef]
- Qutbudin, I.; Shiru, M.S.; Sharafati, A.; Ahmed, K.; Al-Ansari, N.; Yaseen, Z.M.; Shahid, S.; Wang, X. Seasonal drought pattern changes due to climate variability: Case study in Afghanistan. Water 2019, 11, 1096. [Google Scholar] [CrossRef] [Green Version]
- Pour, S.H.; Wahab, A.K.A.; Shahid, S. Spatiotemporal changes in aridity and the shift of drylands in Iran. Atmos. Res. 2020, 233, 104704. [Google Scholar] [CrossRef]
- Unger-Shayesteh, K.; Vorogushyn, S.; Farinotti, D.; Gafurov, A.; Duethmann, D.; Mandychev, A.; Merz, B. What do we know about past changes in the water cycle of Central Asian headwaters? A review. Glob. Planet. Chang. 2013, 110, 4–25. [Google Scholar] [CrossRef]
- Babow, S.; Meisen, P. The Water-Energy Nexus in the Amu Darya River Basin: The Need for Sustainable Solutions to a Regional Problem; Global Energy Network Institute: San Diego, CA, USA, 2012. [Google Scholar]
- Khamzayeva, A.; Rahimov, S.; Islamov, U.; Maksudov, F.; Maksudova, D.; Sakiev, B. Water Resources Management in Central Asia: Regional and International Issues at Stake; CIDOB edicions: Barcelona, Spain, 2009. [Google Scholar]
- Lioubimtseva, E. Impact of Climate Change on the Aral Sea and its basin The Aral Sea; Springer: Berlin/Heidelberg, Germany, 2014. [Google Scholar]
- Glantz, M.H. Water, climate, and development issues in the Amu Darya Basin. Mitig. Adapt. Strat. Glob. Chang. 2005, 10, 23–50. [Google Scholar] [CrossRef]
- Kure, S.; Jang, S.; Ohara, N.; Kavvas, M.L.; Chen, Z.Q. Hydrologic impact of regional climate change for the snowfed and glacierfed river basins in the Republic of Tajikistan: Hydrological response of flow to climate change. Hydrol. Process. 2013, 27, 4057–4070. [Google Scholar] [CrossRef]
- Novikov, V.; Simonett, O.; Beilstein, M.; Bournay, E.; Berthiaume, C.; Kirby, A.; Rajabov, I. Climate change in Central Asia—A Visual Synthesis; Swiss Federal Office for the environment (FOEN), Zoı Environment Network: Vernier, Switzerland, 2009. [Google Scholar]
- Jalilov, S.-M.; Keskinen, M.; Varis, O.; Amer, S.; Ward, F.A. Managing the water–energy–food nexus: Gains and losses from new water development in Amu Darya River Basin. J. Hydrol. 2016, 539, 648–661. [Google Scholar] [CrossRef]
- Dodson, J.; Betts, A.V.; Amirov, S.; Yagodin, V.N. The nature of fluctuating lakes in the southern Amu-dar’ya delta. Palaeogeogr. Palaeoclimatol. Palaeoecol. 2015, 437, 63–73. [Google Scholar] [CrossRef]
- Lutz, A.F.; Droogers, P.; Immerzeel, W. Climate change impact and adaptation on the water resources in the Amu Darya and Syr Darya River basins. Rep. Futur. 2012, 110, 1–116. [Google Scholar]
- Hagg, W.; Hoelzle, M.; Wagner, S.; Mayr, E.; Klose, Z. Glacier and runoff changes in the Rukhk catchment, upper Amu-Darya basin until 2050. Glob. Planet. Chang. 2013, 110, 62–73. [Google Scholar] [CrossRef] [Green Version]
- White, C.J.; Tanton, T.W.; Rycroft, D.W. The impact of climate change on the water resources of the Amu Darya Basin in Central Asia. Water Resour. Manag. 2014, 28, 5267–5281. [Google Scholar] [CrossRef]
- Immerzeel, W.; Lutz, A.; Droogers, P. Climate Change Impacts on the Upstream Water Resources of the Amu and Syr Darya River Basins; FutureWater: Wageningen, The Netherlands, 2012. [Google Scholar]
- Nezlin, N.P.; Kostianoy, A.G.; Lebedev, S.A. Interannual variations of the discharge of Amu Darya and Syr Darya estimated from global atmospheric precipitation. J. Mar. Syst. 2004, 47, 67–75. [Google Scholar] [CrossRef]
- Wegerich, K. Hydro-hegemony in the Amu Darya basin. Water Policy 2008, 10, 71–88. [Google Scholar] [CrossRef] [Green Version]
- Kumar, N.; Khamzina, A.; Tischbein, B.; Knöfel, P.; Conrad, C.; Lamers, J.P. Spatio-temporal supply–demand of surface water for agroforestry planning in saline landscape of the lower Amudarya Basin. J. Arid Environ. 2019, 162, 53–61. [Google Scholar] [CrossRef]
- Crosa, G.; Froebrich, J.; Nikolayenko, V.; Stefani, F.; Galli, P.; Calamari, D. Spatial and seasonal variations in the water quality of the Amu Darya River (Central Asia). Water Res. 2006, 40, 2237–2245. [Google Scholar] [CrossRef] [PubMed]
- Schlüter, M.; Savitsky, A.G.; McKinney, D.C.; Lieth, H. Optimizing long-term water allocation in the Amudarya River delta: A water management model for ecological impact assessment. Environ. Model. Softw. 2005, 20, 529–545. [Google Scholar] [CrossRef]
- Sun, J.; Li, Y.; Suo, C.; Liu, Y. Impacts of irrigation efficiency on agricultural water-land nexus system management under multiple uncertainties—A case study in Amu Darya River basin, Central Asia. Agric. Water Manag. 2019, 216, 76–88. [Google Scholar] [CrossRef]
- Schlüter, M.; Khasankhanova, G.; Talskikh, V.; Taryannikova, R.; Agaltseva, N.; Joldasova, I.; Abdullaev, U. Enhancing resilience to water flow uncertainty by integrating environmental flows into water management in the Amudarya River, Central Asia. Glob. Planet. Chang. 2013, 110, 114–129. [Google Scholar] [CrossRef]
- Ahmad, M.; Wasiq, M. Water Resource Development in Northern Afganistan and Its Implications for Amu Darya Basin: The World Bank; World Bank Publications: Washington, DC, USA, 2004; ISBN 0821358901. [Google Scholar]
- Normatov, P.I.; Normatov, I.S. Monitoring of Meteorological, Hydrological Conditions and Water Quality of the Main Tributaries of the Transboundary Amu Darya River. In Achievements and Challenges of Integrated River Basin; IntechOpen: London, UK, 2018. [Google Scholar]
- Jalilov, S.-M.; Amer, S.A.; Ward, F.A. Reducing conflict in development and allocation of transboundary rivers. Eurasian Geogr. Econ. 2013, 54, 78–109. [Google Scholar] [CrossRef]
- Behzod, G.; Su-Chin, C. Water salinity changes of the gauging stations along the Amu Darya River. J. Agric. For. 2013, 62, 1–14. [Google Scholar]
- Wang, X.; Luo, Y.; Sun, L.; He, C.; Zhang, Y.; Liu, S. Attribution of runoff decline in the Amu Darya River in Central Asia during 1951–2007. J. Hydrometeorol. 2016, 17, 1543–1560. [Google Scholar] [CrossRef]
- Hirsch, R.M.; Slack, J.R. A nonparametric trend test for seasonal data with serial dependence. Water Resour. Res. 1984, 20, 727–732. [Google Scholar] [CrossRef] [Green Version]
- McLeod, A.I.; Hipel, K.W. Simulation procedures for Box-Jenkins models. Water Resour. Res. 1978, 14, 969–975. [Google Scholar] [CrossRef]
- Asefa, T.; Clayton, J.; Adams, A.; Anderson, D. Performance evaluation of a water resources system under varying climatic conditions: Reliability, Resilience, Vulnerability and beyond. J. Hydrol. 2014, 508, 53–65. [Google Scholar] [CrossRef]
- Hashimoto, T.; Stedinger, J.R.; Loucks, D.P. Reliability, resiliency, and vulnerability criteria for water resource system performance evaluation. Water Resour. Res. 1982, 18, 14–20. [Google Scholar] [CrossRef] [Green Version]
- Sun, Y.; Riva, R.E.M. A global semi-empirical glacial isostatic adjustment (GIA) model based on Gravity Recovery and Climate Experiment (GRACE) data. Earth Syst. Dyn. 2020, 11, 129–137. [Google Scholar] [CrossRef] [Green Version]
- Jing, W.; Zhang, P.; Zhao, X. A comparison of different GRACE solutions in terrestrial water storage trend estimation over Tibetan Plateau. Sci. Rep. 2019, 9, 1765. [Google Scholar] [CrossRef] [PubMed] [Green Version]
- Brite, E.B. The hydrosocial empire: The Karakum River and the Soviet conquest of Central Asia in the 20th century. J. Anthropol. Archaeol. 2018, 52, 123–136. [Google Scholar] [CrossRef]
- Havenith, H.-B.; Torgoev, I.; Ischuk, A. Integrated geophysical-geological 3D model of the right-bank slope downstream from the Rogun dam construction site, Tajikistan. Int. J. Geophys. 2018, 2018, 1641789. [Google Scholar] [CrossRef]
- Liu, G.; Hu, F.; Wang, Y.; Wang, H. Assessment of Lexicographic Minimax Allocations of Blue and Green Water Footprints in the Yangtze River Economic Belt Based on Land, Population, and Economy. Int. J. Environ. Res. Public Health 2019, 16, 643. [Google Scholar] [CrossRef] [PubMed] [Green Version]
- Baker, R.J.; Scott, D.M.; King, P.J.; Overall, A.D.J. Genetic structure of regional water vole populations and footprints of reintroductions: A case study from southeast England. Conserv. Genet. 2020, 21, 531–546. [Google Scholar] [CrossRef]
- Sediqi, M.N.; Shiru, M.S.; Nashwan, M.S.; Ali, R.; Abubaker, S.; Wang, X.; Ahmed, K.; Shahid, S.; Asaduzzaman, M.; Manawi, S.M.A. Spatio-temporal pattern in the changes in availability and sustainability of water resources in Afghanistan. Sustainability 2019, 11, 5836. [Google Scholar] [CrossRef] [Green Version]
- Salehie, O.; Ismail, T.; Shahid, S.; Sammen, S.S.; Malik, A.; Wang, X. Selection of the Gridded Temperature Dataset for Assessment of Thermal Bioclimatic Environment Changes in Amu Darya River Basin. Res. Sq. 2021. [CrossRef]
- Seyoum, W.M.; Kwon, D.; Milewski, A.M. Downscaling GRACE TWSA Data into High-Resolution Groundwater Level Anomaly Using Machine Learning-Based Models in a Glacial Aquifer System. Remote Sens. 2019, 11, 824. [Google Scholar] [CrossRef] [Green Version]
- Jin, S.; Zhang, T.Y.; Zou, F. Glacial density and GIA in Alaska estimated from ICESat, GPS and GRACE measurements. J. Geophys. Res. Earth Surf. 2017, 122, 76–90. [Google Scholar] [CrossRef]
Publisher’s Note: MDPI stays neutral with regard to jurisdictional claims in published maps and institutional affiliations. |
© 2022 by the authors. Licensee MDPI, Basel, Switzerland. This article is an open access article distributed under the terms and conditions of the Creative Commons Attribution (CC BY) license (https://creativecommons.org/licenses/by/4.0/).
Share and Cite
Salehie, O.; Ismail, T.b.; Shahid, S.; Hamed, M.M.; Chinnasamy, P.; Wang, X. Assessment of Water Resources Availability in Amu Darya River Basin Using GRACE Data. Water 2022, 14, 533. https://doi.org/10.3390/w14040533
Salehie O, Ismail Tb, Shahid S, Hamed MM, Chinnasamy P, Wang X. Assessment of Water Resources Availability in Amu Darya River Basin Using GRACE Data. Water. 2022; 14(4):533. https://doi.org/10.3390/w14040533
Chicago/Turabian StyleSalehie, Obaidullah, Tarmizi bin Ismail, Shamsuddin Shahid, Mohammed Magdy Hamed, Pennan Chinnasamy, and Xiaojun Wang. 2022. "Assessment of Water Resources Availability in Amu Darya River Basin Using GRACE Data" Water 14, no. 4: 533. https://doi.org/10.3390/w14040533
APA StyleSalehie, O., Ismail, T. b., Shahid, S., Hamed, M. M., Chinnasamy, P., & Wang, X. (2022). Assessment of Water Resources Availability in Amu Darya River Basin Using GRACE Data. Water, 14(4), 533. https://doi.org/10.3390/w14040533