1. Introduction
The Sinai Peninsula (located in the north-eastern portion of Egypt) has been developed socio-economically in the last four decades [
1]. Thus, sufficient sustainable water resources should meet the future water demand in order to cope with this socio-economic development. One of the cities located in Sinai is Nuweiba City. The city was completely dependent on groundwater as a source of drinking water, and limited agriculture for the local population many years ago. Recently, a desalination plant has been constructed to supply the city and touristic resorts with potable water. The city is currently witnessing an accelerating in development in all urban and social fields. Therefore, it is necessary to develop the available water resources (conventional and non-conventional) such as desalinated seawater and storm water, in order to meet the water demand requirements.
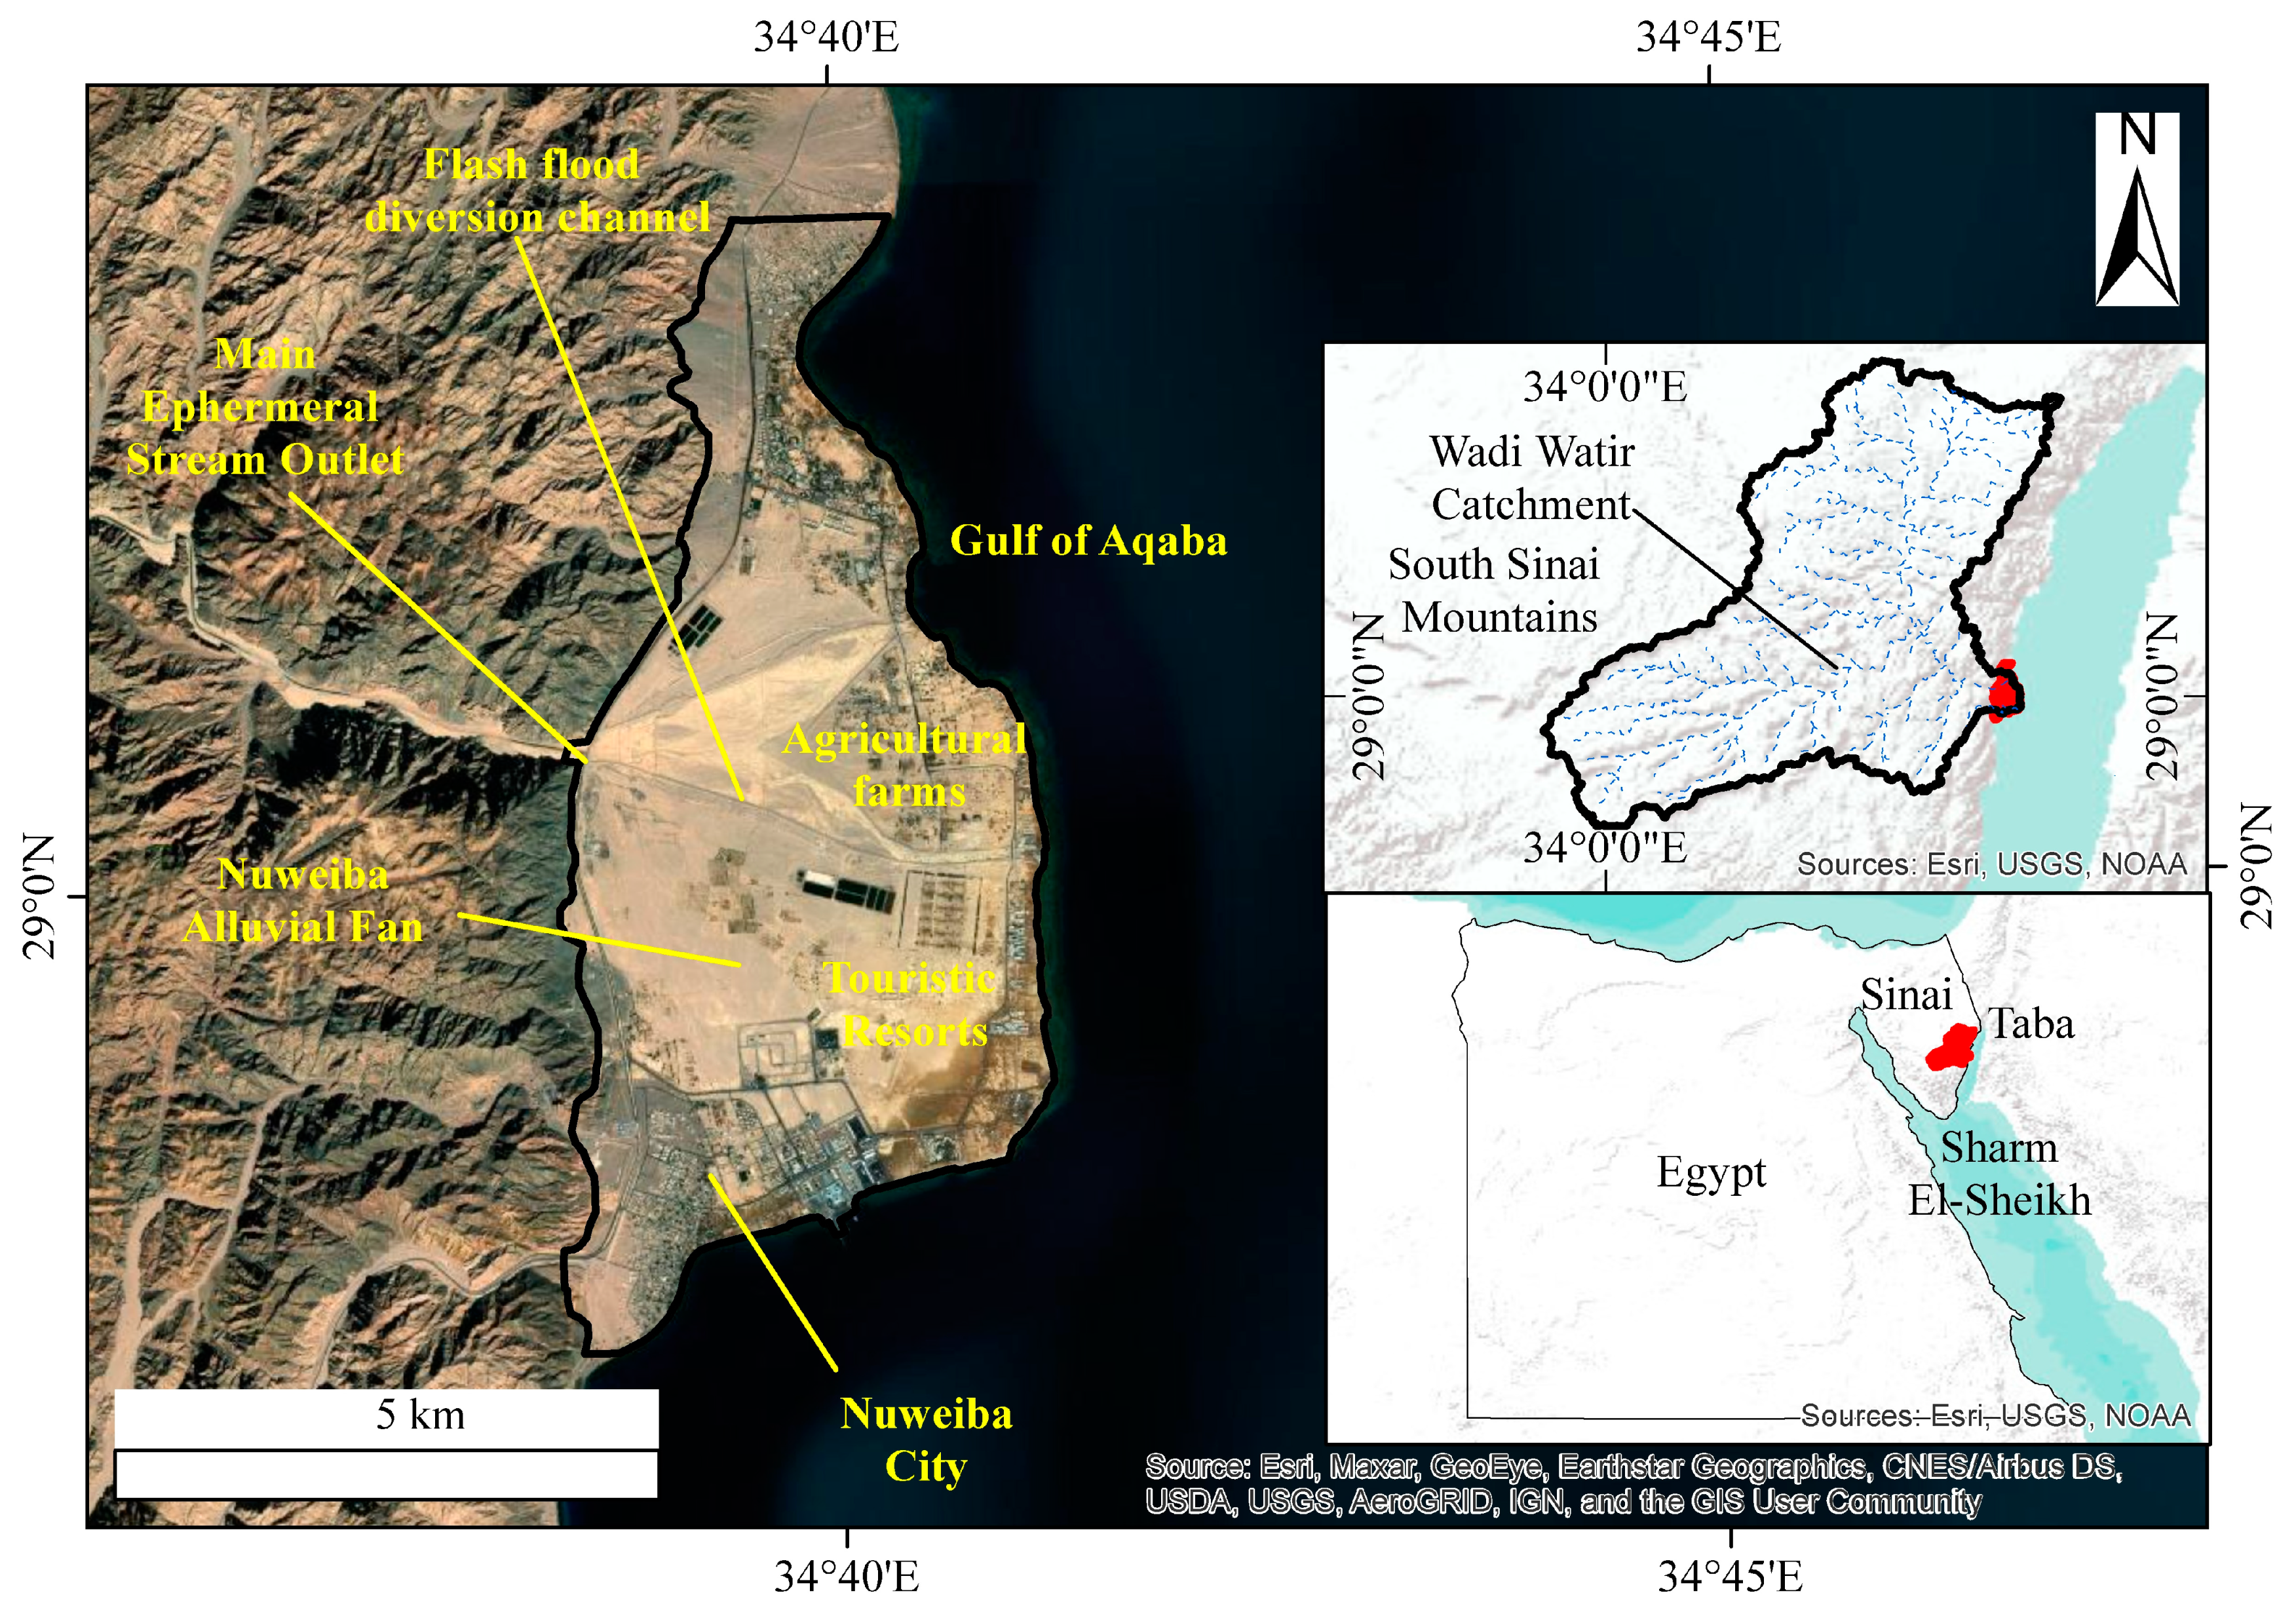
The city is located in the Nuweiba alluvial fan between the main ephemeral stream outlet of the Wadi Watir catchment in the west and the Gulf of Aqaba in the east [
2] (
Figure 1). Various features are present in the city: an international harbor, touristic resorts, and small agricultural farms.
In light of the city’s rapid growth, desalinated seawater is the main sustainable source that can meet the consumption requirements. However, it is necessary to search for another suitable water source to meet the requirements during drought periods. In other words, it is impossible to rely solely on desalinated seawater to meet the consumption requirements during emergency periods. In addition, the current water supply in the study area is subject to the following risks: desalination plant malfunction, petroleum leakage in the sea, and malfunction of the main intake pipeline to the desalination plant.
Hence, sustainable water resource plans are essential to cope with any future emergent drought. Thus, most previous studies have demonstrated the feasibility of sustaining water resources by focusing on either surface water or groundwater in the future. Previous researchers applied different methods, but most studies lack solutions related to sustaining water resources in the case of emergencies.
Regarding surface water, Masoud [
3] quantified the runoff and recharge volumes for the main active catchments using the Soil Conservation Service (SCS) model. Milewski et al. [
4] calculated the runoff and recharge volumes for the active catchments in Sinai using the Soil and Water Assessment Tool (SWAT) model via Remote Sensing (RS) data. Zayed et al. [
5] evaluated water harvesting potential by imposing Integrated Water Resources Management (IWRM) guidelines based on physical, socioeconomic, environmental, and institutional data analyses.
Regarding groundwater, Abuzied et al. [
2] delineated the groundwater potential zones in the study area by creating a groundwater potential map using remote sensing (RS) and geoinformation system (GIS) tools to assess the groundwater resources. Eissa et al. [
1] modeled the groundwater system using Modular Finite Difference Groundwater Flow (MODFLOW), Net Geochemical Reactions Along a Flow Path (NETPATH), and Simulation of Three-Dimensional Variable-Density Groundwater Flow and Transport (SEAWAT) models to understand the recharge sources to the aquifer. Sallam [
6] modeled the suitability of Aquifer Storage Recovery (ASR) to the system using the linkage between MODFLOW, MODPATH, and Three-Dimensional Multi-Species Solute Transport (MT3DMS) to evaluate the recovery efficiency when injecting freshwater into the aquifer. Elewa and Qaddah [
7] mapped the groundwater potential for Sinai using RS and GIS in order to assess the groundwater resources.
The aforementioned studies focused on sustaining water resources in the future in relation to the current situation; however, the studies did not address the water resources’ vulnerability to future droughts. Hence, techniques such as MAR could be applied to act as a back-up system to supply water in the case of emergency. Groundwater management can mitigate the water scarcity problems and sustain water resources supply in the future [
8]. As such, MAR has been applied as a groundwater management tool, especially in arid and semi-arid regions [
9,
10]. MAR is defined according to Dillon et al. [
11] as the artificial injection of freshwater into groundwater aquifers to recover water or to gain environmental benefits. It seeks to replenish the aquifer such that the groundwater is the secondary water supply, which could be utilized in the case of emergency. To effectively install MAR, the feasible site locations should be assessed.
Thus, the main objective of this study is to delineate MAR sites. To achieve the objectives, the following steps were taken: (1) reviewing the literature related to the study area and delineation methods; (2) acquiring data from previous studies and field trips; (3) preparing data before applying the delineation method; (4) generating potential maps showing the MAR delineation locations.
2. Materials and Methods
2.1. Nuweiba Alluvial Fan Aquifer
The total area of the Nuweiba alluvial fan is around 30 km
2. The surface elevation ranges from 0 to 48 m above mean sea level (MSL). The fan is characterized by a steep surface; the surface’s slope ranges from around 0.3 to 5%, with an arithmetic mean of about 1.4%. Most of the study area is covered by alluvial dunes in the presence of clastic sediments [
12], whereas the rest is surrounded by urban buildings, roads, and agricultural sites.
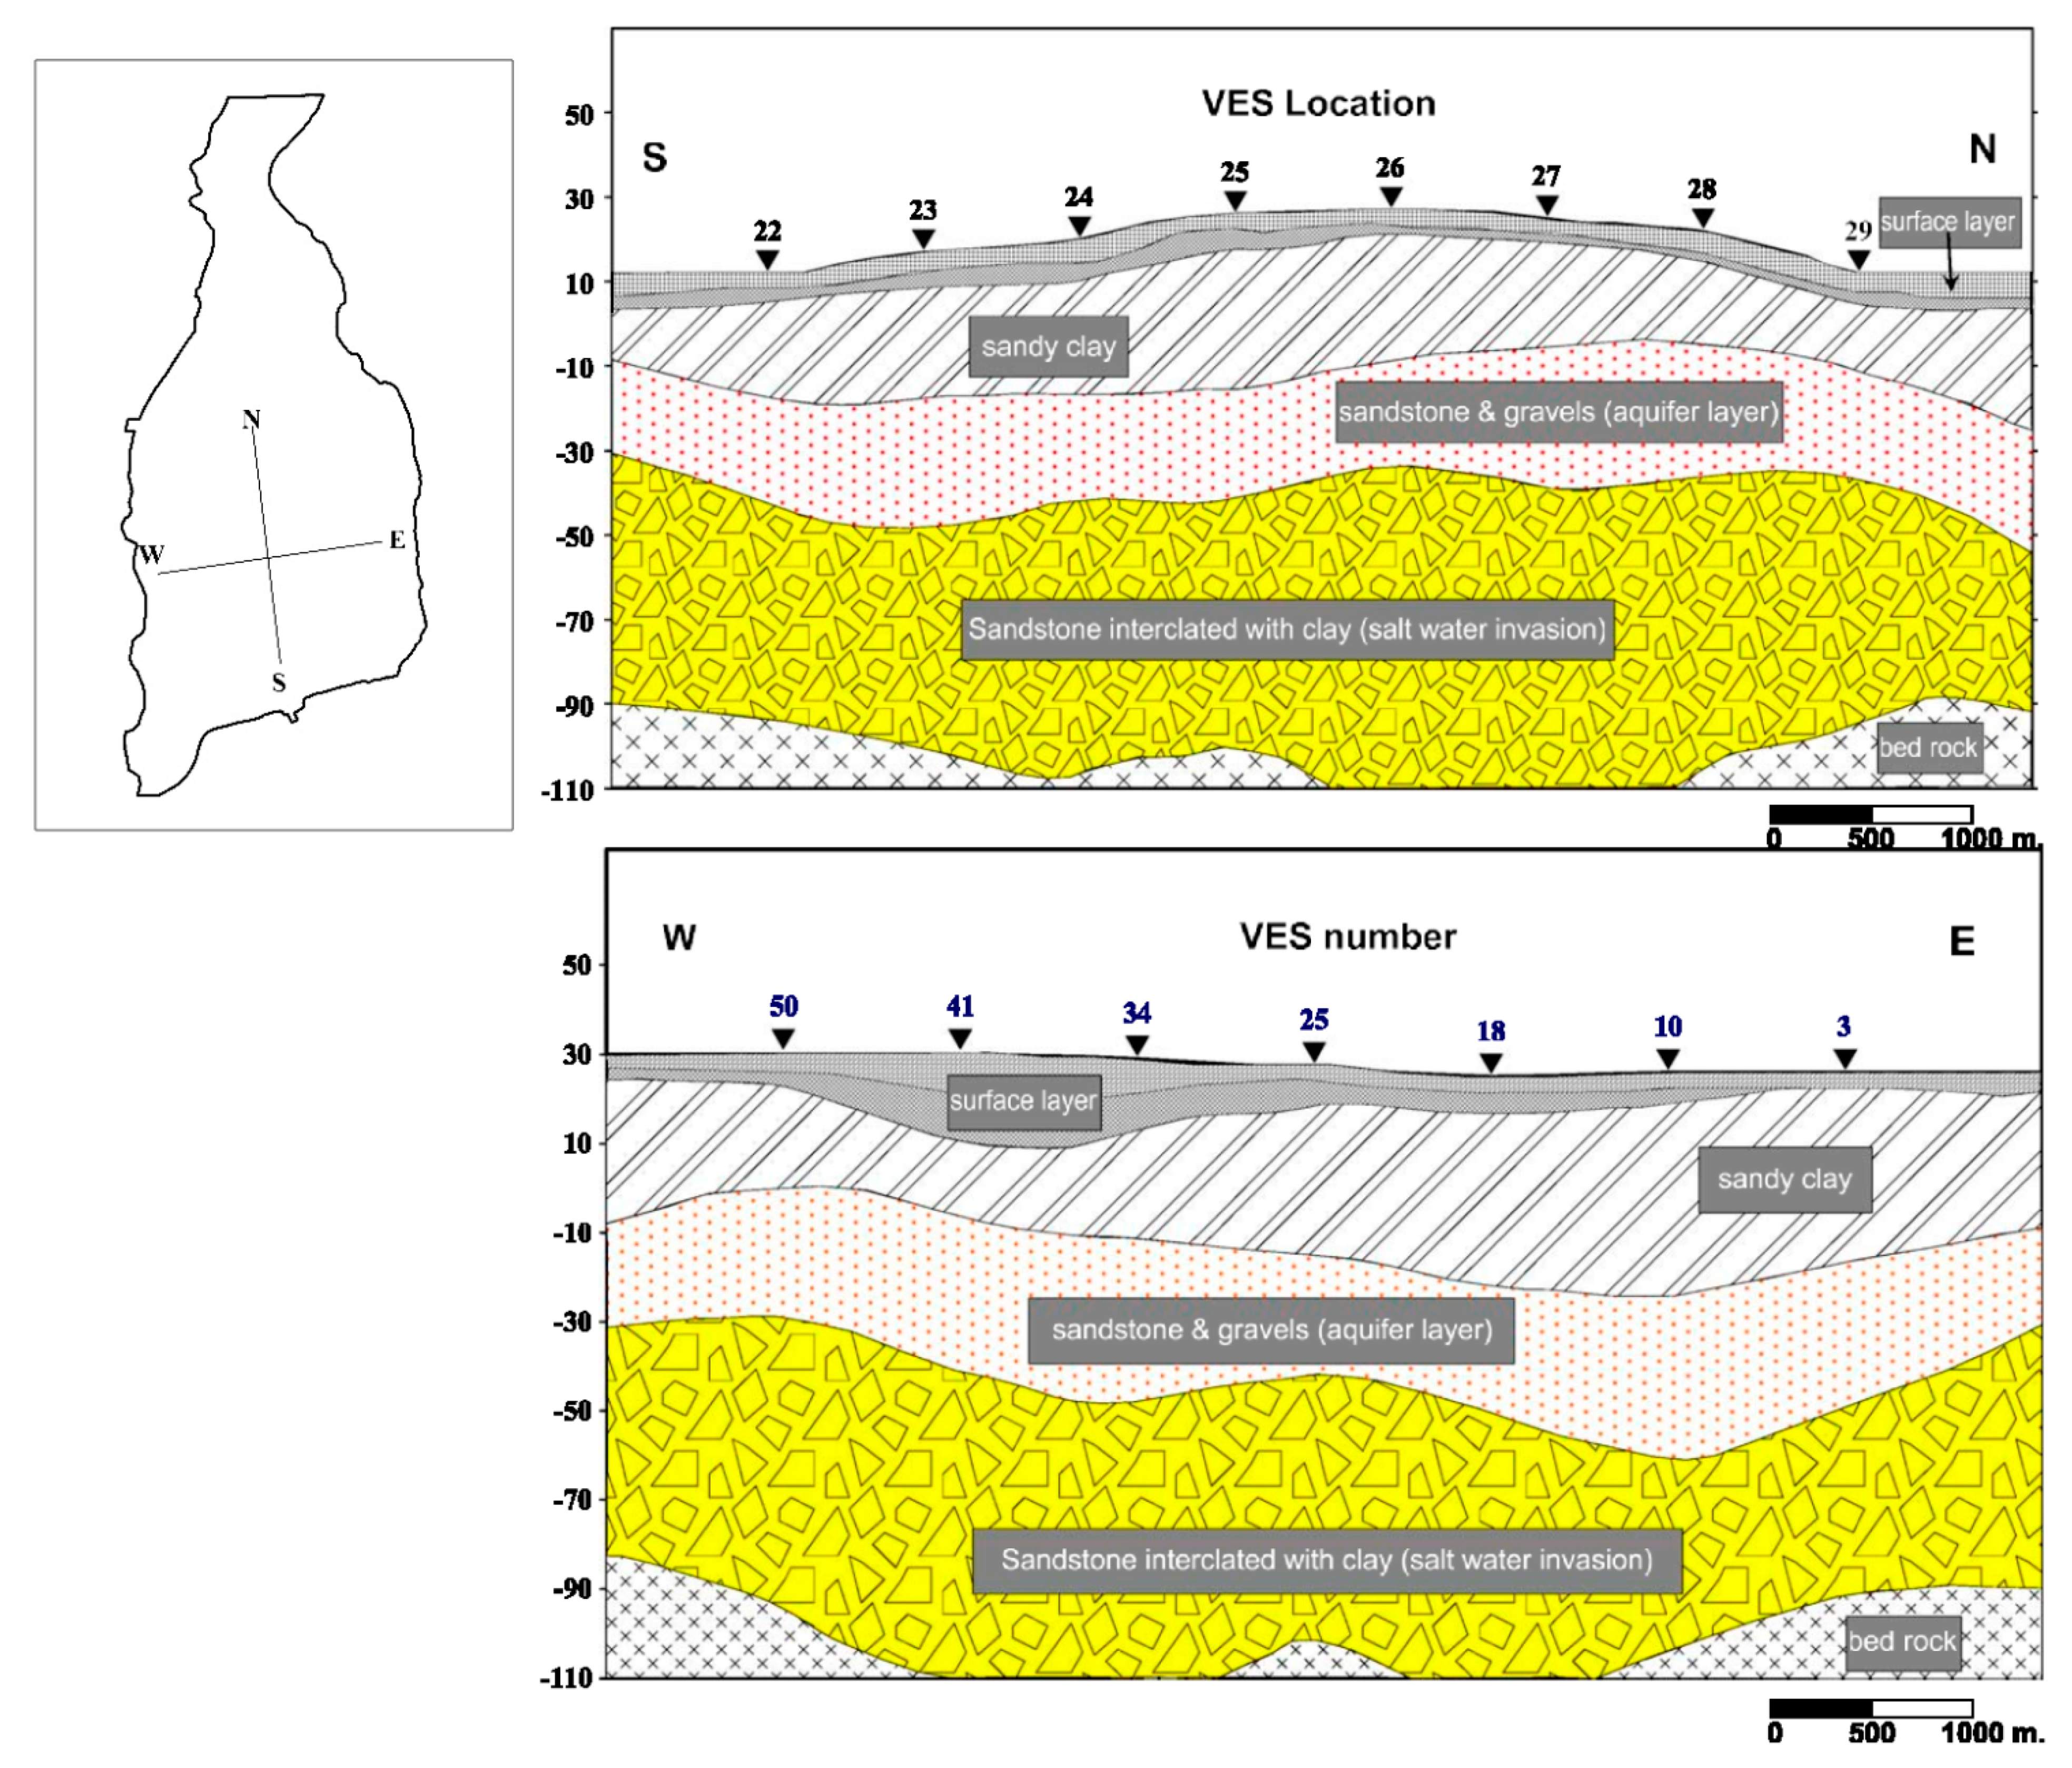
Regarding aquifer geometry and formation,
Figure 2 shows the hydrogeological cross-section and the aquifer thickness. The Nuweiba alluvial fan comprises quaternary fine to coarse sands, gravels, and boulders intercalated by a silty and clayey matrix [
13]. The quaternary deposits form an unconfined heterogeneous water-bearing aquifer. According to Abbas et al. [
12], the aquifer is divided into five layers. The two upper layers consist of fine to coarse alluvial deposits with a thickness lower than 10 m each. The intermediate layer consists of Pleistocene sandy clay with 30 to 45 m thickness. The fourth layer comprises sand and gravel with a thickness ranging from 20 to 40 m. The bottom layer consists of sand with clay intercalation, and is 20 to 50 m thick. A granitic rock basement under-lays the bottom layer.
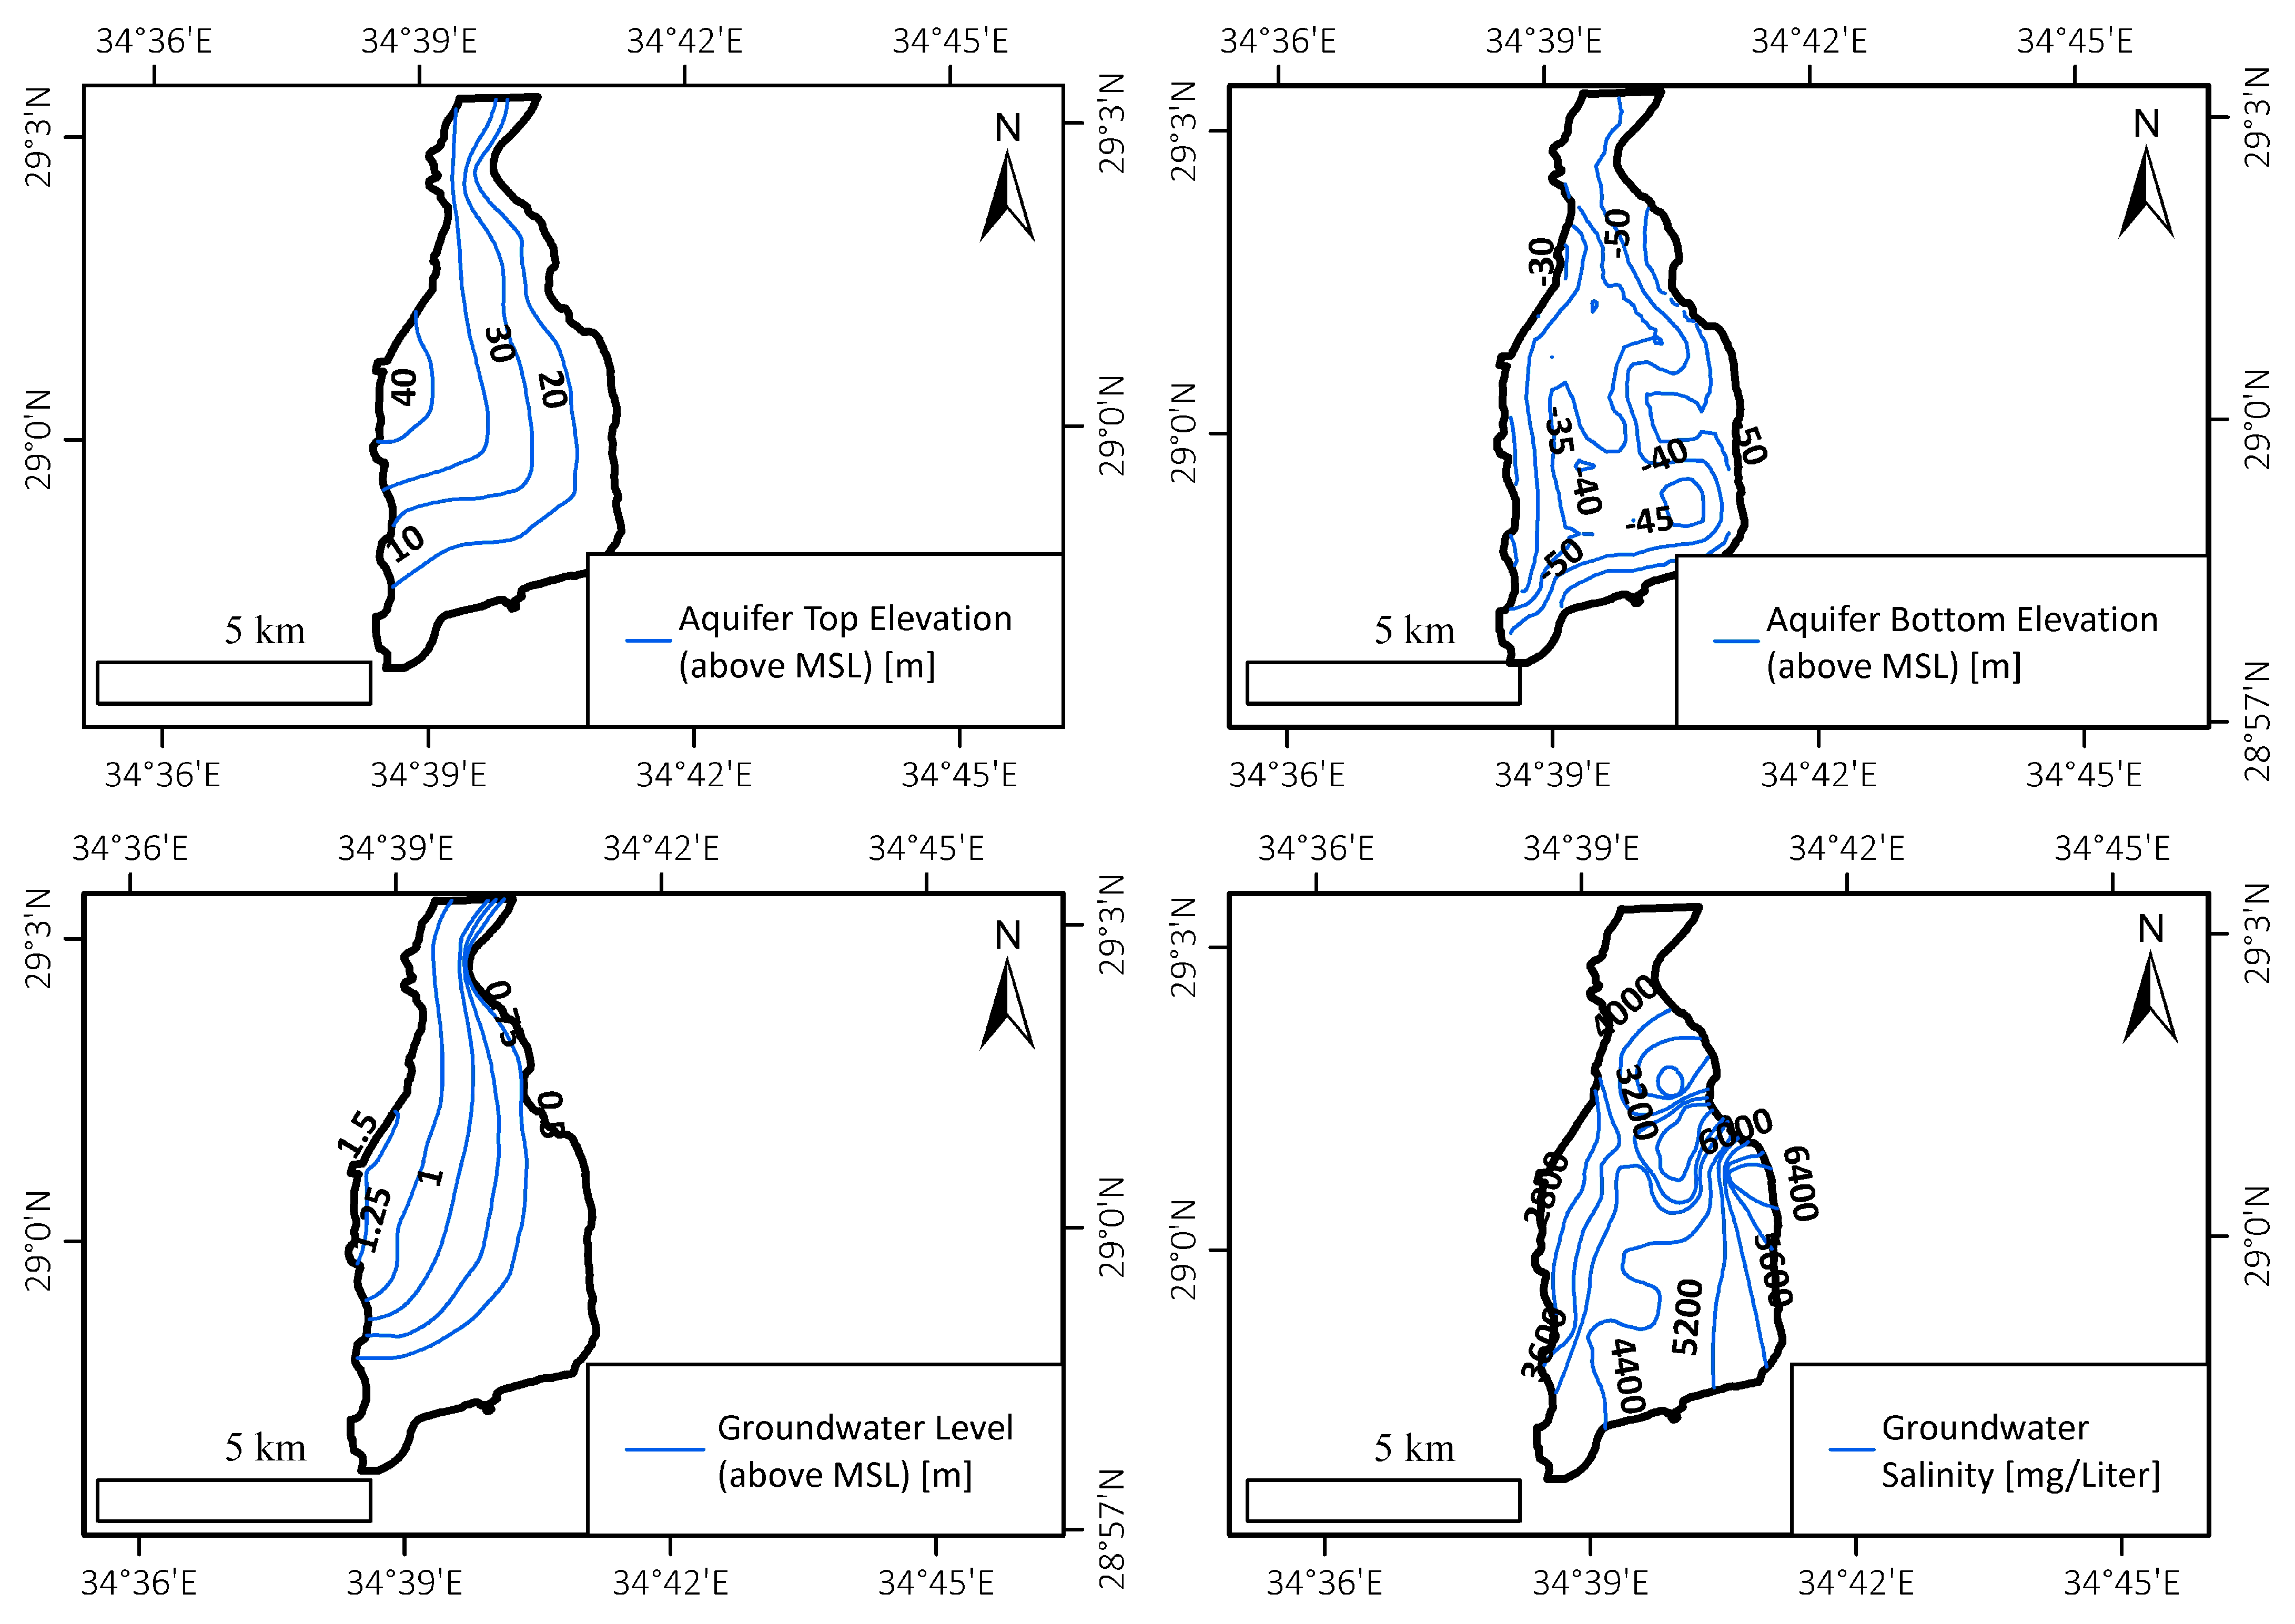
Figure 3 represents the aquifer’s geometry.
Regarding aquifer properties, the saturated hydraulic conductivity was determined by different methods (geo-electrical fieldwork, pumping tests, slug tests, and groundwater flow model calibration). The hydraulic conductivity values were estimated by Khalil [
14] as 54 m/day by interpreting geo-electrical data, and 1 to 12 m/day by Himida [
15] via interpolating the pumping test analysis results. These results were calibrated using groundwater flow models by Eissa et al. [
1] and Salam [
6] as 4 m/day for the three upper layers, 11 m/day for the fourth layer, and as 0.001 for the lowermost layer. Additionally, Himida [
15] calculated the transmissivity parameter such that the value ranged from around 65 to 500 m
2/day.
Regarding the unsaturated zone’s properties, its vertical permeability was measured and interpolated by Himida [
15] by applying infiltration tests at specified points, and this was found to range from approximately 1.75 to 9.18 m/day. Besides this, Eissa et al. [
1] measured the vertical permeability at five different locations, with a geometric mean of 0.19 m/day. The porosity and tortuosity were determined by Khalil [
14] via geo-electrical analysis as 0.3 and 1.348, respectively. The storativity parameter ranges from around 0.0003 to 0.01 according to field pumping tests [
15].
Regarding groundwater recharge and discharge, the aquifer is naturally recharged by rainfall precipitation [
16]. The mean annual recharge volume has been estimated, respectively, by Himida [
15], Eissa et al. [
1], and Eissa et al. [
13] as 1.83, 1.58, and 2.16 Mm
3. In addition, groundwater pumping started in the year 1982 with a pumping rate of 870 m
3/day, and increased slightly from the year 1982 to 1998, reaching a rate of 3900 m
3/day, followed by a slight decrease until the year 2013, reaching a rate of 1400 m
3/day [
13].
Regarding groundwater characteristics, the groundwater table level was measured, respectively, in 1994 and 2013 by Himida [
15] and Eissa et al. [
1]. The groundwater level varies from 0.23 to 1.75 m above MSL (
Figure 3). Himida [
15] calculated the groundwater hydraulic gradient, and found that it varies from 0.00023 to 0.0027, with an arithmetic mean of 0.0015 [
15]. Since the aquifer is classified as a coastal aquifer, the Total Dissolved Solids (TDS) concentration of the groundwater is relatively high if it is compared to the fresh groundwater of the in-land aquifers (higher than 1000 mg/L) (
Figure 3). The TDS concentration was found to range from around 2000 to 8000 mg/L in 1994 [
15], and from about 100 to 14,000 mg/liter in 2009 [
1].
2.2. Data Acquisition and Preparation
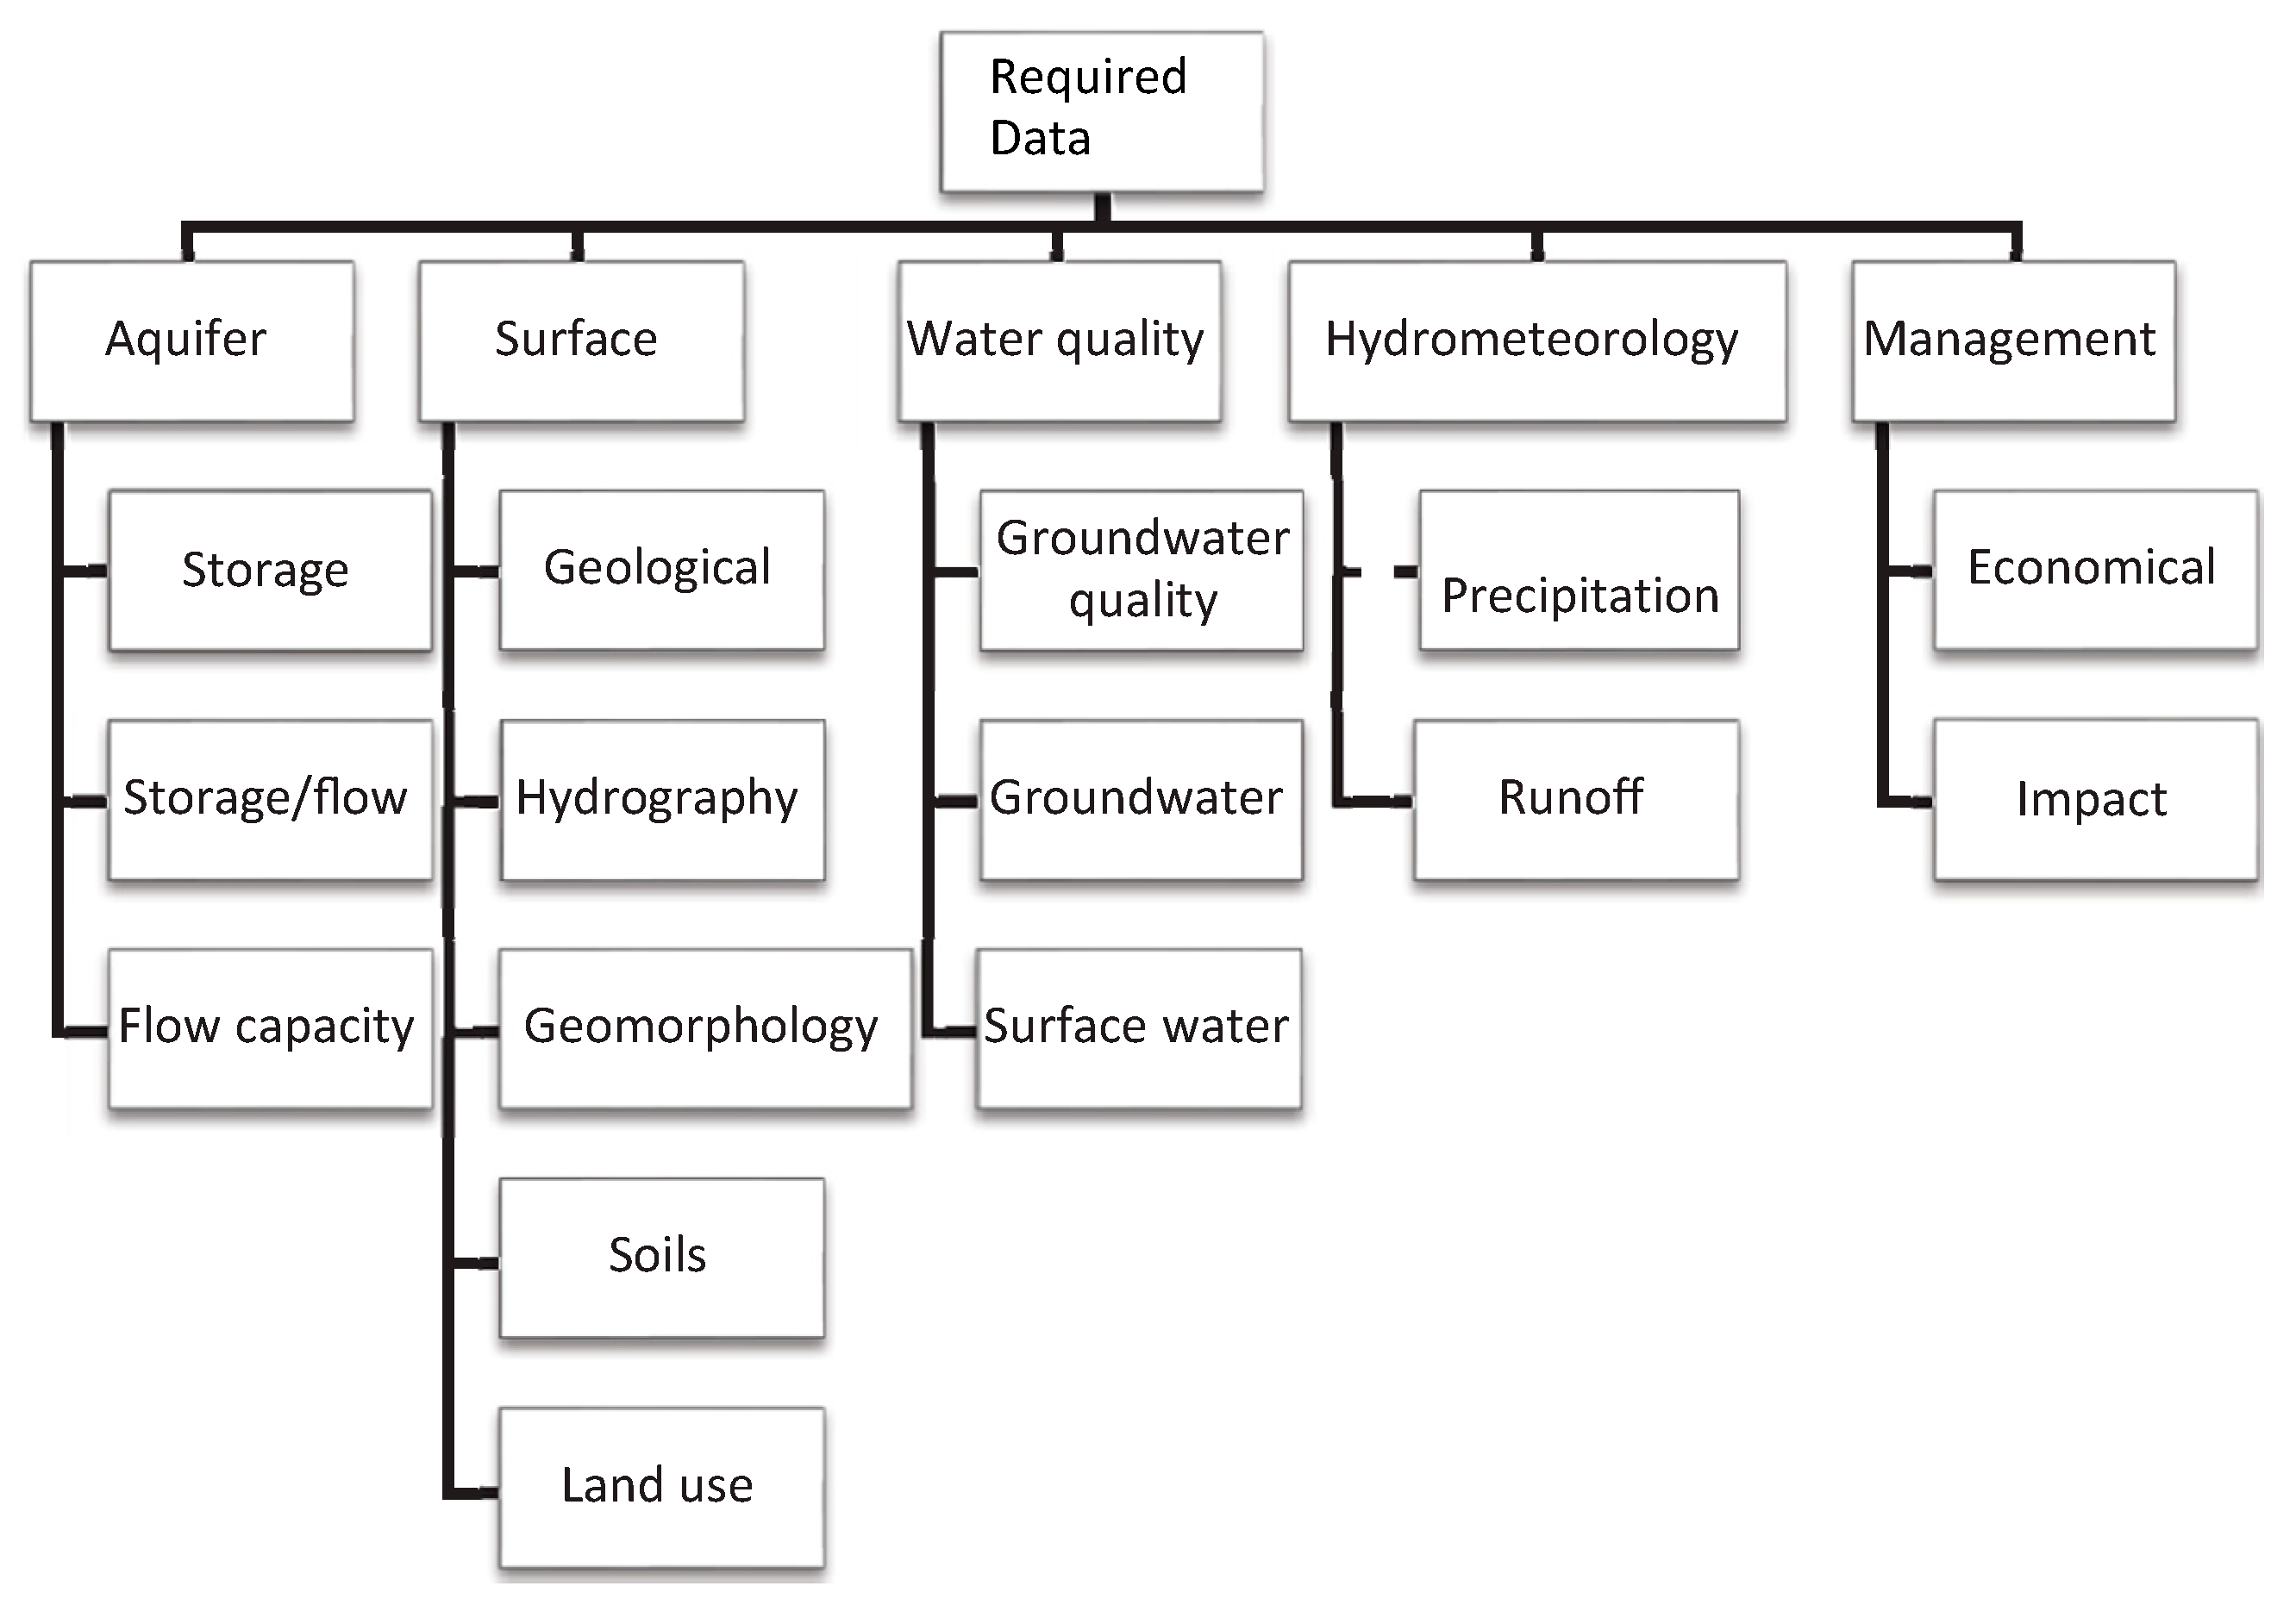
Delineating the MAR sites depends on many factors, such as aquifer hydrogeology, topography, water quality, hydrometeorology, and management (
Figure 4) [
8]. Thus, data related to the aforementioned fields should be acquired. Our data were collected from the previous studies, except surface water quality, flow discharge hydrographs, and environmental impact assessment, due to the lack of data availability.
Regarding the aquifer’s properties, aquifer geometry data were acquired from geophysical fieldwork and analyses conducted by Abbas et al. [
12]. Additionally, aquifer hydrogeology information was collected from Himida [
15] in the form of contoured maps based on field measurements. Himida [
15] mapped the vertical permeability, groundwater table, transmissivity, and storativity. In addition, hydraulic conductivity data were collected from Eissa et al. [
13] and Sallam [
6] by calibrating the groundwater flow model. The groundwater hydraulic gradient was processed by ArcGIS 10.7.1 (developed by ESRI (Environmental Systems Research Institute) located in Redlands, California, USA) by using the groundwater table as input data.
Surface topography was prepared by downloading the Digital Elevation Model (DEM) raster file of type Shuttle Radar Topography Mission (SRTM) from the surface elevation data of Consortium for Spatial Information (CGIAR-CSI) geospatial community with a resolution of 30 m. Additionally, the spatial data (surface slope, distance from the shore) were processed by analyzing the acquired DEM data using ArcGIS10.7.1 software. In addition, LULC were classified by downloading Landsat 7 images from USGS, followed by image processing using ArcGIS 10.7.1 software.
The groundwater quality data were acquired from Himida [
15] and Eissa et al. [
1], taking into account the spatial variability. Regarding hydro-meteorological data, precipitation and runoff data were obtained from Al Zayed et al. [
5] and Khalil [
14], whereas the groundwater natural recharge was estimated by Himida [
15], Eissa et al. [
1], and Eissa et al. [
13]. However, the hydro-meteorological data are not spatially distributed in the study area. Thus, hydro-meteorological data were excluded from the gathered data.
Since the groundwater level and salinity were last measured in the year 2009, a field trip was performed on 24 July and 25 July 2020 (
Appendix A). The main objective of the trip was to check the data collected from the previous studies. Additionally, it was necessary to investigate the current land use and the main water supply in the study area.
2.3. GIS-MCDA Method Set-Up
To apply a MAR system at a specific site, feasibility studies should be carefully conducted to check the suitable elements required for a successful MAR installation. The elements include water source for recharge (surface, storm, reclaimed, potable, desalinated), aquifer for storing and recovering water (geological strata type, hydrogeological characteristics, groundwater hydro-chemistry characteristics, aquifer mineralogy), and a suitable site location for installing MAR (hydrogeology, topography, soil type, land use, climate).
RS and GIS tools have been widely used in the field of hydrogeology. These tools are powerful for use in acquiring, representing, and analyzing thematic layers characterized by spatial variability (topography, hydrogeology, hydro-chemistry, etc.) [
16]. Researchers have created potential maps to manage groundwater by applying the aforementioned tools to give the necessary information to decision-makers in order to achieve the following objectives [
16]: (i) exploring and assessing the groundwater resources, (ii) delineating artificial recharge sites, (iii) assessing the groundwater’s vulnerability to pollution, (iv) estimating natural recharge distribution, (v) analyzing and monitoring hydrogeological properties, (vi) modeling the groundwater flow and pollution.
Therefore, potential maps could be utilized as a tool to delineate the most feasible MAR sites for the decision-makers. Different decision-making methods have been applied to create potential maps: statistical methods [
17,
18,
19], machine learning [
20,
21,
22], multi-criteria decision analysis [
9,
10,
23] and groundwater numerical modeling [
24].
Most researchers have combined the two methods to delineate feasible MAR sites: GIS and Multi-Criteria Decision Analysis (MCDA). The combination of the aforementioned methods was firstly introduced by Malczewski [
25] as GIS-MCDA. It is defined as a group of methods applied by overlaying and aggregating the spatial thematic layers to provide the necessary information for the decision-making process [
26]. Despite the presence of several method combinations (as mentioned above) for creating potential MAR site location maps, GIS-MCDA is the most common method among researchers [
8].
Most studies applied a specific methodology to select the best MAR sites [
27,
28,
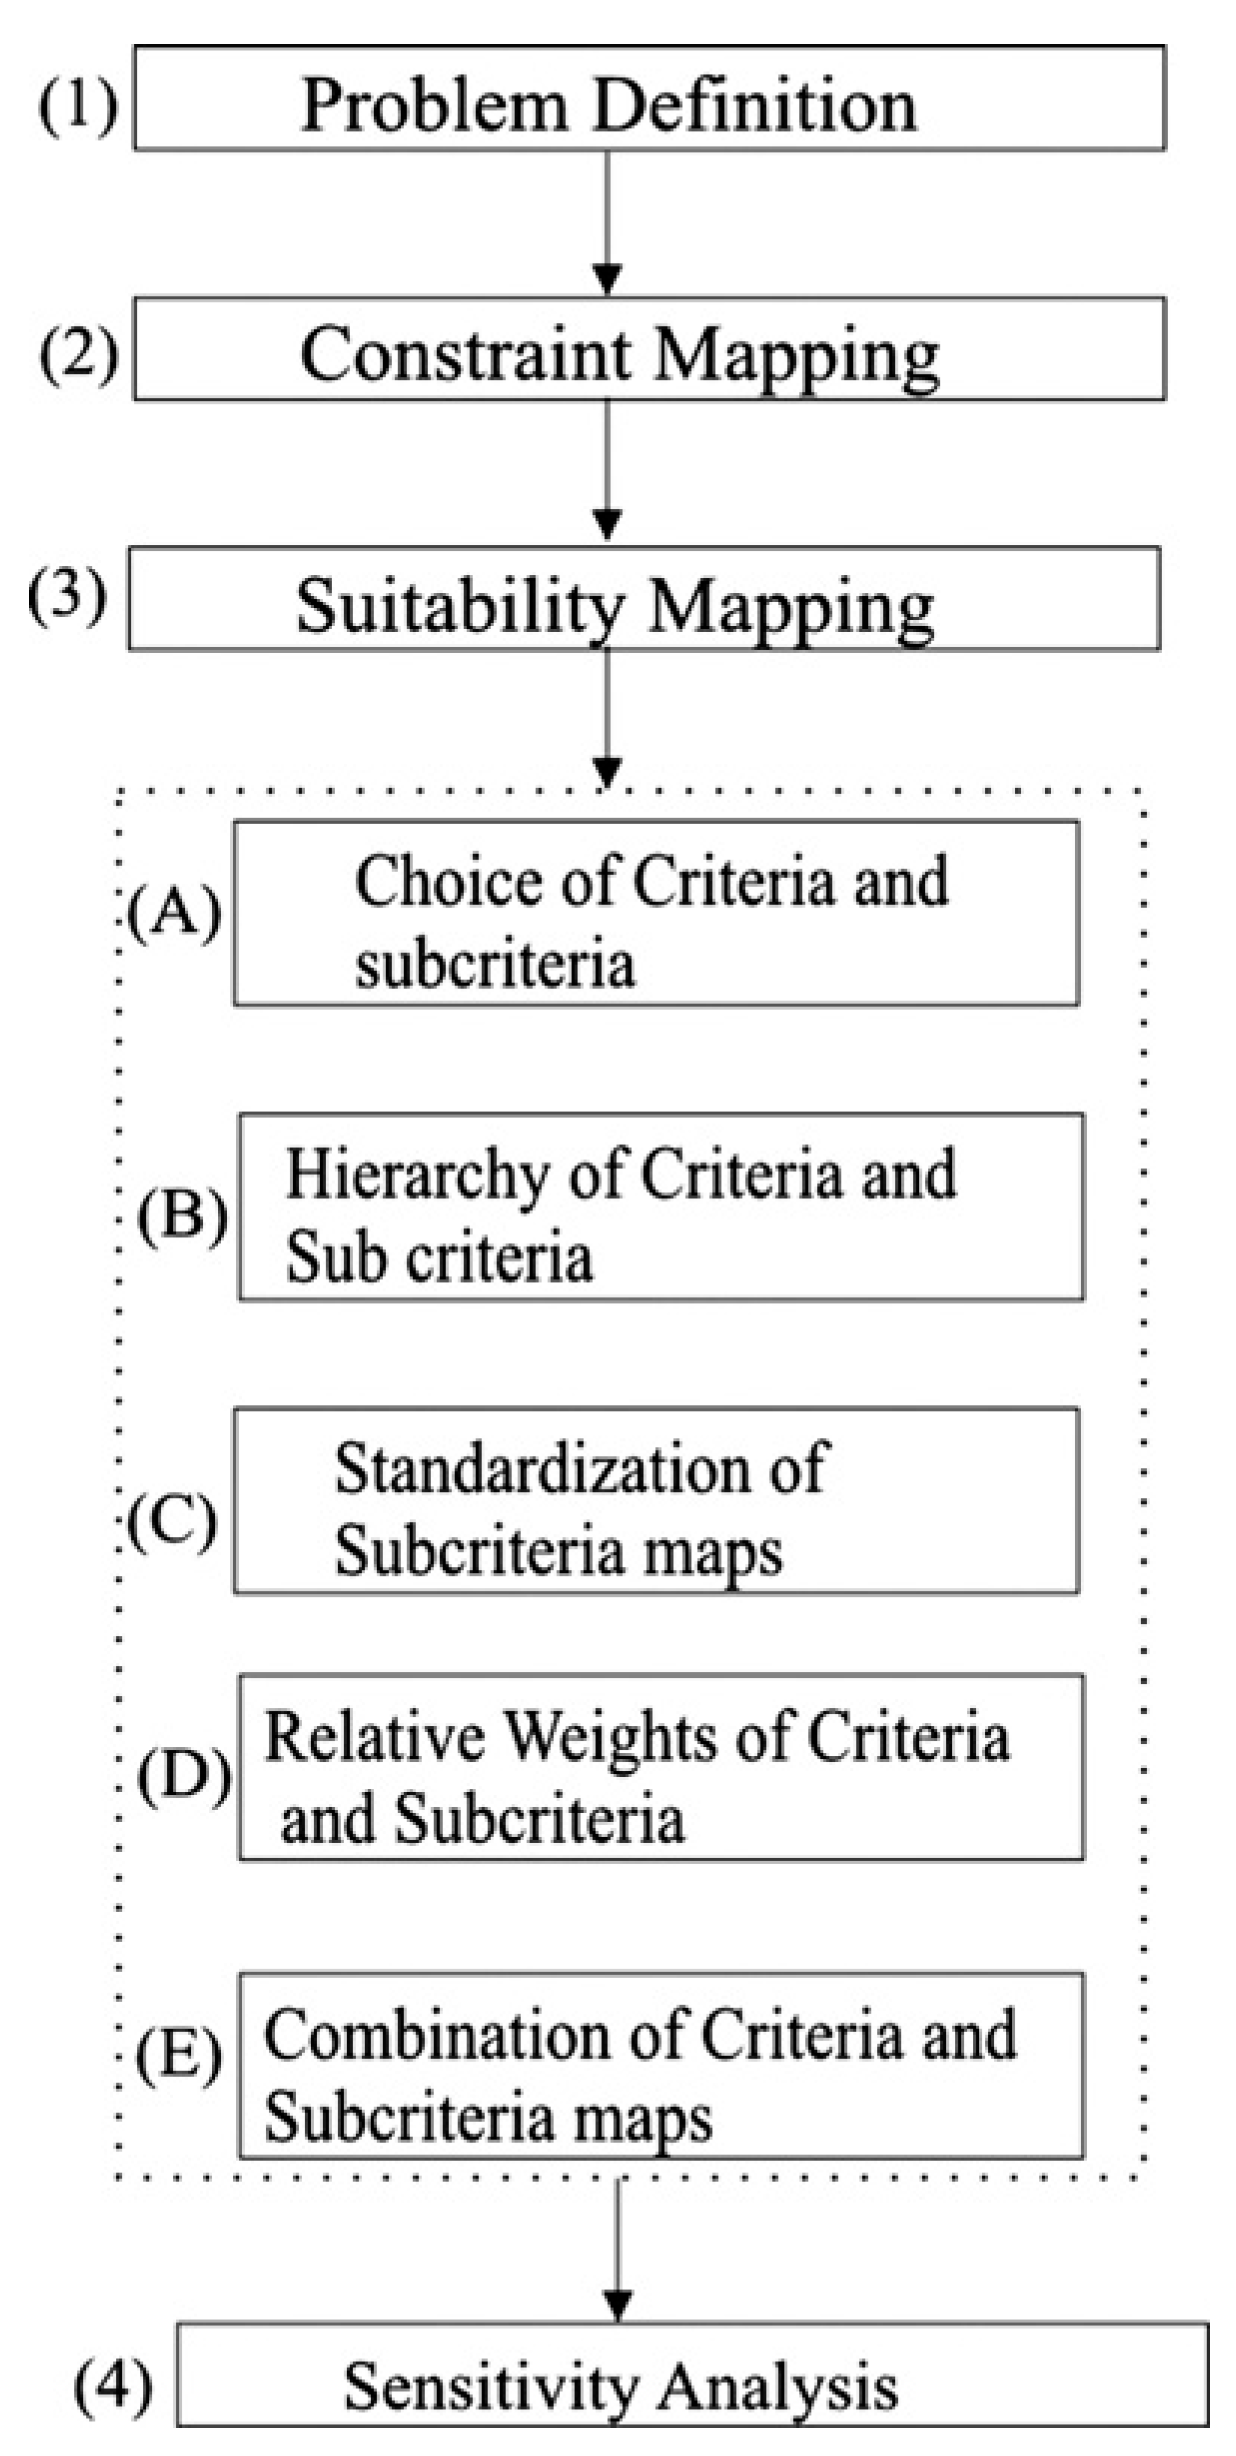
29]. However, in this study, the locations of the best sites are delineated by classifying the study area into different zones according to site feasibility. This study adopted a GIS-based holistic approach. This approach was introduced by [
9] and encompasses the following steps (
Figure 5): (i) problem definition (checking the elements and specifying the methods), (ii) constraint mapping (screening out unfeasible sites), (iii) suitability mapping (calculating overall score by combining criteria via a weighting factor), (iv) sensitivity analysis (checking the robustness of the weighting factors).
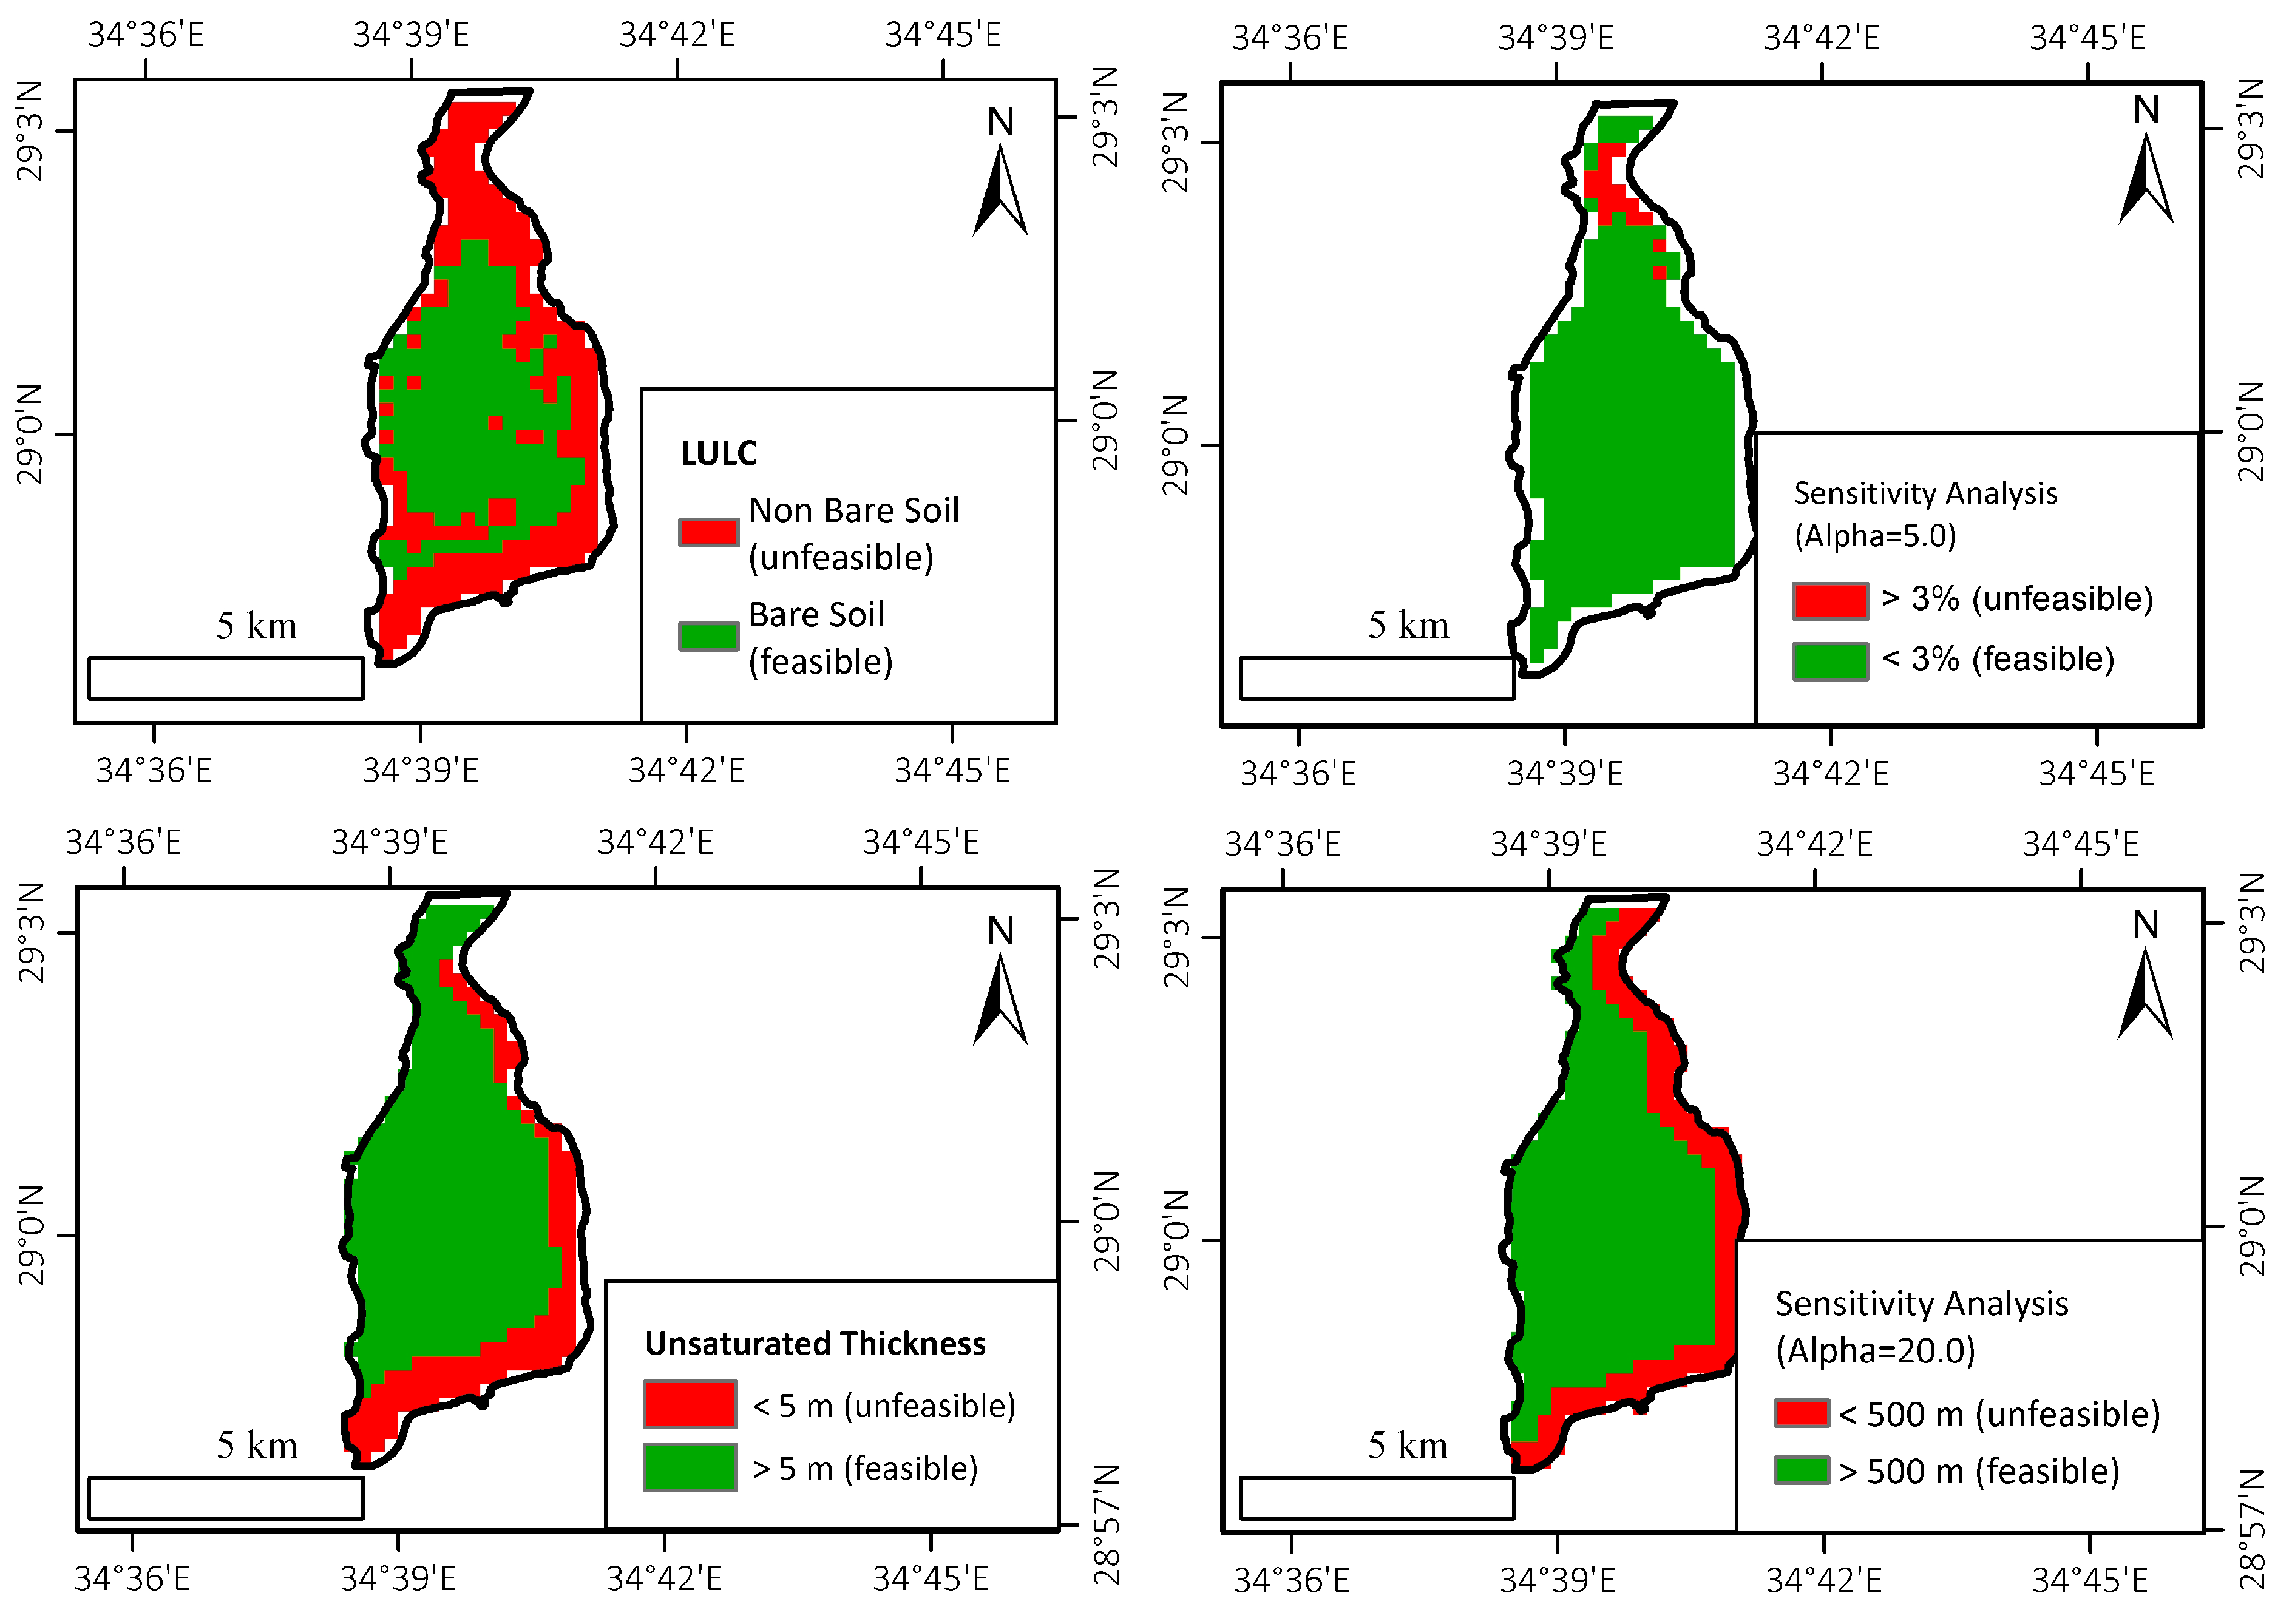
2.3.1. Constraint Mapping
In this study, an intersection operator was chosen for this process. The criterion value of the intersection operator is unity and zero. An intersection operator is practiced by assigning a unity value when the criteria satisfy the logical conditions, and vice versa [
9].
Before applying this method, the constraint criteria were validated using the criteria reviewed by Sallwey et al. [
8] (
Table 1). Afterwards, the chosen criteria were converted from contoured maps to thematic raster layers with a 250 m pixel size using ArcGIS10.7.1 software. The pixel size was assigned based on grain size classification (medium sand in this study), as represented by Lagacherie et al. [
30].
Appendix B shows the criterion of thematic layers for the constraint mapping.
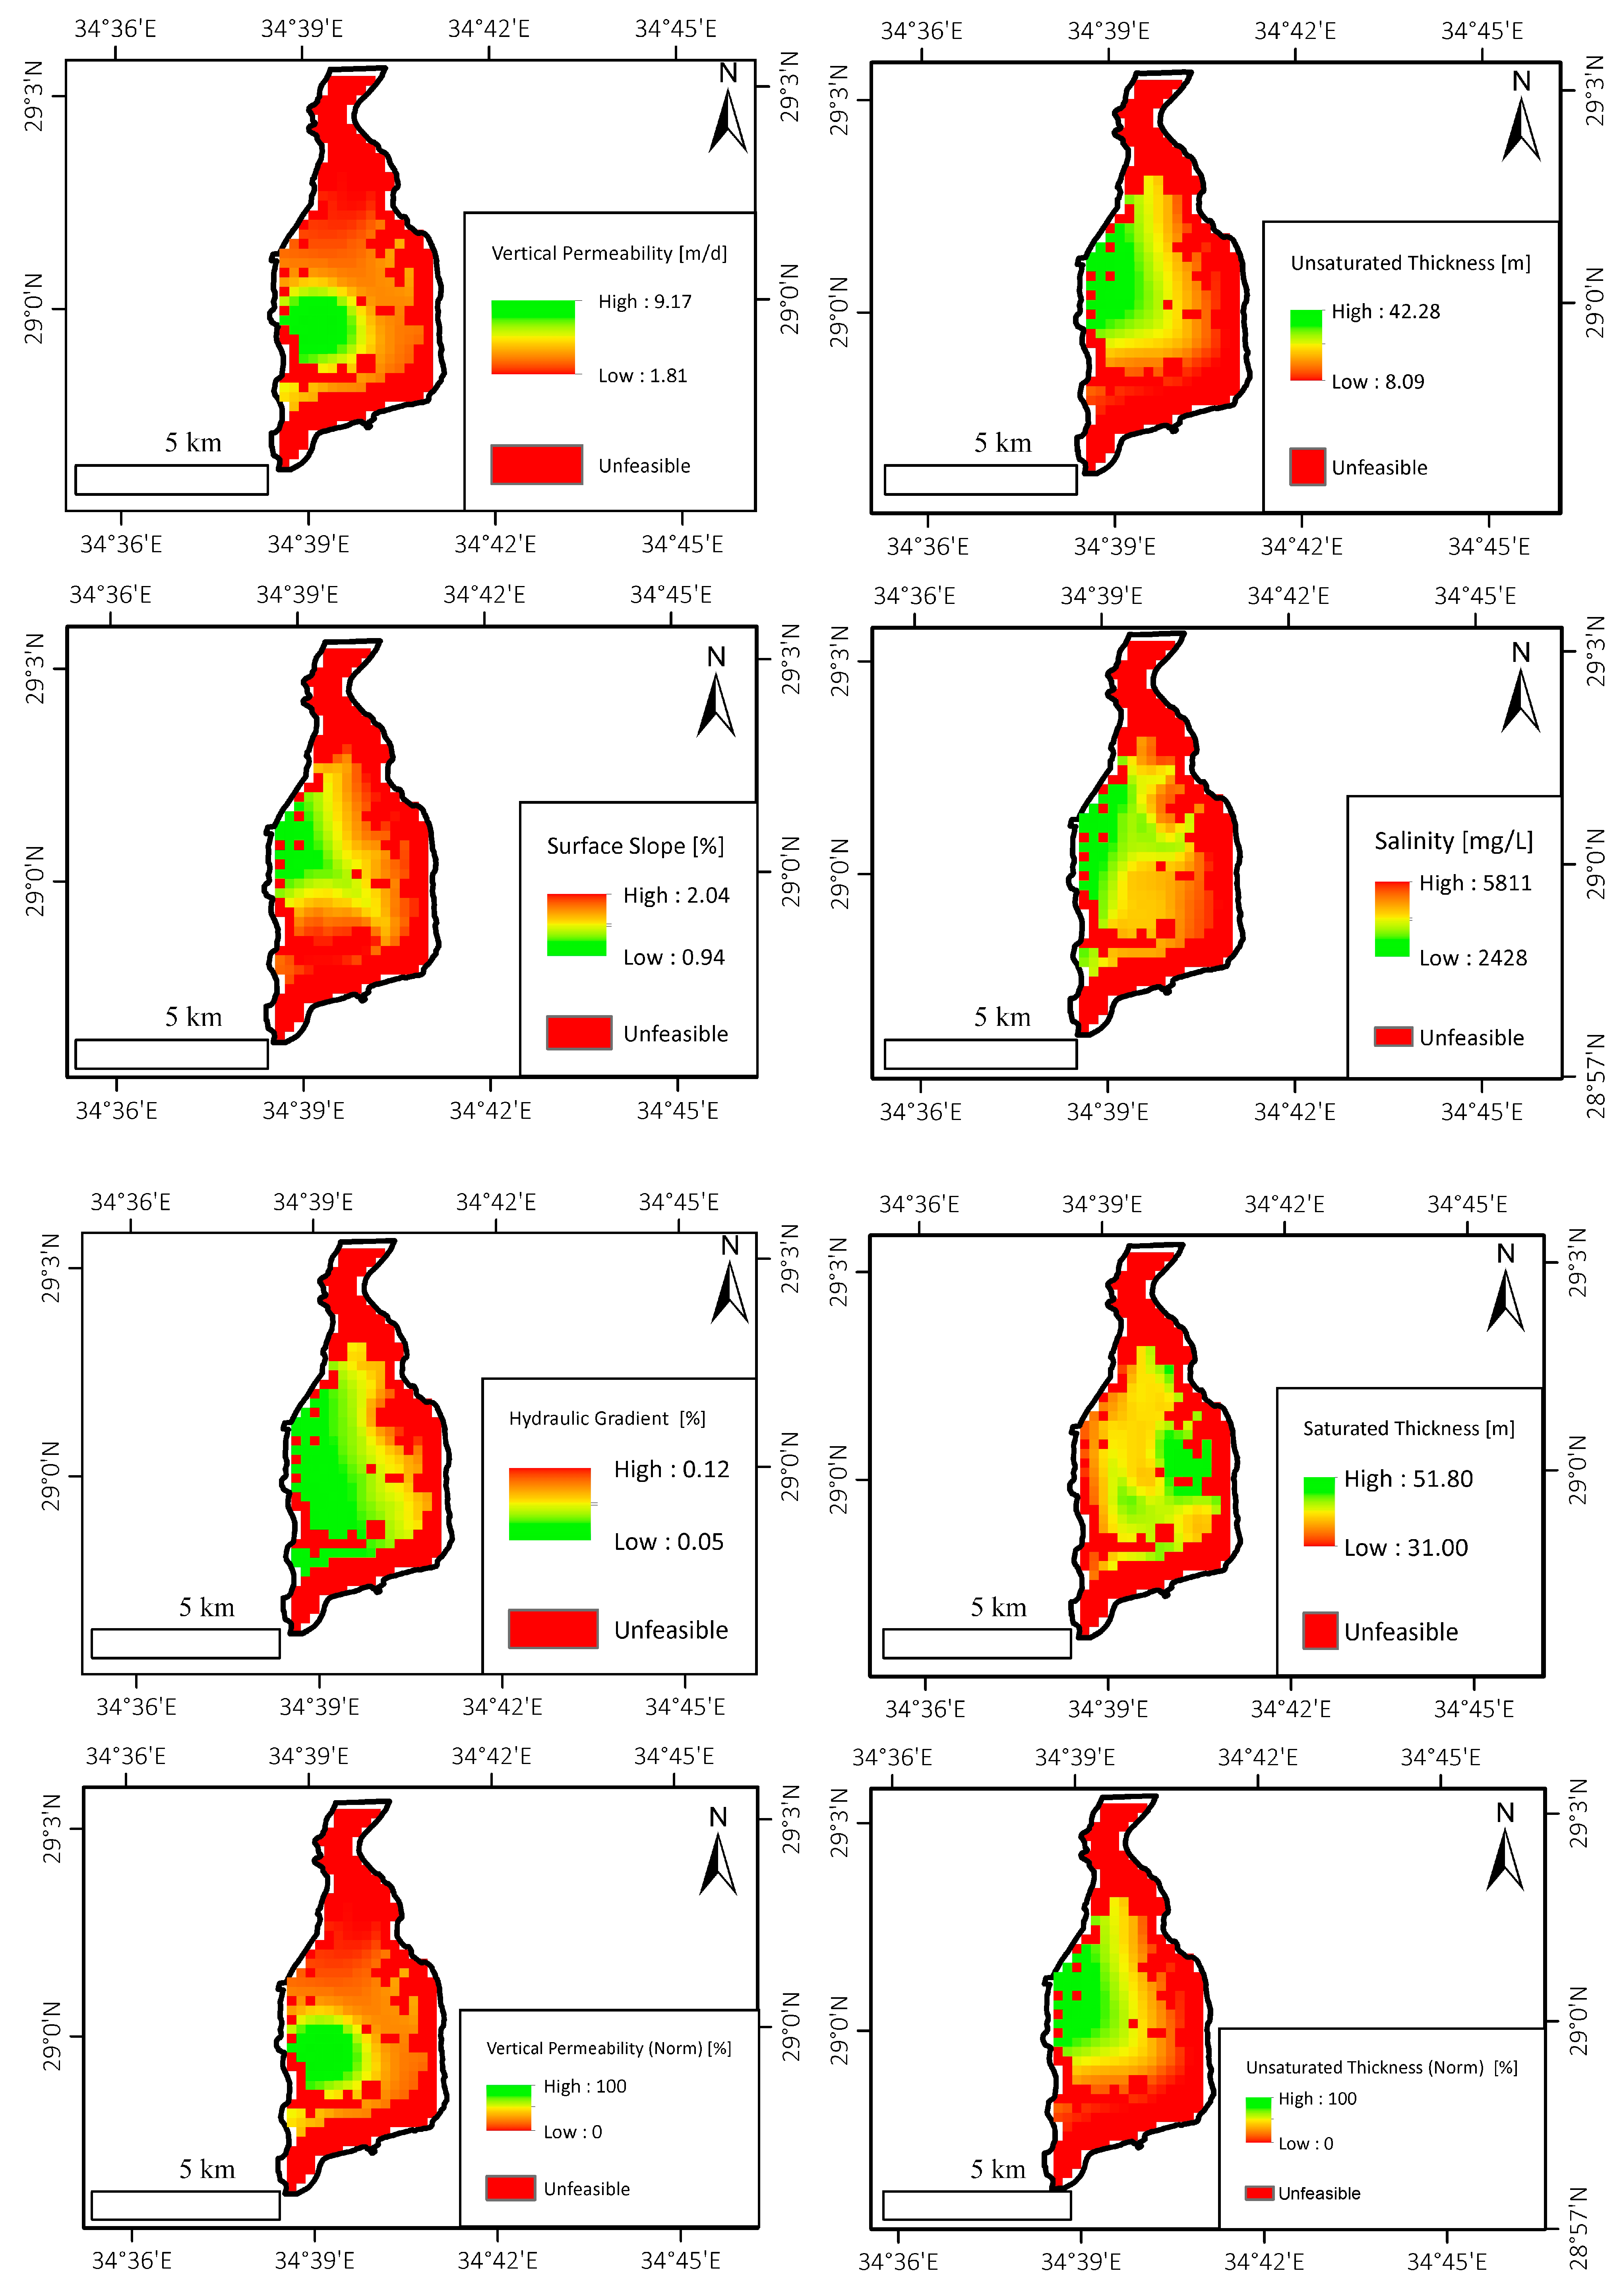
2.3.2. Suitability Mapping
The primary function of suitability mapping is classifying the potential for installing the site at a specific location. During this process, weights are assigned to the criteria and combined to get a score for each area [
26]. The assigned weights are estimated by a technical expert or a decision-maker based on field experience [
8]. Suitability mapping comprises four steps: (1) choice of criteria, (2) hierarchy of criteria, (3) standardization of criteria, (4) relative weights of criteria and (5) combination of criteria.
Choice of Criteria
Choosing the criteria depends on the problem statement and site conditions [
8]. The more complex the problem is, the more criteria are chosen. To determine the criteria to be selected, Sallwey et al. [
8] reviewed previous studies to collect all possible criteria that could be applied for this process. We screened out the criteria to choose the most suitable ones for the problem and the case study (
Table 2).
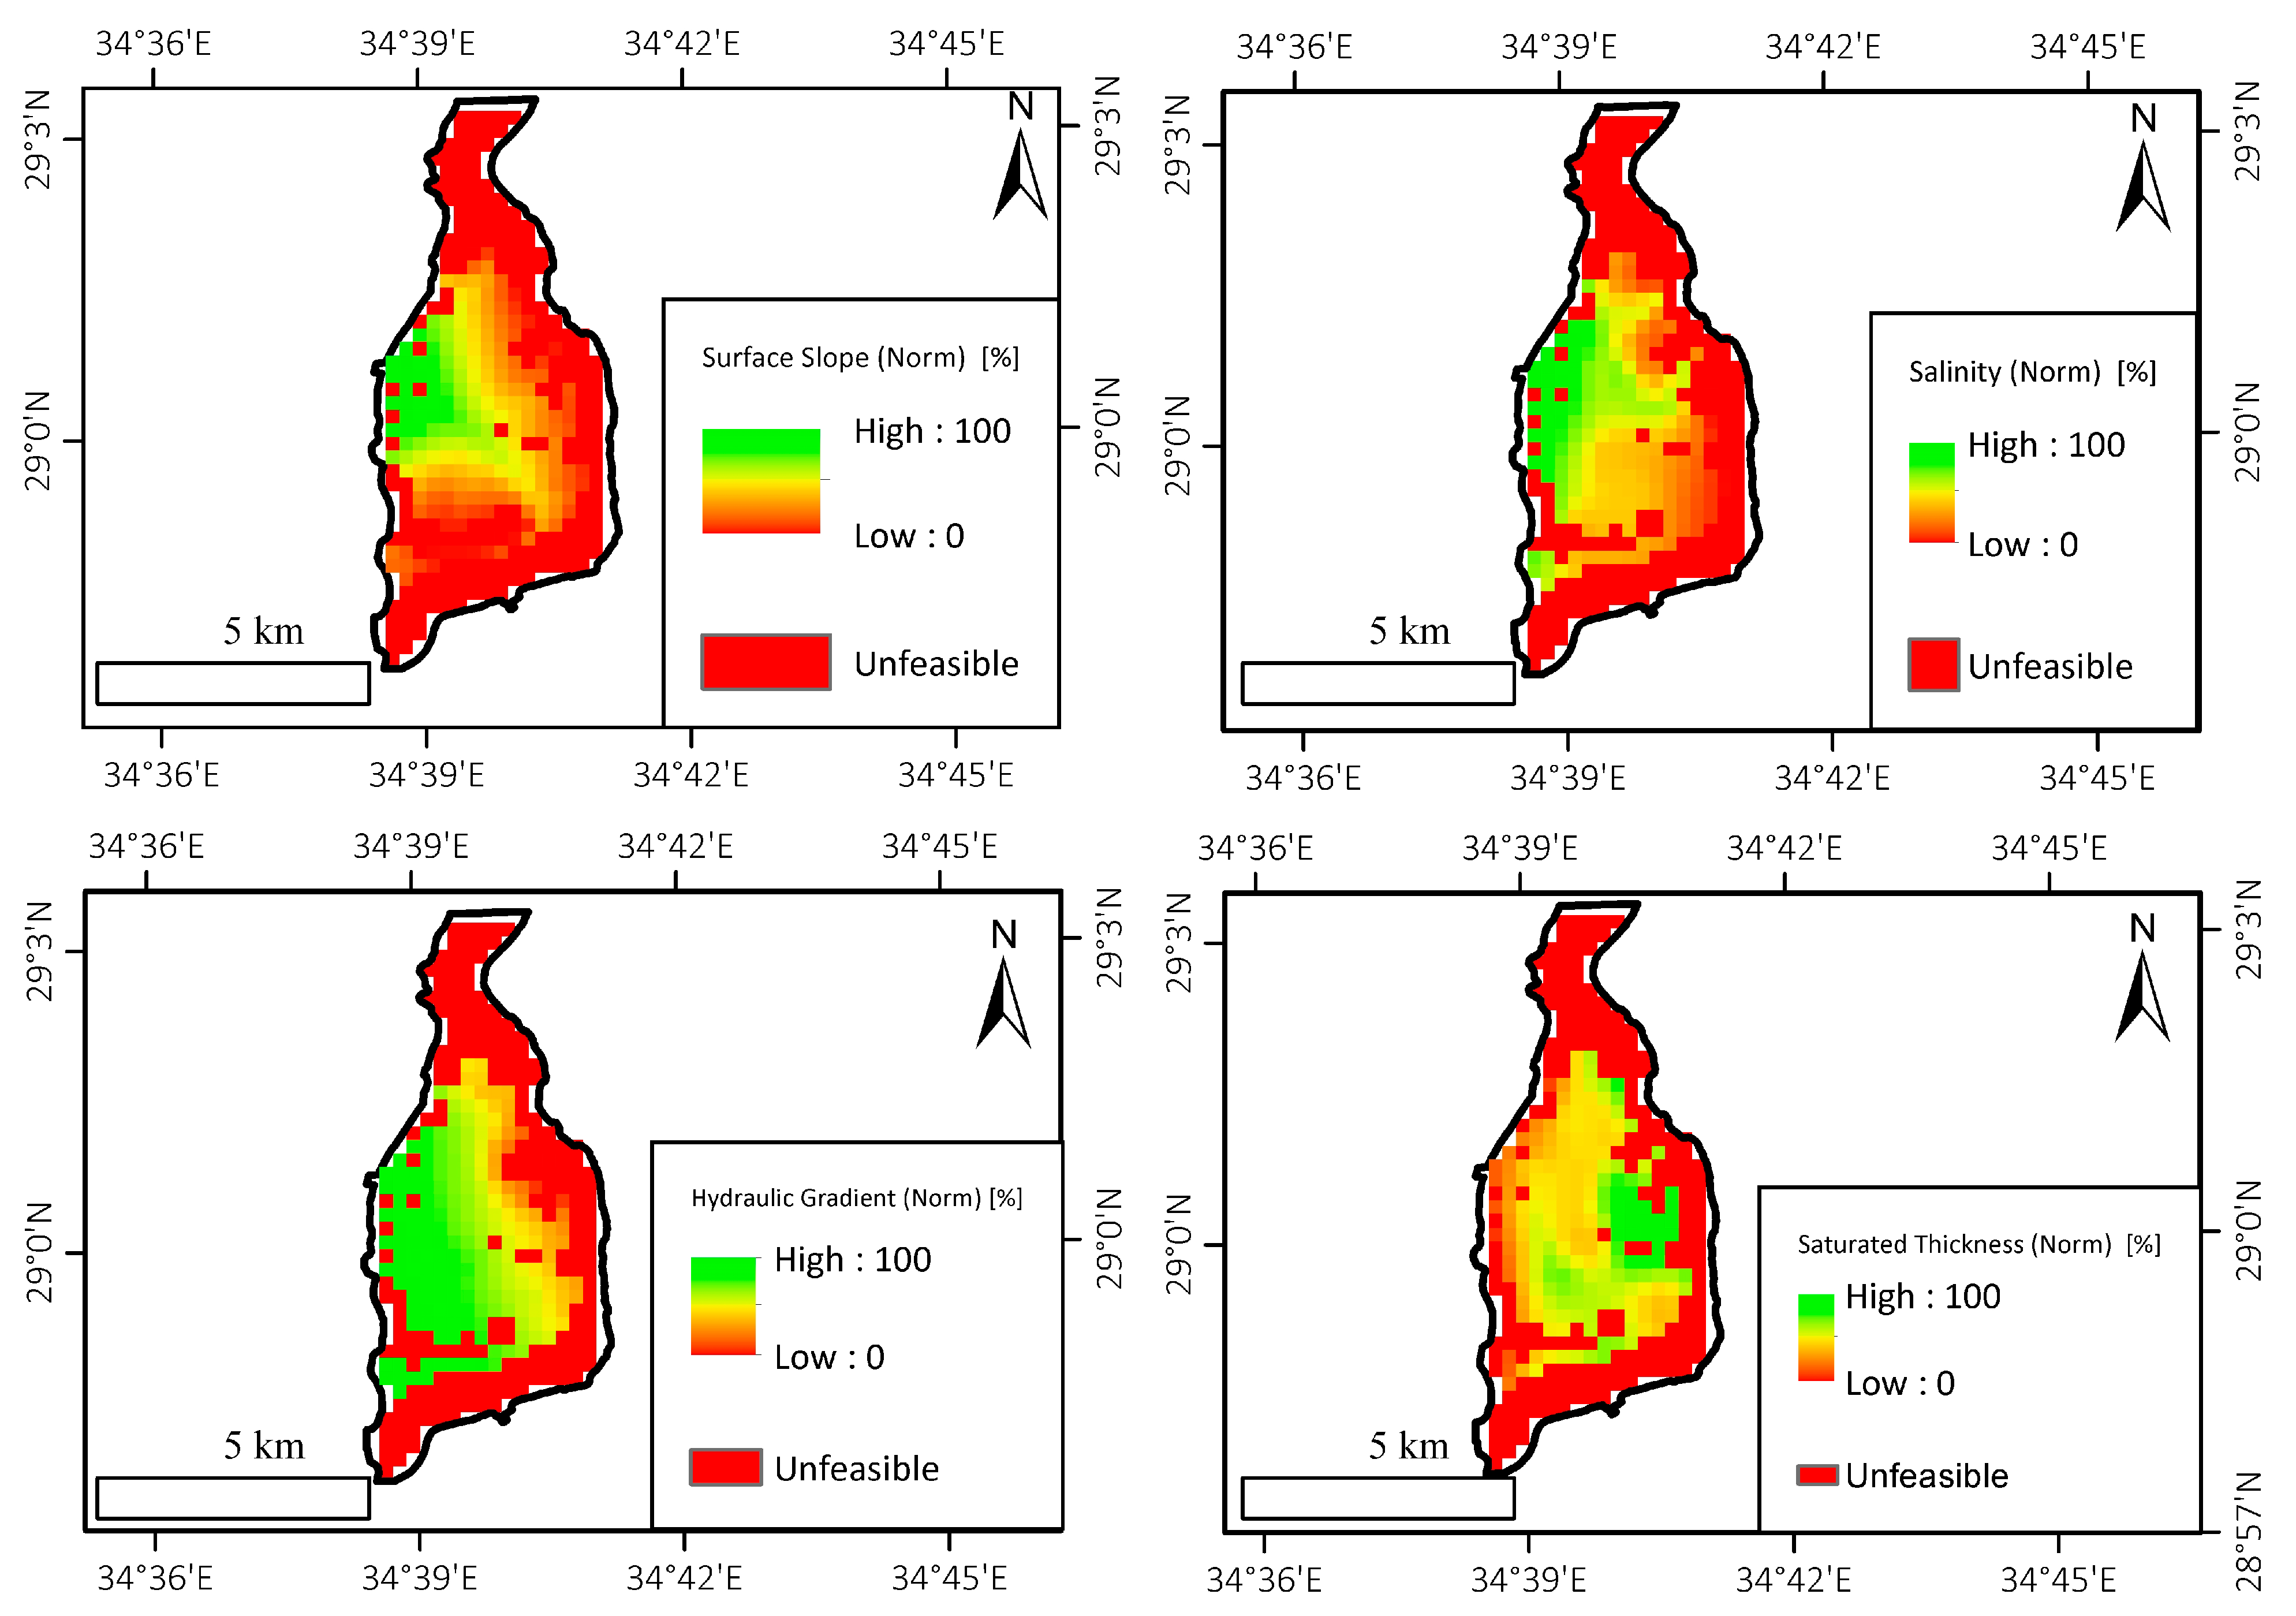
Appendix B shows the chosen criterion thematic layers for suitability mapping.
Hierarchy of the Criteria
After selecting the criteria, the criteria should be divided into three groups in a hierarchical order. Most of the previous studies adopted the following hierarchy according to the priority of the following criteria: (1) aquifer hydrogeology (unsaturated thickness and vertical permeability), (2) topography (surface slope) and groundwater quality (salinity), and (3) aquifer hydrogeology (saturated thickness and hydraulic gradient).
Standardization of Criteria
To combine the criteria for suitability mapping, the criterion value should be converted to a uniform scale. The method is known as standardization. Standardization is applied by different methods: linear and step functions. In this study, the linear method was practiced. The results range from 0% (assigned for the lowest suitable criterion value) to 100% (assigned for the highest suitable criterion value).
Appendix B shows the criterion thematic layers after standardization.
Relative Weights of the Criteria
Relative weights of the criteria were conducted by applying the Analytical Hierarchy Process (AHP) using a pair-wise matrix. AHP was used because it is the most common method in the literature. The matrix was calculated based on the proposal assigned by Saaty [
31], as shown in Equations (1) and (2) [
21]. Additionally, a consistency check has been performed to verify the assigned relative weights.
where
A is the pair comparison matrix, and
is the scale of importance determined by an expert [
25].
where
W is the vector of weighting factors
w1,
w2,…..
wn,
is the normalized scale of importance determined by an expert, and
N is the number of the criteria [
25].
Combination of Criteria
After assigning weighting and standardizing processes, the overall score is calculated by combining the weighting factors. Weighted Linear Combination (WLC) and weighted average methods were chosen for combining the thematic layers. WLC is an overlay-weighted method applied in most studies before selecting the most suitable MAR site location [
27].
2.3.3. Sensitivity Analysis
Sensitivity analysis was conducted to check the results’ robustness and determine the uncertainty in the hierarchy and the assignment of relative importance [
31]. Ordered Weighted Averaging (OWA) was utilized for the analysis, as OWA is characterized by the presence of a fuzzy linguistic quantifier, which is capable of manipulating the weighting factor. OWA was first proposed by Yager [
32] and can be calculated using Equation (3).
Table 3 represents the weighting values of weighted average, WLC and the sensitivity analysis.
where
is the weighted factor for the criterion value
i,
is the criteria weight reordered according to
, and
is the parameter linguistic quantifier.
equals 0 when at least one of the criteria is satisfied, resulting in no trade-off, whereas
= 1 corresponds to WLC. If
= ∞, then most of the criteria are satisfied, resulting in no trade [
32].
3. Results
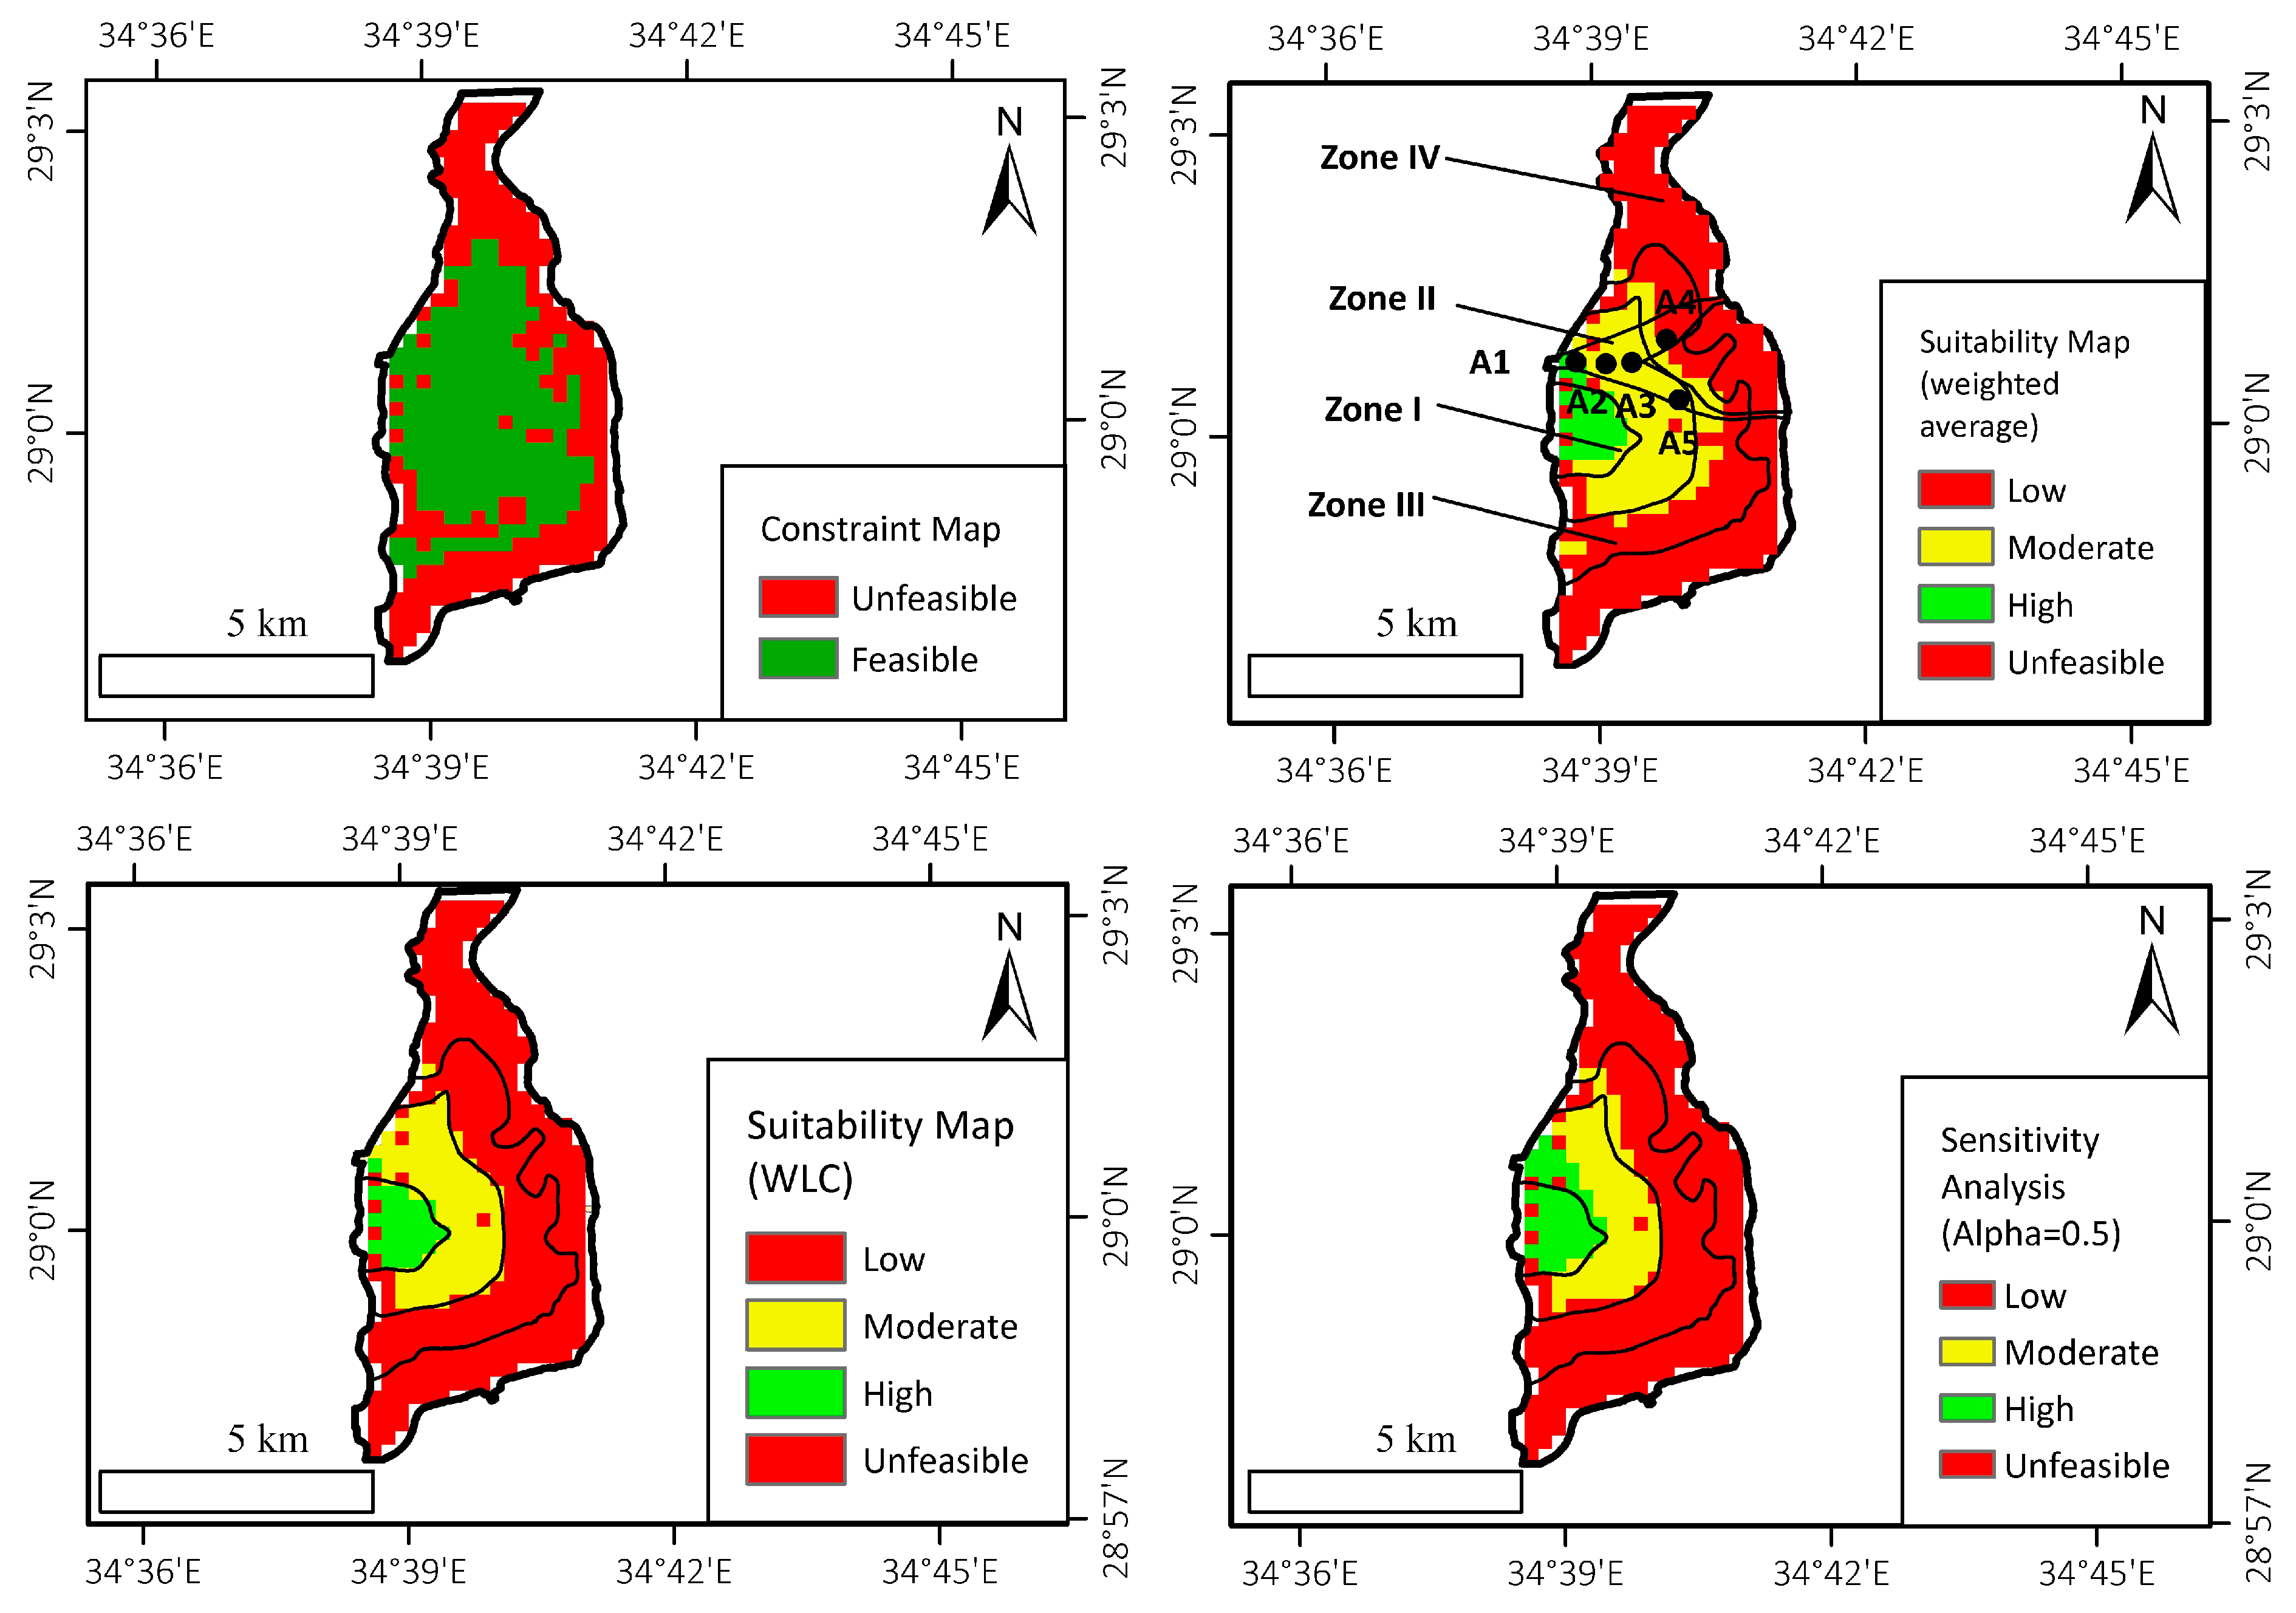
Constraint mapping, suitability mapping and sensitivity analysis were performed (
Figure 6). Suitability mapping was undertaken using two methods: WLC and weighted averaging. High suitability scores indicate high potential for installing MAR and vice versa. WLC involves applying the AHP hierarchy according to its priority based on field experience. Regarding the WLC map, the overall suitability scores are 6.34% (high potential MAR sites), 20.73% (moderate potential MAR site), and 24% (low potential MAR site). The most suitable locations are situated in the western portion of the study area near the ephemeral stream outlet. The most suitable locations are zoned (Zone I). They are characterized by good hydrogeological and groundwater quality conditions (
Table 4).
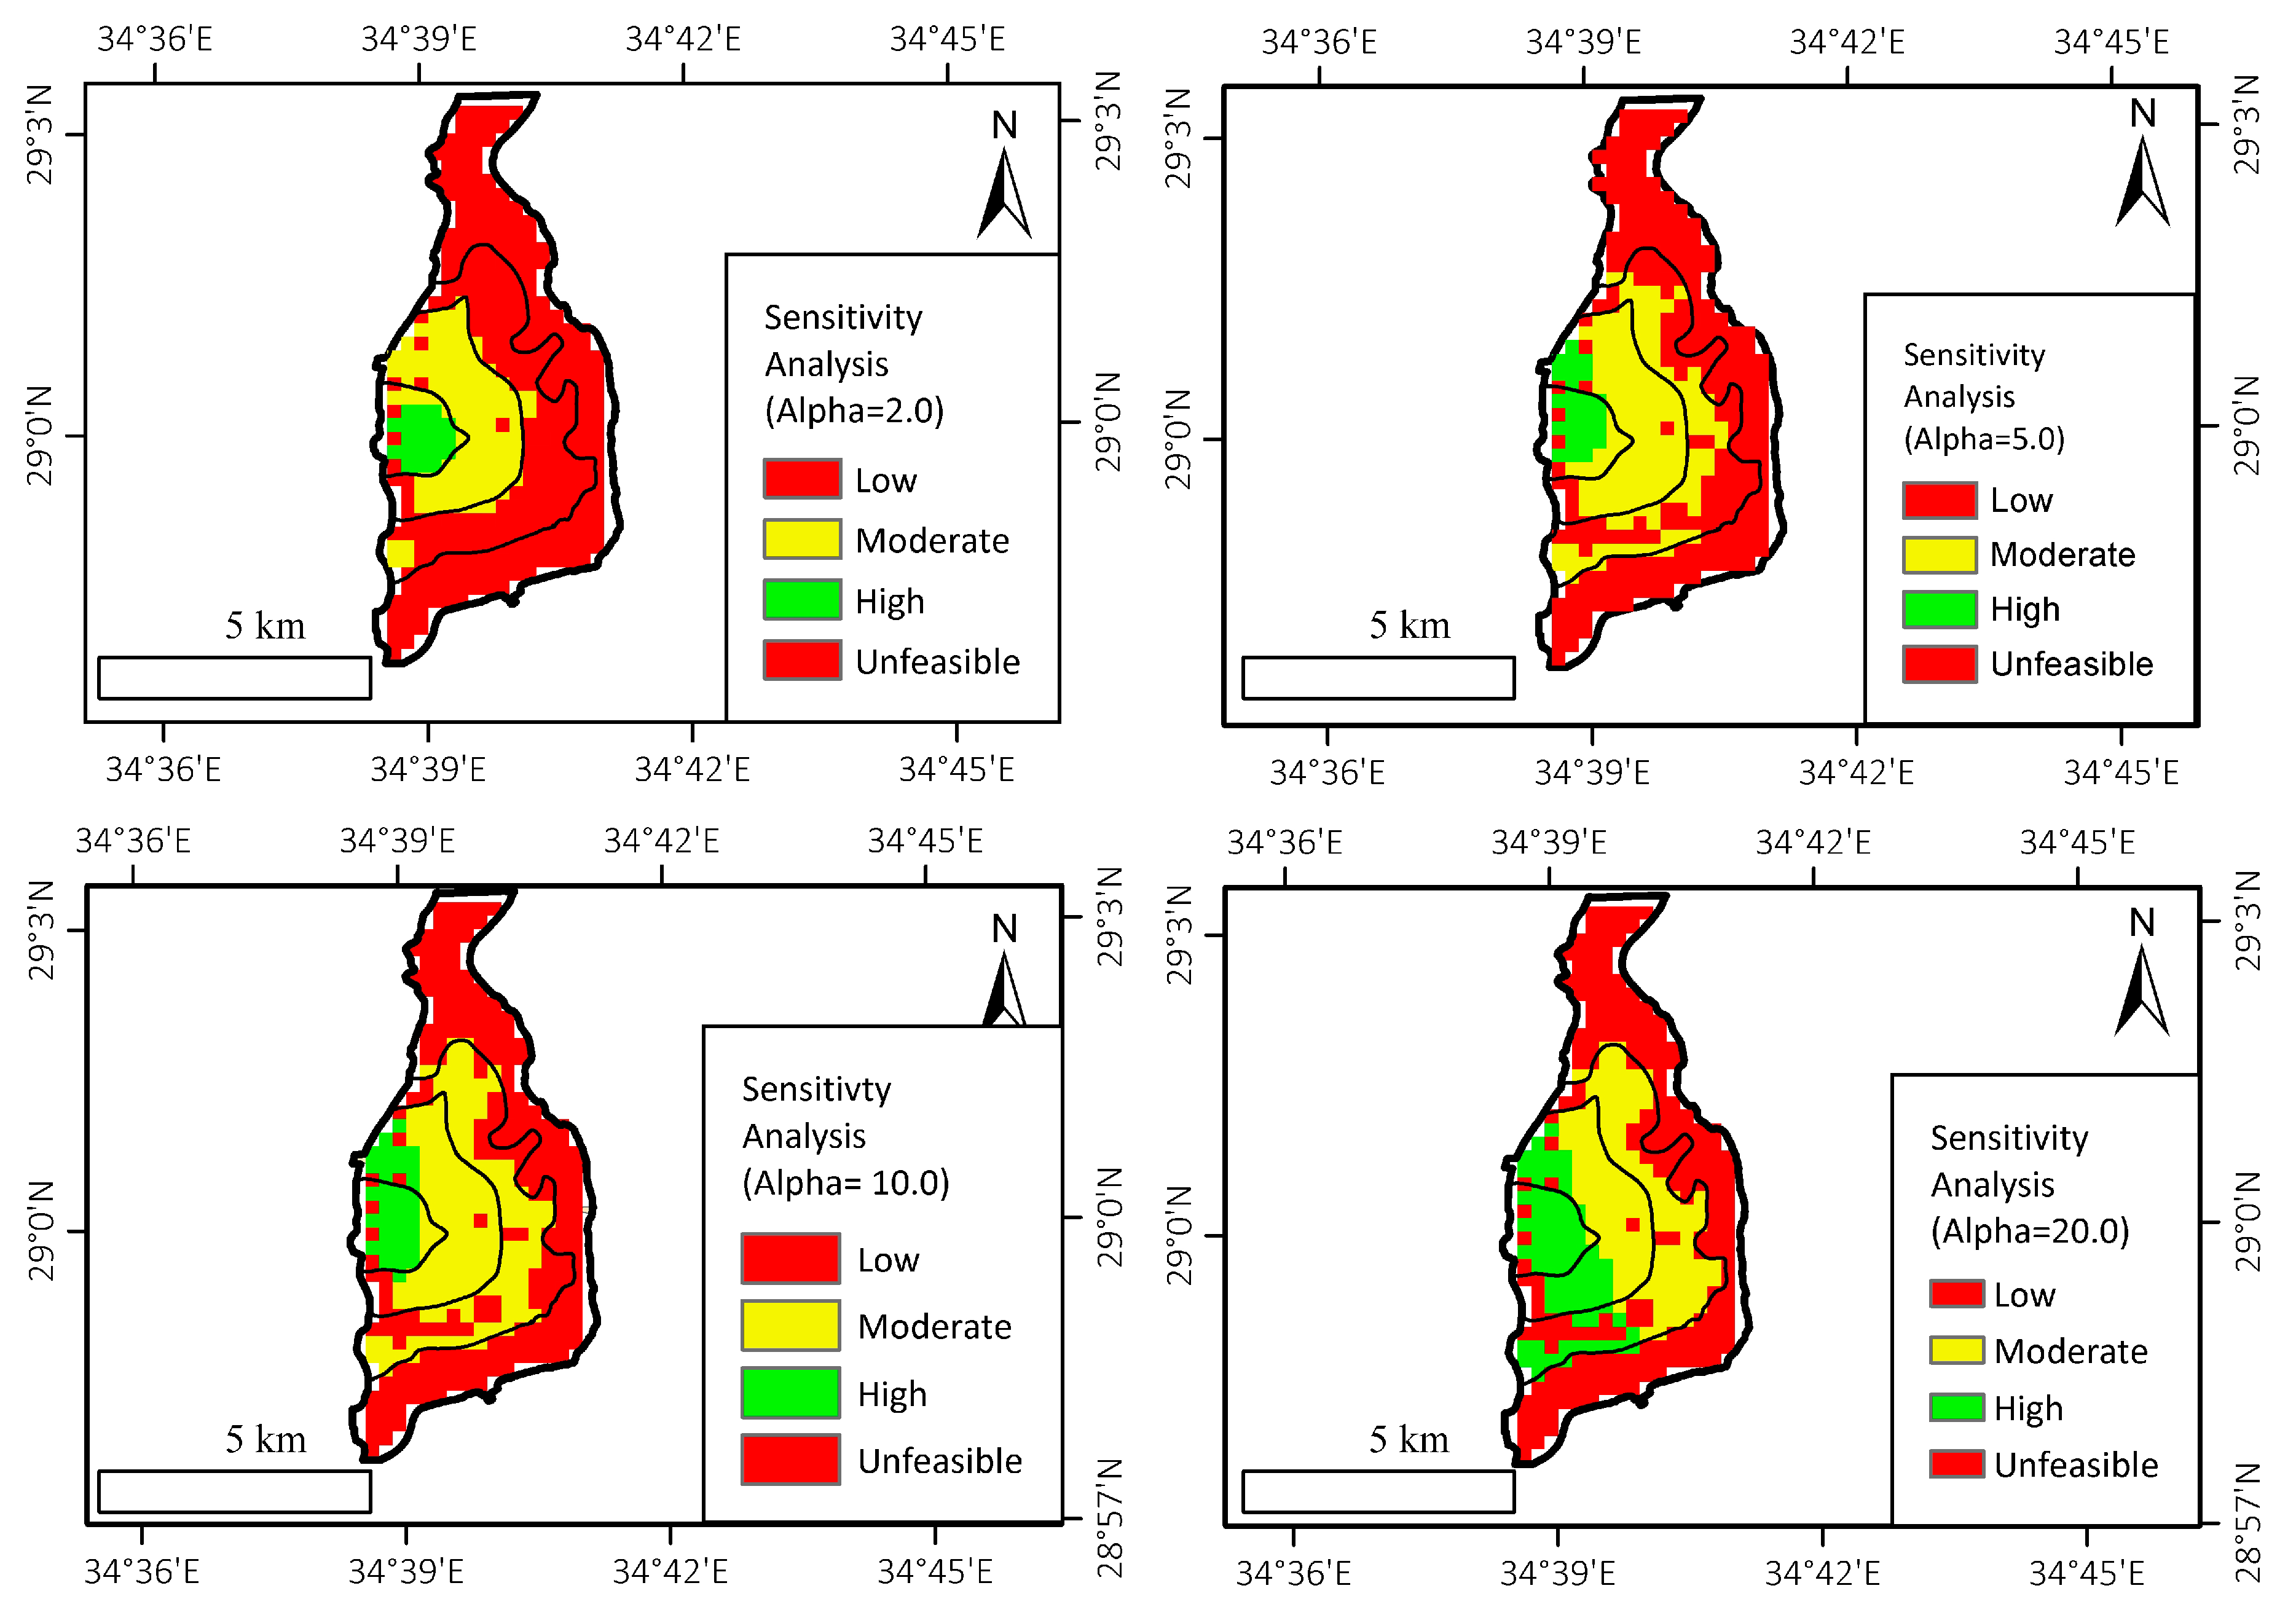
The sensitivity analysis is defined as a change in the overall suitability score due to a change in the weighting factors assigned by the decision-makers or experts. In this study, sensitivity analysis was performed using the OWA method, whereby the weighting factor was changed to determine the effect of changing the criterion’s value on the results using quantifier α. Quantifier α ranges from 0.5 to 20. The results show a close agreement between the sensitivity analysis map and the suitability map in the case of a high potential MAR site location (Zone I) (
Figure 6).
Table 5 shows the GIS-MCDA results summary. The table represents the fractions of the total area occupied by each potential MAR class.
4. Discussion
Firstly, the study area is suitable for installing the MAR system because MAR elements are satisfied (source of water, adequate aquifer, land for construction). Additionally, the following MAR structures are feasible to use for the study area: infiltration pond, controlled flooding, percolation pond, recharge releases, open wells and shafts, percolation tanks. However, further socio-economic and technical studies are required to decide on the most suitable structure. In addition, environmental studies are necessary to check whether the installed structure positively affects the environment of the hydrogeological system.
The suitability map has indicated that the high potential sites for installing MAR are located in the western portion in the vicinity of the study area, near the ephemeral stream outlet. Additionally, the constraint map has shown that sites near the shoreline are unfeasible.
The suitability map has been compared with the criterion thematic layers, and it has been observed that a close agreement occurs between the suitability map and the criterion thematic layers, except for the saturated thickness, where low criterion values are found in high potential scoring areas, and vice versa. This means that the suitability map reflects not only the potential sites for installing MAR, but also the locations of areas characterized by good aquifer hydrogeological conditions.
The sensitivity analysis indicates that the change in assigned weights does not significantly affect the results at zone I (high potential MAR site), which ensures the robustness of the suitability map at high potential sites.
The suitability map has been compared with the previous study conducted by Sallam [
6], who studied the feasibility of installing ASR in the study area. The comparison shows that the highly potential MAR site locations on the suitability map are near to the suggested ASR site locations “A1”, “A2” and “A3” proposed by Sallam [
6] (
Figure 6). Sallam [
6] concluded that the “A1”, “A2” and “A3” site locations are characterized by a high recovery efficiency at low dispersivity compared to the latter, especially “A1”, using the numerical modeling method. This strongly agrees with the results obtained from the GIS-MCDA method in this study.
The suitability map is a tool for decision-makers, and it can be utilized along with other maps in the study area, such as the groundwater potential map, the water allocation map, the flood plain map, etc. Even though the suitability map could contribute to deciding the location of MAR, it has been created without considering the decision rules set by the decision-maker, economic benefits (cost–benefit analysis), risk assessment studies, and environmental benefits (environmental impact assessment). In addition, this study has applied just one approach (GIS-MCDA); however, different methods can identify MAR locations (statistical methods, machine learning, groundwater numerical modeling).
The MAR structure can be applied for the conjunctive use of the surface, groundwater, reclaimed water, and desalinated seawater. Hence, further studies are needed to impose the conjunctive use of water resources using an IWRM framework.
5. Conclusions
The main aim of this research is to delineate the most feasible sites for installing MAR using the GIS-MCDA approach. To delineate the feasible sites, a constraint map and suitability maps have been created. The criteria utilized for screening out the unfeasible sites in the constraint mapping process are as follows: LULC, surface slope, unsaturated thickness, and distance from shore. The constraint map depicts that around 48% of the study area is inappropriate for use as MAR (located mostly in the eastern portion of the study area). Additionally, the criteria utilized to develop a suitability map include vertical permeability, unsaturated thickness, surface slope, salinity, hydraulic gradient, and saturated thickness. The suitability map is divided into four zones according to the feasibility of installing a MAR site: zone I (high), zone II (moderate), zone III (low) and zone IV (infeasible). The suitability map shows that the high and moderate potential areas constitute, respectively, around 6% and 20% of the study area.
To sum up, the suitability map indicates that MAR could be installed at zone I (located in the western portion of the study area near the ephemeral stream outlet), where most conditions for installing MAR are fulfilled, as the zone is characterized by high vertical permeability (6.96–9.17 m/d), high unsaturated thickness (32.45–42.89 m), low surface slope (0.94–1.27%), low salinity (2368.22–3443.26 mg/L), and low hydraulic gradient (0.071–0.05%).
Further studies should be conducted to check the efficiency of replenishing the aquifer after installing the MAR system at the best locations by modeling the groundwater flow and transport. In addition, it is important to identify the risks that may cause MAR malfunction, such as clogging problems and hydro-geochemical reactions during operating MAR. A pilot project should be constructed to perform fieldwork (injection tests, infiltration tests).
Author Contributions
Conceptualization, O.M.S.; methodology, O.M.S.; validation, O.M.S., and C.S.; formal analysis, K.S.; investigation, K.S.; resources, O.M.S.; data curation, O.M.S.; writing—original draft preparation, K.S.; writing—review and editing, O.M.S., and C.S.; visualization, K.S.; supervision, O.M.S., and C.S. All authors have read and agreed to the published version of the manuscript.
Funding
This work was part of a master’s thesis conducted by Karim Mohamed Ahmed Soliman via a scholarship awarded by Deutsche Akademischer Austauschdienst (DAAD) (Funding programme/-ID: 57252261), (personal ref. no.: 91708607).
Institutional Review Board Statement
Not applicable.
Informed Consent Statement
Not applicable.
Data Availability Statement
Not applicable.
Acknowledgments
The first author would like to thank Deutsche Akademischer Austauschdienst (DAAD) for awarding him a scholarship to study on a master’s program at Technische Universität Darmstadt. The authors would like to thank Water Resources Research Institute (WRRI), National Water Research Center (NWRC), Egypt, for providing the necessary information and support related to the research.
Conflicts of Interest
The authors declare no conflict of interest.
Appendix A
Figure A1.
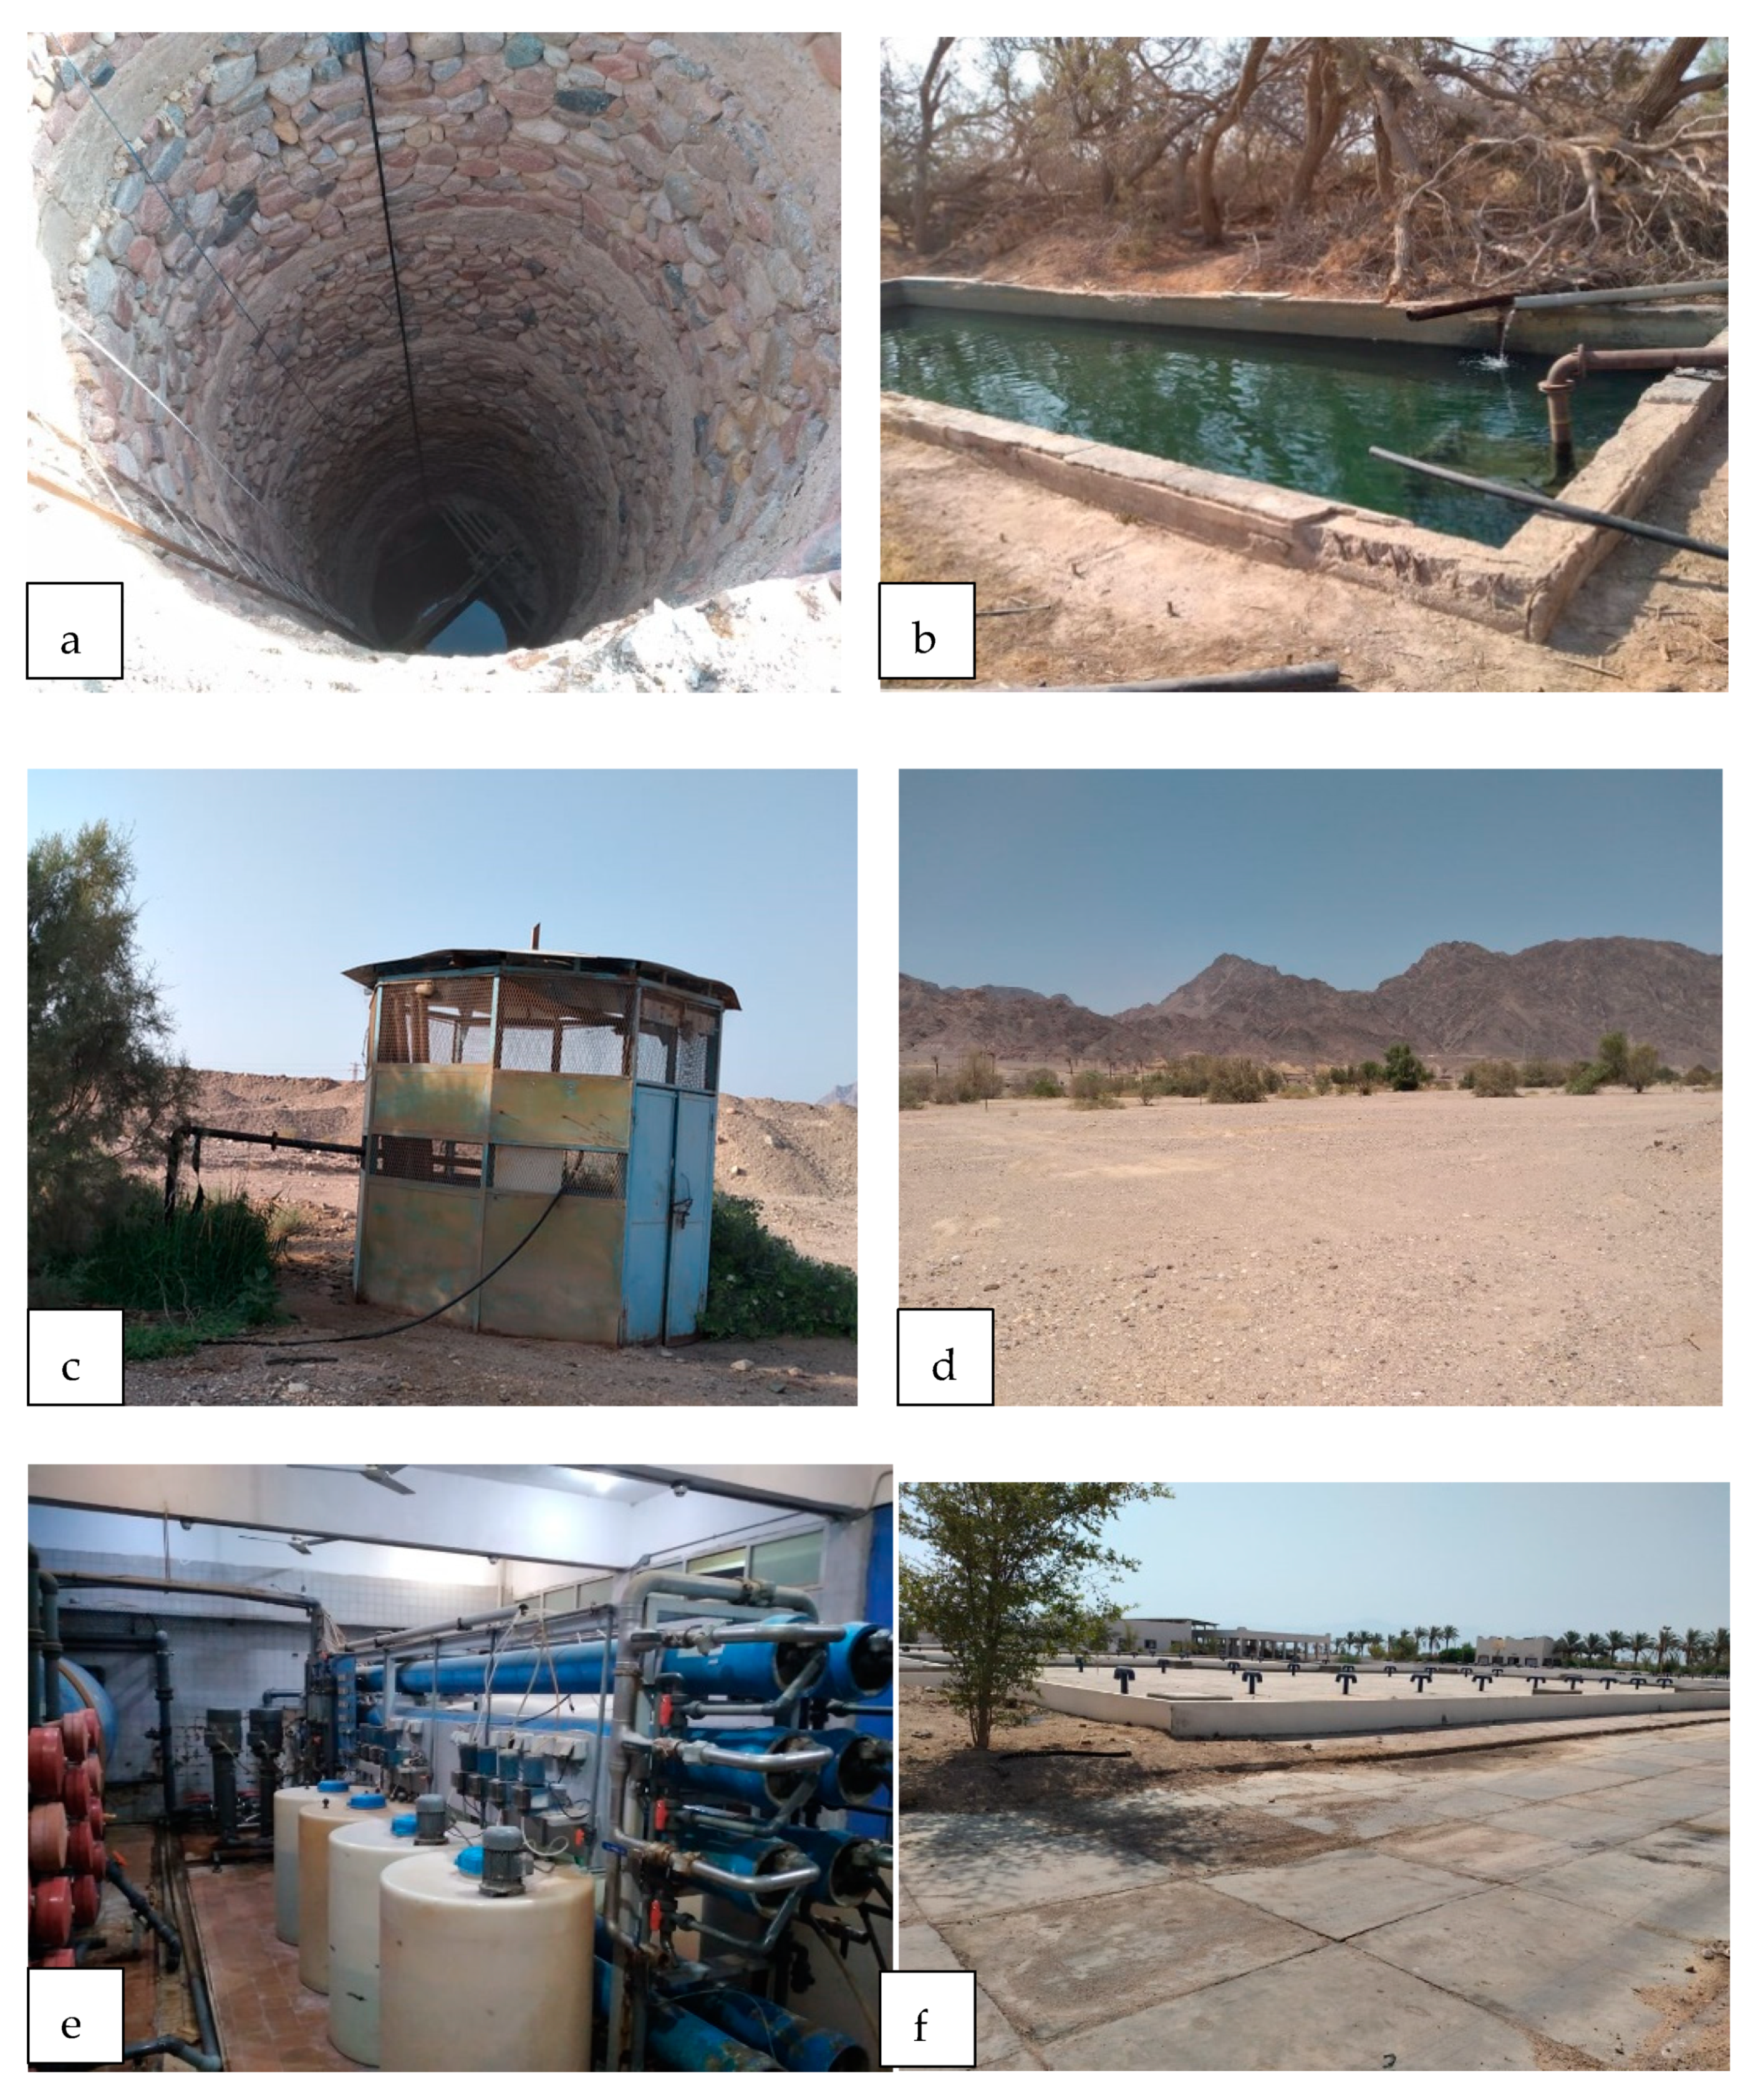
(a) Dug wells. (b) A basin located beside the hand-dug well for storing the extracted groundwater after the pumping phase. (c) Drilled well. (d) Forest trees irrigated from groundwater. (e) Nuweiba desalination plant. (f) Storage tank in Nuweiba desalination plant.
Figure A1.
(a) Dug wells. (b) A basin located beside the hand-dug well for storing the extracted groundwater after the pumping phase. (c) Drilled well. (d) Forest trees irrigated from groundwater. (e) Nuweiba desalination plant. (f) Storage tank in Nuweiba desalination plant.
Appendix B
Figure A2.
Constraint map criteria thematic layers.
Figure A2.
Constraint map criteria thematic layers.
Figure A3.
Suitability map criteria thematic layers before and after standardization.
Figure A3.
Suitability map criteria thematic layers before and after standardization.
References
- Eissa, M.A.; Thomas, J.M.; Pohll, G.; Hershey, R.L.; Dahab, K.A.; Dawoud, M.I.; ElShiekh, A.; Gomaa, M.A. Groundwater resource sustainability in the Wadi Watir delta, Gulf of Aqaba, Sinai, Egypt. Hydrogeol. J. 2013, 21, 1833–1851. [Google Scholar] [CrossRef]
- Abuzied, S.M.; Yuan, M.; Ibrahim, S.K.; Kaiser, M.F.; Seleem, T.A. Delineation of Groundwater Potential Zones in Nuweiba Area (Egypt) Using Remote Sensing and GIS Techniques. Int. J. Signal Process. Syst. 2015, 4, 109–117. [Google Scholar] [CrossRef]
- Masoud, A.A. Runoff modeling of the wadi systems for estimating flash flood and groundwater recharge potential in Southern Sinai, Egypt. Arab. J. Geosci. 2011, 4, 785–801. [Google Scholar] [CrossRef]
- Milewski, A.; Sultan, M.; Yan, E.; Becker, R.; Abdeldayem, A.; Soliman, F.; Gelil, K.A. A remote sensing solution for estimating runoff and recharge in arid environments. J. Hydrol. 2009, 373, 1–14. [Google Scholar] [CrossRef]
- Al Zayed, I.; Ribbe, L.; Al Salhi, A. Water Harvesting and Flashflood Mitigation-Wadi Watier Case Study (South Sinai, Egypt). Int. J. Water Resour. Arid Environ. 2013, 2, 102–109. [Google Scholar]
- Sallam, O.M. Use of Numerical Groundwater Modeling to Assess the Feasibility of Aquifer Storage and Recovery (ASR) in the Wadi Watir Delta, Sinai, Egypt. J. Water Resour. Prot. 2019, 11, 1462–1480. [Google Scholar] [CrossRef] [Green Version]
- Elewa, H.H.; Qaddah, A.A. Groundwater potentiality mapping in the Sinai Peninsula, Egypt, using remote sensing and GIS-watershed-based modeling. Hydrogeol. J. 2011, 19, 613–628. [Google Scholar] [CrossRef] [Green Version]
- Sallwey, J.; Valverde, J.P.B.; López, F.V.; Junghanns, R.; Stefan, C. Suitability maps for managed aquifer recharge: A review of multi-criteria decision analysis studies. Environ. Rev. 2019, 27, 138–150. [Google Scholar] [CrossRef]
- Rahman, M.A.; Rusteberg, B.; Gogu, R.; Ferreira, J.L.; Sauter, M. A new spatial multi-criteria decision support tool for site selection for implementation of managed aquifer recharge. J. Environ. Manag. 2012, 99, 61–75. [Google Scholar] [CrossRef]
- Chowdhury, A.; Jha, M.K.; Chowdary, V.M. Delineation of groundwater recharge zones and identification of artificial recharge sites in West Medinipur district, West Bengal, using RS, GIS and MCDM techniques. Environ. Earth Sci. 2010, 59, 1209–1222. [Google Scholar] [CrossRef]
- Dillon, P.; Pavelic, P.; Page, D.; Beringen, H.; Ward, J.R. Managed Aquifer Recharge: An Introduction. Waterlines Report Series; National Water Commission: Canberra, Australia, 2009; Volume 13. [Google Scholar]
- Abbas, A.M.; Atya, M.A.; Al-Sayed, E.A.; Kamei, H. Assessment of groundwater resources of the Nuweiba area at Sinai Peninsula, Egypt by using geoelectric data corrected for the influence of near surface inhomogeneities. J. Appl. Geophys. 2004, 56, 107–122. [Google Scholar] [CrossRef]
- Eissa, M.; Thomas, J.M.; Pohll, G.; Shouakar-Stash, O.; Hershey, R.L.; Dawoud, M. Groundwater recharge and salinization in the arid coastal plain aquifer of the Wadi Watir delta, Sinai, Egypt. Appl. Geochem. 2016, 71, 48–62. [Google Scholar] [CrossRef]
- Khalil, M.H. Hydro-geophysical Configuration for the Quaternary Aquifer of Nuweiba Alluvial Fan. J. Environ. Eng. Geophys. 2010, 15, 77–90. [Google Scholar] [CrossRef]
- Himida, I.H. Water Resources in Delta Wadi Watir (Nuweiba Area) and Improvement of the Hydrologic Setting in the Area; Internal Technical Report; Desert Research Center: Cairo, Egypt, 1994. [Google Scholar]
- Jha, M.K.; Chowdhury, A.; Chowdary, V.M.; Peiffer, S. Groundwater management and development by integrated remote sensing and geographic information systems: Prospects and constraints. Water Resour. Manag. 2007, 21, 427–467. [Google Scholar] [CrossRef]
- Razandi, Y.; Pourghasemi, H.R.; Neisani, N.S.; Rahmati, O. Application of analytical hierarchy process, frequency ratio, and certainty factor models for groundwater potential mapping using GIS. Earth Sci. Inform. 2015, 8, 867–883. [Google Scholar] [CrossRef]
- Manap, M.A.; Nampak, H.; Pradhan, B.; Lee, S.; Sulaiman, W.N.A.; Ramli, M.F. Application of probabilistic-based frequency ratio model in groundwater potential mapping using remote sensing data and GIS. Arab. J. Geosci. 2014, 7, 711–724. [Google Scholar] [CrossRef]
- Guru, B.; Seshan, K.; Bera, S. Frequency ratio model for groundwater potential mapping and its sustainable management in cold desert, India. J. King Saud Univ. Sci. 2017, 29, 333–347. [Google Scholar] [CrossRef] [Green Version]
- Naghibi, S.A.; Pourghasemi, H.R.; Dixon, B. GIS-based groundwater potential mapping using boosted regression tree, classification and regression tree, and random forest machine learning models in Iran. Environ. Monit. Assess. 2016, 188, 1–27. [Google Scholar] [CrossRef]
- Kordestani, M.D.; Naghibi, S.A.; Hashemi, H.; Ahmadi, K.; Kalantar, B.; Pradhan, B. Groundwater potential mapping using a novel data-mining ensemble model. Hydrogeol. J. 2019, 27, 211–224. [Google Scholar] [CrossRef] [Green Version]
- Díaz-Alcaide, S.; Martínez-Santos, P. Review: Advances in groundwater potential mapping. Hydrogeol. J. 2019, 27, 2307–2324. [Google Scholar] [CrossRef]
- Valverde, J.P.B.; Blank, C.; Roidt, M.; Schneider, L.; Stefan, C. Application of a GIS Multi-Criteria Decision Analysis for the Identification of Intrinsic Suitable Sites in Costa Rica for the Application of Managed Aquifer Recharge (MAR) through Spreading Methods. Water 2016, 8, 391. [Google Scholar] [CrossRef]
- Russo, T.A.; Fisher, A.T.; Lockwood, B.S. Assessment of Managed Aquifer Recharge Site Suitability Using a GIS and Modeling. Ground Water 2015, 53, 389–400. [Google Scholar] [CrossRef] [PubMed] [Green Version]
- Malczewski, J. GIS and Multicriteria Decision Analysis; John Wiley and Sons: New York, NY, USA, 1999. [Google Scholar]
- Malczewski, J. GIS-based multicriteria decision analysis: A survey of the literature. Int. J. Geogr. Inf. Sci. 2006, 20, 703–726. [Google Scholar] [CrossRef]
- Saraf, A.K.; Choudary, P.R. Integrated remote sensing and GIS for the groundwater exploration and identification of artificial recharge sites. Int. J. Remote Sens. 1998, 19, 1825–1841. [Google Scholar] [CrossRef]
- Shankar, M.N.R.; Mohan, G. A GIS based hydrogeomorphic approach for identification of site-specific artificial-recharge techniques in the Deccan Volcanic Province. J. Earth Syst. Sci. 2005, 114, 505–514. [Google Scholar] [CrossRef]
- Anbazhagan, S.; Ramasamy, S.M.; Das Gupta, S. Remote sensing and GIS for artificial recharge study, runoff estimation and planning in Ayyar basin, Tamil Nadu, India. Environ. Earth Sci. 2005, 48, 158–170. [Google Scholar] [CrossRef]
- Lagacherie, P.; McBratney, A.B.; Voltz, M. Digital Soil Mapping: An Introductory Perspective; Elsevier B.V.: Amsterdam, The Netherlands, 2006. [Google Scholar]
- Saaty, T.L. The Analytical Hierarchy Process; Mcgraw-Hill: New York, NY, USA, 1980. [Google Scholar]
- Yager, R.R. On ordered weighted averaging aggregation operators in multicriteria decision making Systems. IEEE Trans. Syst. Man Cybern. 1988, 18, 183–190. [Google Scholar] [CrossRef]
| Publisher’s Note: MDPI stays neutral with regard to jurisdictional claims in published maps and institutional affiliations. |
© 2022 by the authors. Licensee MDPI, Basel, Switzerland. This article is an open access article distributed under the terms and conditions of the Creative Commons Attribution (CC BY) license (https://creativecommons.org/licenses/by/4.0/).


