
Proposal of a Water Consumption Efficiency Indicator for the Hotel Sector


Abstract
1. Introduction
2. Understanding Water Consumption in Hotels
- Rooms: Guests’ water usage inside hotel rooms is constrained to sanitary uses. This water use is comparable to the indoor consumption of a household restroom as the water appliances are the same: tap, toilet, bidet, and shower or bathtub.As expected, water use inside guest rooms strongly correlates with the hotel occupation rate. The main influential factors identified for this micro-component are the following: technical characteristics of the water appliances, dynamic water pressure available at the consumption points, and consumption habits of guests.
- Kitchen: Water use in a hotel’s kitchen is extremely similar to water consumption in a restaurant’s kitchen. It comprises meals preparation, kitchenware washing, and cleaning activities.The magnitude of this micro-component depends not only on the hotel occupation rate but also on the possibility that the hotel restaurant is open to non-guests. In addition, the technical characteristics of the kitchen equipment (taps, dishwashers) are other influential factors.
- Laundry: Water consumption associated with the laundry is required to wash towels, linen, and other clothes. Washing is typically done using industrial washing machines owned by the hotel or outsourcing laundry services to an external company. Water usage associated with this micro-component happens outside the hotel premises when this later situation occurs.Similar to water usage inside rooms, water laundry consumption directly depends on the hotel occupation rate. The main relevant factor that affects its magnitude is the technical characteristics of the washers used and the linen replacement policies followed by the hotel.
- Pools: As in the previous item, the water amounts required by the regular use of swimming pools, spas, or other water attractions also depend significantly on the type of hotel.Hotel occupation rate has only an average influence on this micro-component because of the relatively high operation and maintenance flow rate in this type of installation. The main influential factors are the size of facilities and the hydraulic systems technology.
- Irrigation: This micro-component accounts for the water required to maintain gardens and green areas. Irrigation depends hugely on the type of hotel: it may be negligible in urban business hotels, and conversely, it might demand significant amounts of water in the case of large holiday resorts.Hotel occupation rate does not significantly influence irrigation water or, at least, not in the same proportion as other factors such as the size of gardens, irrigation systems, plant species, or the climate itself.
- Cooling and heating: This micro-component includes the water required by the hotel’s air conditioning (AC) system.The amount of water used for cooling exhibits a medium dependence on the occupation rate of the hotel. The reason is that there are certain areas of the hotel, such as the reception, halls, corridors, the restaurant, or the gym, that need to be cooled independently of the hotel occupancy. However, other spaces, such as the guests’ rooms, are only cooled if they are occupied. The main influential factor of this micro-component is related to the air conditioning system’s technical characteristics and the climatic conditions at the hotel’s location.
3. Literature Review and Conclusions
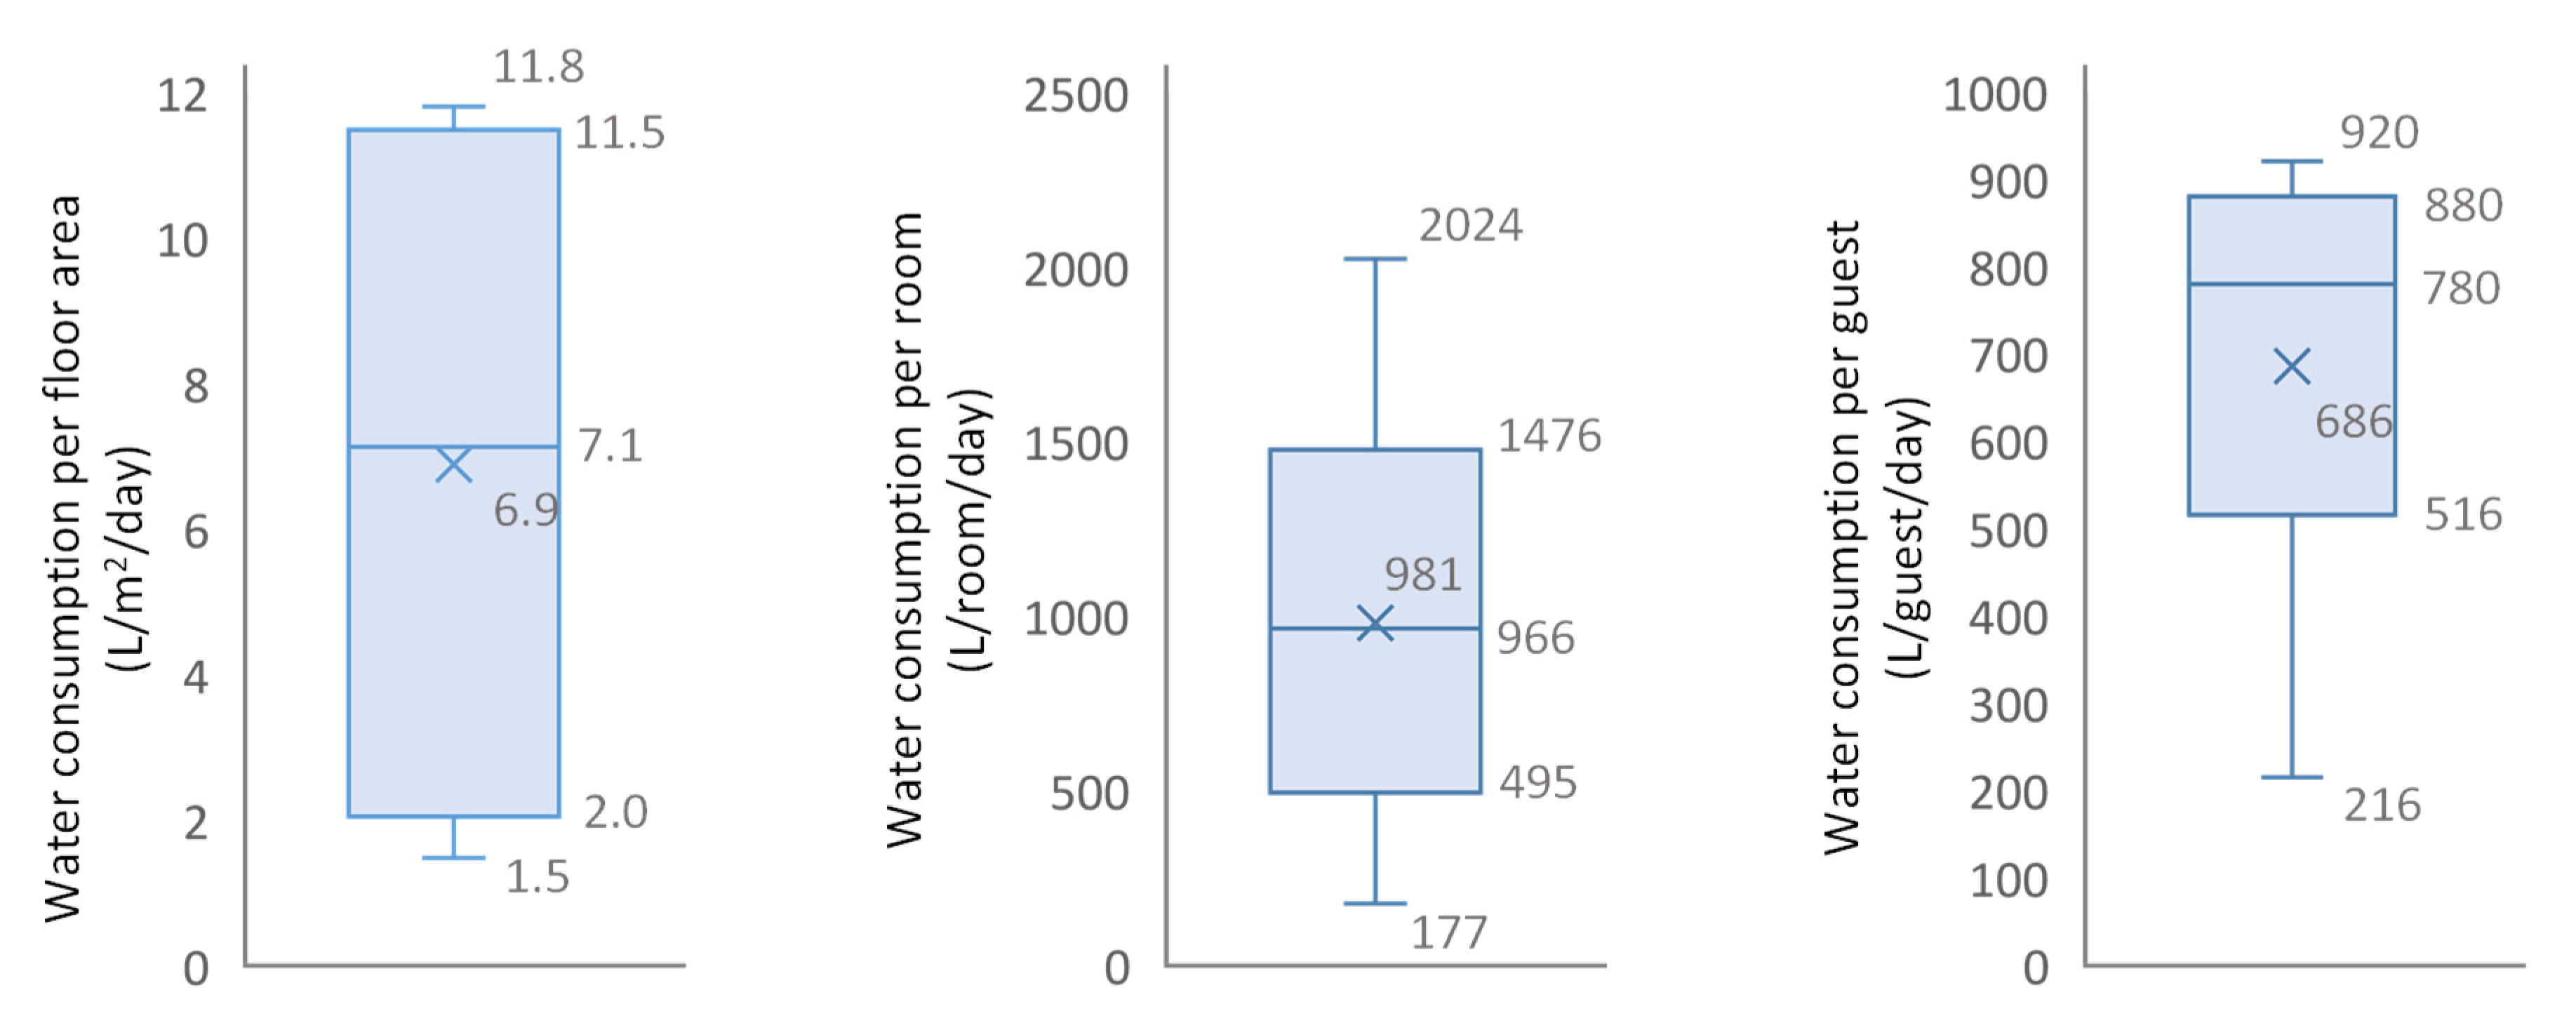
- Water consumption per floor area: 6.9 L/(m2·day)
- Water consumption per room: 981 L/(room·day)
- Water consumption per guest: 686 L/(guest·day)
4. Model for Water Consumption in Hotels
4.1. Water Consumption in Rooms
- The number of occupants in a hotel room is directly related to water consumption. An increase in the occupants’ number implies a nearly proportional increase in water consumption.
- The water consumption habits of the occupants affect the number of usages per day of the toilet and faucets or the running time of the showers and other faucets.
- The number and type of water appliances can also influence the water volumes used inside guest rooms. Though hotel rooms tend to be comparable in number and type of appliances, the more sophisticated equipment in high-standard hotels (bidet, bathtub, rain showerheads, hydro-massage showers, etc.) can lead to higher water consumption.
- The water efficiency of the appliances installed. Independently of the type of appliance considered, it should be analysed if the service can be provided more efficiently. The objective is to perform its function and satisfy the customer’s needs using the lowest volume of water.
- Flow rate-based appliances (faucet, shower, bidet). The consumption volumes from these appliances depend on the discharge flow rate and the running time. In addition, the flow rate depends on the available dynamic pressure at the room. The consumption volumes made by hotel guests can be calculated based on the average duration of the usage events and the average flow rates provided by the appliances.
- Volume-based appliances (toilet, bathtub). These appliances can be characterised by an average usage volume defined, for example, by the toilet tank size or the bathtub capacity. The consumption volumes are determined by estimating the number of times the guests in the room may use these appliances every day.
- Flowrates are the ones for efficient appliances in Table 3;
4.2. Water Consumption in Kitchens-Restaurants
- Factors affecting the number of meals served. These factors are related to size in general—the restaurant seating capacity, the working hours of the kitchen, or the number of meals shifts per day.
- Factors affecting the unitary water consumption per meal. These factors are either technical, such as the characteristics of appliances and machines used in the kitchen, or behavioural, such as the water consumption habits of employees. In addition, the type of cuisine may be relevant here. For instance, according to [49], Chinese kitchens may consume more significant amounts of water than others.
4.3. Water Consumption in Outdoor Irrigation
- Climate. The first factor to consider is the general weather that naturally exists at the hotel geographical location. The better adapted the plants are to the local climate, the lower their water consumption.
- Garden area. The second factor is the size of the area to irrigate—the larger the area, the higher the water demand.
- Types of plants. From great water-demanding types such as turf grass to arid and semi-arid types such as succulent plants, the water requirements largely depend on the plant species selected for landscaping. It is essential to highlight that the ornamental value of plants must not necessarily be related to their water requirements.
- Irrigation system. The efficiency of the different irrigation systems available in the market might be highly variable. They can range from the lowest one, such as simple sprinklers, to the highest ones, such as drip irrigation managed through an automatic system driven by the hour of the day and the weather conditions.
- Additional means might also be installed to reduce plants water demand. In some cases, specific techniques such as mulching may reduce the water needs for irrigation.
4.4. Water Consumption in the Laundry
- Technical characteristics of washers. Depending on the technologies employed, water consumption could vary as much as 70%: front-loading vs. top-loading washers [66,67], continuous-batch washers [34], or water reclamation systems that allow associating successive wash cycles by using the rinse water of the last washer as the load water of the next one [23].
4.5. Water Consumption in Swimming-Pools
- Evaporation. The amount of water lost depends on the temperature difference between the water and the surrounding air and other factors such as the relative humidity and the wind velocity over the pool [74].
- Maintenance tasks. Backwashing of the filters is a regular maintenance activity conducted periodically. The required frequency of backwashing depends on the number of swimmers and the dirt they introduce into the water. Even if proper maintenance is carried out, part of the water needs to be regularly renewed to adjust and correct the presence of chemicals and reduce the concentration of chloramines.
- Swimmers’ activity. It is compulsory to shower for hygienic reasons before diving into a swimming pool. In addition, after taking a bath, it is highly advisable to take a shower to remove chlorine, bacteria, fungus, dead skin cells, hair, and other people’s body fluids. Depending on several factors, splashing could be a significant component. It can be reduced by giving the proper slope to the wet deck and installing gutters around the pool’s edge to collect most of the water splashed out.
4.6. Water Consumption in Air Conditioning
- The system technology and design. The water demand in an open-loop cooling tower is much greater than that for a closed-loop device. Not only that, but closed-loop devices have shown significant advantages and better overall efficiencies than the alternative open-loop system [27]. Equally, feasible modifications on existing systems such as eliminating single-pass cooling, increasing the tower’s cycles of concentration, or improving total operational management have reported significant reductions in water consumed [82]. Finally, other aspects such as the design loads performance [83] and the maintenance level [34] have shown an evident influence on water consumption.
- Characteristics of the building. The size of the building and, more particularly, the space being cooled and heated is the main factor for the water consumption of the cooling system [51]. Other features such as the building design criteria and the average and maximum occupancy [51] should also be considered.
5. The Indicator: Hotel Water Consumption Index (HWCI)
6. Case Study
7. Discussion
- The HWCI efficiency indicator takes into account and evaluates all the existing water consumption micro-components in any hotel separately. The minimum achievable water consumption in a hotel is calculated by summing the minimum water consumption achievable in each micro-component, considering the hotel’s characteristics.
- The figures obtained for the HWCI are independent of the local conditions, hotel style, or other factors that may influence water consumption. The HWCI considers and reduces the dependence on these and other hotel characteristics related to water consumption components. This way, the HWCI figures can be used for a more reliable comparison of the efficiency performance of different accommodation establishments;
- Regardless of the above, the HWCI has been designed to have a simple calculation procedure, and the parameters needed can be directly obtained and verified by external auditors. The HWCI calculation only requires eight primary hotel attributes. The proposed figures for the parameters used in the calculation are justified according to the current state of the art and previous publications. The operations to be performed are neither mathematically nor statistically complex;
- The HWCI is easy to understand, and it can be directly compared to a reference value: one. The greater the HWCI, the less efficient hotel’s water use is. The HWCI is a non-dimensional index that reflects the inefficiencies related to water consumption and how many times above the minimum achievable amount the current consumption of the hotel is. It also reflects how much room is available to implement water efficiency measures, quantifying the magnitude of the attainable savings and providing indication where to apply them.
- The HWCI is based on figures representative of current conditions. As such conditions might change in the future, the HWCI calculations should be updated accordingly. This may be especially relevant for the case of new technologies in consumer devices that may be developed and thus reduce the minimum achievable consumption in some microcomponents. Likewise, ET0 values can be updated as climate change studies confirm them;
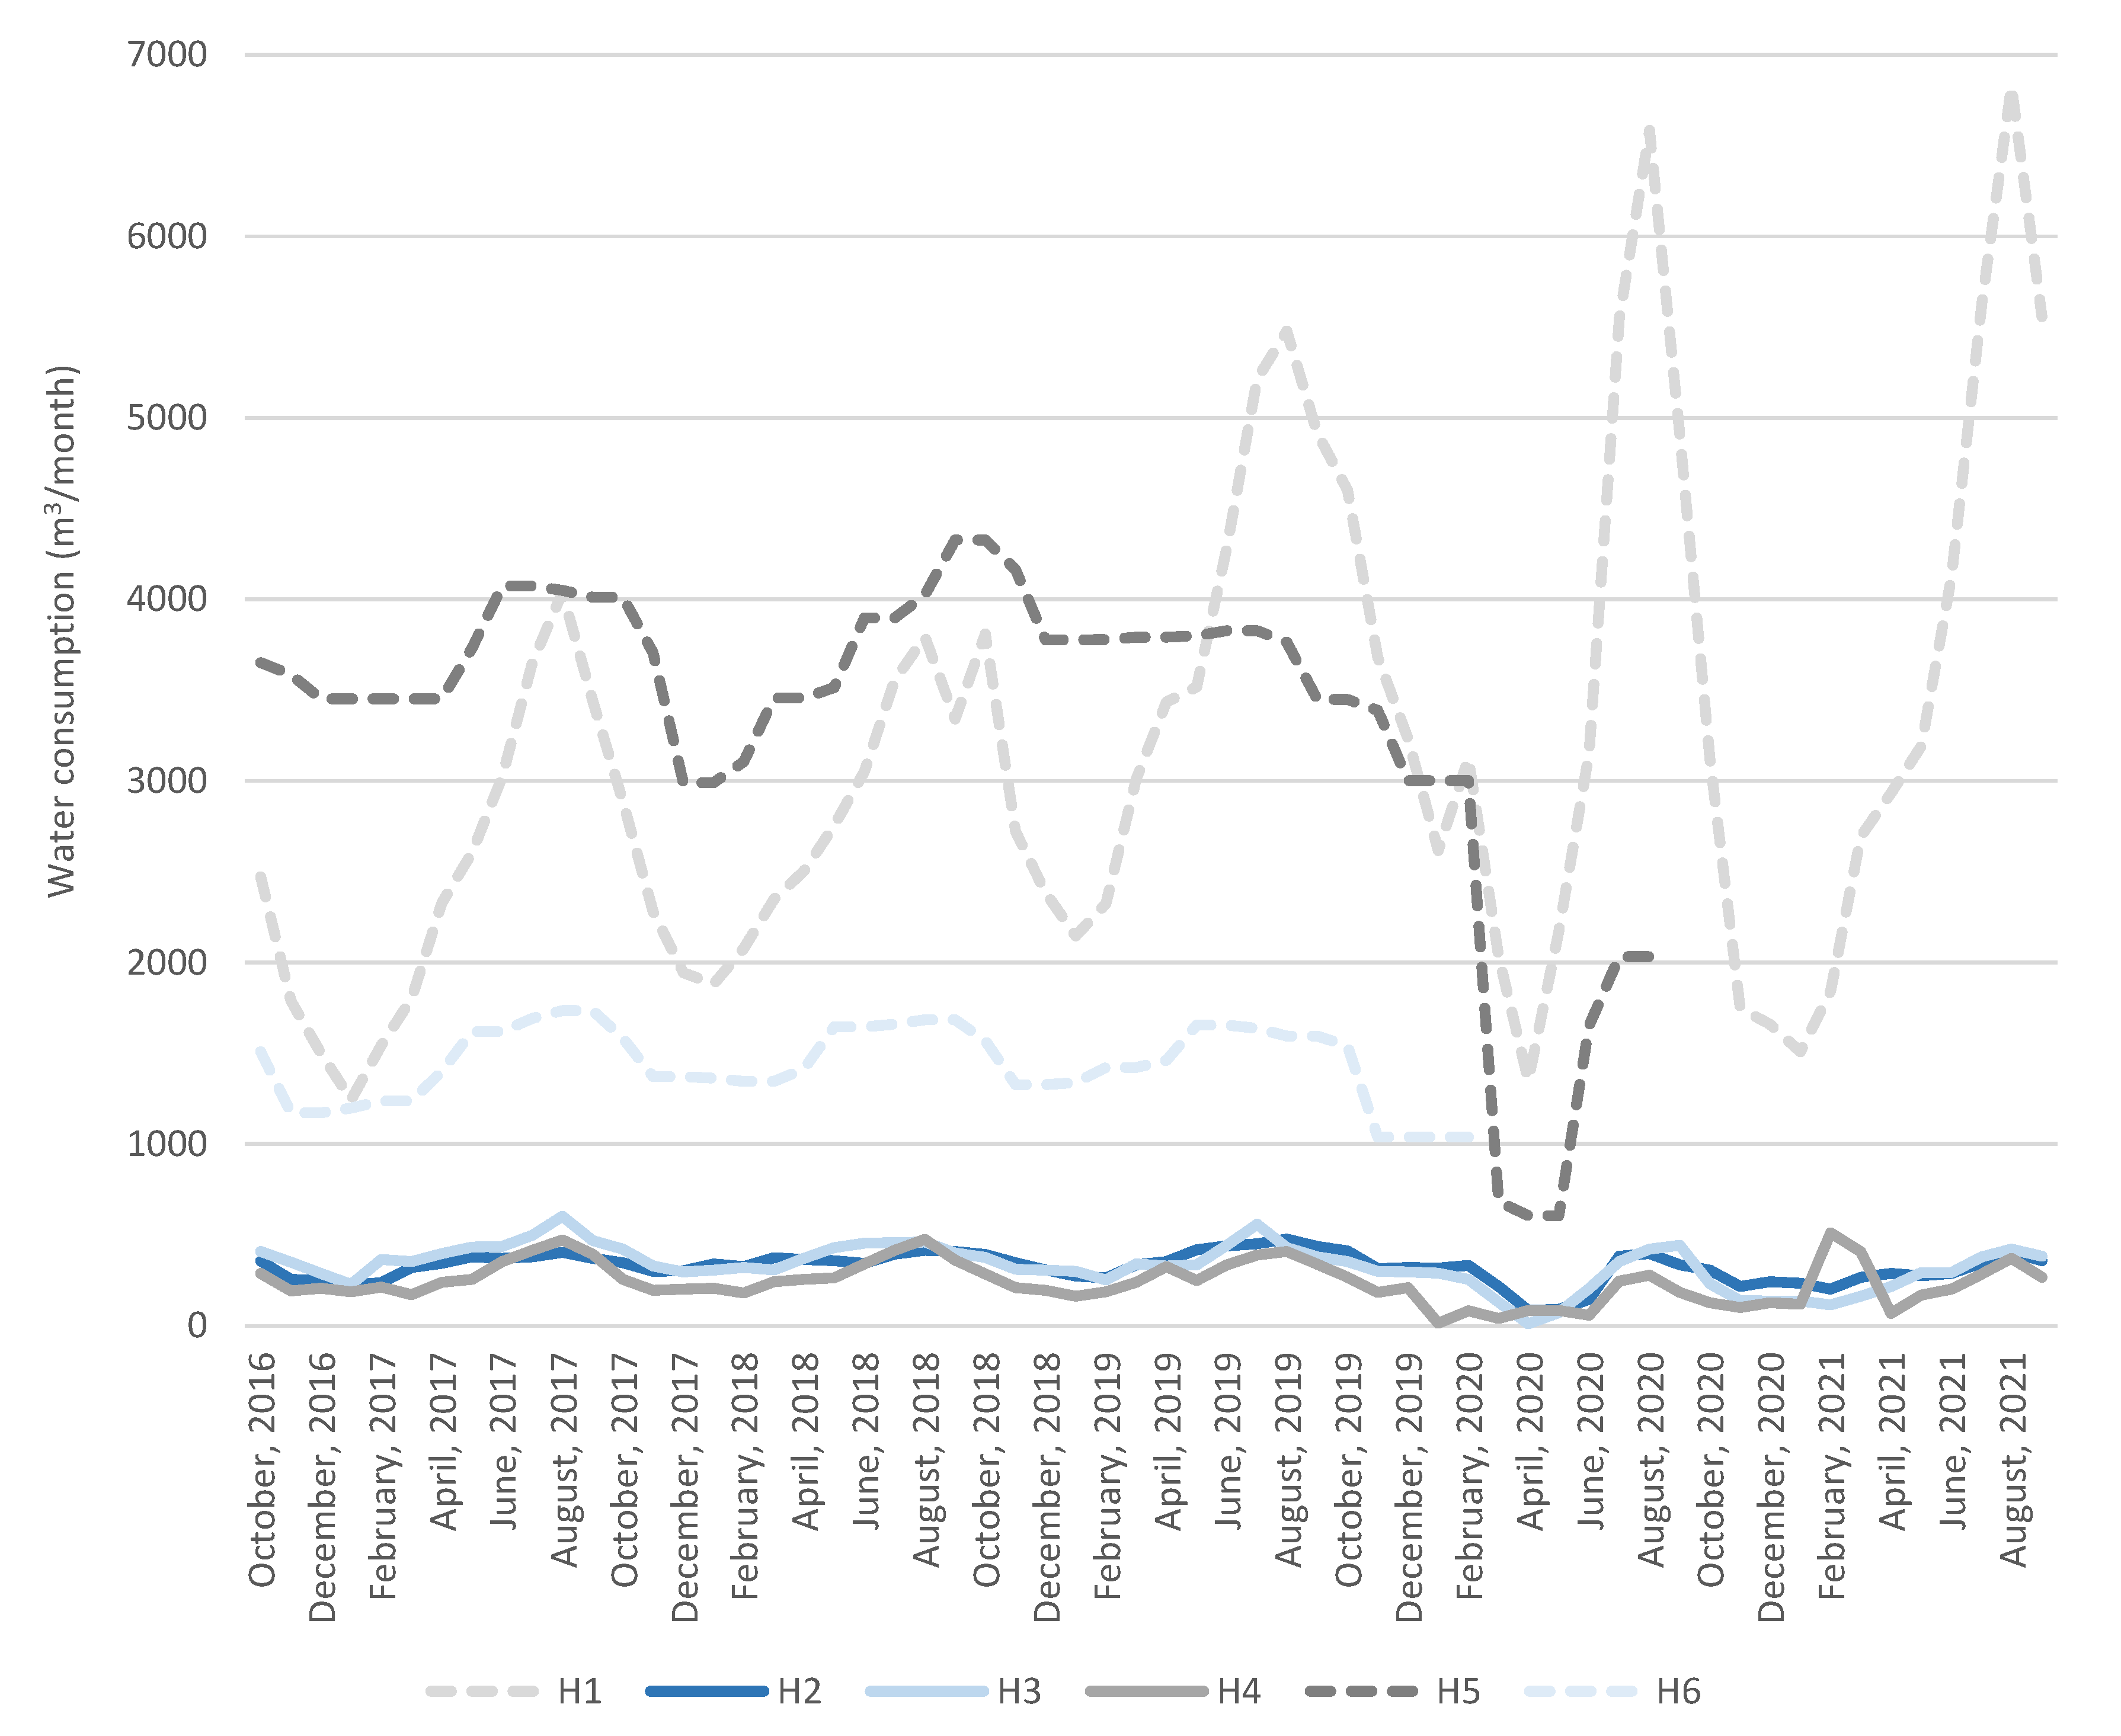
- The calculation of the HWCI has been proposed on an annual basis because it is intended for long-term analysis, and the usual reports on occupancy, consumption, and even climatic parameters are all prepared on an annual basis. However, this does not prevent the HWCI from being used for the analysis of shorter time periods. In the case of hotels with a highly seasonal occupancy that may also be located in climates with very distinct seasons (such as the Mediterranean climate), an annual average may not represent properly the hotel operation. Alternatively, the hotel management may want to know in more detail the water efficiency consumption in each season since the maximum occupancy and water consumption normally match the highest temperatures. In such cases, calculating the HWCI for a period of three months (or any other duration) is not a problem. It is sufficient to know the value of all the calculation parameters for that period of time. Although some of them will be constant (flow rates or consumption times), it will be the most critical ones (occupancy, temperatures, rainfall) that will make the difference;
- The HWCI relies on the previous calculation of the MCB. It is essential to highlight that the MCB is solely a reference for the hotel’s minimum achievable water consumption. The MCB does not provide a figure for the actual minimum achievable water consumption for the specific conditions of the establishment analysed. This way, values of HWCI below one should not be frequent but are not impossible (as in the case of H4 in the previous section). HWCI below one should be interpreted as belonging to hotels with fully efficient water consumption. HWCI above one should not be considered an unacceptable result without a detailed analysis;
- There is a risk of manipulating the parameters used to calculate the minimum achievable consumption to obtain lower values for the HWCI. Consequently, a complete understanding of the indicator requires that the report also includes a comprehensive justification of the parameters used in the calculation.
8. Conclusions
Supplementary Materials
Author Contributions
Funding
Data Availability Statement
Conflicts of Interest
References
- UNESCO. International Hydrological Programme. Managing Water Resources in Arid and Semi Arid Regions of Latin America and Caribbean. 2016. Available online: https://unesdoc.unesco.org/ark:/48223/pf0000244247 (accessed on 30 March 2022).
- Rodriguez, R.D.G.; Pruski, F.F.; Singh, V.P. Estimated Per Capita Water Usage Associated with Different Levels of Water Scarcity Risk in Arid and Semiarid Regions. Water Resour. Manag. 2016, 30, 1311–1324. [Google Scholar] [CrossRef]
- Sharafatmandrad, M.; Mashizi, A.K. Temporal and Spatial Assessment of Supply and Demand of the Water-yield Ecosystem Service for Water Scarcity Management in Arid to Semi-arid Ecosystems. Water Resour. Manag. 2021, 35, 63–82. [Google Scholar] [CrossRef]
- Deloitte. 2018 Travel and Hospitality Industry Outlook. 2018. Available online: https://www2.deloitte.com/content/dam/Deloitte/us/Documents/consumer-business/us-cb-2018-travel-hospitality-industry-outlook.pdf (accessed on 5 April 2022).
- Patterson, I.; Balderas, A. Continuing and Emerging Trends of Senior Tourism: A Review of the Literature. J. Popul. Ageing 2020, 13, 385–399. [Google Scholar] [CrossRef]
- Statista. Global Tourism Industry—Statistics & Facts. 2022. Available online: https://www.statista.com/topics/962/global-tourism/#dossierKeyfigures (accessed on 5 April 2022).
- Statista. Business Travel Spending Worldwide 2020. 2022. Available online: https://www.statista.com/statistics/1093295/business-travel-spending-worldwide/ (accessed on 5 April 2022).
- Statista. Leisure Travel Spending Worldwide 2020. 2022. Available online: https://www.statista.com/statistics/1093335/leisure-travel-spending-worldwide/ (accessed on 5 April 2022).
- Vogel, H. Travel Industry Economics; Springer Nature: Cham, Switzerland, 2016. [Google Scholar] [CrossRef]
- Styles, D.; Schoenberger, H.; Martos, J.L.G. Water management in the European hospitality sector: Best practice, performance benchmarks and improvement potential. Tour. Manag. 2015, 46, 187–202. [Google Scholar] [CrossRef]
- Gössling, S. New performance indicators for water management in tourism. Tour. Manag. 2015, 46, 233–244. [Google Scholar] [CrossRef]
- Flores, R.A.; Ghisi, E. Water Benchmarking in Buildings: A Systematic Review on Methods and Benchmarks for Water Conservation. Water 2022, 14, 473. [Google Scholar] [CrossRef]
- Bohdanowicz, P.; Martinac, I. Determinants and benchmarking of resource consumption in hotels—Case study of Hilton International and Scandic in Europe. Energy Build. 2007, 39, 82–95. [Google Scholar] [CrossRef]
- Tortella, B.D.; Tirado, D. Hotel water consumption at a seasonal mass tourist destination. The case of the island of Mallorca. J. Environ. Manag. 2011, 92, 2568–2579. [Google Scholar] [CrossRef]
- Lambert, A.; Hirner, W. Losses from Water Supply Systems: Standard Terminology and Recommended Performance Measures; IWA—The Blue Pages; IWA: London, UK, 2000. [Google Scholar]
- European Union. Directive (EU) 2020/2184 of the European Parliament and of the Council of 16 December 2020 on the Quality of Water Intended for Human Consumption. 2020. Available online: https://eur-lex.europa.eu/legal-content/EN/TXT/PDF/?uri=CELEX:32020L2184&from=ES (accessed on 4 April 2022).
- Redlin, M.H.; DeRoos, J.A. Water Consumption in the Lodging Industry: A Study Prepared for the Research Foundation of the American Hotel & Motel Association and the School of Hotel Administration at Cornell University; American Hotel & Motel Association: Washington, DC, USA, 1991. [Google Scholar]
- Brown and Caldwell Consultants. Water Conservation Survey, Hotel Customer Category; Brown and Caldwell Consultants: Los Angeles, CA, USA, 1990. [Google Scholar]
- Ploeser, J.H.; Pike, C.W.; Kobrick, J.D. Nonresidential Water Conservation: A Good Investment. J. Am. Water Work. Assoc. 1992, 10, 65–73. [Google Scholar] [CrossRef]
- East Bay Municipal Utility District. Water Conservation Baseline Study; East Bay Municipal Utility District: Oakland, CA, USA, 1994. [Google Scholar]
- Stipanuk, D. The U.S. lodging industry and the environment an historical view. Cornell Hotel Restaur. Adm. Q. 1996, 37, 39–45. [Google Scholar] [CrossRef]
- The Greater Vancouver Regional District. Study of Water Consumption and Conservation Potential in Greater Vancouver’s Hotel Industry; The Greater Vancouver Regional District: Vancouver, BC, Canada, 1998. [Google Scholar]
- NMOSE and Schultz Communications. A Water Conservation Guide for Commercial, Institutional and Industrial Users. 1999. Available online: https://www.ose.state.nm.us/WUC/PDF/cii-users-guide.pdf (accessed on 27 September 2021).
- Singh, J.; Clouden, F. A Review of Water Conservation Practices and Potential for Tourist Facilities in 1999. Available online: https://pdf.usaid.gov/pdf_docs/Pnacg407.pdf (accessed on 27 September 2021).
- Wastewater Gardens. Estimated Water Consumption in the World + per Appliance and Sector; Wastewater Gardens: Montebelluna, Italy, 2000. [Google Scholar]
- EAST. Why Conserve Water? DRAFT Produced through the USAID Environmental Audits for Sustainable Tourism Project (EAST) in Collaboration with OAS-USAID. 2001. Available online: https://caribbeanhotelandtourism.com/downloads/CHTAEF_WaterConservation.pdf (accessed on 27 September 2021).
- SPU, O’Neill & Siegelbaum, and The RICE Group. Hotel Water Conservation A Seattle Demonstration Prepared for: Seattle Public Utilities Resource Conservation Section. 2002. Available online: https://www.seattle.gov/documents/Departments/SPU/Documents/HotelWaterConservation.pdf (accessed on 27 September 2021).
- Shiming, D.; Burnett, J. Energy use and management in hotels in Hong Kong. Int. J. Hosp. Manag. 2002, 21, 371–380. [Google Scholar] [CrossRef]
- Cooley, H.; Hutchins-Cabibi, T.; Cohen, M.; Gleick, P.H.; Herberger, M.E. Pacific Institute for Studies in Development, and Western Resource Advocates, Hidden Oasis: Water Conservation and Efficiency in Las Vegas; Pacific Institute: Oakland, CA, USA, 2007; Available online: https://pacinst.org/wp-content/uploads/2007/11/hidden_oasis3.pdf (accessed on 27 September 2021).
- Bohdanowicz, P.; Simanic, B.; Martinac, I. Sustainable hotels—Environmental reporting according to Green Globe 21. Green Globes Canada, Gem UK, IHEI benchmarkhotel and Hilton environmental reporting. In Proceedings of the 2005 World Sustainable Building Conference, SB05Tokyo, Tokyo, Japan, 27–29 September 2005; Available online: https://www.irbnet.de/daten/iconda/CIB3740.pdf (accessed on 11 November 2022).
- The Brendle Group Inc. Benchmarking Task Force Collaboration for Industrial, Commercial & Institutional (ICI) Water Conservation. 2007. Available online: https://coloradowaterwise.org/Resources/Documents/ICI_toolkit/docs/Brendle%20Group%20and%20CWW%20ICI%20Benchmarking%20Study.pdf (accessed on 22 October 2021).
- USEPA. Water Efficiency in the Commercial and Institutional Sector: Considerations for a WaterSense Program. 2009. Available online: https://19january2017snapshot.epa.gov/www3/watersense/docs/ci_whitepaper.pdf (accessed on 27 September 2021).
- Natural Edge Project. Water Transformed: Sustainable Water Solutions for Climate Change Adaptation. 2009. Available online: https://eprints.qut.edu.au/85206/7/85206.pdf (accessed on 27 September 2021).
- North Carolina Division of Pollution Prevention and Environmental Assistance and North Carolina Division of Water Resources. Water Efficiency Manual Water Efficiency Manual for Commercial, Industrial and Institutional Facilities. May 2009. Available online: https://www.gwinnettcounty.com/static/departments/DWR/pdf/NCWaterEfficiencyManual.pdf (accessed on 13 November 2021).
- Tang, F.E. A Study of Water Consumption in Two Malaysian Resorts. Int. J. Environ. Chem. Ecol. Geol. Geophys. Eng. 2012, 6, 88–93. Available online: https://espace.curtin.edu.au/bitstream/handle/20.500.11937/32793/217526_217526a.pdf?sequence=2 (accessed on 27 September 2021).
- Gössling, S.; Peeters, P.; Hall, C.M.; Ceron, J.-P.; Dubois, G.; Lehmann, L.V.; Scott, D. Tourism and water use: Supply, demand, and security. An international review. Tour. Manag. 2012, 33, 1–15. [Google Scholar] [CrossRef]
- Styles, D.; Schönberger, H.; Luis, J.; Martos, G. Learning from Frontrunners Best Environmental Management Practice in the Tourism Sector; Publications Office of the European Union: Luxembourg, 2013. [Google Scholar] [CrossRef]
- Sterling Forests. Infrastructure Requirements. 2014. Available online: https://www.gaming.ny.gov/pdf/Redacted%20RFA%20Applications/RW%20Sterling%20Forest/SFR%20Alt%202/Sub-Binder%201/SFR%20Exhibit%20VIII.%20C.17.c.%20Necessary%20utility%20improvements.pdf (accessed on 22 October 2021).
- Revisor of Statutes. 4715.3600 Total Daily Water Requirements. May 2012. Available online: https://www.revisor.mn.gov/rules/4715.3600/version/2014-01-18T05:50:52-06:00 (accessed on 13 November 2021).
- Meade, B.; Gonzalez-Morel, P. Improving Water Use Efficiency in Jamaican Hotels and Resorts through the Implementation of Environmental Management Systems. 2011. Available online: https://core.ac.uk/download/pdf/60535473.pdf (accessed on 27 September 2021).
- Rajini, D.; Samarakoon, S.B.R.G.K. Factors Influencing Water Consumption in Hotel Facilities: A Literature Review. 2016. Available online: https://www.researchgate.net/publication/318881102 (accessed on 27 September 2021).
- CBECS. User’s Guide to the 2012 CBECS Large Buildings Water Usage Public Use Microdata File. 2017. Available online: https://www.eia.gov/consumption/commercial/reports/2012/water/pdf/users%20guide%20to%202012%20water%20public%20use.pdf (accessed on 27 September 2021).
- USEPA. Water Efficiency Management Guide Bathroom Suite Bathroom Suite. 2017. Available online: https://www.epa.gov/sites/default/files/2017-12/documents/ws-commercialbuildings-waterscore-bathroom-resource-guide.pdf (accessed on 27 September 2021).
- Hernaiz, M. Sustainable Operations in Hotels: Methodology to Benchmark the Water Consumption in Small and Medium-Sized Hotels in Germany; Hochschule fur Technik und Wirtschaft: Berlin, Germany, 2017; Available online: https://www.theseus.fi/bitstream/handle/10024/133965/MasterThesis-MHernaiz.pdf?sequence=1 (accessed on 13 November 2021).
- USEPA. Saving Water in Hotels. March 2016. Available online: https://19january2017snapshot.epa.gov/www3/watersense/docs/saving-water-in-hotels_fact%20sheet_508_Mar2016.pdf (accessed on 13 November 2021).
- Ricaurte, E.; Jagarajan, R. Hotel Sustainability Benchmarking Index 2021: Carbon, Energy, and Water. 2021. Available online: https://ecommons.cornell.edu/handle/1813/109990 (accessed on 15 November 2022).
- Blokker, E.J.M.; Pieterse-Quirijns, E.J.; Vreeburg, J.H.G.; van Dijk, J.C. Simulating Nonresidential Water Demand with a Stochastic End-Use Model. J. Water Resour. Plan. Manag. 2011, 137, 511–520. [Google Scholar] [CrossRef]
- Cobacho, R.; Arregui, F.; Parra, J.; Cabrera, E. Improving efficiency in water use and conservation in Spanish hotels. Water Sec. Technol. Water Supply 2005, 5, 273–279. [Google Scholar] [CrossRef]
- Dziegielewski, B. Commercial and Institutional End Uses of Water Subject Area; American Water Works Association: Denver, CO, USA, 2000. [Google Scholar]
- Sirikan, K.; Perret, D.; Tse, R. Water Benchmarking Study: Restaurants and Microbreweries in the City of Vancouver. 2018. Available online: https://sustain.ubc.ca/sites/default/files/2018-48%20Water%20benchmarking%20study%20-%20Restaurants%20%26%20microbreweries%20in%20the%20City%20of%20Vancouver_Sirikan.pdf (accessed on 11 October 2021).
- Kiefer, J.C.; Krentz, L.R.; Dziegielewski, B. Methodology for Evaluating Water Use in the Commercial, Institutional, and Industrial Sectors. 2015. Available online: https://www.waterrf.org/resource/methodology-evaluating-water-use-commercial-institutional-and-industrial-sectors (accessed on 16 November 2021).
- Vanschenkhof, M. An Investigation of Water Usage in Casual Dining Restaurants in Kansas. Ph.D. Thesis, Kansas State University, Manhattan, KS, USA, 2011. Available online: https://krex.k-state.edu/dspace/bitstream/handle/2097/13114/MatthewVanSchenkhof2011.pdf?sequence=5&isAllowed=y (accessed on 16 November 2021).
- USEPA and WaterSense. Saving Water in Restaurants. 2012. Available online: https://www.epa.gov/sites/default/files/2017-01/documents/ws-commercial-factsheet-restaurants.pdf (accessed on 1 February 2022).
- Burgesser, J. Restaurant Water Conservation. Denver. May 2015. Available online: https://www.denvergov.org/files/assets/public/climate-action/documents/certifiably-green/water-conservation-restaurants.pdf (accessed on 1 February 2022).
- USEPA. Best Management Practices for Commercial and Institutional Facilities. 2012. Available online: https://www.epa.gov/sites/production/files/2017-02/documents/watersense-at-work_final_508c3.pdf (accessed on 25 May 2021).
- Mayer, P.; Lander, P.; Glenn, D. Outdoor Water Savings Research Initiative. Chicago. January 2015. Available online: https://www.allianceforwaterefficiency.org/sites/www.allianceforwaterefficiency.org/files/highlight_documents/AWE-OWSRI-Phase-1-Final-Report-01-2015.pdf (accessed on 11 November 2022).
- USEPA. Water Efficiency Management Guide Landscaping and Irrigation. November 2017. Available online: https://www.epa.gov/sites/default/files/2017-12/documents/ws-commercialbuildings-waterscore-irrigation-landscape-guide.pdf (accessed on 18 November 2021).
- USEPA. WaterSense—Water Budget Approach. July 2014. Available online: https://www.epa.gov/sites/default/files/2017-01/documents/ws-homes-water-budget-approach.pdf (accessed on 18 November 2021).
- Rodríguez, R.H.; Chamochín, R.; Vilar, J.L.; Suárez, F. Eficiencia en el Uso del Agua en Jardinería en la Comunidad de Madrid; Canal de Isabel II: Madrid, Spain, 2010. [Google Scholar]
- FEMP. Guidelines for Estimating Unmetered Landscaping Water Use. July 2010. Available online: https://www.energy.gov/sites/prod/files/2013/10/f3/est_unmetered_landscape_wtr.pdf (accessed on 11 November 2022).
- Kjelgren, R.; Beeson, R.C.; Pittenger, D.P.; Montague, T. Simplified Landscape Irrigation Demand Estimation: SLIDE Rules. Appl. Eng. Agric. 2016, 32, 363–378. [Google Scholar] [CrossRef]
- Pittenger, D. Methodology for Estimating Landscape Irrigation Demand Review and Recommendations. April 2014. Available online: https://bseacd.org/uploads/BSEACD_Irr_Demand_Meth_Rprt_2014_Final_140424.pdf (accessed on 18 November 2021).
- Allen, R.G.; Pereira, L.S.; Raes, D.; Smith, M. Crop Evapotranspiration-Guidelines for Computing Crop Water Requirements-FAO Irrigation and Drainage Paper 56. January 1998. Available online: https://www.fao.org/3/x0490e/x0490e00.htm (accessed on 11 November 2022).
- Seguido, Á.F.M.; Hernández, M.H. El uso y consumo de agua en los jardines de las viviendas del litoral de Alicante (España). Cuad. Geogr. 2016, 98, 29–44. [Google Scholar]
- UNEP. World Atlas of Desertification; UNEP: Nairobi, Kenya, 1997. [Google Scholar]
- Leggett, R. How Many Gallons of Water Does the Average Washing Machine Hold When Full? SF Gate, 27 December 2018. Available online: https://homeguides.sfgate.com/much-water-mini-washer-use-85056.html (accessed on 16 November 2021).
- DeOreo, W.B.; Mayer, P.; Dziegielewski, B.; Kiefer, J. Residential End Uses of Water. 2016. Available online: https://www.redwoodenergy.tech/wp-content/uploads/2017/07/4309B-June-16-2016.pdf (accessed on 16 November 2021).
- Gleick, P.H.; Haasz, D.; Henges-Jeck, C.; Srinivasan, V.; Wolff, G.; Cushing, K.K.; Mann, A. Waste Not, Want Not: The Potential for Urban Water Conservation in California; Pacific Institute for Studies in Development, Environment, and Security: Oakland, CA, USA, November 2003; Available online: https://pacinst.org/wp-content/uploads/2003/11/waste_not_want_not_full_report.pdf (accessed on 16 November 2021).
- Troy, P.; Holloway, D.; Randolph, B. Water Consumption and the Built Environment: A Social and Behavioural Analysis; City Futures Research Centre: Sydney, NSW, USA, December 2005; Available online: https://cityfutures.be.unsw.edu.au/documents/34/waterconsumption.pdf (accessed on 16 November 2021).
- USEPA. Water Efficiency Management Guide Residential Kitchen and Laundry. 2017. Available online: https://www.epa.gov/sites/default/files/2017-10/documents/ws-commercialbuildings-waterscore-residential-kitchen-laundry-guide.pdf (accessed on 9 December 2021).
- GE. Washer Modified Energy Factor and Water Factor. 2021. Available online: https://products.geappliances.com/appliance/gea-support-search-content?contentId=18015 (accessed on 16 November 2021).
- Bobák, P.; Pavlas, M.; Kšenzuliak, V.; Stehlík, P. Analysis of energy consumption in professional laundry care process. Chem. Eng. Trans. 2010, 21, 109–114. [Google Scholar] [CrossRef]
- JENSEN. Washroom Technology. 2021. Available online: https://www.jensen-group.com/products/washroom-technology.html (accessed on 16 November 2021).
- Hof, A.; Morán-Tejeda, E.; Lorenzo-Lacruz, J.; Blázquez-Salom, M. Swimming Pool Evaporative Water Loss and Water Use in the Balearic Islands (Spain). Water 2018, 10, 1883. [Google Scholar] [CrossRef]
- Blázquez, J.L.F.; Maestre, I.R.; Gallero, F.J.G.; Gómez, P. Experimental test for the estimation of the evaporation rate in indoor swimming pools: Validation of a new CFD-based simulation methodology. Build. Environ. 2018, 138, 293–299. [Google Scholar] [CrossRef]
- Lund, J.W. Design Considerations for Pools and Spas (Natatoriums). Geo Heat Cent. Q. Bull. 2000, 21, 6–8. Available online: https://www.researchgate.net/publication/251209681_Design_Considerations_form_Pools_and_Spas_Natatoriums (accessed on 4 February 2022).
- Silva, F.; Antão-Geraldes, A.M.; Zavattieri, C.; Afonso, M.J.; Freire, F.; Albuquerque, A. Improving Water Efficiency in a Municipal Indoor Swimming-Pool Complex: A Case Study. Appl. Sci. 2021, 11, 10530. [Google Scholar] [CrossRef]
- Maglionico, M.; Stojkov, I. Water consumption in a public swimming pool. Water Sci. Technol. Water Supply 2015, 15, 1304–1311. [Google Scholar] [CrossRef]
- Quinn, R.; Bannister, P.; Munzinger, M.; Bloomfield, C. Water Efficiency Guide: Office and Public Buildings; Department of the Environment and Heritage: Brisbane, QLD, Australia, 2006. [Google Scholar]
- Cobb & Douglas Public Health. Bathing Load Calculation Guide. 2019. Available online: https://www.cobbanddouglaspublichealth.com/wp-content/uploads/2019/03/Swimming-Pools-Handout-Bathing-Load-Calculation-V.2-2019-03-07-1.pdf (accessed on 8 February 2022).
- NRH Consumer Health. Calculating Maximum User Load for Texas Public Swimming Pools/Spas. 2021. Available online: https://www.nrhtx.com/DocumentCenter/View/6177/Calculating-Maximum-Number-of-Users-in-Swimming-Pools-and-Spas-2021?bidId= (accessed on 8 February 2022).
- Colorado WaterWise and Aquacraft Inc. Guidebook of BEST Practices for Municipal Water Conservation in Colorado; Colorado WaterWise and Aquacraft Inc.: Denver, CO, USA, 2010. [Google Scholar]
- Hawkins, G. Rules of Thumb. Guidelines for Building Services; BSRIA: Bracknell, UK, 2011. [Google Scholar]
- Instituto Vasco de Estadística. Basque Country Tourism Data Explorer. Hotel Establishments. 2022. Available online: https://en.eustat.eus/estadisticas/tema_101/opt_0/tipo_1/temas.html (accessed on 30 March 2022).
- Lambert, A.O.; Lalonde, A. Leakage 2005. In Proceedings of the Using Practical Predictions of Economic Intervention Frequency to Calculate Short-Run Economic Leakage Level, with or without Pressure Management, Leakage 2005, Halifax, NS, Canada, 12–14 September 2005. [Google Scholar]
- Gabarda-Mallorquí, A.; Garcia, X.; Ribas, A. Mass tourism and water efficiency in the hotel industry: A case study. Int. J. Hosp. Manag. 2017, 61, 82–93. [Google Scholar] [CrossRef]
- Sadi, I.A.; Adebitan, E.O. Waste Water Recycling in the Hospitality Industry. Acad. J. Interdiscip. Stud. 2014, 3, 87. [Google Scholar] [CrossRef][Green Version]
- Estévez, S.; Feijoo, G.; Moreira, M.T. Environmental synergies in decentralized wastewater treatment at a hotel resort. J. Environ. Manag. 2022, 317, 115392. [Google Scholar] [CrossRef]
- Zorpas, A.A.; Voukkali, I.; Loizia, P. The impact of tourist sector in the waste management plans. Desalination Water Treat. 2015, 56, 1141–1149. [Google Scholar] [CrossRef]
- Cruz-Pérez, N.; Rodríguez-Martín, J.; Martín, J.F.A.; García, C.; Ruiz-Rosa, I.; Santamarta, J.C. Improvements in hotel water consumption: Case study of a five-star hotel (Canary Islands, Spain). Urban Water J. 2021, 19, 32–39. [Google Scholar] [CrossRef]
- Perez, F.J.D.; Chinarro, D.; Mouhaffel, A.G.; Martin, R.D.; Otin, R.P. Modelling of Energy and Water Supplies in Hotels in Lanzarote and Fuerteventura with and Without Desalination Plant (SWROP). Indian J. Sci. Technol. 2016, 9, 1–19. [Google Scholar] [CrossRef]
- Barahona-Pike, D.; Posas-Medina, V.; Perez-Alvarado, R.; Ramos, E.; Jimenez, C.H.O. Solar HDH Desalination for Coastal Hotels: Literature Review and Research Trend. MATEC Web Conf. 2019, 293, 05001. [Google Scholar] [CrossRef][Green Version]
- Filimonau, V.; Dickinson, J.; Robbins, D.; Huijbregts, M.A. Reviewing the carbon footprint analysis of hotels: Life Cycle Energy Analysis (LCEA) as a holistic method for carbon impact appraisal of tourist accommodation. J. Clean. Prod. 2011, 19, 1917–1930. [Google Scholar] [CrossRef]
- Yin, P.; Tsai, H.; Wu, J. A hotel life cycle model based on bootstrap DEA efficiency. Int. J. Contemp. Hosp. Manag. 2015, 27, 918–937. [Google Scholar] [CrossRef]
- Filimonau, V.; Dickinson, J.; Robbins, D. The carbon impact of short-haul tourism: A case study of UK travel to Southern France using life cycle analysis. J. Clean. Prod. 2014, 64, 628–638. [Google Scholar] [CrossRef]


| Micro-Component | Rooms | Kitchen | Laundry | Pools | Irrigation | Cooling and Heating |
|---|---|---|---|---|---|---|
| Aim of use | Sanitary | Meals preparation and cleaning | Clothes washing | Recreational | Garden watering | Air conditioning |
| Devices | Taps Toilets Bidets Baths Showers | Taps Dishwashers | Washers | Pools Spas Water attractions | Hoses Sprinklers Drippers | Cooling towers |
| Influencing factors | Technical features of devices | Technical features of devices | Technical features of devices | Climate and evaporation | Technical features of irrigation systems, type of plants, grass area | Technical characteristics of the AC system |
| Dependence on hotel’s occupancy rate | High | High | High | Medium | Low | Medium |
| Micro-Component | Rooms | Kitchen | Laundry | Pools | Irrigation | Cooling and Heating |
|---|---|---|---|---|---|---|
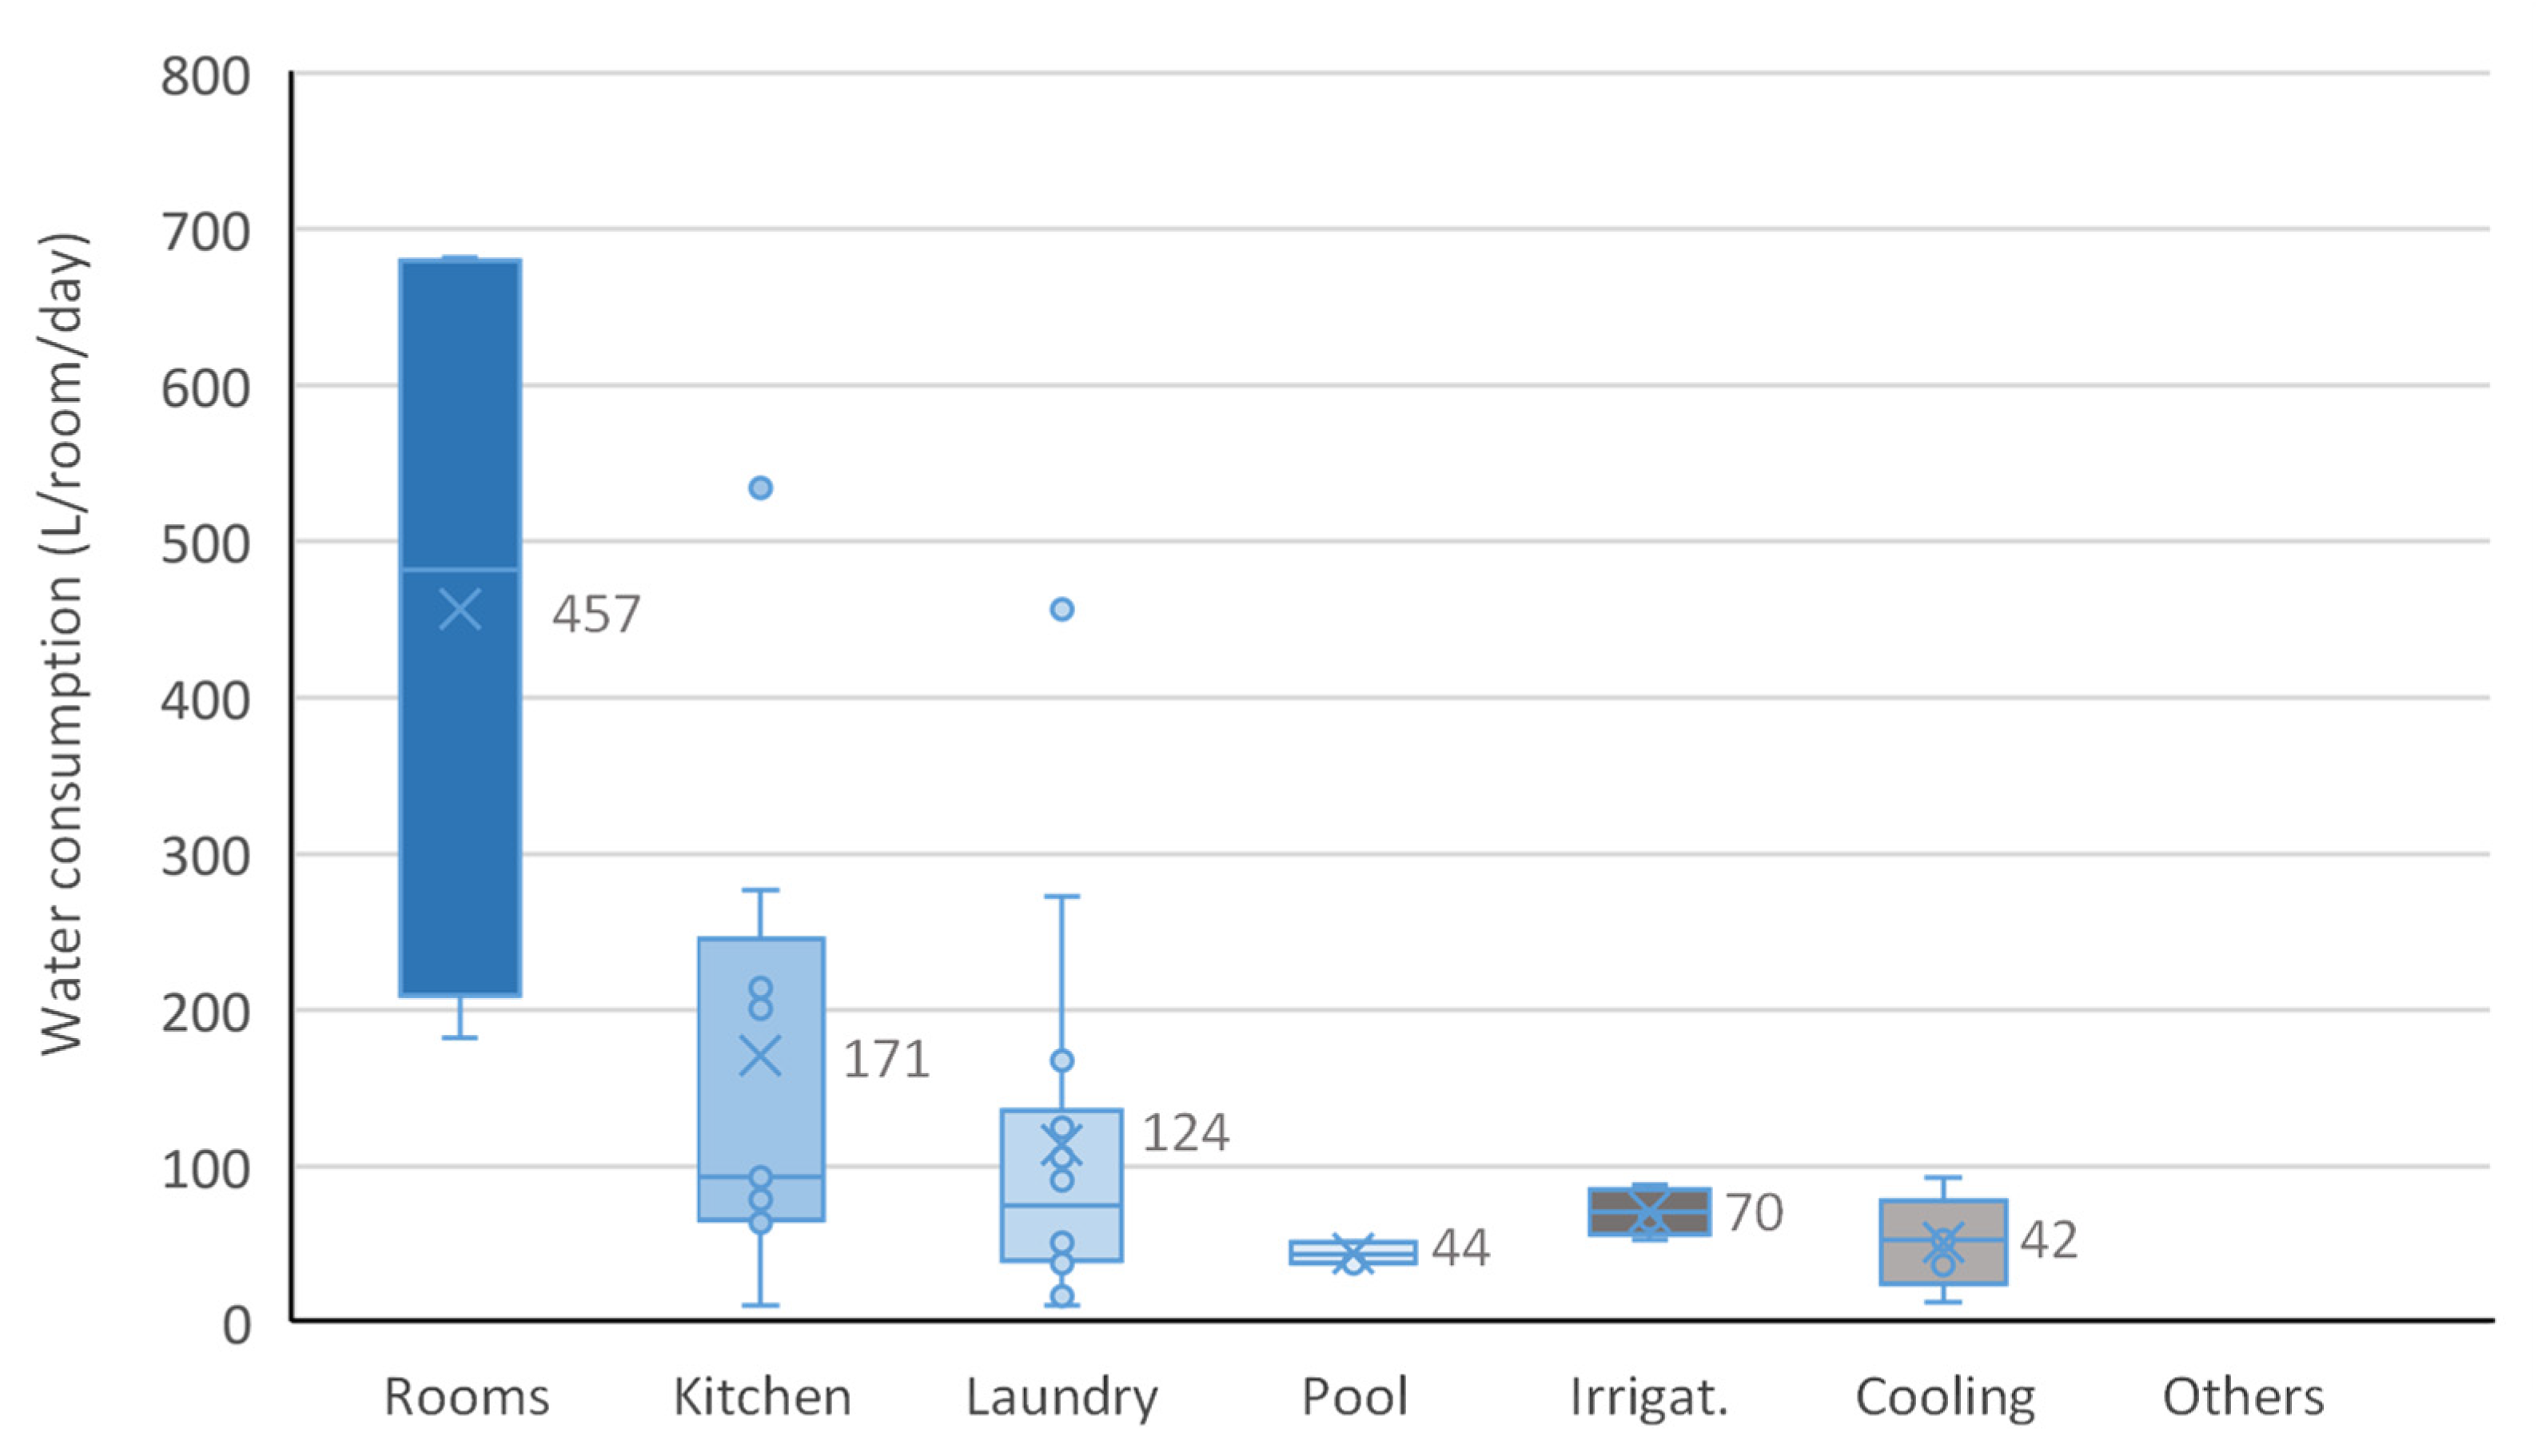
| Average consumption (L/room/day) | 457 | 171 | 124 | 44 | 70 | 42 |
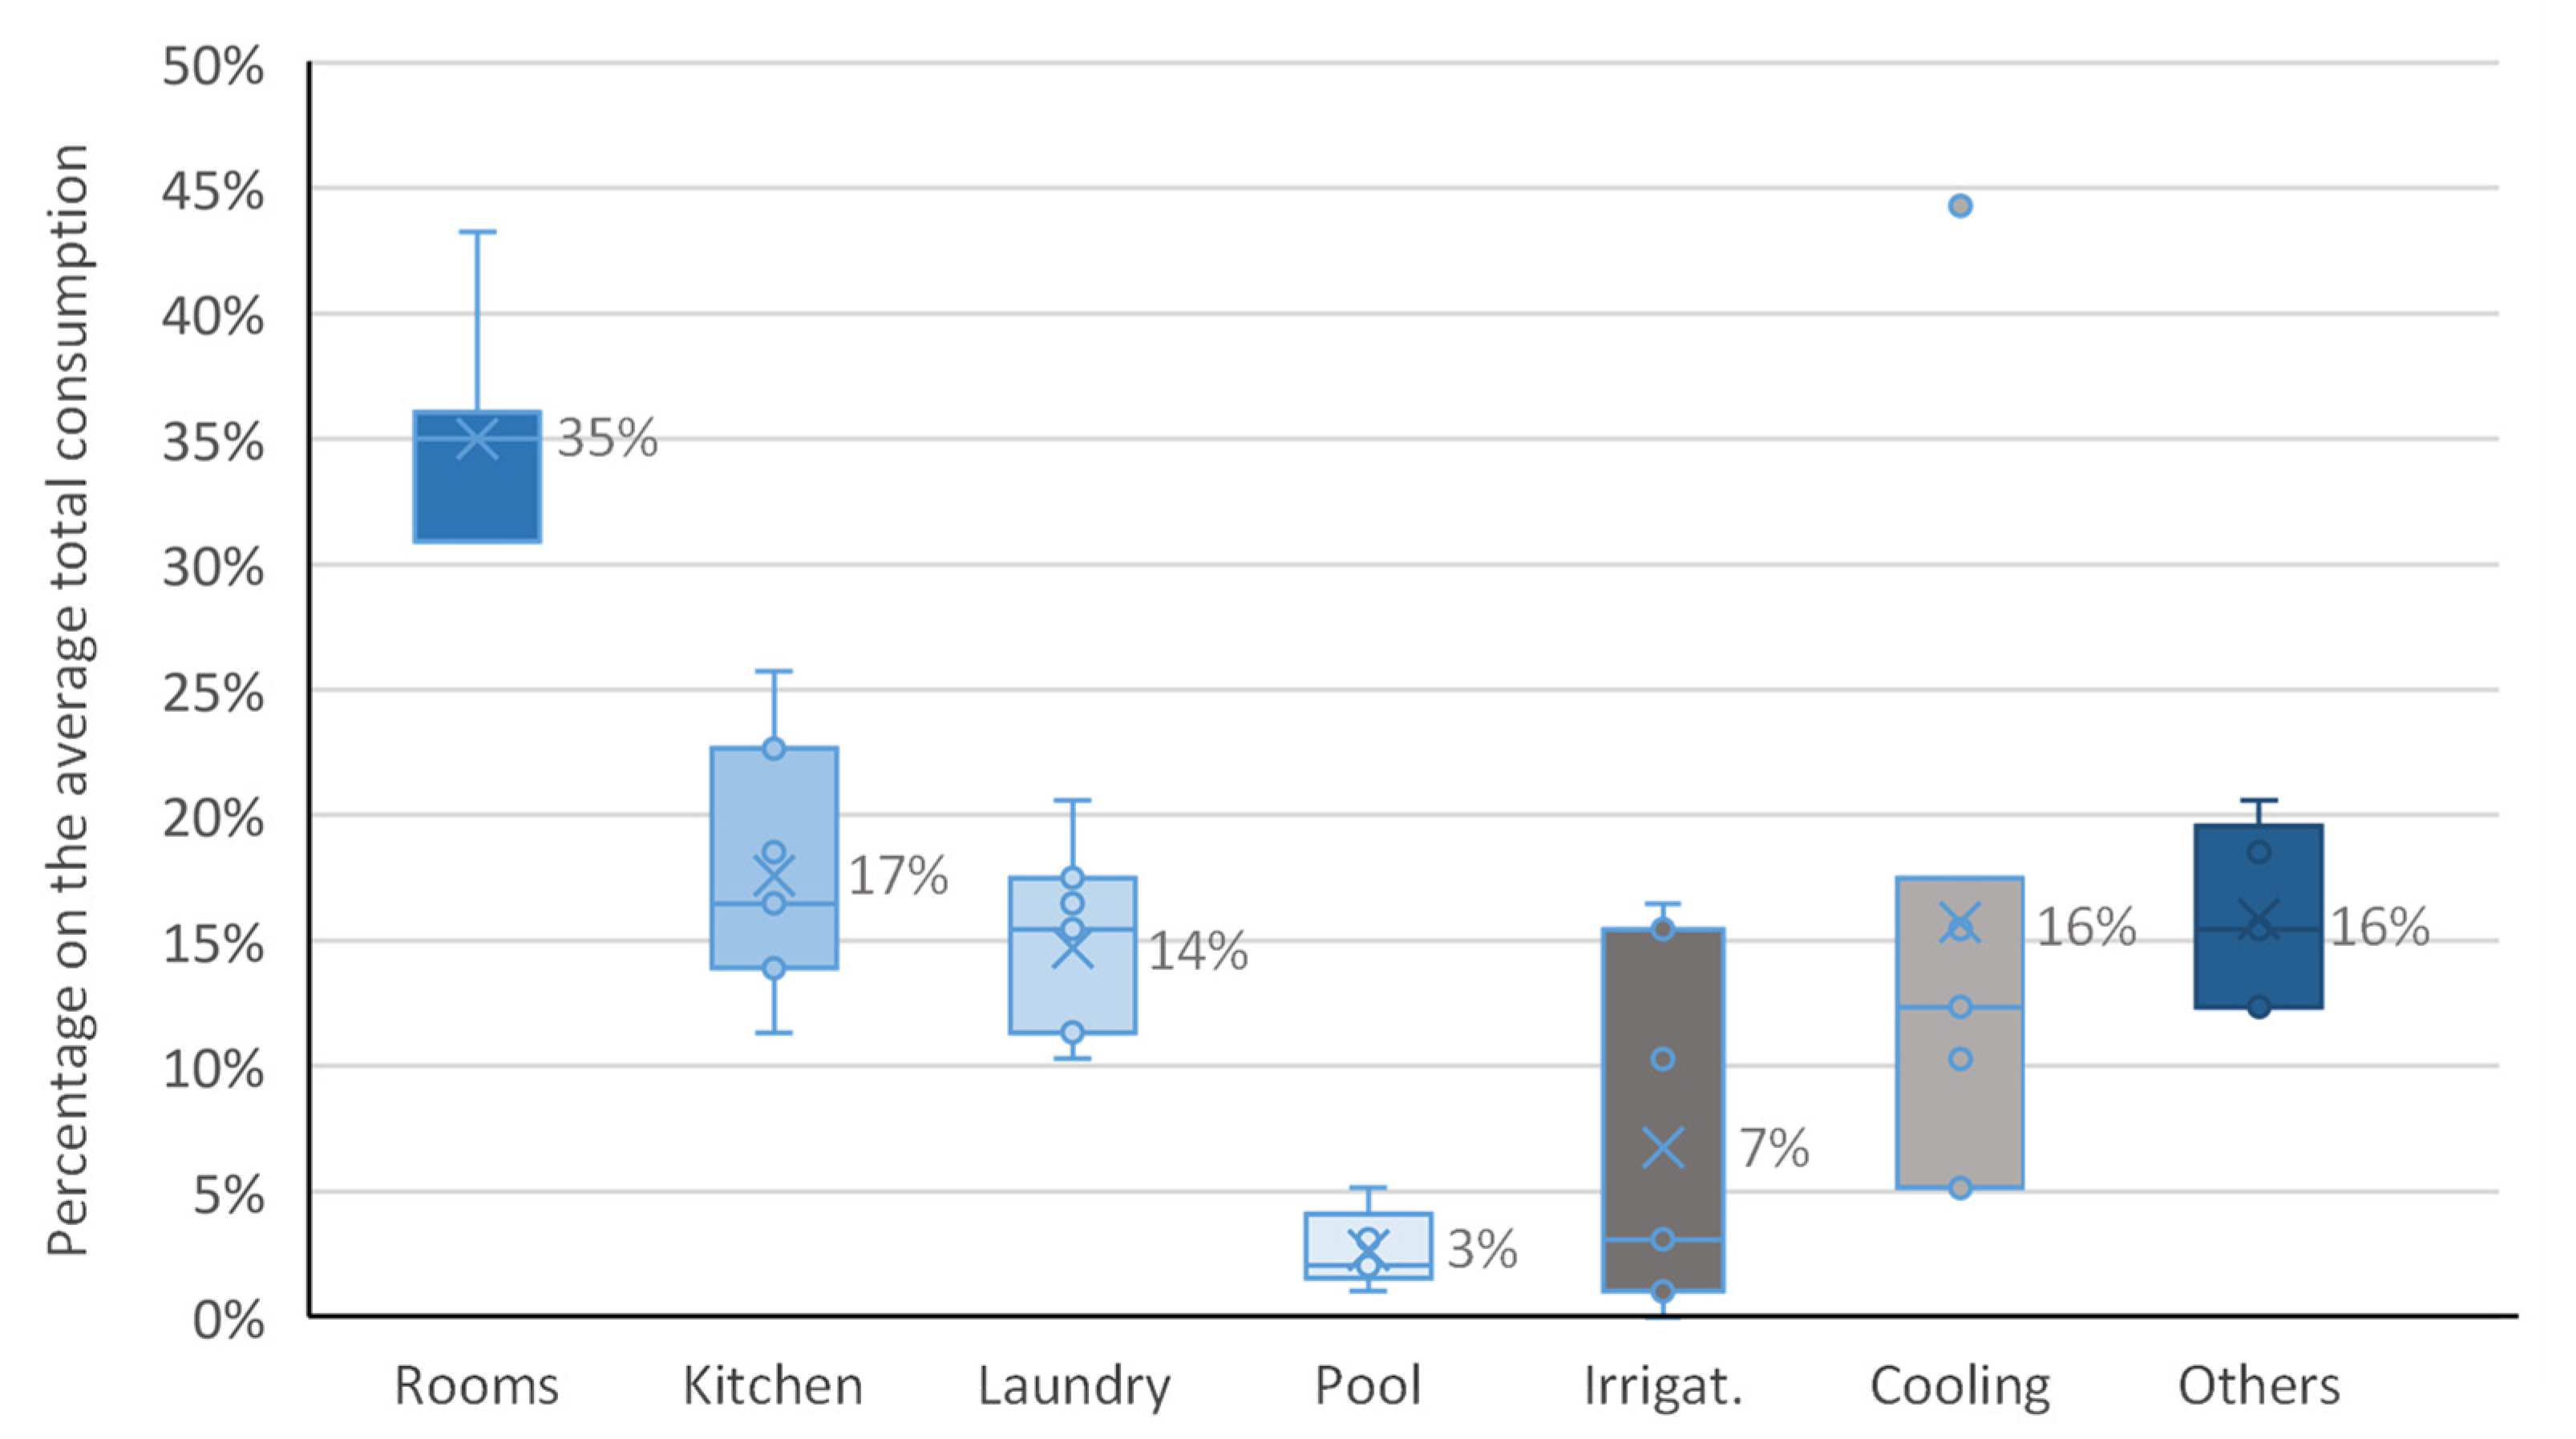
| Contribution to total hotel consumption | 35% | 21% | 15% | 2% | 18% | 14% |
| Water Appliance | Units | Standard | Efficient |
|---|---|---|---|
| Faucets | gpm | 2.20 | 1.50 |
| L/min | 8.33 | 5.68 | |
| Showerheads | gpm | 2.50 | 2.00 |
| L/min | 9.46 | 7.57 | |
| Toilets | gpf | 1.60 | 1.28 |
| L/flush | 6.06 | 4.85 |
| Water Appliance | Variable (Unit) | [47] | [48] |
|---|---|---|---|
| Faucets | Time of use (min/guest/day) | 1.6 | 4.8 |
| Showerheads | Time of use (min/guest/day) | 8.5 | 3.5 |
| Toilets | flushes (flushes/guest/day) | 4.0 | 3.5 |
| Climate Type | ET0 (mm/Year) |
|---|---|
| Cold tundra | 0–400 |
| Temperate regions | 400–1000 |
| Mild Mediterranean | 1000–1500 |
| Damp tropical regions | 1500–2000 |
| Arid zones | 2000–2800 |
| Plant Type | PFi |
|---|---|
| Turf (cool season) | 0.8 |
| Herbaceous perennials, annual flowers, bedding plants | 0.6 |
| Turf (warm season) | 0.6 |
| Woody plants (humid) | 0.7 |
| Woody plants (arid) | 0.5 |
| Desert plants | 0.3 |
| Irrigation System | Kri |
|---|---|
| Sprinkler | 0.75 |
| Diffuser | 0.75 |
| Drip | 0.90 |
| Manual hosing | 0.95 |
| Gardening Technique | Kti |
|---|---|
| Irrigation stepping | 0.95 |
| Mycorrhizae | 0.80 |
| Mulching (textile + bark clippings) | 0.80 |
| Mulching (textile + gravel) | 0.75 |
| Climate Type | ET0 (mm/Year) | PFi | MCBI (m3/Year) | |
|---|---|---|---|---|
| Temperate regions | 700 | 0.7 | (11) | |
| Mild Mediterranean | 1250 | 0.6 | (12) | |
| Damp tropical regions | 1750 | 0.5 | (13) |
| Cloth Type | Mass (g) |
|---|---|
| Towel—big | 600 |
| Towel—medium | 250 |
| Towel—small | 100 |
| Bed linen | 600 |
| Pillow cloth | 100 |
| Duvet | 800 |
| Tablecloth | 600 |
| Napkin | 20 |
| Cloth Type | Washes Per Guest and Day |
|---|---|
| Towel—big | 1 |
| Towel—medium | 1 |
| Towel—small | 1 |
| Bed linen | 1/2 |
| Pillow cloth | 1/2 |
| Duvet | 1/5 |
| Cloth Type | Washes Per Meal and Day |
|---|---|
| Tablecloth | 1/2 |
| Napkin | 2 |
| T (°C) | pw (bar) | pw (kPa) |
|---|---|---|
| 15 | 0.0170 | 1.70 |
| 20 | 0.0234 | 2.34 |
| 25 | 0.0317 | 3.17 |
| 30 | 0.0425 | 4.25 |
| 35 | 0.0563 | 5.63 |
| 40 | 0.0738 | 7.38 |
| T (°C) | 40% Relative Humidity | 50% Relative Humidity | 60% Relative Humidity | |||
|---|---|---|---|---|---|---|
| pa (bar) | pa (kPa) | pa (bar) | pa (kPa) | pa (bar) | pa (kPa) | |
| 20 | 0.0094 | 0.94 | 0.0117 | 1.17 | 0.0140 | 1.40 |
| 25 | 0.0127 | 1.27 | 0.0158 | 1.58 | 0.0190 | 1.90 |
| 30 | 0.0170 | 1.70 | 0.0212 | 2.12 | 0.0255 | 2.55 |
| Type of Pool | Fa |
|---|---|
| Residential pool | 0.50 |
| Condominium | 0.65 |
| Therapy | 0.65 |
| Hotel | 0.80 |
| Public, schools | 1.00 |
| Whirlpools, spas | 1.00 |
| Wave pools, slides | >1.5 |
| Hotel ID | H1 | H2 | H3 | H4 | H5 | H6 | |
|---|---|---|---|---|---|---|---|
| Hotel Style | Rural Business | Urban Luxury | Urban Budget | Rural Small | Urban Business | Urban Luxury | |
| Number of Rooms | 114 | 36 | 76 | 42 | 200 | 145 | |
| Restaurant’s coefficients | Breakfast | 1 | 1 | 1 | 1 | 1 | 1 |
| Lunch | 0.5 | 0 | 0.3 | 0.7 | 0.7 | 0.5 | |
| Dinner | 1.2 | 0 | 0.5 | 1.5 | 1 | 1.2 | |
| Garden area (m2) | 12,500 | 0 | 0 | 3000 | 465 | 0 | |
| Swimming Pool | Area (m2) | 0 | 0 | 0 | 100 | 175 | 0 |
| % Open | 0 | 0 | 0 | 0.25 | 0.25 | 0 | |
| Swimmers/day | 0 | 0 | 0 | 15 | 30 | 0 | |
| Actual Water Consumption for Each Hotel (m3) | Average Occupation Rate Per Year | ||||||
|---|---|---|---|---|---|---|---|
| Hotel ID | H1 | H2 | H3 | H4 | H5 | H6 | |
| 2017 | 30,783 | 3972 | 4827 | 3349 | 44,462 | 17,798 | 65.4% |
| 2018 | 34,226 | 4371 | 4491 | 3430 | 44,946 | 18,013 | 67.5% |
| 2019 | 45,834 | 4488 | 4314 | 3289 | 43,642 | 17,403 | 68.4% |
| 2020 | 38,013 | 3058 | 2674 | 1417 | - | - | 41.0% |
| Year | Avg. Occ. Rate | H1 | H2 | H3 | H4 | H5 | H6 | |
|---|---|---|---|---|---|---|---|---|
| 2017 | 65.4% | Actual consump. (m3/year) | 30,783 | 3972 | 4827 | 3349 | 44,462 | 17,798 |
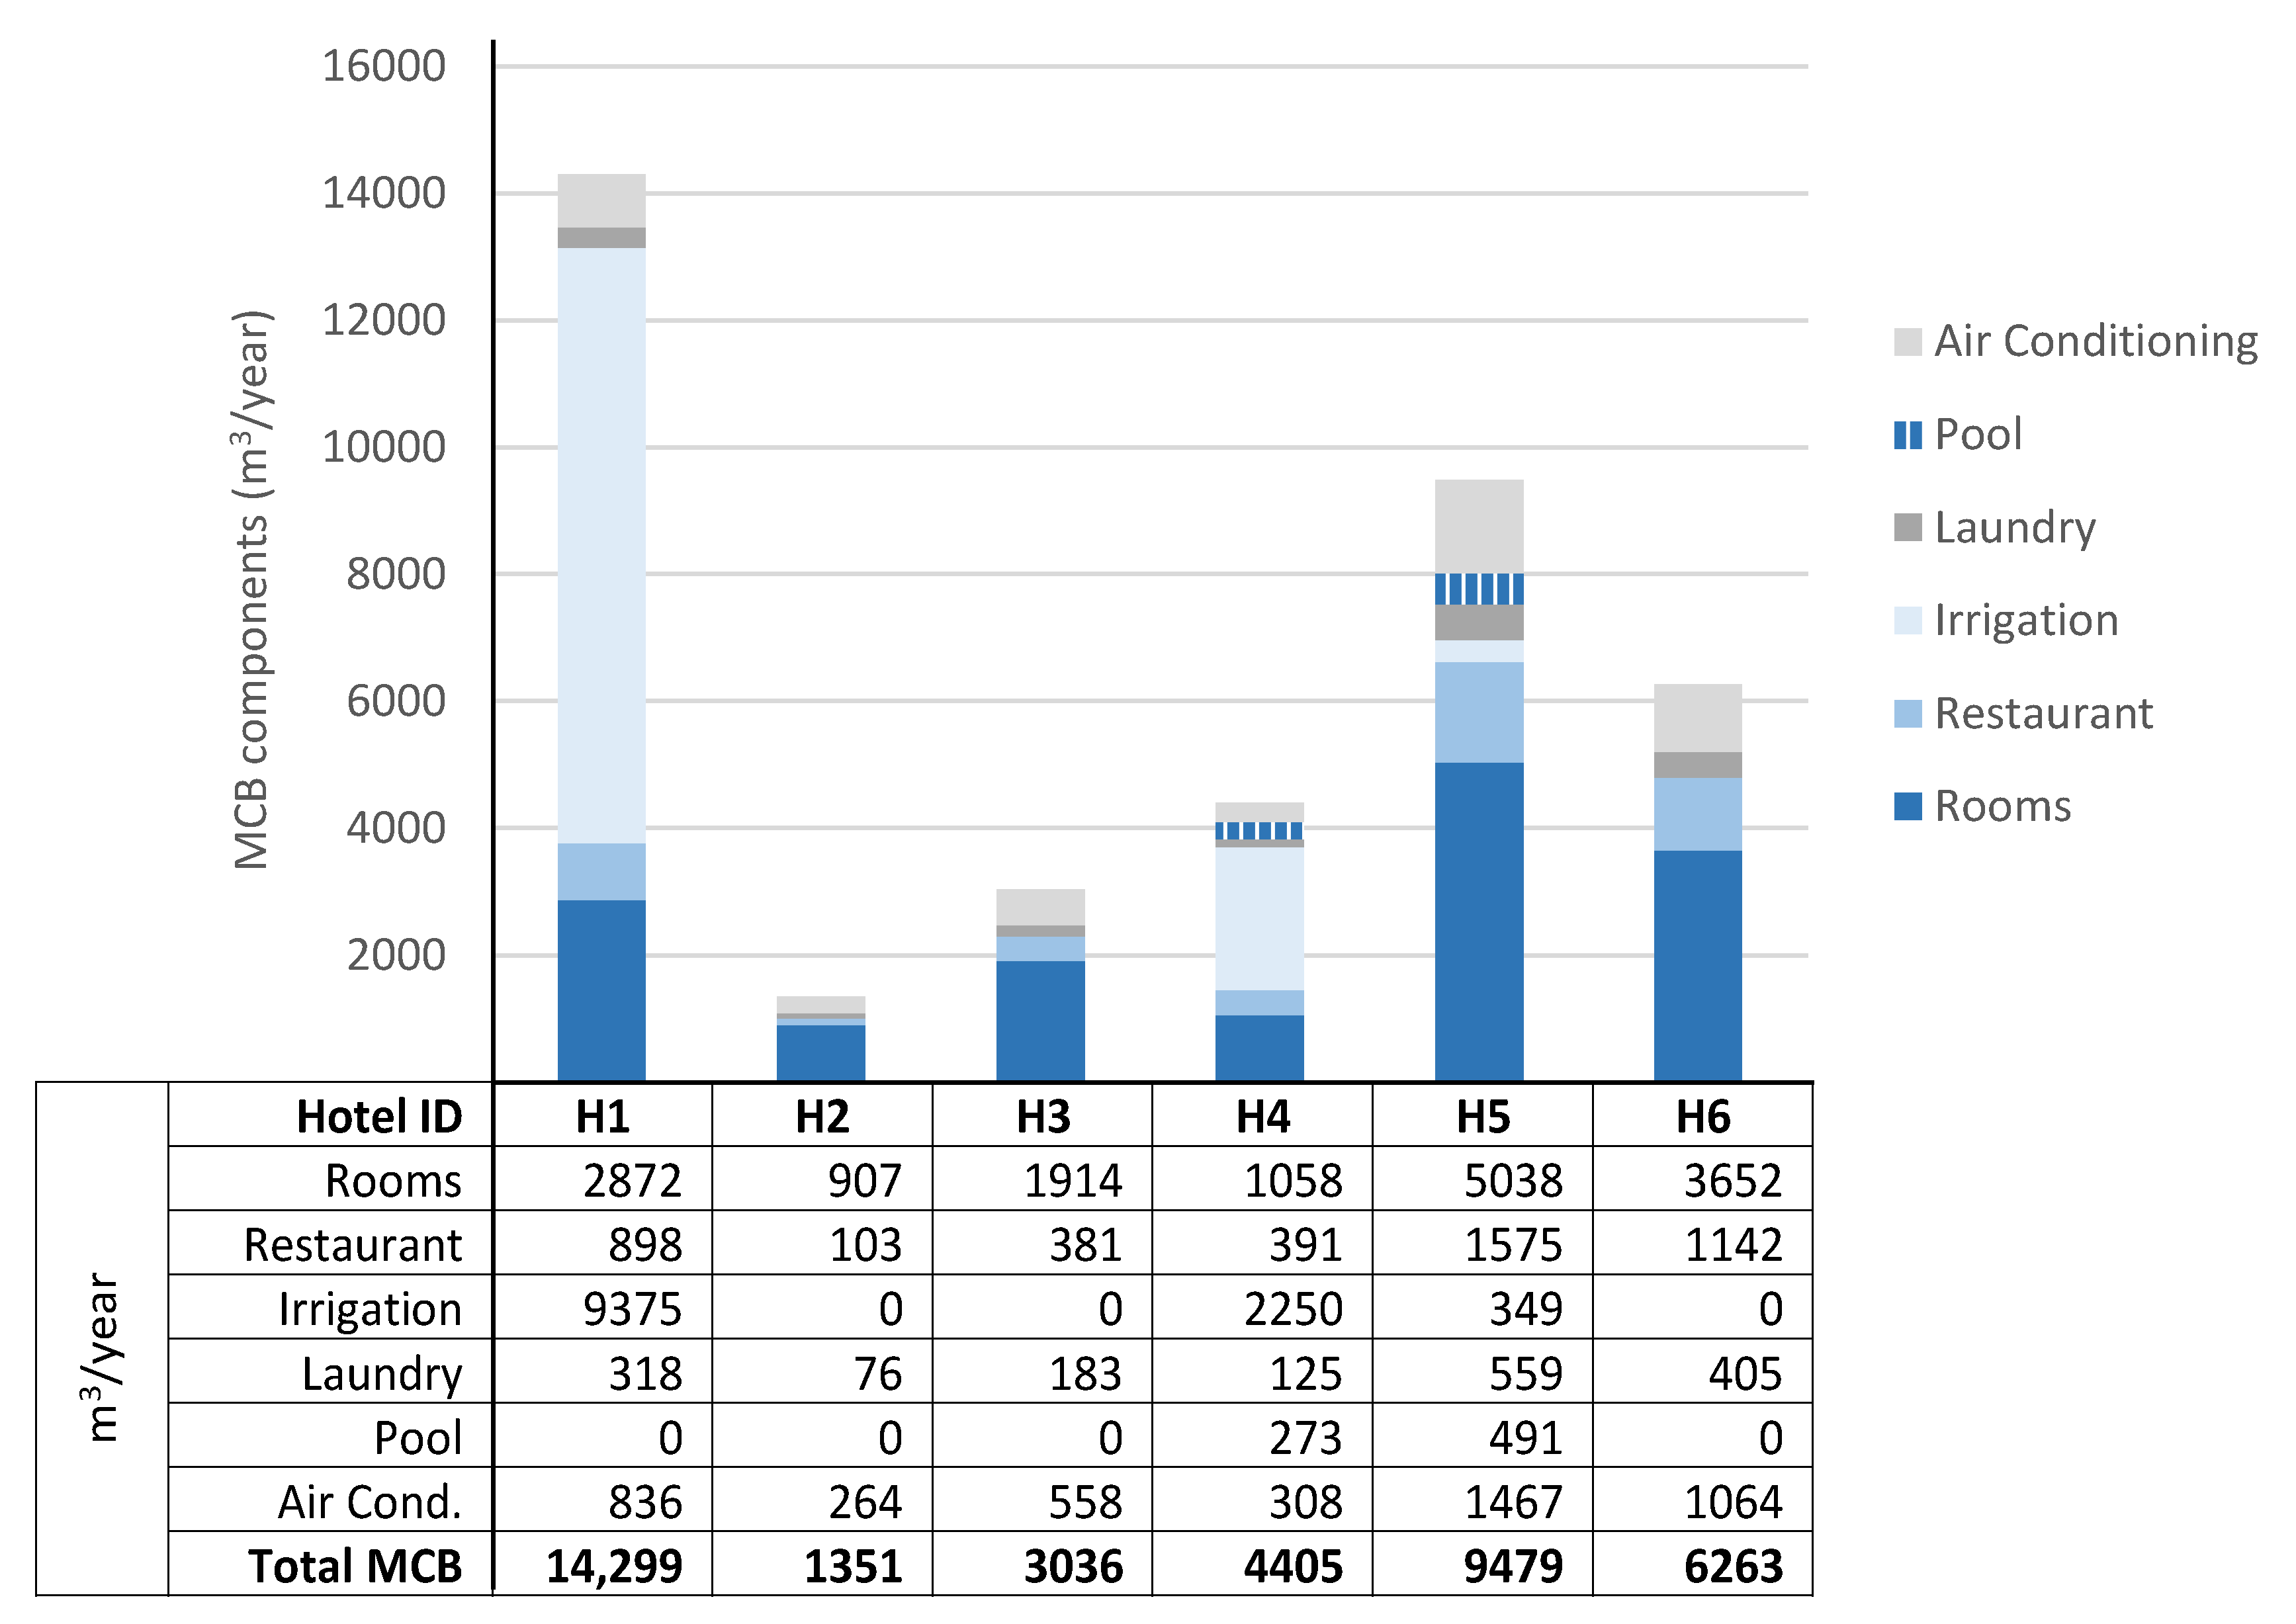
| MCB (m3/year) | 14,299 | 1351 | 3036 | 4405 | 9479 | 6263 | ||
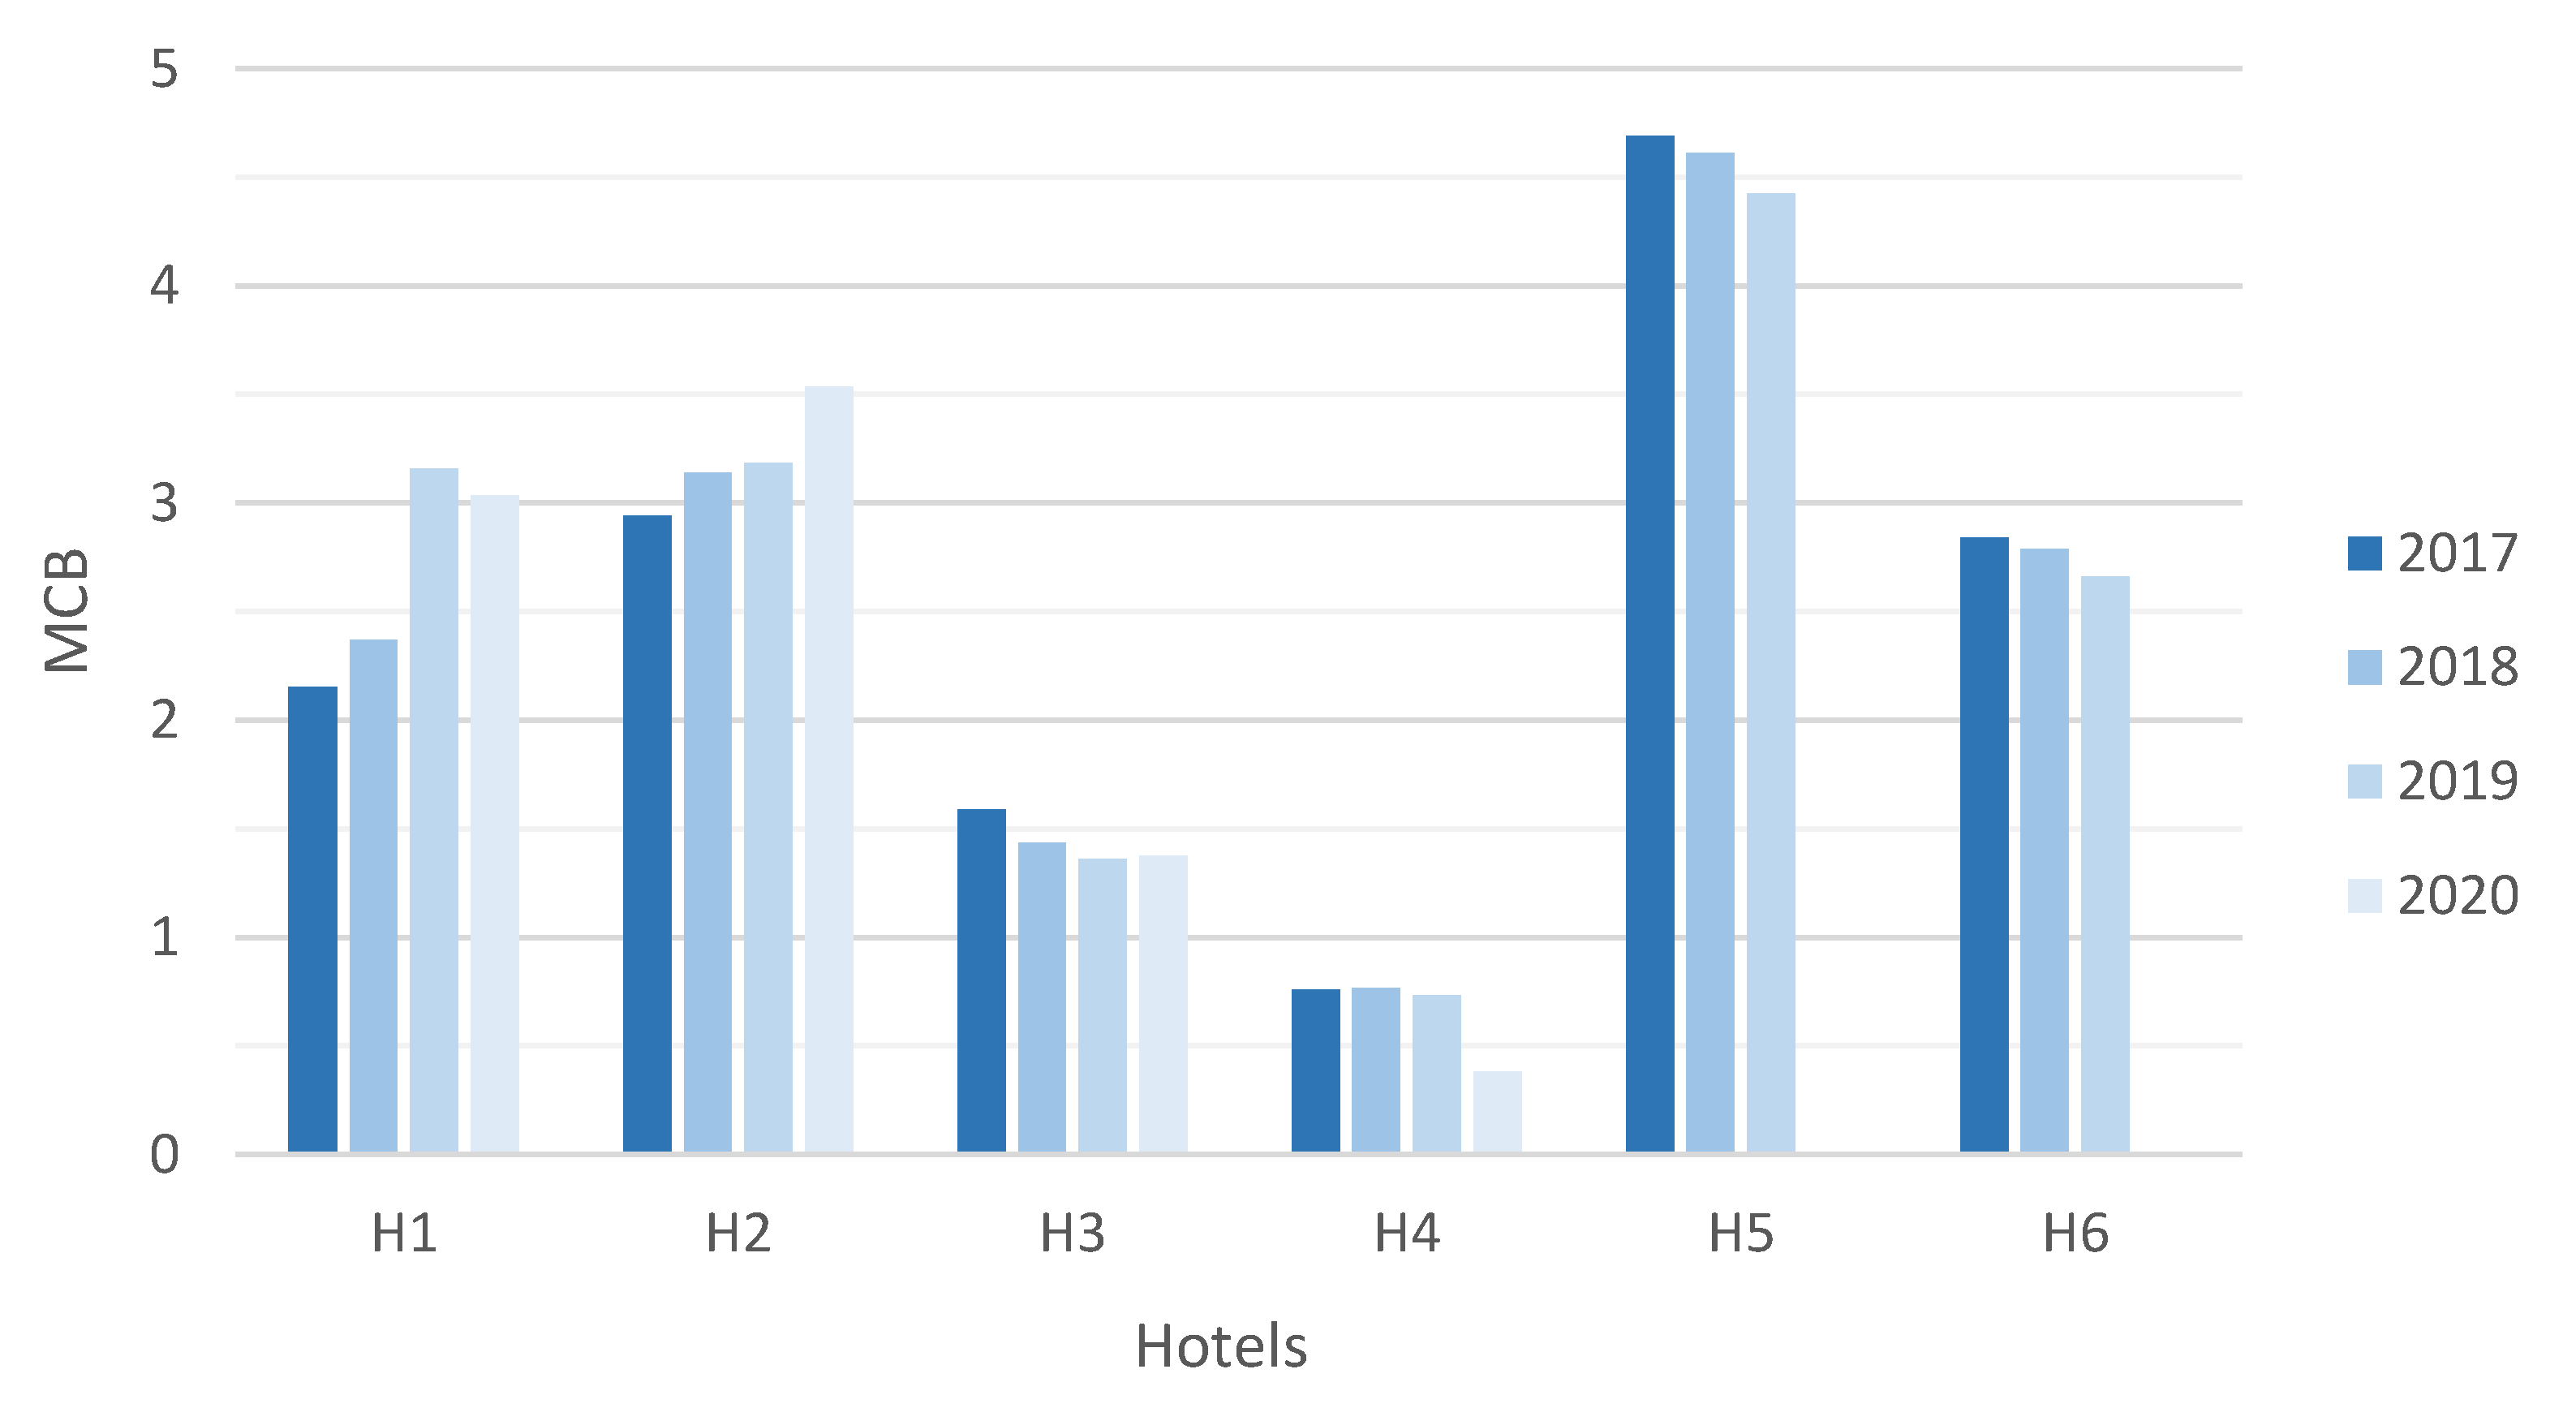
| HWCI | 2.2 | 2.9 | 1.6 | 0.8 | 4.7 | 2.8 | ||
| 2018 | 67.5% | Actual consump. (m3/year) | 34,226 | 4371 | 4491 | 3430 | 44,946 | 18,013 |
| MCB (m3/year) | 14,452 | 1392 | 3130 | 4464 | 9748 | 6458 | ||
| HWCI | 2.4 | 3.1 | 1.4 | 0.8 | 4.6 | 2.8 | ||
| 2019 | 68.4% | Actual consump. (m3/year) | 45,834 | 4488 | 4314 | 3289 | 43,642 | 17,403 |
| MCB (m3/year) | 14,518 | 1410 | 3171 | 4489 | 9863 | 6542 | ||
| HWCI | 3.2 | 3.2 | 1.4 | 0.7 | 4.4 | 2.7 | ||
| 2020 | 41.0% | Actual consump. (m3/year) | 38,013 | 3058 | 2674 | 1417 | - | - |
| MCB (m3/year) | 12,520 | 865 | 1942 | 3724 | 6358 | 4001 | ||
| HWCI | 3.0 | 3.5 | 1.4 | 0.4 | - | - |
Publisher’s Note: MDPI stays neutral with regard to jurisdictional claims in published maps and institutional affiliations. |
© 2022 by the authors. Licensee MDPI, Basel, Switzerland. This article is an open access article distributed under the terms and conditions of the Creative Commons Attribution (CC BY) license (https://creativecommons.org/licenses/by/4.0/).
Share and Cite
Alhudaithi, M.; Arregui, F.J.; Cobacho, R. Proposal of a Water Consumption Efficiency Indicator for the Hotel Sector. Water 2022, 14, 3828. https://doi.org/10.3390/w14233828
Alhudaithi M, Arregui FJ, Cobacho R. Proposal of a Water Consumption Efficiency Indicator for the Hotel Sector. Water. 2022; 14(23):3828. https://doi.org/10.3390/w14233828
Chicago/Turabian StyleAlhudaithi, Musaad, Francisco J. Arregui, and Ricardo Cobacho. 2022. "Proposal of a Water Consumption Efficiency Indicator for the Hotel Sector" Water 14, no. 23: 3828. https://doi.org/10.3390/w14233828
APA StyleAlhudaithi, M., Arregui, F. J., & Cobacho, R. (2022). Proposal of a Water Consumption Efficiency Indicator for the Hotel Sector. Water, 14(23), 3828. https://doi.org/10.3390/w14233828