Communication

The Impact of Water Temperature on In-Line Turbidity Detection

1
Chemical Engineering Department, Ningbo Polytechnic, Ningbo 315800, China
2
Ningbo Water Meter Co., Ltd., Ningbo 315032, China
*
Author to whom correspondence should be addressed.
Water 2022, 14(22), 3720; https://doi.org/10.3390/w14223720
Submission received: 18 September 2022 / Revised: 28 October 2022 / Accepted: 10 November 2022 / Published: 17 November 2022
(This article belongs to the Special Issue Water Quality and Contaminant Transport in Aquatic Environments)

Abstract

:
Turbidity measurements are influenced by environmental factors such as water temperature. We designed experiments to study whether water temperature affects in-line turbidity detection and the potential influence mechanism. A turbidity meter installed in-line could self-record data, including the water temperature and turbidity values. From our experimental analysis, we verified the influence of water temperature on the in-line turbidity. Moreover, the temperature coefficient should not be obtained from the experiment directly because the intrinsic impact of in-line turbidity detection does not come from water temperature. Instead, the effect is derived from the optical components’ heat change. When the water temperature change is insignificant, the in-line turbidity deviation caused by the water temperature can be ignored. However, when the water temperature changes substantially, the in-line turbidity sensor should compensate for the temperature drift.

1. Introduction

Turbidity detection has been widely used in water treatment plants [1,2], water supply and drainage pipe networks [3,4], river and lake management [5,6], the beverage industry [7,8], and other fields. The accuracy of turbidity detection affects the correct expression of drinking water quality, the water quality of wastewater discharge, rivers and lakes, the concentration of drinks, and the visual senses, so the accurate determination of turbidity is critical. Turbidity measurements are influenced by environmental factors [9,10] and we should exclude the influence of environmental factors as much as possible. In cases where it is difficult to exclude such effects directly, we should compensate for the impact of environmental factors [11] and obtain the turbidity at a constant specific value for a particular environmental factor. Temperature is a fundamental ecological factor that may cause turbidity disturbance [12,13]. The temperature of the water sample needs to be detected simultaneously during the turbidity measurement [12,14]. A software-programmed method is usually applied to compensate for the temperature influence on turbidity [15]. For the software compilation method of temperature compensation of turbidity, the stability and reliability depend on whether the relationship between the temperature influence and turbidity is correctly established. Therefore, it is essential and of practical significance to study the impact of water temperature on in-line turbidity detection.
Temperature may affect the turbidity from two aspects. One is the influence of temperature on the photoelectric components inside the turbidity sensor, including optical emitting and receiving electronic components [12,16]. The other is the effect of temperature on the distribution and movement of tiny particles in water. The results of these two mechanisms are reversed. Supposing that the temperature increases, the turbidity decreases based on the first mechanism and increases based on the second mechanism. Although the nature of influence and mechanism of these two aspects are entirely different, it is difficult to directly distinguish which factor mainly contributes to the turbidity change in the actual turbidity detection process. A greater number of studies report the influence from the first aspect, while there are very few reports on the impact from the second aspect.
Temperature fluctuation can influence the electrical signal output of the turbidity sensor. Not all electronic components are affected by temperature fluctuations; however, the performances of the optical emission and receiving components are closely related to temperature fluctuations [12]. The light emission element is affected by the ambient temperature. Even if the input current is constant, the light intensity decreases when the ambient temperature rises. The light-receiving element is also affected by temperature. When the ambient temperature increases, the open circuit voltage of silicon photovoltaic cells decreases, and the short circuit current increases. The open circuit voltage and the short circuit current show a linear relationship with ambient temperature [12]. Usually, this fluctuation only slightly affects turbidity readings and can, thus, be neglected. However, the turbidity sensor with LED as the light source warms up rapidly, and the impact on the turbidity detection is considerable [12]. The ambient temperature increases, the light source output weakens, and the turbidity detection value is smaller than the true turbidity [17,18].
The most crucial influence of temperature on the distribution and movement of tiny particles in the water is probably the influence of temperature on the Brownian motion. Brownian motion is the restless and irregular motion of small particles in a fluid [19]. The higher the water temperature, the more active the particle movement [20]. When the water temperature varies greatly, the light spot and light intensity obtained by light scattering also fluctuate wildly, which may bring a significant error to the turbidity detection.
In the existing studies, the effect of temperature on turbidity is established by offline measurements, so it is unclear whether the influence of water temperature on in-line turbidity measurements also follows the same correlations of offline turbidity and temperature measurements. This paper explores the effect of in-line turbidity affected by water temperature.
In the current study, the impact of water temperature on in-line turbidity was investigated. Two cases were designed with different water temperature change intervals, within 10 °C and more than 15 °C, and the experimental results revealed two different patterns.

2. Materials and Methods

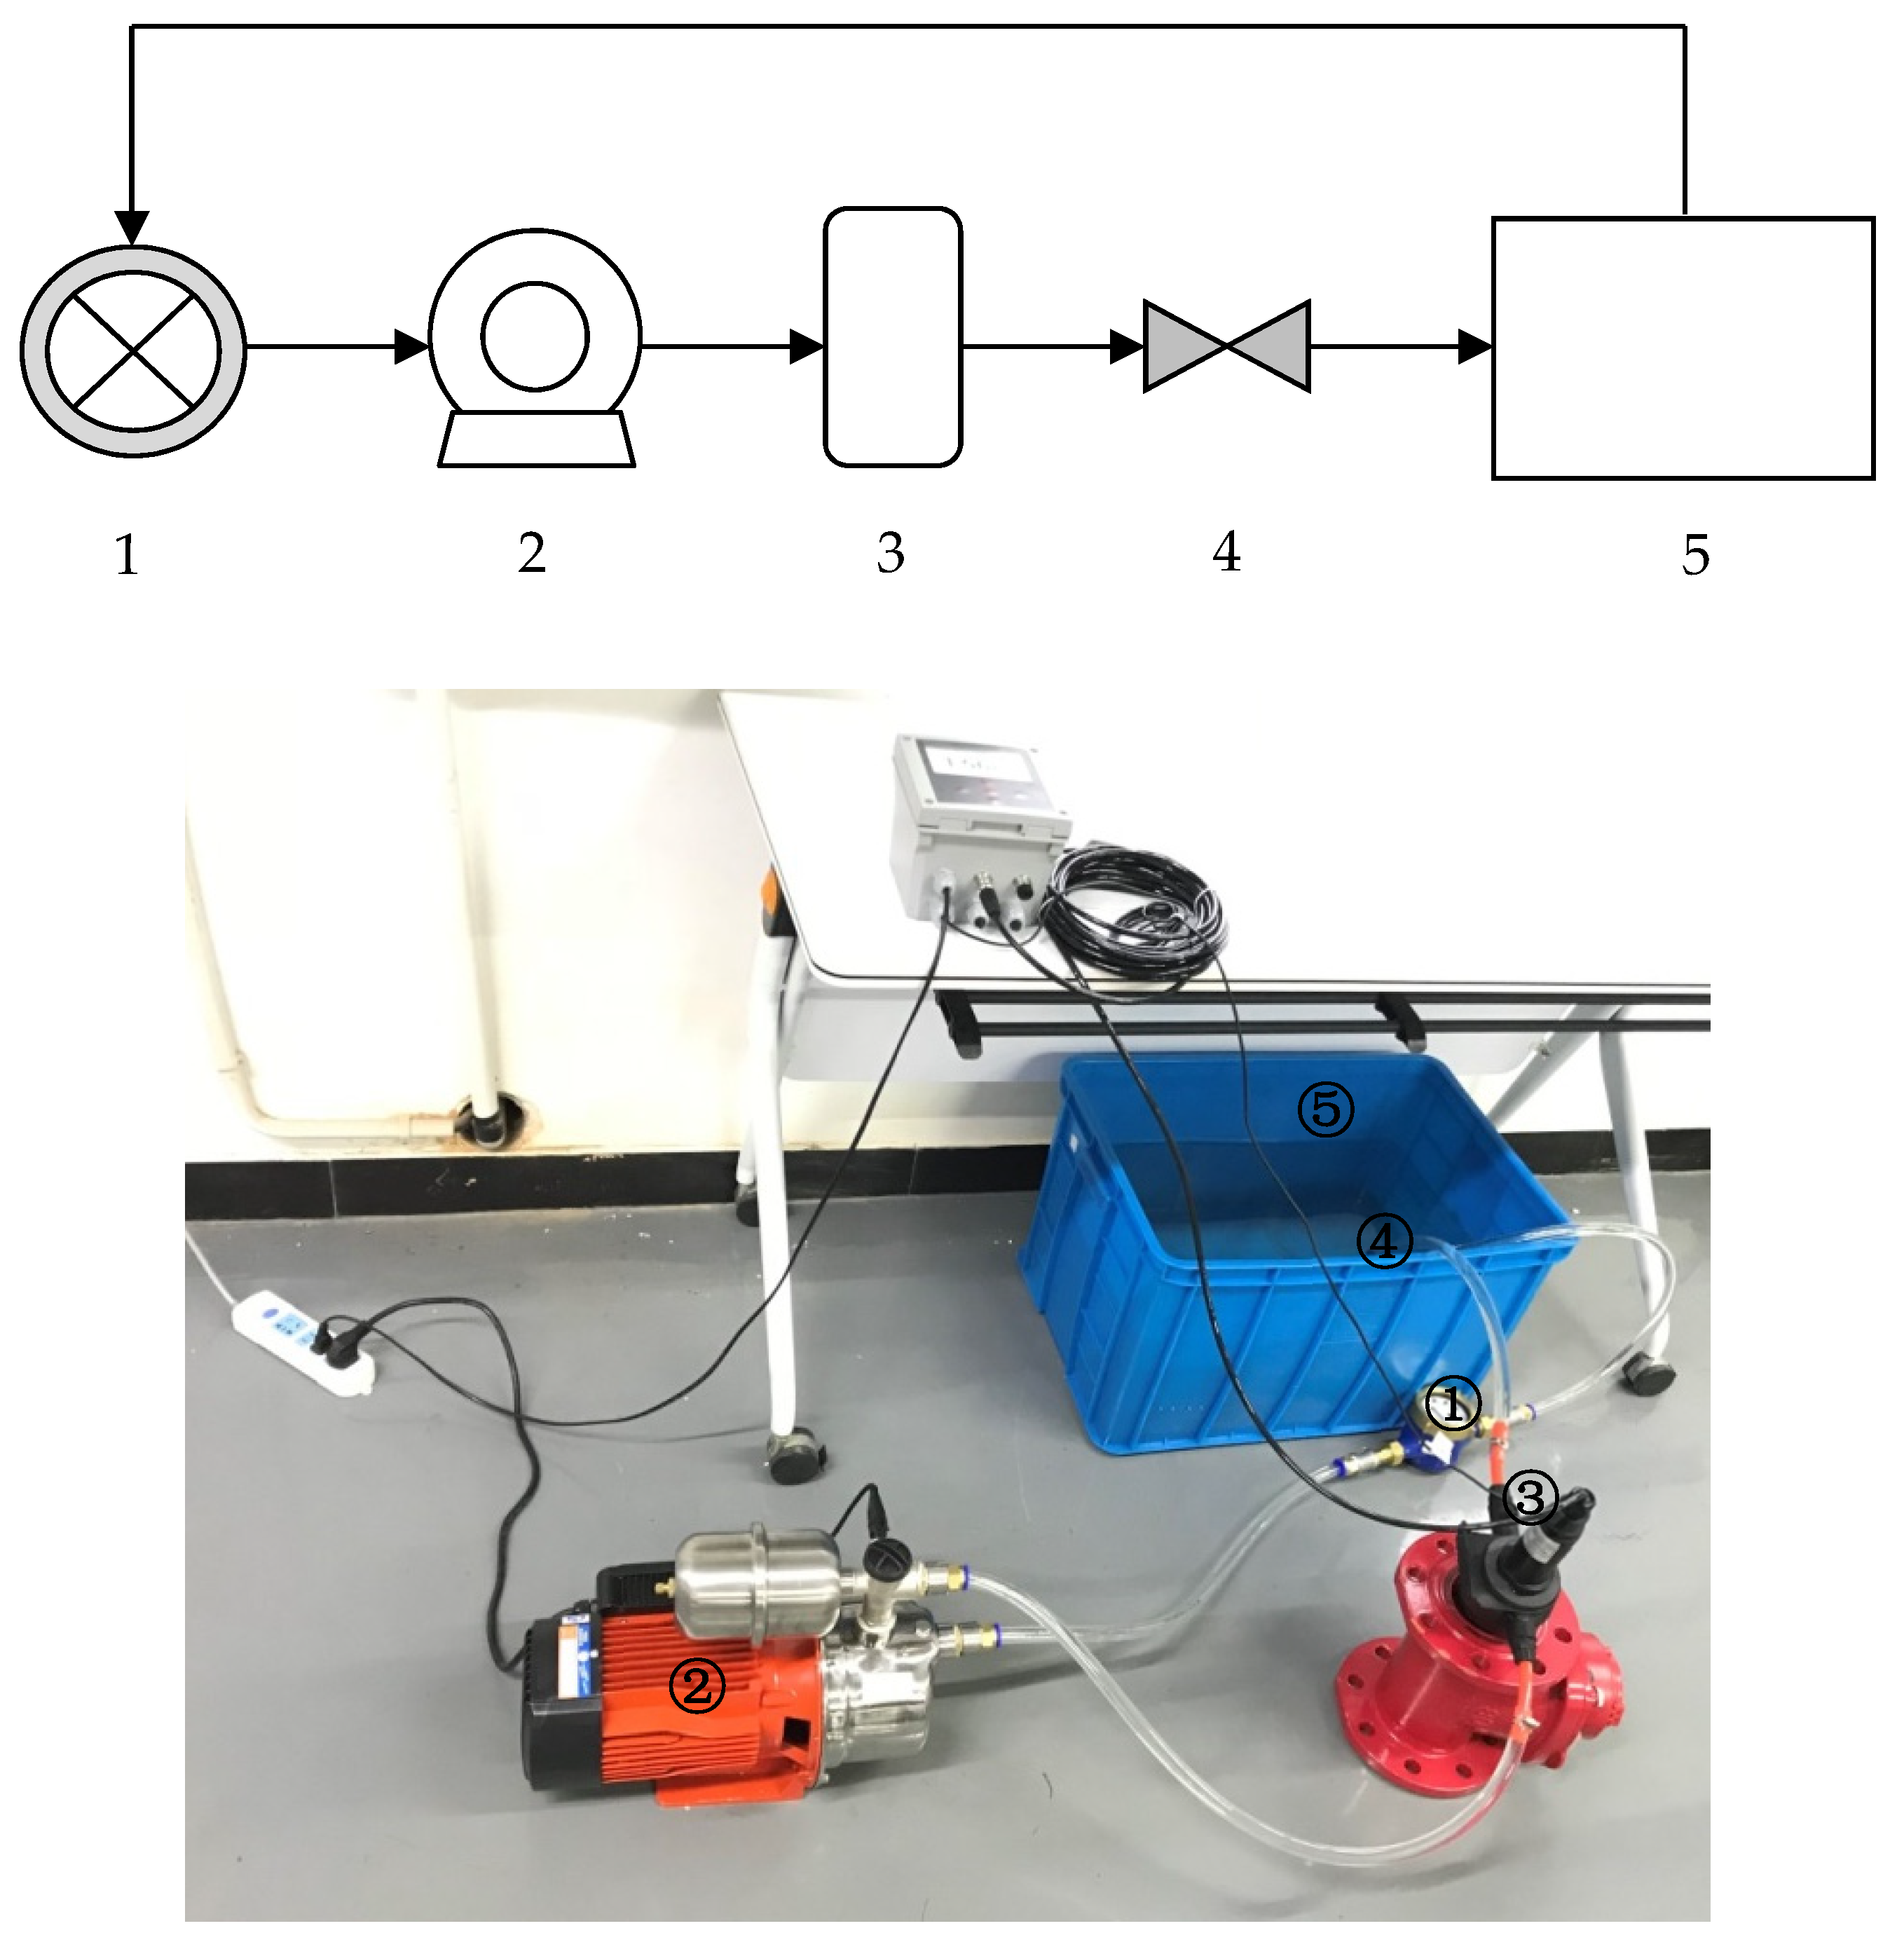
2.1. Experimental Setup

The experiment was implemented via a self-built water circulation system, as shown in Figure 1. In this system, the water meter was used to detect the water velocity in the pipe. The centrifugal pump, controlled by a variable frequency drive, provided the power of the steady flow, which was verified by a flowmeter. The ball valve was applied to adjust the water flow in the pipe and was installed directly downstream of the turbidity meter, providing a certain pressure to suppress bubble production. The turbidity meter displays a more significant value if a bubble exists. A Chemitec in-line turbidimeter was utilized to measure turbidity. Its optical source is 860 nm infrared light, and the measurement principle is 90° light scattering, with an accuracy of 1% in 0–10 NTU, a resolution of 0.001 NTU, a reproducibility of 2%, a data-logging interval of 3 min, and an operating temperature of 0–50 °C. Before starting the experiment, the turbidimeter was calibrated. In addition to in-line turbidity measurements, the Chemitec in-line turbidimeter includes a temperature sensor that can record temperature data simultaneously.

2.2. Operational Mode

To exclude the influence of the pipeline water velocity on the turbidity and, thus, make our experimental conclusions more universal, we performed parallel experiments on the influence of water temperature on in-line turbidity detection under different flow speed conditions. We chose three different flow rates, namely 0.33 m/s (the corresponding volume flow is 1 L/min), 0.66 m/s (the corresponding volume flow is 2 L/min), and 1.66 m/s (the corresponding volume flow is 5 L/min). In the test platform shown in Figure 1, we measured and recorded the in-line turbidity every minute using the Chemitec in-line turbidimeter while simultaneously recording the water temperature data flowing through the turbidity meter.

2.3. Two Experimental Designs

We designed two cases with different water temperature change intervals, within 10 °C and more than 15 °C, to investigate the impact of water temperature on the in-line turbidity and compare the similarities and differences between these two cases. We applied the experimental water at room temperature as the lower temperature interval case. We used cooled water to study the case with a significant water temperature change interval.

3. Results and Discussion

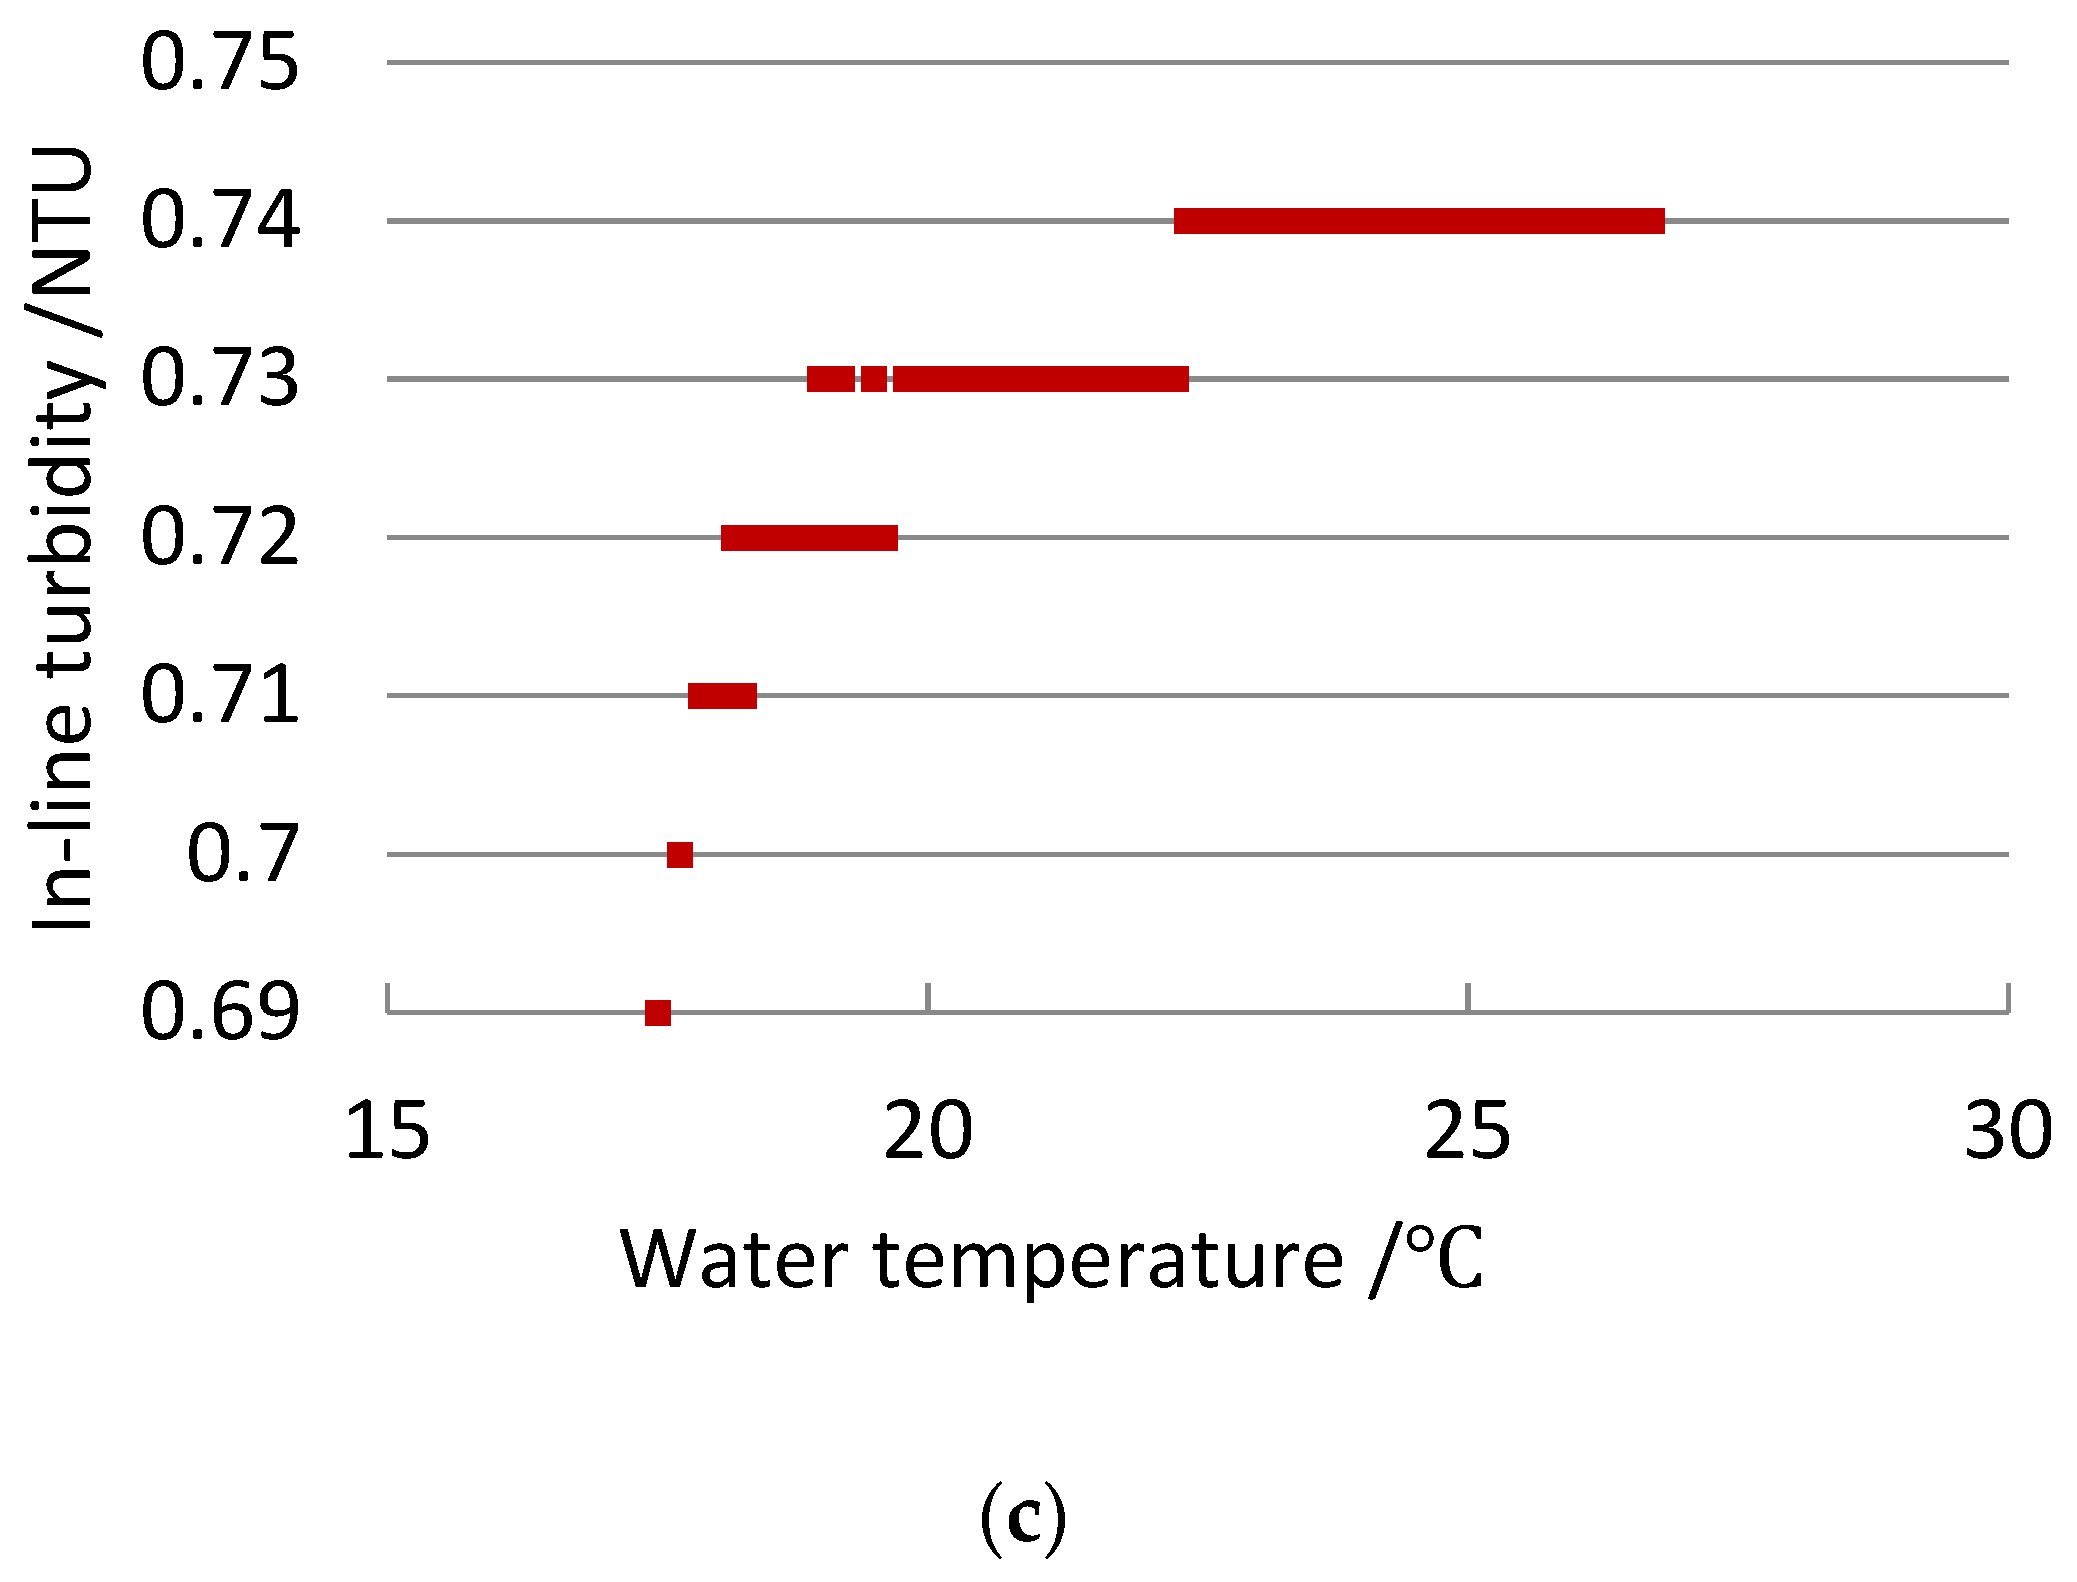
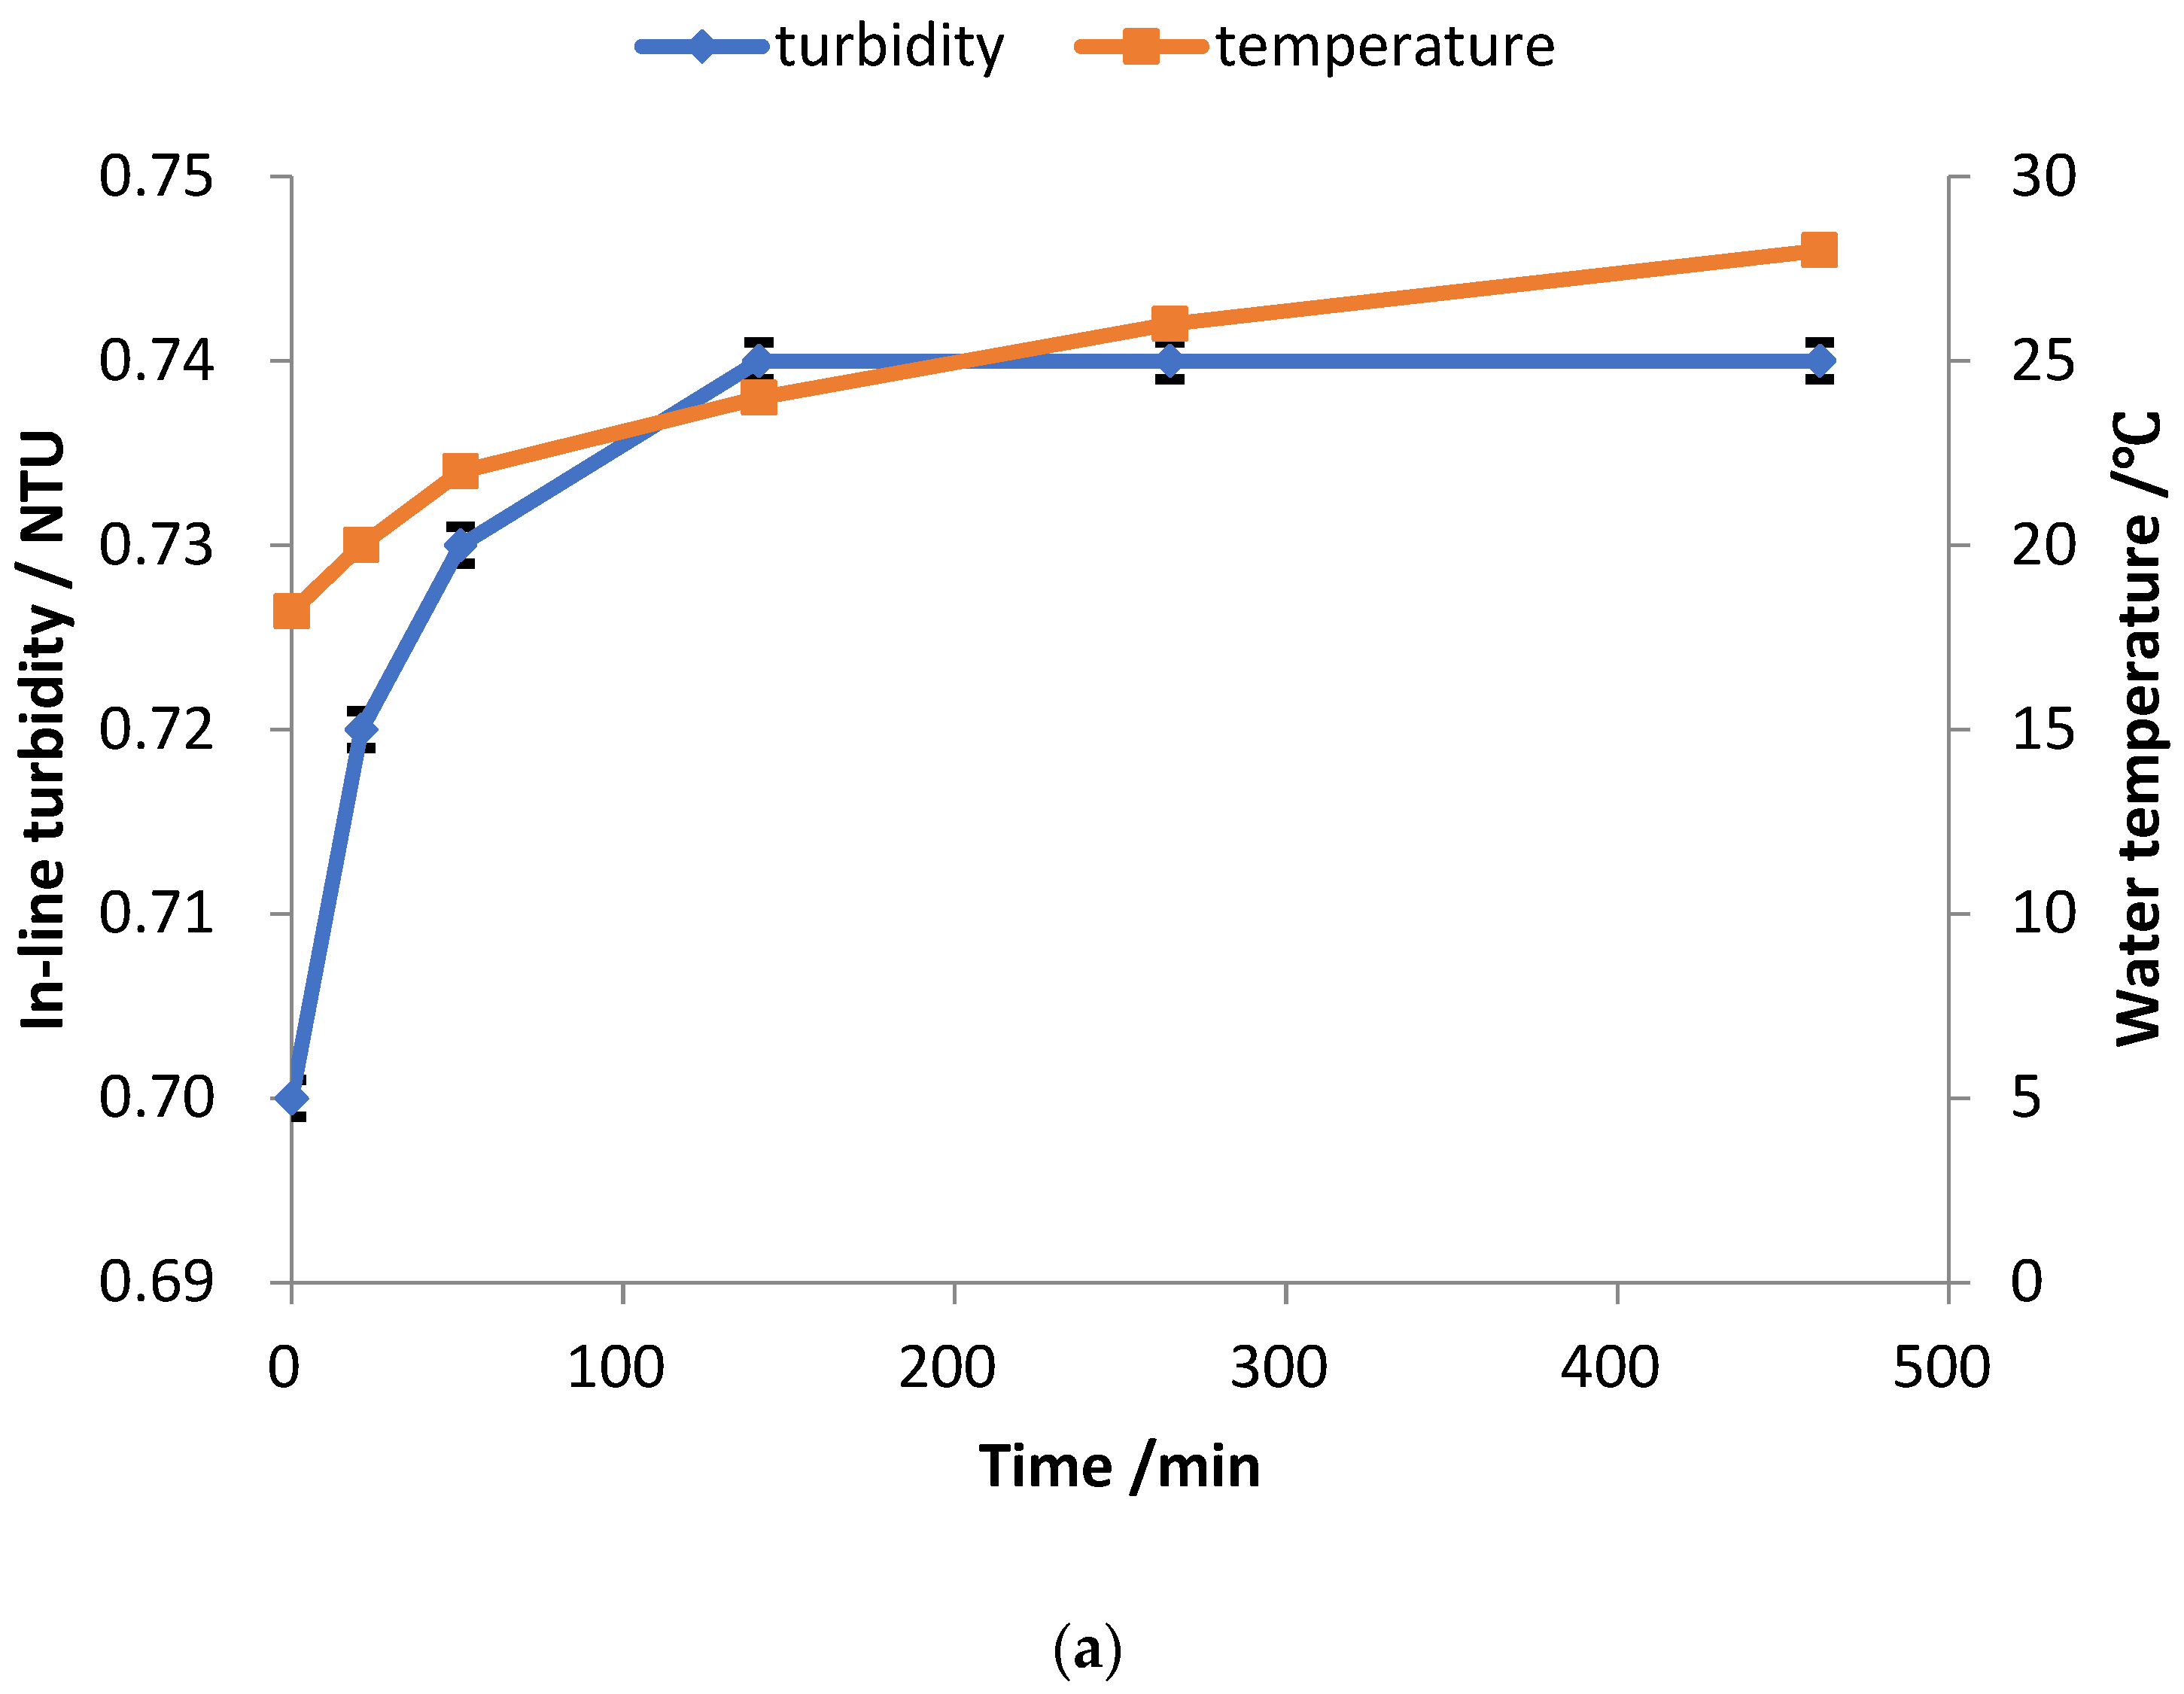
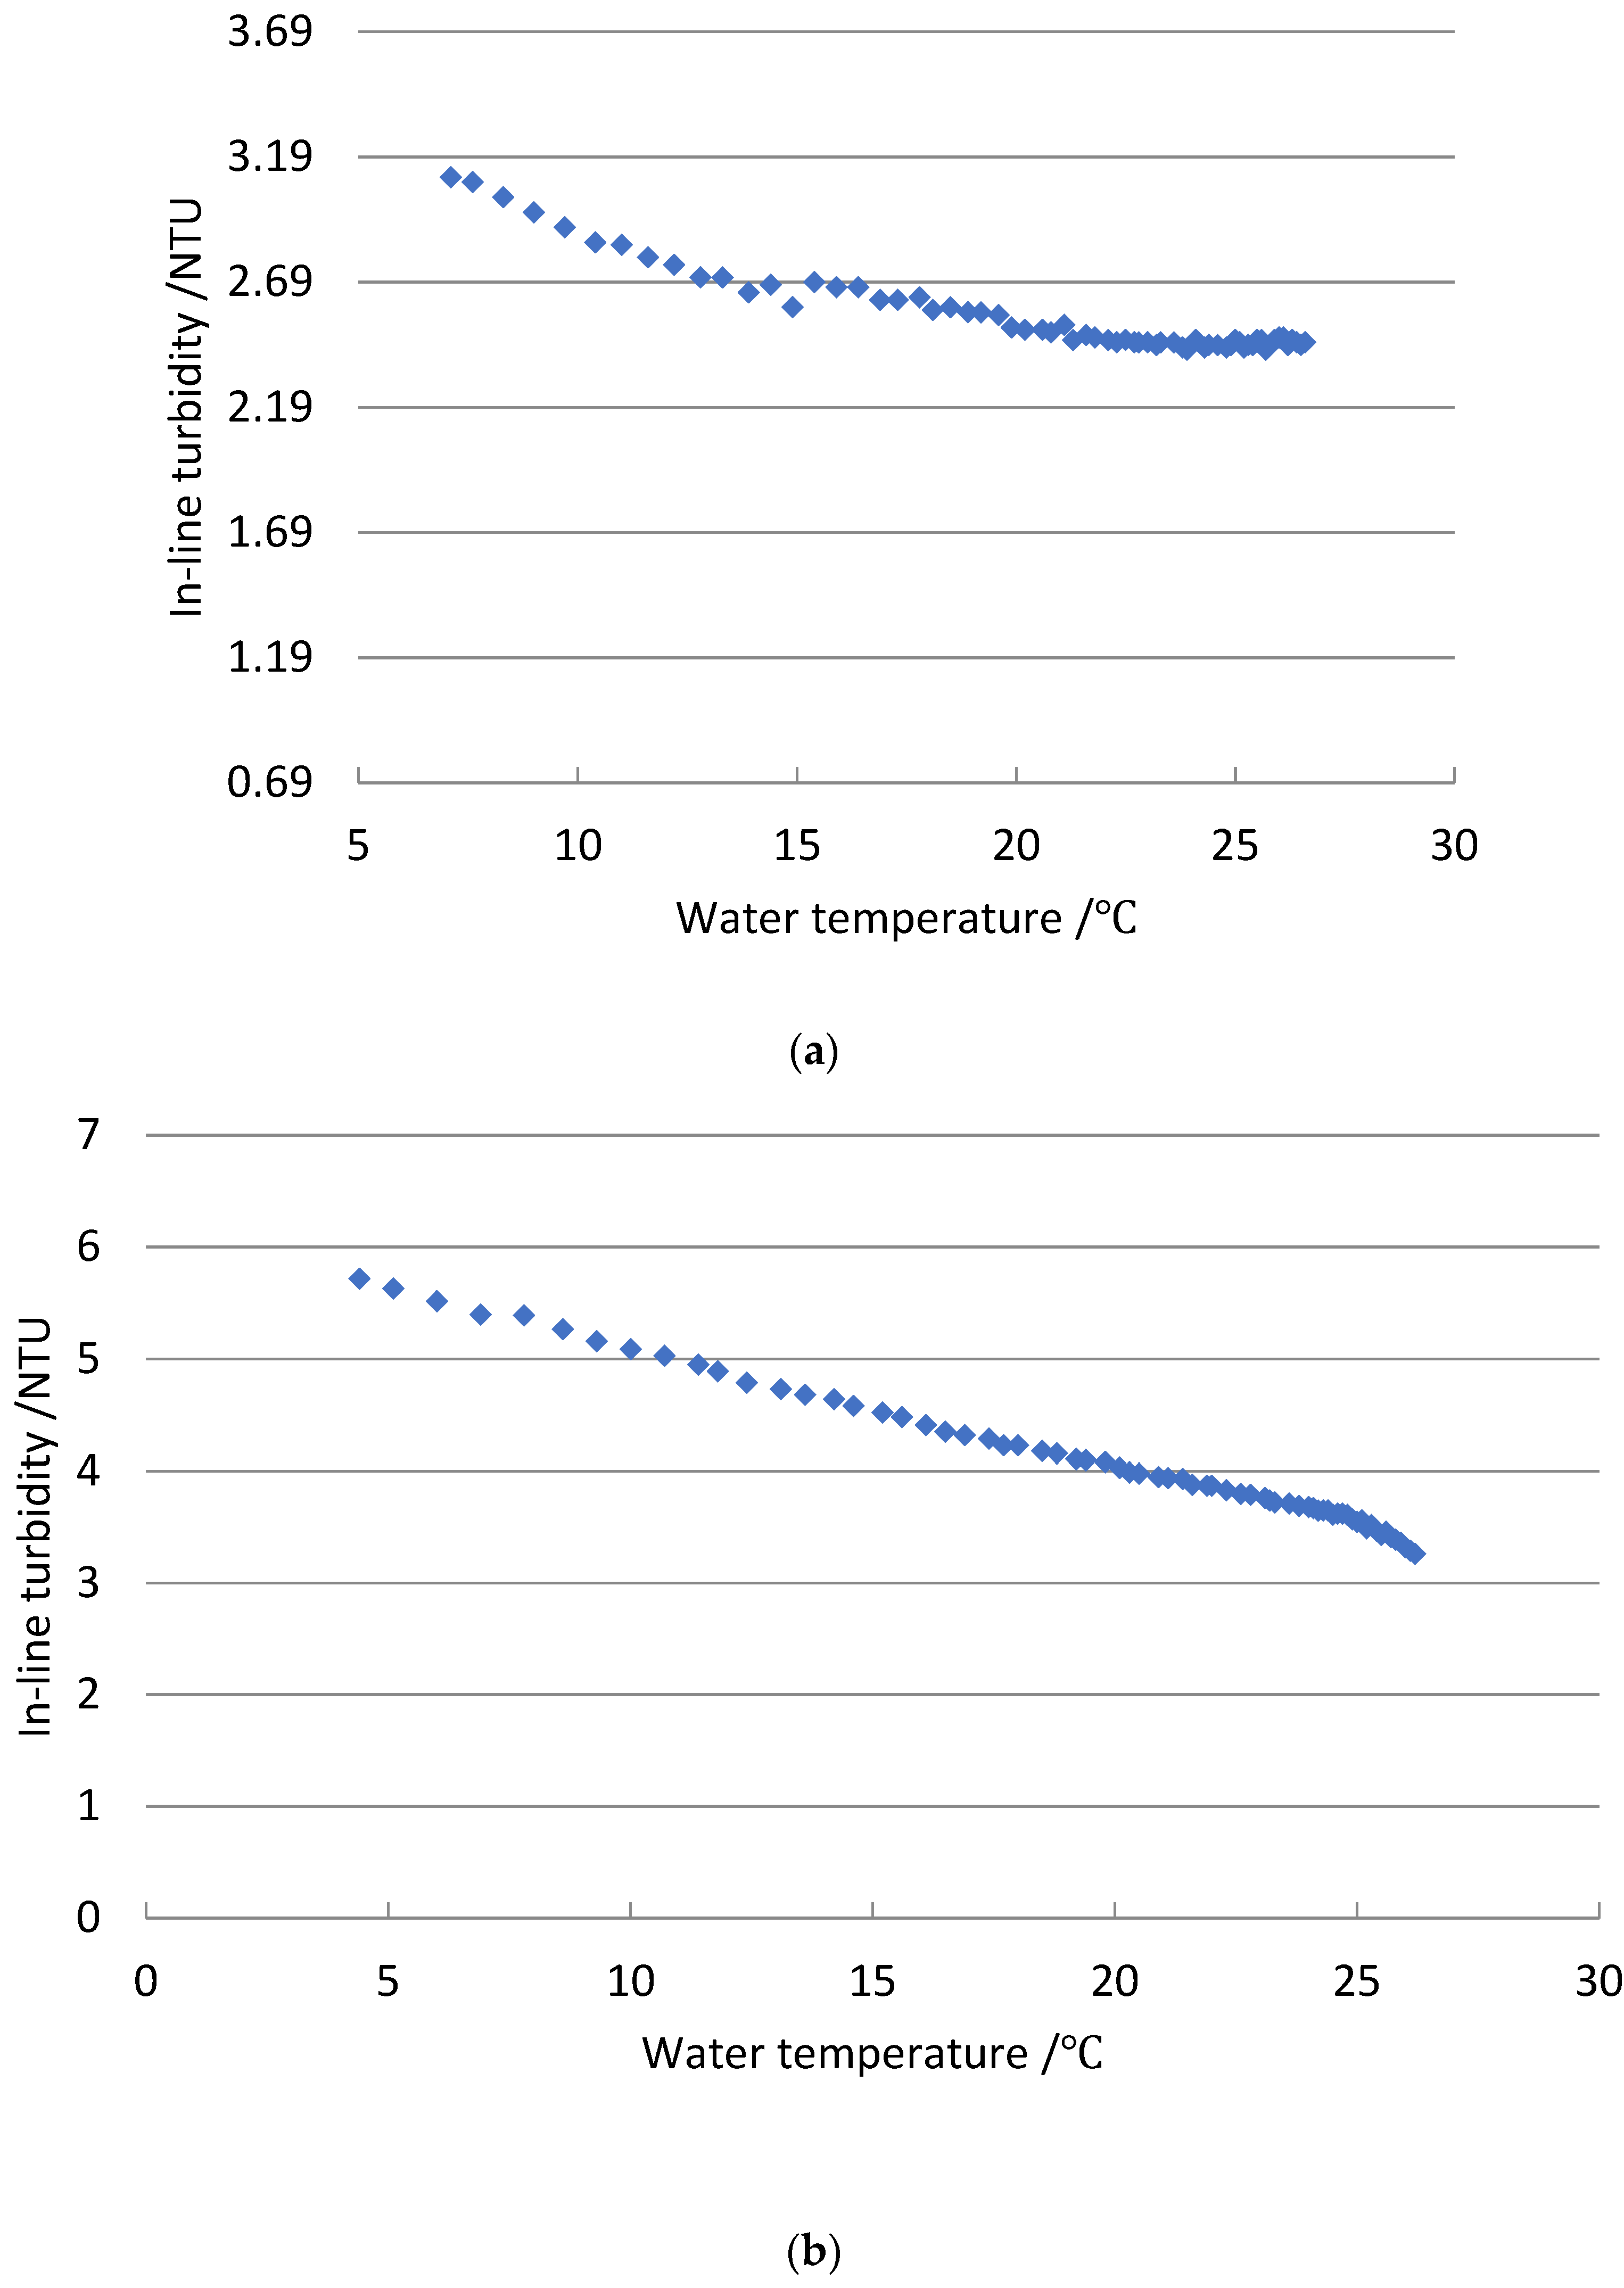
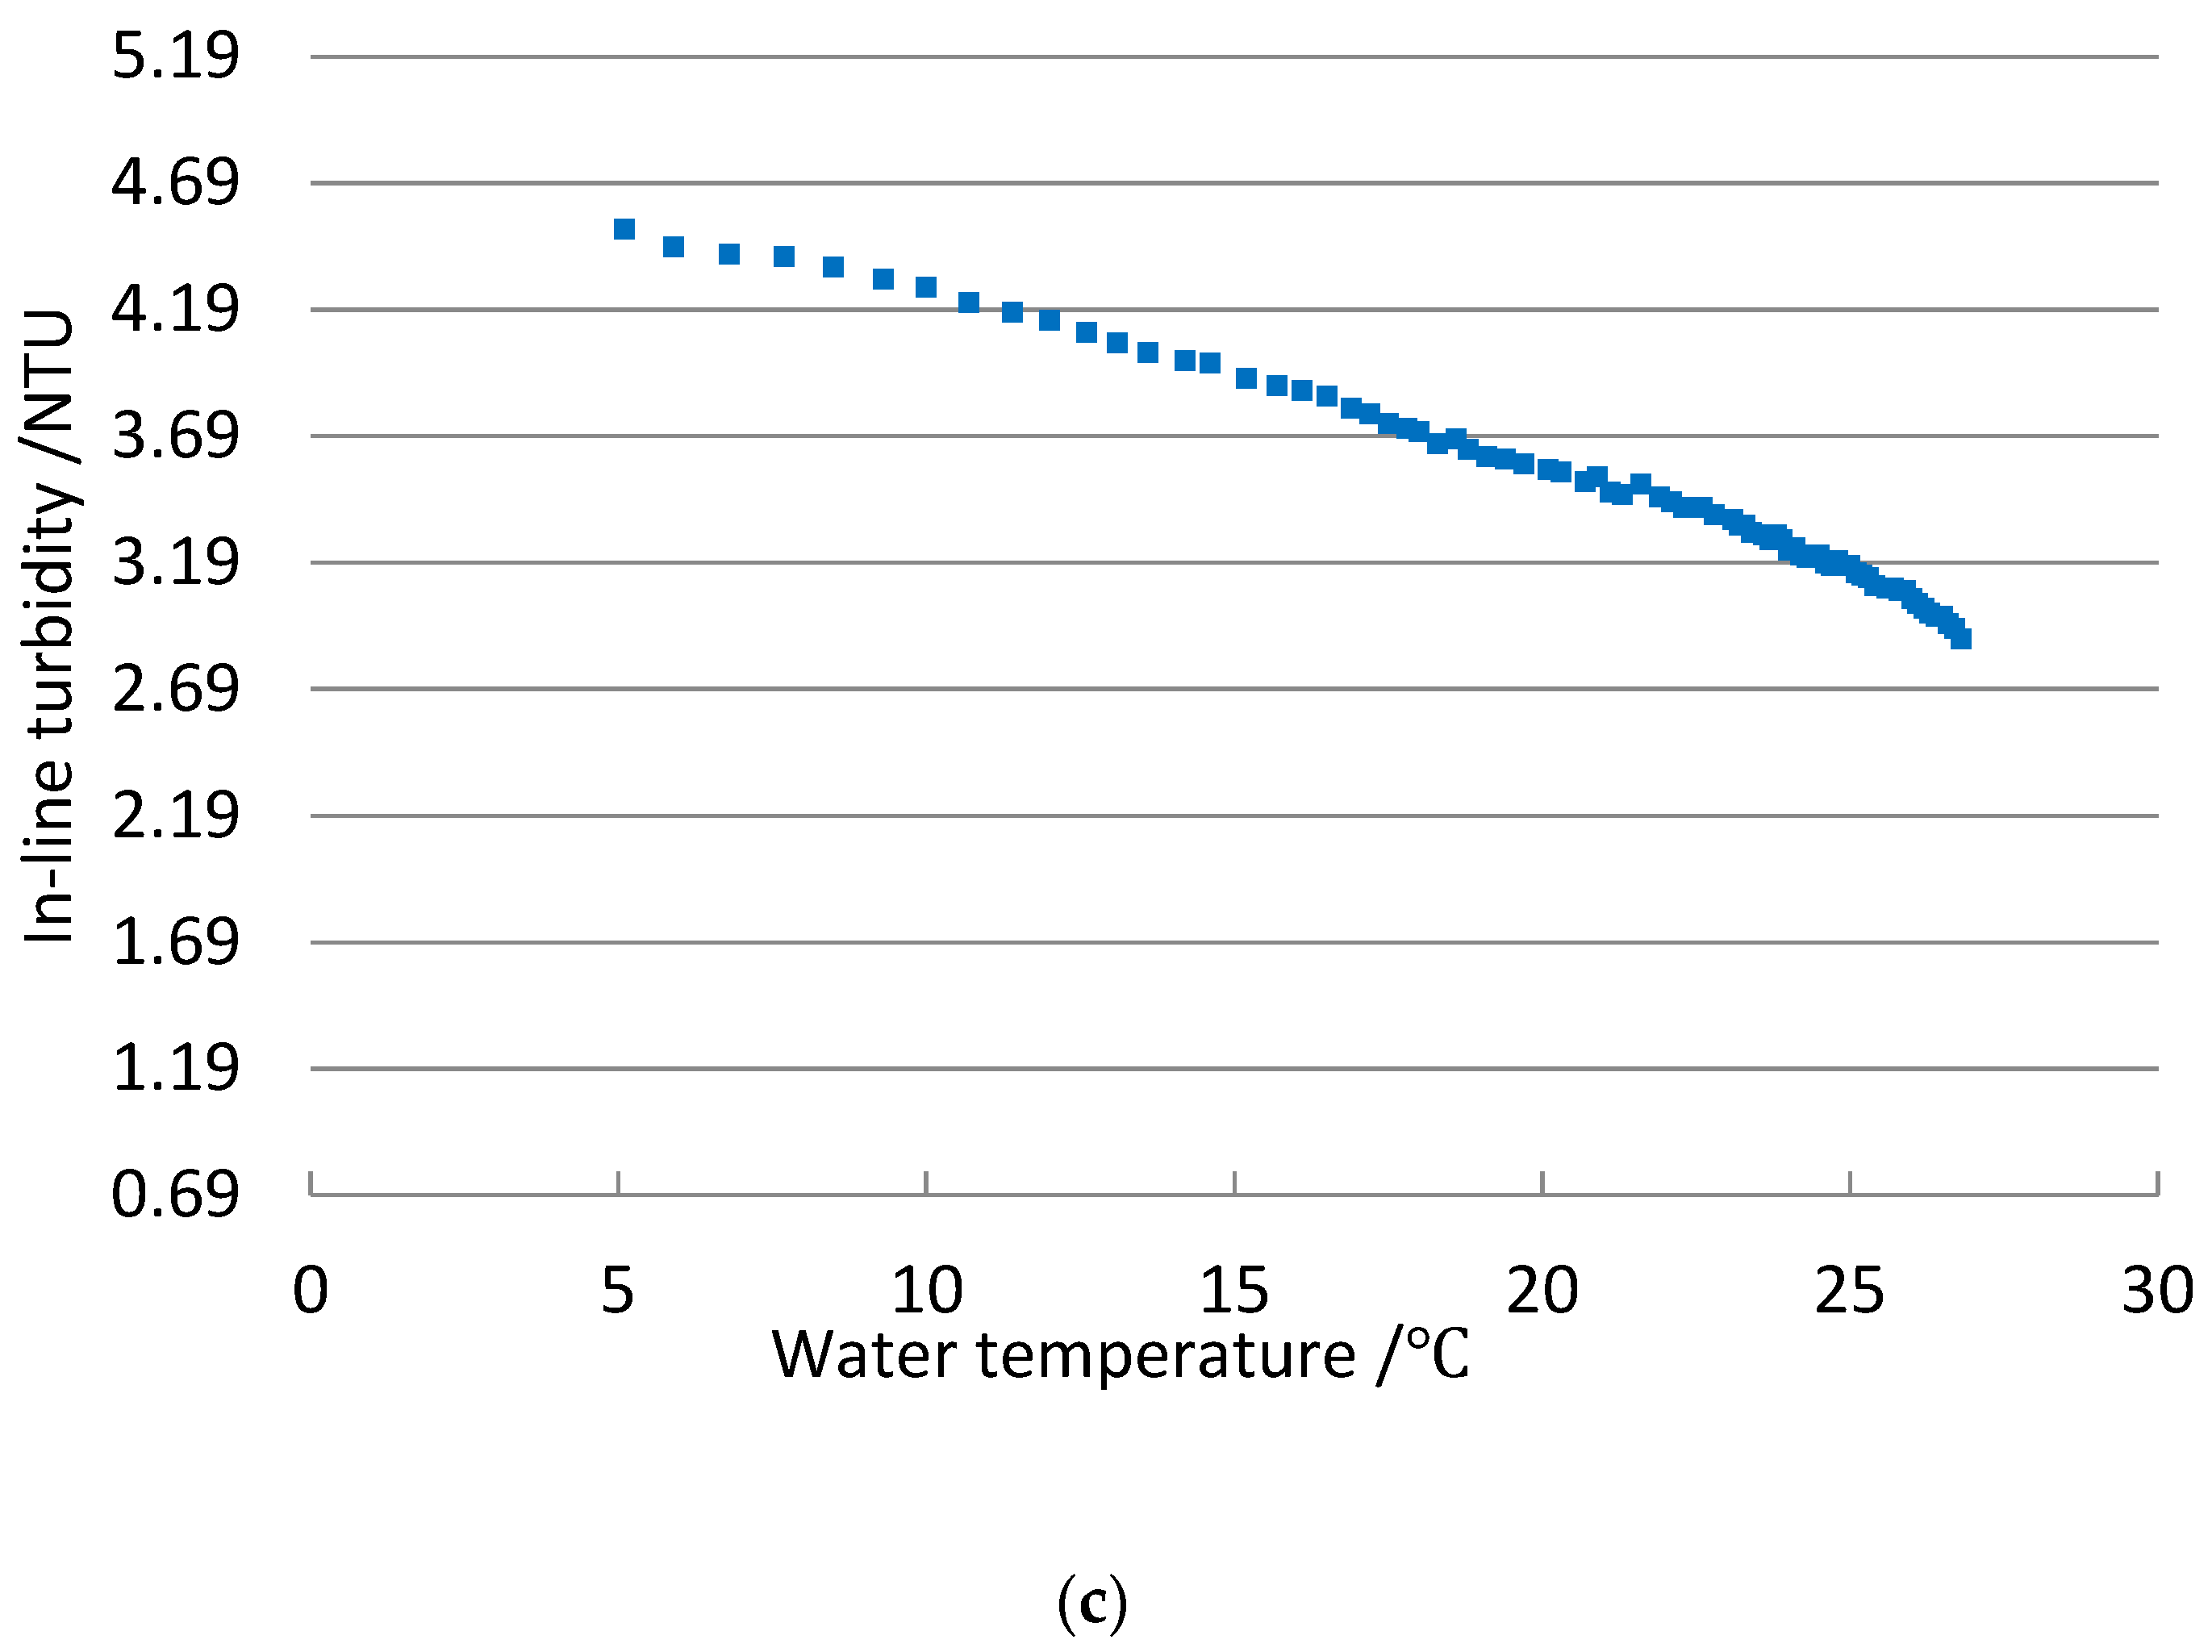
3.1. Relationship between the In-Line Turbidity and Water Temperature at Room Temperature

The experimental water was room temperature water. Since the variable frequency pump produces heat during operation, the water in the pipeline is gradually heated up, so the water temperature rise can be realized via the operation of the pump. The variation range of the water temperature could reach approximately 10 °C. The turbidimeter was set to record data (including turbidity and temperature) every 3 min. The raw data shown in Figure 2 were rehandled as follows. We took a set of in-line turbidity values at every 2 °C of water temperature, drew a line plot of both in-line turbidity and water temperature over time, as given in Figure 3a–c, and showed the turbidity data at each temperature point with the standard deviation. However, in some conditions, the turbidity changed very little, and the turbidity value kept steady at the same temperature; therefore, the short horizontal lines representing the positive and negative deviation in the figure overlapped with the turbidity value at some points.
In each sub-figure of Figure 3, the water temperature in the pipeline ranged from 18 to 28 °C at different velocities, and the in-line turbidity showed a consistent trend with the water temperature. The in-line turbidity values increased slightly as the water temperature rose. However, the in-line turbidity increase was less than 0.05 NTU, which is negligible. Therefore, when the water temperature fluctuation is insignificant, generally within 10 °C, the water temperature has little influence on the in-line turbidity. Nevertheless, when the water temperature changes significantly, such as when comparing winter and summer periods or significant temperature differences between day and night, is it necessary to compensate for the water temperature coefficient of the in-line turbidimeter? We implemented experiments with cooled experimental water in Section 3.2, keeping other operating conditions unchanged.

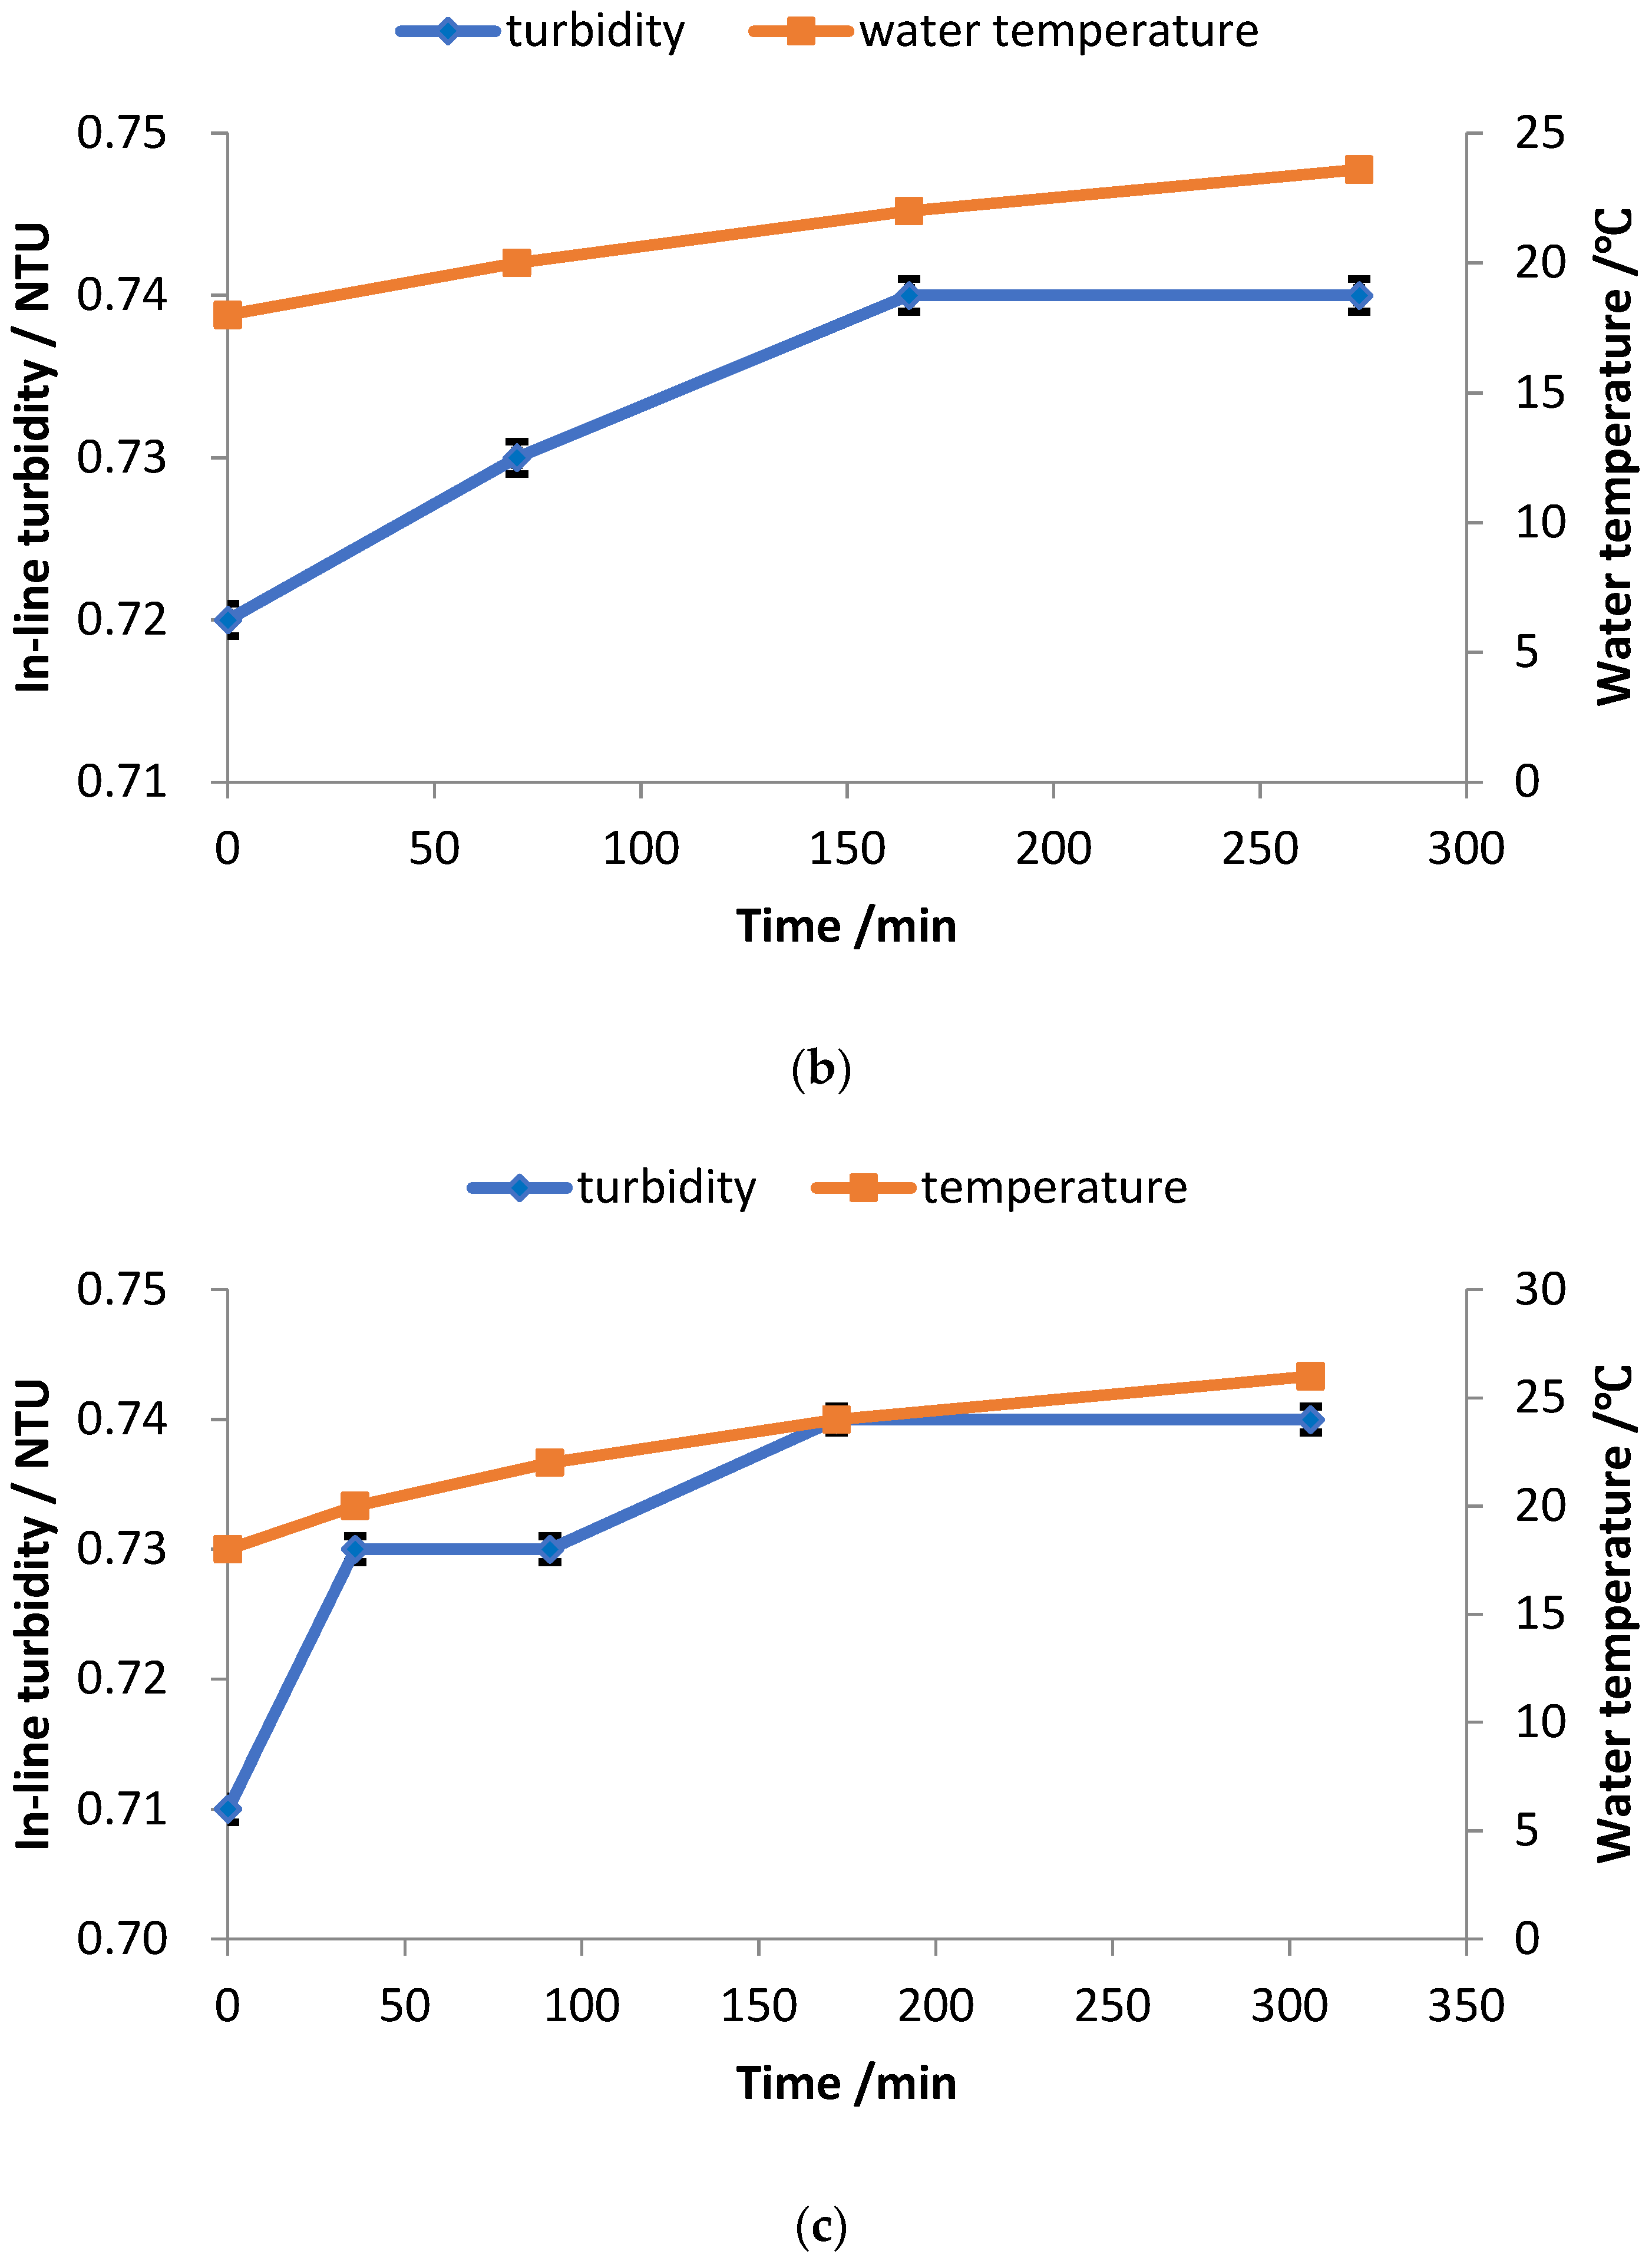
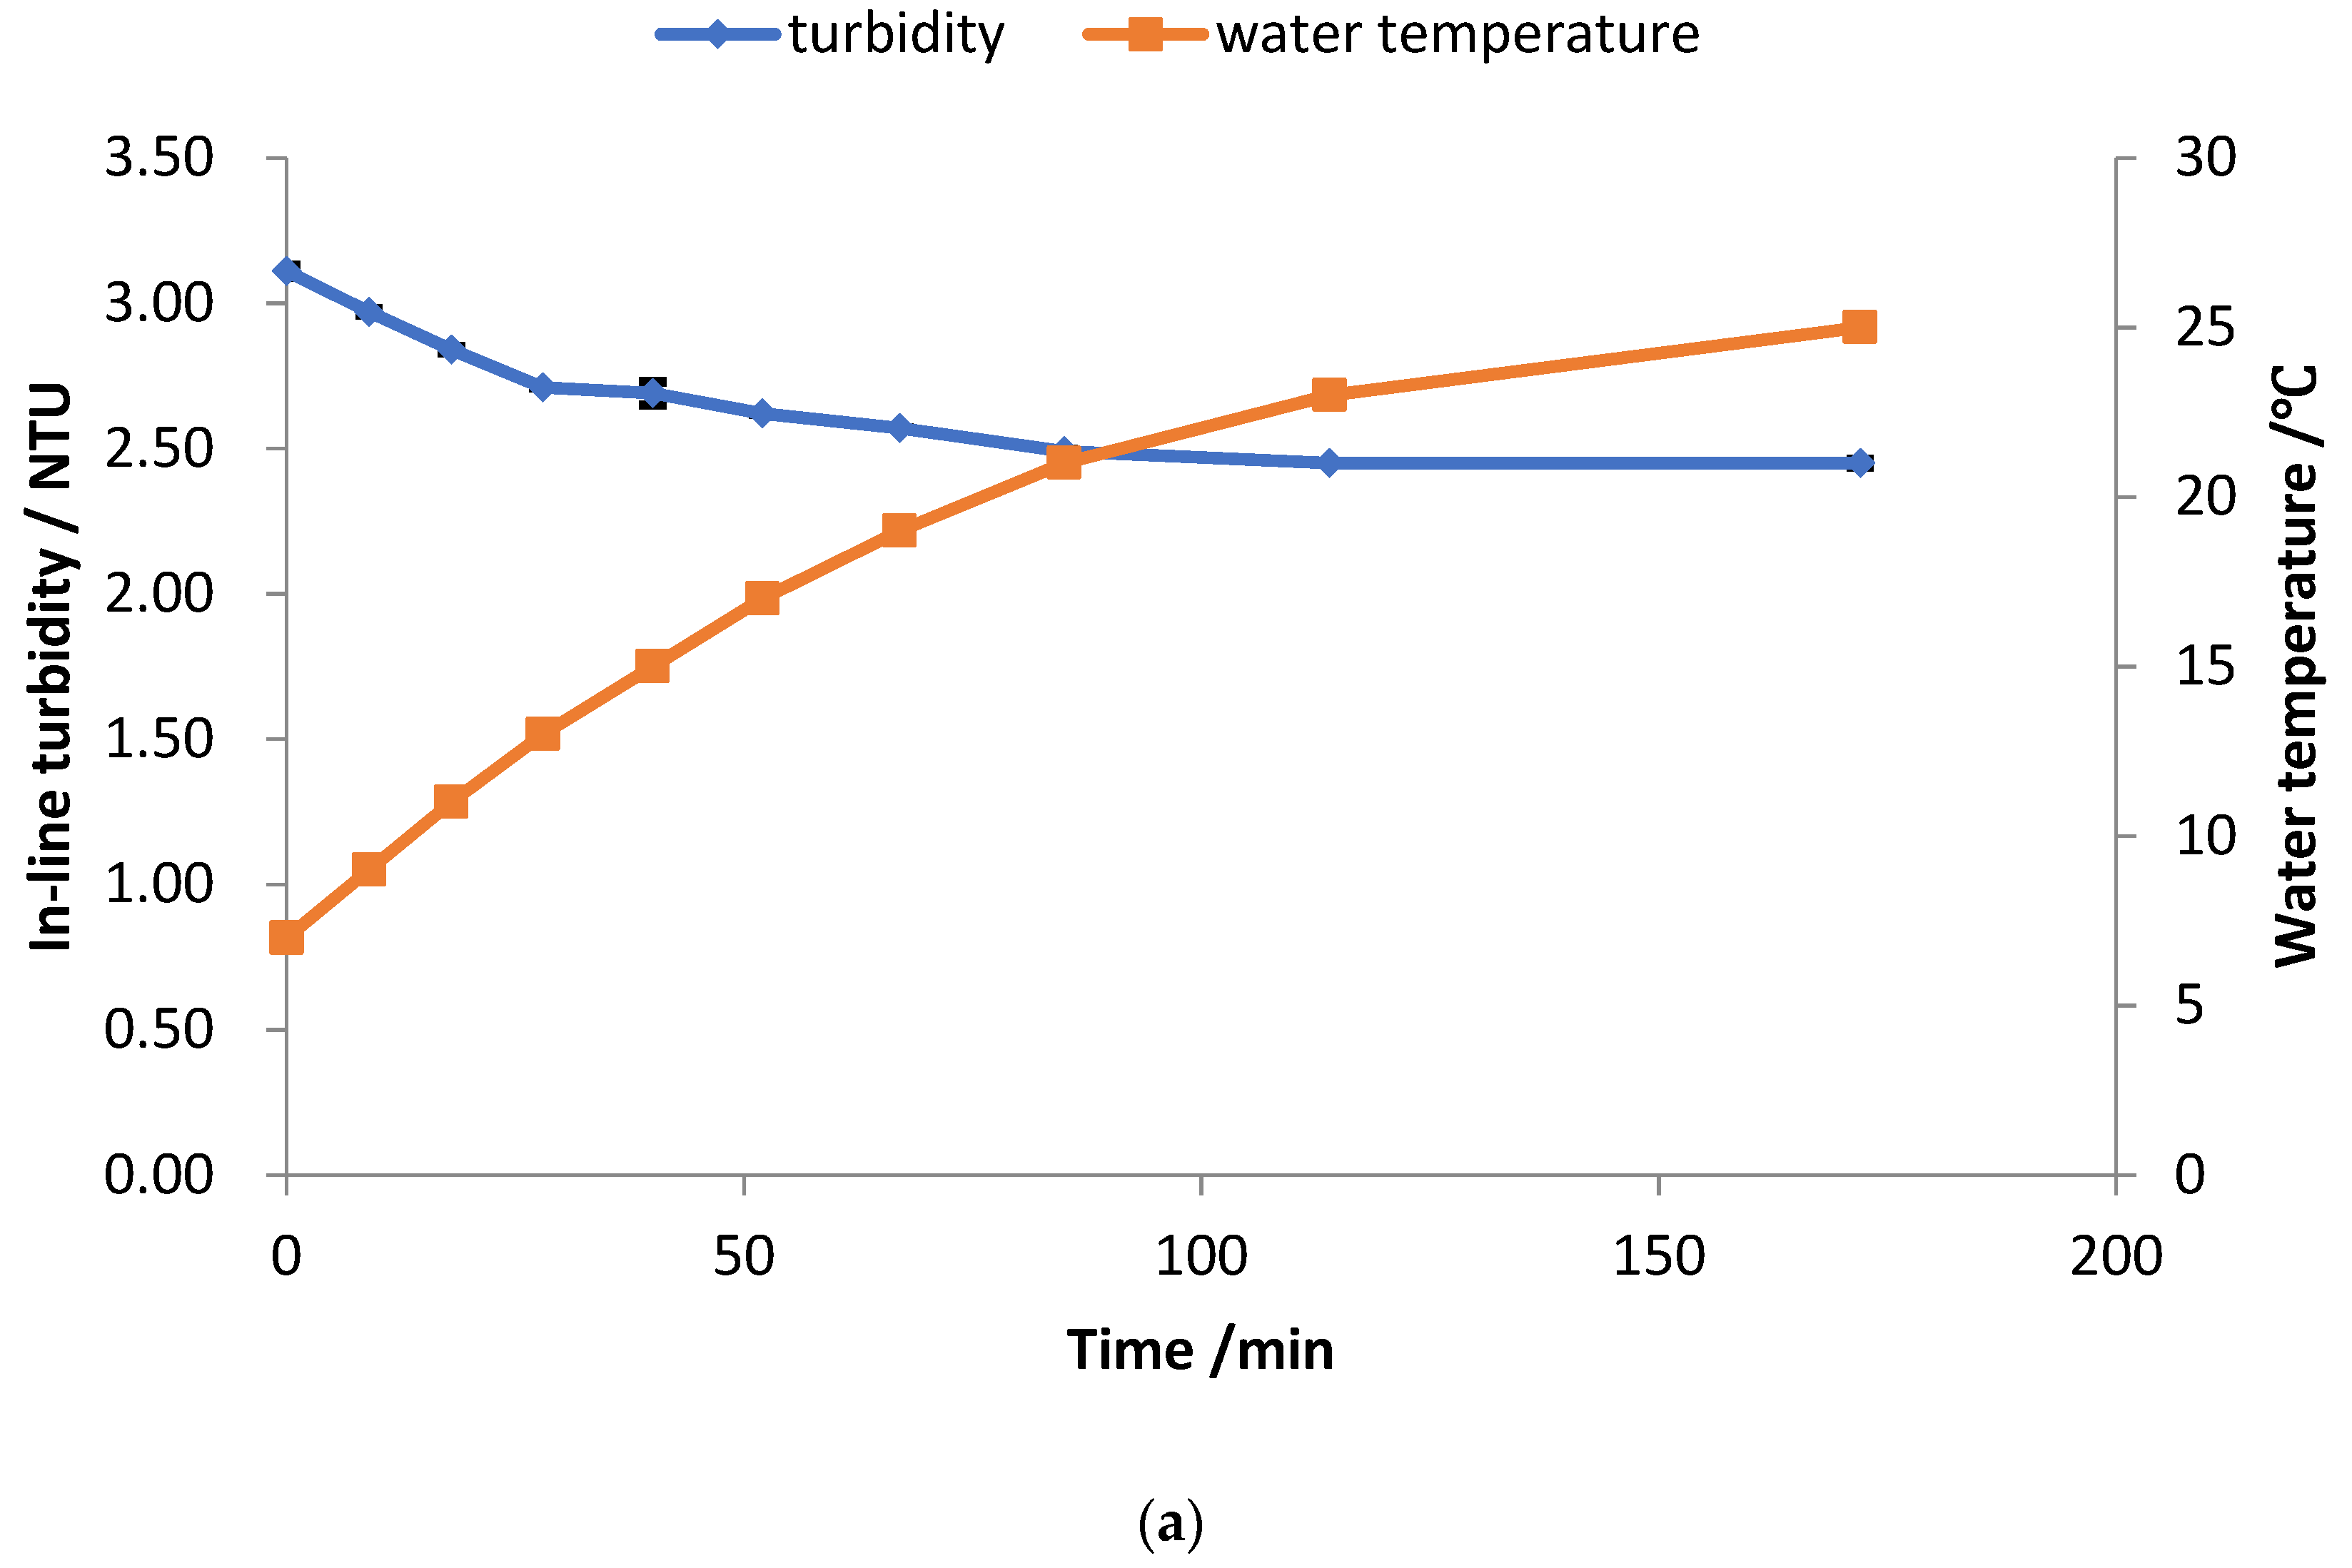
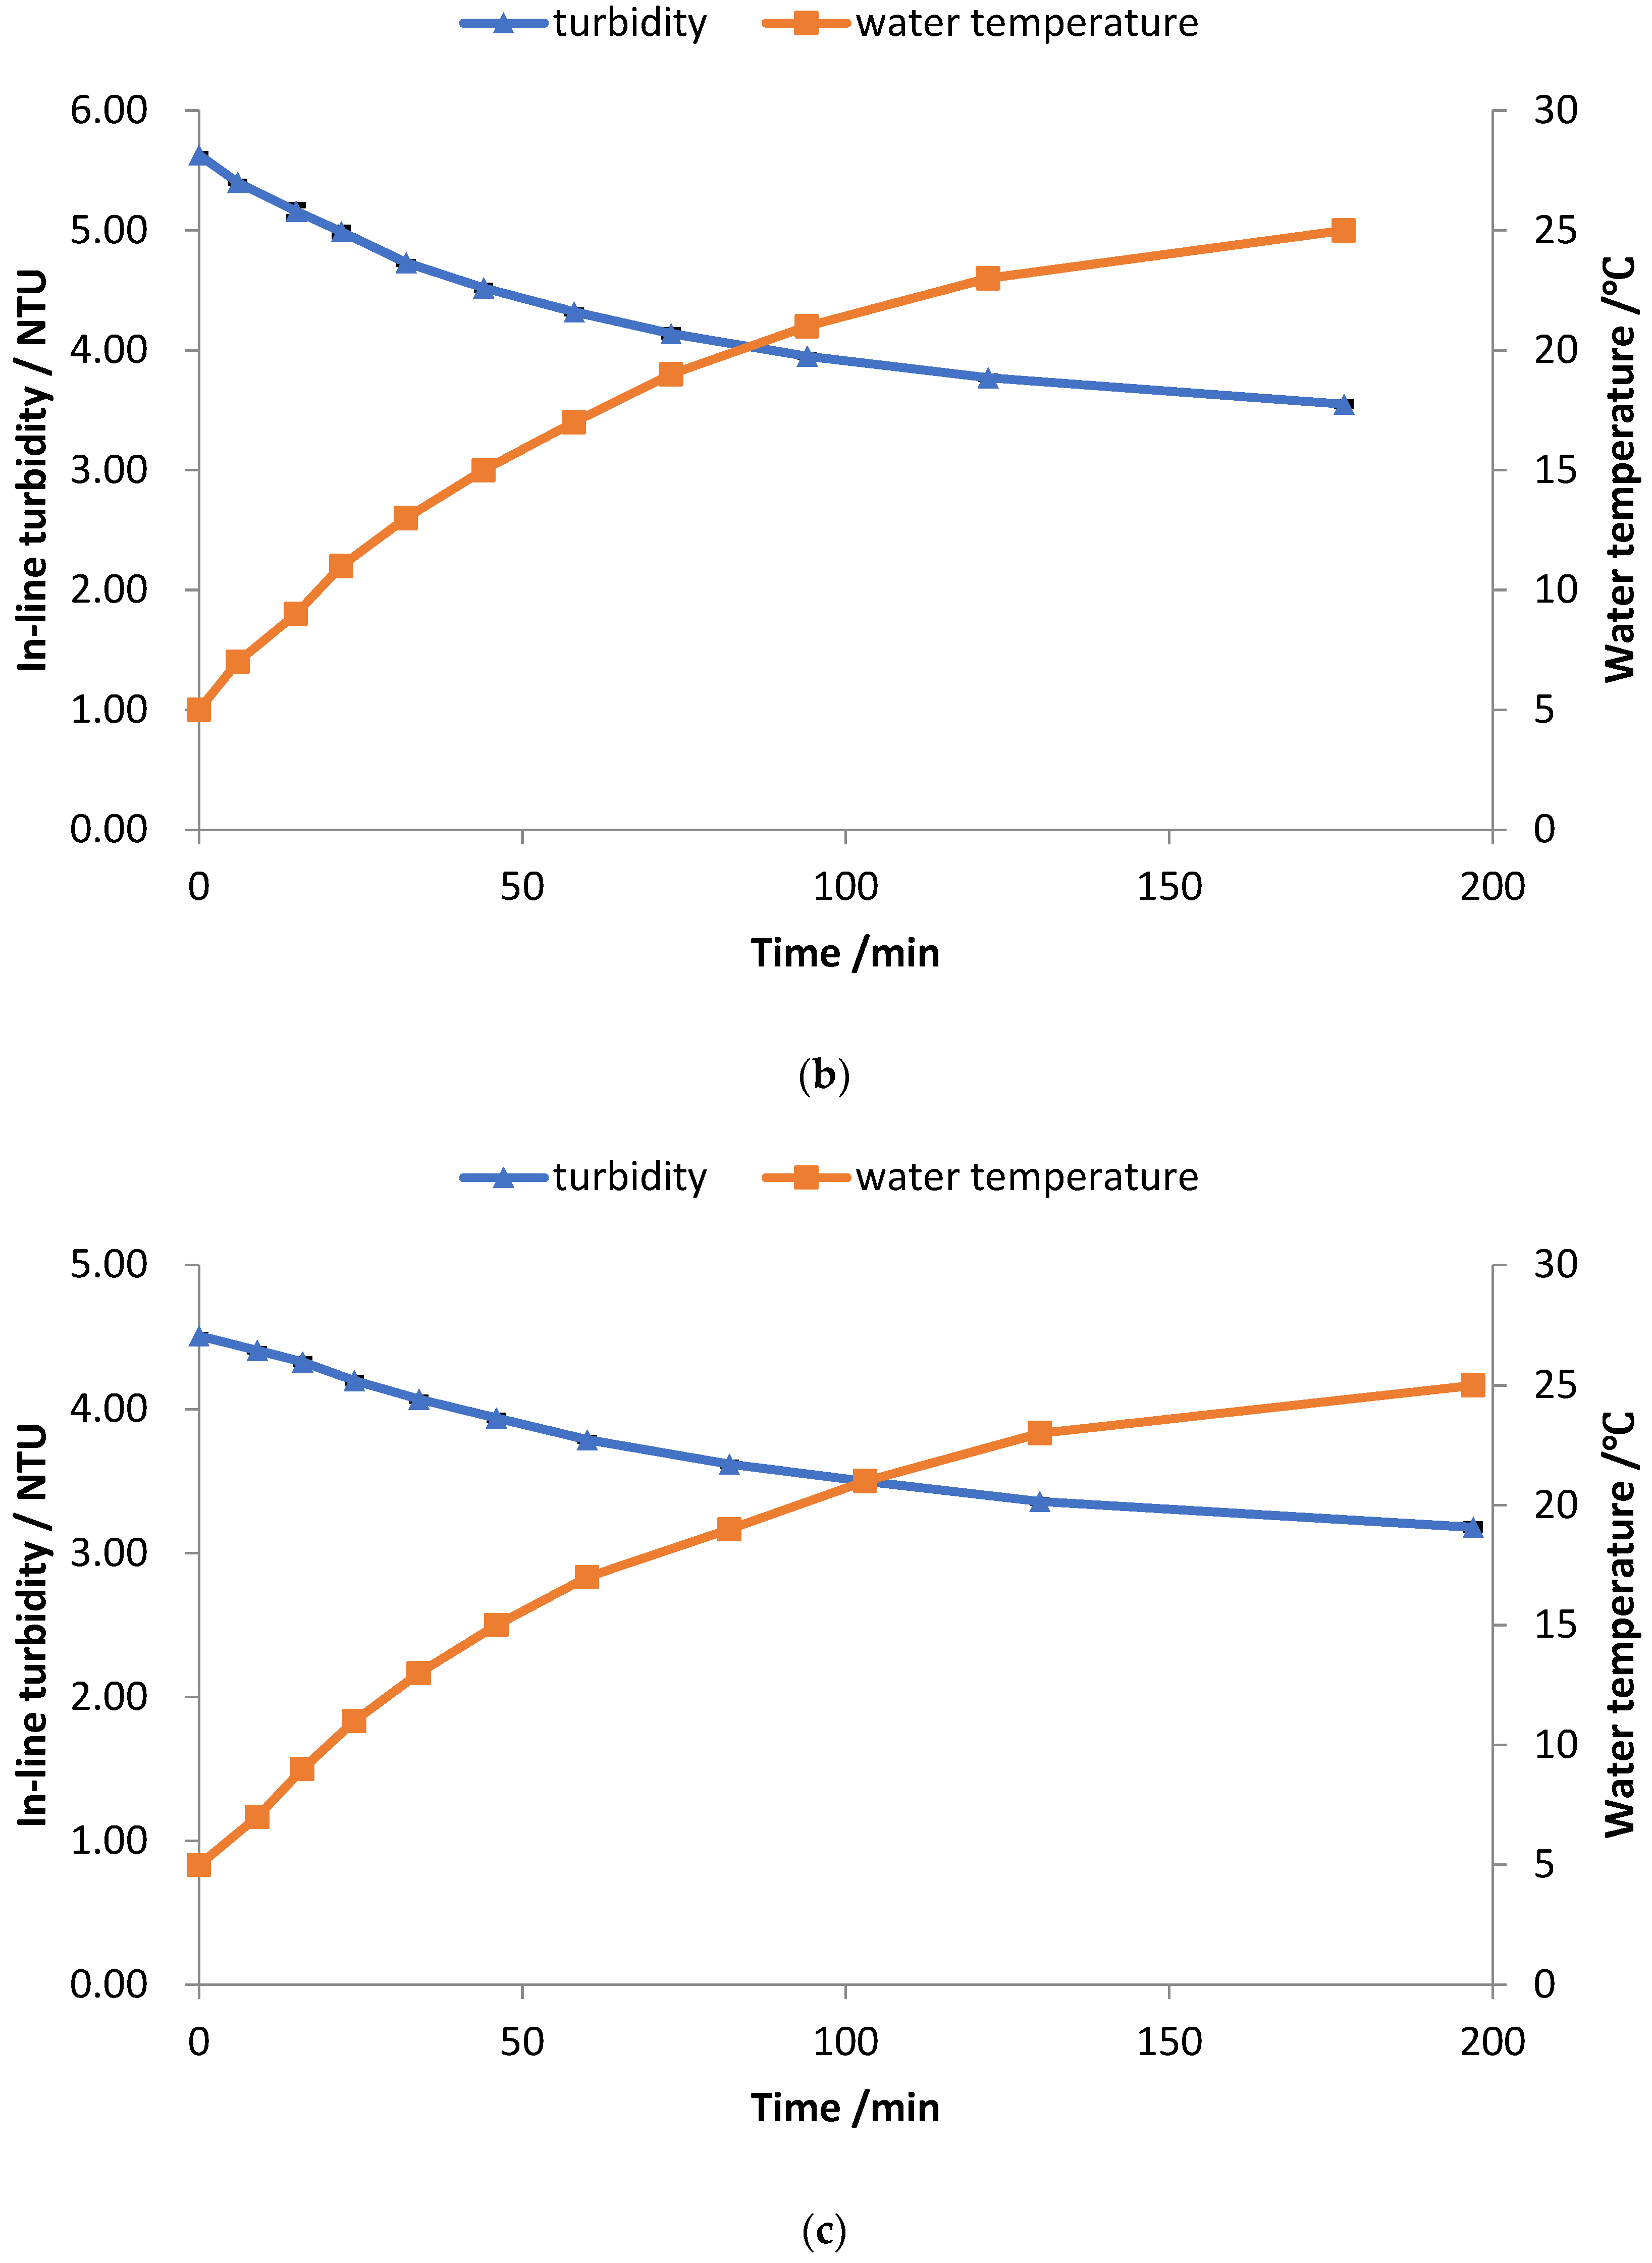
3.2. Relationship between the In-Line Turbidity and Water Temperature after the Water Cooling Treatment

In actual pipelines, the water temperature is usually much lower than in the above Section 3.1; therefore, we cooled the experimental water. The cooling method involved placing ice into the water tank and waiting for all ice to melt into the water. Afterward, we powered on the variable frequency pump, eliminated the bubbles in the pipeline, adjusted the water flow at the set velocity, and then started to record the in-line turbidity and water temperature data. Finally, we recorded data every 3 min and plotted the raw data, as shown in Figure 4. We also plotted the in-line turbidity and water temperature over time in the corresponding figure, as shown in Figure 5.
In each sub-figure of Figure 5, the water temperature ranged from 5 to 25 °C at different water velocities. The in-line turbidity over time was consistent, showing a downtrend. As the water temperature rose, the in-line turbidity value dropped, and the drop reached about 1 NTU. This trend was entirely different from the conclusion of the experimental case at room temperature. Why does one trend rise while the other falls, and why is one effect negligible while the other is much larger?

3.3. Comparison between the Two Cases

The influence mechanism of temperature on in-line turbidity has two aspects: the influence of temperature on optical elements and the impact of temperature on water samples. These two effects on the turbidity measurement are reversed. The optical element in the turbidimeter, including optical emitting and receiving electronic components, has little influence on the in-line turbidity for room temperature water due to temperature fluctuation, and the water temperature influences the water sample more significantly. The higher the water temperature, the stronger the water particle movement. The turbidity value also rises with the increase in the water temperature. However, in the experiment following the water-cooling treatment, the influence of the optical element due to the temperature fluctuation is more critical, far more than that of the water sample. The dominant aspect in the experiment determines the trend line direction, which is the reason for the opposite trends in Figure 3 and Figure 5.
However, in Figure 3 and Figure 5, the overlap of the in-line turbidity trend of the water temperature is opposite because there is no real-time synchronization of the optical element temperature and the water temperature. The factor affecting in-line turbidity detection is the temperature of the optical element, and the water temperature is just a representation. The heat exchange between the water and the environment takes time. In Figure 3, both the water and the optical element are at room temperature; when the water is heated up, the optical element is also heated up, gradually following the water. In Figure 5, the visual component is at room temperature, while the water is cooled at the beginning; when the variable frequency pump heats the cooled water, the optical element loses heat quickly at first and then gradually slows down the heat loss. The case of the visual components’ different temperature change shows the opposite in-line turbidity trend in Figure 3 and Figure 5. Since heat transfer takes time, the spatial structure of the water body, optical elements, the medium in contact with water or optical elements, and their temperature distribution all affect the speed and efficiency of heat transfer. The media in contact with water or optical elements include a pipe wall, the case of the turbidity meter, and air.
The in-line turbidity meter needs to compensate for the temperature coefficient. When the water temperature and the temperature of the optical element cannot be synchronized in real-time, the coefficient compensation of the temperature drift should not be determined by the water temperature, and the temperature of the relevant optical element should also be directly selected. Only when the water temperature and the temperature of the optical element are synchronized in real-time, the water temperature can replace the temperature of the optical element to establish its influence on in-line turbidity detection.

3.4. Discussion

In the existing studies, the effect of temperature on turbidity has been established by off-line measurements. This research gave insight into the influence of water temperature on in-line turbidity. However, our cases are limited and cannot cover most cases. More related work is required, including other methodologies and experiments, especially those involving the quantitative relationship.

4. Conclusions

Our experiments verified the impact of temperature on in-line turbidity. In-line turbidity is affected by the water temperature. The influence is negligible when the water temperature change interval within 10 °C is not significant. However, when the water temperature changes more than 15 °C, the in-line turbidity sensor must correct for temperature drift, and the correction coefficient needs to be obtained from the experiment covering the temperature interval. The temperature should be obtained from the optical components. The fundamental factor affecting in-line turbidity detection is not the water temperature but the temperature of light-related electronic components, including light-emitting and light-receiving elements. Only when the water temperature and the temperature of the optical element are synchronized in real-time, the water temperature can replace the temperature of the optical element, and the influence of the associated temperature on the presence of in-line turbidity is used.

Author Contributions

Conceptualization, M.S. and J.M.; methodology, M.S. and K.Z.; investigation, M.S. and J.M.; writing—original draft preparation, M.S.; writing—review and editing, K.Z. All authors have read and agreed to the published version of the manuscript.

Funding

This research is supported by the “Qianjiang Talent Plan” of Zhejiang Province (no. QJD1902003), the Natural Science Foundation of Zhejiang Province (no. LQ21B060003), and the Ningbo Polytechnic high-level talent introduction research project (no. RC201909).

Conflicts of Interest

The authors declare no conflict of interest.

References

  1. Foroughi, M.; Chavoshi, S.; Bagheri, M.; Yetilmezsoy, K.; Samadi, M.T. Alum-based sludge (AbS) recycling for turbidity removal in drinking water treatment: An insight into statistical, technical, and health-related standpoints. J. Mater. Cycles Waste Manag. 2018, 20, 1999–2017. [Google Scholar] [CrossRef]
  2. Newhart, K.B.; Holloway, R.W.; Hering, A.S.; Cath, T.Y. Data-driven performance analyses of wastewater treatment plants: A review. Water Res. 2019, 157, 498–513. [Google Scholar] [CrossRef] [PubMed]
  3. Douterelo, I.; Sharpe, R.L.; Husband, S.; Fish, K.E.; Boxall, J.B. Understanding microbial ecology to improve management of drinking water distribution systems. Wiley Interdiscip. Rev. Water 2019, 6, e01325. [Google Scholar] [CrossRef] [Green Version]
  4. Priya, S.K.; Shenbagalakshmi, G.; Revathi, T. Design of smart sensors for real time drinking water quality monitoring and contamination detection in water distributed mains. Int. J. Eng. Technol. 2018, 7, 47–51. [Google Scholar] [CrossRef] [Green Version]
  5. Droujko, J.; Molnar, P. Open-source, low-cost, in-situ turbidity sensor for river network monitoring. Sci. Rep. 2022, 12, 10341. [Google Scholar] [CrossRef] [PubMed]
  6. Zhang, Y.; Yao, X.; Wu, Q.; Huang, Y.; Zhou, Z.; Yang, J.; Liu, X. Turbidity prediction of lake-type raw water using random forest model based on meteorological data: A case study of Tai lake, China. J. Environ. Manag. 2021, 290, 112657. [Google Scholar] [CrossRef] [PubMed]
  7. Fleet, C.F.; Siebert, K.J. Effect of illumination intensity on visual perception of turbidity. Food Qual. Prefer. 2005, 16, 536–544. [Google Scholar] [CrossRef]
  8. Goode, K.R.; Asteriadou, K.; Robbins, P.T.; Fryer, P.J. Fouling and cleaning studies in the food and beverage industry classified by cleaning type. Compr. Rev. Food Sci. Food Saf. 2013, 12, 121–143. [Google Scholar] [CrossRef]
  9. Hach, C.C.; Engelhardt, T.; Sadar, M. Principles of Surface Scatter® Turbidity Measurement: Technical Information Series Booklet; Hach Company: Loveland, CO, USA, 2013. [Google Scholar]
  10. Sader, M. Turbidity Measurement: A Simple, Effective Indicator of Water Quality Change. OTT Hydromet. 2017. Available online: https://www.ott.com/download/turbidity-white-paper (accessed on 25 August 2022).
  11. Fay, C.D.; Nattestad, A. Advances in optical based turbidity sensing using LED photometry (PEDD). Sensors 2022, 22, 254. [Google Scholar] [CrossRef] [PubMed]
  12. Tai, H.; Li, D.; Wei, Y.; Ma, D.; Ding, Q. A simple temperature compensation method for turbidity sensor. In International Conference on Computer and Computing Technologies in Agriculture; Springer: Berlin/Heidelberg, Germany, 2010. [Google Scholar]
  13. Racey, J.D. Development of Novel Turbidity Calibration Standards and Methodologies Using Appropriate Technology. Master’s Thesis, Purdue University Graduate School, West Lafayette, IN, USA, 2019. [Google Scholar]
  14. Nazirova, K.; Alferyeva, Y.; Lavrova, O.; Shur, Y.; Soloviev, D.; Bocharova, T.; Strochkov, A. Comparison of in situ and remote-sensing methods to determine turbidity and concentration of suspended matter in the Estuary Zone of the Mzymta River, Black Sea. Remote Sens. 2021, 13, 143. [Google Scholar] [CrossRef]
  15. Wang, Y.; Rajib, S.M.S.M.; Collins, C.; Grieve, B. Low-cost turbidity sensor for low-power wireless monitoring of fresh-water courses. IEEE Sens. J. 2018, 18, 4689–4696. [Google Scholar] [CrossRef] [Green Version]
  16. Bardsley, R.; Gardner, G.; Tse, H.M.; Fraker, C.A. Optical sensor arrays designed for guided manufacture of perfluorocarbon nanoemulsions with a non-synthetic stabilizer. Acta Biomater. 2021, 136, 558–569. [Google Scholar] [CrossRef] [PubMed]
  17. Berkcan, E. Temperature Compensation Method for a Turbidity Sensor Used in an Appliance for Washing Articles. U.S. Patent 005477576A, 26 December 1995. [Google Scholar]
  18. Engel, C. Method for Temperature Compensation of Measured Values of a Turbidity Sensor in an Automatic Washing Machine or Dishwasher. U.S. Patent 5889192, 30 March 1999. [Google Scholar]
  19. Malliaris, A.G. Wiener Process. In Time Series and Statistics; Eatwell, J., Milgate, M., Newman, P., Eds.; Palgrave Macmillan: London, UK, 1990; pp. 316–318. [Google Scholar]
  20. Gottlieb, M.A.; Pfeiffer, R. The Brownian Movement [EB/OL]. California Institute of Technology. 2013. Available online: http://www.feynmanlectures.caltech.edu/I_41.html (accessed on 28 August 2022).
Figure 1. Schematic diagram and actual picture of the experimental setup. 1. Water meter; 2. Variable frequency pump; 3. Chemitec in-line turbidity meter (including temperature sensor); 4. Ball valve; 5. Water tank.
Water 14 03720 g001
Figure 2. Scatterplot graphs for the in-line turbidity and water temperature original data set at room temperature. (a) Water velocity is set as 0.33 m/s. (b) Water velocity is set as 0.66 m/s. (c) Water velocity is set as 1.66 m/s.
Water 14 03720 g002aWater 14 03720 g002b
Figure 3. Relationship between the in-line turbidity and water temperature over time at room temperature. (a) Water velocity is set as 0.33 m/s. (b) Water velocity is set as 0.66 m/s. (c) Water velocity is set as 1.66 m/s.
Water 14 03720 g003aWater 14 03720 g003b
Figure 4. Scatterplot graphs for the in-line turbidity and water temperature original data set after the cooling water treatment. (a) Water velocity is set as 0.33 m/s. (b) Water velocity is set as 0.66 m/s. (c) Water velocity is set as 1.66 m/s.
Water 14 03720 g004aWater 14 03720 g004b
Figure 5. Relationship between the in-line turbidity and water temperature over time after the water cooling treatment. (a) Water velocity is set as 0.33 m/s. (b) Water velocity is set as 0.66 m/s. (c) Water velocity is set as 1.66 m/s.
Water 14 03720 g005aWater 14 03720 g005b
Publisher’s Note: MDPI stays neutral with regard to jurisdictional claims in published maps and institutional affiliations.

