


Relationship of Rainfall and Flood Return Periods through Hydrologic and Hydraulic Modeling

 ,
,  ,
,  and
and
Abstract
1. Introduction
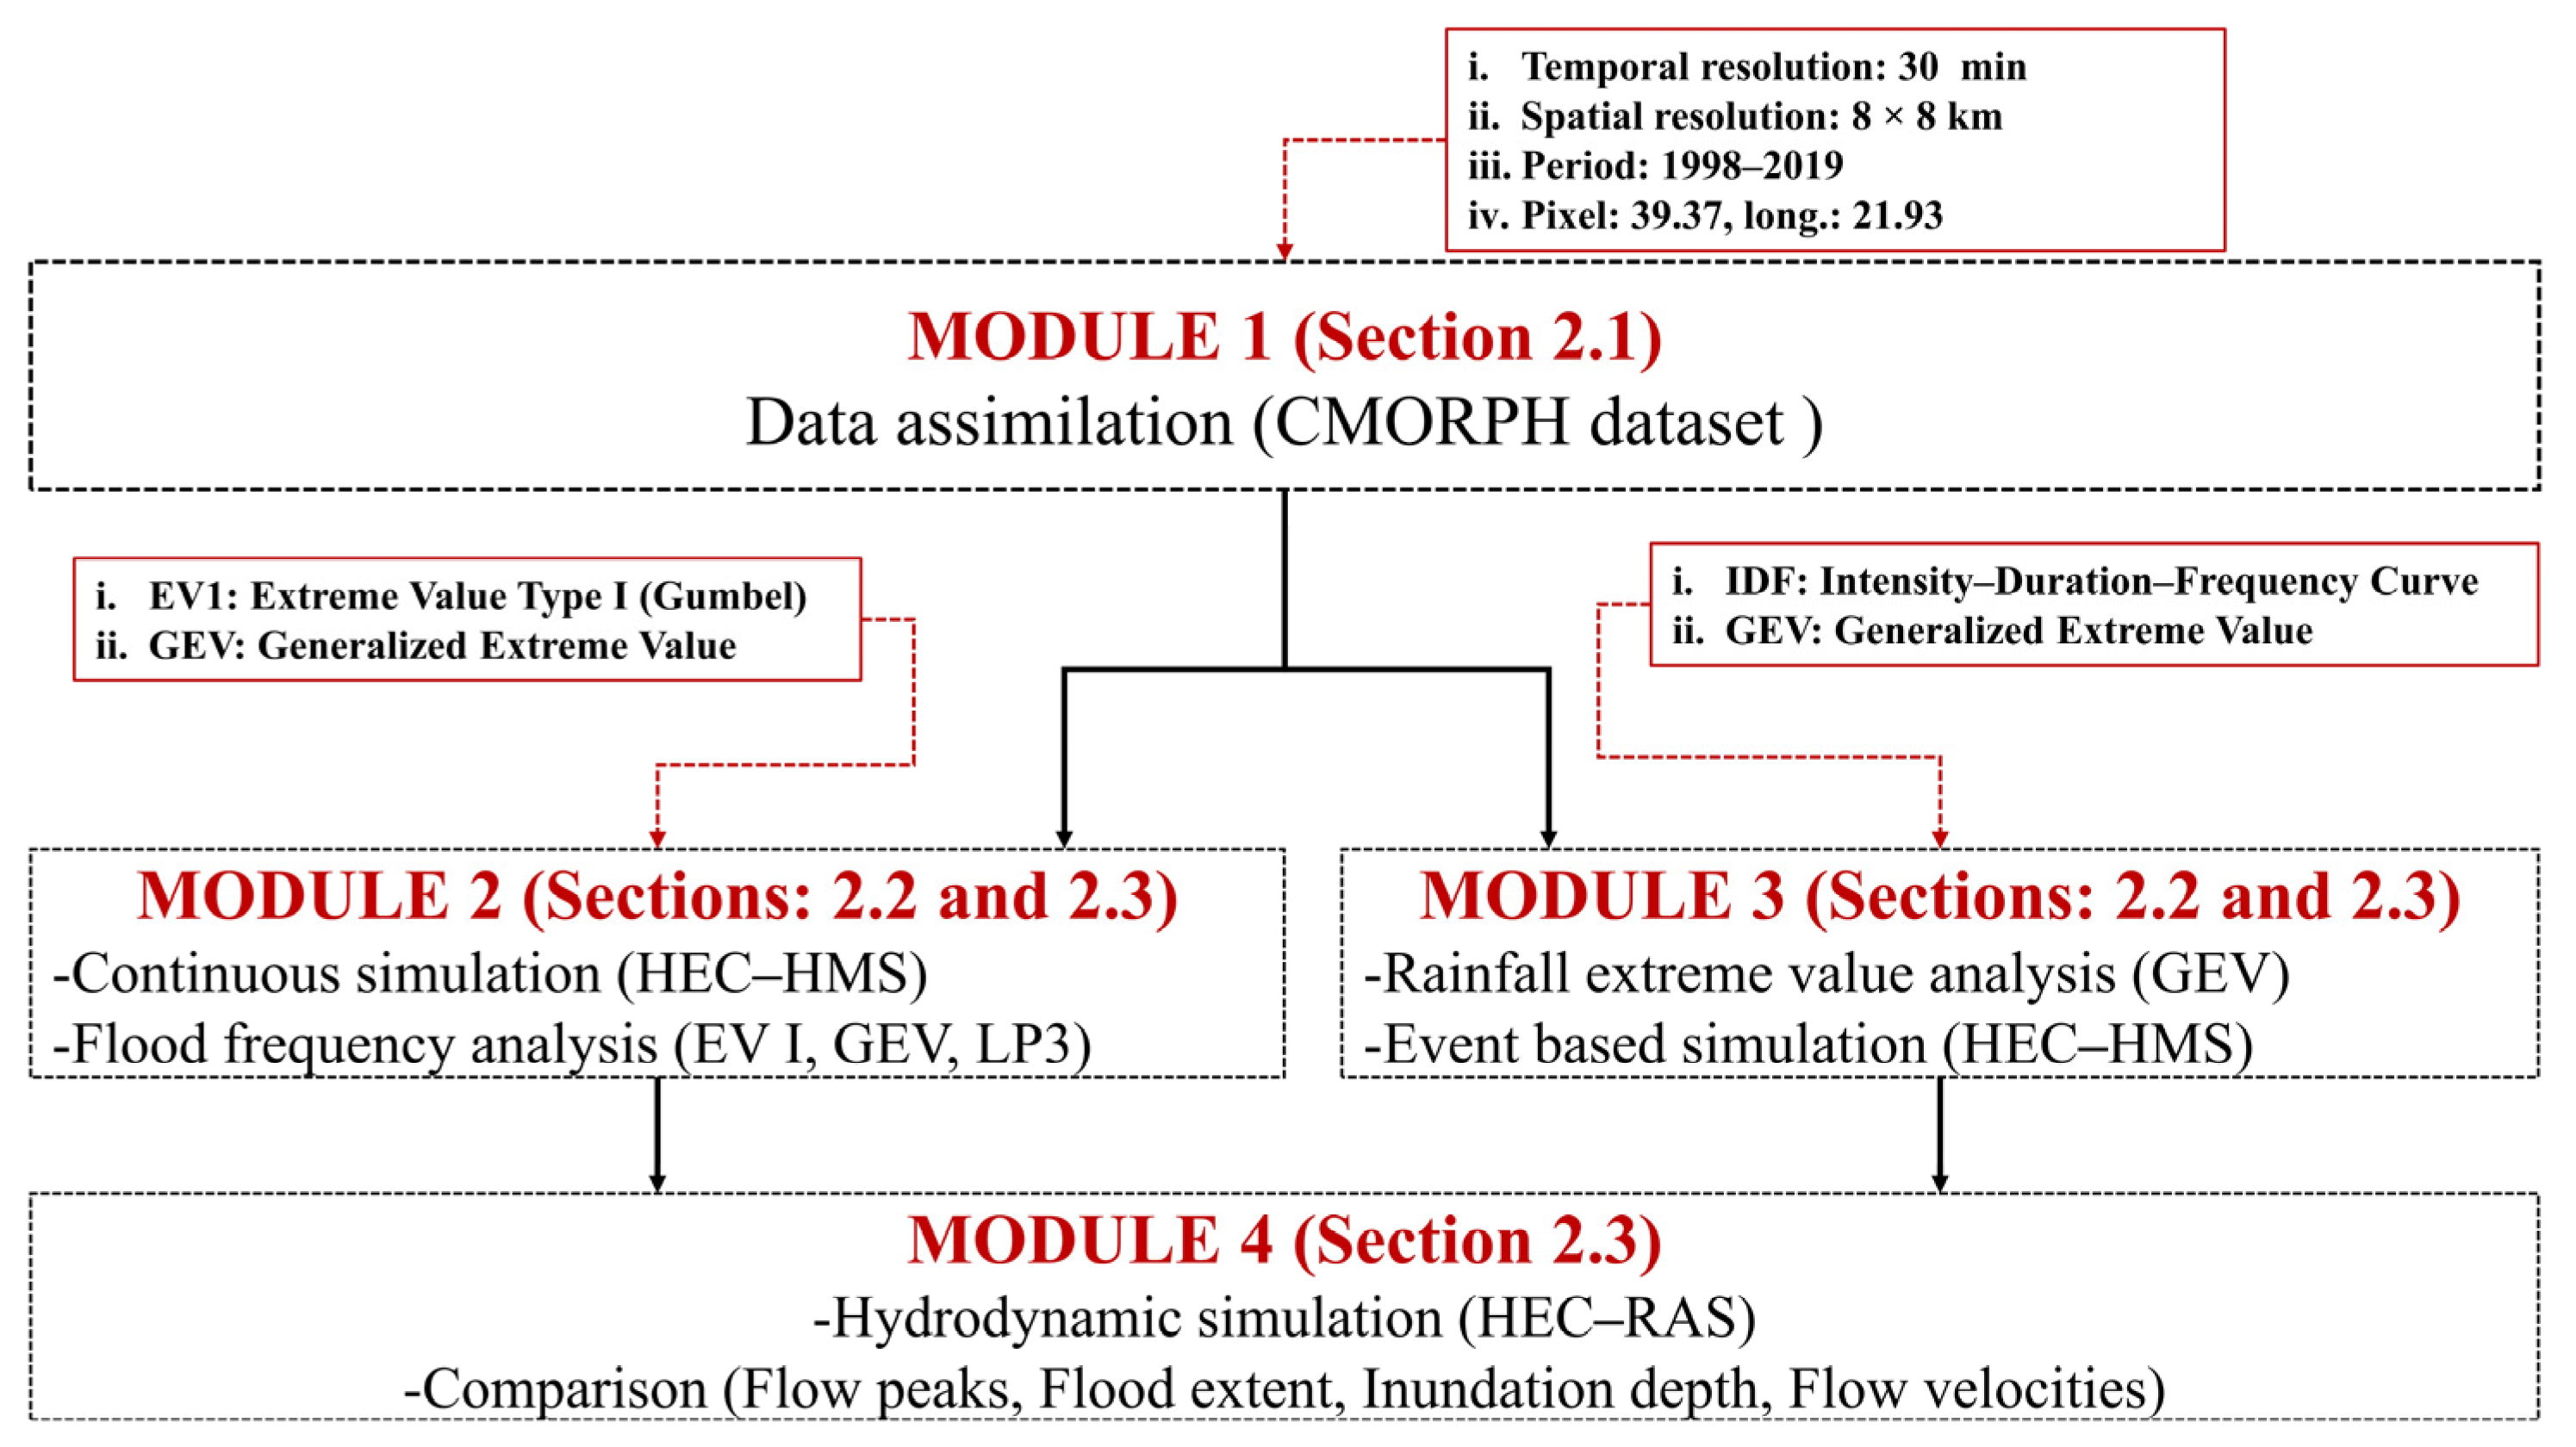
2. Materials and Methods
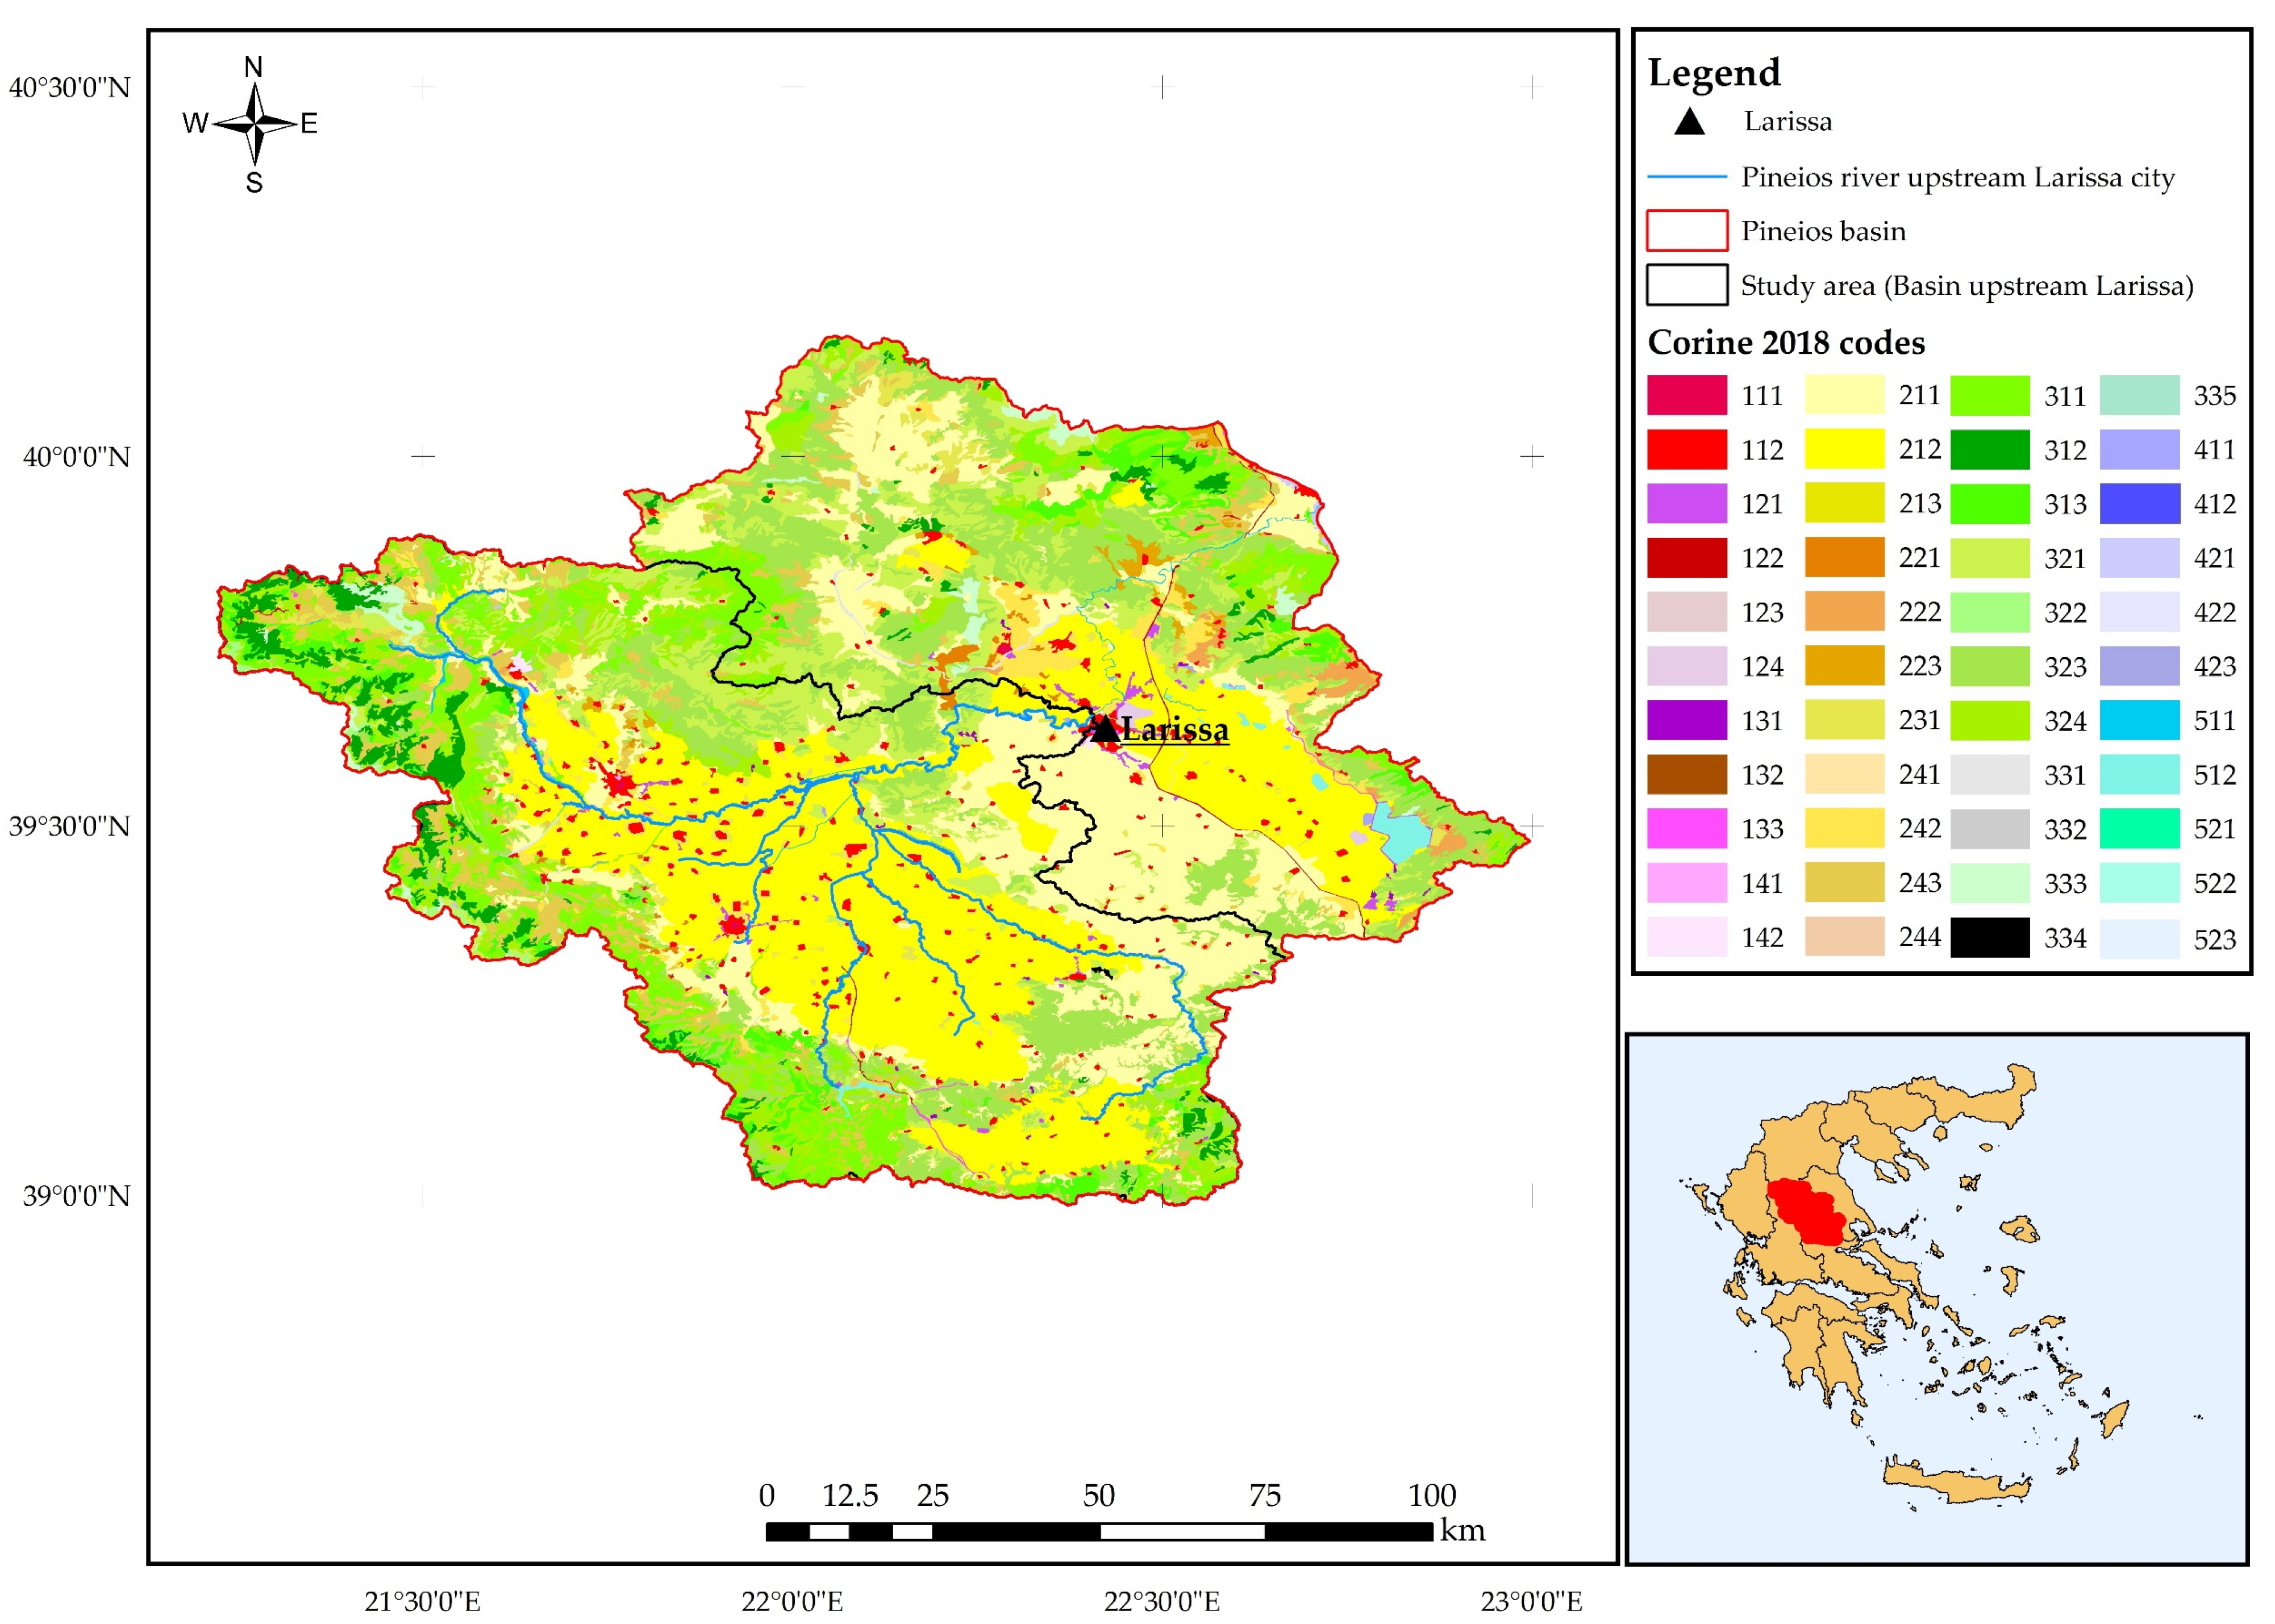
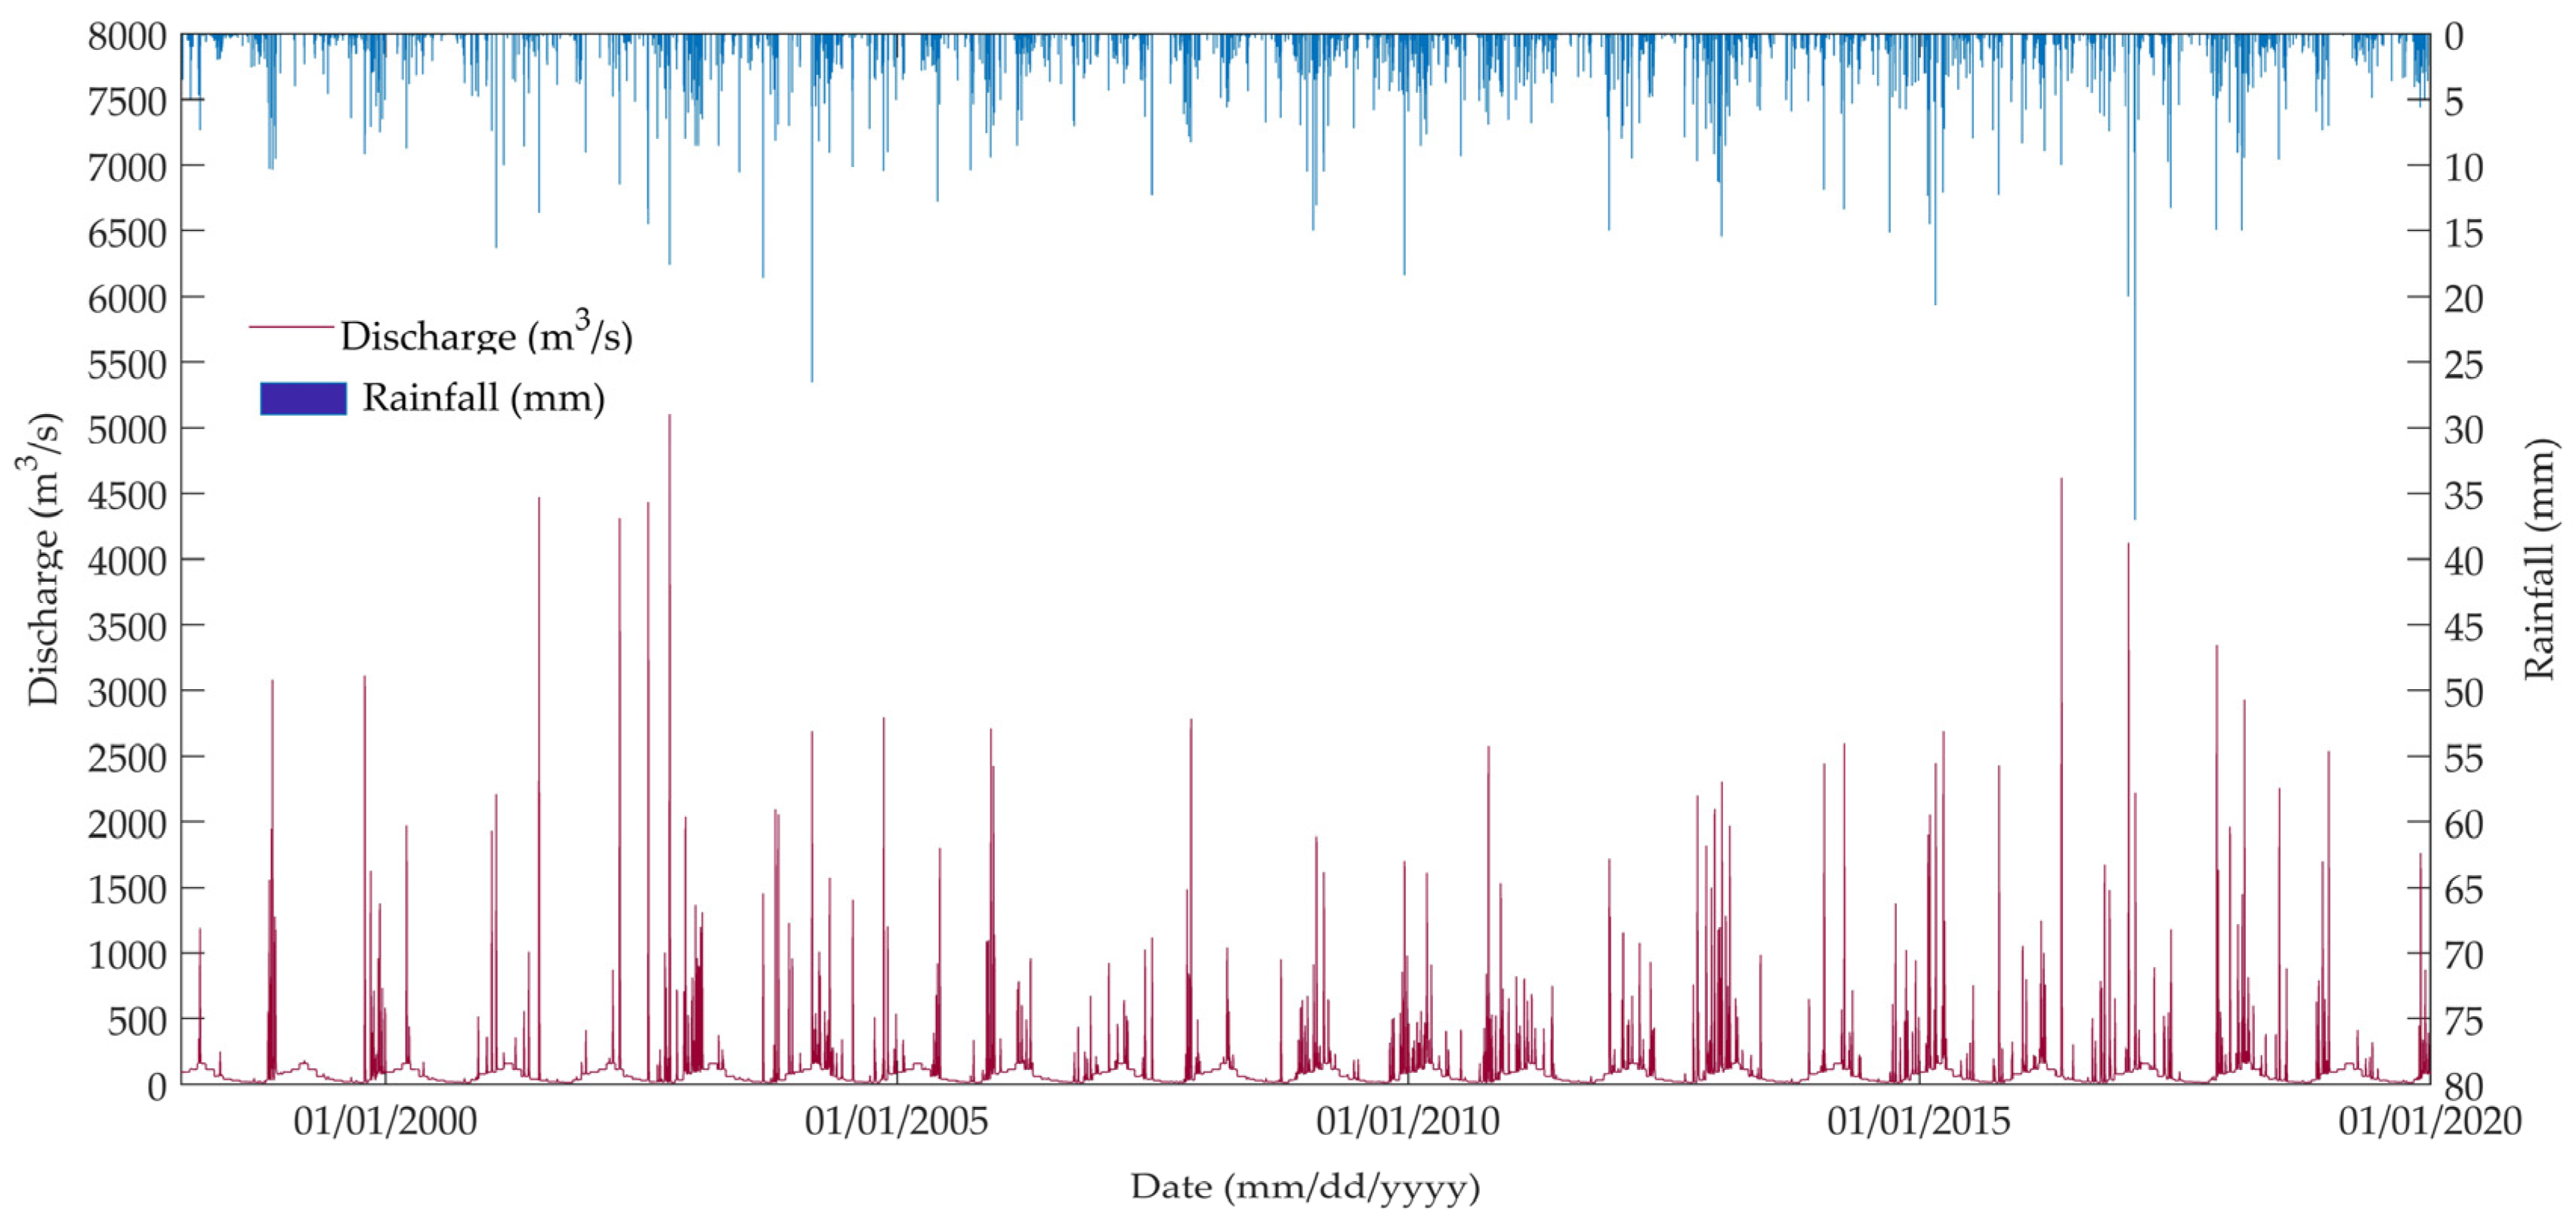
2.1. Study Area and Data
- Satellite rainfall is free of biases;
- The rainfall distribution is produced based on the empirical Alternating Block Method [1] assuming specific time step and storm duration;
- The rainfall losses are estimated using the SCS Curve Number (CN, land uses and soil in the study area);
- Continuous simulation and flood flow frequency analysis was conducted using the peak discharges generated by the hydrological model;
- One flood per hydrological year is selected so that the events are identically distributed and statistically independent.
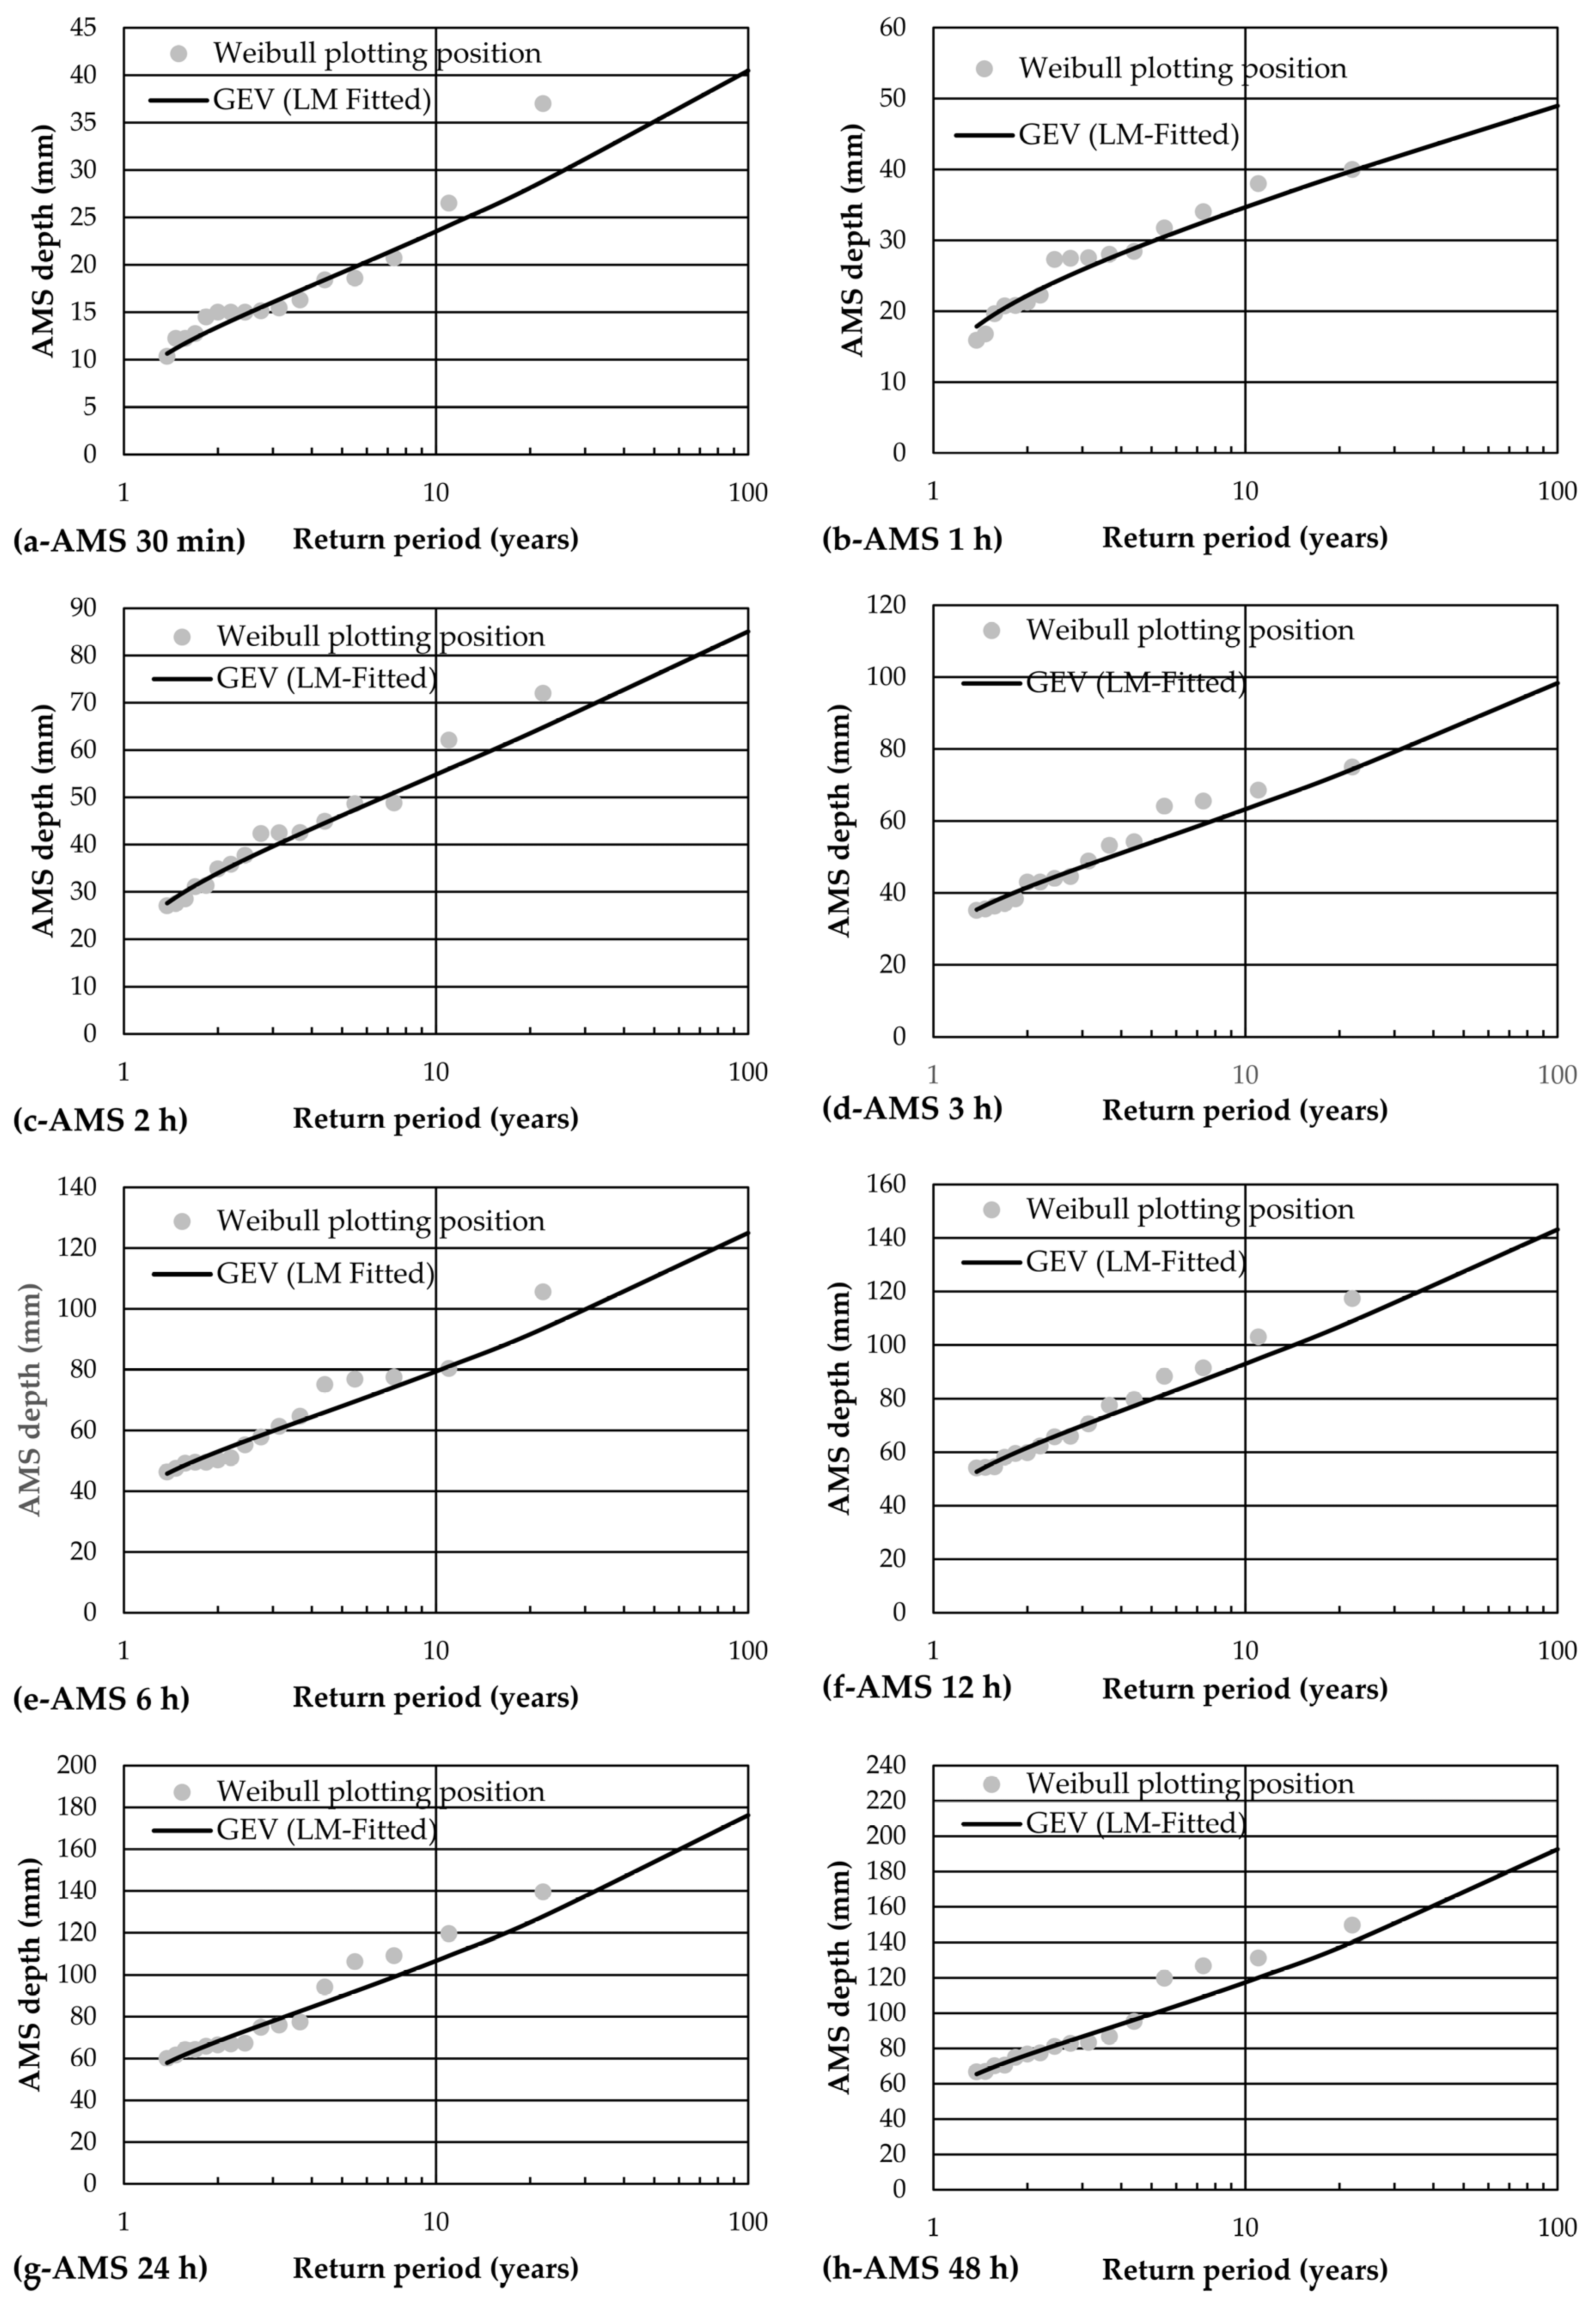
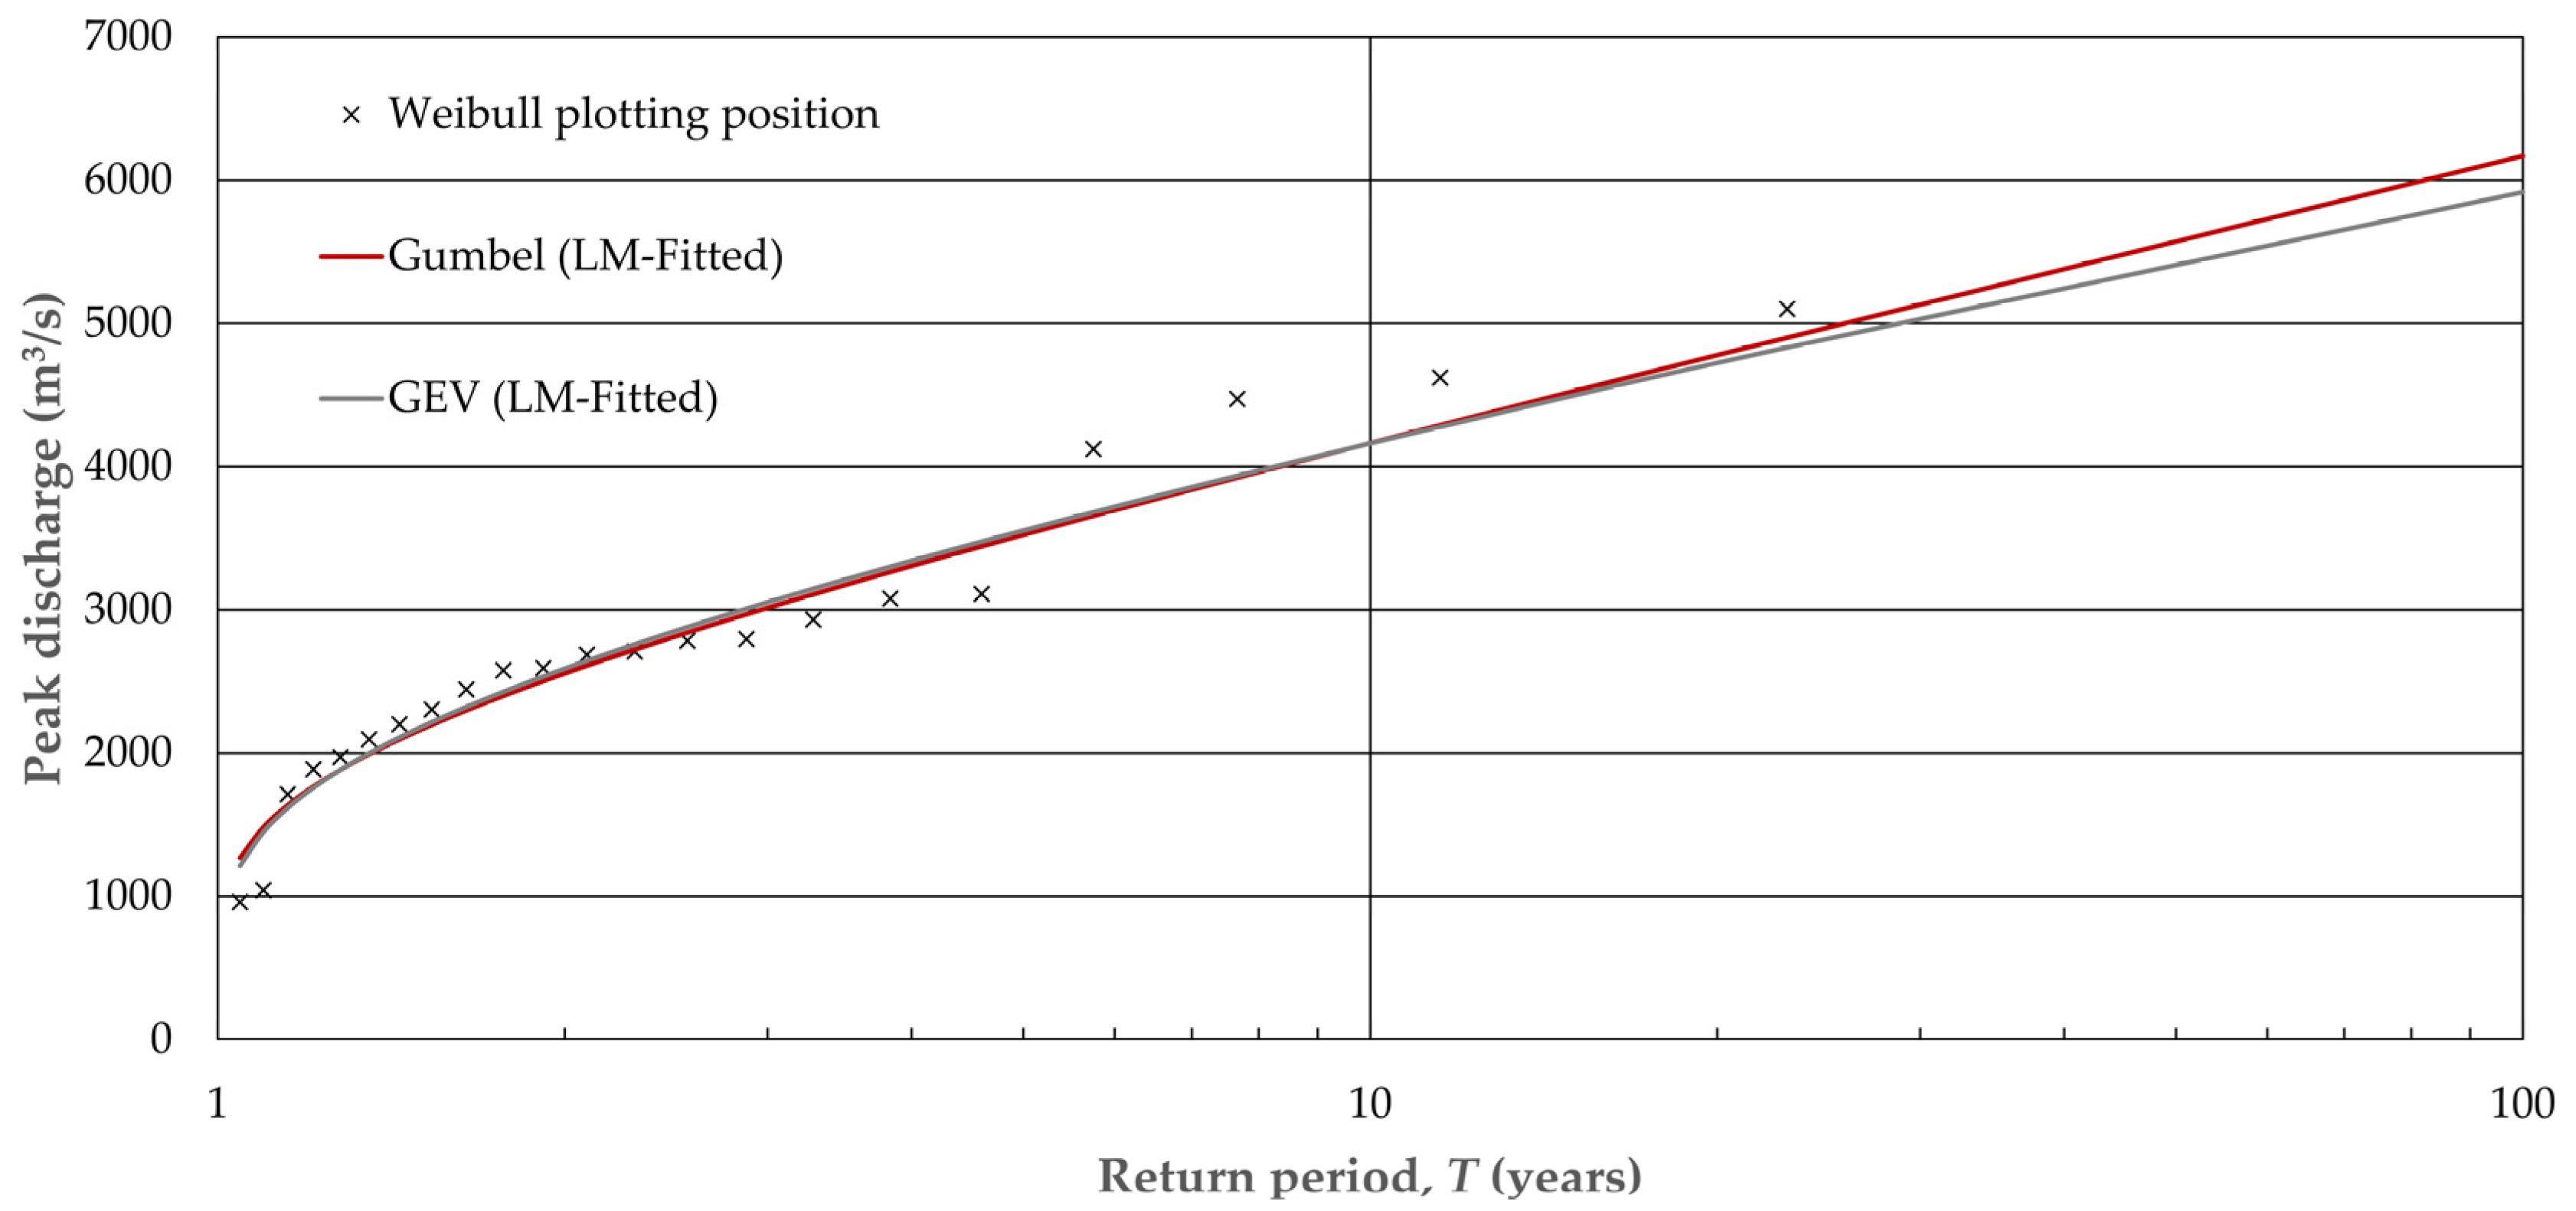
2.2. Extreme Value Analysis
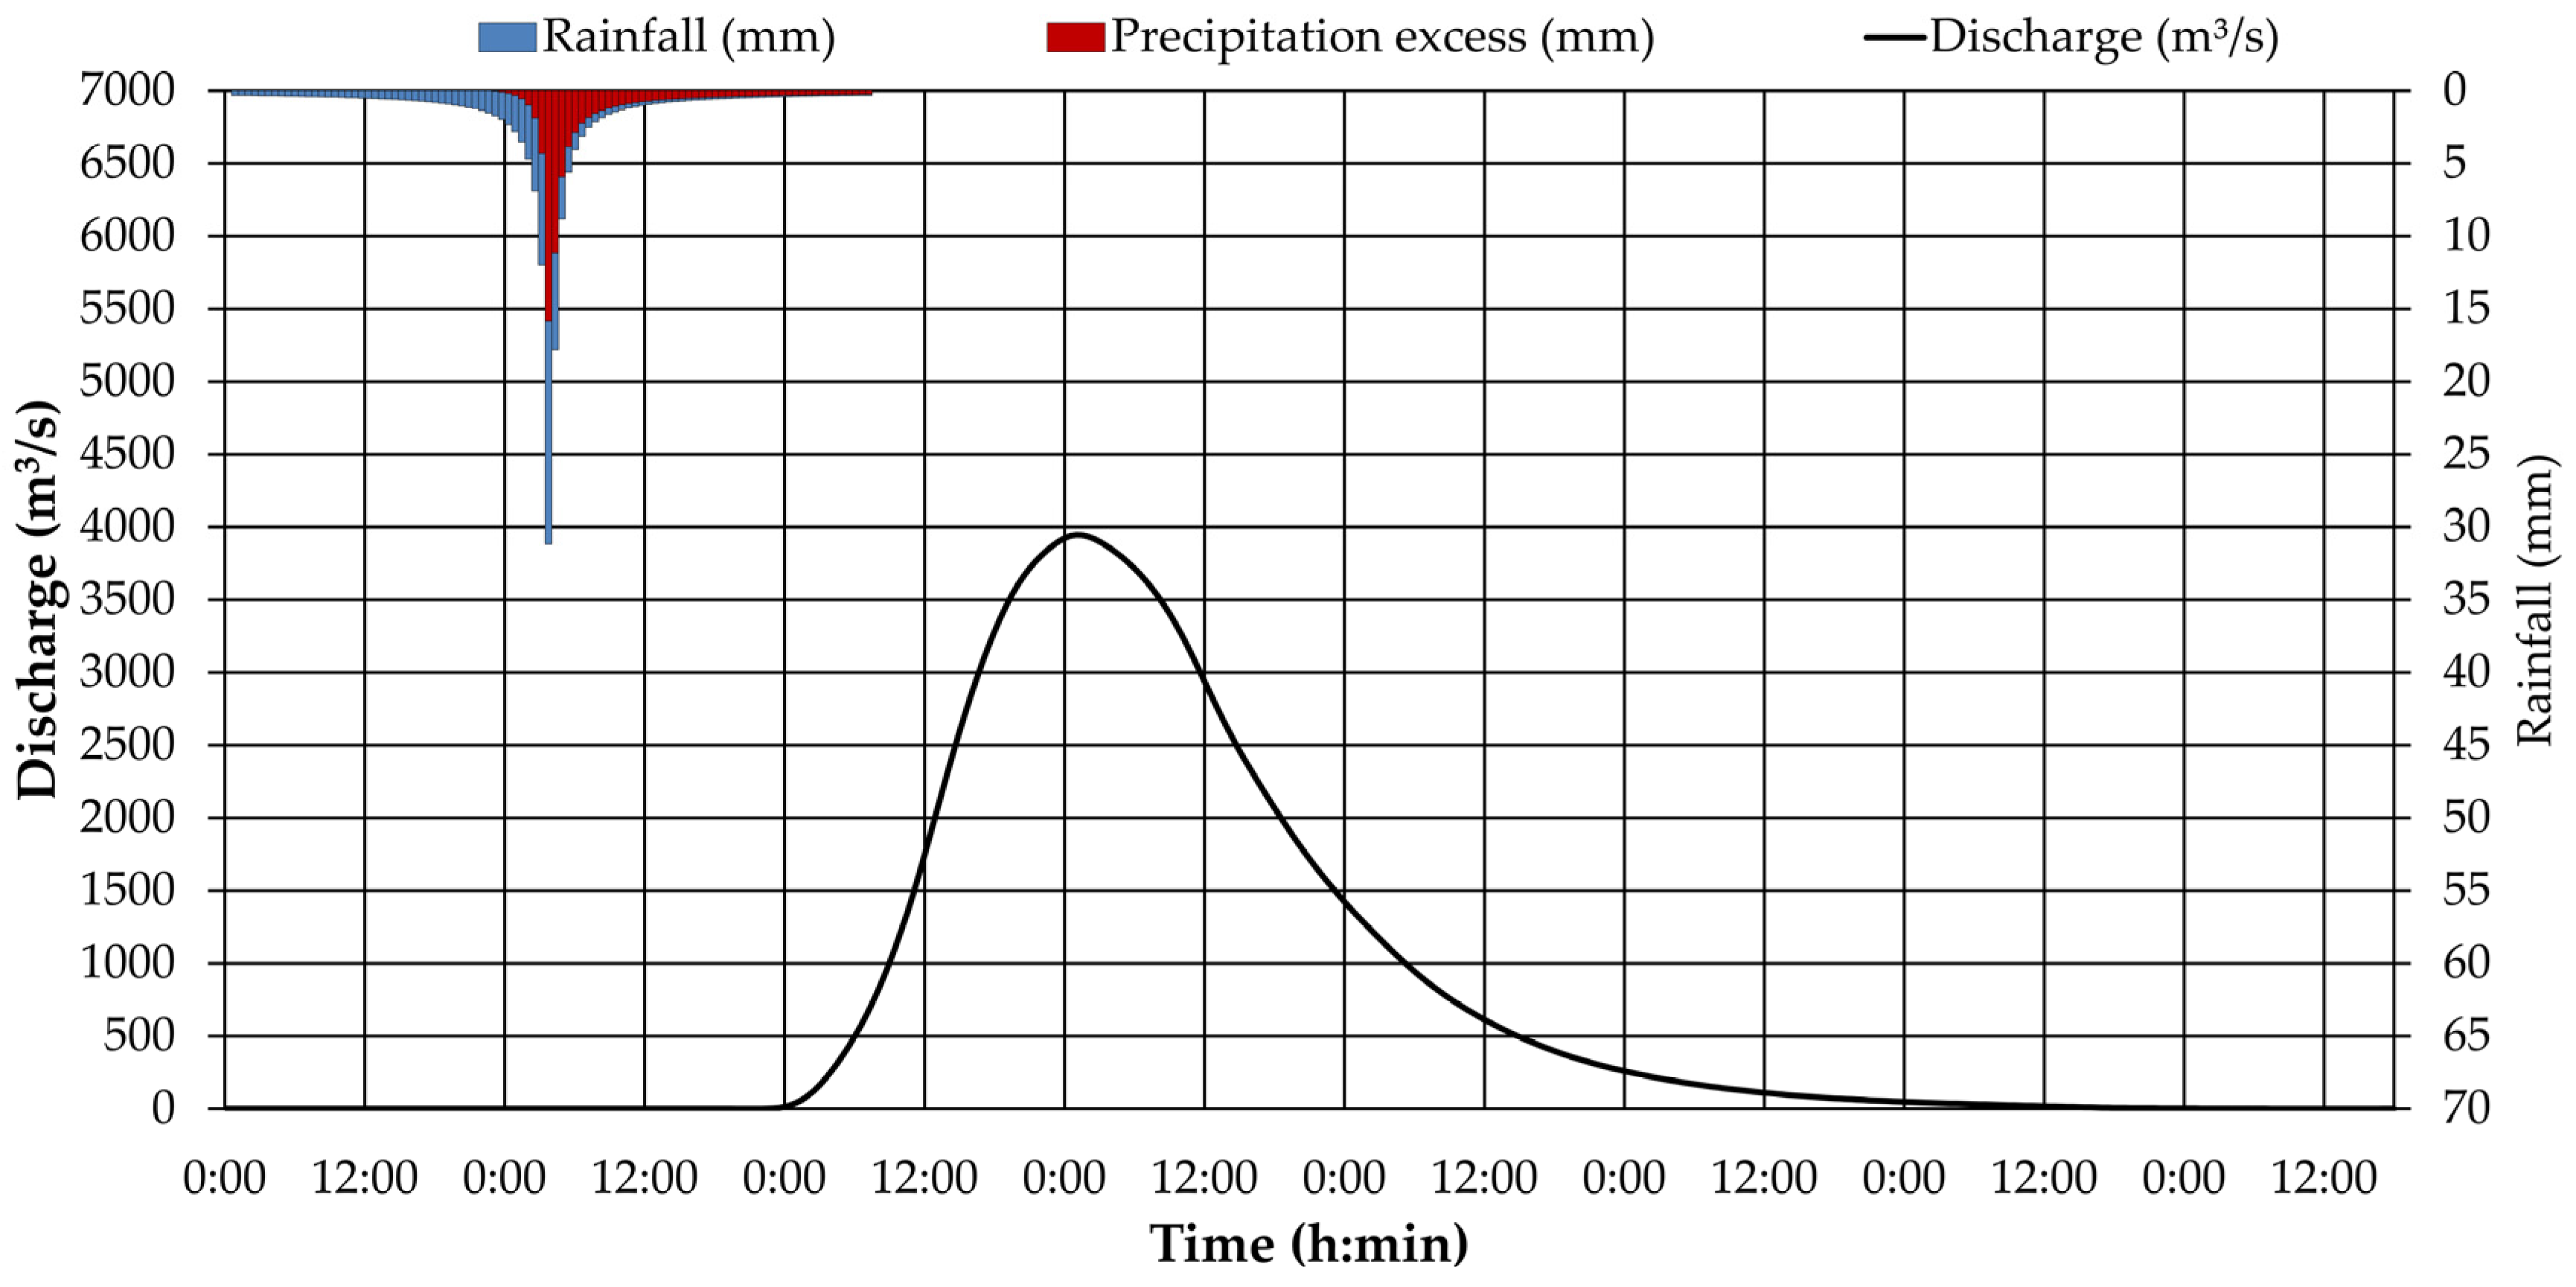
2.3. Hydrologic-Hydrodynamic Modeling
3. Results
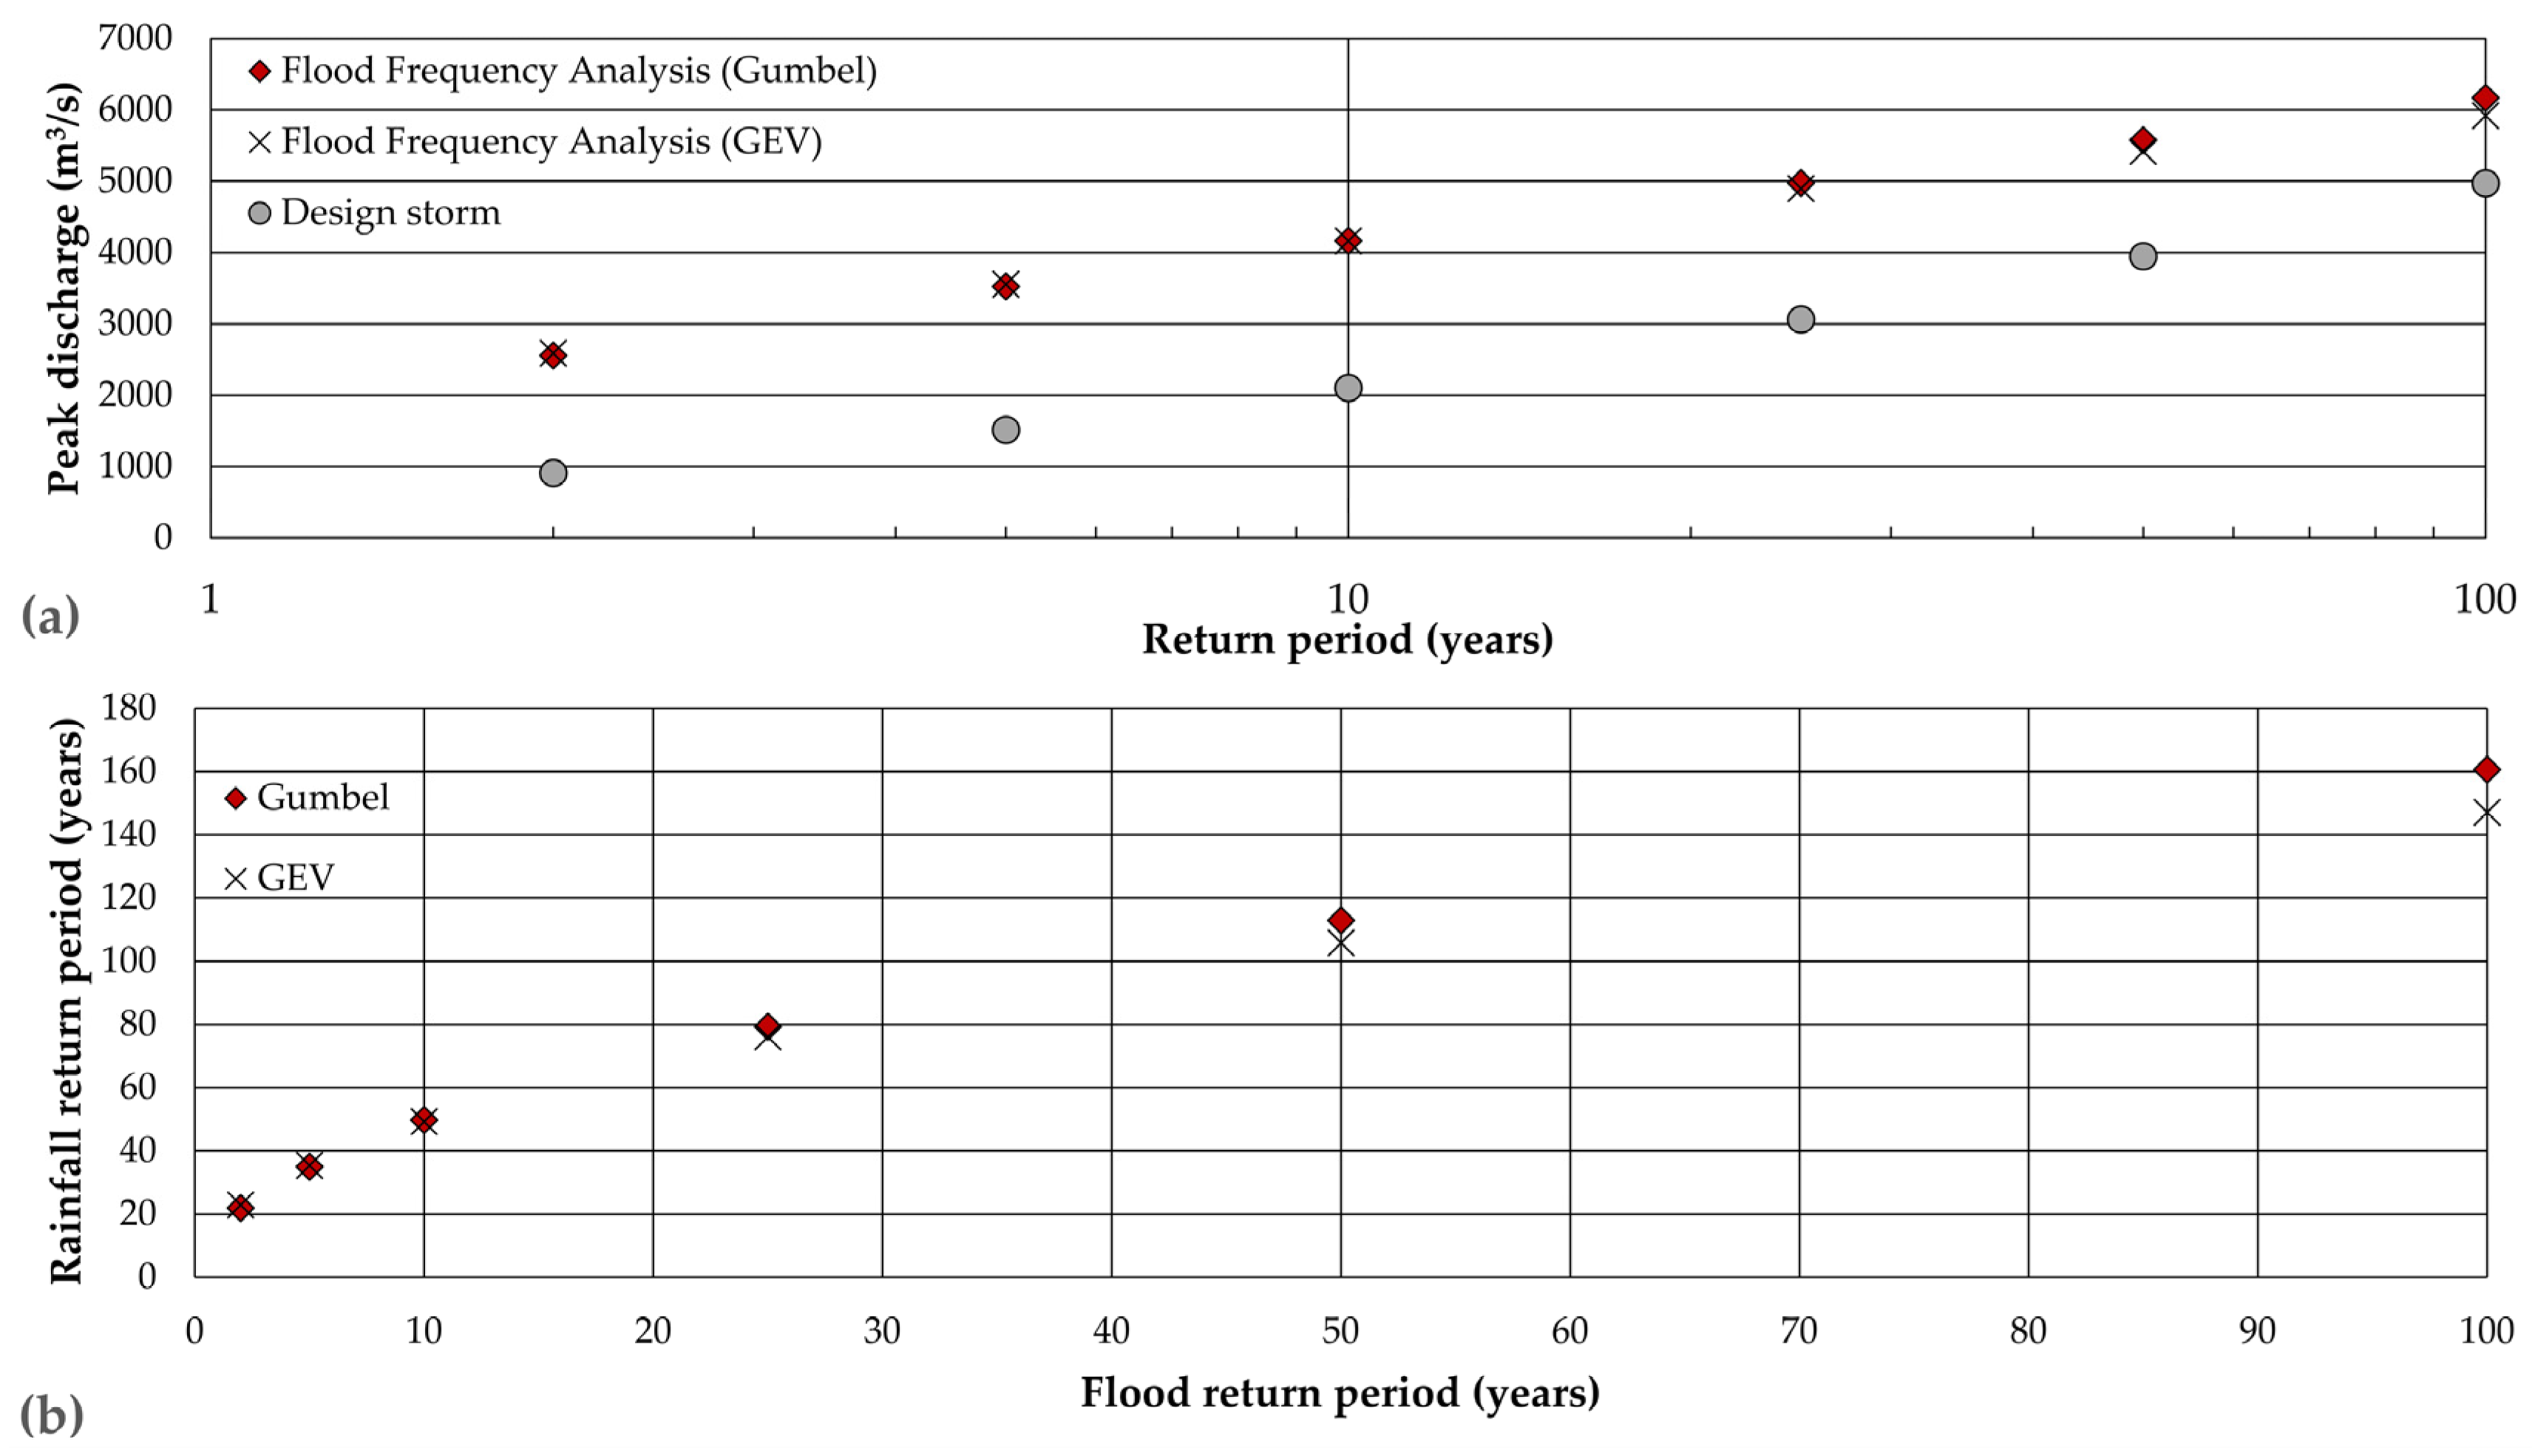
3.1. Design Storm Approach vs. Flood Frequency Analysis
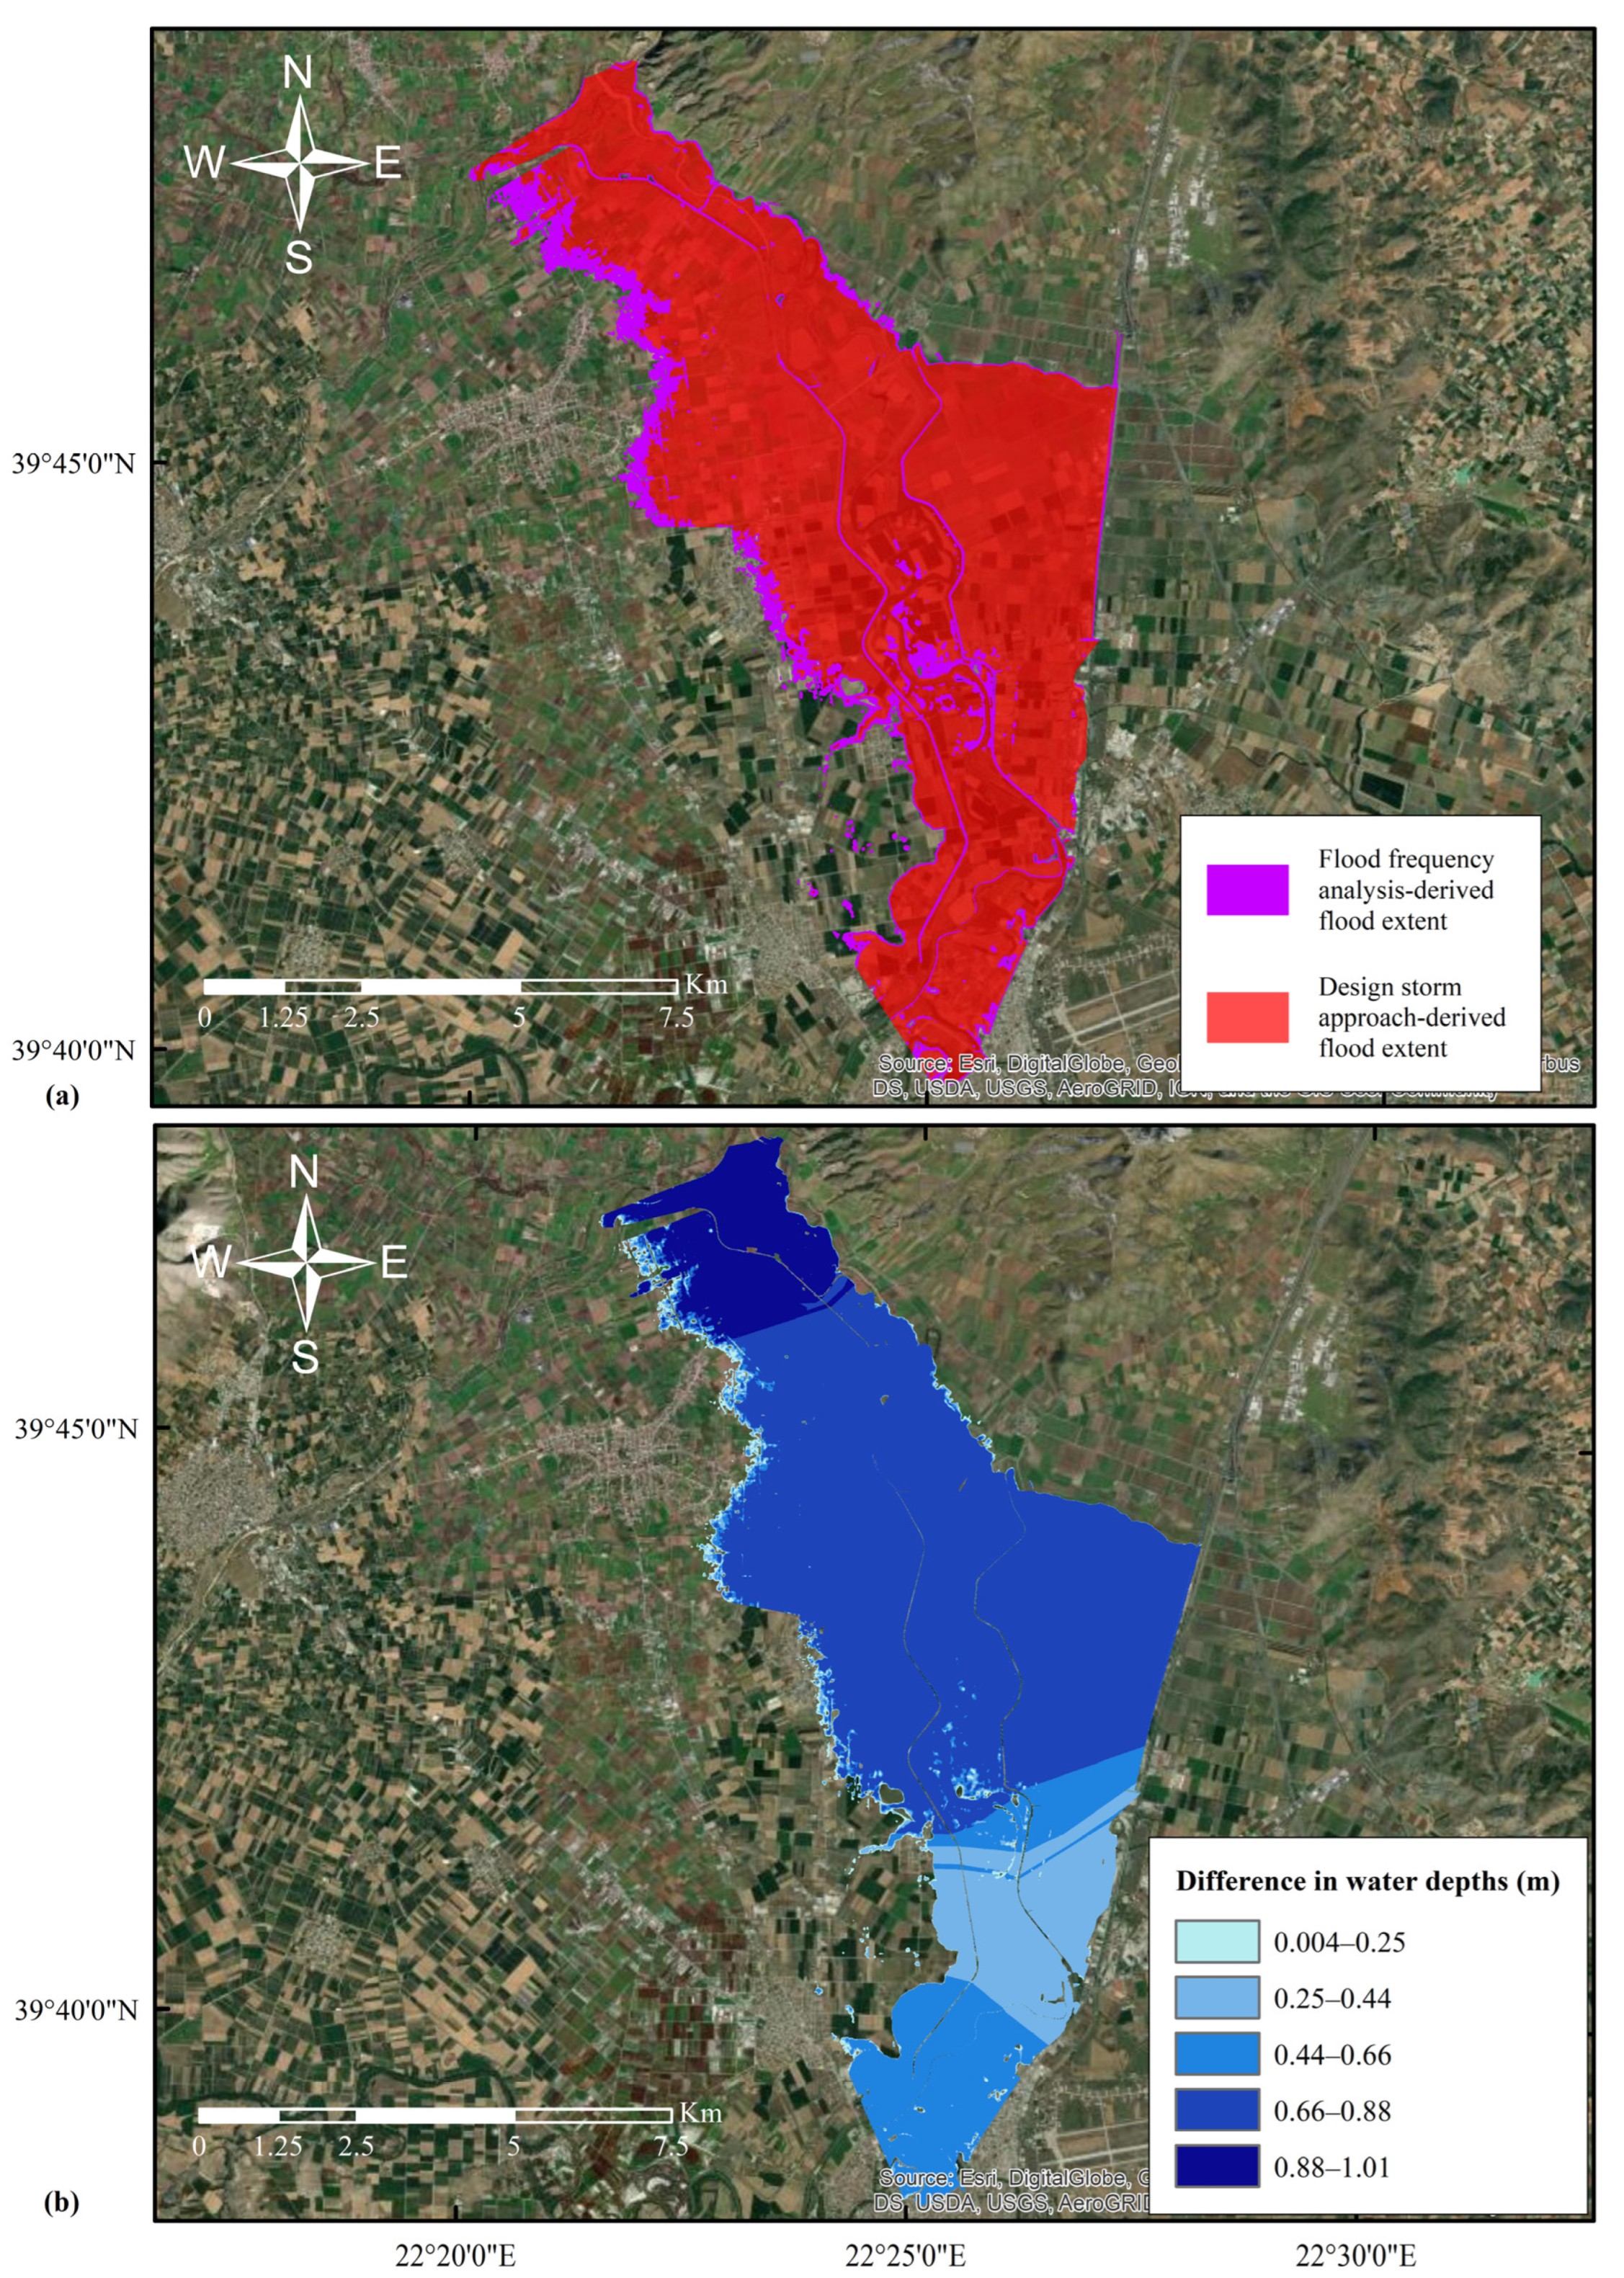
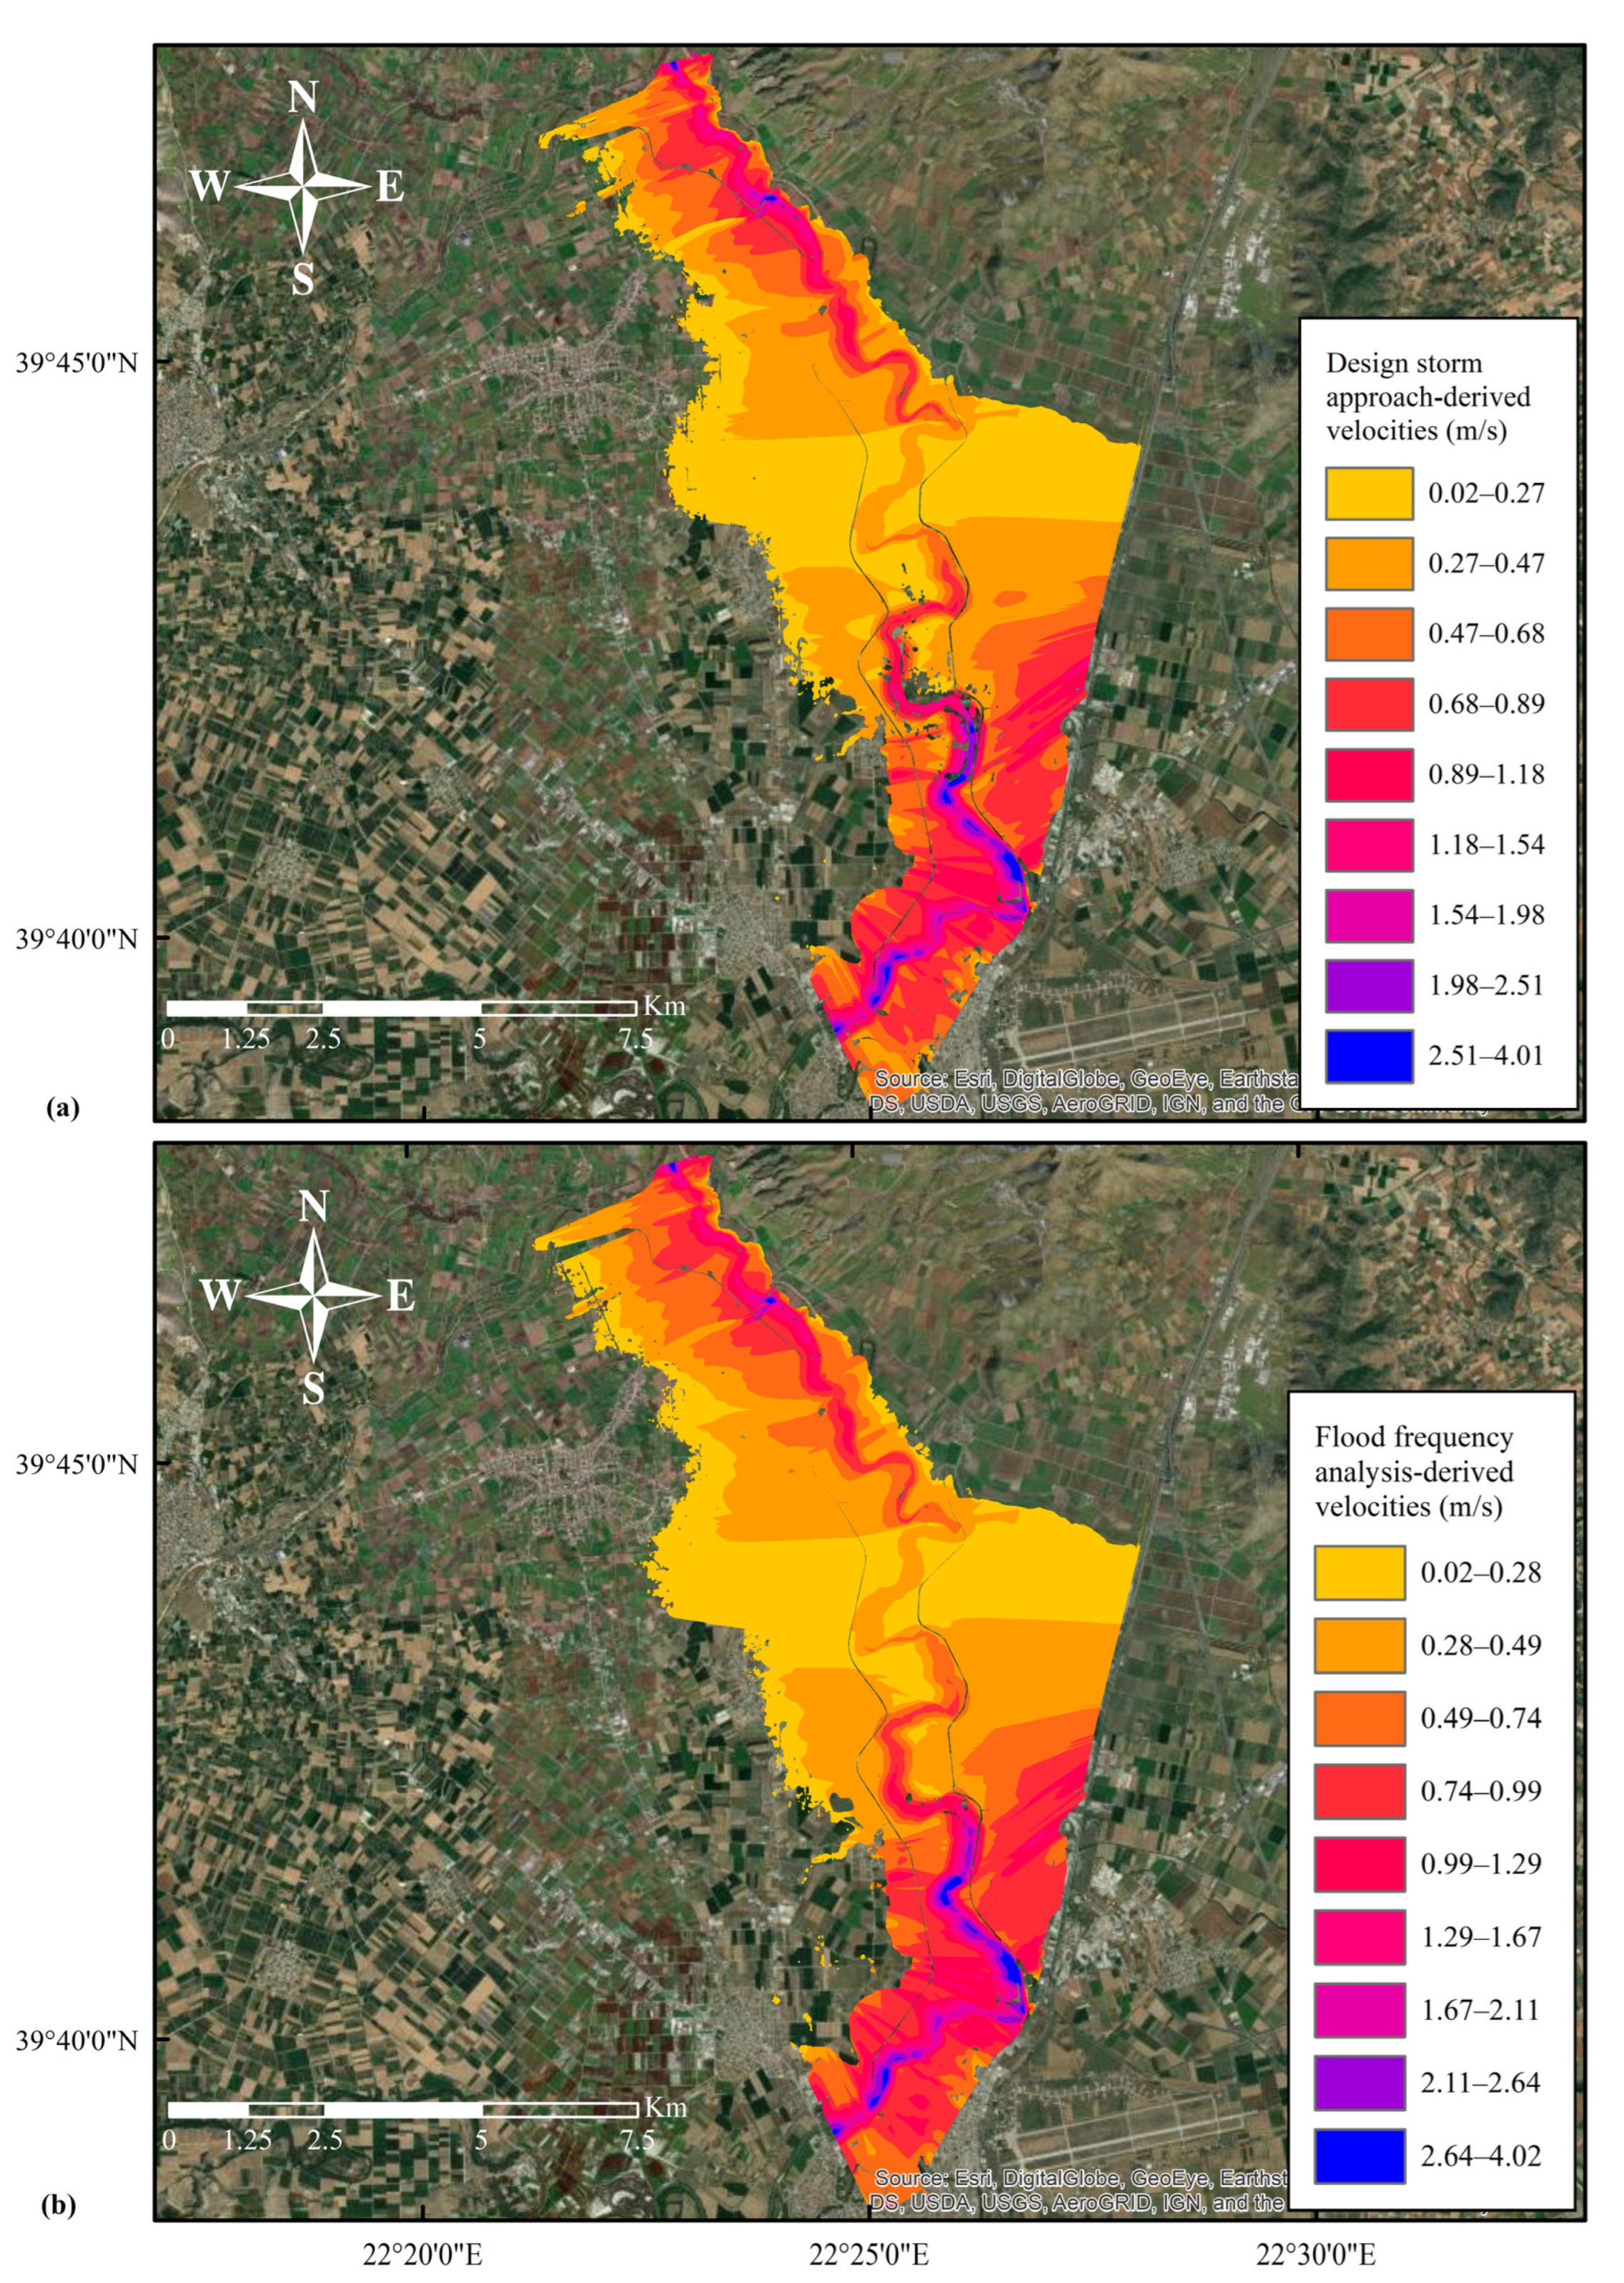
3.2. Hydrodynamic Simulations and Results
4. Discussion
5. Summary and Conclusions
Author Contributions
Funding
Institutional Review Board Statement
Informed Consent Statement
Data Availability Statement
Acknowledgments
Conflicts of Interest
References
- Chow, V.; Maidment, D.; Mays, L. Applied Hydrology; McGraw-Hill Book Company: New York, NY, USA, 1988. [Google Scholar]
- Mimikou, M.A.; Baltas, E.A.; Tsihrintzis, V.A. Hydrology and Water Resource Systems Analysis; CRC Press: Boca Raton, FL, USA, 2016. [Google Scholar]
- Kourtis, I.M.; Tsihrintzis, V.A.; Baltas, E. A robust approach for comparing conventional and sustainable flood mitigation measures in urban basins. J. Environ. Manag. 2020, 269, 110822. [Google Scholar] [CrossRef] [PubMed]
- Packman, J.C.; Kidd, C.H.R. A logical approach to the design storm concept. Water Resour. Res. 1980, 16, 994–1000. [Google Scholar] [CrossRef]
- Breinl, K.; Lun, D.; Müller-Thomy, H.; Blöschl, G. Understanding the relationship between rainfall and flood probabilities through combined intensity-duration-frequency analysis. J. Hydrol. 2021, 602, 126759. [Google Scholar] [CrossRef]
- Pilgrim, D.H.; Cordery, I. Flood Runoff. In Handbook of Hydrology; Chapter, 9; Maidment, D.R., Ed.; McGraw-Hill, Inc.: New York, NY, USA, 1993; p. 1143. [Google Scholar]
- Alfieri, L.; Laio, F.; Claps, P. A simulation experiment for optimal design hyetograph selection. Hydrol. Process. 2008, 22, 813–820. [Google Scholar] [CrossRef]
- Viglione, A.; Blöschl, G. On the role of storm duration in the mapping of rainfall to flood return periods. Hydrol. Earth Syst. Sci. 2009, 13, 205–216. [Google Scholar] [CrossRef]
- Sutcliffe, J.V. Methods of Flood Estimation: A Guide to Flood Studies Report; Institute of Hydrology: Wallingford, UK, 1978. [Google Scholar]
- Gumbel, E.J. Statistics of Extremes; Columbia University Press: New York, NY, USA, 1958. [Google Scholar]
- Noto, L.V.; Loggia, G.L. Use of L-Moments Approach for Regional Flood Frequency Analysis in Sicily, Italy. Water Resour. Manag. 2008, 23, 2207–2229. [Google Scholar] [CrossRef]
- Eregno, F.E.; Nilsen, V.; Seidu, R.; Heistad, A. Evaluating the Trend and Extreme Values of Faecal Indicator Organisms in a Raw Water Source: A Potential Approach for Watershed Management and Optimizing Water Treatment Practice. Environ. Process. 2014, 1, 287–309. [Google Scholar] [CrossRef]
- Tsakiris, G.; Kordalis, N.; Tsakiris, V. Flood double frequency analysis: 2D-Archimedean copulas vs bivariate probability distributions. Environ. Process. 2015, 2, 705–716. [Google Scholar] [CrossRef]
- Yannopoulos, S.; Eleftheriadou, E.; Mpouri, S.; Giannopoulou, I. Implementing the Requirements of the European Flood Directive: The Case of Ungauged and Poorly Gauged Watersheds. Environ. Process. 2015, 2, 191–207. [Google Scholar] [CrossRef]
- Razmi, A.; Golian, S.; Zahmatkesh, Z. Non-Stationary Frequency Analysis of Extreme Water Level: Application of Annual Maximum Series and Peak-over Threshold Approaches. Water Resour. Manag. 2017, 31, 2065–2083. [Google Scholar] [CrossRef]
- Stojkovic, M.; Simonovic, S.P. Mixed General Extreme Value Distribution for Estimation of Future Precipitation Quantiles Using a Weighted Ensemble—Case Study of the Lim River Basin (Serbia). Water Resour. Manag. 2019, 33, 2885–2906. [Google Scholar] [CrossRef]
- Ullah, H.; Akbar, M. Drought Risk Analysis for Water Assessment at Gauged and Ungauged Sites in the Low Rainfall Regions of Pakistan. Environ. Process. 2021, 8, 139–162. [Google Scholar] [CrossRef]
- Razmi, A.; Mardani-Fard, H.A.; Golian, S.; Zahmatkesh, Z. Time-Varying Univariate and Bivariate Frequency Analysis of Nonstationary Extreme Sea Level for New York City. Environ. Process. 2022, 9, 1–27. [Google Scholar] [CrossRef]
- Tegos, A.; Ziogas, A.; Bellos, V.; Tzimas, A. Forensic Hydrology: A Complete Reconstruction of an Extreme Flood Event in Data-Scarce Area. Hydrology 2022, 9, 93. [Google Scholar] [CrossRef]
- World Meteorological Organization (WMO). Statistical Distributions for Flood Frequency Analysis, Operational Hydrology Report No. 33; WMO: Geneva, Switzerland, 1989. [Google Scholar]
- Matalas, N.C.; Wallis, J.R. An Approach to Formulating Strategies for Flood Frequency Analysis. In Proceedings of the International Symposium on Uncertainties in Hydrologic and Water Resource Systems, Tucson, AZ, USA, 11–14 December 1972; pp. 940–961. [Google Scholar]
- Forestieri, A.; Arnone, E.; Blenkinsop, S.; Candela, A.; Fowler, H.; Noto, L.V. The impact of climate change on extreme precipitation in Sicily, Italy. Hydrol. Process. 2018, 32, 332–348. [Google Scholar] [CrossRef]
- Vogel, R.M.; McMahon, T.A.; Chiew, F.H. Flood flow frequency model selection in Australia. J. Hydrol. 1993, 146, 421–449. [Google Scholar] [CrossRef]
- Todorovic, P. Stochastic models of floods. Water Resour. Res. 1978, 14, 345–356. [Google Scholar] [CrossRef]
- Hosseinzadehtalaei, P.; Tabari, H.; Willems, P. Precipitation intensity–duration–frequency curves for central Belgium with an ensemble of EURO-CORDEX simulations, and associated uncertainties. Atmos. Res. 2018, 200, 1–12. [Google Scholar] [CrossRef]
- Kroll, C.N.; Vogel, R.M. Probability distribution of low streamflow series in the United States. J. Hydrol. Eng. 2002, 7, 137–146. [Google Scholar] [CrossRef]
- Bhatkoti, R.; Moglen, G.E.; Murray-Tuite, P.M.; Triantis, K.P. Changes to Bridge Flood Risk under Climate Change. J. Hydrol. Eng. 2016, 21, 04016045. [Google Scholar] [CrossRef]
- Kourtis, I.M.; Bellos, V.; Kopsiaftis, G.; Psiloglou, B.; Tsihrintzis, V.A. Methodology for holistic assessment of grey-green flood mitigation measures for climate change adaptation in urban basins. J. Hydrol. 2021, 603, 126885. [Google Scholar] [CrossRef]
- Phillips, R.C.; Samadi, S.Z.; Meadows, M.E. How extreme was the October 2015 flood in the Carolinas? An assessment of flood frequency analysis and distribution tails. J. Hydrol. 2018, 562, 648–663. [Google Scholar] [CrossRef]
- Langat, P.K.; Kumar, L.; Koech, R. Identification of the most suitable probability distribution models for maximum, minimum, and mean streamflow. Water 2019, 11, 734. [Google Scholar] [CrossRef]
- Schardong, A.; Simonovic, S.P.; Gaur, A.; Sandink, D. Web-Based Tool for the Development of Intensity Duration Frequency Curves under Changing Climate at Gauged and Ungauged Locations. Water 2020, 12, 1243. [Google Scholar] [CrossRef]
- Arnbjerg-Nielsen, K.; Leonardsen, L.; Madsen, H. Evaluating adaptation options for urban flooding based on new high-end emission scenario regional climate model simulations. Clim. Res. 2015, 64, 73–84. [Google Scholar] [CrossRef]
- Atiem, I.A. Assessment of regional floods using L-moments approach: The case of the River Nile. Water Resour. Manag. 2006, 20, 723–747. [Google Scholar] [CrossRef]
- Grimaldi, S.; Kao, S.C.; Castellarin, A.; Papalexiou, S.M.; Viglione, A.; Laio, F.; Aksoy, H.; Gedikli, A. Statistical hydrology. In Treatise on Water Science; Wilderer, P.A., Ed.; Elsevier: Amsterdam, The Netherlands, 2011; Volume 2, pp. 479–517. [Google Scholar]
- Madsen, H.; Lawrence, D.; Lang, M.; Martinkova, M.; Kjeldsen, T.R. A Review of Applied Methods in Europe for Flood-Frequency Analysis in a Changing Environment. 2012. Available online: https://hal.inrae.fr/hal-02597863/document (accessed on 10 May 2022).
- Hosking, J.R.M. L-Moments: Analysis and Estimation of Distributions Using Linear Combinations of Order Statistics. J. R. Stat. Soc. Ser. B 1990, 52, 105–124. [Google Scholar] [CrossRef]
- Hosking, J.R.M.; Wallis, J.R. Regional Frequency Analysis; Cambridge University Press: Cambridge, UK, 1997; p. 240. [Google Scholar]
- Zotou, I.; Bellos, V.; Gkouma, A.; Karathanassi, V.; Tsihrintzis, V.A. Using Sentinel-1 imagery to assess predictive performance of a hydraulic model. Water Resour. Manag. 2020, 34, 4415–4430. [Google Scholar] [CrossRef]
- Bathrellos, G.D.; Skilodimou, H.D.; Soukis, K.; Koskeridou, E. Temporal and spatial analysis of flood occurrences in the drainage basin of pinios river (thessaly, central greece). Land 2018, 7, 106. [Google Scholar] [CrossRef]
- Joyce, R.J.; Janowiak, J.E.; Arkin, P.A.; Xie, P. CMORPH: A method that produces global precipitation estimates from passive microwave and infrared data at high spatial and temporal resolution. J. Hydrometeorol. 2004, 5, 487–503. [Google Scholar] [CrossRef]
- Data Server of the Climate Prediction Center (CPC) of the National Oceanic and Atmospheric Administration. Available online: Ftp://ftp.cpc.ncep.noaa.gov/precip/global_CMORPH/ (accessed on 10 May 2022).
- Kozanis, S.; Christofides, A.; Mamassis, N.; Efstratiadis, A.; Koutsoyiannis, D. Hydronomon–open source software for the analysis of hydrological data. In Proceedings of the European Geosciences Union (EGU) General Assembly, Vienna, Austria, 2–7 May 2010. [Google Scholar]
- Koutsoyiannis, D.; Kozonis, D.; Manetas, A. A mathematical framework for studying rainfall intensity–duration–frequency relationships. J. Hydrol. 1998, 206, 118–135. [Google Scholar] [CrossRef]
- Leclerc, G.; Schaake, J.C. Derivation of Hydrologic Frequency Curves. Report 142; Department of Civil Engineering, MIT: Cambridge, MA, USA, 1972; p. 151. [Google Scholar]
- Giandotti, M. Previsione Delle Piene e Delle, Magre dei Corsi D’acqua; Istituto Poligrafico dello Stato: Rome, Italy, 1934; pp. 107–117. [Google Scholar]
- Scharffenberg, B.; Bartles, M.; Brauer, T.; Fleming, M.; Karlovits, G. Hydrologic Modeling System HEC-HMS: User’s Manual; US Army Corps of Engineers, Hydrologic Engineering Center: Davis, CA, USA, 2018. [Google Scholar]
- Nalbantis, I.; Koutsoyiannis, D. Research Project, Upgrading and Updating of Hydrological Information of Thessalia, Volume 4, Final Report; National Technical University of Athens: Athens, Greece, 1997. (In Greek) [Google Scholar]
- Brunner, G.W. HEC-RAS, River Analysis System Hydraulic Reference Manual, Version 6.0. Report Number CPD-69; Hydrologic Engineering Center, US Army Corps of Engineers: Davis, CA, USA, 2020. [Google Scholar]
- Efstratiadis, A.; Dimas, P.; Pouliasis, G.; Tsoukalas, I.; Kossieris, P.; Bellos, V.; Sakki, G.K.; Makropoulos, C.; Michas, S. Revisiting Flood Hazard Assessment Practices under a Hybrid Stochastic Simulation Framework. Water 2022, 14, 457. [Google Scholar] [CrossRef]
- Stedinger, J.R.; Vogel, R.M.; Foufoula-Georgiou, E. Frequency analysis of extreme events. In Handbook of Hydrology; Chapter 18; Maidment, D.R., Ed.; McGraw-Hill, Inc.: New York, NY, USA, 1993; p. 1143. [Google Scholar]


| Corine Code | Description | Percent of Total Area (%) | Corine Code | Description | Percent of Total Area (%) |
|---|---|---|---|---|---|
| 111 | Continuous urban fabric | 0.03 | 243 | Land principally occupied by agriculture, with significant areas of natural vegetation | 5.52 |
| 112 | Discontinuous urban fabric | 2.12 | 311 | Broad-leaved forest | 9.13 |
| 121 | Industrial or commercial units | 0.20 | 312 | Coniferous forest | 3.87 |
| 122 | Road and rail networks and associated land | 0.07 | 313 | Mixed forest | 2.30 |
| 131 | Mineral extraction sites | 0.06 | 321 | Natural grasslands | 7.87 |
| 133 | Construction sites | 0.08 | 322 | Moors and heathland | 0.28 |
| 141 | Green urban areas | 0.02 | 323 | Sclerophyllous vegetation | 11.84 |
| 142 | Sport and leisure facilities | 0.07 | 324 | Transitional woodland-shrub | 7.84 |
| 211 | Non-irrigated arable land | 13.48 | 331 | Beaches, dunes, sands | 0.09 |
| 212 | Permanently irrigated land | 30.45 | 332 | Bare rocks | 0.02 |
| 221 | Vineyards | 0.18 | 333 | Sparsely vegetated areas | 0.66 |
| 222 | Fruit trees and berry plantations | 0.02 | 334 | Burnt areas | 0.03 |
| 223 | Olive groves | 0.16 | 411 | Inland marshes | 0.09 |
| 231 | Pastures | 1.46 | 511 | Water courses | 0.47 |
| 242 | Complex cultivation patterns | 1.47 | 512 | Water bodies | 0.11 |
| TOTAL | - | 100 |
| Time Scale | ||||||||
|---|---|---|---|---|---|---|---|---|
| Statistical Parameter | 30 min | 1 h | 2 h | 3 h | 6 h | 12 h | 24 h | 48 h |
| Sample size | 21 | 21 | 21 | 21 | 21 | 21 | 21 | 21 |
| Maximum | 37.00 | 40.00 | 72.00 | 75.00 | 105.60 | 117.35 | 139.55 | 149.65 |
| Minimum | 6.90 | 12.75 | 20.00 | 29.25 | 29.55 | 34.55 | 37.70 | 46.05 |
| Mean | 15.06 | 23.44 | 36.80 | 44.83 | 57.35 | 66.43 | 74.77 | 83.47 |
| Geometric mean | 13.85 | 22.15 | 34.69 | 43.01 | 55.12 | 63.78 | 71.19 | 79.88 |
| Median | 15.00 | 21.26 | 34.85 | 43.00 | 50.30 | 59.81 | 66.55 | 76.80 |
| Standard deviation | 6.90 | 8.09 | 13.48 | 13.75 | 17.34 | 20.18 | 25.30 | 26.89 |
| Coefficient of skewness | 1.76 | 0.54 | 1.06 | 0.88 | 1.18 | 1.02 | 1.16 | 1.18 |
| Coefficient of kurtosis | 4.33 | −0.65 | 1.08 | −0.28 | 1.64 | 0.83 | 0.98 | 0.76 |
| Coefficient of variation (CoV) | 0.46 | 0.35 | 0.37 | 0.31 | 0.30 | 0.30 | 0.34 | 0.32 |
| Q1 | 10.35 | 15.90 | 27.05 | 35.10 | 46.35 | 54.10 | 60.00 | 66.70 |
| Q3 | 16.30 | 28.04 | 42.53 | 53.18 | 64.71 | 77.50 | 77.50 | 86.70 |
| IQR | 5.95 | 12.14 | 15.48 | 18.08 | 18.36 | 23.40 | 17.50 | 20.00 |
| Quartile Skew | −0.56 | 0.12 | −0.01 | 0.13 | 0.57 | 0.51 | 0.25 | −0.01 |
| Parameters (Units) | Range | Adjusted Value |
|---|---|---|
| Maximum deficit (mm)-L | 35–120 | 78 |
| Constant rate (mm/h)-L | 2–8 | 2 |
| Initial deficit (mm)-L | 15–60 | 39 |
| Impervious (%)-L | 0–100 | 2 |
| Crop coefficient (kc)-C | 0.1–0.5 | 0.19 |
| Initial storage (%)-C | 0–50 | 50 |
| Maximum storage (mm)-C | 2–7 | 4.5 |
| Intensity (mm/h) for Return Period (Years) | ||||||
|---|---|---|---|---|---|---|
| Duration (h) | 2 | 5 | 10 | 25 | 50 | 100 |
| 2 | 18.07 | 22.54 | 26.36 | 32.06 | 36.92 | 42.31 |
| 3 | 14.20 | 17.72 | 20.72 | 25.20 | 29.02 | 33.26 |
| 6 | 8.89 | 11.09 | 12.97 | 15.78 | 18.17 | 20.82 |
| 12 | 5.30 | 6.61 | 7.73 | 9.40 | 10.83 | 12.41 |
| 24 | 3.07 | 3.83 | 4.47 | 5.44 | 6.27 | 7.18 |
| 48 | 1.75 | 2.18 | 2.55 | 3.10 | 3.57 | 4.09 |
| Statistics | |||
|---|---|---|---|
| Sample size | 22 | Coefficient of skewness | 0.64 |
| Maximum | 5101.40 | Coefficient of kurtosis | 0.33 |
| Minimum | 959.20 | Coefficient of variation (CoV) | 0.39 |
| Mean | 2736.36 | Q1 | 2121.93 |
| Geometric mean | 2533.70 | Q3 | 3042.55 |
| Median | 2640.25 | IQR | 920.63 |
| Standard deviation | 1064.43 | Quartile Skew | −0.13 |
| Return Period (Years) | Design Storm Approach (m3/s) | Flood Frequency Analysis (m3/s) | Percent Increase (%) | ||
|---|---|---|---|---|---|
| Gumbel | GEV | Gumbel | GEV | ||
| 2 | 909.8 | 2556.5 | 2589.2 | 181 | 185 |
| 5 | 1516.4 | 3523.9 | 3554.1 | 132 | 134 |
| 10 | 2102.0 | 4164.5 | 4162.1 | 98 | 98 |
| 25 | 3062.3 | 4973.8 | 4896.7 | 62 | 60 |
| 50 | 3946.5 | 5574.2 | 5418.5 | 41 | 37 |
| 100 | 4972.9 | 6170.1 | 5917.7 | 24 | 19 |
Publisher’s Note: MDPI stays neutral with regard to jurisdictional claims in published maps and institutional affiliations. |
© 2022 by the authors. Licensee MDPI, Basel, Switzerland. This article is an open access article distributed under the terms and conditions of the Creative Commons Attribution (CC BY) license (https://creativecommons.org/licenses/by/4.0/).
Share and Cite
Vangelis, H.; Zotou, I.; Kourtis, I.M.; Bellos, V.; Tsihrintzis, V.A. Relationship of Rainfall and Flood Return Periods through Hydrologic and Hydraulic Modeling. Water 2022, 14, 3618. https://doi.org/10.3390/w14223618
Vangelis H, Zotou I, Kourtis IM, Bellos V, Tsihrintzis VA. Relationship of Rainfall and Flood Return Periods through Hydrologic and Hydraulic Modeling. Water. 2022; 14(22):3618. https://doi.org/10.3390/w14223618
Chicago/Turabian StyleVangelis, Harris, Ioanna Zotou, Ioannis M. Kourtis, Vasilis Bellos, and Vassilios A. Tsihrintzis. 2022. "Relationship of Rainfall and Flood Return Periods through Hydrologic and Hydraulic Modeling" Water 14, no. 22: 3618. https://doi.org/10.3390/w14223618
APA StyleVangelis, H., Zotou, I., Kourtis, I. M., Bellos, V., & Tsihrintzis, V. A. (2022). Relationship of Rainfall and Flood Return Periods through Hydrologic and Hydraulic Modeling. Water, 14(22), 3618. https://doi.org/10.3390/w14223618