Abstract
Fluoride pollution in water has been reported in many regions and countries. Adsorption is the most commonly used process for treating fluoride-containing water. For industrial applications, the treatment of a pollutant is normally performed in continuous column mode. In this work, batch and lab-scale column studies were conducted by applying modified granular activated carbon (MGAC) to remove fluoride (F−) from an aqueous solution. MGAC was prepared by a wet impregnation method and characterized using SEM and FTIR. Batch studies presented the adsorption of F− onto MGAC following the Freundlich model and the pseudo-second-order model, indicating the dominant adsorption was a multilayer adsorption and chemisorption process. The breakthrough time, exhaustion time, adsorption capacity, and adsorption efficiency in breakthrough curves were evaluated under varying influent F− concentrations, flow rates, and bed heights. Thomas, Yoon-Nelson, and Yan models were employed to describe the whole breakthrough behavior, showing their suitability to predict the features of the breakthrough curves of the MGAC continuous flow system.
1. Introduction
Fluorine is the most reactive of all elements and an essential trace element for the growth of bones and teeth [1,2]. Chronic intake of excessive fluoride (F−) can lead to biological health hazards, such as dental fluorosis, bone disease, and neurological disorders [3,4,5]. The World Health Organization stipulates that the guideline value for F− in drinking water is 1.5 mg/L [6]. However, high F− concentrations can be found in many regions and countries, particularly in parts of India, China, Africa, and South America [6,7]. Fluoride pollution is partly caused by natural geological sources on account of the widespread presence of fluoride in nature, including sellaite (MgF2), fluorspar (CaF2), fluorapatite (Ca5(PO4)3F) and cryolite (Na3AlF6) [8]. Simultaneously, due to increased industrial activities, industrial fluoride wastewater from electroplating, dental products, and other industries can give rise to fluoride pollution [9,10]. Therefore, the defluorination of water is very important to human health and becoming a focus of great concern.
Currently, several effective methods have been developed to remove F− from wastewater, mainly including adsorption, coagulation sedimentation, ion exchange, membrane separation, electroflocculation, and electrodialysis [11]. Among these techniques, adsorption is preferred for its low cost, high efficiency, and easy operation [12,13]. Activated carbon (AC) is a widely used adsorbent with various advantages, such as affordable price, high surface area, and high activity [14]. Nevertheless, AC has hardly any adsorption capacity for inorganic anions [15]. It is necessary to tailor AC to remove F− anions in wastewater. Recently, researchers have tried to modify AC with different metal cations, such as Al3+ [16], Mg2+ [17], and Ca2+ [18]. These explorations have shown an efficient way to enhance F− adsorption capacity. Powdered activated carbon is easily lost and requires further filtration after use. This still leaves the possibility of carbon leakage into the treated water. Conversely, granular activated carbon (GAC) is easy to bed design and routine maintenance due to its large size.
Most related studies for F− adsorption are carried out in batches and are mainly concerned with characterizations, equilibrium, thermodynamics, and kinetics. These works help to understand the adsorption efficiency and capacity of the adsorbent. However, for practical implementation, conclusions from batch studies are not suitable for describing the performance of a continuous system in real wastewater purification [19]. At large-scale operations, the adsorption of a pollutant is normally conducted in a fixed-bed column (FBC). Hence, continuous flow studies need to be investigated to provide readily designed parameters for directly applying F− removal.
This work investigates the removal performance of granular activated carbon modified with Al3+ in the defluoridation from aqueous solutions through a batch system and a lab-scale continuous-flow system. The batch studies were successively implemented to assess the adsorption capacity and efficiency of adsorbents. In the continuous-flow system, the effects of FBC operating parameters (F− concentration, flow rate, and bed height) on the column performance (breakthrough time, exhaustion time, adsorption capacity, and adsorption efficiency) were investigated. Thomas, Yoon-Nelson, and Yan mathematical models were employed to explore the breakthrough characteristics of FBC.
2. Materials and Methods
2.1. Chemicals and Materials
GAC and other reagents were purchased from China Sinopharm Group. All chemicals were of analytical purity. Sodium fluoride (NaF) was used to prepare the simulated wastewater containing F−. 1 M NaOH and 1 M HCl were used to adjust pH. The concentrations of F− were tested by an ion meter equipped with a fluoride ion selective electrode (Bante 931). Before the measurement, equal volumes of total ion strength adjustment buffer (TISAB II) were added to the sample. All solutions were prepared using deionized water.
2.2. Preparation and Characterization of Material
GAC was rinsed with DI water and then dried in a hot air blast oven at 80 ℃ for 24 h. After that, 1 g GAC was impregnated with 200 mL 0.5 mol/L AlCl3 solution. The suspension was treated with ultrasound for 30 min and then left to stand for 4 h. After filtration of the mixture, the filtrate was washed with DI water 3 − 4 times to remove free aluminum. Finally, the filtrate was put into a hot air blast oven for drying at 100 °C for 24 h. The dried sample was labeled as MGAC and stored in plastic bags for subsequent experiments.
Scanning electron microscopy (SEM, FEI Inspect F50) was applied to observe the morphology of GAC and MGAC. Their chemical structures were displayed by Fourier transform infrared spectroscopy (FTIR, Nicolet 380). For FTIR analysis, the samples were mixed with KBr powder and recorded at a resolution of 4 cm−1.
2.3. Batch Study
Batch experiments were performed to verify the adsorption capacity of MGAC, including isothermal and kinetic experiments. To perform isothermal experiments, 0.10 g of MGAC was added to plastic conical flasks containing 100 mL F− solution aliquots and initial concentrations of 20, 30, 50, 60, and 90 mg/L. In the kinetic study of fluoride adsorption on MGAC, 0.10 g of MGAC was placed in plastic conical flasks containing aliquots of 100 mL F− solution (initial concentration C0 = 20 mg/L, pH = 6.0 [20,21]). Both studies were conducted at room atmosphere (20 ± 2 °C), maintaining a constant agitation speed of 200 rpm. For sampling, syringe filters were used to separate MGAC from F− solutions.
2.4. Column Study
2.4.1. Experimental Procedure
The schematic of the experimental setup is shown in Figure 1. The FBC was made of an acrylic tube (internal diameter = 1.5 cm, total height = 25 cm). A known bed height of MGAC was packed at the center of the column, and the bed was compacted naturally by gravity. Some acrylic beads and polypropylene wool were then loaded into the tube to prevent the floating of the bed and to provide a uniform distribution of the influent. Two rubber stoppers were used to seal the ends of the column. A peristaltic pump (Kamoer DIPump 550-B146) delivered the solution into the column in upward flow mode.
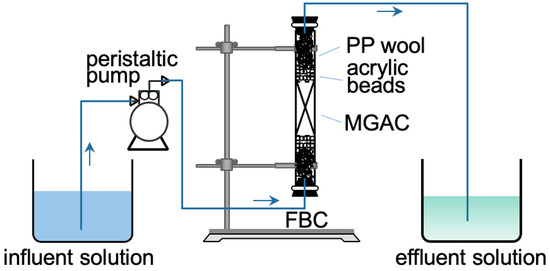
Figure 1.
The schematic representation of FBC.
The effects of three variables (F− concentration C0, flow rate Q, and bed height Z) were investigated to provide basic profiles for scale-up column design. The F− solutions with different concentrations (20, 30, and 40 mg/L, pH = 6.0) were conveyed upwards to the column, with different bed heights (3, 6, and 9 cm, equal to 1.5, 3.0, and 4.5 g of MGAC respectively), with different flow rate (10, 20, and 30 mL/min). Before initiating the adsorption experiments, DI water was delivered through the column for 10 min to eliminate air bubbles and look for fluid leaks. The F− solutions at the column outlet were sampled at different time intervals. All fixed-bed tests were conducted at room atmosphere (20 ± 2 °C).
2.4.2. Determination of Breakthrough Curves
The performance of FBC was based on the breakthrough curve, which was acquired by plotting the ratio (Ct/C0) of the effluent concentration (Ct, mg/L) to the influent concentration (C0, mg/L) against time (t). The breakthrough time (tb) was determined as Ct = 1.5 mg/L, the guideline value recommended by WHO. The exhaustion time (ts) was chosen when Ct/C0 = 0.95.
The total amount mads (mg) of F− adsorbed onto MGAC was calculated by the breakthrough curve, and the equation was presented as Equation (1).
where Q (mL/min) was the flow rate. The fixed-bed saturation adsorption capacity qs (mg/g) was obtained from Equation (2).
where w (g) was the mass of MGAC packed in FBC. The total mass mtotal (mg) of F− conveyed by the column was computed by Equation (3).
where VF (mL) was the quantity of wastewater through the FBC, which was determined by Equation (4).
The percentage of F− removed by the FBC, namely removal efficiency R (%) was obtained by Equation (5).
3. Results
3.1. Characterization
The amorphous nature of GAC and MGAC was revealed via SEM imaging, presented in Figure 2. It could be seen that there was no significant difference in the surface morphology of GAC before and after modification. At the same time, it was observed that the MGAC presented well-developed pores, which facilitated F− adsorption.
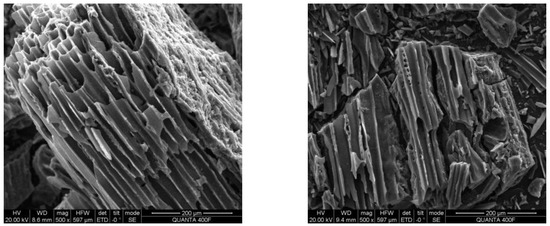
Figure 2.
The SEM micrographs of GAC (left) and MGAC (right).
FTIR spectroscopy could provide information about the functional groups of adsorbents. The spectra of GAC and MGAC before and after adsorption are shown in Figure 3. After modification, the position of peaks and transmittance did not change significantly. However, after adsorbing F−, the transmittance increased slightly, the position of peaks shifted, and a few new peaks appeared. These changes in the spectrum were possibly due to the interaction of F− with MGAC. There were four main adsorption peaks in the figure. The broad peaks near 3422 cm−1 were assigned to the stretching vibrations of H–O–H adsorption bands [22]. The band near 1566 cm−1 indicated the presence of the stretching vibration of COO– bonds [23]. The two peaks moved respectively to 3419 cm−1 and 1619 cm−1 after adsorbing F−. The stretching vibration peaks near 1100 cm−1 corresponded to C–O [24]. The shifts might be caused by the ion exchange between F− and hydroxide ions. Fluoride ions could be easily exchanged with hydroxide ions because of the same size and isoelectricity [25]. The new peak of spent MGAC around 400–800 cm−1 might be associated with the interaction between F− and MGAC through electrostatic attraction [11]. The observed changes suggested that F− had successfully interacted with MGAC.
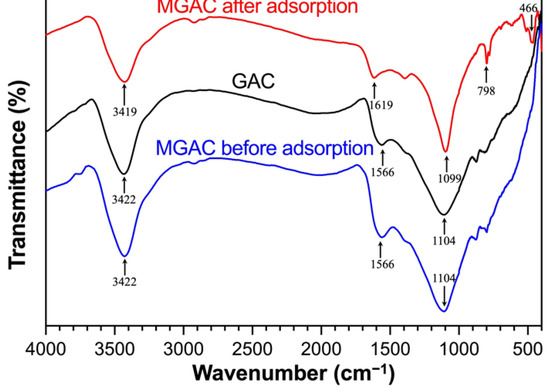
Figure 3.
The FTIR spectra of GAC and MGAC before and after adsorption.
3.2. Isotherm and Kinetic Study
3.2.1. Isotherm Study
Two typical isotherm models (Langmuir model and Freundlich model) were fitted to adsorption equilibrium data to figure out how F− was adsorbed onto the surface of MGAC. The isotherm models were given by Equations (6) and (7).
Langmuir isotherm
Freundlich isotherm
where Ce (mg/L) denoted the F− concentration at equilibrium; qm (mg/g) and KL (L/mg) denoted the maximal adsorption value, the Langmuir constant, respectively; both of KF ((mg/g) × (L/mg)1/n) and n denoted the Freundlich constants; qe (mg/g) denoted the sorption capacity of F− at equilibrium, which was expressed as Equation (8).
where C0 (mg/L) was the F− concentration at the beginning, V (L) was the total volume of the solution, and W (g) was the MGAC dosage.
The non-linear fitting curves of the two models are presented in Figure 4a. The estimated parameters obtained for the Langmuir model were KL = 0.0667 L/mg and qm = 57.1 mg/g, and for the Freundlich model, were n = 2.37 L/mg and KF = 8.70 (mg/g) × (L/mg)1/n. It showed that the Freundlich model (correlation coefficient R2 = 0.917) approached better the experimental results compared to the Langmuir model (R2 = 0.816). The adsorption of F− onto the surface of MGAC was well modeled by the Freundlich model, suggesting that the interaction between F− and MGAC was a multilayer adsorption mode and the surface of MGAC was heterogeneous surface containing different energies [26]. The constant n was greater than 1, representing the favorability of adsorption on heterogeneous systems [27,28].
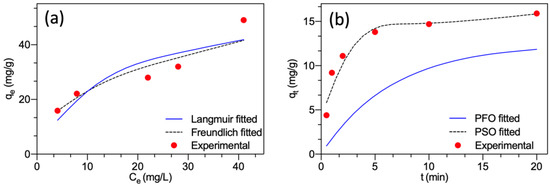
Figure 4.
(a) Fitting plots of the Langmuir and Freundlich models; (b) Fitting plots of the pseudo-first-order and pseudo-second-order models.
3.2.2. Kinetic Study
The experimental kinetic data were simulated by two widely used models (pseudo-first-order model and pseudo-second-order model) to determine the rate-limiting steps and adsorption efficiency. These two models were given by Equations (9) and (10).
Pseudo-first order model
Pseudo-second order model
where qe was defined as Equation (6); k1 (1/min) and k2 (g/(mg·min)) were the kinetic rate constants; qt (mg/g) was the amount of F− adsorbed on MGAC at time t, which was obtained as Equation (11).
where Ct (mg/L) was the F− concentration with respect to time t. The definitions of the other symbols were the same as in Section 3.2.1.
The non-linear fitting curves of the two models are presented in Figure 4b. The estimated parameters for the pseudo-first-order model were k1 = 0.1515 1/min and qe = 12.5 mg/g. For the pseudo-second-order model, the estimated parameters were k2 = 0.0540 g/(mg·min) and qe = 16.7 mg/g. The pseudo-second-order model presented a much smaller relative error (5.03%) between experimental qe and calculated qe than the pseudo-first-order model (21.4%). Meanwhile, the pseudo-second-order kinetic equation (correlation coefficient R2 = 0.999) approached the kinetic data better than the pseudo-first order kinetic equation (R2 = 0.801). Hence, the solid-liquid adsorption process followed the pseudo-second-order model. This implied that chemisorption played a rate-limiting role and was the dominant adsorption kinetic process involving sharing or exchanging electrons [23,29].
3.3. Fixed-Bed Column Adsorption
3.3.1. Effect of Fluoride Concentration
The dynamic adsorption process is heavily dependent on the adsorbent concentration. The effects of F− concentration (20, 30, 40 mg/L) on the breakthrough curve were studied, and the fixed operating conditions were: 20 mL/min of flow rate and 3 cm of bed height. Figure 5a presented the inclination of breakthrough curves was affected dramatically by the influent F− concentration. The breakthrough curves became steeper and shifted toward the origin with the increasing F− concentration. Table 1 showed that for the rise of F− concentration, the breakthrough time and exhaustion time declined from 7.0 to 4.6 min and from 21.5 to 13.5 min, respectively. These decreases were attributed to a higher F− concentration of influent provided a higher driving force, and led to a quicker breakthrough and more rapid saturation of available active sites. Furthermore, with the F− concentration increasing, the removal efficiency and adsorption capacity increased from 53.7% to 67.3% and from 3.08 to 4.84 mg/g, respectively. This variation might be because a considerable increase in concentration resulted in a fast mass transfer of F− onto the MGAC. Therefore, it could be concluded that the adsorption process was concentration-dependent. Other researchers have observed a similar phenomenon [28,30].
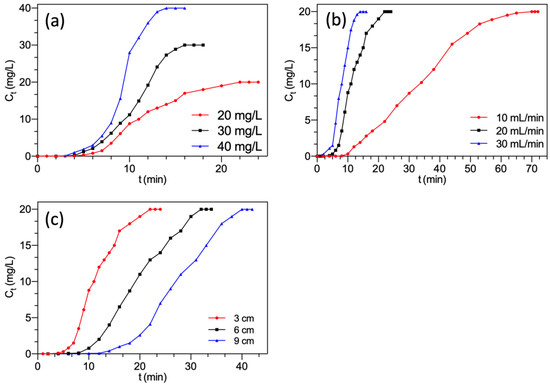
Figure 5.
Breakthrough curves of F− adsorption by FBC varying (a) F− concentration; (b) flow rate; (c) bed height.

Table 1.
Performance parameters of FBC from the breakthrough curves.
3.3.2. Effect of Flow Rate
The flow rate significantly influenced the residence time of adsorbate in the adsorbent bed. The effects of flow rate (10, 20, 30 mL/min) on the breakthrough curve were studied, and the fixed operating conditions were: 20 mg/L of F− concentration and 3 cm of bed height. As shown in Figure 5b, the changes in the nature of the breakthrough curves were similar to Figure 5a. Table 1 showed that when the flow rate rose from 10 to 30 mg/L, the breakthrough time and exhaustion time declined from 12.5 to 5.0 min and from 65.0 to 13.1 min, respectively. At the same time, the adsorption capacity and total amount of F− adsorbed onto the column decreased from 4.35 to 3.05 mg/g and from 6.53 to 4.58 mg, respectively. The reduction might be that the increasing flow rate tended to cause insufficient and limited contact time between F− and MGAC. Therefore, the F− ions ran away from the column before being adsorbed [31]. Simultaneously, the increment of flow rate reduced the resistance to mass transfer and the thickness of the external mass transfer film. This meant that the limited residence time made F− tougher to access the interior space of MGAC at a higher flow rate [32]. A similar phenomenon was also observed by other researchers [33,34]. Therefore, a lower flow rate would contribute to the removal of F− [35].
3.3.3. Effect of Bed Height
The bed height has an important influence on the performance of fixed-bed columns because it directly determines the dosage of adsorbent. The effect of bed height (3, 6, 9 cm) on the breakthrough curve was studied, and the fixed operating conditions were: 20 mg/L of F− concentration and 20 mL/min of flow rate. As presented in Figure 5c, along with rising bed height, the breakthrough curves became flatter and shifted away from the origin. Table 1 showed that by raising the bed height from 3 to 9 cm, the breakthrough time and exhaustion time were prolonged from 7.0 to 18.0 min and 21.5 to 39.5 min, respectively. This was because higher bed height meant more amount of adsorbent. It indicated that the increased bed height took longer to saturate than the lower bed height. Likewise, the removal efficiency and the total amount adsorbed onto MGAC increased from 53.7% to 68.3% and from 4.62 to 10.8 mg, respectively. The increment might be owing to the larger amount of adsorbent, which provided more adsorption sites [36,37]. Anyway, the increased bed height created more contact chances and broadened the mass transfer zone for catching F− [38].
3.4. Breakthrough Curve Modelling
Mathematical modeling of breakthrough curves is frequently used to understand the breakthrough performance and help design the parameters of the fixed-bed continuous column system during its field application [39]. This work analyzes the kinetic data of fixed-bed columns with three normally adopted mathematical models, viz. Thomas, Yoon-Nelson, and Yan models for the sake of ascertaining the best model for predicting the column profiles [40].
3.4.1. Thomas Model
This model has the assumptions that: (1) the adsorption-desorption process is in accordance with the Langmuir type; (2) the dynamic is described by the pseudo-second reversible kinetics [41]. It helps predict the maximal adsorption quantity of adsorbent based on the relation of effluent concentration to time [42]. The Thomas model could be presented as Equation (12) [43].
where KTh (mL/(min·mg)) and q0 (mg/g) denoted the rate constant and the theoretical saturated adsorption capacity, respectively. Both were obtained by Equation (12). The other symbols were defined in Section 2.4.
Figure 6 presents the linear plots of the Thomas model. The corresponding parameters are summarized in Table 2.
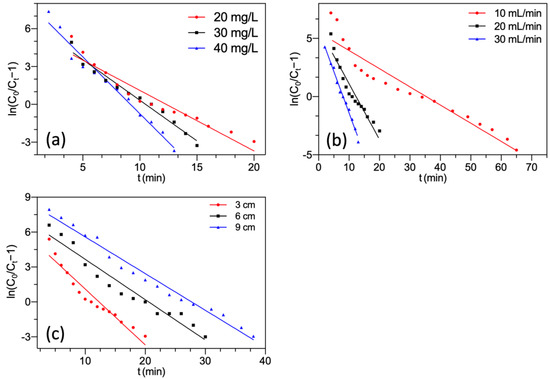
Figure 6.
Thomas model fitting of F− adsorption by FBC varying (a) F− concentration; (b) flow rate; (c) bed height.
Table 2.
Calculated fixed-bed parameters using Thomas model.
As shown in Figure 6 and Table 2, the regression analysis demonstrated that almost all correlation coefficients had high R2, which showed the predicted value q0 fitted satisfactorily with the experimental value qs. It suggested that the Thomas model represented the adsorption process of F− onto MGAC. This manifested that the external and internal diffusions were absent during adsorption [44,45]. From Table 2, it could be noted that with the initial influent F− concentration increasing, the predicted value q0 increased. It might be attributed to the high concentration gradient reducing mass transfer resistance [46]. The predicted value q0 declined with the increment of the inflow rate. This tendency might be due to insufficient contact time between F− and MGAC at a higher inflow rate [47].
The predicted value q0 rose with an increase in bed height because higher bed height helped provide more active sites. Nevertheless, the values of KTh declined with increasing bed height. This was due to the enhancement of the resistance between the liquid and solid phases, which reduced the mass transfer rate [36,48].
3.4.2. Yoon-Nelson Model
This model supposes that the adsorption probability of each adsorbate molecule is directly related to the adsorption of adsorbate and the probability of breakthrough [49]. It is widely used to evaluate the time needed for a 50% pollutant breakthrough [49]. Yoon-Nelson model could be presented as Equation (13).
where KYN (min−1) and τ (min) denoted the rate constant and the time needed for a 50% F− breakthrough, respectively. The saturated adsorption capacity qY(mg/g) based on the Yoon-Nelson model was determined by Equation (14).
Yoon-Nelson kinetic plots are presented in Figure 7. The calculated fixed-bed parameters are summarized in Table 3.
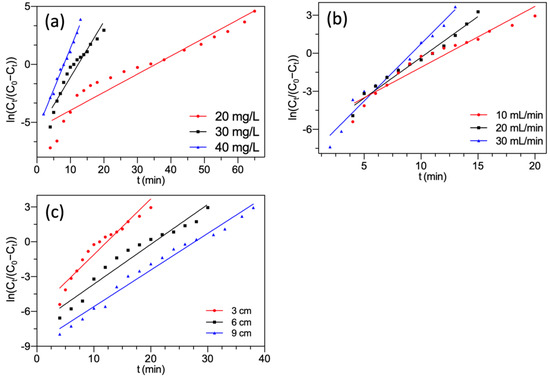
Figure 7.
Yoon-Nelson model fitting of F− adsorption by FBC varying (a) F− concentration; (b) flow rate; (c) bed height.
Table 3.
Calculated fixed-bed parameters using the Yoon-Nelson model.
The plots and high R2 indicated a good fit of experimental data to the Yoon-Nelson model at different experimental conditions. The predicted value of saturated adsorption capacity qY was very close to the experimental value qs. These demonstrated the practicality of the Yoon-Nelson model for depicting the fixed-bed process of F− onto MGAC. Previous studies also reported that both the Thomas and Yoon-Nelson models were applicable for the forecast of the saturated adsorption capacity of the column system [50,51]. As shown in Table 3, with the increment of both F− concentration and inflow rate, the KYN values raised while the τ values decreased. It was probably because of the fast saturation of MGAC in the fixed bed [52]. However, the KYN values declined and the corresponding values of τ raised with increasing bed height. Since increasing bed height packed more MGAC, which resulted in a slower column saturation.
3.4.3. Yan Model
Yan model is an empirical model to explore the breakthrough curves. It overcomes the limitation of the Thomas model in fitting the whole breakthrough curves, especially at time t = 0 [53]. The Yan model could be presented as Equation (15).
where a and qYa (mg/g) denoted the rate constant and saturated adsorption capacity, respectively.
Figure 8 presents the linear plots of the Yan model. The parameters obtained by Equation (15) are summarized in Table 4.
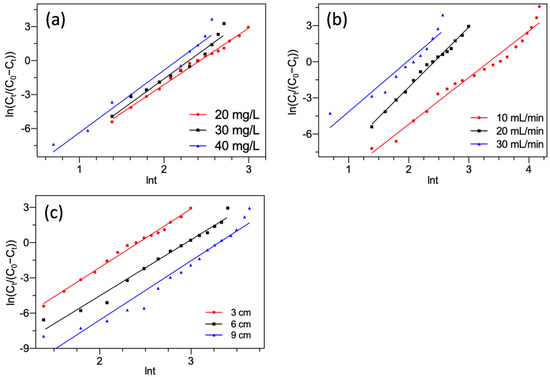
Figure 8.
Yan model fitting of F− adsorption by FBC varying (a) F− concentration; (b) flow rate; (c) bed height.
Table 4.
Calculated fixed-bed parameters using the Yan model.
As shown in Figure 8 and Table 4, the Yan model provided satisfactory fitting of all breakthrough curves with a high correlation coefficient R2. Therefore, the Yan model was desirable for representing the nature of the column system for F− removal. Like the Thomas model, it also suggested that the kinetic processes were exclusive of the internal and external diffusions [44,54]. The predicted value of saturated adsorption capacities qYa estimated by the Yan model was very close to those estimated by the Thomas model and followed similar orders. Whereas, all adsorption capacities estimated by the Thomas model were found to overtop these by the Yan model. This was caused by a flaw in the Thomas model [41]. This overestimation has also been reported by other studies [55,56].
From the aforementioned analysis of the breakthrough curves modeling, it could be seen that all three models gave very high R2 (0.910~0.993), which indicated they were appropriate for the description of the experimental data. Moreover, the favorable fitness also represented the practicability of the three models to evaluate and predict the features of FBC filled with MGAC for F− removal.
4. Conclusions
In this work, a good adsorbent (MGAC) prepared by modifying granular activated carbon with Al3+ was used to remove fluoride (F−) from aqueous solutions in batch and lab-scale column experiments. The physicochemical characterization of MGAC was conducted using SEM and FTIR. SEM micrographs presented that MGAC provided stable and rich pores, facilitating F− adsorption. FTIR spectra demonstrated that F− had successfully interacted with MGAC. The Freundlich model described the isotherm well, suggesting multilayer and heterogeneous adsorption. A kinetic study revealed that the removal of F− was directed by the pseudo-second-order model, indicating chemisorption was the dominant reaction process.
The column studies showed that the breakthrough time and exhaustion time raised with the increment of bed height, whereas they declined with the increment of both influent F− concentration and flow rate. The fixed-bed saturation adsorption capacity raised with the increment of influent F− concentration, whereas it declined with the increment of flow rate. The removal efficiency was raised with both influent F− concentration and bed height increment. The Thomas, Yoon-Nelson, and Yan models satisfactorily described the fixed-bed experimental data, showing their suitability to predict the features of the continuous flow system for F− removal. For the scaling up of the column system, future research would focus on the competitive adsorption of multiple ions in water, the column regeneration, and the system’s economic efficiency.
Author Contributions
Conceptualization, Z.L.; methodology, Z.L.; software, Z.L.; validation, S.Z. and D.Z.; formal analysis, S.Z. and D.Z.; investigation, S.Z. and D.Z.; resources, Z.L.; data curation, S.Z. and D.Z.; writing—original draft preparation, Z.L.; writing—review and editing, Z.L.; visualization, Z.L.; supervision, Z.L.; project administration, Z.L.; funding acquisition, Z.L. All authors have read and agreed to the published version of the manuscript.
Funding
This research was funded by the Education Department of Fujian Province (grant number JAT200473) and Xiamen University of Technology (grant number XPDKT20015).
Institutional Review Board Statement
Not applicable.
Informed Consent Statement
Not applicable.
Data Availability Statement
The data that support the findings of this study are available upon request from the corresponding author (Zheng Liu) upon reasonable request.
Acknowledgments
The authors thank the Xiamen University of Technology for providing the equipment and laboratory facilities required to successfully conclude this research.
Conflicts of Interest
The authors declare no conflict of interest.
References
- Dong, Q.; Yang, D.; Luo, L.; He, Q.; Cai, F.; Cheng, S.; Chen, Y. Engineering porous biochar for capacitive fluorine removal. Sep. Purif. Technol. 2020, 257, 117932. [Google Scholar] [CrossRef]
- Fan, C.; Yin, N.; Cai, X.; Du, X.; Wang, P.; Liu, X.; Li, Y.; Chang, X.; Du, H.; Ma, J.; et al. Stabilization of fluorine-contaminated soil in aluminum smelting site with biochar loaded iron-lanthanide and aluminum-lanthanide bimetallic materials. J. Hazard. Mater. 2022, 426, 128072. [Google Scholar] [CrossRef] [PubMed]
- Brown, W.; Gregory, T.; Chow, L. Effects of Fluoride on Enamel Solubility and Cariostasis. Caries Res. 1977, 11, 118–141. [Google Scholar] [CrossRef] [PubMed]
- Nell, J.; Livanos, G. Effects of fluoride concentration in seawater on growth and fluoride accumulation by Sydney rock oyster (Saccostrea commercialis) and flat oyster (Ostrea angasi) spat. Water Res. 1988, 22, 749–753. [Google Scholar] [CrossRef]
- Kanduti, D.; Sterbenk, P.; Artnik, A. Fluoride: A Review of Use and Effects on Health. Mater. Socio Medica 2016, 28, 133–137. [Google Scholar] [CrossRef]
- WHO. Guidelines for Drinking-Water Quality, 4th ed.; Incorporating the 1st Addendum; WHO: Geneva, Switzerland, 2017; Volume 24, 631p, Available online: https://www.who.int/publications/i/item/9789241549950 (accessed on 7 May 2021).
- Bhatnagar, A.; Kumar, E.; Sillanpaa, M. Fluoride removal from water by adsorption—A review. Chem. Eng. J. 2011, 171, 811–840. [Google Scholar] [CrossRef]
- He, J.; Yang, Y.; Wu, Z.; Xie, C.; Zhang, K.; Kong, L.; Liu, J. Review of fluoride removal from water environment by adsorption. J. Environ. Chem. Eng. 2020, 8, 104516. [Google Scholar] [CrossRef]
- Gago, C.; Romar, A.; Marcos, M.L.F.; Álvarez, E. Fluorine sorption by soils developed from various parent materials in Galicia (NW Spain). J. Colloid Interface Sci. 2012, 374, 232–236. [Google Scholar] [CrossRef]
- Wang, Z.; Gu, X.; Zhang, Y.; Zhang, X.; Ngo, H.H.; Liu, Y.; Jiang, W.; Tan, X.; Wang, X.; Zhang, J. Activated nano-Al2O3 loaded on polyurethane foam as a potential carrier for fluorine removal. J. Water Process. Eng. 2021, 44, 102444. [Google Scholar] [CrossRef]
- Kumari, U.; Behera, S.K.; Meikap, B.C. A novel acid modified alumina adsorbent with enhanced defluoridation property: Kinetics, isotherm study and applicability on industrial wastewater. J. Hazard. Mater. 2019, 365, 868–882. [Google Scholar] [CrossRef]
- Iwar, R.T.; Iorhemen, O.T.; Katibi, K.K. Novel aluminium (hydr) oxide-functionalized activated carbon derived from Raffia palm (Raphia hookeri) shells: Augmentation of its adsorptive properties for efficient fluoride uptake in aqueous media. Environ. Chem. Ecotoxicol. 2021, 3, 142–154. [Google Scholar] [CrossRef]
- Mullick, A.; Neogi, S. Acoustic cavitation induced synthesis of zirconium impregnated activated carbon for effective fluoride scavenging from water by adsorption. Ultrason. Sonochem. 2018, 45, 65–77. [Google Scholar] [CrossRef]
- Bhatnagar, A.; Hogland, W.; Marques, M.; Sillanpää, M. An overview of the modification methods of activated carbon for its water treatment applications. Chem. Eng. J. 2013, 219, 499–511. [Google Scholar] [CrossRef]
- Shao, Y.; Li, J.; Fang, X.; Yang, Z.; Qu, Y.; Yang, M.; Tan, W.; Li, G.; Wang, H. Chemical modification of bamboo activated carbon surface and its adsorption property of simultaneous removal of phosphate and nitrate. Chemosphere 2021, 287, 132118. [Google Scholar] [CrossRef]
- Li, Y.-H.; Wang, S.; Cao, A.; Zhao, D.; Zhang, X.; Xu, C.; Luan, Z.; Ruan, D.; Liang, J.; Wu, D.; et al. Adsorption of fluoride from water by amorphous alumina supported on carbon nanotubes. Chem. Phys. Lett. 2001, 350, 412–416. [Google Scholar] [CrossRef]
- Mullick, A.; Neogi, S. Ultrasound assisted synthesis of Mg-Mn-Zr impregnated activated carbon for effective fluoride adsorption from water. Ultrason. Sonochemistry 2019, 50, 126–137. [Google Scholar] [CrossRef]
- Roy, S.; Das, P.; Sengupta, S.; Manna, S. Calcium impregnated activated charcoal: Optimization and efficiency for the treatment of fluoride containing solution in batch and fixed bed reactor. Process. Saf. Environ. Prot. 2017, 109, 18–29. [Google Scholar] [CrossRef]
- Ahmad, A.A.; Hameed, B.H. Fixed-bed adsorption of reactive azo dye onto granular activated carbon prepared from waste. J. Hazard. Mater. 2010, 175, 298–303. [Google Scholar] [CrossRef]
- Chen, J.; Yang, R.; Zhang, Z.; Wu, D. Removal of fluoride from water using aluminum hydroxide-loaded zeolite synthesized from coal fly ash. J. Hazard. Mater. 2021, 421, 126817. [Google Scholar] [CrossRef]
- Pang, T.; Marken, F.; Zhang, D.; Shen, J. Investigating the role of dissolved inorganic and organic carbon in fluoride removal by membrane capacitive deionization. Desalination 2022, 528, 115618. [Google Scholar] [CrossRef]
- Saravanan, L.; Subramanian, S. Surface chemical studies on the competitive adsorption of poly(ethylene glycol) and ammonium poly(methacrylate) onto alumina. J. Colloid Interface Sci. 2005, 284, 363–377. [Google Scholar] [CrossRef] [PubMed]
- Wahab, M.A.; Jellali, S.; Jedidi, N. Ammonium biosorption onto sawdust: FTIR analysis, kinetics and adsorption isotherms modeling. Bioresour. Technol. 2010, 101, 5070–5075. [Google Scholar] [CrossRef] [PubMed]
- Hamid, Y.; Liu, L.; Usman, M.; Naidu, R.; Haris, M.; Lin, Q.; Ulhassan, Z.; Hussain, M.I.; Yang, X. Functionalized biochars: Synthesis, characterization, and applications for removing trace elements from water. J. Hazard. Mater. 2022, 437, 129337. [Google Scholar] [CrossRef] [PubMed]
- Kumari, U.; Behera, S.K.; Siddiqi, H.; Meikap, B.C. Facile method to synthesize efficient adsorbent from alumina by nitric acid activation: Batch scale defluoridation, kinetics, isotherm studies and implementation on industrial wastewater treatment. J. Hazard. Mater. 2020, 381, 120917. [Google Scholar] [CrossRef] [PubMed]
- De Franco, M.A.E.; de Carvalho, C.B.; Bonetto, M.M.; de Pelegrini Soares, R.; Féris, L.A. Diclofenac removal from water by adsorption using activated carbon in batch mode and fixed-bed column: Isotherms, thermodynamic study and breakthrough curves modeling. J. Clean. Prod. 2018, 181, 145–154. [Google Scholar] [CrossRef]
- Freundlich, H.M.F. Over the adsorption in solution. J. Phys. Chem. 1906, 57, 385–471. [Google Scholar]
- Das, L.; Sengupta, S.; Das, P.; Bhowal, A.; Bhattacharjee, C. Experimental and Numerical modeling on dye adsorption using pyrolyzed mesoporous biochar in Batch and fixed-bed column reactor: Isotherm, thermodynamics, mass transfer, kinetic analysis. Surf. Interfaces 2021, 23, 100985. [Google Scholar] [CrossRef]
- Chen, C.; Chen, Z.; Shen, J.; Kang, J.; Zhao, S.; Wang, B.; Chen, Q.; Li, X. Dynamic adsorption models and artificial neural network prediction of mercury adsorption by a dendrimer-grafted polyacrylonitrile fiber in fixed-bed column. J. Clean. Prod. 2021, 310, 127511. [Google Scholar] [CrossRef]
- Bacelo, H.; Santos, S.C.; Ribeiro, A.; Boaventura, R.A.; Botelho, C.M. Antimony removal from water by pine bark tannin resin: Batch and fixed-bed adsorption. J. Environ. Manag. 2021, 302, 114100. [Google Scholar] [CrossRef]
- Singh, A.; Kumar, D.; Gaur, J.P. Continuous metal removal from solution and industrial effluents using Spirogyra biomass-packed column reactor. Water Res. 2012, 46, 779–788. [Google Scholar] [CrossRef]
- Nur, T.; Loganathan, P.; Nguyen, T.; Vigneswaran, S.; Singh, G.; Kandasamy, J. Batch and column adsorption and desorption of fluoride using hydrous ferric oxide: Solution chemistry and modeling. Chem. Eng. J. 2014, 247, 93–102. [Google Scholar] [CrossRef]
- Bishayee, B.; Ruj, B.; Nandi, S.; Chatterjee, R.P.; Mallick, A.; Chakraborty, P.; Nayak, J.; Chakrabortty, S. Sorptive elimination of fluoride from contaminated groundwater in a fixed bed column: A kinetic model validation based study. J. Indian Chem. Soc. 2021, 99, 100302. [Google Scholar] [CrossRef]
- Han, X.; Zhang, Y.; Zheng, C.; Yu, X.; Li, S.; Wei, W. Enhanced Cr(VI) removal from water using a green synthesized nanocrystalline chlorapatite: Physicochemical interpretations and fixed-bed column mathematical model study. Chemosphere 2020, 264, 128421. [Google Scholar] [CrossRef]
- Madan, S.S.; De, B.S.; Wasewar, K.L. Adsorption performance of packed bed column for benzylformic acid removal using CaO2 nanoparticles. Chem. Data Collect. 2019, 23, 100267. [Google Scholar] [CrossRef]
- Chatterjee, S.; Mondal, S.; De, S. Design and scaling up of fixed bed adsorption columns for lead removal by treated laterite. J. Clean. Prod. 2018, 177, 760–774. [Google Scholar] [CrossRef]
- Yanyan, L.; Kurniawan, T.A.; Zhu, M.; Ouyang, T.; Avtar, R.; Othman, M.H.D.; Mohammad, B.T.; Albadarin, A.B. Removal of acetaminophen from synthetic wastewater in a fixed-bed column adsorption using low-cost coconut shell waste pretreated with NaOH, HNO3, ozone, and/or chitosan. J. Environ. Manag. 2018, 226, 365–376. [Google Scholar] [CrossRef]
- Kumari, U.; Mishra, A.; Siddiqi, H.; Meikap, B. Effective defluoridation of industrial wastewater by using acid modified alumina in fixed-bed adsorption column: Experimental and breakthrough curves analysis. J. Clean. Prod. 2020, 279, 123645. [Google Scholar] [CrossRef]
- Bai, S.; Li, J.; Ding, W.; Chen, S.; Ya, R. Removal of boron by a modified resin in fixed bed column: Breakthrough curve analysis using dynamic adsorption models and artificial neural network model. Chemosphere 2022, 296, 134021. [Google Scholar] [CrossRef]
- Cruz-Olivares, J.; Perez-Alonso, C.; Barrera-Díaz, C.; Ureña-Nuñez, F.; Chaparro-Mercado, M.; Bilyeu, B. Modeling of lead (II) biosorption by residue of allspice in a fixed-bed column. Chem. Eng. J. 2013, 228, 21–27. [Google Scholar] [CrossRef]
- Cruz, M.A.P.; Guimarães, L.C.M.; Júnior, E.F.D.C.; Rocha, S.D.F.; Mesquita, P.D.L. Adsorption of crystal violet from aqueous solution in continuous flow system using bone char. Chem. Eng. Commun. 2019, 207, 372–381. [Google Scholar] [CrossRef]
- Manjunath, S.V.; Kumar, M. Simultaneous removal of antibiotic and nutrients via Prosopis juliflora activated carbon column: Performance evaluation, effect of operational parameters and breakthrough modeling. Chemosphere 2021, 262, 127820. [Google Scholar] [CrossRef] [PubMed]
- Ang, T.N.; Young, B.R.; Taylor, M.; Burrell, R.; Aroua, M.K.; Baroutian, S. Breakthrough analysis of continuous fixed-bed adsorption of sevoflurane using activated carbons. Chemosphere 2019, 239, 124839. [Google Scholar] [CrossRef] [PubMed]
- Banerjee, K.; Ramesh, S.T.; Gandhimathi, R. A novel agricultural waste adsorbent, watermelon shell for the removal of copper from aqueous solutions. Iran. J. Energy Environ. 2012, 3, 143–156. [Google Scholar] [CrossRef]
- Aksu, Z.; Gönen, F. Biosorption of phenol by immobilized activated sludge in a continuous packed bed: Prediction of breakthrough curves. Process. Biochem. 2004, 39, 599–613. [Google Scholar] [CrossRef]
- Chen, S.; Yue, Q.; Gao, B.; Li, Q.; Xu, X.; Fu, K. Adsorption of hexavalent chromium from aqueous solution by modified corn stalk: A fixed-bed column study. Bioresour. Technol. 2012, 113, 114–120. [Google Scholar] [CrossRef]
- Kumar, P.A.; Chakraborty, S. Fixed-bed column study for hexavalent chromium removal and recovery by short-chain polyaniline synthesized on jute fiber. J. Hazard. Mater. 2009, 162, 1086–1098. [Google Scholar] [CrossRef]
- Du, Z.; Zheng, T.; Wang, P. Experimental and modelling studies on fixed bed adsorption for Cu(II) removal from aqueous solution by carboxyl modified jute fiber. Powder Technol. 2018, 338, 952–959. [Google Scholar] [CrossRef]
- Gupta, A.; Garg, A. Adsorption and oxidation of ciprofloxacin in a fixed bed column using activated sludge derived activated carbon. J. Environ. Manag. 2019, 250, 109474. [Google Scholar] [CrossRef]
- Talat, M.; Mohan, S.; Dixit, V.; Singh, D.K.; Hasan, S.H.; Srivastava, O.N. Effective removal of fluoride from water by coconut husk activated carbon in fixed bed column: Experimental and breakthrough curves analysis. Groundw. Sustain. Dev. 2018, 7, 48–55. [Google Scholar] [CrossRef]
- Mohan, S.; Singh, D.K.; Kumar, V.; Hasan, S.H. Effective removal of fluoride ions by rGO/ZrO2 nanocomposite from aqueous solution: Fixed bed column adsorption modelling and its adsorption mechanism. J. Fluor. Chem. 2017, 194, 40–50. [Google Scholar] [CrossRef]
- Bai, B.; Xu, X.; Li, C.; Xing, J.; Wang, H.; Suo, Y. Magnetic Fe3O4@Chitosan Carbon Microbeads: Removal of Doxycycline from Aqueous Solutions through a Fixed Bed via Sequential Adsorption and Heterogeneous Fenton-Like Regeneration. J. Nanomater. 2018, 2018, 5296410. [Google Scholar] [CrossRef]
- Yan, G.; Viraraghavan, T.; Chen, M. A New Model for Heavy Metal Removal in a Biosorption Column. Adsorpt. Sci. Technol. 2001, 19, 25–43. [Google Scholar] [CrossRef]
- De Franco, M.A.E.; de Carvalho, C.B.; Bonetto, M.M.; de Pelegrini Soares, R.; Féris, L.A. Removal of amoxicillin from water by adsorption onto activated carbon in batch process and fixed bed column: Kinetics, isotherms, experimental design and breakthrough curves modelling. J. Clean. Prod. 2017, 161, 947–956. [Google Scholar] [CrossRef]
- Ye, Y.; Yang, J.; Jiang, W.; Kang, J.; Hu, Y.; Ngo, H.H.; Guo, W.; Liu, Y. Fluoride removal from water using a magnesia-pullulan composite in a continuous fixed-bed column. J. Environ. Manag. 2018, 206, 929–937. [Google Scholar] [CrossRef]
- Reck, I.M.; Paixão, R.M.; Bergamasco, R.; Vieira, M.F.; Vieira, A.M.S. Investigation of Moringa oleifera seeds as effective and low-cost adsorbent to remove yellow dye tartrazine in fixed-bed column. Sep. Sci. Technol. 2018, 55, 13–25. [Google Scholar] [CrossRef]


Publisher’s Note: MDPI stays neutral with regard to jurisdictional claims in published maps and institutional affiliations. |
© 2022 by the authors. Licensee MDPI, Basel, Switzerland. This article is an open access article distributed under the terms and conditions of the Creative Commons Attribution (CC BY) license (https://creativecommons.org/licenses/by/4.0/).